201 CALIFORNIA GAS REPORT. Prepared by the California Gas and Electric Utilities
|
|
|
- Jonas Norton
- 6 years ago
- Views:
Transcription


1 201 CALIFORNIA GAS REPORT Prepared by the California Gas and Electric Utilities
2 2016 C A L I F O R N I A G A S R E P O R T PREPARED BY THE CALIFORNIA GAS AND ELECTRIC UTILITIES Southern California Gas Company Pacific Gas and Electric Company San Diego Gas & Electric Company Southwest Gas Corporation City of Long Beach Gas & Oil Department Southern California Edison Company
3
4 TABLE OF CONTENTS TABLE OF CONTENTS Page No. FOREWORD... 1 EXECUTIVE SUMMARY... 3 Demand Outlook... 4 Focus on Efficiency and Environmental Quality... 6 Future Gas System Impacts Resulting From Increased Renewable Generation, and Localized or Distributed-Generation Resources... 8 Natural Gas Projects: Proposals, Completions, and Liquefied Natural Gas... 9 Liquefied Natural Gas (LNG) Statewide Consolidated Summary Tables Statewide Recorded Sources and Disposition Statewide Recorded Highest Sendout NORTHERN CALIFORNIA Introduction Gas Demand Overview Forecast Method Forecast Scenarios Temperature Assumptions Hydro Conditions Gas Price and Rate Assumptions Market Sectors Residential Commercial Industrial Electric Generation SMUD Electric Generation Greenhouse Gas Legislation/AB Renewable Electric Generation Energy Efficiency Programs Impact of SB350 on Energy Efficiency. 38 Gas Supply, Capacity, and Storage Overview Gas Supply California-Sourced Gas U.S. Southwest Gas Canadian Gas Rocky Mountain Gas Storage Interstate Pipeline Capacity U.S. Southwest and Rocky Mountains Canada and Rocky Mountains Gas Supplies and Infrastructure Projects LNG Imports/Exports i
5 TABLE OF CONTENTS North American Supply Development Gas Storage Regulatory Environment State Regulatory Matters Gas Quality Pipeline Safety Storage Safety..45 Core Gas Aggregation Program Federal Regulatory Matters El Paso Kern River Ruby Pipeline Transwestern Gas Transmission Northwest and Canadian Pipelines. 46 FERC Notice of Inquiry Regarding Integration of Variable Energy Resources (Docket RM10-11) FERC Gas-Electric Coordination Actions (AD12-12 & EL14-22) Other Regulatory Matters Gas Exports Greenhouse Gas (GHG) Reporting and Cap & Trade 48 California State Senate Bill Abnormal Peak Day Demand and Supply APD Demand Forecast APD Supply Requirement Forecast NORTHERN COMPANY TABULAR DATA SOUTHERN CALIFORNIA GAS COMPANY Introduction The Southern California Environment Economics and Demographics Gas Demand (Requirements) Overview Market Sensitivity Temperature Hydro Condition Market Sectors Residential Commercial Industrial Non-Refinery Industrial Demand Refinery-Industrial Demand Electric Generation. 71 Industrial/Commercial/ Cogeneration <20 MW.. 72 Industrial/Commercial Cogeneration >20 MW Refinery-Related Cogeneration Enhanced Oil Recovery-Related Cogeneration Non-Cogeneration Electric Generation Enhanced Oil Recovery Steam Wholesale and International San Diego Gas & Electric ii
6 TABLE OF CONTENTS City of Long Beach Southwest Gas City of Vernon Ecogas Mexico, S. de R.L. de C.V. (Ecogas) Natural Gas Vehicles (NGV) Energy Efficiency Programs Gas Supply, Capacity and Storage Gas Supply Sources California Gas Southwestern U.S. Gas Rocky Mountain Gas Canadian Gas Biogas Interstate Pipeline Capacity Firm Receipt Capacity Storage Aliso Canyon. 83 Regulatory Environment State Regulatory Matters Triennial Cost Allocation Proceeding (TCAP) Pipeline Safety Federal Regulatory Matters El Paso Kern River Transwestern Gas Transmission Northwest (GTN) Coordination Between Gas and Electric Markets Greenhouse Gas Issues National Policy Assembly Bill Greenhouse Gas Rulemaking Reporting and Cap-and-Trade Obligations Motor Vehicle Emissions Reductions 89 Low Carbon Fuel Standard. 89 Programmatic Emission Reduction Measures 90 Gas Price Forecast Market Condition Development of the Forecast Peak Day Demand and Deliverability SOUTHERN CALIFORNIA GAS COMPANY TABULAR DATA CITY OF LONG BEACH MUNICIPAL GAS AND OIL DEPARTMENT CITY OF LONG BEACH MUNICIPAL GAS AND OIL DEPARTMENT TABULAR DATA. 102 SAN DIEGO GAS & ELECTRIC COMPANY Introduction Gas Demand Overview Economics and Demographics Market Sectors Residential Commercial iii
7 TABLE OF CONTENTS Industrial Electric Generation Cogeneration Non-Cogeneration Electric Generation Natural Gas Vehicles (NGV) Energy Efficiency Programs Gas Supply Peak Day Demand SAN DIEGO GAS & ELECTRIC COMPANY TABULAR DATA GLOSSARY RESPONDENTS RESERVE YOUR SUBSCRIPTION iv
8 TABLE OF CONTENTS LIST OF CHARTS AND TABLES Page No. EXECUTIVE SUMMARY California Gas Demand Outlook... 5 Impact of Renewable and Energy Efficiency Programs on Gas Demand... 7 Western North American Natural Gas Pipelines Potential and Proposed North American West Coast LNG Terminals.. 11 Statewide Total Supply Sources and Requirements (Avg. & Normal) & 14 Statewide Total Supply Sources Taken (Avg. & Normal) Statewide Annual Gas Requirements (Avg & Normal) & 17 Statewide Total Supply Sources and Requirements (Cold & Dry) & 19 Statewide Annual Gas Supply Sources Taken (Cold & Dry) Statewide Annual Gas Requirements (Cold & Dry) & 22 Recorded 2011 Statewide Sources and Disposition Summary Recorded 2012 Statewide Sources and Disposition Summary Recorded 2013 Statewide Sources and Disposition Summary Recorded 2014 Statewide Sources and Disposition Summary Recorded 2015 Statewide Sources and Disposition Summary Estimated California Highest Summer Sendout (MMcf/d) Estimated California Highest Winter Sendout (MMcf/d) NORTHERN CALIFORNIA Composition of PG&E Requirements (Bcf) Average-Year Demand Natural Gas Savings Due to Energy Efficiency Natural Gas Energy Efficiency Programs Forecast of Gas Demand and Supply on an APD (MMcf/d) Winter Peak Day Demand (MMcf/d) Summer Peak Day Demand (MMcf/d) Annual Gas Supply and Requirements Annual Gas Supply Forecast (Average Demand Year) & 57 Annual Gas Supply Forecast (High Demand Year) & 59 SOUTHERN CALIFORNIA SoCalGas 12-County Area Employment SoCalGas Annual Active Meter Growth ( ) Composition of SoCalGas Requirements-Average Temperature, Normal Hydro Year ( ) Composition of SoCalGas Residential Demand Forecast ( ) Commercial Gas Demand by Business Types: Composition of Industry (2015) Commercial Demand Forecast ( ) Non-Refinery Industrial Gas Demand by Business Types Composition of Industry Activity (2015) Annual Industrial Demand Forecast (Bcf) SoCalGas Service Area Total Electric Generation Forecast (Bcf) Annual Energy Efficiency Cumulative Savings Goal (Bcf) EE Savings Relative to Total Demand Upstream Capacity to Southern California v
9 TABLE OF CONTENTS SoCalGas/SDG&E Current Firm Receipt Capacity Natural Gas Price at the Southern California Border Retail Core Peak Day Demand and Supply Requirements (MMcf/d) Winter Peak Day Demand (MMcf/d) Summer Peak Day Demand (MMcf/d) SOUTHERN CALIFORNIA GAS COMPANY TABULAR DATA Annual Gas Supply and Sendout - (MMcf/d) - Recorded Years 2011 to Annual Gas Supply and Requirements - (MMcf/d) - Estimated Years 2016 Thru Annual Gas Supply and Requirements - (MMcf/d) - Estimated Years 2021 Thru Annual Cold Year Gas Supply and Requirements - (MMcf/d) - Estimated Years 2016 Thru Annual Cold Year Gas Supply and Requirements - (MMcf/d) - Estimated Years 2021 Thru CITY OF LONG BEACH MUNICIPAL GAS & OIL DEPARTMENT TABULAR DATA Annual Gas Supply and Sendout - (MMcf/d) - Recorded Years 2011 Thru 2015 (Table 1A-LB) Annual Gas Supply and Sendout - (MMcf/d) - Recorded Years 2011 Thru 2015 (Table 1-LB) Annual Gas Supply and Requirements - (MMcf/d) - Estimated Years 2016 Thru 2020 (Table 2-LB) Annual Gas Supply and Requirements - (MMcf/d) - Estimated Years 2021 Thru 2035 (Table 3-LB) Annual Cold Year Gas Supply and Requirements - (MMcf/d) - Estimated Years 2016 Thru 2020 (Table 6-LB) Annual Cold Year Gas Supply and Requirements - (MMcf/d) - Estimated Years 2021 Thru 2035 (Table 7-LB) SAN DIEGO GAS & ELECTRIC COMPANY Composition of SDG&E Gas Throughput (Bcf) -- Average Temperature, Normal Hydro Year ( ) Composition of SDG&E s Residential Demand Forecast ( ). 113 SDG&E Commercial Natural Gas Demand Forecast ( ) SDG&E s Industrial Demand Forecast ( ) SDG&E s Service Area Total Electric Generation Forecast (Bcf) SDG&E s Energy Efficiency Cumulative Savings, Various Years ( ) SAN DIEGO GAS & ELECTRIC COMPANY TABULAR DATA Annual Gas Supply and Sendout - (MMcf/d) - Recorded Years Annual Gas Supply Taken - (MMcf/d) - Recorded Years Annual Gas Supply and Requirements - (MMcf/d) - Estimated Years 2016 Thru 2020 (Table 1-SDGE) Annual Gas Supply and Requirements - (MMcf/d) - Estimated Years 2021 Thru 2035 (Table 2-SDGE) Annual Cold Year Gas Supply and Requirements - (MMcf/d) - Estimated Years 2016 Thru 2020 (Table 3-SDGE) Annual Cold Year Gas Supply and Requirements - (MMcf/d) - Estimated Years 2021 Thru 2035 (Table 4-SDGE) vi
10 FOREWARD 2016 C A L I F O R N I A G A S R E P O R T FOREWORD 1
11 FOREWORD FOREWORD The 2016 California Gas Report presents a comprehensive outlook for natural gas requirements and supplies for California through the year This report is prepared in even-numbered years, followed by a supplemental report in odd-numbered years, in compliance with California Public Utilities Commission Decision D The projections in the California Gas Report are for long-term planning and do not necessarily reflect the day-to-day operational plans of the utilities. The report is organized into three sections: Executive Summary, Northern California, and Southern California. The Executive Summary provides statewide highlights and consolidated tables on supply and demand. The Northern California section provides details on the requirements and supplies of natural gas for Pacific Gas and Electric Company (PG&E), the Sacramento Municipal Utility District (SMUD), Wild Goose Storage, Inc. and Lodi Gas Storage LLC. The Southern California section shows similar detail for Southern California Gas Company (SoCalGas), the City of Long Beach Municipal Oil and Gas Department, Southwest Gas Corporation, and San Diego Gas and Electric Company. Each participating utility has provided a narrative explaining its assumptions and outlook for natural gas requirements and supplies, including tables showing data on natural gas availability by source, with corresponding tables showing data on natural gas requirements by customer class. Separate sets of tables are presented for average and cold year temperature conditions. Any forecast, however, is subject to considerable uncertainty. Changes in the economy, energy and environmental policies, natural resource availability, and the continually evolving restructuring of the gas and electric industries can significantly affect the reliability of these forecasts. This report should not be used by readers as a substitute for a full, detailed analysis of their own specific energy requirements. A working committee, comprised of representatives from each utility was responsible for compiling the report. The membership of this committee is listed in the Respondents Section at the end of this report. Workpapers and next year s report are available on request from PG&E and SoCalGas/SDG&E. Write or us at the address shown in the Reserve Your Subscription section at the end of this report. 2
12 EXECUTIVE SUMMARY 2016 C A L I F O R N I A G A S R E P O R T EXECUTIVE SUMMARY 3
13 EXECUTIVE SUMMARY EXECUTIVE SUMMARY DEMAND OUTLOOK California natural gas demand, including volumes not served by utility systems, is expected to decrease at a rate of 1.4 percent per year from 2016 to The forecast decline is a combination of moderate growth in the Natural Gas Vehicle (NGV) market and across-the-board declines in all other market segments: residential, commercial, electric generation, and industrial markets. Residential gas demand is expected to decrease at an annual average rate of 0.5 percent. Demand in the commercial and industrial markets are expected to decline at an annual rate of 0.24 percent. Aggressive energy efficiency programs make a significant impact in managing growth in the residential, commercial, and industrial markets. For the purpose of load-following as well as backstopping intermittent renewable resource generation, gas-fired generation will continue to be the primary technology to meet the ever-growing demand for electric power. However, overall gas demand for electric generation is expected to decline at 1.3 percent per year for the next 20 years due to more efficient power plants, statewide efforts to minimize greenhouse gas (GHG) emissions through aggressive programs pursuing demand-side reductions, and the acquisition of preferred power generation resources that produce little or no carbon emissions. 4
14 MMcf/day EXECUTIVE SUMMARY California Demand Outlook Base Case: Avg Temp. Normal Hydro High Case: Cold Temp, Dry Hydro The graph above summarizes statewide gas demand under a base case and high case scenario. The base case refers to the expected gas demand for an average temperature year and normal hydroelectric power (hydro) year, and the high case refers to expected gas demand for a cold temperature year and dry hydro conditions. Under an average-temperature condition and a normal hydro year, gas demand for the state is projected to average 6,072 MMcf/d in 2016 decreasing to 4,626 MMcf/d by 2035, a decline of 1.35% per year. In 2016, Northern California is projected to require an additional 2.3% of gas supply to meet demand for the high gas demand scenario, whereas southern California is projected to require an additional 4.0% of supply to meet demand under the high scenario condition. The weather scenario for each year is an independent event and each event has the same likelihood of occurring. The annual demand forecast for the base case and high case should therefore not be viewed as a combined event from year to year. 5
15 EXECUTIVE SUMMARY FOCUS ON EFFICIENCY AND ENVIRONMENTAL QUALITY California utilities continue to focus on Customer Energy Efficiency (CEE) and other Demand-Side Management (DSM) programs in their utility electric and gas resource plans. California utilities are committed to helping their customers make the best possible choices regarding use of this increasingly valuable resource. Gas demand for electric power generation is expected to be moderated by CPUC-mandated goals for electric energy efficiency programs and renewable power. The base case forecasts in this report assume that renewable power will meet 33% of the state s electric needs by 2020 and 50% by 2030 and beyond. In 2015, the state enacted legislation intended to improve air quality, provide aggressive reductions in energy dependency and boost the employment of renewable power. The first legislation, the 2015 Clean Energy and Pollution Reduction Act, also known as Senate Bill (SB) 350, requires the amount of electricity generated and sold to retail customers per year from eligible renewable energy resources be increased to 50 percent by December 31, SB 350 establishes annual targets for statewide energy efficiency savings and demand reduction that will achieve a cumulative doubling of statewide energy efficiency savings in electricity and natural gas final end uses by January 1, Second, the Energy Efficiency Act (AB 802) provides aggressive state directives to increase the energy efficiency of existing buildings, requires that access to building performance data for nonresidential buildings be provided by energy utilities and encourages pay-forperformance incentive-based programs. This paradigm shift will allow California building owners a better and more effective way to access whole-building information and at the same time will help to address climate change, and deliver cost-effective savings for ratepayers. Last, the Energy Efficiency Act (AB 793) is intended to promote and provide incentives to residential or small and medium-sized business utility customers that acquire energy management technology for use in their home or place of business. AB 793 requires energy utilities to develop a plan to educate residential customers and small and medium business customers about the incentive program. The table on the following page provides estimates of total gas savings based on the impact of renewables in addition to the impact of electric and gas energy efficiency goals on the CPUC-jurisdictional utilities. Gas savings from electric energy efficiency goals are based on a generic assumption of heat rate per megawatt-hour of electricity produced at gas-fired peaking and combined-cycle power plants. 6
16 EXECUTIVE SUMMARY Impact of Renewable Generation and Energy Efficiency Programs on Gas Demand California Energy Requirements by CPUC-Jurisdictional Utilities (CAISO) (1) Electricity Demand (GWh) 254, , , , , , , ,176 33% Renewables by 2020 & 50% Renewables by 2030 Renewable Electric Generation (GWh/Yr) (2) 63,738 68,528 73,078 77,766 82, , , ,588 Increase over 2015 Level (GWh/Yr) (3) 3,998 8,789 13,339 18,026 22,827 43,659 63,779 62,849 Gas Savings over 2015 Level (Bcf/Yr) (4) Electric Energy Efficieny Goals (5) Electricity Savings over 2015 Level (GWh/Yr) 3,562 6,976 10,092 12,749 15,110 23,645 33,832 44,604 Gas Savings over 2015 Level (Bcf/Yr) (4) Energy Efficiency Goal for Natural Gas Programs (6) Gas Savings over 2015 Level (Bcf/Yr) Total Gas Savings (Bcf/Yr) (7) Notes: (1) Electricity demand forecast from the California Energy Commission: Mid-Case LSE and Balancing Authority Forecast.xls, "form1.1c" tab. From the average growth rate was used from the last five years ( ) which is %. (2) Assumes 33% renewables by the year 2020 and 50% renewables by (3) Increase reflects only the impacts of equipment installed after December 31, (4) Gas savings are estimated based on the following generic assumptions for California: gas-fired peaking plants are assumed to be the marginal source for 10% of the 8,760 hours in each year (24 x 365) and combined-cycle plants are marginal in another 75% of each year. Each MWh displaced from a peaking plant saves 10 MMBtu (10 Dth, or approximately 10,000 CF) of natural gas. Each MWh displaced from a combined-cycle plant saves 7 MMBtu (7 Dth, or approximately 7,000 CF) of natural gas. A conservation program that saves 1 MWh in every hour of a year saves about 55,000 MMBtu of natural gas (8,750 hours x 10% x 10 MMBtu, plus 8,760 hours x 75% x 7 MMBtu). Conservation programs that save MWh primarily during summer peak periods produce greater natural gas savings per MWh. Similar estimates apply to renewable electric generators. (5) Data from the California Energy Commission: ; "Committed Electricity Efficiency Conservations Savings by Planning Area and Sector", Mid CORRECTED, "STATEWIDEnonrescon-Mid Demand" tab. From the average growth rate was used from the last five years ( ) which is 1.661%. (6) Data from the California Energy Commission: ; Committed Gas Savings by PA-RF15.xlxs. From the average growth rate was used from the last five years ( ) which is 1.096%. (7) Total gas savings are annual savings from equipment installed after December 31,
17 EXECUTIVE SUMMARY Future Gas System Impacts Resulting From Increased Renewable Generation, and Localized or Distributed-Generation Resources Since electric utility-system operators must balance electrical demand with generation sources on a real-time basis, most system operators rely on dispatchable resources that can respond quickly to changes in demand. The challenge with renewable resources is that while they can provide energy, they are not always totally predictable nor are they often considered controllable resources. In the future the increase in renewable generation in the state will reduce the total amount of natural gas usage, but it is also expected that the future increases in renewable electric generation will increase the daily and hourly load-forecast variance associated with operation of the natural gas-fueled electric generation system. California is currently on track to meet a 33% Renewable Portfolio Standard (RPS) by SB 350 further raised the RPS target to 50% by All this renewable energy will displace some of the natural gas currently being used to generate electricity in California, but the reduction will not be proportional to the amount of renewable generation energy due to the intermittent nature of this renewable generation. The intermittent nature of renewable generation is likely to cause the electric system to rely more heavily on natural gas-fired electric generation for providing the ancillary services (load following, ramping, and quick starts) needed to balance the electric system in the short term until other technologies can mature. Per the CPUC Storage Mandate Decision D , energy storage products would use the excess renewable energy to charge the battery or system during the time of low energy demand and would provide energy back into the grid during periods of high energy demand. It is expected that solar and wind generating units will provide most of the new renewable electric generation in the years ahead with much of the smaller incremental renewable power coming from solar PV (photovoltaic) installations, because solar generation costs have declined rapidly in the past few years and solar has siting advantages, especially in urban areas. Due to this expansion of renewable resources, there may be an increased need for rapid-response, gas-fired generators that could be available to follow load fluctuations due to the intermittent nature of added renewables. Since gas-fired generation is the marginal resource in most hours, the amount of gas consumed for integrating more renewables will fluctuate hourly. The gas system will therefore need to be both robust and flexible to handle such fluctuations with minimal disturbance. 8
18 EXECUTIVE SUMMARY NATURAL GAS PROJECTS: PROPOSALS, COMPLETIONS, AND LIQUEFIED NATURAL GAS Over the past five years, California natural gas utilities, interstate pipelines, and in-state natural gas-storage facilities have increased their delivery and receipt capacity to meet natural gas demand growth. In addition, more projects have been proposed and some are under construction. The California Energy Commission (Energy Commission) posts a list of natural gas projects on its website, which tracks both completed projects and ones that are being developed or in the proposal stage, along with proposed liquefied natural gas (LNG) projects. To review these project lists check the Energy Commission s website at Supply Outlook/Pipeline Capacity California s existing gas supply portfolio is regionally diverse and includes supplies from California sources (onshore and offshore), Southwestern U.S. supply sources (the Permian, Anadarko, and San Juan basins), the Rocky Mountains, and Canada. The Ruby pipeline came online in 2010, bringing up to 1.5 Bcf/d of additional gas to California (via Malin) from the Rocky Mountains. The Energia Costa Azul LNG (Liquefied Natural Gas) receiving terminal in Baja California provides yet another source of supply for California. The map on the following page shows the locations of these supply sources and the natural gas pipelines serving California. Additional pipeline capacity and open access have contributed to long-term supply availability and gas-on-gas competition for the California market. In addition to Ruby, interstate pipelines currently serving California include El Paso Natural Gas Company, Kern River Transmission Company, Mojave Pipeline Company, Gas Transmission-Northwest, Transwestern Pipeline Company, Questar Southern Trails Pipeline, Tuscarora Pipeline, and the Baja Norte/North Baja Pipeline. 9

19 EXECUTIVE SUMMARY Western North American Natural Gas Pipelines 1. El Paso Natural Gas 2. Gasoducto Bajanorte (GB) 3. Gas Transmission Northwest (GTN) 4. Kern River Pipeline 5. Mojave Pipeline 6. North Baja Pipeline 7. Northwest Pipeline 8. Piute Pipeline 9. Pacific Gas & Electric Company 10. Questar Southern Trail Pipeline 11. Rockies Express 12. San Diego Gas & Electric Company 13. Southern California Gas Company 14. Transportadora de Gas Natural (TGN) 15. TransCanada Pipeline 16. Transwestern Pipeline 17. Tuscarora Pipeline 18. Unused 19. Ruby Pipeline 20. Kern River Expansion 21. Sunstone Pipeline 22. Transcolorado Pipeline 23. Pacific Connector Pipeline 10
20 EXECUTIVE SUMMARY Liquefied Natural Gas (LNG) The abundance of shale gas has changed the paradigm for liquefied natural gas in the West. Until the latter part of the last decade, LNG was seen as being a potential source of imported gas for California, but that has now changed to a focus on exporting gas. There are two proposed new LNG facilities in the West Coast. Both are in Canada and are described in the table below. The Costa Azul terminal remains the only import terminal on the west coast; however, it remains under-utilized as a source of gas for California. It is uncertain whether all of the proposed and potential export terminals will be built, but their construction and operation may put upward pressure on gas prices in the West in the future. Potential and Proposed North American West Coast LNG Terminals As of May 19, 2016 [1] Western Region LNG Terminals Existing and Proposed as of May 19, Baja California, Mexico Existing Sempra-Energia Costa Azul 4.0 Bcf/d Import Terminal 2 Kenai, AL Existing Conoco Phillips 0.2 Bcf/d Export Terminal 3 P. Manzanillo, MX Existing KMS GNL de Manzanillo 0.5 Bcf/d Import Terminal 4 Kitimat, BC Approved LNG Canada 3.23 Bcf/d Export Terminal 5 Squarmish, BC Approved Woodfibre LNG Ltd 0.29 Bcf/d Export Terminal [1] Source: FERC List of Existing, Proposed, and Potential LNG Terminals ( accessed 5/22/2016) 11
21 EXECUTIVE SUMMARY STATEWIDE CONSOLIDATED SUMMARY TABLES The consolidated summary tables on the following pages show the statewide aggregations of projected gas supplies and gas requirements (demand) from 2016 to 2035 for average-temperature and normal-hydro years and cold-temperature and dry-hydro years. Gas sales and transportation volumes are consolidated under the general category of system requirements. Details of gas transportation for individual utilities are given in the tabular data for Northern California and Southern California. The wholesale category includes the City of Long Beach Gas and Oil Department, San Diego Gas & Electric Company, Southwest Gas Corporation, City of Vernon, Alpine Natural Gas, Island Energy, West Coast Gas, Inc., and the municipalities of Coalinga and Palo Alto. Some columns may not sum precisely, because of modeling accuracy and rounding differences, and do not imply curtailments. 12
22 EXECUTIVE SUMMARY STATEWIDE TOTAL SUPPLY SOURCES AND REQUIREMENTS Average Temperature and Normal Hydro Year MMcf/Day California's Supply Sources Utility California Sources Out-of-State 5,060 4,798 4,758 4,711 4,668 Utility Total 5,225 4,963 4,924 4,876 4,833 Non-Utility Served Load (1) 1,132 1, Statewide Supply Sources Total 6,358 6,020 5,909 5,787 5,645 California's Requirements Utility Residential 1,181 1,181 1,175 1,167 1,155 Commercial Natural Gas Vehicles Industrial Electric Generation (2) 1,897 1,648 1,623 1,590 1,566 Enhanced Oil Recovery Steaming Wholesale/International+Exchange Company Use and Unaccounted-for Utility Total 4,939 4,677 4,638 4,590 4,547 Non-Utility Enhanced Oil Recovery Steaming EOR Cogeneration/Industrial Electric Generation Non-Utility Served Load (1) 1,132 1, Statewide Requirements Total (3) 6,072 5,734 5,623 5,501 5,360 Notes: (1) Consists of California production and deliveries by El Paso, Kern/Mojave and TGN pipelines to industrial, EOR Cogen, EOR steaming and powerplant customers, and gas consumption at Elk Hills powerplant. Source: CEC staff-provided forecast results from their own model simulations. (2) Includes utility generation, wholesale generation, and cogeneration. (3) The difference between California supply sources and California requirements is PG&E's forecast of off-system deliveries. 13
23 EXECUTIVE SUMMARY STATEWIDE TOTAL SUPPLY SOURCES AND REQUIREMENTS Average Temperature and Normal Hydro Year MMcf/Day California's Supply Sources Utility California Sources Out-of-State 4,620 4,618 4,599 4,481 4,489 Utility Total 4,786 4,783 4,764 4,646 4,654 Non-Utility Served Load (1) Statewide Supply Sources Total 5,566 5,474 5,312 4,938 4,912 California's Requirements Utility Residential 1,148 1,139 1,114 1,080 1,076 Commercial Natural Gas Vehicles Industrial Electric Generation (2) 1,529 1,540 1,548 1,454 1,453 Enhanced Oil Recovery Steaming Wholesale/International+Exchange Company Use and Unaccounted-for Utility Total 4,500 4,497 4,478 4,360 4,368 Non-Utility Enhanced Oil Recovery Steaming EOR Cogeneration/Industrial Electric Generation Non-Utility Served Load (1) Statewide Requirements Total (3) 5,281 5,188 5,026 4,652 4,626 Notes: (1) Consists of California production and deliveries by El Paso, Kern/Mojave and TGN pipelines to industrial, EOR Cogen, EOR steaming and powerplant customers, and gas consumption at Elk Hills powerplant. Source: CEC staff-provided forecast results from their own model simulations. (2) Includes utility generation, wholesale generation, and cogeneration. (3) The difference between California supply sources and California requirements is PG&E's forecast of off-system deliveries. 14
24 EXECUTIVE SUMMARY STATEWIDE TOTAL SUPPLY SOURCES-TAKEN Average Temperature and Normal Hydro Year MMcf/Day Utility Northern California California Sources (1) Out-of-State 2,501 2,271 2,274 2,252 2,232 Northern California Total 2,545 2,314 2,317 2,295 2,275 Southern California California Sources (2) Out-of-State 2,559 2,527 2,485 2,459 2,436 Southern California Total 2,681 2,649 2,607 2,581 2,558 Utility Total 5,225 4,963 4,924 4,876 4,833 Non-Utility Served Load (3) 1,132 1, Statewide Supply Sources Total 6,358 6,020 5,909 5,787 5,645 Utility Northern California California Sources (1) Out-of-State 2,216 2,236 2,265 2,229 2,229 Northern California Total 2,259 2,279 2,308 2,272 2,272 Southern California California Sources (2) Out-of-State 2,404 2,382 2,334 2,252 2,260 Southern California Total 2,526 2,504 2,456 2,374 2,382 Utility Total 4,786 4,783 4,764 4,646 4,654 Non-Utility Served Load (3) Statewide Supply Sources Total 5,566 5,474 5,312 4,938 4,912 Notes: (1) Includes utility purchases and exchange/transport gas. (2) Includes utility purchases and exchange/transport gas and City of Long Beach "own-source" gas. (3) Consists of California production and deliveries by El Paso, Kern/Mojave and TGN pipelines to industrial, EOR Cogen, EOR steaming and powerplant customers, and gas consumption at Elk Hills powerplant. Source: CEC staff-provided forecast results from their own model simulations. 15
25 EXECUTIVE SUMMARY STATEWIDE ANNUAL GAS REQUIREMENTS (1) Average Temperature and Normal Hydro Year MMcf/Day Utility Northern California Residential Commercial - Core Natural Gas Vehicles - Core Natural Gas Vehicles - Noncore Industrial - Noncore Wholesale SMUD Electric Generation Electric Generation (2) Exchange (California) Company Use and Unaccounted-for Northern California Total (3) 2,259 2,028 2,031 2,010 1,989 Southern California Residential Commercial - Core Commercial - Noncore Natural Gas Vehicles - Core Industrial - Core Industrial - Noncore Wholesale SDG&E+Vernon Electric Generation Electric Generation (4) Enhanced Oil Recovery Steaming Company Use and Unaccounted-for Southern California Total 2,681 2,649 2,607 2,581 2,558 Utility Total 4,939 4,677 4,638 4,590 4,547 Non-Utility Served Load (5) 1,132 1, Statewide Gas Requirements Total (6) 6,072 5,734 5,623 5,501 5,360 Notes: (1) Includes transportation gas. (2) Electric generation includes cogeneration, PG&E-owned electric generation, and deliveries to power plants connected to the PG&E system. It excludes deliveries by the Kern Mojave and other pipelines. (3) Northern Calfornia Total excludes Off-System Deliveries to Southern California. (4) Southern California Electric Generation includes commercial and industrial cogeneration, refineryrelated cogeneration, EOR-related cogeneration, and non-cogeneration electric generation. (5) Consists of California production and deliveries by El Paso, Kern/Mojave and TGN pipelines to industrial, EOR Cogen, EOR steaming and powerplant customers, and gas consumption at Elk Hills powerplant. Source: CEC staff-provided forecast results from their own model simulations. (6) Does not include off-system deliveries. 16
26 EXECUTIVE SUMMARY STATEWIDE ANNUAL GAS REQUIREMENTS (1) Average Temperature and Normal Hydro Year MMcf/Day Utility Northern California Residential Commercial - Core Natural Gas Vehicles - Core Natural Gas Vehicles - Noncore Industrial - Noncore Wholesale SMUD Electric Generation Electric Generation (2) Exchange (California) Company Use and Unaccounted-for Northern California Total (3) 1,974 1,993 2,022 1,986 1,986 Southern California Residential Commercial - Core Commercial - Noncore Natural Gas Vehicles - Core Industrial - Core Industrial - Noncore Wholesale SDG&E+Vernon Electric Generation Electric Generation (4) Enhanced Oil Recovery Steaming Company Use and Unaccounted-for Southern California Total 2,526 2,504 2,456 2,374 2,382 Utility Total 4,500 4,497 4,478 4,360 4,368 Non-Utility Served Load (5) Statewide Gas Requirements Total (6) 5,281 5,188 5,026 4,652 4,626 Notes: (1) Includes transportation gas. (2) Electric generation includes cogeneration, PG&E-owned electric generation, and deliveries to power plants connected to the PG&E system. It excludes deliveries by the Kern Mojave and other pipelines. (3) Northern Calfornia Total excludes Off-System Deliveries to Southern California. (4) Southern California Electric Generation includes commercial and industrial cogeneration, refineryrelated cogeneration, EOR-related cogeneration, and non-cogeneration electric generation. (5) Consists of California production and deliveries by El Paso, Kern/Mojave and TGN pipelines to industrial, EOR Cogen, EOR steaming and powerplant customers, and gas consumption at Elk Hills powerplant. Source: CEC staff-provided forecast results from their own model simulations. (6) Does not include off-system deliveries. 17
27 EXECUTIVE SUMMARY STATEWIDE TOTAL SUPPLY SOURCES AND REQUIREMENTS Cold Temperature (4) and Dry Hydro Year MMcf/Day California's Supply Sources Utility California Sources Out-of-State 5,224 5,042 5,013 4,963 4,918 Utility Total 5,390 5,207 5,178 5,128 5,083 Non-Utility Served Load (1) 1,670 1,577 1,323 1,250 1,181 Statewide Supply Sources Total 7,060 6,784 6,501 6,378 6,264 California's Requirements Utility Residential 1,273 1,273 1,269 1,262 1,253 Commercial Natural Gas Vehicles Industrial Electric Generation (2) 1,927 1,756 1,740 1,704 1,676 Enhanced Oil Recovery Steaming Wholesale/International+Exchange Company Use and Unaccounted-for Utility Total 5,104 4,921 4,893 4,842 4,797 Non-Utility Enhanced Oil Recovery Steaming EOR Cogeneration/Industrial Electric Generation 1,515 1,422 1,168 1,095 1,026 Non-Utility Served Load (1) 1,670 1,577 1,323 1,250 1,181 Statewide Requirements Total (3) 6,774 6,498 6,215 6,092 5,978 Notes: (1) Consists of California production and deliveries by El Paso, Kern/Mojave and TGN pipelines to industrial, EOR Cogen, EOR steaming and powerplant customers, and gas consumption at Elk Hills powerplant. Source: CEC staff-provided forecast results from their own model simulations. (2) Includes utility generation, wholesale generation, and cogeneration. (3) The difference between California supply sources and California requirements is PG&E's forecast of off-system deliveries. (4) 1-in-35 cold year temperature for SoCalGas; 1-in-10 cold year temperature for PG&E. 18
28 EXECUTIVE SUMMARY STATEWIDE TOTAL SUPPLY SOURCES AND REQUIREMENTS Cold Temperature (4) and Dry Hydro Year MMcf/Day California's Supply Sources Utility California Sources Out-of-State 4,890 4,895 4,982 4,846 4,853 Utility Total 5,056 5,060 5,147 5,011 5,018 Non-Utility Served Load (1) 1,136 1, Statewide Supply Sources Total 6,191 6,154 6,139 5,649 5,659 California's Requirements Utility Residential 1,247 1,238 1,216 1,189 1,184 Commercial Natural Gas Vehicles Industrial Electric Generation (2) 1,655 1,673 1,785 1,664 1,663 Enhanced Oil Recovery Steaming Wholesale/International+Exchange Company Use and Unaccounted-for Utility Total 4,770 4,774 4,861 4,725 4,733 Non-Utility Enhanced Oil Recovery Steaming EOR Cogeneration/Industrial Electric Generation Non-Utility Served Load (1) 1,136 1, Statewide Requirements Total (3) 5,906 5,868 5,853 5,363 5,373 Notes: (1) Consists of California production and deliveries by El Paso, Kern/Mojave and TGN pipelines to industrial, EOR Cogen, EOR steaming and powerplant customers, and gas consumption at Elk Hills powerplant. Source: CEC staff-provided forecast results from their own model simulations. (2) Includes utility generation, wholesale generation, and cogeneration. (3) The difference between California supply sources and California requirements is PG&E's forecast of off-system deliveries. (4) 1-in-35 cold year temperature for SoCalGas; 1-in-10 cold year temperature for PG&E. 19
29 EXECUTIVE SUMMARY STATEWIDE TOTAL SUPPLY SOURCES-TAKEN Cold Temperature (4) and Dry Hydro Year MMcf/Day Utility Northern California California Sources (1) Out-of-State 2,560 2,336 2,342 2,322 2,306 Northern California Total 2,603 2,379 2,386 2,366 2,349 Southern California California Sources (2) Out-of-State 2,665 2,706 2,671 2,640 2,612 Southern California Total 2,787 2,828 2,793 2,762 2,734 Utility Total 5,390 5,207 5,178 5,128 5,083 Non-Utility Served Load (3) 1,670 1,577 1,323 1,250 1,181 Statewide Supply Sources Total 7,060 6,784 6,501 6,378 6,264 Utility Northern California California Sources (1) Out-of-State 2,292 2,316 2,455 2,420 2,420 Northern California Total 2,336 2,360 2,498 2,463 2,463 Southern California California Sources (2) Out-of-State 2,598 2,579 2,527 2,426 2,433 Southern California Total 2,720 2,701 2,649 2,548 2,555 Utility Total 5,056 5,060 5,147 5,011 5,018 Non-Utility Served Load (3) 1,136 1, Statewide Supply Sources Total 6,191 6,154 6,139 5,649 5,659 Notes: (1) Includes utility purchases and exchange/transport gas. (2) Includes utility purchases and exchange/transport gas and City of Long Beach "own-source" gas. (3) Consists of California production and deliveries by El Paso, Kern/Mojave and TGN pipelines to industrial, EOR Cogen, EOR steaming and powerplant customers, and gas consumption at Elk Hills powerplant. Source: CEC staff-provided forecast results from their own model simulations. (4) 1-in-35 cold year temperature for SoCalGas; 1-in-10 cold year temperature for PG&E. 20
30 EXECUTIVE SUMMARY STATEWIDE ANNUAL GAS REQUIREMENTS (1) Cold Temperature (7) and Dry Hydro Year MMcf/Day Utility Northern California Residential Commercial - Core Natural Gas Vehicles - Core Natural Gas Vehicles - Noncore Industrial - Noncore Wholesale SMUD Electric Generation Electric Generation (2) Exchange (California) Company Use and Unaccounted-for Northern California Total (3) 2,317 2,093 2,100 2,080 2,063 Southern California Residential Commercial - Core Commercial - Noncore Natural Gas Vehicles - Core Industrial - Core Industrial - Noncore Wholesale SDG&E+Vernon Electric Generation Electric Generation (4) Enhanced Oil Recovery Steaming Company Use and Unaccounted-for Southern California Total 2,787 2,828 2,793 2,762 2,734 Utility Total 5,104 4,921 4,893 4,842 4,797 Non-Utility Served Load (5) 1,670 1,577 1,323 1,250 1,181 Statewide Gas Requirements Total (6) 6,774 6,498 6,215 6,092 5,978 Notes: (1) Includes transportation gas. (2) Electric generation includes cogeneration, PG&E-owned electric generation, and deliveries to power plants connected to the PG&E system. It excludes deliveries by the Kern Mojave and other pipelines. (3) Northern Calfornia Total excludes Off-System Deliveries to Southern California. (4) Southern California Electric Generation includes commercial and industrial cogeneration, refineryrelated cogeneration, EOR-related cogeneration, and non-cogeneration electric generation. (5) Consists of California production and deliveries by El Paso, Kern/Mojave and TGN pipelines to industrial, EOR Cogen, EOR steaming and powerplant customers, and gas consumption at Elk Hills powerplant. Source: CEC staff-provided forecast results from their own model simulations. (6) Does not include off-system deliveries. (7) 1-in-35 cold year temperature for SoCalGas; 1-in-10 cold year temperature for PG&E. 21
31 EXECUTIVE SUMMARY STATEWIDE ANNUAL GAS REQUIREMENTS (1) Cold Temperature (7) and Dry Hydro Year MMcf/Day Utility Northern California Residential Commercial - Core Natural Gas Vehicles - Core Natural Gas Vehicles - Noncore Industrial - Noncore Wholesale SMUD Electric Generation Electric Generation (2) Exchange (California) Company Use and Unaccounted-for Northern California Total (3) 2,050 2,074 2,212 2,177 2,177 Southern California Residential Commercial - Core Commercial - Noncore Natural Gas Vehicles - Core Industrial - Core Industrial - Noncore Wholesale SDG&E+Vernon Electric Generation Electric Generation (4) Enhanced Oil Recovery Steaming Company Use and Unaccounted-for Southern California Total 2,720 2,701 2,649 2,548 2,555 Utility Total 4,770 4,774 4,861 4,725 4,733 Non-Utility Served Load (5) 1,136 1, Statewide Gas Requirements Total (6) 5,906 5,868 5,853 5,363 5,373 Notes: (1) Includes transportation gas. (2) Electric generation includes cogeneration, PG&E-owned electric generation, and deliveries to power plants connected to the PG&E system. It excludes deliveries by the Kern Mojave and other pipelines. (3) Northern Calfornia Total excludes Off-System Deliveries to Southern California. (4) Southern California Electric Generation includes commercial and industrial cogeneration, refineryrelated cogeneration, EOR-related cogeneration, and non-cogeneration electric generation. (5) Consists of California production and deliveries by El Paso, Kern/Mojave and TGN pipelines to industrial, EOR Cogen, EOR steaming and powerplant customers, and gas consumption at Elk Hills powerplant. Source: CEC staff-provided forecast results from their own model simulations. (6) Does not include off-system deliveries. (7) 1-in-35 cold year temperature for SoCalGas; 1-in-10 cold year temperature for PG&E. 22
32 EXECUTIVE SUMMARY STATEWIDE RECORDED SOURCES AND DISPOSITION The Statewide Sources and Disposition Summary is intended to complement the existing five-year recorded data tables included in the tabular data sections for each utility. The information displayed in the following tables shows the composition of supplies from both out-of-state sources as well as California sources. The data are based on the utilities accounting records and on available gas nomination and preliminary gas transaction information obtained daily from customers or their appointed agents and representatives. It should be noted that data on daily gas nominations are frequently subject to reconciling adjustments. In addition, some of the data are based on allocations and assignments that, by necessity, rely on estimated information. These tables have been updated to reflect the most current information. Some columns may not sum exactly, because of factored allocation and rounding differences, and do not imply curtailments. 23
33 EXECUTIVE SUMMARY Recorded 2011 Statewide Sources and Disposition Summary MMcf/Day California Trans Kern Sources El Paso western GTN River Mojave (10) Other (1) RUBY Total Southern California Gas Company Core + UAF (2) ,040 Noncore Commercial/Industrial EG (3) EOR Wholesale/Resale/International (4) Total ,623 Pacific Gas and Electric Company (5) Core Noncore Industrial/Wholesale/EG (6) ,323 Total , ,154 Other Northern California Core (7) Non-Utilities Served Load (8,9) Direct Sales/Bypass , ,471 TOTAL SUPPLIER 698 1, ,189 1, ,322 Notes: (1) Includes storage activities, volumes delivered on Questar Southern Trails for SoCalGas and PG&E. (2) Includes NGV volumes (3) EG includes UEG, COGEN, and EOR Cogen. (4) Includes transportation to City of Long Beach, Southwest Gas, City of Vernon, DGN, & SDG&E, as shown. San Diego Gas & Electric Company California Trans Kern Sources El Paso western GTN River Mojave (10) Other (1) RUBY Total Core Noncore Commercial/Industrial Total SouthWest Gas Core Noncore Commercial/Industrial Total (5) Kern River supplies include net volume flowing over Kern River High Desert interconnect. (6) Includes UEG, COGEN, industrial and deliveries to PG&E's wholesale customers. (7) Includes Southwest Gas Corporation and Tuscarora deliveries in the Lake Tahoe and Susanville areas. (8) Deliveries to end-users by non-cpuc jurisdictional pipelines. (9) California production is preliminary. 24
34 EXECUTIVE SUMMARY Recorded 2012 Statewide Sources and Disposition Summary MMcf/Day California Trans Kern Sources El Paso western GTN River Mojave (10) Other (1) Ruby Total Southern California Gas Company Core + UAF (2) Noncore Commercial/Industrial EG (3) EOR Wholesale/Resale/International (4) Total ,834 Pacific Gas and Electric Company (5) Core Noncore Industrial/Wholesale/EG (6) ,863 Total ,672 Other Northern California Core (7) Non-Utilities Served Load (8,9) Direct Sales/Bypass ,245 TOTAL SUPPLIER 637 1, ,064 1, ,774 Notes: (1) Includes storage activities, volumes delivered on Questar Southern Trails for SoCalGas and PG&E. (2) Includes NGV volumes (3) EG includes UEG, COGEN, and EOR Cogen. (4) Includes transportation to City of Long Beach, Southwest Gas, City of Vernon, DGN, & SDG&E, as shown. California Trans Kern Sources El Paso western GTN River Mojave (10) Other (1) Ruby Total San Diego Gas & Electric Company Core Noncore Commercial/Industrial Total SouthWest Gas Core Noncore Commercial/Industrial Total (5) Kern River supplies include net volume flowing over Kern River High Desert interconnect. (6) Includes UEG, COGEN, industrial and deliveries to PG&E's wholesale customers. (7) Includes Southwest Gas Corporation and Tuscarora deliveries in the Lake Tahoe and Susanville areas. (8) Deliveries to end-users by non-cpuc jurisdictional pipelines. (9) California production is preliminary. 25
35 EXECUTIVE SUMMARY Recorded 2013 Statewide Sources and Disposition Summary MMcf/Day California Trans Kern Sources El Paso western GTN River Mojave (10) Other (1) Ruby Total Southern California Gas Company Core + UAF (2) Noncore Commercial/Industrial EG (3) EOR Wholesale/Resale/International (4) Total 153 1, ,775 Pacific Gas and Electric Company (5) Core Noncore Industrial/Wholesale/EG (6) ,440 Total ,200 Other Northern California Core (7) Non-Utilities Served Load (8,9) Direct Sales/Bypass ,170 TOTAL SUPPLIER 618 1, , ,169 Notes: (1) Includes storage activities, volumes delivered on Questar Southern Trails for SoCalGas and PG&E. (2) Includes NGV volumes (3) EG includes UEG, COGEN, and EOR Cogen. (4) Includes transportation to City of Long Beach, Southwest Gas, City of Vernon, DGN, & SDG&E, as shown. California Trans Kern Sources El Paso western GTN River Mojave (10) Other (1) Ruby Total San Diego Gas & Electric Company Core Noncore Commercial/Industrial Total SouthWest Gas Core Noncore Commercial/Industrial Total (5) Kern River supplies include net volume flowing over Kern River High Desert interconnect. (6) Includes UEG, COGEN, industrial and deliveries to PG&E's wholesale customers. (7) Includes Southwest Gas Corporation and Tuscarora deliveries in the Lake Tahoe and Susanville areas. (8) Deliveries to end-users by non-cpuc jurisdictional pipelines. (9) California production is preliminary. 26
36 EXECUTIVE SUMMARY Recorded 2014 Statewide Sources and Disposition Summary MMcf/Day California Trans Kern Sources El Paso western GTN River Mojave Other (1) RUBY Total Southern California Gas Company Core + UAF (2) Noncore Commercial/Industrial EG (3) EOR Wholesale/Resale/International (4) Total Pacific Gas and Electric Company (5) Core Noncore Industrial/Wholesale/EG (6) ,638 Total ,295 Other Northern California Core (7) Non-Utilities Served Load (8,9) Direct Sales/Bypass ,600 TOTAL SUPPLIER 791 1, ,173 1, ,492 Notes: (1) Includes storage activities, volumes delivered on Questar Southern Trails for SoCalGas and PG&E. (2) Includes NGV volumes (3) EG includes UEG, COGEN, and EOR Cogen. (4) Includes transportation to City of Long Beach, Southwest Gas, City of Vernon, DGN, & SDG&E, as shown. San Diego Gas & Electric Company California Trans Kern Sources El Paso western GTN River Mojave (10) Other (1) RUBY Total Core Noncore Commercial/Industrial Total SouthWest Gas Core Noncore Commercial/Industrial Total (5) Kern River supplies include net volume flowing over Kern River High Desert interconnect. (6) Includes UEG, COGEN, industrial and deliveries to PG&E's wholesale customers. (7) Includes Southwest Gas Corporation and Tuscarora deliveries in the Lake Tahoe and Susanville areas. (8) Deliveries to end-users by non-cpuc jurisdictional pipelines. (9) California production is preliminary. 27
37 EXECUTIVE SUMMARY Recorded 2015 Statewide Sources and Disposition Summary MMcf/Day California Trans Kern Sources El Paso western GTN River Mojave Other (1) RUBY Total Southern California Gas Company Core + UAF (2) Noncore Commercial/Industrial EG (3) EOR Wholesale/Resale/International (4) Total Pacific Gas and Electric Company (5) Core Noncore Industrial/Wholesale/EG (6) ,884 Total , ,595 Other Northern California Core (7) Non-Utilities Served Load (8,9) Direct Sales/Bypass ,234 TOTAL SUPPLIER Notes: (1) Includes storage activities, volumes delivered on Questar Southern Trails for SoCalGas and PG&E. (2) Includes NGV volumes (3) EG includes UEG, COGEN, and EOR Cogen. (4) Includes transportation to City of Long Beach, Southwest Gas, City of Vernon, DGN, & SDG&E, as shown. San Diego Gas & Electric Company California Trans Kern Sources El Paso western GTN River Mojave (10) Other (1) RUBY Total Core Noncore Commercial/Industrial Total SouthWest Gas Core Noncore Commercial/Industrial Total (5) Kern River supplies include net volume flowing over Kern River High Desert interconnect. (6) Includes UEG, COGEN, industrial and deliveries to PG&E's wholesale customers. (7) Includes Southwest Gas Corporation and Tuscarora deliveries in the Lake Tahoe and Susanville areas. (8) Deliveries to end-users by non-cpuc jurisdictional pipelines. (9) California production is preliminary. 28
38 EXECUTIVE SUMMARY STATEWIDE RECORDED HIGHEST SENDOUT The table below summarizes the highest sendout days by the state in the summer and winter periods from the last five years. Daily sendout from Southern California Gas Company, Pacific Gas & Electric and from customers not served by these utilities were used to construct the following tables. Estimated California Highest Summer Sendout (MMcf/d (4) ) Year Date PG&E (1) SoCal Gas (2) Utility Total (3) Non- Utility (3) State Total /08/2011 2,164 3,313 5,477 1,322 6, /13/2012 2,685 3,483 6,168 1,633 7, /01/2013 2,558 3,393 5,951 1,437 7, /16/2014 2,683 3,488 6,171 1,523 7, /10/2015 2,787 3,601 6,899 1,407 7,795 Estimated California Highest Winter Sendout (MMcf/d (4) ) Year Date PG&E (1) SoCal Gas (2) Utility Total (3) Non- Utility (3) State Total /12/2011 2,842 4,152 6,994 1,501 8, /19/2012 3,628 4,294 7,922 1,501 9, /09/2013 4,850 4,881 9,731 1,426 11, /31/2014 3,429 4,325 7,754 1,465 9, /29/2015 3,626 4,036 7,865 1,311 8,973 Notes: (1) PG&E Piperanger. (2) SoCalGas Envoy. (3) Source: DOGGR, Monthly Oil and Gas Production and Injection Report, Lipmann Monthly Pipeline Reports. Nonutility Demand equals Kern/Mojave and California monthly average total flows less PG&E and SoCal Gas peak day supply from Kern/Mojave and California Production. Provided by the CEC. (4) PG&E and SoCalGas sendouts are reported for the day on which the coincident Utility Total sendout is the maximum for the respective season each year. Winter season months are Jan, Feb, Mar, Nov and Dec; while summer season months are Apr, May, Jun, Jul, Aug, Sep and Oct. 29
39 NORTHERN CALIFORNIA C A L I F O R N I A G A S R E P O R T NORTHERN CALIFORNIA 30
40 NORTHERN CALIFORNIA INTRODUCTION Pacific Gas and Electric Company (PG&E) provides natural gas procurement, transportation, and storage services to 4.2 million residential customers and over 229,000 businesses in northern and central California. In addition to serving residential, commercial, and industrial markets, PG&E provides gas transportation and storage services to a variety of gas-fired electric generation plants in its service area. Other wholesale distribution systems, which receive gas transportation service from PG&E, serve a small portion of the gas customers in the region. PG&E's customers are located in 37 counties from south of Bakersfield to north of Redding, with high concentrations in the San Francisco Bay Area and the Sacramento and San Joaquin valleys. In addition, some customers also utilize the PG&E system to meet their gas needs in Southern California. The Northern California section of the report begins with an overview of the gas demand forecast followed by a discussion of the forecast methodology, economic conditions, and other factors affecting demand in various markets, including the regulatory environment. Following the gas demand forecast are discussions of gas supply and pipeline capacity. Abnormal Peak Day (APD) demands and supply resources, as well as gas balances, are discussed at the end of this section. The forecast in this report covers the years 2016 through However, as a matter of convenience, the tabular data at the end of the section show only the years 2016 through 2022, and the years 2025, 2030, and

41 NORTHERN CALIFORNIA GAS DEMAND OVERVIEW PG&E s 2016 California Gas Report (CGR) average-year demand forecast projects total on-system demand to decline at annual average rate of 0.6 percent between 2016 and This is due to the combination of a 0.3 percent annual decline in the core market and an annual decline of 0.9 percent in the noncore market. By comparison, the 2014 CGR estimated an annual average growth rate of 0.1 percent per year, based on a 0.1 percent annual growth in the core market and a 0.1 percent annual growth in the noncore market. Composition of PG&E Requirements (bcf) Average-Year Demand The projected rate of growth of the core market has decreased from the 2014 CGR primarily due to increasing emphasis on Energy Efficiency (EE). The forecast rate of growth of the noncore electric generation market has decreased due to higher levels of renewable generation to meet the 50 percent goal in 2030 and higher gas transmission rates for electric generators. In this CGR, total gas demand by electric generators and cogenerators in Northern California for average hydrological conditions is estimated to decrease at a rate of about 0.4 percent per year from 2017 through 2035 (the forecast assumes that new rates from PG&E s 2015 Gas Transmission and Storage (GT&S) Rate Case are effective in November 2016). This total gas demand excludes gas delivered by nonutility pipelines to 32
42 NORTHERN CALIFORNIA electric generators and cogenerators in PG&E s service area, such as deliveries by the Kern/Mojave pipelines to the La Paloma and Sunrise plants in central California. In addition, increasing quantities of renewable energy generation are expected to increase the need for load following and ancillary services such as regulation. These ancillary services are likely to be provided by gas-fired power plants, thus, affecting gas demand to some extent. PG&E s 2016 CGR forecast, however, does not capture this impact. FORECAST METHOD PG&E s gas demand forecasts for the residential, commercial, and industrial sectors are developed using econometric models. Forecasts for other sectors (Natural Gas Vehicle (NGV), wholesale) are developed based on market information. Forecasts of gas demand by power plants are developed by modeling the electricity market in the Western Electricity Coordinating Council (WECC) using the MarketBuilder software. While variation in short-term gas use depends mainly on prevailing weather conditions, longer-term trends in gas demand are driven primarily by changes in customer usage patterns influenced by underlying economic, demographic, and technological changes, such as growth in population and employment, changes in prevailing prices, growth in electricity demand and in electric generation by renewables, changes in the efficiency profiles of residential and commercial buildings and the appliances within them, and the response to climate change. FORECAST SCENARIOS The average-year gas demand forecast presented here is a reasonable projection for an uncertain future. However, a point forecast cannot capture the uncertainty in the major determinants of gas demand (e.g., weather, economic activity, appliance saturation, and efficiencies). To give some flavor of the possible variation in gas demand, PG&E has developed an alternative forecast of gas demand under assumed high-demand conditions. For the high-demand scenario, PG&E relied on a weather vintage approach by considering a year with cold temperatures and dry hydro conditions. Assuming the demographic conditions and infrastructure likely to exist in each forecast year, PG&E forecasts total gas demand with the weather conditions set to match the conditions that have an approximately 1-in-10 likelihood of occurrence. PG&E used an average of the forecasts with the weather conditions from November 2001 through October 2002 and November 2009 through October 2010, as the winters of and were colder than normal, and these time periods were average or dry in both Northern California and the Pacific Northwest. In addition to the weather assumptions, in the high-demand scenario PG&E assumed that Diablo Canyon Power Plan units retire at the end of their current licenses in 2024 and Temperature Assumptions Because space heating accounts for a high percentage of use, gas requirements for PG&E s residential and commercial customers are sensitive to prevailing temperature conditions. In previous CGRs, PG&E s average-year demand forecast assumed that 33
43 NORTHERN CALIFORNIA temperatures in the forecast period would be equivalent to the average of observed temperatures during the past 20 years. PG&E is now building into its forecast an assumption of climate change. The climate change scenario is developed from work done at the National Center for Atmospheric Research (Boulder, Colorado), downscaled to the PG&E service area. Although the near-term temperatures of this scenario differ little from long-term averages, the years beyond 2016 begin to show the effects of a warming climate. For example, in 2020, total December/January heating degree days are only 3 percent below the 20-year average. By 2035, however, the impact is more significant, with the difference at 7 percent. Of course, actual temperatures in the forecast period will be higher or lower than those assumed in the climate-change scenario and gas use will vary accordingly. PG&E s high-demand forecast assumes that winter temperatures in the forecast horizon will be the same as those that prevailed during November 2000-October 2001 and November 2009-October Seasonal variations in temperature have relatively little effect on power plant gas demand and, consequently, PG&E s forecasts of power plant gas demand for average and high demand are both based on average temperatures. (Each summer typically contains a few heat waves with temperatures 10º or 15º Fahrenheit above normal, which lead to peak electricity demands and drive up power plant gas demand; however, on a seasonal basis, temperatures seldom deviate more than 2º Fahrenheit from average.) Hydro Conditions In contrast to temperature deviations, annual water runoff for hydroelectric plants has varied by 50 percent above and below the long-term annual average. The impact of dry conditions was demonstrated during the drought and electricity crisis in 2001 (October 2000 through September 2001). For the 2016 CGR s high-demand scenario, as noted above, PG&E used the and conditions. Gas Price and Rate Assumptions Inputs for gas prices and rate assumptions are important for forecasting gas demand; this is especially true for market sectors that are particularly price sensitive, such as industrial or electric generation. PG&E used the gas commodity price forecast described in detail in the Southern California section. The CPUC issued a final decision in PG&E s 2016 GT&S Rate Case on June 23, 2016, which significantly affects gas transmission and end use rates. Because of the uncertainty in the outcome of this case at the time the forecast was prepared, PG&E assumed rates based on its filed request would become effective in November
44 NORTHERN CALIFORNIA MARKET SECTORS Residential Households in the PG&E service area are forecast to grow 0.5 percent annually from However, gas use per household has been dropping in recent years due to improvements in appliance and building-shell efficiencies. This decline accelerated sharply in 2001 when gas prices spiked, causing temperature-adjusted residential gas demand to plunge by more than 8 percent. After recovering somewhat in 2002 and 2003, temperature-adjusted gas use per household reverted to its long-term trend and, despite slight upticks in 2009 and 2010 due to cold winters, has fallen on average 1.6 percent per year since Total residential demand is expected to decrease despite household growth due to continuing upgrades in appliance and building efficiencies, as well as warming temperatures. Commercial The number of commercial customers in the PG&E service area is projected to grow on average by 0.4 percent per year from The noncore-to-core migration wave has caused this class to be less temperature-sensitive than it had previously been, and has also tended to stunt overall growth in both customer base and gas use per customer. Gas use per commercial customer is projected to decline slightly over the forecast horizon due to continuing EE efforts as well as warmer temperatures. Over the next 20 years commercial sales are expected to grow at 0.1 percent per year. Industrial Gas requirements for PG&E s industrial sector are affected by the level and type of industrial activity in the service area and changes in industrial processes. Gas demand from this sector plummeted by close to 20 percent in 2001 due to a combination of increasing gas prices, noncore-to-core migration, and a manufacturing sector mired in a severe downturn. After a slight recovery in 2002, demand from this sector fell another 6 percent in 2003 but has seen slow growth in the recent past due to low natural gas prices and increased capacity at local refineries, though these effects have been tempered by the continuing structural change in California s manufacturing sector. PG&E observed historically high demand from the industrial sector in 2014 and 2015 due in part to refinery demand. While the industrial sector has the potential for high year-to-year variability, over the long-term, industrial gas consumption is expected to grow slowly at 0.2 percent annually over the next 20 years. Electric Generation This sector includes cogeneration and power plants. Forecasts for this sector are subject to greater uncertainty due to the retirement of existing power plants with once-through cooling; the timing, location, and type of new generation, particularly renewable-energy facilities; construction of new electric transmission lines; and the impact of greenhouse gas (GHG) 35
45 NORTHERN CALIFORNIA policies and regulations on both generation and load. Because of these uncertainties, the forecast is held constant at 2030 levels for PG&E forecasts gas demand for most cogenerators by assuming a continuation of past usage, with modifications for expected expansions or closures. In this CGR, PG&E has assumed no additions of new onsite and export (demand- and supply-side) combined heat-and-power plants and retirement of existing plants when they are 40 years old. Operations at most cogeneration plants are not strongly affected by prices in the wholesale electricity market, because electricity is generated with some other product, usually steam, for an industrial process. PG&E forecasts gas demand by power plants and market-sensitive cogenerators using the MarketBuilder software. MarketBuilder enables the creation of economic-equilibrium models of markets with geographically distributed supplies and demands, such as the North American natural gas market. PG&E uses MarketBuilder to model the electricity market in the WECC, which encompasses the electric systems from the Rocky Mountains to the Pacific coast and from northern Baja California to British Columbia and Alberta. PG&E s forecast for uses the mid-case electricity demand forecast from the California Energy Commission s (CEC) 2015 Integrated Energy Policy Report. The forecast assumes that renewable energy generation will provide 25 percent of the state s retail sales in 2016, 33 percent by 2020, 40 percent by 2024, and 50 percent by PG&E assumed that gas-fired plants that employ once-through cooling will retire by the compliance date set by the State Water Resources Control Board, with some replaced by new gas-fired plants. Sacramento Municipal Utility District Electric Generation The Sacramento Municipal Utility District (SMUD) is the sixth largest community owned municipal utility in the United States, and provides electric service to over 575,000 customers within the greater Sacramento area. SMUD operates three cogeneration plants, a gas-fired combined-cycle plant, and a peaking turbine with a total capacity of approximately 1,000 megawatts. The peak gas load of these units is approximately 158 million cubic feet per day (MMcf/d), and the average load is about 122 MMcf/d. SMUD owns and operates a pipeline connecting the Cosumnes combined-cycle plant and the three cogeneration plants to PG&E s backbone system near Winters, California. SMUD owns an equity interest of approximately 3.6 percent in PG&E s Line 300 and approximately 4.2 percent in Line 401 for about 85 MMcf/d of capacity. GREENHOUSE GAS LEGISLATION/ASSEMBLY BILL 32 During the forecast horizon covered by this CGR, there are many uncertainties that may significantly impact the future trajectory of natural gas demand. It is unclear at this time what the ultimate effect on natural gas demand will be from California s landmark California Global Warming Solutions Act of 2006 (Assembly Bill 32, or AB 32) and Clean Energy and Pollution Reduction Act of 2015 (Senate Bill 350, or SB 350). On the one hand, more aggressive EE 36
46 NORTHERN CALIFORNIA programs and/or increased targets for renewable electricity supplies could significantly reduce the use of natural gas by residential and commercial customers and power plants. On the other hand, increased penetration of electric and NGVs could reduce gasoline use and overall GHG emissions, but increase consumption of natural gas. PG&E will continue to minimize GHG emissions by aggressively pursuing both demand-side reductions and acquisition of preferred resources, which produce little or no carbon emissions. RENEWABLE ELECTRIC GENERATION PG&E expects the growth of renewable electric generation due to higher renewable portfolios standards will result in a reduction in the demand for generation from natural gas-fueled resources. This overall reduction in demand may be accompanied by higher daily and hourly deviations between forecast and actual generation from natural gas-fueled electric resources. The intermittent nature of some renewable generation (e.g., wind or solar power) is likely to cause the electric system to rely more heavily on natural gas-fired electric generation to cover forecast deviations and intra-day and intra-hour variability of intermittent generation. This variability will, in turn, result in higher daily forecast errors for gas and increased fluctuations in gas-system inventory. ENERGY EFFICIENCY PROGRAMS PG&E engages in a number of EE and conservation programs designed to help customers identify and implement ways to benefit environmentally and financially from EE investments. Programs administered by PG&E include services that help customers evaluate their EE options and adopt recommended solutions, as well as simple equipment-retrofit improvements, such as rebates for new hot water heaters. The forecast of cumulative natural gas savings due to PG&E s EE programs is provided in the figures below. Savings for these efforts are based on the report California Energy Demand , Revised Electricity Forecast, CEC, January 2016, which contains an Additional Achievable Energy Efficiency section that previously had been published as a standalone report. 37

47 NORTHERN CALIFORNIA Conservation and EE savings include any interactive effects that may result from efficiency improvements of electric end uses; for instance, increased natural gas heating load that could result from efficiency improvements in lighting and appliances. These figures also include any reductions in natural gas demand for electric generation that may occur due to lower electric demand; see Natural Gas savings from electric reductions in the graph on the right above. Details of PG&E s 2015 and 2016 Energy Efficiency Portfolio can be found in California Public Utilities Commission (CPUC or Commission) Decision (D.) , which authorized programs and budgets for 2015, and D , which authorized, among other things, extending these programs into Impact of SB 350 on Energy Efficiency SB 350, which was enacted in fall 2015, requires the CEC, in coordination with the CPUC and the local public utilities, to set EE targets that double the CEC s AAEE mid-case forecast, subject to what is cost-effective and feasible. 2 This legislation will undoubtedly impact levels of 2 The bill text states: On or before November 1, 2017, the commission, in collaboration with the Public Utilities Commission and local publicly owned electric utilities, in a public process that allows input from other stakeholders, shall establish annual targets for statewide energy efficiency savings and demand reduction that will achieve a cumulative doubling of statewide energy efficiency savings in electricity and natural gas final end uses of retail customers by January 1, The commission shall base the targets on a doubling of the mid case estimate of additional achievable energy efficiency savings, as contained in the California Energy Demand Updated Forecast, , adopted by the commission, extended to 2030 using an average annual growth rate, and the targets adopted by local publicly owned electric utilities pursuant to Section 9505 of the Public Utilities Code, extended to 2030 using an average annual 38
48 NORTHERN CALIFORNIA EE savings. There are, however, a number of uncertainties that led the investor-owned utilities (IOU) to defer incorporating estimates of additional savings until the 2018 CGR. These uncertainties include: The deadline for the CEC and CPUC to establish SB 350 targets is November 2017, 16 months after this CGR is filed. A lot of work will need to be done to set these targets. There are already state requirements for IOUs to pursue all cost-effective EE. Given that the doubling goal is subject to what is cost-effective and achievable, a significant increase in savings while still maintaining a cost-effective portfolio would require changes to programs and/or what is deemed to be cost-effective. IOU EE programs are still operating under avoided costs that were last updated in 2011 and An update to avoided costs is currently underway and is likely to decrease what is currently determined to be cost-effective, as gas prices have dropped and/or stayed lower than forecast in 2011 and 2012 and higher levels of renewables have pushed down energy and capacity values. In the CPUC s EE proceeding, an effort is underway to update EE goals to reflect SB 350 and AB 802 impacts. This update is not yet available and will be an important source for estimating SB 350 EE impacts. It is expected that these updated goals will be available for incorporation into the 2018 CGR. For these reasons, PG&E used current levels of EE included in the 2015 Integrated Energy Policy Report in the forecast for this CGR. However, for context, the IOUs offer the following relative maximum impact of SB 350 on EE savings levels. Assuming costeffectiveness challenges identified above can be resolved, a doubling of cumulative EE savings, based on the mid-case estimate of additional achievable EE savings, as contained in the California Energy Demand Updated Forecast, , would result in approximately 600 million therms beyond current levels statewide by However, the reader is cautioned that this is based on a literal reading of the bill language and the CEC forecast identified in the bill, without consideration of the challenges mentioned above. growth rate, to the extent doing so is cost effective, feasible, and will not adversely impact public health and safety. 39
49 NORTHERN CALIFORNIA GAS SUPPLY, CAPACITY, AND STORAGE OVERVIEW Competition for gas supply, market share, and transportation access has increased significantly since the late 1990s. Implementation of PG&E s Gas Accord in March 1998 and the addition of interstate pipeline capacity and storage capacity have provided all customers with direct access to gas supplies, intra- and inter-state transportation, and related services. Almost all of PG&E s noncore customers buy all or most of their gas supply needs directly from the market. They use PG&E s transportation and storage services to meet their gas needs. Overall, most of the gas supplies that serve PG&E customers are sourced from out of state with only a small portion originating in California. This mix is due to the increasing gas demand in California over the years and the limited amount of native California supply available. GAS SUPPLY California-Sourced Gas Northern California-sourced gas supplies come primarily from gas fields in the Sacramento Valley. In 2015, PG&E s customers obtained on average 39 MMcf/d of Californiasourced gas. U.S. Southwest Gas PG&E s customers have access to three major U.S. Southwest gas producing basins Permian, San Juan, and Anadarko via the El Paso, Southern Trails, and Transwestern pipeline systems. PG&E s customers can purchase gas in the producing basins and transport it to California via interstate pipelines. They can also purchase gas at the California-Arizona border or at the PG&E Citygate from marketers who hold inter- or intra-state pipeline capacity. Canadian Gas PG&E s customers can purchase gas from various suppliers in western Canada (British Columbia and Alberta) and transport it to California primarily through the Gas Transmission Northwest Pipeline. Likewise, they can also purchase these supplies at the California-Oregon border or at the PG&E Citygate from marketers who hold inter- or intra-state pipeline capacity. 40
50 NORTHERN CALIFORNIA Rocky Mountain Gas PG&E s customers have access to gas supplies from the Rocky Mountain area via the Kern River Pipeline, the Ruby Pipeline and via the Gas Transmission Northwest Pipeline interconnect at Stanfield, Oregon. The Ruby Pipeline came online in July 2011 and brings up to 1.5 billion cubic feet per day (bcf/d) of Rocky Mountain gas to Malin, Oregon. With Ruby pipeline, the share of Canadian gas to PG&E s system has been reduced somewhat while the Redwood path from Malin to PG&E Citygate has run at a higher utilization rate. Storage In addition to storage services offered by PG&E, there are four other storage providers in Northern California Wild Goose Storage, Inc., Gill Ranch Storage, LLC; Central Valley Gas Storage, LLC; and Lodi Gas Storage, LLC. As of 2015, these facilities had total working gas capacity of roughly 133 billion cubic feet and peak withdrawal capacity of 2.5 bcf/d. INTERSTATE PIPELINE CAPACITY As a result of pipeline expansion and new projects, California utilities and end-users benefit from improved access to supply basins and enhanced gas-on-gas and pipeline-on-pipeline competition. Interstate pipelines serving northern and central California include the El Paso, Mojave, Transwestern, Gas Transmission Northwest, Paiute Pipeline Company, Ruby, Southern Trails, and Kern River pipelines. These pipelines provide northern and central California with access to gas-producing regions in the U.S. Southwest and Rocky Mountain areas, and in western Canada. U.S. Southwest and Rocky Mountains PG&E s Baja Path (Line 300) is connected to U.S. Southwest and Rocky Mountain pipeline systems (Transwestern, El Paso, Southern Trails, and Kern River) at and west of Topock, Arizona. The Baja Path has a firm capacity of 1,016 MMcf/d. Canada and Rocky Mountains PG&E s Redwood Path (Lines 400/401) is connected to Gas Transmission Northwest and Ruby at Malin, Oregon. The Redwood Path has a firm capacity of 2,023 MMcf/d. GAS SUPPLIES AND INFRASTRUCTURE PROJECTS PG&E anticipates that sufficient supplies will be available from a variety of sources at market-competitive prices to meet existing and projected market demands in its service area. The new supplies could be delivered through a variety of sources, including new interstate pipeline facilities and expansion of PG&E s existing transmission facilities, or PG&E s or others storage facilities. 41
51 NORTHERN CALIFORNIA The growth of gas production in the Midcontinent and eastern shale plays (e.g., Barnett in northeast Texas, Marcellus in Pennsylvania) have had the effect of pushing larger volumes of Canadian, Rockies, San Juan, and Permian supplies to California, as those supplies are crowded out of markets to the east. Liquefied Natural Gas Imports/Exports U.S. imports of liquefied natural gas (LNG) have been declining since The development of low-cost domestic shale gas supplies has largely eliminated the need for LNG imports and positioned the United States as a net exporter of LNG. Exports of LNG from the contiguous U.S. started in early LNG contracts have traditionally been indexed to oil prices. The collapse of world oil prices in 2015, slowing growth of Asian economies, and the expansion of world LNG liquefaction capacity have increased the uncertainty around the economic viability of North American LNG liquefaction projects over the next several years. There are numerous proposed projects to export LNG to world markets. Many of the projects are brownfield, using existing U.S. import terminals to export LNG, but some are greenfield. The greenfield LNG export projects targeting the Asian gas market are mostly on the west coasts of the U.S. and Canada. The DOE granted conditional authorization to the Jordan Cove project in Oregon with non-fta LNG export capacity of 0.8 bcf/d on March 24, On March 11, 2016, the FERC rejected the project and its related Pacific Connector pipeline. However, much more work lies ahead to resolve complex issues of commercial contracts, FERC and local approvals, financing, and new pipelines, before plans can succeed. On April 15, 2016, the Oregon LNG project was terminated due to local opposition. The Jordan Cove LNG export project, which would be the first on the U.S. West Coast, is positioned to source gas from Canada and the U.S. Rockies; thus, it could directly compete for gas supplies available to Northern California. North American Supply Development The biggest development in the North American gas supply picture in the past several years has been the rapid development of various shale gas resources through horizontal drilling combined with hydraulic fracturing. While the initial developments were concentrated in the U.S. Midcontinent, the large Marcellus and Utica plays in the eastern U.S. have become the main source of supply growth, resulting in record U.S. gas production in While some of the traditional supply basins have shown modest declines in production, the Marcellus and Utica plays have grown from roughly 10 percent of U.S. production in 2012 to about 25 percent in 2015, with further growth expected in the next few years. Most industry forecasts now expect supply can increase to meet the most aggressive demand scenario in the future. 42
52 NORTHERN CALIFORNIA GAS STORAGE Northern California is served by several gas storage facilities in addition to the long-standing PG&E fields at McDonald Island, Pleasant Creek, and Los Medanos. Other storage providers include Gill Ranch Storage, LLC (the 20 bcf facility was co-developed with PG&E, which owns 25 percent of the capacity), Wild Goose Storage, Inc., Lodi Gas Storage, LLC, and Central Valley Storage, LLC. The abundant storage capacity in the Northern California market has had the effect of creating additional liquidity in the market both in Northern California and in other parts of the West. The extent to which Northern California storage helped supply the larger western market could be seen during much of the winter of ; increased storage withdrawals allowed pipeline supplies to meet demand outside of California. 43
53 NORTHERN CALIFORNIA REGULATORY ENVIRONMENT STATE REGULATORY MATTERS Gas Quality Gas quality has received much less attention since 2010 due to the abundance of domestic gas supply, which has diminished interest in LNG imports, as described in the previous section. Hence, the challenges associated with integrating LNG and traditional North American sources, each typically with different quality characteristics, do not require immediate resolution. Pipeline Safety Since 2011, the CPUC and the state legislature have adopted a series of regulations and bills that reinforce the setting of public and employee safety as the top priority for the state s gas utilities. In particular, SB 705 mandated for the first time that gas operators develop and implement safety plans that are consistent with the best practices in the gas industry. On December 29, 2015, PG&E filed its 2015 update to the Gas Safety Plan with the CPUC. The Gas Safety Plan update demonstrates PG&E s commitment to implement processes and procedures to achieve its vision to becoming the safest and most reliable natural gas utility in the nation. One of the plan highlights is the Gas Safety Excellence framework, which guides how PG&E operates, conducts, and manages all parts of its business by putting safety and people at the heart of everything it does; investing in the reliability and integrity of its gas system; and, by continuously improving the effectiveness and affordability of its processes. Additionally, PG&E submits semi-annual GT&S, and Gas Distribution Pipeline Safety Reports. These reports are designed to provide the CPUC and other interested stakeholders with insight into the amount of safety and reliability-related work PG&E has completed over the course of the reporting period. See below for a selection of 2015 highlights further demonstrating PG&E s commitment to gas safety: American Petroleum Institute Recommended Practice (API RP 1173): PG&E is the first company in the U.S. to meet the rigor of a new industry gold standard for pipeline safety and safety culture. PAS-55 and ISO 55001: Successfully maintained PAS 55-1 and ISO certifications for asset management with two separate, third-party assessments. 44
54 NORTHERN CALIFORNIA Cast Iron Pipe Removal: Culminating in a multi-decade program to improve system safety, PG&E completed removal of all known cast iron pipe from its system. Community Pipeline Safety Initiative: A multi-year program designed to enhance safety by improving access to pipeline right-of-way goals included clearing 380 miles of trees and brush and 90 miles of structures located too close to gas pipelines and which pose an emergency access or safety concern. Storage Safety On January 16, 2016, California Governor Jerry Brown ordered that injections into Southern California Gas Company s (SoCalGas) Aliso Canyon storage field remain suspended until a comprehensive review, utilizing independent experts, of the safety of the storage wells is completed. The reduced working storage capacity on the SoCalGas system would tend to increase the volatility in southern California natural gas prices. Greater price volatility in Southern California would likely cause greater fluctuations in flows on PG&E s system (particularly the Baja path), on the interconnects between PG&E s and SoCalGas systems, and into and out of Northern California storage fields. Greater fluctuations in flows could lead to increased use of PG&E s storage for balancing and more frequent operational flow orders. On March 1, 2016, SoCalGas and San Diego Gas & Electric Company submitted a joint motion to the CPUC proposing temporary daily balancing while the Aliso Canyon field is out of service. The impacts above could be even greater if the real-time dispatch of SoCalGas fired generators is constrained by their day-ahead dispatch to minimize balancing penalties, resulting in northern California gas-fired generators being used to meet real-time load variations. Emergency regulations implemented by the Division of Oil, Gas, and Geothermal Resources on February 5, 2015 should have no potential impact in meeting peak demands in summer and winter. Scheduling of inspections, maintenance, repairs and monitoring under the emergency regulations could potentially result in short duration outages. The Division of Oil, Gas, and Geothermal Resources will promulgate new regulations to replace the emergency regulations and various legislation introduced on storage safety. Core Gas Aggregation Program As of early 2016, Core Transport Agents (CTA) serve approximately 19 percent of PG&E s core gas demand. PG&E completed implementing the CTA Settlement Agreement, part of the Gas Accord V Settlement Agreement, in The CTA Settlement Agreement modified the practice by which PG&E offers a share of its pipeline and storage capacity holdings to CTAs to serve core customers. In April 2015, the CTAs began taking full cost responsibility for all rejected firm pipeline capacity and rejected firm storage inventory capacity. In October 2015, the Commission issued D , which established a new interstate pipeline capacity planning range for PG&E s core gas customers, and affirmed that PG&E 45
55 NORTHERN CALIFORNIA should acquire interstate pipeline capacity for both PG&E s bundled core customers and for those core customers served by CTAs. FEDERAL REGULATORY MATTERS PG&E actively participates in FERC ratemaking proceedings for interstate pipelines connected to PG&E s system, because these cases can impact the cost of gas delivered to PG&E s gas customers and the services provided. PG&E also participates in FERC proceedings of general interest to the extent they affect PG&E s operations and policies or natural gas market policies generally. El Paso Natural Gas Company, L.L.C. (El Paso) El Paso filed a general rate case application in the FERC Docket No. RP , for revised rates and terms and conditions effective April 1, Several issues raised in rehearing requests and exceptions to FERC s decisions are currently under review by the U.S. Court of Appeals. Kern River Gas Transmission (Kern River) There are currently no significant regulatory issues. Ruby Pipeline, L.L.C. (Ruby) There are currently no significant regulatory issues. Transwestern Pipeline Company, L.L.C. (Transwestern) On October 15, 2015, FERC approved a rate case settlement between Transwestern and shippers. Under the settlement, Transwestern may not file a new general Section 4 rate case before October 1, 2019, unless it files to implement a surcharge in compliance with FERC s policy statement providing for the modernization of natural gas facilities. Transwestern and shippers, including PG&E, are working to resolve non-rate issues, including the adoption of a maximum heating value of the gas received and delivered. Gas Transmission Northwest (GTN) and Canadian Pipelines On June 30, 2015, FERC approved a rate settlement between Gas Transmission Northwest and its customers. The agreement is effective January 1, 2016 through December 31, 2019, and results in a rate decrease for California customers. PG&E participates in Canadian regulatory matters pertaining to its pipeline capacity subscriptions on TransCanada s NOVA Gas Transmission Limited (NGTL) and Foothills Pipelines Limited Company (Foothills). NGTL and Foothills transport PG&E s Canadian- 46
56 NORTHERN CALIFORNIA sourced gas from Alberta and British Columbia, delivering the supplies to GTN at the Canadian-U.S. Border, for ultimate delivery to California. On April 7, 2016, Canada s National Energy Board (NEB) approved a settlement agreement on NGTL s revenue requirements. Foothills received approval for separate rate changes effective in 2015 and 2016, respectively. The resulting transportation rate changes on both pipelines are nominal. FERC Gas-Electric Coordination Actions (AD12-12 & EL14-22) Since 2012, FERC commissioners have raised questions about whether there is sufficient coordination and harmonization between gas and electric systems regarding reliability. Concerns have arisen for several reasons: extreme weather events that can affect both the gas and electric grids; expectations of significant increases in gas-fired electric generation nationwide (less so in PG&E s service territory since a significant number of gas-fired generators already exist); and the expanding prevalence of renewable generation portfolio requirements and the resulting need for non-renewable fuel sources, like natural gas, to support the grid when renewable generation is unavailable or reduced. In spring 2012, FERC held multiple technical conferences and requested comments from gas and electric industry stakeholders regarding any impediments to closer coordination/communication. After multiple meetings and comment periods, on March 20, 2014, FERC issued a Notice of Proposed Rulemaking (NOPR) proposing to move the start of the Gas Day from the current 9 a.m. to 4 a.m. (Central Time) and change the natural gas intraday scheduling practice. The NOPR provided the gas and electricity industry the opportunity to work through the North American Energy Standards Board (NAESB) to reach consensus on modification of the proposed gas day and nomination schedule by September 29, 2014, and requested comments on the NOPR by November 28, PG&E actively participated in the NAESB process and led a coalition that supported retention of the existing Gas Day and adoption of the NAESB consensus scheduling cycle changes. On April 16, 2015, FERC issued Order 809 in which FERC adopted the NAESB endorsed modified scheduling cycles. FERC elected to retain the existing Gas Day. In general, PG&E s position is that gas-electric coordination should be viewed on a regional basis due to the numerous differences in infrastructure and electric markets across the country. PG&E also believes that a high degree of coordination already exists in California between gas system operators and the (electric) California Independent System Operator (CAISO). Also on March 20, 2014, FERC requested that Independent System Operators/Regional Transmission Operators (ISO/RTO) investigate electric scheduling practices. FERC did not dictate any specific language changes; instead it required each ISO/RTO, to make a filing 90 days after the gas-day revised final order is published containing either (1) proposed tariff changes to adjust the electric scheduling; or (2) show why such changes are not necessary. The 47
57 NORTHERN CALIFORNIA CAISO proposed that its electric scheduling timelines remain unchanged. FERC accepted the CAISO s recommendation. OTHER REGULATORY MATTERS Gas Exports The U.S. Department of Energy (DOE) evaluates the impact of LNG projects proposing to export LNG to countries without a Free Trade Agreement (FTA) with the U.S. and grants approval only if the project is deemed in the public interest. As of February 2016, the DOE had approved 16 non-fta LNG export applications with a total export capacity of 15.7 bcf/d. The U.S. Federal Energy Regulatory Commission (FERC), on the other hand, is focused on evaluating the environmental impacts of proposed LNG projects, and is responsible for authorizing the siting and construction of LNG facilities. As of January 2016, FERC had approved for construction 12.8 bcf/d of LNG export capacity, all but 2.2 bcf/d of which was under construction. As of March 2016, only the first train of Sabine Pass Liquefaction, LLC, has completed construction. With low domestic natural gas prices compared to world markets, the United States is positioned to become a net exporter of natural gas by Mexico, accounting for approximately 60 percent of total U.S. gas exports, became the largest importer of U.S. natural gas in The U.S. natural gas exports to Mexico have grown in recent years from 0.9 bcf/d in 2010 to 2.9 bcf/d in 2015, and are projected to reach 5.0 bcf/d by Declining gas production and increasing gas demand for power generation and industrial use in Mexico are main drivers of this export growth. Completion of several gas pipeline capacity-expansion projects on both sides of the U.S.-Mexico border have resulted in 7 bcf/d of export capacity as of 2015.More pipeline projects are under way to help meet Mexico s growing demand for U.S. gas. When completed, these pipelines will significantly increase the total U.S.-to-Mexico pipeline-export capacity. Greenhouse Gas (GHG) Reporting and Cap-and-Trade Obligations In 2015, PG&E Gas Operations reported to the Environmental Protection Agency (EPA) GHG emissions in accordance with 40 Code of Federal Regulations Part 98 in three primary categories: GHG emissions in 2015 resulting from combustion at seven compressor stations, where the annual emissions exceed 25,000 metric tons of CO 2 equivalent (mtco 2e); the GHG emissions resulting from combustion of all customers except customers consuming more than 460 MMcf; and certain vented and fugitive emissions from the seven compressor stations and natural gas distribution system. In 2015, PG&E Gas Operations reported to the California Air Resources Board (CARB) GHG emissions approximately 44 million mtco 2e in three primary categories: GHG emissions resulting from combustion at seven compressor stations and one underground gas storage facility, where the annual emissions exceed 10,000 mtco 2e; the GHG emissions resulting from combustion of delivered gas to all customers; and vented and fugitive emissions from seven 48
58 NORTHERN CALIFORNIA compressor stations, one underground gas storage facility and the natural gas distribution system. The seven compressor stations subject to the CARB mandatory reporting are still subject to the CARB Cap-and-Trade Program. On January 1, 2015, natural gas suppliers became subject to the Cap-and-Trade Program and now have a compliance obligation for GHG emissions from the natural gas use of their small customers (i.e., those customers who are not covered directly under CARB s Cap-and-Trade program). In 2014, CARB estimated that PG&E s responsibility for compliance obligations of GHG emissions as a natural gas supplier were approximately 16.4 million mtco 2e for CARB will issue the final 2015 compliance obligations of GHG emissions as a natural gas supplier in October In 2014, Rulemaking (R.) was initiated by the Commission to carry out the intent of SB 1371 (Statutes 2014, Chapter 525).1 SB 1371 requires the adoption of rules and procedures to minimize natural gas leakage from Commission-regulated natural gas pipelines consistent with Public Utilities Code Section 961 (d), (c) of Subpart M of Title 49 of the CFR, the Commission s General Order 112-F, and the state s goal of reducing GHG emissions. As part of this rulemaking, natural gas utilities are required to annually report methane emissions from intentional and unintentional releases and their leak management practices. On June 17, 2016, PG&E filed the 2015 Annual Report and reported 3.25 billion cubic feet (Bcf) of methane emissions from intentional and unintentional releases. Currently, these emissions are not subject to the CARB Cap-and-Trade Program. California State Senate Bill 350 On October 7, 2015, Governor Brown signed into law SB 350 which among others requires that commencing in 2017 the Commission adopt a process for each Load Serving Entity (LSE) to file and periodically update an Integrated Resource Plan (IRP) to ensure that LSEs: Meet the GHG emissions reduction targets established by the State Air Resources Board, in coordination with the Commission and the Energy Commission, for the electricity sector and each load-serving entity that reflect the electricity sector s percentage in achieving the economy-wide GHG emissions reductions of 40 percent from 1990 levels by 2030; Procure at least 50 percent eligible renewable energy resources by December 31, 2030; Enable each electrical corporation to fulfill its obligation to serve its customers at just and reasonable rates; Minimize impacts on ratepayers bills; Ensure system and local reliability; 49
59 NORTHERN CALIFORNIA Strengthen the diversity, sustainability, and resilience of the bulk transmission and distribution systems, and local communities; Enhance distribution systems and demand-side energy management; and Minimize localized air pollutants and other GHG emissions, with early priority on disadvantaged communities. On February 11, 2016, the Commission opened R with the primary purpose of implementing the Commission s requirement to adopt an IRP process. 50
60 NORTHERN CALIFORNIA ABNORMAL PEAK DAY DEMAND AND SUPPLY APD DEMAND FORECAST The APD forecast is a projection of demand under extreme weather conditions. PG&E uses a 1-in-90-year cold-temperature event as the design criterion. This criterion corresponds to a 27 degree Fahrenheit system-weighted mean temperature across the PG&E gas system. The PG&E core demand forecast corresponding to a 27 degree Fahrenheit temperature is estimated to be approximately 3.2 bcf/d. The PG&E load forecast shown here excludes all noncore demand and, in particular, excludes all electric generation (EG) demand. PG&E estimates that total noncore demand during an APD event would be approximately 2.5 bcf/d, with EG demand comprising between one-half to two-thirds of the total noncore demand. The APD core forecast is developed using the observed relationship between historical daily weather and core usage data. This relationship is then used to forecast the core load under APD conditions. APD SUPPLY REQUIREMENT FORECAST For APD planning purposes, supplies will flow under Core Procurement s firm capacity, any as-available capacity, and capacity made available pursuant to supply-diversion arrangements. Supplies could also be purchased from noncore suppliers. Flowing supplies may come from Canada, the U.S. Southwest, the Rocky Mountain region, SoCalGas, and California production. Also, a significant part of the APD demand will be met by storage withdrawals from PG&E s and independent storage providers underground storage facilities located within northern and central California. PG&E s Core Gas Supply Department is responsible for procuring adequate flowing supplies to serve approximately 78 percent of PG&E s core gas usage. Core aggregators provide procurement services for the balance of PG&E s core customers and have the same obligation as PG&E Core Gas Supply to make and pay for all necessary arrangements to deliver gas to PG&E to match the use of their customers. In previous extreme-cold weather events, PG&E has observed a drop in flowing pipeline supplies. Supply from Canada is affected as the cold weather front drops south from Canada with a two-to-three-day lag before hitting PG&E s service territory. There is also impact on supply from the Southwest. While prices can influence the availability of supply to our system, cold weather can affect producing wells in the basins, which in turn can affect the total supply to the PG&E system and others. If core supplies are insufficient to meet core demand, PG&E can divert gas from noncore customers, including EG customers, to meet it. PG&E s tariffs contain diversion and Emergency Flow Order (EFO) noncompliance charges that are designed to cause the noncore market to either reduce or cease its use of gas, if required. Since little, if any, alternate fuel-burn capability 51
61 NORTHERN CALIFORNIA exists today, supply diversions from the noncore would necessitate those noncore customers to curtail operations. The implication for the future is that under supply-shortfall conditions such as an APD, a significant portion of EG customers could be shut down with the impact on electric system reliability left as an uncertainty. As mentioned above, PG&E projects that in the near term, noncore demand, including gas-fired EG, on an APD would be approximately 2.5 bcf/d. With the Wild Goose, Lodi, Gill Ranch, and Central Valley Gas storage facilities, more noncore demand will be satisfied in the event of an APD. The availability of supply for any given high-demand event, such as an APD, is dependent on a wide range of factors, including the availability of interstate flowing supplies and storage inventories. Forecast of Core Gas Demand and Supply on an APD (Million Cubic Feet Per Day) APD Core Demand (1) 3,199 3,208 3,211 Firm Storage Withdrawal (2) 1,076 1,076 1,076 Required Flowing Supply (3) 2,123 2,132 2,135 Total APD Resources 3,199 3,208 3,211 Notes: (1) Includes PG&E s Gas Procurement Department s and other Core Aggregator s core customer demands. APD core demand forecast is calculated for 27 degrees Fahrenheit system-composite temperature, corresponding to 1-in-90-year cold-temperature event. PG&E uses a system-composite temperature based on six weather sites. (2) Core Firm Storage Withdrawal capacity includes 98 MMcf/day contracted with an on-system independent storage provider. (3) Includes supplies flowing under firm and as-available capacity, and capacity made available pursuant to supply-diversion arrangements. 52
62 NORTHERN CALIFORNIA The tables below provide peak-day demand projections on PG&E s system for both winter month (December) and summer month (August) periods under PG&E s high-demand scenario. Winter Peak Day Demand (Million Cubic Feet per Day) Year Core (1) Noncore Non-EG (2) EG, including SMUD (3) Total Demand , , , , , ,012 4, , , , , , ,075 Notes: (1) Core demand calculated for 34-degrees-Fahrenheit system-composite temperature, corresponding to 1-in-10-year cold-temperature event. (2) Average daily winter (December) demand. (3) Average daily winter (December) demand under 1-in-10 cold-and-dry conditions. Summer Peak Day Demand (Million Cubic Feet per Day) Year Core (4) Noncore Non-EG (4) EG, including SMUD (5) Total Demand ,506 2, ,144 2, ,197 2, ,167 2, ,199 2, ,173 2,187 Notes: (4) Average daily summer (August) demand. (5) Average daily summer (August) demand under 1-in-10 cold-and-dry conditions. 53
63 NORTHERN CALIFORNIA C A L I F O R N I A G A S R E P O R T NORTHERN CALIFORNIA TABULAR DATA 54
64 NORTHERN CALIFORNIA ANNUAL GAS SUPPLY AND REQUIREMENTS RECORDED YEARS MMCF/DAY LINE LINE GAS SUPPLY TAKEN CALIFORNIA SOURCE GAS 1 Core Purchases Customer Gas Transport & Exchange Total California Source Gas OUT-OF-STATE GAS Core Net Purchases 6 Rocky Mountain Gas U.S. Southwest Gas Canadian Gas Customer Gas Transport 10 Rocky Mountain Gas U.S. Southwest Gas Canadian Gas Total Out-of-State Gas 2,059 2,330 2,146 2,247 2, STORAGE WITHDRAWAL (2) Total Gas Supply Taken 2,513 2,673 2,598 2,640 2, GAS SENDOUT CORE 19 Residential Commercial NGV Total Throughput-Core NONCORE 24 Industrial Electric Generation (1) , NGV Total Throughput-Noncore 1,222 1,458 1,507 1,524 1, WHOLESALE Total Throughput 2,058 2,239 2,291 2,183 2, OFF-SYSTEM DELIVERIES (4) CALIFORNIA EXCHANGE GAS STORAGE INJECTION (2) SHRINKAGE Company Use / Unaccounted for Total Gas Send Out 2,513 2,673 2,598 2,640 2, TRANSPORTATION & EXCHANGE 38 CORE ALL END USES NONCORE INDUSTRIAL ELECTRIC GENERATION SUBTOTAL/RETAIL 1,339 1,587 1,658 1,666 1, WHOLESALE/INTERNATIONAL TOTAL TRANSPORTATION AND EXCHANGE 1,349 1,596 1,668 1,674 1, CURTAILMENT/ALTERNATIVE FUEL BURNS 48 Residential, Commercial, Industrial Utility Electric Generation TOTAL CURTAILMENT NOTES: (1) Electric generation includes SMUD, cogeneration, PG&E-owned electric generation, and deliveries to power plants connected to the PG&E system. It excludes deliveries by other pipelines. (2) Includes both PG&E and third party storage (3) UEG curtailments include voluntary oil burns due to economic, operational, and inventory reduction reasons as well as involuntary curtailments due to supply shortages and capacity constraints. (4) For years 2011 through 2014, Total gas send-out excludes off-system transportation; off-system deliveries are subtracted from supply total. 55
65 NORTHERN CALIFORNIA ANNUAL GAS SUPPLY FORECAST MMCF/DAY AVERAGE DEMAND YEAR LINE LINE FIRM CAPACITY AVAILABLE 1 California Source Gas Out of State Gas 2 Baja Path (1) 1,016 1,016 1,016 1,016 1, Redwood Path (2) 2,023 2,023 2,023 2,023 2, a SW Gas Corp. from Paiute Pipeline Comp a 4 Supplemental (3) Total Supplies Available 3,123 3,123 3,123 3,123 3,123 5 GAS SUPPLY TAKEN 6 California Source Gas Out of State Gas (via existing facilities) 2,501 2,271 2,274 2,252 2, Supplemental Total Supply Taken 2,545 2,314 2,317 2,295 2, Net Underground Storage Withdrawal Total Throughput 2,545 2,314 2,317 2,295 2, REQUIREMENTS FORECAST BY END USE Core 12 Residential (4) Commercial NGV Total Core Noncore 16 Industrial SMUD Electric Generation (5) PG&E Electric Generation (6) NGV Wholesale California Exchange Gas Total Noncore 1,455 1,227 1,233 1,216 1, Off-System Deliveries (7) Shrinkage 24 Company use and Unaccounted for TOTAL END USE 2,545 2,314 2,317 2,295 2, TRANSPORTATION & EXCHANGE 26 CORE ALL END USES NONCORE COMMERCIAL/INDUSTRIAL ELECTRIC GENERATION SUBTOTAL/RETAIL 1,596 1,368 1,374 1,357 1, WHOLESALE/INTERNATIONAL TOTAL TRANSPORTATION AND EXCHANGE 1,605 1,378 1,383 1,366 1, System Curtailment NOTES: (1) PG&E s Baja Path receives gas from U. S. Southwest and Rocky Mountain producing regions via Kern River, Transwestern, El Paso and Southern Trails pipelines. (2) PG&E s Redwood Path receives gas from Canadian and Rocky Mountain producing regions via TransCanada Gas Transmission Northwest pipeline and Ruby pipeline. (3) May include interruptible supplies transported over existing facilities, displacement agreements, or modifications that expand existing facilities. (4) Includes Southwest Gas direct service to its northern California service area. (5) Forecast by SMUD. (6) Electric generation includes cogeneration, PG&E-owned electric generation, and deliveries to power plants connected to the PG&E system. It excludes deliveries by the Kern Mojave and other pipelines. (7) Deliveries to southern California. 56
66 NORTHERN CALIFORNIA ANNUAL GAS SUPPLY FORECAST MMCF/DAY AVERAGE DEMAND YEAR LINE LINE FIRM CAPACITY AVAILABLE 1 California Source Gas Out of State Gas 2 Baja Path (1) 1,016 1,016 1,016 1,016 1, Redwood Path (2) 2,023 2,023 2,023 2,023 2, a SW Gas Corp. from Paiute Pipeline Comp a 4 Supplemental (3) Total Supplies Available 3,123 3,123 3,123 3,123 3,123 5 GAS SUPPLY TAKEN 6 California Source Gas Out of State Gas (via existing facilities) 2,216 2,236 2,265 2,229 2, Supplemental Total Supply Taken 2,259 2,279 2,308 2,272 2, Net Underground Storage Withdrawal Total Throughput 2,259 2,279 2,308 2,272 2, REQUIREMENTS FORECAST BY END USE Core 12 Residential (4) Commercial NGV Total Core Noncore 16 Industrial SMUD Electric Generation (5) PG&E Electric Generation (6) NGV Wholesale California Exchange Gas Total Noncore 1,191 1,213 1,251 1,228 1, Off-System Deliveries (7) Shrinkage 24 Company use and Unaccounted for TOTAL END USE 2,259 2,279 2,308 2,272 2, TRANSPORTATION & EXCHANGE 26 CORE ALL END USES NONCORE COMMERCIAL/INDUSTRIAL ELECTRIC GENERATION SUBTOTAL/RETAIL 1,330 1,352 1,389 1,365 1, WHOLESALE/INTERNATIONAL TOTAL TRANSPORTATION AND EXCHANGE 1,340 1,362 1,398 1,374 1, System Curtailment NOTES: (1) PG&E s Baja Path receives gas from U. S. Southwest and Rocky Mountain producing regions via Kern River, Transwestern, El Paso and Southern Trails pipelines. (2) PG&E s Redwood Path receives gas from Canadian and Rocky Mountain producing regions via TransCanada Gas Transmission Northwest pipeline and Ruby pipeline. (3) May include interruptible supplies transported over existing facilities, displacement agreements, or modifications that expand existing facilities. (4) Includes Southwest Gas direct service to its northern California service area. (5) Forecast by SMUD. (6) Electric generation includes cogeneration, PG&E-owned electric generation, and deliveries to power plants connected to the PG&E system. It excludes deliveries by the Kern Mojave and other pipelines. (7) Deliveries to southern California. 57
67 NORTHERN CALIFORNIA ANNUAL GAS SUPPLY FORECAST MMCF/DAY HIGH DEMAND YEAR (1 in 10 Cold Year) LINE LINE FIRM CAPACITY AVAILABLE 1 California Source Gas Out of State Gas 2 Baja Path (1) 1,016 1,016 1,016 1,016 1, Redwood Path (2) 2,023 2,023 2,023 2,023 2, a SW Gas Corp. from Paiute Pipeline Comp a 4 Supplemental (3) Total Supplies Available 3,123 3,123 3,123 3,123 3,123 5 GAS SUPPLY TAKEN 6 California Source Gas Out of State Gas (via existing facilities) 2,560 2,336 2,342 2,322 2, Supplemental Total Supply Taken 2,603 2,379 2,386 2,366 2, Net Underground Storage Withdrawal Total Throughput 2,603 2,379 2,386 2,366 2, REQUIREMENTS FORECAST BY END USE Core 12 Residential (4) Commercial NGV Total Core Noncore 16 Industrial SMUD Electric Generation (5) PG&E Electric Generation (6) NGV Wholesale California Exchange Gas Total Noncore 1,486 1,265 1,273 1,256 1, Off-System Deliveries (7) Shrinkage 24 Company use and Unaccounted for TOTAL END USE 2,603 2,379 2,386 2,366 2, TRANSPORTATION & EXCHANGE 26 CORE ALL END USES NONCORE COMMERCIAL/INDUSTRIAL ELECTRIC GENERATION SUBTOTAL/RETAIL 1,631 1,411 1,418 1,401 1, WHOLESALE/INTERNATIONAL TOTAL TRANSPORTATION AND EXCHANGE 1,641 1,421 1,428 1,411 1, System Curtailment NOTES: (1) PG&E s Baja Path receives gas from U. S. Southwest and Rocky Mountain producing regions via Kern River, Transwestern, El Paso and Southern Trails pipelines. (2) PG&E s Redwood Path receives gas from Canadian and Rocky Mountain producing regions via TransCanada Gas Transmission Northwest pipeline and Ruby pipeline. (3) May include interruptible supplies transported over existing facilities, displacement agreements, or modifications that expand existing facilities. (4) Includes Southwest Gas direct service to its northern California service area. (5) Forecast by SMUD. (6) Electric generation includes cogeneration, PG&E-owned electric generation, and deliveries to power plants connected to the PG&E system. It excludes deliveries by the Kern Mojave and other pipelines. (7) Deliveries to southern California
68 NORTHERN CALIFORNIA ANNUAL GAS SUPPLY FORECAST MMCF/DAY HIGH DEMAND YEAR (1 in 10 Cold Year) LINE LINE FIRM CAPACITY AVAILABLE 1 California Source Gas Out of State Gas 2 Baja Path (1) 1,016 1,016 1,016 1,016 1, Redwood Path (2) 2,023 2,023 2,023 2,023 2, a SW Gas Corp. from Paiute Pipeline Comp a 4 Supplemental (3) Total Supplies Available 3,123 3,123 3,123 3,123 3,123 5 GAS SUPPLY TAKEN 6 California Source Gas Out of State Gas (via existing facilities) 2,292 2,316 2,455 2,420 2, Supplemental Total Supply Taken 2,336 2,360 2,498 2,463 2, Net Underground Storage Withdrawal Total Throughput 2,336 2,360 2,498 2,463 2, REQUIREMENTS FORECAST BY END USE Core 12 Residential (4) Commercial NGV Total Core Noncore 16 Industrial SMUD Electric Generation (5) PG&E Electric Generation (6) NGV Wholesale California Exchange Gas Total Noncore 1,231 1,256 1,398 1,367 1, Off-System Deliveries (7) Shrinkage 24 Company use and Unaccounted for TOTAL END USE 2,336 2,360 2,498 2,463 2, TRANSPORTATION & EXCHANGE 26 CORE ALL END USES NONCORE COMMERCIAL/INDUSTRIAL ELECTRIC GENERATION SUBTOTAL/RETAIL 1,376 1,401 1,543 1,512 1, WHOLESALE/INTERNATIONAL TOTAL TRANSPORTATION AND EXCHANGE 1,386 1,411 1,553 1,522 1, System Curtailment NOTES: (1) PG&E s Baja Path receives gas from U. S. Southwest and Rocky Mountain producing regions via Kern River, Transwestern, El Paso and Southern Trails pipelines. (2) PG&E s Redwood Path receives gas from Canadian and Rocky Mountain producing regions via TransCanada Gas Transmission Northwest pipeline and Ruby pipeline. (3) May include interruptible supplies transported over existing facilities, displacement agreements, or modifications that expand existing facilities. (4) Includes Southwest Gas direct service to its northern California service area. (5) Forecast by SMUD. (6) Electric generation includes cogeneration, PG&E-owned electric generation, and deliveries to power plants connected to the PG&E system. It excludes deliveries by the Kern Mojave and other pipelines. (7) Deliveries to southern California. 59
69 SOUTHERN CALIFORNIA GAS COMPANY C A L I F O R N I A G A S R E P O R T SOUTHERN CALIFORNIA GAS COMPANY 60
70 SOUTHERN CALIFORNIA GAS COMPANY INTRODUCTION Southern California Gas Company (SoCalGas) is the principal distributor of natural gas in Southern California, providing retail and wholesale customers with transportation, exchange and storage services and also procurement services to most retail core customers. SoCalGas is a gas-only utility and, in addition to serving the residential, commercial, and industrial markets, provides gas for enhanced oil recovery (EOR) and electric generation (EG) customers in Southern California. San Diego Gas & Electric Company (SDG&E), Southwest Gas Corporation, the City of Long Beach Municipal Oil and Gas Department, and the City of Vernon are SoCalGas four wholesale utility customers. SoCalGas also provides gas transportation services across its service territory to a border crossing point at the California-Mexico border at Mexicali to ECOGAS Mexico S. de R.L. de C.V which is a wholesale international customer located in Mexico. This report covers a 20-year demand and forecast period, from 2016 through 2035; only the consecutive years 2016 through 2022 and the point years 2025, 2030, and 2035 are shown in the tabular data in the next sections. These single point forecasts are subject to uncertainty, but represent best estimates for the future, based upon the most current information available. The Southern California section of the 2016 California Gas Report (CGR) begins with a discussion of the economic conditions and regulatory issues facing the utilities, followed by a discussion of the factors affecting natural gas demand in various market sectors. The outlook on natural gas supply availability, which continues to be favorable, is also presented. The natural gas price forecast methodology used to develop the gas demand forecast is discussed followed by a review of the peak day demand forecast. Summary tables and figures underlying the forecast are also provided. 61
71 SOUTHERN CALIFORNIA GAS COMPANY THE SOUTHERN CALIFORNIA ENVIRONMENT ECONOMICS AND DEMOGRAPHICS The gas demand projections are in large part determined by the long-term economic outlook for the SoCalGas service territory. As of mid-2016, Southern California s economy appears to be heading into slower growth after largely recovering from the previous multi-year slump. Overall area jobs are expected to average moderate 1.0% annual growth from 2016 through During the same period, local manufacturing and mining industrial employment should grow a more modest 0.7% per year, with commercial jobs growing just over 1% annually. Construction jobs should continue their comeback, averaging over 4% annual growth from 2016 through Other sectors with expected strong growth in the same period include professional and business services (jobs growing 2.3% per year) and health and social services (1.7% per year). Millions 12 SoCalGas 12-County Area Employment Commercial Industrial Longer term, SoCalGas service-area employment is expected to increase only modestly as the area population s average age gradually increases--part of a national demographic trend of aging and retiring baby boomers. From 2016 through 2035, total area job growth should average 0.8% per year. Area industrial jobs are forecasted to shrink an average of 0.1% per year 20162
72 SOUTHERN CALIFORNIA GAS COMPANY through 2035; we expect the industrial share of total employment to fall from 8.2% in 2016 to 6.9% by Commercial jobs are expected to grow an average of 0.9% annually from 2016 through % 0.6% 0.5% 0.4% 0.3% 0.2% 0.1% 0.0% SoCalGas Annual Active Meters and Growth Rates Average annual growth (%) Active meters (millions) Since 2011, SoCalGas service area housing market has gradually been recovering from its prior drastic downturn. Home building and meter hookups continue to increase modestly, with SoCalGas annual active meters growing by about 29,000 (0.52%) in SoCalGas expects active meters to maintain moderate growth at about the same pace, growing an average of 0.51% per year from 2016 through
73 Bcf/Year SOUTHERN CALIFORNIA GAS COMPANY GAS DEMAND (REQUIREMENTS) OVERVIEW SoCalGas projects total gas demand to decline at an annual rate of 0.6% from 2016 to The decline in throughput demand is due to modest economic growth, CPUC-mandated energy efficiency (EE) standards and programs, renewable electricity goals, the decline in commercial and industrial demand, and conservation savings linked to Advanced Metering Infrastructure (AMI). By comparison, the 2014 CGR projected an annual decline in demand of 0.33% over the forecast horizon. The difference between the two forecasts is caused primarily by more modest meter and employment growth forecasts than those embodied in the 2014 California Gas Report. The following chart shows the composition of SoCalGas throughput for the recorded year 2015 (with weather-sensitive market segments adjusted to average year heating degree day assumptions) and forecasts for the 2016 to 2035 forecast period. Composition of SoCalGas Requirements Average Temperature and Normal Hydro Year ( ) Residential Core Non Residential Noncore Non EG EG Wholesale + Ecogas Notes: (1) Core non-residential includes core commercial, core industrial, gas air-conditioning, gas engine, natural gas vehicles. (2) Non-core non-eg includes non-core commercial, non-core industrial, industrial refinery, and EOR-steaming (3) Retail electric generation includes industrial and commercial cogeneration, refinery-related cogeneration, EORrelated cogeneration, and non-cogeneration electric generation. (4) Wholesale includes sales to the City of Long Beach, City of Vernon, SDG&E, Southwest Gas and Ecogas in Mexico
74 SOUTHERN CALIFORNIA GAS COMPANY From 2016 to 2035, residential demand is expected to decline from 239 Bcf to 218 Bcf. The decline is due to declining use per meter offsetting new meter growth. The core, nonresidential markets are expected to decline from 113 Bcf in 2016 to 105 Bcf by The change reflects an annual rate of decline of 0.5% over the forecast period. The noncore, non-eg markets are expected to decline from 170 Bcf in 2016 to 153 Bcf by The annual rate of decline is approximately 0.5% due to very aggressive energy efficiency goals and associated programs. On the other hand, utility gas demand for EOR steaming operations, which had declined since the FERC-regulated Kern/Mojave interstate pipeline began offering direct service to California customers in 1992, has shown some growth in recent years. EOR steaming gas demand is expected to remain at about its 2015 level through 2035 as gains are offset by the depletion of older oil fields. Total electric generation load, including cogeneration and non-cogeneration EG for a normal hydro year, is expected to decline from 288 Bcf in 2016 to 232 Bcf in 2035, a decrease of 1.1% per year. Market Sensitivity Temperature Core demand forecasts are prepared for two design temperature conditions average and cold to quantify changes in space heating demand due to weather. Temperature variations can cause significant changes in winter gas demand due to space heating in the residential, core commercial and core industrial markets. The largest demand variations due to temperature are likely to occur in the month of December. Heating Degree Day (HDD) differences between the two conditions are developed from a six-zone temperature monitoring procedure within SoCalGas service territory. One HDD is defined when the average temperature for the day drops 1 degree below 65 Fahrenheit. The cold design temperature conditions are based on a statistical likelihood of occurrence of 1-in-35 on an annual basis. In our 2016 CGR, average year and cold year HDD totals are 1,340 and 1,659 respectively, on a calendar year basis for SoCalGas. For SDG&E, these values are 1,288 and 1,656 HDDs, respectively. The average year values were computed as the simple average of annual HDD s for the years 1996 through Hydro Condition The EG forecasts are prepared for two hydro conditions average and dry. The dry hydro case refers to gas demand in a 1-in-10 dry hydro year. 65
75 SOUTHERN CALIFORNIA GAS COMPANY MARKET SECTORS Residential Residential demand adjusted for temperature totaled 239 Bcf in 2015 which is 3 Bcf lower than 2014 weather adjusted deliveries. The residential load is expected to decline on average by 0.5% per year from 239 Bcf in 2015 to 218 Bcf in The decrease in gas demand results from a combination of continued decline in residential use per meter, increases in marginal gas rates, the impact of savings from SoCalGas Advanced Meter Infrastructure (AMI) project deployment which began in 2013 and CPUC authorized energy efficiency program savings in this market. The total residential customer count for SoCalGas consists of five residential segment types: single family, small multi-family, large multi-family, master meter and sub-metered customers. The active meters for all residential customer classes were 5.46 million at the end of This amount reflects a 29,759 active meter increase between 2014 at year end and 2015 at year end. The overall observed residential meter growth was 0.55%. Eight years before, the observed meter growth had been 53,326 new meters between 2006 and 2007, which amounts to an annual growth rate of 1.03%. The slowdown in active meter growth reflects more modest new home construction activity since the boom ended in The 2016 CGR shows that in 2015, single family and overall multi-family temperatureadjusted average annual use per meter was 474 therms and 312 therms, respectively. Over the forecast period, the demand per meter is expected to decline at an average annual rate of 0.7%. The decline in use per meter for residential customers is explained by conservation, improved building and appliance standards, energy efficiency programs, and demand reductions anticipated as the result of the deployment of AMI in the Southern California area. With AMI, customers will have more timely information available about their daily and hourly gas use and thereby are expected to use gas more efficiently. Mass deployment of SoCalGas AMI modules began in 2013 and is expected to be completed by The deployment of SoCalGas AMI will not only provide operating efficiencies but will also generate long term conservation benefits. The projected residential natural gas demand will be influenced primarily by residential meter growth, moderated by the forecasted decline in use per customer. The residential load trend over the forecast period is illustrated in the graph below
76 Bcf SOUTHERN CALIFORNIA GAS COMPANY 300 Composition of SoCalGas' Residential Demand Forecast ( ) Single Family MF <= 4 Units MF > 4 Units Master Meter Sub-Metered Commercial The commercial market consists of 14 business types identified by the customers North American Industry Classification System (NAICS) codes. The restaurant business dominates this market with 27% of the usage in The health industry is next largest with a share of 13% of the overall market based on 2015 natural gas consumption. 67
77 SOUTHERN CALIFORNIA GAS COMPANY Commercial Gas Demand by Business Type Composition of Industry (2015) Agriculture 6% Construction 1% TCU 4% Miscellaneous 7% Office 7% Government 5% Lodging 7% Restaurant 27% Health 13% College 4% School 3% Warehouse 2% Laundry 7% Retail 6% The core commercial market demand is expected to decline over the forecast period. On a temperature-adjusted basis, the core commercial market demand in 2015 totaled 81 Bcf. By the year 2035, the load is anticipated to be approximately 65 Bcf. The average annual rate of decline from 2016 to 2035 is forecasted at 1% percent. The decline in gas usage is mainly the result of the impact of CPUC-authorized energy efficiency programs in this market. Noncore commercial demand in 2015 was 16.4 Bcf. From 2016 through 2035, demand in this market is expected to decline slightly at approximately 0.55% annually to 14.7 Bcf. A key factor of the decreasing trend is the CPUC-authorized energy efficiency programs
78 SOUTHERN CALIFORNIA GAS COMPANY 120 Annual Commercial Demand Forecast Bcf/Year Core Commercial Noncore Commercial Industrial Non-Refinery Industrial Demand In 2015, temperature-adjusted core industrial demand was 21.6 Bcf, which was lower than 2014 deliveries by 0.4 Bcf. Core industrial market demand is projected to decrease by 1.7% per year from 21.6 Bcf in 2015 to 15.3 Bcf in This decrease in gas demand results from a combination of factors: a minor decrease in employment growth, minor increases in marginal gas rates, the municipalization of the City of Vernon, and CPUC-authorized energy efficiency programs. The 2015 industrial gas demand served by SoCalGas is shown below. Food processing, with 34% of the total share, dominates this market. 69
79 Bcf SOUTHERN CALIFORNIA GAS COMPANY Non-Refinery Industrial Gas Demand by Business Types Composition of Industrial Activity (2015) Transport 4% Misc 8% Mining 3% Fab_Metal 10% Food 34% Prim_Metal 10% Stone 6% Petroleum 7% Chemical 7% Textile 5% Wood_Paper 6% Annual Industrial Demand Forecast Bcf/Year Core Industrial Noncore Industrial (non-refinery) Noncore Industrial Refinery 20170
80 SOUTHERN CALIFORNIA GAS COMPANY Gas demand for the retail noncore industrial (non-refinery) market is expected to decline at a rate of 0.8% from 49.9 Bcf in 2015 to 42.2 Bcf by The reduced demand is primarily due to the departure of customers within the City of Vernon to wholesale service by the City of Vernon, the CPUC-authorized energy efficiency programs designed to reduce gas demand and the expected implementation of regulations to aggressively reduce CO2 emissions by effectively increasing the gas commodity price for industrial customers. Refinery-Industrial Demand Refinery-industrial demand is comprised of gas consumption by petroleum refining customers, hydrogen producers and refined petroleum product transporters. Gas demand in the refinery industrial market sector is forecasted to decline about 0.34% per year over the forecast period, from 84.0 Bcf in 2015 to 78.5 Bcf in The decrease over the forecast period is primarily due to the estimated savings from CPUC-authorized energy efficiency programs. Electric Generation SoCalGas Service Area: Total Electric Generation Gas Demand Forecast (Bcf/Year) Base-Hydro Case 1-in-10 Dry Hydro Case The electric generation sector includes all commercial/industrial cogeneration, EORrelated cogeneration, and non-cogeneration electric generation. The forecast of electric generation (EG) load is subject to a high degree of uncertainty. Forecast uncertainty is in large part due to load sensitivity to weather conditions, the expiration of existing contracts with cogeneration facilities, and the construction and retirement of power plants and transmission lines. Additionally, many once-through-cooling (OTC) plants in California are scheduled to either retire or repower during the forecasted period. These are mostly gas-fired thermal plants, located near the coast, that use ocean water for cooling. 71
81 SOUTHERN CALIFORNIA GAS COMPANY The forecast uses a power market simulation for the period of 2016 to The simulation reflects the anticipated dispatch of all EG resources in the SoCalGas service territory using a base electricity demand scenario under both average and low hydroelectric availability market conditions. The base case assumes that the state will reach its 50% Renewable Portfolio Standards by 2030, as mandated in SB 350. The base case also assumes the IOUs will meet D , or the energy storage procurement framework and design program. However, there is substantial uncertainty as to how this will be implemented, and its impact on gas throughput is unknown. Due to the large uncertainty in the timing and type of generating plants that could be added after 2030, the EG forecast is held constant at 2030 levels through For electricity demand within California, SoCalGas relies on the California Energy Commission s (CEC) California Energy Demand Revised/Final Forecast, dated January SoCalGas selected the Mid Energy Demand scenario with the Mid Additional Achievable Energy Efficiency (AAEE) scenario. For the first time in CEC forecasts, the Mid AAEE scenario shows a declining, long-term, state-wide energy demand; Southern California energy demand declines at a faster rate than Northern California. However, CEC s current electricity demand forecast does not include the doubling of energy efficiency programs, as mandated in SB 350, due to timing constraints. CEC is currently analyzing how it would implement these additional energy programs and their impacts on electricity demand. Industrial/Commercial/Cogeneration <20MW The commercial/industrial cogeneration market segment is generally comprised of customers with generating capacity of less than 20 megawatts (MW) of electric power. Most of the cogeneration units in this segment are installed primarily to generate electricity for internal customer consumption rather than for the sale of power to electric utilities. Customers in this market segment install their own electric generation equipment for both economic reasons (gas powered systems produce electricity cheaper than purchasing it from a local electric utility) and reliability reasons (lower purchased power prices are realized only for interruptible service). In 2015, gas demand in the small cogeneration market was 23.7 Bcf. Demand is expected to be about 25 Bcf per year during the period from 2016 to 2020 due to relatively low gas to electric fuel prices. After 2020, cogeneration demand is projected to decline modestly to 24.4 Bcf by the year This represents an average decline of 0.32% per year. Overall, from 2016 through 2035, small cogeneration load is anticipated to decline at an annual average rate of 0.22%. A key factor in this decline is the expected implementation of regulations to reduce CO2 emissions which will increase the gas commodity price for many small cogeneration customers. Industrial/Commercial Cogeneration >20 MW For commercial/industrial cogeneration customers greater than 20 MW, gas demand is forecasted to decrease from 49 Bcf in 2016 to 44 Bcf in There are some uncertainties in this sector with respect to contract renewals. This forecast assumes that most of the existing facilities will continue to be cost effective and thus will continue to operate at historical levels. However, a facility has signed a dispatchable contract recently with its local electric utilities; there may be more dispatchable contracts to follow. Additional changes to this assumption in the future could have a significant impact on the forecast
82 SOUTHERN CALIFORNIA GAS COMPANY Refinery-Related Cogeneration Refinery cogeneration units are installed primarily to generate electricity for internal use. This market is forecasted to decline modestly at about 0.16% per year, decreasing from 22.5 Bcf in 2015 to 21.8 Bcf in The slight decline is mainly due to higher gas costs stemming from California s GHG carbon fees. Enhanced Oil Recovery-Related Cogeneration In 2015, recorded gas deliveries to the EOR-related cogeneration market were 3.8 Bcf, a 37% decrease from This decrease in load was due to changes in operations for some of the existing EOR-related cogeneration customers. EOR-related cogeneration demand is forecasted to remain at 3.8 Bcf throughout the forecast period. Non-Cogeneration Electric Generation For the base case (average hydro condition), gas demand is forecasted to decrease from 188 Bcf in 2016 to 138 Bcf in The main factors for the decline are an increasing RPS target level and decreasing electricity demand. SB 350 raised the RPS target level from 33% to 50% by As mentioned earlier, CEC s latest electricity demand forecast (Mid Base, Mid AAEE scenario) shows declining electricity demand. To account for dry climate conditions, a 1-in-10 dry hydro sensitivity gas demand forecast was created. This dry hydro forecast increases gas demand on average by 26 Bcf. SoCalGas forecast includes the addition of approximately 2,015 MW of new local, gasfired combined cycle and peaking generating resources in its service area by However, the forecast also assumes 7,413 MW of local, gas-fired plants are and/or will be retired as a result of the state s once-through-cooling regulation and economics. For this forecast, SoCalGas included energy storage resources in the model as required by D Installed storage capacity data was based on the mid scenario from the CPUC s 2014 Long Term Procurement Plan assumptions. In the model, a state-wide installed capacity of 141 MW was added starting in Storage capacity increased to 1,125 MW by
83 SOUTHERN CALIFORNIA GAS COMPANY Enhanced Oil Recovery Steam Recorded deliveries to the EOR steaming market in 2015 were 17.0 Bcf, an increase of approximately 4% from SoCalGas EOR steaming demand is expected to stay at 17.0 Bcf from 2016 through the end of the forecast period. The EOR-related cogeneration demand is discussed in the Electric Generation section. Crude oil futures prices appear to be flat for the next 8 years which is expected to result in California EOR operations staying steady going forward. Wholesale and International SoCalGas provides wholesale transportation service to SDG&E, the City of Long Beach Gas and Oil Department (Long Beach), Southwest Gas Corporation (SWG), and the City of Vernon (Vernon) and Ecogas Mexico, L. de R.L. de C.V. The wholesale load excluding SDG&E is expected to increase from 25.4 Bcf in 2016 to 27.8 Bcf in San Diego Gas & Electric Under average year temperature and normal hydro conditions, SDG&E gas demand is expected to decrease at an average rate of 0.4% per year from 131 Bcf in 2015 to 120 Bcf in Additional information regarding SDG&E s gas demand is provided in the SDG&E section of this report. City of Long Beach The wholesale load forecast is based on forecast information provided by the City of Long Beach Municipal Gas & Oil Department. Long Beach s gas use is expected to remain fairly constant, increasing from 8.0 Bcf in 2016 to 8.4 Bcf by Long Beach's locally supplied deliveries are estimated to stay steady at 1.0 Bcf from 2016 to SoCalGas transportation to Long Beach is expected to increase gradually from 7.0 Bcf in 2016 to 7.4 Bcf by Refer to City of Long Beach Municipal Gas & Oil Department for more information. Southwest Gas SoCalGas used the forecast prepared by Southwest Gas for this report. In 2016, SoCalGas expects to serve approximately 6.2 Bcf directly, with another 2.9 Bcf being served by PG&E under exchange arrangements with SoCalGas. The total load is expected to grow from 9.1 Bcf in 2016 to approximately 10.6 Bcf in Refer to Southwest Gas Corporation for more information
84 SOUTHERN CALIFORNIA GAS COMPANY City of Vernon The City of Vernon initiated municipal gas service to its electric power plant within the city s jurisdiction in June, Since 2005, there has also been a gradual increase of commercial/industrial gas demand as customers within the city boundaries have left the SoCalGas retail system and interconnected with Vernon s municipal gas system. The forecasted throughput starts at 3.2 Bcf in 2016 and increases to 4.0 Bcf by 2021, after which the demand remains relatively flat through The forecasted throughput includes Core and Non-Core customers but excludes Malburg Power Plant throughput. Vernon s commercial and industrial load is based on recorded historical usage for commercial and industrial customers already served by Vernon plus the customers that are expected to request retail service from Vernon. Ecogas Mexico, S. de R.L. de C.V. (Ecogas) SoCalGas used the forecast prepared by Ecogas for this report. Ecogas use is expected to gradually increase from approximately 9.0 Bcf/year in 2016 to 9.2 Bcf/year by Refer to Ecogas or IENova, Ecogas s parent company, for more information. Natural Gas Vehicles (NGV) The NGV market is expected to continue to grow due to government (federal, state and local) incentives and regulations related to the purchase and operation of alternate fuel vehicles, growing numbers of natural gas engines and vehicles, and the cost differential between petroleum (gasoline and diesel) and natural gas. At the end of 2015, there were 310 compressed natural gas (CNG) fueling stations delivering 13.2 Bcf of natural gas during the year. The NGV market is expected to grow 3.3% per year, on average, over the forecast horizon. ENERGY EFFICIENCY PROGRAMS SoCalGas engages in a number of energy efficiency and conservation programs designed to help customers identify and implement ways to benefit environmentally and financially from energy efficiency investments. Programs administered by SoCalGas include services that help customers evaluate their energy efficiency options and adopt recommended solutions, as well as simple equipment-retrofit improvements, such as rebates for new hot water heaters. The forecast of cumulative natural gas savings due to SoCalGas energy efficiency programs is provided in the figure below. The net load impact includes all energy efficiency programs that SoCalGas has forecasted to occur through year The goals for 2016 and beyond are based on the levels authorized by the CPUC in D
85 SOUTHERN CALIFORNIA GAS COMPANY Conservation and energy efficiency savings are measured at the meter and include any interactive effects that may result from efficiency improvements of gas end uses; for instance, increased natural gas heating load that could result from efficiency improvements in lighting and appliances. These figures also include any reductions in natural gas demand for electric generation that may occur due to lower electric demand. SB350, which was passed in fall 2015, requires the CEC, in coordination with the CPUC and the local public utilities, to set EE targets that double the CEC s AAEE mid-case forecast, subject to what is cost-effective and feasible. 3 This legislation will undoubtedly impact levels of EE savings. There are, however, a number of uncertainties that led the IOUs to treat SB350 impacts qualitatively and defer incorporating estimates of this savings until the next California Gas Report. These are: The deadline for the CEC and CPUC to establish SB350 targets is November 2017, 18 months from the time of this writing. A lot of work will need to be done to set these targets. There are already state requirements for IOUs to pursue all cost-effective EE. Given that the doubling goal is subject to what is cost-effective and achievable, a significant increase in savings while still maintaining a cost-effective portfolio would require changes to current cost-effectiveness practices. IOU EE programs are still operating under avoided costs that were last updated in 2011 and An update to avoided costs is likely in the next year or two and is likely to decrease what is currently determined to be cost-effective, as gas prices have dropped and/or stayed lower than forecast in 2011 and 2012 and higher levels of renewables have pushed down energy and capacity values. In the CPUC s EE proceeding, an effort is underway to update EE goals to reflect SB350 and AB802 impacts. This is not yet available and will be an important source for estimating SB350 EE impacts. It is expected that these updated goals will be available for incorporation into the next California Gas Report. For these reasons, SoCalGas recommends using current levels of EE included in the 2015 IEPR in the forecast until the issues identified above are resolved. However, for context, the IOUs offer the following relative maximum impact of the bill on EE savings levels. Assuming sufficient cost effective measures can be identified, a doubling of cumulative EE savings by 2030 would result in approximately 600 MMTherms beyond current levels for all IOUs. However, the reader is cautioned that this is based on a literal reading of the bill language and the CEC forecast identified in the bill, without consideration of the challenges mentioned above. 3 The actual bill text states: On or before November 1, 2017, the commission, in collaboration with the Public Utilities Commission and local publicly owned electric utilities, in a public process that allows input from other stakeholders, shall establish annual targets for statewide energy efficiency savings and demand reduction that will achieve a cumulative doubling of statewide energy efficiency savings in electricity and natural gas final end uses of retail customers by January 1, The commission shall base the targets on a doubling of the midcase estimate of additional achievable energy efficiency savings, as contained in the California Energy Demand Updated Forecast, , adopted by the commission, extended to 2030 using an average annual growth rate, and the targets adopted by local publicly owned electric utilities pursuant to Section 9505 of the Public Utilities Code, extended to 2030 using an average annual growth rate, to the extent doing so is cost effective, feasible, and will not adversely impact public health and safety
86 SOUTHERN CALIFORNIA GAS COMPANY Annual Energy Efficiency Cumulative Savings Goal (Bcf) Residential Noncore Commercial and Industrial EE Savings Core Commercial and Industrial EE savings Noncore Refinery EE savings EE Savings Relative to Total Load (Bcf/year) Load: Res + Core+Noncore C+I Cumulative Impact of EE Savings on Load Reduction 77
87 SOUTHERN CALIFORNIA GAS COMPANY Savings reported are for measures installed under SoCalGas energy efficiency programs. Credit is only taken for measures that are installed as a result of SoCalGas energy efficiency programs, and only for the estimated measure lives of the measures installed. Measures with useful lives less than the forecast planning period fall out of the forecast when their expected life is reached. Naturally occurring conservation that is not attributable to SoCalGas energy efficiency activities is not included in the energy efficiency forecast
88 SOUTHERN CALIFORNIA GAS COMPANY GAS SUPPLY, CAPACITY, AND STORAGE GAS SUPPLY SOURCES Southern California Gas Company and San Diego Gas & Electric Company receive gas supplies from several sedimentary basins in the western United States and Canada including supply basins located in New Mexico (San Juan Basin), West Texas (Permian Basin), Rocky Mountains, Western Canada, and local California supplies. Recorded 2011 through 2015 receipts from gas supply sources can be found in the Sources and Disposition tables in the Executive Summary. CALIFORNIA GAS Gas supply available to SoCalGas from California sources averaged 122 MMcf/day in SOUTHWESTERN U.S. GAS Traditional Southwestern U.S. sources of natural gas will continue to supply most of Southern California s natural gas demand. This gas is primarily delivered via the El Paso Natural Gas and Transwestern pipelines. The San Juan Basin s gas supplies peaked in 1999 and have been declining at an annual rate of roughly 3%. In recent years, this rate of decline has accelerated. The Permian Basin s share of supply into Southern California has increased in recent years, although increasing demand in Mexico for natural gas supplies may significantly reduce the volume of Permian Basin supply available to Southern California in the future. SoCalGas and SDG&E have discussed this situation in more detail and have proposed a solution in A The proposal requested to construct a North-South Pipeline from SoCalGas Adelanto compressor station near Victorville down to the Moreno pressure limiting station in Moreno Valley. ROCKY MOUNTAIN GAS Rocky Mountain supply supplements traditional Southwestern U.S. gas sources for Southern California. This gas is delivered to Southern California primarily on the Kern River Gas Transmission Company s pipeline, although there is also access to Rockies gas through pipelines interconnected to the San Juan Basin. Many pipelines connect to Rocky Mountain region, which allows these supplies to be redirected from lower to higher value markets as conditions change. 79
89 SOUTHERN CALIFORNIA GAS COMPANY CANADIAN GAS Canadian gas only provides a small share of Southern California gas supplies due to the high cost of transport. BIOGAS Biogas is a mixture of methane and carbon dioxide produced by the bacterial degradation of organic matter. Biogas is a byproduct produced from processes including, but not limited to, anaerobic digestion, anaerobic decomposition, and thermo-chemical decomposition under sub-stoichiometric conditions. These processes are applied to biodegradable biomass materials, such as livestock manure, wastewater sewage, food waste, and green waste. When biogas is conditioned/upgraded to pipeline quality specifications, commonly referred to as biomethane, it can be interconnected to a gas utility s pipeline and nominated for a specific end-use customer. 2 Biomethane may also be consumed onsite for a variety of uses, including electrical power generation from internal combustion engines, fuel cells, and turbines, or as a fuel source for natural gas vehicles. Currently, there are instances where biogas is being vented naturally or flared to the atmosphere. Venting and flaring wastes this valuable renewable resource and fails to support the state in achieving its emission reduction targets set forth by Assembly Bill ( AB ) 32 and the Renewables Portfolio Standard ( RPS ) goals, as processed renewable natural gas injected into a common carrier natural gas pipeline system can ultimately count toward satisfying AB 32 and RPS goals. In February 2013, the CPUC issued an Order Instituting Rulemaking ( Rulemaking ) to adopt standards and requirements, open access rules, and related enforcement provisions, pursuant to Assembly Bill 1900 (Gatto), which tasked state agencies to address any constituents of concern specifically found in biomethane, and to identify impediments to interconnecting to utility pipelines. 3 CARB released their report on May 15, 2013 which identifies 17 constituents of concern found in biomethane and provides direction on monitoring, testing, reporting and recordkeeping procedures for utilities and biomethane suppliers. The first phase of the Rulemaking - the identification of constituents of concern resulted in the utilities filing revised tariff rules governing gas quality specifications in February The second phase of the Rulemaking began in April 2014 to determine who should bear the costs of complying with the CPUC-adopted testing, monitoring, reporting, and recordkeeping requirements. (D.) on Phase II of the proceeding was issued in June 2015 adopting a policy and a five-year monetary incentive program to encourage biomethane producers to design, construct, and successfully operate biomethane projects that interconnect with the gas utilities pipeline systems so as to inject biomethane that can be safely used at an end user s home or business. The monetary incentive program is a state-wide program that is capped at $40 million and provides a biomethane producer 50% of the project s interconnection costs, up to $1.5 million, to 2 SoCalGas Tariff Rule 30 ( ) must be met in order to qualify for pipeline injection into SoCalGas gas pipeline system. 3 February 13, 2013 Order Instituting Rulemaking to Adopt Biomethane Standards and Requirements, Pipeline Open Access Rules, and Related Enforcement Provisions
90 SOUTHERN CALIFORNIA GAS COMPANY help offset interconnection costs associated with the successful interconnection of the biomethane facility to the utility pipeline system. In January 2014 the Commission approved SoCalGas application to offer a Biogas Conditioning/Upgrading Services Tariff in response to customer inquiries and requests. This service is designed to meet the current and future needs of biogas producers seeking to upgrade their biogas for beneficial uses such as pipeline injection, onsite power generation, or compressed natural gas vehicle refueling stations. There is growing interest regarding biogas production potential in SoCalGas service territory from the following activities: nonhazardous-waste landfills, landfill diversion of organic waste material, wastewater treatment, concentrated animal feeding operations, and food/green waste processing. INTERSTATE PIPELINE CAPACITY Interstate pipeline delivery capability into SoCalGas and SDG&E on any given day theoretically is approximately 6,725 MMcf/day based on the Federal Energy Regulatory Commission (FERC) Certificate Capacity or SoCalGas estimated physical capacity of upstream pipelines. These pipeline systems provide access to several large supply basins, located in: New Mexico (San Juan Basin), West Texas (Permian Basin), Rocky Mountains, Western Canada, and LNG. Upstream Capacity to Southern California Pipeline Upstream Capacity (MMcf/d) El Paso at Blythe 1,210 El Paso at Topock 540 Transwestern at Needles 1,150 PG&E at Kern River 650 (1) Southern Trails at Needles 120 Kern/Mojave at Wheeler Ridge 885 Kern at Kramer Junction 750 Occidental at Wheeler Ridge 150 California Production 310 TGN at Otay Mesa 400 North Baja at Blythe 600 Total Potential Supplies 6,765 (1) Estimate of physical capacity. 81
91 SOUTHERN CALIFORNIA GAS COMPANY FIRM RECEIPT CAPACITY SoCalGas/SDG&E currently has firm receipt capacity at the following locations for its customers to access supply from interstate pipelines. Transmission Zone SoCalGas/SDG&E Current Firm Receipt Capacity Total Transmission Zone Firm Access (MMcf/d) Specific Point of Access (1) (Limitations) (2) (MMcf/d) Southern 1,210 EPN Ehrenberg (1,010) TGN Otay Mesa (400) NBP Blythe (600) Northern 1,590 EPN Topock (540) TW Topock (300) TW North Needles (800) QST North Needles (120) KR Kramer Junction (550) Wheeler Ridge 765 KR/MP Wheeler Ridge (765) PG&E Kern River Station (520) OEHI Gosford (150) Line California Supply Coastal 150 California Supply Other N/A California Supply Total 3,875 (1) Pipelines EPN: El Paso Natural Gas Pipeline TGN: Transportadora de Gas Natural de Baja California NBP: North Baja Pipeline TW: Transwestern Pipeline MP: Mojave Pipeline QST: Questar Southern Trails Pipeline KR: Kern River Pipeline PG&E: Pacific Gas and Electric OEHI: Occidental of Elk Hills (2) Transmission Zone Contract Limitations: Southern Zone: In total EPN Ehrenberg and NBP Blythe cannot exceed 1,010 MMcfd. In total EPN Ehrenberg, NBP Blythe and TGN Otay Mesa cannot exceed 1,210 MMcfd. Northern Zone: In total TW at Topock and EPN at Topock cannot exceed 540 MMcfd. In total TW at North Needles and QST at North Needles cannot exceed 800 MMcfd. In total TW at North Needles, TW Topock, EPN Topock, QST North Needles and KR Kramer Junction cannot exceed 1,590 MMcfd. Wheeler Ridge Zone: In total PG&E at Kern River Station and OEHI at Gosford cannot exceed 520 MMcfd. In total PG&E Kern River Station, OEHI Gosford, and KR/MP Wheeler Ridge cannot exceed 765 MMcfd
92 SOUTHERN CALIFORNIA GAS COMPANY STORAGE Underground storage of natural gas plays a vital role in balancing the region s energy supply and demand. SoCalGas owns and operates four underground storage facilities located at Aliso Canyon, Honor Rancho, Goleta and Playa Del Rey. These facilities play a vital role in balancing the region s energy supply and demand. SoCalGas storage fields attain a combined theoretical storage working inventory capacity of Bcf by November 1 of each year. Of that, 83 Bcf is allocated to our Core residential, small industrial and commercial customers. About 4.2 Bcf of space is used for system balancing. 4 The remaining capacity is available to other customers. However, working inventory at Aliso Canyon (currently approximately 15 Bcf) cannot be used for anything other than reliability-related withdrawals until DOGGR authorizes SoCalGas to begin injecting gas into Aliso again. ALISO CANYON On October 23, 2015, a natural gas leak in well SS25 was detected at the Aliso Canyon natural gas storage facility owned by SoCalGas. The leak was stopped on February 11, 2016 and SS25 was permanently sealed on February 18, As a result of the leak, SB 380 and new DOGGR regulations impose a moratorium on injections at the Aliso facility until SoCalGas complies with the regulations and conditions defined by SB380 and DOGGR s Comprehensive Safety Review for Aliso Canyon. This safety review requires that all 114 wells in the facility are either thoroughly tested for safe operation or removed from operation and isolated from the underground reservoir. The implementation of these safety measures means that the Aliso Canyon facility is not available to the System Operator to be used to provide gas for system reliability in the Greater Los Angeles area. Only 15 billion cubic feet of working inventory natural gas remains in the Aliso Canyon underground reservoir less than one fifth of the working capacity of the facility. However, withdrawals have been authorized as necessary to support regional energy reliability this summer, consistent with a defined withdrawal protocol that promotes safe use of working inventory. As a result of the constraints on the operations at Aliso Canyon, the California Energy Commission (Energy Commission), California Public Utilities Commission (CPUC), California Independent System Operator (California ISO) and the Los Angeles Department of Water and Power (LADWP) collaborated to develop a technical assessment of energy impacts to the electric grid stemming from the current gas supply limitations of Aliso Canyon. Technical staff from these four entities joined with staff from SoCalGas in a Technical Assessment Group to conduct an engineering analysis that details potential energy impacts in the coming summer months. These efforts culminated in the Aliso Canyon Action Plan, which identifies actions to reduce the risks of gas curtailments this summer, including using the current supply of 15 4 Proposed to increase to 8 Bcf pending adoption of the Joint Motion for Adoption of Settlement Agreement in the Triennial Cost Allocation Proceeding (TCAP) Phase 1 application (A ). 83
93 SOUTHERN CALIFORNIA GAS COMPANY billion cubic feet stored in Aliso Canyon during periods of peak demand to avoid electrical interruptions, directing all shippers to closely match their scheduled gas deliveries with their actual demand every day, and asking customers to use less energy. The Aliso Canyon Action Plan proposes implementation of 18 specific measures to reduce the possibility of electrical service interruptions this summer. These measures will reduce, but not eliminate, the risk of gas curtailments large enough to cause electricity interruptions. The measures fall into five major categories: efficient use of Aliso Canyon, noncore gas tariff changes, greater operational coordination, LADWP specific measures, and measures aimed at reducing natural gas and electricity consumption. State Regulatory Matters REGULATORY ENVIRONMENT TRIENNIAL COST ALLOCATION PROCEEDING (TCAP) SoCalGas filed TCAP applications in December 2014 (A , Phase 1) and July 2015 (A , Phase 2) to update the allocation of the costs of providing gas service to customer classes and determine the transportation n rates it charges to customers. The Phase 1 Application includes updating the allocation of costs related to the underground storage of natural gas for the period 2016 through The Phase 2 Application includes updating the allocation of all other costs related to gas transportation service to various customer classes to recover the cost of service from the respective rate base, as well as the throughput forecasts used to set rates, for a three-year period of A Settlement Agreement on the Phase 1 Application was filed in August A final CPUC Decision on both phases is expected in PIPELINE SAFETY On February 24, 2011, the CPUC approved an Order Instituting Rulemaking (OIR) to develop and adopt new regulations on pipeline safety. Through the OIR, the Commission will develop and adopt safety regulations that address topics such as construction standards, shutoff valves, maintenance requirements, records management and retention, ratemaking, and penalty provisions. On June 9, 2011, the CPUC issued a decision requiring that the utilities file a plan to pressure test or replace transmission pipelines that have not been pressure tested. SoCalGas/SDG&E jointly filed their comprehensive Pipeline Safety Enhancement Plan (PSEP) on August 26, The comprehensive plan covers all of the utilities' approximately 4,000 miles of transmission lines (3,750 miles for SoCalGas and 250 miles for SDG&E) and would be implemented in two phases. Phase 1 focuses on populated areas of SoCalGas' and SDG&E's service territories and, if approved, would be implemented over a 10-year period, from 2012 to Phase 2 will cover unpopulated areas of SoCalGas' and SDG&E's service territories and will be filed with the CPUC at a later date
94 SOUTHERN CALIFORNIA GAS COMPANY The utilities Pipeline Safety Enhancement Plan was transferred for consideration from the Pipeline Safety Rulemaking to the Triennial Cost Allocation Proceeding. A proposed decision was issued in April 2014 which adopts the overall plan and a process to recover the associated costs subject to reasonableness reviews. In June 2014, the CPUC issued a final decision addressing SoCalGas and SDG&E s PSEP. Specifically, the decision determined the following for Phase 1 of the program: approved the utilities model for implementing PSEP; approved a process, including a reasonableness review, to determine the amount that the utilities will be authorized to recover from ratepayers for the interim costs incurred through the date of the final decision to implement PSEP, which is recorded in regulatory accounts authorized by the CPUC; approved balancing account treatment, subject to a reasonableness review, for incremental costs yet to be incurred to implement PSEP; and established the criteria to determine the amounts that would not be eligible for cost recovery, including: certain costs incurred or to be incurred searching for pipeline test records, the cost of pressure testing pipelines installed after July 1, 1961 for which the company has not found sufficient records of testing, and any undepreciated balances for pipelines installed after 1961 that were replaced due to insufficient documentation of pressure testing. SoCalGas and SDG&E are authorized to file an application with the CPUC for recovery of costs up to the date of the TCAP decision and then annually for costs incurred through the end of each calendar year beginning after December 31, In December 2014, SoCalGas and SDG&E filed an application with the CPUC for recovery of a portion of costs recorded in the regulatory account through June 11, SoCalGas and SDG&E request recovery of $0.1 million and $26.8 million, respectively. The application is pending a decision from the CPUC. SoCalGas and SDG&E filed an application with the CPUC in June 2015 requesting approval to establish regulatory accounts to record planning and engineering design costs associated with Phase 2 projects. The work is necessary to present detailed cost estimates in future filings with the CPUC. Phase 2 addresses about 660 miles of transmission pipelines that do not have sufficient documentation of a pressure test to at least 1.25 times the Maximum Allowable Operating Pressure (MAOP) that are located in less populated areas. This proceeding was also expanded to address interim cost recovery issues for Phase 1 and proceeding schedules for PSEP filings going forward. A decision from the CPUC is pending. FEDERAL REGULATORY MATTERS SoCalGas and SDG&E participate in FERC proceedings involving interstate natural gas pipelines serving California that can affect the cost of gas delivered to their customers. SoCalGas holds contracts for interstate transportation capacity on the El Paso, Kern River, Transwestern, and GTN and Canadian pipelines. SoCalGas and SDG&E also participate in FERC and Canadian regulatory proceedings involving the natural gas industry generally as those proceedings may impact their operations and policies. 85
95 SOUTHERN CALIFORNIA GAS COMPANY El Paso El Paso s rates have been the subject of extensive litigation at FERC in recent years. El Paso filed its third general rate case in five years in September The 2010 rate case proceeded to a hearing on all issues in 2011 (a first since 1959), with the FERC Commission issuing an initial decision, Opinion No. 528, in 2013 and a revised decision, Opinion No. 528-A, issued in Collectively, these decisions ruled on issues related to revenue requirements, abandonment costs, cost allocation, and rate design. The aforementioned FERC decisions are currently under review before the U.S. Court of Appeals. Kern River A final ruling was issued in 2013 in Kern River s 2004 general rate case. The ruling denied many rehearing requests to revisit the issues litigated in this case and accepted a series of orders retaining Kern River s original 1992 levelized rate design, resulting in reduced rates for eligible shippers, who renew their contracts for another 10- or 15-year period. At the time of this publication, there have not been any new general rate case filings made by Kern River. Transwestern Transwestern filed and the FERC approved a Settlement Agreement in its 2015 rate case. Under the terms of this agreement, settlement transportation base rates remain unchanged through October 2019, and Transwestern may not file another general rate case until July In the interim, the settlement agreement calls for separate proceedings to resolve issues related to capacity release procedures and gas quality. Gas Transmission Northwest (GTN) and Canadian Pipelines SoCalGas acquires its Canadian natural gas supplies from the NOVA Gas Transmission Limited (NGTL) pipeline located in Alberta, Canada and transports these supplies through the NGTL pipeline in Alberta, to the Foothills Pipe Lines Limited Company pipeline (Foothills) in British Columbia, and finally to GTN at the Canadian/U.S. international border. NGTL filed and received approval in 2016 from its Canadian regulators for a settlement agreement on revenue requirements for its pipeline for Foothills filed and received approval from its Canadian regulators for its annual filing on rate changes for 2015, and separately for The annual transportation rate increases on both the NGTL and Foothills pipelines have been modest in recent years. GTN filed and the FERC approved a Settlement Agreement in its 2015 rate case. Under the terms of this agreement, transportation base rates will decrease incrementally over six years and be approximately 20% lower by 2021 relative to current 2014 levels
96 SOUTHERN CALIFORNIA GAS COMPANY Coordination Between Gas and Electric Markets In April 2015, FERC issued Order No. 809 to better coordinate scheduling protocols and emergency response measures between gas and electricity markets. Interstate pipelines must comply with the new business standards by April 1, Discussions are on-going to explore the potential for faster, computerized scheduling when shippers and confirming parties all submit electronic nominations and confirmations, including a streamlined confirmation process, if necessary. In June 2015, SoCalGas and SDG&E filed A seeking changes to its gas curtailment procedures on the SoCalGas and SDG&E system. A component of those changes included formalized and regular communication between the Utility Gas Control department and the electric grid operators prior to implementing a gas curtailment in order to minimize the impact to grid reliability while maintaining gas system integrity. A final decision from the CPUC on these changes is pending. GREENHOUSE GAS ISSUES National Policy The national greenhouse gas program is largely based on the Clean Power Plan adopted by the U.S. Environmental Protection Agency pursuant to EPA s authority under the Clean Air Act. The Clean Power Plan establishes unique emission rate goals and mass equivalents for each state. It is projected to reduce carbon emissions from the power sector 32 percent from 2005 levels by Individual state targets are based on national uniform emission performance rate standards (pounds of CO2 per MWh) and each state s unique generation mix. On February 9, 2016, the U.S. Supreme Court issued a stay of the Environmental Protection Agency s (EPA s) Clean Power Plan, freezing carbon pollution standards for existing power plants while the rule is under review at the U.S. Court of Appeals for the District of Columbia Circuit. Assembly Bill 32 The Global Warming Solutions Act of 2006 (Assembly Bill 32) caps California s greenhouse gas (GHG) emissions at the 1990 level by AB 32 directed the California Air Resources Board (ARB) to adopt a GHG emissions cap on all major sources. The electric and natural gas sectors will play an important role in achieving the emissions reduction goal. CARB s plan envisions that the electric sector will contribute at least 40 percent of the total direct GHG reductions even though the sector accounts for just 25 percent of California s GHG emissions. 87
97 SOUTHERN CALIFORNIA GAS COMPANY California is in the process of implementing a broad portfolio of policies and regulations aimed at reducing greenhouse gas (GHG) emissions. This process is a collaborative effort underway at the CPUC, the CEC, and CARB. CARB however is statutorily empowered with developing and implementing the final regulations on GHG regulatory frameworks and compliance. Approved policies include both programmatic measures and market-based mechanisms to reduce GHG emissions. Cap-and-Trade is one technique being implemented by CARB. Other measures include increasing the amount of renewable energy power that enters the grid, ambitious energy efficiency incentive programs and incentives on electric vehicles and solar energy. Greenhouse Gas (GHG) Rulemaking Beginning on January 1, 2015, CARB s Cap-and-Trade Program expanded to include emissions from all SoCalGas customers. SoCalGas is required to purchase carbon allowances or offsets on behalf of our end-use customers for the emissions generated from the full combustion of the natural gas we deliver. Large end-use customers who emit at least 25,000 metric tons of CO2 equivalent per year have a direct obligation to the CARB for their own emissions; therefore, SoCalGas obligation will not include these customers and they will not be responsible for compliance costs related to end-users from SoCalGas. The CPUC had recently completed a rulemaking proceeding to determine how the costs related to compliance with the Cap-and-Trade program will be included in end-use customers rates. The rulemaking had also addressed how revenues generated from the sale of directly allocated allowances will be returned to ratepayers. The Rulemaking had initially determined that all Cap-and-Trade compliance costs will be included on a forecasted basis in customers transportation rates beginning April 1, Customers with a direct obligation to the CARB for their emissions are exempt from SoCalGas end-users compliance obligation, and will receive a volumetric credit called the Cap-and-Trade Cost Exemption for the amount of their transportation rates that contribute to these costs. All customers rates will also include compliance costs related to SoCalGas covered facilities, as well as for Lost and Unaccounted For (LUAF) gas. Revenues generated from the sale of directly allocated allowances would initially have been returned as a fixed, once-annual California Climate Credit to all residential households on their April bills. Nonresidential customers were not to have received a California Climate Credit. An Application for Rehearing on the use of the revenues generated from the sale of directly allocated allowances was granted in April As such, the introduction of Cap-and-Trade costs into rates and the distribution of the gas California Climate Credit has been delayed. Reporting and Cap-and-Trade Obligations In 2015, SoCalGas reported GHG emissions to the Environmental Protection Agency, in accordance with 40 Code of Federal Regulations Part 98, in three primary categories: combustion emissions at three compressor stations and two storage fields, where total annual GHG emissions exceeded the 25,000 metric tons of CO2 equivalent (mtco2e) threshold for GHG reporting; vented and fugitive emissions from four compressor stations, two storage fields and the natural gas 20188
98 SOUTHERN CALIFORNIA GAS COMPANY distribution system and the GHG emissions resulting from combustion of natural gas delivered to all customers except for customers consuming more than 460 MMcf. In 2015, SoCalGas reported to the California Air Resources Board (CARB) GHG emissions approximately 43 million mtco2e in three primary categories: combustion emissions at six compressor stations and two storage fields, where annual emissions exceed 10,000 mtco2e; vented and fugitive emissions from three compressor stations, two storage fields and the natural gas distribution system and the GHG emissions resulting from combustion of natural gas delivered to all customers. The five facilities subject to the EPA mandatory reporting regulation are also subject to the CARB Cap-and-Trade Program. On January 1, 2015, natural gas suppliers became subject to the Cap-and-Trade Program and now have a compliance obligation for GHG emissions from the natural gas use of their small customers (i.e., those customers who are not covered directly under CARB s Cap-and-Trade program). SoCalGas estimated that responsibility for compliance obligations of GHG emissions as a natural gas supplier were approximately 20.5 million mtco2e for CARB will issue the final 2015 compliance obligations of GHG emissions as a natural gas supplier in October In 2014, Rulemaking (R.) was initiated by the Commission to carry out the intent of SB 1371 (Statutes 2014, Chapter 525).1 SB 1371 requires the adoption of rules and procedures to minimize natural gas leakage from Commission-regulated natural gas pipelines consistent with Public Utilities Code Section 961 (d), (c) of Subpart M of Title 49 of the CFR, the Commission s General Order 112-F, and the state s goal of reducing GHG emissions. As part of this rulemaking, natural gas utilities are required to annually report methane emissions from intentional and unintentional releases and their leak management practices by May 15. In 2014, SoCalGas reported an estimated 1.2 bcf of methane emissions from intentional and unintentional releases. Currently, these emissions are not subject to the CARB Cap-and-Trade Program. Motor Vehicle Emissions Reductions National GHG policy-makers realize that motor vehicles are one of the largest sources of GHG emissions, and one of the potential solutions is the substitution of natural gas and electricity for the current diesel and gasoline energy sources. This transition to cleaner fuels will also increase the demand for both natural gas and natural gas-generated electricity. Under EPA s Mandatory Reporting of Greenhouse Gases rule, all vehicle and engine manufacturers outside of the light-duty sector must report emission rates of carbon dioxide, nitrous oxide, and methane from their products. Low Carbon Fuel Standard On January 18, 2007, former Governor Schwarzenegger signed an Executive Order establishing the low carbon fuel standard (LCFS). LCFS requires a 10 percent carbon intensity reduction by 2020 in the transportation sector. The LCFS requires fuel providers to ensure that the mix of fuel they sell into the California market meets, on average, a declining standard for GHG emissions measured in CO2 equivalent gram per unit of fuel energy sold. As stated above, the transition to cleaner fuels will increase the demand for both natural gas and natural gas-generated electricity in order to meet the needs of a cleaner state transportation fleet, which will increasingly utilize electricity and natural gas in the future. Further, the CPUC has recently 89
99 SOUTHERN CALIFORNIA GAS COMPANY authorized the utilities to sell LCFS credits generated both by their use of low-carbon fuel vehicles and those generated by public refueling stations. The revenue generated by the sale of these credits will be returned to the customers who generated the credits, further enhancing the value of low-carbon fuels. Programmatic Emission Reduction Measures The CEC, CPUC and CARB are considering or have approved a variety of non marketbased measures to reduce GHG emissions. Some of these programs include: the California Energy Efficiency Green Building Standards, the Green State Buildings Executive Order, the CPUC s adopted goal of zero net energy for all new residential construction by 2020 and a similar goal for commercial buildings by 2030; potential combined heat and power (CHP) and distributed generation portfolio standards or feed-in tariffs; increasing the electric renewables portfolio standard to 33% by 2020 and to 50% by 2030; implementing the CARB Short-Lived Climate Pollutants strategy and revising the CARB Regulation for GHG Emission Standards for Crude Oil and Natural Gas Facilities. There is also an on-going Rulemaking (R.) to implement SB 1371 which requires the adoption of rules and procedures to minimize natural gas leakage from Commission-regulated natural gas pipeline facilities. This proceeding is led by the CPUC in consultation with CARB the first phase will develop the overall policies and guidelines for a natural gas leak abatement program consistent with SB The second phase will develop ratemaking and performance-based financial incentives associated with the natural gas leak abatement program determined through Phase 1 of the proceeding. Energy efficiency and renewables are considered fundamental to GHG emission reduction in the electric sector. As a result, integration of additional renewables will require quick-start peaking capacity for firming and shaping of intermittent power, which in the foreseeable future will be gas-fired combustion turbines. GAS PRICE FORECAST MARKET CONDITION North American production from conventional supplies has been declining for the past several years as gas prices have continued to fall from prior peaks. Through 2015, improvements in fracking technology and horizontal drilling efficiencies in both dry and wet gas plays have resulted in supplies from unconventional shale resources increasing faster than conventional supply declines through However, the low gas and oil price environment of the past several years has taken a toll on drilling efforts whereby efficiency gains were no longer able to offset drilling declines, and total North American production has been declining this year. Also in response to the low gas price environment, gas demand has been rising, primarily from coal-to-gas fuel switching in the power sector, and most recently from increasing exports to Mexico by pipe and overseas via LNG as domestic liquefaction projects are commissioned. These exports are expected to continue increasing over the next several years as additional domestic liquefaction projects are placed into service, and as new pipeline 20190
100 SOUTHERN CALIFORNIA GAS COMPANY projects delivering gas to and within Mexico are completed. The level of LNG exports are subject to much uncertainty since they will be competing with increasing LNG supplies from new liquefaction facilities built overseas. Industry experts currently forecast that North American gas supplies will be sufficient to meet expected demand growth, but at prices which are higher than recently low levels. While North American gas price increases will be somewhat tempered by renewable power generation additions both in the US and in Mexico, continuing closures of coal-fired generation to meet environmental goals will also provide price support. DEVELOPMENT OF THE FORECAST Natural gas prices for the SoCalGas border are expected to average out at $2.61/MMBtu in 2015, down from $3.83/MMbtu in The natural gas prices are expected to increase to $6.36/MMBtu by Consistent with the prior CGR practices, the 2016 CGR gas price forecast was developed using a combination of market prices and fundamental forecasts. NYMEX futures prices were used for the period. Fundamental price forecasts were used for 2021 and beyond. The forecasts for 2021 and 2022 reflect a blending of market and fundamental prices, with declining weights for market prices (and corresponding increasing weights for the fundamental price forecast) over the two-year period. The fundamental gas price forecast represents an average of the forecasts developed by the CEC and independent consultants. $6.00 $5.00 $4.00 $3.00 $2.00 $1.00 $- Natural Gas Price at the Southern California Border Constant 2015 $/MMBtu Natural Gas Price at the Southern California Border It is important to recognize that the natural gas price forecast is inherently uncertain. SoCalGas and the respondents of the 2016 CGR do not warrant the accuracy of the gas price projection. In no event shall SoCalGas or the respondents of the 2016 CGR be liable for the use of or reliance on this natural gas price forecast. 91
101 SOUTHERN CALIFORNIA GAS COMPANY PEAK DAY DEMAND AND DELIVERABILITY Since April 2008, gas supplies to serve both SoCalGas and SDG&E s retail core gas demand have been procured as a combined portfolio. SoCalGas and SDG&E plan and design their systems to provide continuous service to their core customers under an extreme peak day event. For each utility s service area, the extreme peak day is defined as a service area average temperature so cold that it would, on average, occur only once every 35 years. This definition translates to a system average temperature of 40.1 degrees Fahrenheit for SoCalGas service area and 42.9 degrees Fahrenheit for SDG&E s service area. Demand on an extreme peak day is met through a combination of withdrawals from underground storage facilities and flowing pipeline supplies. The firm storage withdrawal amount of 2,225 MMCF/day is the value SoCalGas and SDG&E are approved to hold (per CPUC D on Dec. 4, 2008 at p. 12) to serve the combined core portfolio of SoCalGas and SDG&E s retail core customers. Storage withdrawal plus pipeline supplies must be sufficient to meet peak day operating requirements. The following table provides an illustration of how storage and flowing supplies can meet forecasted retail core peak day demand. Year Retail Core Peak Day Demand and Supply Requirements (MMcf/Day) 4 SoCalGas Retail Core Demand (1) SDG&E Retail Core Demand (2) Total Demand Firm Storage Withdrawal (3) Flowing Supply , ,334 2,225 1, , ,339 2,225 1, , ,326 2,225 1, , ,312 2,225 1, , ,294 2,225 1, , ,270 2,225 1, , ,242 2,225 1,017 Notes: (1) 1-in-35 peak temperature cold day SoCalGas core sales and transportation. (2) 1-in-35 peak temperature cold day SDG&E core sales and transportation. (3) This amount was approved by the CPUC for SoCalGas and SDG&E to serve the combined core portfolio of SoCalGas and SDG&E s retail core customers in CPUC D on 12/4/2008 at p. 12. (4) SoCalGas and SDG&E are only obligated to design their systems to maintain service to retail and wholesale core customers during a 1-in-35 winter peak day temperature event
102 SOUTHERN CALIFORNIA GAS COMPANY The tables below provide system-wide Winter (December month) peak day demand projections on SoCalGas system and High Sendout demand during Summer (July, August or September month as designated) periods. Winter Peak Day Demand (MMcf/Day) Year Core (1) Noncore Electric Total NonEG (2) Generation (3) Demand ,947 1,012 1,054 5, ,944 1,019 1,051 5, ,931 1,019 1,048 4, ,917 1,017 1,045 4, ,899 1,016 1,042 4, ,875 1,009 1,036 4, ,849 1,003 1,029 4,882 Notes: (1) 1-in-35 peak temperature cold day for SoCalGas core. (2) 1-in-10 peak temperature cold day for HDD-sensitive load. Includes SoCalGas non-core and wholesale non-eg. (3) UEG/EWG Base Hydro + all other EG. Year High Demand Month (1) Summer High Sendout Day Demand (MMcf/Day) Core (2) Noncore NonEG (3) Electric Generation (4) Total Demand 2016 Sep ,084 3, Sep ,005 3, Sep ,924 3, Sep ,843 3, Sep ,773 3, Sep ,705 2, Sep ,667 2,928 Notes: (1) Month of High Sendout gas demand during summer (July, August or September). (2) Average daily summer demand SoCalGas core. (3) Average daily summer demand. Includes SoCalGas retail and wholesale load. (4) Highest demand on a summer day under 1-in-10 dry hydro conditions. 93
103 SOUTHERN CALIFORNIA GAS COMPANY C A L I F O R N I A G A S R E P O R T SOUTHERN CALIFORNIA GAS COMPANY TABULAR DATA 94
104 SOUTHERN CALIFORNIA GAS COMPANY SOUTHERN CALIFORNIA GAS COMPANY ANNUAL GAS SUPPLY AND SENDOUT - MMCF/DAY RECORDED YEARS 2011 TO 2015 Line CAPACITY AVAILABLE California Source Gas Out-of-State Gas 2 California Offshore -POPCO / PIOC 3 El Paso Natural Gas Co. 4 Transwestern Pipeline Co. 5 Kern / Mojave 6 PGT / PG&E 7 Other 8 Total Out-of-State Gas 9 TOTAL CAPACITY AVAILABLE GAS SUPPLY TAKEN 10 California Source Gas Out-of-State Gas 11 Other Out-of-State 2,452 2,728 2,514 2,538 2, Total Out-of-State Gas 2,452 2,728 2,514 2,538 2, TOTAL SUPPLY TAKEN 2,627 2,876 2,667 2,681 2, Net Underground Storage Withdrawal (4) (42) 106 (63) TOTAL THROUGHPUT (1)(2) 2,623 2,834 2,773 2,618 2,559 DELIVERIES BY END-USE 16 Core Residential Commercial Industrial NGV Subtotal 1, Noncore Commercial Industrial EOR Steaming Electric Generation Subtotal 1,176 1,376 1,311 1,339 1, Wholesale/International Co. Use & LUAF SYSTEM TOTAL-THROUGHPUT (1)(2) 2,623 2,834 2,773 2,618 2,559 TRANSPORTATION AND EXCHANGE 29 Core All End Uses Noncore Commercial/Industrial EOR Steaming Electric Generation Subtotal-Retail 1,205 1,411 1,356 1,388 1, Wholesale/International TOTAL TRANSPORTATION & EXCHANGE 1,612 1,888 1,821 1,798 1, CURTAILMENT (3) 37 REFUSAL 38 Total BTU Factor (Dth/Mcf) NOTES: (1) The wholesale volumes only reflect natural gas supplied by SoCalGas; and, do not include supplies from other sources. Refer to the supply source data provided in each utility s report for a complete accounting of their supply sources. (2) Deliveries by end-use includes sales, transportation, and exchange volumes and data includes effect of prior period adjustments. (3) The table does not explicitly show any curtailment numbers for the recorded years because, during some curtailment events, the estimate of the curtailed volume is not available. While the table does not explicitly show any curtailment numbers for the recorded years, the noncore customer usage data implicitly captures the effects of any curtailment events. 95
105 SOUTHERN CALIFORNIA GAS COMPANY SOUTHERN CALIFORNIA GAS COMPANY TABLE 1-SCG ANNUAL GAS SUPPLY AND REQUIREMENTS - MMCF/DAY ESTIMATED YEARS 2016 THRU 2020 AVERAGE TEMPERATURE YEAR LINE LINE CAPACITY AVAILABLE 1 California Line 85 Zone (California Producers) California Coastal Zone (California Producers) Out-of-State Gas 3 Wheeler Ridge Zone (KR, MP, PG&E, OEHI) 1/ Southern Zone (EPN,TGN,NBP) 2/ 1,210 1,210 1,210 1,210 1, Northern Zone (TW,EPN,QST, KR) 3/ 1,590 1,590 1,590 1,590 1, Total Out-of-State Gas 3,565 3,565 3,565 3,565 3, TOTAL CAPACITY AVAILABLE 3,875 3,875 3,875 3,875 3,875 7 GAS SUPPLY TAKEN 8 California Source Gas Out-of-State 2,559 2,527 2,485 2,459 2, TOTAL SUPPLY TAKEN 2,681 2,649 2,607 2,581 2, Net Underground Storage Withdrawal TOTAL THROUGHPUT 4/ 2,681 2,649 2,607 2,581 2, REQUIREMENTS FORECAST BY END-USE 5/ 13 CORE 6/ Residential Commercial Industrial NGV Subtotal-CORE NONCORE Commercial Industrial EOR Steaming Electric Generation (EG) Subtotal-NONCORE 1,251 1,218 1,195 1,178 1, WHOLESALE & Core INTERNATIONAL Noncore Excl. EG Electric Generation (EG) Subtotal-WHOLESALE & INTL Co. Use & LUAF SYSTEM TOTAL THROUGHPUT 4/ 2,681 2,649 2,607 2,581 2, TRANSPORTATION AND EXCHANGE 29 CORE All End Uses NONCORE Commercial/Industrial EOR Steaming Electric Generation (EG) Subtotal-RETAIL 1,307 1,275 1,252 1,235 1, WHOLESALE & 34 INTERNATIONAL All End Uses TOTAL TRANSPORTATION & EXCHANGE 1,742 1,709 1,671 1,650 1, CURTAILMENT (RETAIL & WHOLESALE) 36 Core Noncore TOTAL - Curtailment NOTES: 1/ Wheeler Ridge Zone: KR & MP at Wheeler Ridge, PG&E at Kern Stn., OEHI at Gosford) 2/ Southern Zone (EPN at Ehrenberg, TGN at Otay Mesa, NBP at Blythe) 3/ Northern Zone (TW at No. Needles, EPN at Topok, QST at No. Needles, KR at Kramer Jct.) 4/ Excludes own-source gas supply of gas procurement by the City of Long Beach 5/ Requirement forecast by end-use includes sales, transportation, and exchange volumes. 6/ Core end-use demand exclusive of core aggregation transportation (CAT) in MDth/d: CALIFORNIA GAS REPORT96
106 SOUTHERN CALIFORNIA GAS COMPANY SOUTHERN CALIFORNIA GAS COMPANY TABLE 2-SCG ANNUAL GAS SUPPLY AND REQUIREMENTS - MMCF/DAY ESTIMATED YEARS 2021 THRU 2035 AVERAGE TEMPERATURE YEAR LINE LINE CAPACITY AVAILABLE 1 California Line 85 Zone (California Producers) California Coastal Zone (California Producers) Out-of-State Gas 3 Wheeler Ridge Zone (KR, MP, PG&E, OEHI) 1/ Southern Zone (EPN,TGN,NBP) 2/ 1,210 1,210 1,210 1,210 1, Northern Zone (TW,EPN,QST, KR) 3/ 1,590 1,590 1,590 1,590 1, Total Out-of-State Gas 3,565 3,565 3,565 3,565 3, TOTAL CAPACITY AVAILABLE 3,875 3,875 3,875 3,875 3,875 7 GAS SUPPLY TAKEN 8 California Source Gas Out-of-State 2,404 2,382 2,334 2,252 2, TOTAL SUPPLY TAKEN 2,526 2,504 2,456 2,374 2, Net Underground Storage Withdrawal TOTAL THROUGHPUT 4/ 2,526 2,504 2,456 2,374 2, REQUIREMENTS FORECAST BY END-USE 5/ 13 CORE 6/ Residential Commercial Industrial NGV Subtotal-CORE NONCORE Commercial Industrial EOR Steaming Electric Generation (EG) Subtotal-NONCORE 1,139 1,126 1,104 1,055 1, WHOLESALE & Core INTERNATIONAL Noncore Excl. EG Electric Generation (EG) Subtotal-WHOLESALE & INTL Co. Use & LUAF SYSTEM TOTAL THROUGHPUT 4/ 2,526 2,504 2,456 2,374 2, TRANSPORTATION AND EXCHANGE 29 CORE All End Uses NONCORE Commercial/Industrial EOR Steaming Electric Generation (EG) Subtotal-RETAIL 1,195 1,182 1,159 1,110 1, WHOLESALE & 34 INTERNATIONAL All End Uses TOTAL TRANSPORTATION & EXCHANGE 1,610 1,597 1,570 1,517 1, CURTAILMENT (RETAIL & WHOLESALE) 36 Core Noncore TOTAL - Curtailment NOTES: 1/ Wheeler Ridge Zone: KR & MP at Wheeler Ridge, PG&E at Kern Stn., OEHI at Gosford) 2/ Southern Zone (EPN at Ehrenberg, TGN at Otay Mesa, NBP at Blythe) 3/ Northern Zone (TW at No. Needles, EPN at Topok, QST at No. Needles, KR at Kramer Jct.) 4/ Excludes own-source gas supply of gas procurement by the City of Long Beach 5/ Requirement forecast by end-use includes sales, transportation, and exchange volumes. 6/ Core end-use demand exclusive of core aggregation transportation (CAT) in MDth/d:
107 SOUTHERN CALIFORNIA GAS COMPANY SOUTHERN CALIFORNIA GAS COMPANY TABLE 3-SCG ANNUAL GAS SUPPLY AND REQUIREMENTS - MMCF/DAY ESTIMATED YEARS 2016 THRU 2020 COLD TEMPERATURE YEAR (1 IN 35 COLD YEAR EVENT) & DRY HYDRO YEAR LINE LINE CAPACITY AVAILABLE 1 California Line 85 Zone (California Producers) California Coastal Zone (California Producers) Out-of-State Gas 3 Wheeler Ridge Zone (KR, MP, PG&E, OEHI) 1/ Southern Zone (EPN,TGN,NBP) 2/ 1,210 1,210 1,210 1,210 1, Northern Zone (TW,EPN,QST, KR) 3/ 1,590 1,590 1,590 1,590 1, Total Out-of-State Gas 3,565 3,565 3,565 3,565 3, TOTAL CAPACITY AVAILABLE 3,875 3,875 3,875 3,875 3,875 7 GAS SUPPLY TAKEN 8 California Source Gas Out-of-State 2,665 2,706 2,671 2,640 2, TOTAL SUPPLY TAKEN 2,787 2,828 2,793 2,762 2, Net Underground Storage Withdrawal TOTAL THROUGHPUT 4/ 2,787 2,828 2,793 2,762 2, REQUIREMENTS FORECAST BY END-USE 5/ 13 CORE 6/ Residential Commercial Industrial NGV Subtotal-CORE 1,047 1,050 1,045 1,040 1, NONCORE Commercial Industrial EOR Steaming Electric Generation (EG) Subtotal-NONCORE 1,252 1,285 1,265 1,244 1, WHOLESALE & Core INTERNATIONAL Noncore Excl. EG Electric Generation (EG) Subtotal-WHOLESALE & INTL Co. Use & LUAF SYSTEM TOTAL THROUGHPUT 4/ 2,787 2,828 2,793 2,762 2, TRANSPORTATION AND EXCHANGE 29 CORE All End Uses NONCORE Commercial/Industrial EOR Steaming Electric Generation (EG) Subtotal-RETAIL 1,311 1,344 1,325 1,303 1, WHOLESALE & 34 INTERNATIONAL All End Uses TOTAL TRANSPORTATION & EXCHANGE 1,764 1,802 1,772 1,748 1, CURTAILMENT (RETAIL & WHOLESALE) 36 Core Noncore TOTAL - Curtailment NOTES: 1/ Wheeler Ridge Zone: KR & MP at Wheeler Ridge, PG&E at Kern Stn., OEHI at Gosford) 2/ Southern Zone (EPN at Ehrenberg, TGN at Otay Mesa, NBP at Blythe) 3/ Northern Zone (TW at No. Needles, EPN at Topok, QST at No. Needles, KR at Kramer Jct.) 4/ Excludes own-source gas supply of gas procurement by the City of Long Beach 5/ Requirement forecast by end-use includes sales, transportation, and exchange volumes. 6/ Core end-use demand exclusive of core aggregation transportation (CAT) in MDth/d: 1,023 1,025 1,020 1,015 1,006 98
108 SOUTHERN CALIFORNIA GAS COMPANY SOUTHERN CALIFORNIA GAS COMPANY TABLE 4-SCG ANNUAL GAS SUPPLY AND REQUIREMENTS - MMCF/DAY ESTIMATED YEARS 2021 THRU 2035 COLD TEMPERATURE YEAR (1 IN 35 COLD YEAR EVENT) & DRY HYDRO YEAR LINE LINE CAPACITY AVAILABLE 1 California Line 85 Zone (California Producers) California Coastal Zone (California Producers) Out-of-State Gas 3 Wheeler Ridge Zone (KR, MP, PG&E, OEHI) 1/ Southern Zone (EPN,TGN,NBP) 2/ 1,210 1,210 1,210 1,210 1, Northern Zone (TW,EPN,QST, KR) 3/ 1,590 1,590 1,590 1,590 1, Total Out-of-State Gas 3,565 3,565 3,565 3,565 3, TOTAL CAPACITY AVAILABLE 3,875 3,875 3,875 3,875 3,875 7 GAS SUPPLY TAKEN 8 California Source Gas Out-of-State 2,598 2,579 2,527 2,426 2, TOTAL SUPPLY TAKEN 2,720 2,701 2,649 2,548 2, Net Underground Storage Withdrawal TOTAL THROUGHPUT 4/ 2,720 2,701 2,649 2,548 2, REQUIREMENTS FORECAST BY END-USE 5/ 13 CORE 6/ Residential Commercial Industrial NGV Subtotal-CORE 1,025 1, NONCORE Commercial Industrial EOR Steaming Electric Generation (EG) Subtotal-NONCORE 1,217 1,207 1,183 1,117 1, WHOLESALE & Core INTERNATIONAL Noncore Excl. EG Electric Generation (EG) Subtotal-WHOLESALE & INTL Co. Use & LUAF SYSTEM TOTAL THROUGHPUT 4/ 2,720 2,701 2,649 2,548 2, TRANSPORTATION AND EXCHANGE 29 CORE All End Uses NONCORE Commercial/Industrial EOR Steaming Electric Generation (EG) Subtotal-RETAIL 1,276 1,265 1,241 1,175 1, WHOLESALE & 34 INTERNATIONAL All End Uses TOTAL TRANSPORTATION & EXCHANGE 1,720 1,710 1,682 1,611 1, CURTAILMENT (RETAIL & WHOLESALE) 36 Core Noncore TOTAL - Curtailment NOTES: 1/ Wheeler Ridge Zone: KR & MP at Wheeler Ridge, PG&E at Kern Stn., OEHI at Gosford) 2/ Southern Zone (EPN at Ehrenberg, TGN at Otay Mesa, NBP at Blythe) 3/ Northern Zone (TW at No. Needles, EPN at Topok, QST at No. Needles, KR at Kramer Jct.) 4/ Excludes own-source gas supply of gas procurement by the City of Long Beach 5/ Requirement forecast by end-use includes sales, transportation, and exchange volumes. 6/ Core end-use demand exclusive of core aggregation transportation (CAT) in MDth/d: 1,
109 CITY OF LONG BEACH GAS & OIL DEPARTMENT 2016 C A L I F O R N I A G A S R E P O R T CITY OF LONG BEACH MUNICIPAL GAS AND OIL DEPARTMENT 100
110 CITY OF LONG BEACH GAS & OIL DEPARTMENT City of Long Beach Municipal Gas & Oil Department The annual gas supply and forecast requirements prepared by the Long Beach Gas & Oil Department (Long Beach) are shown on the following tables for the years 2016 through Serving approximately 150,000 customers, Long Beach is the largest California municipal gas utility and the fifth largest municipal gas utility in the United States. Long Beach's service territory includes the cities of Long Beach and Signal Hill, and sections of surrounding communities including Lakewood, Bellflower, Compton, Seal Beach, Paramount, and Los Alamitos. Long Beach's customer load profile is 53 percent residential and 47 percent commercial/industrial. As a municipal utility, Long Beach's rates and policies are established by the City Council, which acts as the regulatory authority. The City Charter requires the gas utility to establish its rates comparable to the rates charged by surrounding gas utilities for similar types of service. Long Beach receives a small amount of its gas supply directly into its pipeline system from local production fields that are located within Long Beach's service territory, as well as offshore. Currently, Long Beach receives approximately 5 percent of its gas supply from local production. The majority of Long Beach supplies are purchased at the California border, primarily from the Southwestern United States. Long Beach, as a wholesale customer, receives intrastate transmission service for this gas from SoCalGas. 101
111 CITY OF LONG BEACH GAS & OIL DEPARTMENT C A L I F O R N I A G A S R E P O R T CITY OF LONG BEACH MUNICIPAL GAS AND OIL DEPARTMENT TABULAR DATA 102
112 CITY OF LONG BEACH GAS & OIL DEPARTMENT CITY OF LONG BEACH - GAS & OIL DEPARTMENT ANNUAL GAS SUPPLY AND SENDOUT - MMCF/DAY RECORDED YEARS 2011 THRU 2015 LINE GAS SUPPLY AVAILABLE LINE California Source Gas 1 Regular Purchases Received for Exchange/Transport Total California Source Gas Purchases from Other Utilities Out-of-State Gas 5 Pacific Interstate Companies Additional Core Supplies Incremental Supplies Out-of-State Transport Total Out-of-State Gas Subtotal Underground Storage Withdrawal GAS SUPPLY AVAILABLE GAS SUPPLY TAKEN California Source Gas 13 Regular Purchases Received for Exchange/Transport Total California Source Gas Purchases from Other Utilities Out-of-State Gas 17 Pacific Interstate Companies Additional Core Supplies Incremental Supplies Out-of-State Transport Total Out-of-State Gas Subtotal Underground Storage Withdrawal TOTAL Gas Supply Taken & Transported
113 CITY OF LONG BEACH GAS & OIL DEPARTMENT CITY OF LONG BEACH - GAS & OIL DEPARTMENT ANNUAL GAS SUPPLY AND SENDOUT - MMCF/DAY RECORDED YEARS 2011 THRU 2015 LINE ACTUAL DELIVERIES BY END-USE LINE 1 CORE Residential CORE/NONCORE Commercial CORE/NONCORE Industrial Subtotal NON CORE Non-EOR Cogeneration EOR Cogen. & Steaming Electric Utilities Subtotal WHOLESALE Residential Com. & Ind., others Electric Utilities Subtotal-WHOLESALE Co. Use & LUAF Subtotal-END USE Storage Injection SYSTEM TOTAL-THROUGHPUT ACTUAL TRANSPORTATION AND EXCHANGE 17 Residential N/A N/A N/A N/A N/A Commercial/Industrial Non-EOR Cogeneration EOR Cogen. & Steaming N/A N/A N/A N/A N/A Electric Utilites N/A N/A N/A N/A N/A Subtotal-RETAIL WHOLESALE All End Uses TOTAL TRANSPORTATION & EXCHANGE ACTUAL CURTAILMENT 25 Residential Commercial/Industrial Non-EOR Cogeneration EOR Cogen. & Steaming Electric Utilites Wholesale TOTAL- Curtailment REFUSAL NOTE: Actual deliveries by end-use includes sales, transportation, and exchange volumes, but excludes actual curtailments. 104
114 CITY OF LONG BEACH GAS & OIL DEPARTMENT CITY OF LONG BEACH - GAS & OIL DEPARTMENT ANNUAL GAS SUPPLY AND REQUIREMENTS - MMCF/DAY ESTIMATED YEARS 2016 THRU 2020 AVERAGE TEMPERATURE YEAR LINE CAPACITY AVAILABLE LINE 1 California Source Gas 1 2 Out-of-State Gas 2 3 TOTAL CAPACITY AVAILABLE 3 GAS SUPPLY TAKEN 4 California Source Gas Out-of-State Gas TOTAL SUPPLY TAKEN Net Underground Storage Withdrawal TOTAL THROUGHPUT (1) REQUIREMENTS FORECAST BY END-USE (1) 9 CORE Residential Commercial NGV Subtotal-CORE NONCORE Industrial Non-EOR Cogeneration EOR Utility Electric Generation NGV Subtotal-NONCORE Co. Use & LUAF SYSTEM TOTAL THROUGHPUT (1) SYSTEM CURTAILMENT TRANSPORTATION 22 CORE All End Uses NONCORE Industrial Non-EOR Cogeneration EOR Utility Electric Generation Subtotal NONCORE TOTAL TRANSPORTATION (1) Requirement forecast by end-use includes sales and transportation volumes. 105
115 CITY OF LONG BEACH GAS & OIL DEPARTMENT CITY OF LONG BEACH - GAS & OIL DEPARTMENT ANNUAL GAS SUPPLY AND REQUIREMENTS - MMCF/DAY ESTIMATED YEARS 2021 THRU 2035 AVERAGE TEMPERATURE YEAR LINE CAPACITY AVAILABLE LINE 1 California Source Gas 1 2 Out-of-State Gas 2 3 TOTAL CAPACITY AVAILABLE 3 GAS SUPPLY TAKEN 4 California Source Gas Out-of-State Gas TOTAL SUPPLY TAKEN Net Underground Storage Withdrawal TOTAL THROUGHPUT (1) REQUIREMENTS FORECAST BY END-USE (1) 9 CORE Residential Commercial NGV Subtotal-CORE NONCORE Industrial Non-EOR Cogeneration EOR Utility Electric Generation NGV Subtotal-NONCORE Co. Use & LUAF SYSTEM TOTAL THROUGHPUT (1) SYSTEM CURTAILMENT TRANSPORTATION 22 CORE All End Uses NONCORE Industrial Non-EOR Cogeneration EOR Utility Electric Generation Subtotal NONCORE TOTAL TRANSPORTATION (1) Requirement forecast by end-use includes sales and transportation volumes. 106
116 CITY OF LONG BEACH GAS & OIL DEPARTMENT CITY OF LONG BEACH - GAS & OIL DEPARTMENT ANNUAL GAS SUPPLY AND REQUIREMENTS - MMCF/DAY ESTIMATED YEARS 2016 THRU in 35 TEMPERATURE YEAR LINE CAPACITY AVAILABLE LINE 1 California Source Gas 1 2 Out-of-State Gas 2 3 TOTAL CAPACITY AVAILABLE 3 GAS SUPPLY TAKEN 4 California Source Gas Out-of-State Gas TOTAL SUPPLY TAKEN Net Underground Storage Withdrawal TOTAL THROUGHPUT (1) REQUIREMENTS FORECAST BY END-USE (1) 9 CORE Residential Commercial NGV Subtotal-CORE NONCORE Industrial Non-EOR Cogeneration EOR Utility Electric Generation NGV Subtotal-NONCORE Co. Use & LUAF SYSTEM TOTAL THROUGHPUT (1) SYSTEM CURTAILMENT TRANSPORTATION 22 CORE All End Uses NONCORE Industrial Non-EOR Cogeneration EOR Utility Electric Generation Subtotal NONCORE TOTAL TRANSPORTATION (1) Requirement forecast by end-use includes sales and transportation volumes California Gas Report
117 CITY OF LONG BEACH GAS & OIL DEPARTMENT CITY OF LONG BEACH - GAS & OIL DEPARTMENT ANNUAL GAS SUPPLY AND REQUIREMENTS - MMCF/DAY ESTIMATED YEARS 2021 THRU in 35 TEMPERATURE YEAR LINE CAPACITY AVAILABLE LINE 1 California Source Gas 1 2 Out-of-State Gas 2 3 TOTAL CAPACITY AVAILABLE 3 GAS SUPPLY TAKEN 4 California Source Gas Out-of-State Gas TOTAL SUPPLY TAKEN Net Underground Storage Withdrawal TOTAL THROUGHPUT (1) REQUIREMENTS FORECAST BY END-USE (1) 9 CORE Residential Commercial NGV Subtotal-CORE NONCORE Industrial Non-EOR Cogeneration EOR Utility Electric Generation NGV Subtotal-NONCORE Co. Use & LUAF SYSTEM TOTAL THROUGHPUT (1) SYSTEM CURTAILMENT TRANSPORTATION 22 CORE All End Uses NONCORE Industrial Non-EOR Cogeneration EOR Utility Electric Generation Subtotal NONCORE TOTAL TRANSPORTATION (1) Requirement forecast by end-use includes sales and transportation volumes California Gas Report
118 SAN DIEGO GAS & ELECTRIC COMPANY C A L I F O R N I A G A S R E P O R T SAN DIEGO GAS & ELECTRIC COMPANY 109
119 SAN DIEGO GAS & ELECTRIC COMPANY INTRODUCTION San Diego Gas & Electric Company (SDG&E) is a combined gas and electric distribution utility serving more than three million people in San Diego and the southern portions of Orange counties. SDG&E delivered natural gas to 870,000 customers in San Diego County in 2015, including power plants and turbines. Total gas sales and transportation through SDG&E s system for 2015 were approximately 120 billion cubic feet (Bcf), which is an average of 327 million cubic feet per day (MMcf/day). The Gas Supply, Capacity, and Storage section for SDG&E has been moved to SoCalGas due to the integration of gas procurement and system integration functions into one combined SDG&E/SoCalGas system per D (natural gas operations and service offerings) and D (system integration.) 110
120 GAS DEMAND SAN DIEGO GAS & ELECTRIC COMPANY OVERVIEW SDG&E s gas demand forecast is largely determined by the long-term economic outlook for its San Diego County service area. The county s economic trends are expected to generally parallel those of the larger SoCalGas area as discussed above. This projection of natural gas requirements, excluding electric generation (EG) demand, is derived from models that integrate demographic assumptions, economic growth, energy prices, energy efficiency programs, customer information programs, building and appliance standards, weather and other factors. Non-EG gas demand is projected to remain virtually flat between 2015 and Overall demand adjusted for average temperature conditions totaled 126 Bcf in By the year 2035, the total demand is expected to reach 115 Bcf. The change reflects an annual average decline of 0.40%. Assumptions for SDG&E's gas transportation requirements for EG are included as part of the wholesale market sector description for SoCalGas. ECONOMICS AND DEMOGRAPHICS San Diego County s total employment is forecasted to grow an average of 1.1% annually from 2016 to 2035; the subset of industrial (mining and manufacturing) jobs is projected to grow about 0.2% per year during the same period. From 2016 to 2035, the county s inflation-adjusted Gross Product is expected to grow at an average annual rate of 2.6%. (Gross Product is the local equivalent of national Gross Domestic Product, a measure of the total economic output of the area economy.) The number of SDG&E gas meters is expected to increase an average of 1.2% annually from 2016 through
121 SAN DIEGO GAS & ELECTRIC COMPANY 140 Composition of Natural Gas Throughput Average Temperature, Normal Year ( ) Bcf/Year Residential Core Non Residential Noncore Non EG EG MARKET SECTORS Residential The total residential customer count for SDG&E consists of four residential segment types. These are single family and multi-family customers, as well as master meter and submetered customers. The active meters for all residential customer classes averaged 839,947 in This total reflects a 4,194 meter increase relative to the 2014 total. Overall residential meter growth from was 0.50%. Residential demand adjusted for average temperature conditions totaled 31 Bcf in By the year 2035, the residential demand is expected to reach 34 Bcf. The change reflects a 0.45% average annual growth rate. The projected residential natural gas demand is influenced primarily by residential meter growth moderated by the forecasted declining use per customer due to energy efficiency improvements in building shell design, appliance efficiency and CPUC-authorized EE programs plus the additional efficiency gains associated with advanced metering. 112
122 Bcf SAN DIEGO GAS & ELECTRIC COMPANY Composition of SDG&E's Residential Demand Forecast ( ) Single Family Multi-Family Master Metered Sub-Metered Commercial On a temperature-adjusted basis, the core commercial demand in 2015 totaled 17 Bcf. By the year 2035, the SDG&E core commercial load is expected to decline to 14 Bcf. SDG&E s non-core commercial load in 2015 was 2 Bcf. Over the forecast period, gas demand in this market is projected to show moderate growth mostly driven by increased economic activity and employment. Non-core commercial load is projected to grow to 3 Bcf by 2035, an average annual increase of 1.5%. 113
123 SAN DIEGO GAS & ELECTRIC COMPANY SDG&E Commercial Natural Gas Demand Forecast Bcf/Year CORE COMMERCIAL NONCORE COMMERCIAL 114
124 SAN DIEGO GAS & ELECTRIC COMPANY Industrial In 2015, temperature-adjusted core industrial demand was 1.5 Bcf. The core industrial market demand is projected to decrease at an average rate of 1% per year from 1.5 Bcf in 2015 to 1.2 Bcf in This result is due to slightly lower forecasted growth in industrial production and the impact of savings from CPUC-authorized energy efficiency programs in the industrial sector SDG&E Industrial Natural Gas Demand Forecast (Bcf/Year) CORE INDUSTRIAL NONCORE INDUSTRIAL Non-core industrial load in 2015 was 2.2 Bcf and is expected to decline at an average rate of -1.6% per year to 1.6 Bcf by CPUC-mandated energy efficiency programs more than offset any modest gains from industrial economic growth. Electric Generation Total EG, including cogeneration and non-cogeneration EG, is expected to decrease at an annual average rate of 1.0% from 72 Bcf in 2015 to 58 Bcf in The following graph shows total EG forecasts for a normal hydro year and a 1-in-10 dry hydro year. 115
125 SAN DIEGO GAS & ELECTRIC COMPANY SDGE s Service Area Total Electric Generation Gas Demand Forecast (Bcf/Year) Base-Hydro Case 1-in-10 Dry Hydro Case Cogeneration Small Electric Generation load from self-generation totaled 16.2 Bcf in By 2035, small EG load is expected to rise to 18.5 Bcf growing an average of 0.7% per year reflecting economic growth. Non-Cogeneration Electric Generation The forecast of large EG loads in SDG&E s service area is based on the power market simulation noted in SoCalGas Electric Generation chapter for Non-Cogeneration EG demand. EG demand is forecasted to decrease from 51 Bcf in 2016 to 36 Bcf in This forecast includes approximately 800 MW of new thermal peaking generating resources in its service area by However, it also assumes that approximately 1,118 MW of the existing plants are retired during the same time period. The EG forecast is held constant at 2030 levels through 2035 as previously explained. A 1-in-10 year dry hydro sensitivity forecast has also been developed. A dry hydro year increases SDG&E s EG demand on average for the forecast period by approximately 4 Bcf per year. For additional information on EG assumptions, such as renewable generation, greenhouse gas adders and sensitivity to electric demand and attainment of renewables goals, refer to the Non-Cogeneration Electric Generation section of the SoCalGas Electric Generation chapter. 116
126 SAN DIEGO GAS & ELECTRIC COMPANY Natural Gas Vehicles (NGV) The NGV market is expected to continue to grow due to government (federal, state and local) incentives and regulations related to the purchase and operation of alternate fuel vehicles, growing numbers of natural gas engines and vehicles, and the cost differential between petroleum (gasoline and diesel) and natural gas. At the end of 2015, there were 34 compressed natural gas (CNG) fueling stations delivering 1.7 Bcf of natural gas during the year. The NGV market is expected to grow at an annual rate of 4.4% over the forecast period. ENERGY EFFICIENCY PROGRAMS Conservation and energy efficiency activities encourage customers to install energy efficient equipment and weatherization measures and adopt energy saving practices that result in reduced gas usage while still maintaining a comparable level of service. Conservation and energy efficiency load impacts are shown as positive numbers. The total net load impact is the natural gas throughput reduction resulting from the Energy Efficiency programs. The cumulative net load impact forecast from SDG&E s integrated gas and electric energy efficiency programs for selected years is shown in the graph below. The net load impact includes all Energy Efficiency programs, both gas and electric, that SDG&E has forecasted to be implemented beginning in year 2016 and occurring through the year Savings and goals for these programs are based on the program goals authorized by the Commission in D
127 SAN DIEGO GAS & ELECTRIC COMPANY SDG&E's Annual Energy Efficiency Cumulative Savings Goal (MMcf) Core Commercial and Industrial EE savings Noncore Commercial and Industrial EE Savings Residential EE Savings reported are for measures installed under SDG&E s gas and electric Energy Efficiency programs. Credit is only taken for measures that are installed as a result of SDG&E s Energy Efficiency programs, and only for the measure lives of the measures installed. 1 Measures with useful lives less than the forecast planning period fall out of the forecast when their expected life is reached. Naturally occurring conservation that is not attributable to SDG&E s Energy Efficiency activities is not included in the Energy Efficiency forecast. Notes: (1) Hard impacts include measures requiring a physical equipment modification or replacement. SDG&E does not include soft impacts, e.g., energy management services type measures. 118
128 GAS SUPPLY SAN DIEGO GAS & ELECTRIC COMPANY Beginning April 2008, gas supplies to serve both SoCalGas and SDG&E s retail core gas demand are procured with a combined SoCalGas/SDG&E portfolio per D December 6, Refer to the Gas Supply, Capacity and Storage section in the Southern California area for more information. 119
129 SAN DIEGO GAS & ELECTRIC COMPANY PEAK DAY DEMAND Since April 2008, gas supplies to serve both SoCalGas and SDG&E s retail core gas demand have been procured with a combined portfolio with a total firm storage withdrawal capacity designed to serve the utilities combined retail core peak-day gas demand. Please see the corresponding discussion of Peak Day Demand and Deliverability under the SoCalGas portion of this report for an illustration of how storage and flowing supplies can meet the growth in forecasted load for the combined (SoCalGas plus SDG&E) retail core peak day demand. 120
130 SAN DIEGO GAS & ELECTRIC COMPANY C A L I F O R N I A G A S R E P O R T SAN DIEGO GAS & ELECTRIC COMPANY TABULAR DATA 121
131 SAN DIEGO GAS & ELECTRIC COMPANY San Diego Gas and Electric Company Recorded Years Annual Gas Supply and Sendout (MMCF/Day) LINE Actual Deliveries by End-Use CORE Residential Commercial Industrial Subtotal - CORE NONCORE Commercial Industrial Non-EOR Cogen/EG Electric Utilities Subtotal - NONCORE WHOLESALE All End Uses Subtotal - Co Use & LUAF SYSTEM TOTAL THROUGHPUT Actual Transport & Exchange 13 CORE Residential Commercial NONCORE Industrial Non-EOR Cogen/EG Electric Utilities Subtotal - RETAIL WHOLESALE All End Uses TOTAL TRANSPORT & EX CHANGE Storage 21 Storage Injection Storage Withdrawal Actual Curtailment 23 Residential Com/Indl & Cogen Electric Generation TOTAL CURTAILMENT REFUSAL ACTUAL DELIVERIES BY END-USE includes sales and transportation volumes 122
132 SAN DIEGO GAS & ELECTRIC COMPANY San Diego Gas and Electric Company Recorded Years Annual Gas Supply Taken (MMCF/Day) LINE CAPACITY AVAILABLE 1 California Sources Out of State gas 2 California Offshore (POPCO/PIOC) 3 El Paso Natural Gas Company 4 Transwestern Pipeline company 5 Kern River/Mojave Pipeline Company 6 TransCanada GTN/PG&E 7 Other 8 TOTAL Output of State 9 Underground storage withdrawal 10 TOTAL Gas Supply available Gas Supply Taken California Source Gas 11 Regular Purchases Received for Exchange/Transport Total California Source Gas Purchases from Other Utilities Out-of-State Gas 15 Pacific Interstate Companies Additional Core Supplies Supplemental Supplies-Utility Out-of-State Transport-Others Total Out-of-State Gas TOTAL Gas Supply Taken & Transported
133 SAN DIEGO GAS & ELECTRIC COMPANY SAN DIEGO GAS & ELECTRIC COMPANY TABLE 1-SDGE ANNUAL GAS SUPPLY AND REQUIREMENTS - MMCF/DAY ESTIMATED YEARS 2016 THRU 2020 AVERAGE TEMPERATURE YEAR LINE LINE 1/ & 2/ CAPACITY AVAILABLE 1 California Source Gas Southern Zone of SoCalGas 1/ TOTAL CAPACITY AVAILABLE GAS SUPPLY TAKEN 4 California Source Gas Southern Zone of SoCalGas TOTAL SUPPLY TAKEN Net Underground Storage Withdrawal TOTAL THROUGHPUT REQUIREMENTS FORECAST BY END-USE 3/ 9 CORE 4/ Residential Commercial Industrial NGV Subtotal-CORE NONCORE Commercial Industrial Electric Generation (EG) Subtotal-NONCORE Co. Use & LUAF SYSTEM TOTAL THROUGHPUT TRANSPORTATION AND EXCHANGE 20 CORE All End Uses NONCORE Commercial/Industrial Electric Generation (EG) TOTAL TRANSPORTATION & EXCHANGE CURTAILMENT 24 Core Noncore TOTAL - Curtailment NOTES: 1/ Capacity to receive gas from the Southern Zone of SoCalGas is an annual value based on weighting winter and non-winter season values: 607 = (630 winter) x (151/365) + (590 non-winter) x (214/365). 2/ For 2010 and after, assume capacity at same levels. 3/ Requirement forecast by end-use includes sales, transportation, and exchange volumes. 4/ Core end-use demand exclusive of core aggregation transportation (CAT) in MDth/d:
134 SAN DIEGO GAS & ELECTRIC COMPANY SAN DIEGO GAS & ELECTRIC COMPANY TABLE 2-SDGE ANNUAL GAS SUPPLY AND REQUIREMENTS - MMCF/DAY ESTIMATED YEARS 2021 THRU 2035 AVERAGE TEMPERATURE YEAR LINE LINE 1/ & 2/ CAPACITY AVAILABLE 1 California Source Gas Southern Zone of SoCalGas 1/ TOTAL CAPACITY AVAILABLE GAS SUPPLY TAKEN 4 California Source Gas Out-of-State TOTAL SUPPLY TAKEN Net Underground Storage Withdrawal TOTAL THROUGHPUT REQUIREMENTS FORECAST BY END-USE 3/ 9 CORE 4/ Residential Commercial Industrial NGV Subtotal-CORE NONCORE Commercial Industrial Electric Generation (EG) Subtotal-NONCORE Co. Use & LUAF SYSTEM TOTAL THROUGHPUT TRANSPORTATION AND EXCHANGE 20 CORE All End Uses NONCORE Commercial/Industrial Electric Generation (EG) TOTAL TRANSPORTATION & EXCHANGE CURTAILMENT 24 Core Noncore TOTAL - Curtailment NOTES: 1/ Capacity to receive gas from the Southern Zone of SoCalGas is an annual value based on weighting winter and non-winter season values: 607 = (630 winter) x (151/365) + (590 non-winter) x (214/365). 2/ For 2010 and after, assume capacity at same levels. 3/ Requirement forecast by end-use includes sales, transportation, and exchange volumes. 4/ Core end-use demand exclusive of core aggregation transportation (CAT) in MDth/d:
135 SAN DIEGO GAS & ELECTRIC COMPANY SAN DIEGO GAS & ELECTRIC COMPANY TABLE 3-SDGE ANNUAL GAS SUPPLY AND REQUIREMENTS - MMCF/DAY ESTIMATED YEARS 2016 THRU 2020 COLD TEMPERATURE YEAR (1 IN 35 COLD YEAR EVENT) & DRY HYDRO YEAR LINE LINE 1/ & 2/ CAPACITY AVAILABLE 1 California Source Gas Southern Zone of SoCalGas 1/ TOTAL CAPACITY AVAILABLE GAS SUPPLY TAKEN 4 California Source Gas Out-of-State TOTAL SUPPLY TAKEN Net Underground Storage Withdrawal TOTAL THROUGHPUT REQUIREMENTS FORECAST BY END-USE 3/ 9 CORE 4/ Residential Commercial Industrial NGV Subtotal-CORE NONCORE Commercial Industrial Electric Generation (EG) Subtotal-NONCORE Co. Use & LUAF SYSTEM TOTAL THROUGHPUT TRANSPORTATION AND EXCHANGE 20 CORE All End Uses NONCORE Commercial/Industrial Electric Generation (EG) TOTAL TRANSPORTATION & EXCHANGE CURTAILMENT 24 Core Noncore TOTAL - Curtailment NOTES: 1/ Capacity to receive gas from the Southern Zone of SoCalGas is an annual value based on weighting winter and non-winter season values: 607 = (630 winter) x (151/365) + (590 non-winter) x (214/365). 2/ For 2010 and after, assume capacity at same levels. 3/ Requirement forecast by end-use includes sales, transportation, and exchange volumes. 4/ Core end-use demand exclusive of core aggregation transportation (CAT) in MDth/d:
136 SAN DIEGO GAS & ELECTRIC COMPANY SAN DIEGO GAS & ELECTRIC COMPANY TABLE 4-SDGE ANNUAL GAS SUPPLY AND REQUIREMENTS - MMCF/DAY ESTIMATED YEARS 2021 THRU 2035 COLD TEMPERATURE YEAR (1 IN 35 COLD YEAR EVENT) & DRY HYDRO YEAR LINE LINE 1/ & 2/ CAPACITY AVAILABLE 1 California Source Gas Southern Zone of SoCalGas 1/ TOTAL CAPACITY AVAILABLE GAS SUPPLY TAKEN 4 California Source Gas Out-of-State TOTAL SUPPLY TAKEN Net Underground Storage Withdrawal TOTAL THROUGHPUT REQUIREMENTS FORECAST BY END-USE 3/ 9 CORE 4/ Residential Commercial Industrial NGV Subtotal-CORE NONCORE Commercial Industrial Electric Generation (EG) Subtotal-NONCORE Co. Use & LUAF SYSTEM TOTAL THROUGHPUT TRANSPORTATION AND EXCHANGE 20 CORE All End Uses NONCORE Commercial/Industrial Electric Generation (EG) TOTAL TRANSPORTATION & EXCHANGE CURTAILMENT 24 Core Noncore TOTAL - Curtailment NOTES: 1/ Capacity to receive gas from the Southern Zone of SoCalGas is an annual value based on weighting winter and non-winter season values: 607 = (630 winter) x (151/365) + (590 non-winter) x (214/365). 2/ For 2010 and after, assume capacity at same levels. 3/ Requirement forecast by end-use includes sales, transportation, and exchange volumes. 4/ Core end-use demand exclusive of core aggregation transportation (CAT) in MDth/d:
137 SAN DIEGO GAS & ELECTRIC COMPANY This page has been intentionally left blank. 128
138 GLOSSARY C A L I F O R N I A G A S R E P O R T GLOSSARY 129
139 GLOSSARY GLOSSARY Average Day (Operational Definition) Annual gas sales or requirements assuming average temperature year conditions divided by 365 days. Average Temperature year Long-term average recorded temperature. BTU (British Thermal Unit) Unit of measurement equal to the amount of heat energy required to raise the temperature of one pound of water one degree Fahrenheit. This unit is commonly used to measure the quantity of heat available from complete combustion of natural gas. California-Source Gas 1. Regular Purchases All gas received or forecast from California producers, excluding exchange volumes. Also referred to as Local Deliveries. 2. Received for Exchange/Transport All gas received or forecast from California producers for exchange, payback, or transport. CEC California Energy Commission. CNG (Compressed Natural Gas) Fuel for natural gas vehicles, typically natural gas compressed to 3000 pounds per square inch. Cogeneration Simultaneous production of electricity and thermal energy from the same fuel source. Also used to designate a separate class of gas customers. Cold Temperature Year Cold design-temperature conditions based on long-term recorded weather data. Combined Heat and Power (CHP) Combined Heat and Power (CHP) is the sequential production of electricity and thermal energy from the same fuel source. Historically, CHP has been perceived as an efficient technology and is promoted in California as a preferred electric generation resource. Commercial (SoCalGas & SDG&E) Category of gas customers whose establishments consist of services, manufacturing nondurable goods, dwellings not classified as residential, and farming (agricultural). 130
140 GLOSSARY Commercial (PG&E) Non-residential gas customers not engaged in electric generation, enhanced oil recovery, or gas resale activities with usage less than 20,800 therms per month. Company Use Gas used by utilities for operational purposes, such as fuel for line compression and injection into storage. Conversion Factor (Natural Gas) 1 CF (Cubic Feet) = Approx. 1,000 BTUs 1 CCF = 100 CF = Approximately 1 Therm 1 Therm = 100,000 BTUs = Approximately 100 CF = 0.1 MCF 10 Therms = 1 Dth (dekatherm) = Approximately 1 MCF 1 MCF = 1,000 CF = Approximately 10 Therms = 1 MMBTU 1 MMCF = 1 million cubic feet = Approximately 1 MDth (1 thousand dekatherm) 1 BCF = 1 billion CF = Approximately 1 million MMBTU Conversion Factor (Petroleum Products) Approximate heat content of petroleum products (Million BTU per Barrel) Crude Oil Residual Fuel Oil Distillate Fuel Oil Petroleum Coke Butane Propane Pentane Plus Motor Gasoline Conversion Factor (LNG) Approximate LNG liquid conversion factor for one therm (High-Heat Value) Pounds Gallons Cubic Feet Barrels Cubic Meters Metric Tonnes Core Aggregator Individuals or entities arranging natural gas commodity procurement activities on behalf of core customers. Also, sometimes known as an Energy Service Provider (ESP), a Core Transport Agent (CTA), or a Retail Service Provider (RSP). 131
141 GLOSSARY Core customers (SoCalGas & SDG&E) All residential customers; all commercial and industrial customers with average usage less than 20,800 therms per month who typically cannot fuel switch. Also, those commercial and industrial customers (whose average usage is more than 20,800 therms per year) who elect to remain a core customer receiving bundled gas service from the LDC. Core Customer (PG&E) All customers with average usage less than 20,800 therms per month. Core Subscription Noncore customers who elect to use the LDC as a procurement agent to meet their commodity gas requirements. CPUC California Public Utilities Commission. Cubic Foot of Gas Volume of natural gas, which, at a temperature of 60º F and an absolute pressure of pounds per square inch, occupies one cubic foot. Curtailment Temporary suspension, partial or complete, of gas deliveries to a customer or customers. EG Electric generation (including cogeneration) by a utility, customer, or independent power producer. Energy Service Provider (ESP) Individuals or entities engaged in providing retail energy services on behalf of customers. ESP s may provide commodity procurement, but could also provide other services, e.g., metering and billing. Enhanced Oil Recovery (EOR) Injection of steam into oil-holding geologic zones to increase ability to extract oil by lowering its viscosity. Also used to designate a special category of gas customers. Exchange Delivery of gas by one party to another and the delivery of an equivalent quantity by the second party to the first. Such transactions usually involve different points of delivery and may or may not be concurrent. Exempt Wholesale Generators (EWG) A category of customers consuming gas for the purpose of generating electric power. FERC Federal Energy Regulatory Commission. 132
142 GLOSSARY Futures (Gas) Unit of natural gas futures contract trades in units of 10,000 million British thermal units (MMBtu) at the New York Mercantile Exchange (NYMEX). The price is based on delivery at Henry Hub in Louisiana. Gas Accord The Gas Accord is a multi-party settlement agreement, which restructured PG&E's gas transportation and storage services. The settlement was filed with the CPUC in August 1996, approved by the CPUC in August 1997 (D ) and implemented by PG&E in March In D , the CPUC ordered the Gas Accord structure to continue for 2004 and Key features of the Gas Accord structure include the following: unbundling of PG&E's gas transmission service and a portion of its storage service; placing PG&E at risk for transmission service and a portion of its storage service; placing PG&E at risk for transmission and storage costs and revenues; establishing firm, tradable transmission and storage rights; and establishing transmission and storage rates. Gas Sendout That portion of the available gas supply that is delivered to gas customers for consumption, plus shrinkage. GHG Greenhouse gases are the gases present in the atmosphere which reduce the loss of heat into space and therefore contribute to global temperatures through the greenhouse effect. The most the most abundant greenhouse gases are, in order of relative abundance are water vapor, carbon dioxide, methane, nitrous oxide, ozone and CFCs. Heating Degree Day (HDD) A heating degree day is accumulated for every degree Fahrenheit the daily average temperature is below a standard reference temperature (SoCalGas and SDG&E: 65ºF; PG&E 60ºF). A basis for computing how much electricity and gas are needed for space heating purposes. For example, for a 50ºF average temperature day, SoCalGas and SDG&E would accumulate 15 HDD, and PG&E would accumulate 10 HDD. Heating Value Number of BTU s liberated by the complete combustion at constant pressure of one cubic foot of natural gas at a base temperature of sixty degrees Fahrenheit (60 F) and a pressure base of fourteen and seventy-three hundredths (14.73) psia, with air at the same temperature and pressure as the natural gas, after the products of combustion are cooled to the initial temperature of natural gas, and after the water vapor of the combustion is condensed to the liquid state. The heating value of the natural gas shall be corrected for the water vapor content of the natural gas being delivered except that, if such content is seven (7) pounds or less per one million cubic feet, the natural gas shall be considered dry. 133
143 GLOSSARY Industrial (SoCalGas & SDG&E) Category of gas customers who are engaged in mining and in manufacturing durable goods. Industrial (PG&E) Non-residential customers not engaged in electric generation, enhanced oil recovery, or gas resale activities using more than 20,800 therms per month. LDC Local electric and/or natural gas distribution company. LNG (Liquefied Natural Gas) Natural gas that has been super cooled to -260 F (-162 C) and condensed into a liquid that takes up 600 times less space than in its gaseous state. Load Following A utility s practice of adding additional generation to available energy supplies to meet moment-to-moment demand in the distribution system served by the utility, and for keeping generating facilities informed of load requirements to insure that generators are producing neither too little nor too much energy to supply the utilities customers. MMBTU Million British Thermal Units. One MMBTU is equals to 10 therms or one dekatherm. MCF The volume of natural gas which occupies 1,000 cubic feet when such gas is at a temperature of 60º Fahrenheit and at a standard pressure of approximately 15 pounds per square inch. MMCF/DAY Million cubic feet of gas per day. NGV (Natural Gas Vehicle) Vehicle that uses CNG or LNG as its source of fuel for its internal combustion engine. Noncore Customers Commercial and industrial customers whose average usage exceeds 20,800 therms per month, including qualifying cogeneration and solar electric projects. Noncore customers assume gas procurement responsibilities and receive gas transportation service from the utility under firm or interruptible intrastate transmission arrangements. Non-Utility Served Load The volume of gas delivered directly to customers by an interstate or intrastate pipeline or other independent source instead of the local distribution company. Off-System Sales Gas sales to customers outside the utility s service area. 134
144 GLOSSARY Out-Of-State Gas Gas from sources outside the state of California. Priority of Service (SoCalGas & SDG&E) In the event of a curtailment situation, utilities curtail gas usage to customers based on the following end-use priorities: 1. Firm Service All noncore customers served through firm intrastate transmission service, including core subscription service. 2. Interruptible All noncore customers served through interruptible intrastate transmission service, including inter-utility deliveries. Priority of Service (PG&E) In the event of a curtailment situation, PG&E curtails gas usage to customers based on the following end-use priorities: 1. Core Residential 2. Non-residential Core 3. Noncore using firm backbone service (including UEG) 4. Noncore using as-available backbone service (including UEG) 5. Market Center Services PSIA PSEP Pounds per square inch absolute. Equal to gauge pressure plus local atmospheric pressure. Pipeline Safety Enhancement Plan. Purchase from Other Utilities Gas purchased from other utilities in California. Requirements Total potential demand for gas, including that served by transportation, assuming the availability of unlimited supplies at reasonable cost. Resale Gas customers who are either another utility or a municipal entity that, in turn, resells gas to end-use customers. Residential A category of gas customers whose dwellings are single-family units, multi-family units, mobile homes or other similar living facilities. Short-Term Supplies Gas purchased usually involving 30-day, short-term contract or spot gas supplies. Spot Purchases Short-term purchases of gas typically not under contract and generally categorized as surplus or best efforts. 135
145 GLOSSARY Storage Banking The direct use of local distribution company gas storage facilities by customers or other entities to store self-procured commodity gas supplies. Storage Injection Volume of natural gas injected into underground storage facilities. Storage Withdrawal Volume of natural gas taken from underground storage facilities. Supplemental Supplies A utility s best estimate for additional gas supplies that may be realized, from unspecified sources, during the forecast period. System Capacity or Normal System Capacity (Operational Definition) The physical limitation of the system (pipelines and storage) to deliver or flow gas to end-users. System Utilization or Nominal System Capacity (Operational Definition) The use of system capacity or nominal system capacity at less then 100 percent utilization. Take-or-Pay A term used to describe a contract agreement to pay for a product (natural gas) whether or not the product is delivered. Tariff TCF All rate schedules, sample forms, rentals, charges, and rules approved by regulatory agencies for used by the utility. Trillion cubic feet of gas. Therm A unit of energy measurement, nominally 100,000 BTUs. Total Gas Supply Available Total quantity of gas estimated to be available to meet gas requirements. Total Gas Supply Taken Total quantity of gas taken from all sources to meet gas requirements. Total Throughput Total gas volumes passing through the system including sales, company use, storage, transportation and exchange. Transportation Gas Non-utility-owned gas transported for another party under contractual agreement. 136
146 GLOSSARY UEG Utility electric generation. Unaccounted-For Gas received into the system but unaccounted for due to measurement, temperature, pressure, or accounting discrepancies. Unbundling The separation of natural gas utility services into its separate service components such as gas procurement, transportation, and storage with distinct rates for each service. WACOG Weighted average cost of gas. Wholesale A category of customer, either a utility or municipal entity, that resells gas. Wobbe The Wobbe number of a fuel gas is found by dividing the high heating value of the gas in BTU per standard cubic feet (scf) by the square root of a specific gravity with respect to air. The higher a gases Wobbe number, the greater the heating value of the quality of gas that will flow through a hole of a given size in a given amount of time. 137
147 GLOSSARY This page has been intentionally left blank. 138
148 GLOSSARY C A L I F O R N I A G A S R E P O R T RESPONDENTS 139
149 GLOSSARY RESPONDENTS The following utilities have been designated by the California Public Utilities Commission as respondents in the preparation of the California Gas Report. Pacific Gas and Electric Company San Diego Gas and Electric Company Southern California Gas Company The following utilities also cooperated in the preparation of the report. City of Long Beach Municipal Gas and Oil Department Sacramento Municipal Utilities District Southern California Edison Company Southwest Gas Corporation ECOGAS Mexico, S. de R.L. de C.V. A statewide committee has been formed by the respondents and cooperating utilities to prepare this report. The following individuals served on this committee. Working Committee Rose-Marie Payan (Chairperson)-SoCalGas/SDG&E Sharim Chaudhury- SoCalGas/SDG&E Igor Grinberg- PG&E Ipek Connolly- PG&E Jeff Huang SoCalGas/SDG&E Michelle Clay-Ijomah-SDG&E Eric Hsu-PG&E Anthony Dixon- CEC Angela Tanghetti CEC Observers Richard Myers CPUC Energy Division Matthew Karle- CPUC Energy Division 140
150 GLOSSARY RESERVE YOUR SUBSCRIPTION 2017 CALIFORNIA GAS REPORT SUPPLEMENT Southern California Gas Company 2015 CGR Reservation Form Box 3249, Mail Location GT14D6 Los Angeles, CA or Fax: (213) Sharim Chaudhury Send me a 2017 CGR Supplement New subscriber Change of address Company Name: C/O: Address: City: State: Zip: Phone: ( ) Fax: ( ) Also, please visit our website at:
151 GLOSSARY RESERVE YOUR SUBSCRIPTION 2017 CALIFORNIA GAS REPORT SUPPLEMENT Pacific Gas and Electric Company 2017 CGR Reservation Form Mail Code B10B P. O. Box San Francisco, CA or Send me a 2017 CGR Supplement New subscriber Change of address Company Name: C/O: Address: City: State: Zip: Phone: ( ) Fax: ( ) Please visit our website for digital copies of this and past reports: 142
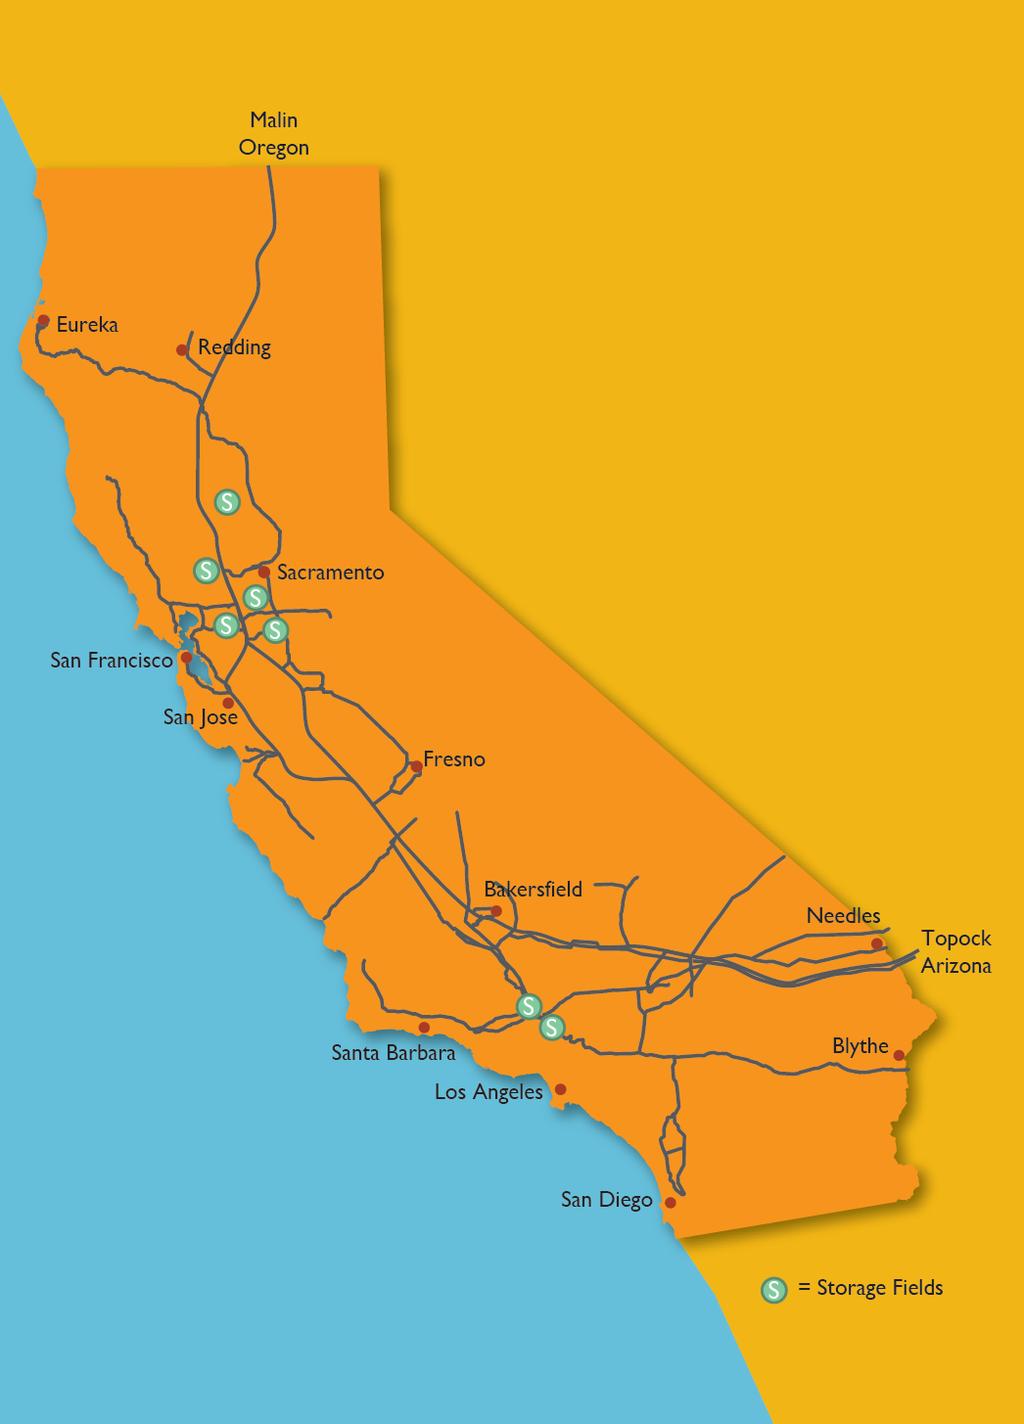
152 S
2008 California Gas Report. Prepared by the California Gas and Electric Utilities
 2008 California Gas Report Prepared by the California Gas and Electric Utilities 2008 CALIFORNIA GAS REPORT PREPARED BY THE CALIFORNIA GAS AND ELECTRIC UTILITIES Southern California Gas Company Pacific
2000 California Gas Report P R E PA R E D B Y THE C A L I F O R N I A G A S U T I L I TIES
 2000 California Gas Report P R E PA R E D B Y THE C A L I F O R N I A G A S U T I L I TIES 2000 CALIFORNIA GAS REPORT Table of Contents Page No. FOREWORD...3 EXECUTIVE SUMMARY...7 Demand Outlook...7 Gas
1998 California Gas Report PREPARED BY THE CALIFORNIA GAS AND ELECTRIC UTILITIES
 1998 California Gas Report PREPARED BY THE CALIFORNIA GAS AND ELECTRIC UTILITIES i ii 1998 CALIFORNIA GAS REPORT Table of Contents Page No. FOREWORD... 1 EXECUTIVE SUMMARY... 5 Demand Outlook... 7 Gas
PREPARED DIRECT TESTIMONY OF BRUCE M. WETZEL SOUTHERN CALIFORNIA GAS COMPANY AND SAN DIEGO GAS & ELECTRIC COMPANY
 Application No: A.1-0- Exhibit No.: Witness: Bruce M. Wetzel Application of Southern California Gas Company (U 0 G) and San Diego Gas & Electric Company (U 0 G) for Authority to Revise their Natural Gas
Analysis of California Natural Gas Market, Supply Infrastructure, Regulatory Implications, and Future Market Conditions. CIEE Subcontract No.
 Analysis of California Natural Gas Market, Supply Infrastructure, Regulatory Implications, and Future Market Conditions CIEE Subcontract No. MNG-07 07-0101 Natural Gas Storage Forum: Modeling of Natural
PREPARED DIRECT TESTIMONY OF JEFF HUANG SAN DIEGO GAS & ELECTRIC COMPANY AND SOUTHERN CALIFORNIA GAS COMPANY
 Application No: A.1-0- Exhibit No.: Witness: Jeff Huang Application of Southern California Gas Company (U 0 G) and San Diego Gas & Electric Company (U 0 G) for Authority to Revise their Natural Gas Rates
) ) ) ) ) ) ) ) UPDATED DIRECT TESTIMONY OF DAVID M. BISI SAN DIEGO GAS & ELECTRIC COMPANY AND SOUTHERN CALIFORNIA GAS COMPANY
 ) ) ) ) ) ) ) UPDATED DIRECT TESTIMONY OF DAVID M. BISI SAN DIEGO GAS & ELECTRIC COMPANY AND SOUTHERN CALIFORNIA GAS COMPANY") Application No: A.1-1-01xxx Exhibit No.: Witness: David M. Bisi Application of Southern California Gas Company (U 0 G) and San Diego Gas & Electric Company (U 0 G) For Authority To Recover North-South
Application No: A.1-1-01xxx Exhibit No.: Witness: David M. Bisi Application of Southern California Gas Company (U 0 G) and San Diego Gas & Electric Company (U 0 G) For Authority To Recover North-South
) ) UPDATED PREPARED DIRECT TESTIMONY OF BRUCE M. WETZEL SAN DIEGO GAS & ELECTRIC COMPANY AND SOUTHERN CALIFORNIA GAS COMPANY
 ) UPDATED PREPARED DIRECT TESTIMONY OF BRUCE M. WETZEL SAN DIEGO GAS & ELECTRIC COMPANY AND SOUTHERN CALIFORNIA GAS COMPANY") Application No: A.--00 Exhibit No.: Witness: Bruce M. Wetzel ) In the Matter of the Application of San Diego Gas & ) Electric Company (U 0 G) and Southern California ) Gas Company (U 0 G) for Authority
Application No: A.--00 Exhibit No.: Witness: Bruce M. Wetzel ) In the Matter of the Application of San Diego Gas & ) Electric Company (U 0 G) and Southern California ) Gas Company (U 0 G) for Authority
) ) SUPPLEMENTAL DIRECT TESTIMONY OF DAVID BISI SAN DIEGO GAS & ELECTRIC COMPANY AND SOUTHERN CALIFORNIA GAS COMPANY
 ) SUPPLEMENTAL DIRECT TESTIMONY OF DAVID BISI SAN DIEGO GAS & ELECTRIC COMPANY AND SOUTHERN CALIFORNIA GAS COMPANY") Application No: A. 11-11-00 Exhibit No.: Witness: David Bisi ) In the Matter of the Application of San Diego Gas & ) Electric Company (U 90 G) and Southern California ) Gas Company (U 90 G) for Authority
Application No: A. 11-11-00 Exhibit No.: Witness: David Bisi ) In the Matter of the Application of San Diego Gas & ) Electric Company (U 90 G) and Southern California ) Gas Company (U 90 G) for Authority
) ) ) ) ) ) ) ) DIRECT TESTIMONY OF DAVID M. BISI SAN DIEGO GAS & ELECTRIC COMPANY AND SOUTHERN CALIFORNIA GAS COMPANY
 ) ) ) ) ) ) ) DIRECT TESTIMONY OF DAVID M. BISI SAN DIEGO GAS & ELECTRIC COMPANY AND SOUTHERN CALIFORNIA GAS COMPANY") Application No: A.1-1-xxx Exhibit No.: Witness: David M. Bisi Application of Southern California Gas Company (U 0 G) and San Diego Gas & Electric Company (U 0 G) For Authority To Recover North-South Project
Application No: A.1-1-xxx Exhibit No.: Witness: David M. Bisi Application of Southern California Gas Company (U 0 G) and San Diego Gas & Electric Company (U 0 G) For Authority To Recover North-South Project
Outlook for Western U.S. Natural Gas Markets
 Outlook for Western U.S. Natural Gas Markets Summer Energy Outlook Conference April, Contact: Kevin R. Petak Vice President, Gas Market Modeling ICF International 73-1 1-753753 kpetak@icfi.com ICF International.
SAN DIEGO GAS & ELECTRIC COMPANY SOUTHERN CALIFORNIA GAS COMPANY PIPELINE SAFETY & RELIABILITY PROJECT (PSRP) (A ) (DATA REQUEST ORA-68)
 (A ) (DATA REQUEST ORA-68)") PRELIMINARY STATEMENT 1. These responses and objections are made without prejudice to, and are not a waiver of, SDG&E and SoCalGas right to rely on other facts or documents in these proceedings. 2. By
PRELIMINARY STATEMENT 1. These responses and objections are made without prejudice to, and are not a waiver of, SDG&E and SoCalGas right to rely on other facts or documents in these proceedings. 2. By
Jim Cleary President, El Paso Western Pipelines. Platts Conference, Rockies Gas & Oil April 25, 2008
 Jim Cleary President, El Paso Western Pipelines Platts Conference, Rockies Gas & Oil April 25, 2008 Cautionary Statement Regarding Forward-looking Statements This presentation includes forward-looking
PREPARED DIRECT TESTIMONY OF ROSE-MARIE PAYAN SAN DIEGO GAS & ELECTRIC COMPANY AND SOUTHERN CALIFORNIA GAS COMPANY
 Application No: A.1-0- Exhibit No.: Witness: Rose-Marie Payan Application of Southern California Gas Company (U 0 G) and San Diego Gas & Electric Company (U 0 G) for Authority to Revise their Natural Gas
PREPARED DIRECT TESTIMONY OF BETH MUSICH SAN DIEGO GAS & ELECTRIC COMPANY AND SOUTHERN CALIFORNIA GAS COMPANY
 Application No: Exhibit No.: Witness: A.-- Beth Musich ) In the Matter of the Application of San Diego Gas & ) Electric Company (U 0 G) and Southern California ) Gas Company (U 0 G) for Authority to Revise
CHAPTER 6 - Load Forecast & Resource Plan
 CHAPTER 6 - Load Forecast & Resource Plan Introduction This Chapter describes the electric resource portfolio that may be acquired to meet the energy requirements of MBCP customers. The following overarching
Assessment of California Natural Gas and Electricity Markets
 Assessment of California Natural Gas and Electricity Markets Prepared for: Valley Center Municipal Water District 29300 Valley Center Rd Valley Center, CA 921082-0067 By: Lon W. House, Ph.D. Water and
California s Renewable Portfolio Standard
 California s Renewable Portfolio Standard Northwest Power and Conservation Council California Power Markets Symposium September 5, 2013 William A. Monsen MRW & Associates, LLC Oakland, California wam@mrwassoc.comcom
Energy Storage Standards, Conformance and Technology
 Energy Storage Standards, Conformance and Technology Creating Storage Policy for Decarbonization, Affordability, Safety and Reliability: The California Experience Diane I. Fellman, Esq. Senior Policy Analyst
New England Electricity Outlook
 O C T O B E R 2 1, 2 0 1 6 S O U T H P O R T L A N D, M E New England Electricity Outlook Environmental and Energy Technology Council of Maine (E2Tech) Eric Johnson D I R E C T O R, E X T E R N A L A F
PREPARED DIRECT TESTIMONY OF GWEN MARELLI SOUTHERN CALIFORNIA GAS COMPANY AND SAN DIEGO GAS & ELECTRIC COMPANY
 Application No: A.1-0- Exhibit No.: Witness: Gwen Marelli Application of Southern California Gas Company (U 0 G) and San Diego Gas & Electric Company (U 0 G) for Authority to Revise their Natural Gas Rates
BC Hydro Renewable Generation Market Competitiveness Report
 BUILDING A WORLD OF DIFFERENCE BC Hydro FINAL REPORT B&V Project Number: 172047 July 2011 Black & Veatch Corporation 11401 Lamar Avenue Overland Park, Kansas 66211 Tel: (913) 458 2000 www.bv.com Table
Natural Gas Next: The Rockies and the West
 Natural Gas Next: The Rockies and the West Callie Kolbe, Manager, Energy Analysis Sadie Fulton, Senior Energy Analyst September 25, 2017 Jordan Cove Back again? There is even more gas? NIMBY! Renewable
SOCALGAS REBUTTAL TESTIMONY OF MARTIN LAZARUS (GAS PROCUREMENT) JUNE 18, 2018
 JUNE 18, 2018") Company: Southern California Gas Company (U0G) Proceeding: 0 General Rate Case Application: A.-0-00/-00 (cons.) Exhibit: SCG- SOCALGAS REBUTTAL TESTIMONY OF MARTIN LAZARUS (GAS PROCUREMENT) JUNE, 0 BEFORE
Company: Southern California Gas Company (U0G) Proceeding: 0 General Rate Case Application: A.-0-00/-00 (cons.) Exhibit: SCG- SOCALGAS REBUTTAL TESTIMONY OF MARTIN LAZARUS (GAS PROCUREMENT) JUNE, 0 BEFORE
Forecasts and Assumptions for IRP. Prepared for PNM September 2016
 Forecasts and Assumptions for IRP Prepared for PNM September 2016 Answers for infrastructure and cities. Pace Global Disclaimer This Report was produced by Pace Global, a Siemens business ( Pace Global
The Transformation of the New England Electric Grid and the Importance of Situational Awareness Tools
 SEPTEMBER 26, 2017 SPRINGFIELD, MA The Transformation of the New England Electric Grid and the Importance of Situational Awareness Tools North American SynchroPhasor Initiative NASPI Work Group Meeting
Major Changes in Natural Gas Transportation Capacity,
 Major Changes in Natural Gas Transportation, The following presentation was prepared to illustrate graphically the areas of major growth on the national natural gas pipeline transmission network between
SB 843 (WOLK) Community Based Renewable Energy Self Generation Program. Utility & Policy Maker Frequently Asked Questions
 Community Based Renewable Energy Self Generation Program. Utility & Policy Maker Frequently Asked Questions") SB 843 (WOLK) Community Based Renewable Energy Self Generation Program Utility & Policy Maker Frequently Asked Questions What problem is SB 843 addressing? Access to renewable energy. The bill allows for
SB 843 (WOLK) Community Based Renewable Energy Self Generation Program Utility & Policy Maker Frequently Asked Questions What problem is SB 843 addressing? Access to renewable energy. The bill allows for
Recommendations on the TPP policy and economic assessment by TPP topic
 Public Advocates Office California Public Utilities Commission 505 Van Ness Avenue San Francisco, California 94102 Tel: 415-703-1584 www.publicadvocates.cpuc.ca.gov COMMENTS OF THE PUBLIC ADVOCATES OFFICE
Exploring the Impacts of California s Renewable Portfolio Standard
 Exploring the Impacts of California s Renewable Portfolio Standard System Planning Committee April 2010 Table of Contents Purpose... 1 Vocabulary... 1 System Planning Committee s Initial Assessment...
Ruby Pipeline Project
 Ruby Pipeline Project Ed Miller Ruby Project Manager October 21, 2008 El Paso Pipeline System Ruby Pipeline CIG & WIC Tennessee Gas Pipeline Mojave Pipeline El Paso Natural Gas Cheyenne Plains Pipeline
SAN DIEGO GAS & ELECTRIC COMPANY SOUTHERN CALIFORNIA GAS COMPANY
 PRELIMINARY STATEMENT 1. These responses and objections are made without prejudice to, and are not a waiver of, SDG&E and SoCalGas right to rely on other facts or documents in these proceedings. 2. By
ISO Transmission Planning Process. Supplemental Sensitivity Analysis: Benefits Analysis of Large Energy Storage
 ISO 2016-2017 Transmission Planning Process Supplemental Sensitivity Analysis: Benefits Analysis of Large Energy Storage January 4, 2018 Contents 1. Introduction... 1 2. Background... 1 3. Objectives of
BEFORE THE PUBLIC UTILITIES COMMISSION OF THE STATE OF CALIFORNIA
 BEFORE THE PUBLIC UTILITIES COMMISSION OF THE STATE OF CALIFORNIA Application of Southern California Gas Company (U904G) and San Diego Gas & Electric Company (U902G) for Low Operational Flow Order and
Making Sense of U.S. Energy Markets
 Making Sense of U.S. Energy Markets National Conference of State Legislators Task Force on Energy Supply Philip Pettingill, Director Regional Integration January 14, 2017 Two-thirds of the United States
Kern River Gas Transmission Company. Customer Meetings 2018
 Kern River Gas Transmission Company Customer Meetings 2018 1 Exceptional Businesses and Assets 11.6 million customers worldwide Top-rated service provider within the industry 22,700 employees worldwide
California s Renewable Portfolio Standard Program
 California s Renewable Portfolio Standard Program By Annette Faraglia PG&E Law Dept. 2009 Annual NHA Conference Washington, D.C. May 12, 2009 California s Renewable Portfolio Standard ( RPS ) is one of
Renewable Rules and Markets: A California Perspective October 2, 2008
 Renewable Rules and Markets: A California Perspective October 2, 2008 Nancy Ryan Chief of Staff, Office of Commissioner Peevey California Public Utilities Commission Outline Renewable energy incentives
U.S. Regional Approaches to Energy Policy and CO 2 Mitigation
 U.S. Regional Approaches to Energy Policy and CO 2 Mitigation The California Experience Tom Bottorff Senior Vice President, Regulatory Affairs Pacific Gas and Electric Company May 13, 2014 Topics for Discussion
Integrating Renewables into the Power Grid
 Integrating Renewables into the Power Grid An Overview by Barney Speckman November 2010 Energy Solutions Overview Why do we have to integrate renewables What is meant by integrating renewables How does
Comparative Costs of Geothermal, Solar, and Wind Generation Based on California Independent System Operator Electricity Market Data
 GRC Transactions, Vol. 41, 2017 Comparative Costs of Geothermal, Solar, and Wind Generation Based on California Independent System Operator Electricity Market Data Ian Warren U.S. Geothermal Inc. Keywords
PREPARED DIRECT TESTIMONY OF MARJORIE SCHMIDT-PINES SOUTHERN CALIFORNIA GAS COMPANY AND SAN DIEGO GAS & ELECTRIC COMPANY
 Application No: A.1-0- Exhibit No.: Witness: Marjorie Schmidt-Pines Application of Southern California Gas Company (U 0 G) and San Diego Gas & Electric Company (U 0 G) for Authority to Revise their Natural
The Impact of Developing Energy and Environmental Policy on the Gas Industry Plus Impacts of the Current Economic State
 The Impact of Developing Energy and Environmental Policy on the Gas Industry Plus Impacts of the Current Economic State Gas / Electric Partnership Conference XVII Gas Compression from Production thru Transmission
California ISO Summer Loads and Resources Operations Assessment April 10, Grid Assets California ISO Version 3.0.
 California Independent System Operator Corporation 2006 Summer Loads and Resources Operations Assessment April 10, 2006 Grid Assets Version 3.0 Table of Contents I. Executive Summary...2 Table 1 2006 ISO
The CCA Handbook. A Guide to Conducting Business with Southern California Edison under Community Choice Aggregation. Version 3.
 The CCA Handbook A Guide to Conducting Business with Southern California Edison under Community Choice Aggregation Version 3.0 February 1, 2017 Welcome Preface Chapter 1: Chapter 2: Chapter 3: Chapter
Power Integrated Resource Plan PWP Presentation
 Power Integrated Resource Plan PWP Presentation Community Meeting #1 Pasadena Central Library July 18, 2018 POWER INTEGRATED RESOURCES PLAN: PWP PWP ACCOMPLISHMENTS & PROGRAMS 2 Renewable and Coal Annual
With funding provided by the US Department of Energy, NREL, and the Utah Office of Energy Development
 With funding provided by the US Department of Energy, NREL, and the Utah Office of Energy Development www.fourcornerswind.org Photo courtesy of Avangrid Renewables, LLC UNDERSTANDING REGIONAL ELECTRICITY
From Restructuring to Decarbonization: Operational and Market-Design Challenges in New England
 SEPTEMBER 25, 2018 WASHINGTON, DC From Restructuring to Decarbonization: Operational and Market-Design Challenges in New England USAEE/IAEE North American Conference Evolving Energy Realities Gordon van
Western Energy Imbalance Market and Regional Initiatives
 Western Energy Imbalance Market and Regional Initiatives Presentation to mid-c Seminar Don Fuller Director Strategic Alliances July 27, 2016 Today s topics Renewable portfolio continues to grow Energy
ISO New England Regional Electricity Outlook
 F E B R U A R Y 7, 2 0 1 7 B E R L I N, C T ISO New England Regional Electricity Outlook Association of Energy Engineers, Connecticut Chapter Stephen J. Rourke V I C E P R E S I D E N T, S Y S T E M P
Implications of Policy-Driven Residential Electrification
 ENERGY Implications of Policy-Driven Residential Electrification An American Gas Association Study prepared by ICF July 2018 IMPORTANT NOTICE: This is an American Gas Association (AGA) Study. The analysis
2018 Summer Loads and Resources Assessment
 May 9, 2018 Table of Contents I. EXECUTIVE SUMMARY... 2 II. SUMMER 2017 REVIEW... 11 Demand... 11 Generation... 12 Interchange... 12 III. SUMMER 2018 ASSESSMENT... 14 CAISO Loads... 14 Hydro Generation...
ATTACHMENT A. Alternative LSE Plan. Solana Energy Alliance 2018 INTEGRATED RESOURCE PLAN
 ATTACHMENT A Alternative LSE Plan Solana Energy Alliance 2018 INTEGRATED RESOURCE PLAN 1 Table of Contents Executive Summary... 3 Background... 3 Conforming Portfolio... 3 Action Plan... 5 Study Design...
ELECTRICITY TRADE AGREEMENT. An Assessment of the Ontario-Quebec Electricity Trade Agreement
 ELECTRICITY TRADE AGREEMENT An Assessment of the Ontario-Quebec Electricity Trade Agreement Spring 2018 About this Document Established by the Financial Accountability Officer Act, 2013, the Financial
From: Keith Casey, Vice President, Market and Infrastructure Development
 California Independent System Operator Corporation Memorandum To: ISO Board of Governors From: Keith Casey, Vice President, Market and Infrastructure Development Date: August 18, 2011 Re: Briefing on Renewable
Impact of Regional Greenhouse Gas Initiative and Renewable Portfolio Standards on Power System Planning
 Impact of Regional Greenhouse Gas Initiative and Renewable Portfolio Standards on Power System Planning Panel on Impacts of GHG Programs and Markets on the Power Industry PESGM2006 Montreal June 21, 2006
CAISO Generator Deliverability Assessment Methodology. On-Peak Deliverability Assessment Methodology (for Resource Adequacy Purposes)
") Background On-Peak Deliverability Assessment Methodology (for Resource Adequacy Purposes) The CAISO s deliverability study methodology for resource adequacy purposes was discussed extensively in the CPUC
Background On-Peak Deliverability Assessment Methodology (for Resource Adequacy Purposes) The CAISO s deliverability study methodology for resource adequacy purposes was discussed extensively in the CPUC
C9-19. Slide 1. markets later in the presentation.
 C9-19 Slide 1 Mr. Chairman, Commissioners. Today I am pleased to present the Office of Enforcement's Winter 2011-2012 Energy Market Assessment. The Winter Energy Assessment is staff's opportunity to share
Gas RateFinder. II - Noncore Gas Rates Customer-Procured Gas Franchise Fee Schedule G-SUR*...10
 January 2019 Volume 47-G, No. 1 The is produced by Pacific Gas and Electric Company s Customer Proceeding and Department as a quick reference to most PG&E gas rates, for both PG&E employees and customers.
Gas RateFinder. II - Noncore Gas Rates Customer-Procured Gas Franchise Fee Schedule G-SUR*...10
 March 2019 Volume 47-G, No. 3 The is produced by Pacific Gas and Electric Company s Customer Proceeding and Department as a quick reference to most PG&E gas rates, for both PG&E employees and customers.
Gas RateFinder. II - Noncore Gas Rates Customer-Procured Gas Franchise Fee Schedule G-SUR*...10
 December 2018 Volume 46-G, No. 12 The is produced by Pacific Gas and Electric Company s Customer Proceeding and Department as a quick reference to most PG&E gas rates, for both PG&E employees and customers.
Balancing Energy Needs with Environmental Goals: The
 Balancing Energy Needs with Environmental Goals: The Case of California Frank A. Wolak Department of Economics Stanford University Stanford, CA 94305-6072 wolak@zia.stanford.edu http://www.stanford.edu/~wolak
MACRO OVERVIEW OF DESERT SOUTHWEST POWER MARKET - CHALLENGES AND OPPORTUNITIES
 Power Task Force Agenda Number 4. MACRO OVERVIEW OF DESERT SOUTHWEST POWER MARKET - CHALLENGES AND OPPORTUNITIES CENTRAL ARIZONA PROJECT POWER TASK FORCE MEETING MAY 18, 2017 DALE PROBASCO MANAGING DIRECTOR
Gas RateFinder. II - Noncore Gas Rates Customer-Procured Gas Franchise Fee Schedule G-SUR*...10
 July 2018 Volume 46-G, No. 7 The Gas RateFinder is produced by Pacific Gas and Electric Company s Customer Proceeding and Department as a quick reference to most PG&E gas rates, for both PG&E employees
Gas RateFinder. II - Noncore Gas Rates Customer-Procured Gas Franchise Fee Schedule G-SUR*...10
 September 2018 Volume 46-G, No. 9 The Gas RateFinder is produced by Pacific Gas and Electric Company s Customer Proceeding and Department as a quick reference to most PG&E gas rates, for both PG&E employees
Gas RateFinder. II - Noncore Gas Rates Customer-Procured Gas Franchise Fee Schedule G-SUR*...10
 November 2018 Volume 46-G, No. 11 The Gas RateFinder is produced by Pacific Gas and Electric Company s Customer Proceeding and Department as a quick reference to most PG&E gas rates, for both PG&E employees
Senate Bill 350 Study
 Senate Bill 350 Study Volume VII: Ratepayer Impact Analysis PREPARED FOR PREPARED BY July 8, 2016 Senate Bill 350 Study The Impacts of a Regional ISO-Operated Power Market on California List of Report
A Natural Gas Primer. California Women in Energy Women EmPOWERED Energy Forum December 12, 2016
 A Natural Gas Primer California Women in Energy Women EmPOWERED Energy Forum December 12, 2016 Overview Natural Gas Basics California Natural Gas Infrastructure California Supply & Demand Natural Gas Regulation
THERMAL ENERGY STORAGE AS AN ENABLING TECHNOLOGY FOR RENEWABLE ENERGY
 THERMAL ENERGY STORAGE AS AN ENABLING TECHNOLOGY FOR RENEWABLE ENERGY Paul Denholm National Renewable Energy Laboratory 1617 Cole Blvd. Golden, CO, USA e-mail: paul.denholm@nrel.gov Sean Ong National Renewable
California ISO 2009 Annual Report on Market Issues and Performance
 California Independent System Operator Corporation California ISO 2009 Annual Report on Market Issues and Performance Special Revised Executive Summary June 30, 2010 Prepared by: Department of Market Monitoring
2017 Long-term Outlook. Information Session July 25, 2017
 2017 Long-term Outlook Information Session July 25, 2017 0 Welcome Overview of 2017 Long-term Outlook (2017 LTO) Questions will be answered at the end of the presentation Please use microphone when asking
Energy and Natural Resources
 Energy and Natural Resources 7.1 Introduction This chapter evaluates the potential impacts of the proposed project s Technology and Marine Terminal Alternatives and a No-Action Alternative, as well as
2017 Energy Preview. What to expect in Gene Beck, CEM, CLP Executive Director
 2017 Energy Preview What to expect in 2017 Gene Beck, CEM, CLP Executive Director Impact of The Election House Before House After [PERCENTA GE] [PERCENTA GE] Dems Reps [PERCENTA GE] [PERCENTA GE] Dems
Reduced Network Modeling of WECC as a Market Design Prototype
 PAPER 2011GM0942 1 Reduced Network Modeling of WECC as a Market Design Prototype James E. Price, Member, IEEE, and John Goodin Abstract California s administration, legislature, and energy regulators have
2018 Customer Forum. May 9, 2018
 2018 Customer Forum May 9, 2018 5/9/2018 Agenda Introductions Antitrust Disclaimer High OFO Review Low OFO Review System Reliability Support Activity Results Post Forum Report / Next Steps 2 Antitrust
) ) ) ) ) ) PREPARED DIRECT TESTIMONY OF STEVE WATSON SOUTHERN CALIFORNIA GAS COMPANY AND SAN DIEGO GAS & ELECTRIC COMPANY
 ) ) ) ) ) PREPARED DIRECT TESTIMONY OF STEVE WATSON SOUTHERN CALIFORNIA GAS COMPANY AND SAN DIEGO GAS & ELECTRIC COMPANY") Application No: A.14-06- Exhibit No.: Witness: Steve Watson Application of Southern California Gas Company (U 904 G) and San Diego Gas & Electric Company (U 902 G) for Low Operational Flow Order and Emergency
Application No: A.14-06- Exhibit No.: Witness: Steve Watson Application of Southern California Gas Company (U 904 G) and San Diego Gas & Electric Company (U 902 G) for Low Operational Flow Order and Emergency
Western Electricity Coordinating Council Regional Planning Project Review Loads and Resources Working Group
 Western Electricity Coordinating Council Regional Planning Project Review Loads and Resources Working Group Demand Analysis of 215 Scenarios To Explore the Range of Need for a Canada/Pacific Northwest
BEFORE THE PUBLIC UTILITIES COMMISSION OF THE STATE OF CALIFORNIA COMMENTS OF THE CALIFORNIA INDEPENDENT SYSTEM OPERATOR
 BEFORE THE PUBLIC UTILITIES COMMISSION OF THE STATE OF CALIFORNIA Order Instituting Rulemaking to Assess Peak Electricity Usage Patterns and Consider Appropriate Time Periods for Future Time-of- Use Rates
Re: Base Case and Alternative Renewable Resource Portfolios for the CAISO Transmission Planning Process
 STATE OF CALIFORNIA EDMUND G. BROWN JR., Governor PUBLIC UTILITIES COMMISSION CALIFORNIA ENERGY COMMISSION 505 VAN NESS AVENUE 1516 NINTH STREET SAN FRANCISCO, CA 94102-3298 SACRAMENTO, CA 95814-5512 February
Presentation to Lafayette City Council. Amy Dao Community Energy Manager Jan. 26, 2015
 Presentation to Lafayette City Council Amy Dao Community Energy Manager Jan. 26, 2015 CA s Renewable Portfolio Standard (RPS) Established in 2002; expanded in 2006 and 2011 Requires all utilities to procure
Making the Case for Energy Efficiency Policy Support: Results from the EPA / DOE Energy Efficiency Benefits Calculator
 Making the Case for Energy Efficiency Policy Support: Results from the EPA / DOE Energy Efficiency Benefits Calculator Snuller Price, Energy and Environmental Economics, Inc. Katrina Pielli and Stacy Angel,
Powering California Forward
 1 Powering California Forward CPUC Thought Leaders Series Fong Wan Senior Vice President, Energy Procurement Pacific Gas and Electric Company Source of Presentation California, Name of Presentation Outlier
California ISO. Q Report on Market Issues and Performance. November 1, Department of Market Monitoring
 California Independent System Operator Corporation California ISO Q3 2018 Report on Market Issues and Performance November 1, 2018 Department of Market Monitoring TABLE OF CONTENTS Executive summary...
PGE s 2013 Integrated Resource Plan
 PGE s 2013 Integrated Resource Plan OPUC Public Meeting 2014 Portland General Electric. All rights reserved. Today s topics IRP public process Load-resource balance Assumptions and inputs E3 low-carbon
Gas RateFinder. II - Noncore Gas Rates Customer-Procured Gas Franchise Fee Schedule G-SUR*...10
 February 2018 Volume 46-G, No. 2 The Gas RateFinder is produced by Pacific Gas and Electric Company s Customer Proceeding and Department as a quick reference to most PG&E gas rates, for both PG&E employees
The Southwest Intertie Project: Assessment of Potential Benefits
 The Southwest Intertie Project: Assessment of Potential Benefits November 2008 THE SOUTHWEST INTERTIE PROJECT ASSESSMENT OF POTENTIAL BENEFITS TABLE OF CONTENTS 1 Executive Summary... 2 2 Introduction...
Procurement Under GHG Regulation
 Procurement Under GHG Regulation Pedro J. Pizarro Senior Vice President, Power Procurement Southern California Edison IEP Annual Meeting September 25, 2007 Existing GHG-Related Procurement Rules Loading
APPENDIX B: WHOLESALE AND RETAIL PRICE FORECAST
 APPENDIX B: WHOLESALE AND RETAIL PRICE FORECAST Contents Introduction... 3 Key Findings... 3 Background... 5 Methodology... 7 Inputs and Assumptions... 8 Load... 8 Fuel Prices... 9 Resources... 9 Pacific
Tucson Electric Power 2017 Integrated Resource Plan. Southern Arizona Regional Solar Partnership Jeff Yockey, PE
 Tucson Electric Power 2017 Integrated Resource Plan Southern Arizona Regional Solar Partnership Jeff Yockey, PE May 2017 Integrated Resource Plan (IRP) Overview Just a Plan Additional steps for specific
4.4 UTILITIES WATER RESOURCES EXISTING CONDITIONS
 4.4 UTILITIES WATER RESOURCES EXISTING CONDITIONS The City of Los Angeles Department of Water and Power (LADWP) was established in 1902 to deliver water to the City of Los Angeles. Under the provisions
100% Fossil Free Electricity. June 27, 2018
 100% Fossil Free Electricity June 27, 2018 Current Washington Emissions Levels 100 90 +7% 80 70 60 50-82% 40 30 20 10 0 1990 2013 2050 (goal) 2016 2017 2018 2019 2020 2021 2022 2023 2024 2025 2026 2027
BC HYDRO S LONG-TERM PLAN PRESENTATION TO THE COLUMBIA BASIN REGIONAL ADVISORY COMMITTEE
 BC HYDRO S LONG-TERM PLAN PRESENTATION TO THE COLUMBIA BASIN REGIONAL ADVISORY COMMITTEE March 12, 2015 THE INTEGRATED RESOURCE PLAN Every 3-5 years BC Hydro develops a flexible, long-term strategic plan
NATURAL GAS MARKET ASSESSMENT PRELIMINARY RESULTS
 CALIFORNIA ENERGY COMMISSION NATURAL GAS MARKET ASSESSMENT PRELIMINARY RESULTS In Support of the 2007 Integrated Energy Policy Report STAFF DRAFT REPORT MAY 2007 CEC-200-2007-009-SD Arnold Schwarzenegger,
National Energy Board. Reasons for Decision. Alberta Natural Gas Company Ltd. GHW May Facilities
 C A N A D A National Energy Board Reasons for Decision Alberta Natural Gas Company Ltd. GHW-2-91 May 1992 Facilities National Energy Board Reasons for Decision In the Matter of Alberta Natural Gas Company
REVISED PREPARED DIRECT TESTIMONY OF SHARIM CHAUDHURY SOUTHERN CALIFORNIA GAS COMPANY AND SAN DIEGO GAS & ELECTRIC COMPANY
 Application No: A.1-0-01 Exhibit No.: Witness: Sharim Chaudhury Application of Southern California Gas Company (U 0 G) and San Diego Gas & Electric Company (U 0 G) for Authority to Revise their Natural
OVERVIEW OF DESERT SOUTHWEST POWER MARKET AND ECONOMIC ASSESSMENT OF THE NAVAJO GENERATING STATION
 OVERVIEW OF DESERT SOUTHWEST POWER MARKET AND ECONOMIC ASSESSMENT OF THE NAVAJO GENERATING STATION ARIZONA CORPORATION COMMISSION APRIL 6, 2017 DALE PROBASCO MANAGING DIRECTOR ROGER SCHIFFMAN DIRECTOR
CCA is a public-private mix
 Community Choice Aggregation in Marin CCA is a public-private mix IOU CCA (investor-owned utility/pg&e) Public Utility (municipal utility like SMUD) IOU Purchases Power IOU Maintains Transmission Lines
Electricity Supply. Monthly Energy Grid Output by Fuel Type (MWh)
") For the first quarter of 2015, Ontario experienced overall demand that was typical for the province in winter, and strong generator output. Demand for Ontario electricity increased as a result of cold
For the first quarter of 2015, Ontario experienced overall demand that was typical for the province in winter, and strong generator output. Demand for Ontario electricity increased as a result of cold
Natural Gas Markets and Regulation
 Natural Gas Markets and Regulation Donald F. Santa President INGAA 33 rd Annual PURC Conference Gainesville, Florida February 24, 2006 Presentation Overview How did we get here? Natural Gas Restructuring
Renewable Energy Plan 2013 Biennial Review Lansing Board of Water & Light MSCP Case No. U-16619
 Renewable Energy Plan 2013 Biennial Review Lansing Board of Water & Light MSCP Case No. U-16619 This Biennial Review filing by the Lansing Board of Water & Light (LBWL) complies with State of Michigan