Soil quality monitoring and management
|
|
|
- Randall Cooper
- 6 years ago
- Views:
Transcription

1 Soil quality monitoring and management Report 4 Irrigation (Activities from 1 January to 4 July 2014) Tiedman Irrigation Program Prepared by Fodder King Ltd for AGL Upstream Investments Pty Ltd August 2014
2 Table of Contents Item Contents Page Executive Summary 1 1 Introduction 1.1. Requirements under the Soil Quality Monitoring and Management Program 1.2. Stage 1A irrigation trial description 1.3. Soil quality monitoring and management program requirements 1.4. Stage 1B irrigation trial description 2 Irrigation program layout, crop selection and planting 2.1 Stage 1A Irrigation Area 2.2 Stage 1B Irrigation Area 3 Mass balance results for the period 3.1 Average rainfall patterns 3.2 Rainfall and Evapotranspiration 3.3 Irrigation scheduling and water balance 3.4 Irrigation water quality 3.5 Sodium, nutrient and carbon balance 3.6 Perched water piezometer results 3.7 Overall salt balance 4 Performance of soils on the Stage 1A irrigation area 4.1 Soil analysis parameters 4.2 Baseline 5 Amended soil sampling and test results 4.3 Key findings Baseline 5 (irrigated soil) vs Baseline 4 (irrigated soil) 4.4 Natural soil characteristics 4.5 Soil profile descriptions 4.6 Electromagnetic survey results 5 Performance of soils on the Stage 1B irrigation area 5.1 Irrigation area 5.2 Baseline 4 amended soil sampling and test results 5.3 Key findings Baseline 4 (irrigated soil) vs Baseline 3(irrigated soil) 5.4 Key findings Baseline 4 (irrigated) vs Baseline 1 6 Sedimentation, runoff and erosion control 6.1 Protection measures 6.2 Summary of weather and irrigation applied 6.3 Performance under rainfall and irrigation 7 Stage 1A Critical control point monitoring and response 7.1 Critical control points 7.2 CSG water dam and mixing dam 7.3 Catch dams 7.4 Soil moisture monitoring system i
3 7.5 Shallow piezometer water levels 7.6 Ameliorated soil in the irrigation area 7.7 Non ameliorated parent soil 8 Conclusions 8.1 Stage 1A 8.2 Stage 1B 9 References Attachments Attachment 1 Stage 1A trial plot layout Attachment 2 Stage 1B trial plot layout Attachment 3 Stage 1A Baseline 5 soil test results Attachment 4 Stage 1A Baseline 5 vs Baseline 4 comparisons Attachment 5 Stage 1B soil test results Attachment 6 Soil profile descriptions ii
4 Executive Summary This is Compliance Report 4 of a series of four (4) reports that have been undertaken during the Tiedman Irrigation Program (TIP) and covers the baseline soils analysis, subsequent soil improvement and re-testing of those soils, establishment of all data collection and monitoring equipment and establishment, irrigation then harvesting of irrigated fodder crops and grazing of improved pasture. This report covers the period from 1 January 2014 to 4 July 2014, which was the original expiry date for TIP REF approval issued on 4 July 2012 (PB, 2011). The irrigation program has recently been granted an additional approval to 30 April This report provides further information on the effect of irrigating blended water on the natural and improved soils on AGL s Tiedman property over the period of the irrigation program. These reports are submitted in compliance with the approved Soil Quality Monitoring and Management Program (FK, 2012). The TIP is being carried out across two areas within the AGL Tiedman property known as Stage 1A and Stage 1B. The Stage 1A area is generally referred to as the main irrigation area. The Stage 1A area is the major focus of the approved Soil Quality Monitoring and Management Program. There has been extensive sampling and analysis of the quality of the parent and treated soils. This area is being intensively monitored for soil, water and crop performance. The Stage 1A area is 12 hectares (ha) in size and is made up of 16 equal sized plots, 0.74 ha in size, where two crop systems (annuals and perennials) and four soil treatment types have been installed. The Stage 1B irrigation area utilised in the reporting period is made up of 4 plots that total approximately 4 ha. The main pasture types grown include a mix of annual and perennial species. This report sets out: the trial plot layout, crop selection and planting; the mass balance results for the reporting period; the performance of soils on the Stage 1A irrigation area; the performance of soils on the Stage 1B irrigation area; the performance of the sedimentation, runoff and erosion control measures; and the critical control points and any trigger responses. Blended water with an average salinity of 1540 µs/cm was applied to Stage 1A (25.49 megalitres (ML) irrigated) and Stage 1B (7.48 ML irrigated) during the reporting period. During the same period some ML of rain occurred across the Stage 1A area and ML on the Stage 1B area. In total, 59 % of the water received by the Stage 1A area fell as rain, while the balance (41 %) was applied by irrigation of blended water. All crops have grown satisfactorily during the irrigation program. For the main irrigation area (Stage 1A) none of the Critical Control Point trigger levels were reached during the reporting period. Salinity and sodium concentrations have increased at depths greater than 20 cm across all soil sampling sites in the Stage 1A area but have had a limited effect on improved soil structure at this time. In the Stage 1B area, salinity and sodium concentrations have increased at a higher rate (in the near surface) than the Stage 1A area on the shallow improved soil. The soil structure in Stage 1A plot areas remains significantly improved from the amendments and shows no indication of adverse effects (such as abnormal salinity or sodium levels, and clay particle dispersion) from the irrigation of blended water or periodic rainfall at this time. 1
5 In the Stage 1A area the net mass balance is close to zero, indicating that salts are accumulating in the soil profile but not at a level detrimental to soil structure or crop growth. In the Stage 1B area there has been a larger increase in accumulated salts in relation to Stage 1A. The monitoring and reporting period was a dry period with limited opportunities for the deep percolation and flushing of salts past the root zone in both the Stage 1A and Stage 1B areas. 2
. The irrigation program involves two main irrigation areas (Stage 1A and Stage 1B).")

 (FK, 2012).")
6 1. Introduction AGL Upstream Investments Pty Ltd (AGL) engaged Fodder King Ltd (FK) to provide technical advisory services (including soil investigations and the preparation of compliance reports) associated with the Tiedman irrigation program (TIP). The irrigation program involves two main irrigation areas (Stage 1A and Stage 1B). This report is the fourth compliance report for the irrigation program. It covers the assessment of soils after the soil treatments, establishment of crops within the Stage 1A area, improved pasture in Stage 1B and after the commencement of irrigation of blended water. The report covers the period from 1 January to 4 July 2014 (which was the expiry date for the TIP REF approval issued in July 2012). The two primary irrigation areas are shown in Figure 1. Stage 1A is the major focus of the Soil Quality Monitoring and Management Program (SQMMP) (FK, 2012). This area is undergoing intensive monitoring of soil, water and crops, and application (after blending) of most of the produced water for irrigation. The Stage 1A area is about 22 hectares (ha) in total, of which 12 ha is being irrigated. Crop types are lucerne, forage sorghum, triticale and oats. Stage 1B is where the lower salinity water, in the produced water storage dams, was irrigated in late Some additional irrigation, using blended water, has occurred on a 4.1 ha portion within the Stage 1B area. Approximately ha of pasture in the Stage 1B area could be irrigated. The main pasture types grown include a mix of annual and perennial species. There is an additional approved irrigation area (the Stage 2 area) which is approximately 15 ha. This area was not irrigated during the reporting period and is unlikely to be irrigated given the low volumes of produced water remaining in storage. Figure 1: Gloucester Irrigation Areas for Exploration Produced Water The Stage 1A, Stage 1B and Stage 2 irrigation areas are all located off the floodplain of the Avon River. The irrigation program was approved in July 2012 after the TIP REF (PB, 2011) and supplementary documents were submitted to NSW Trade and Investment (Division of Resources and Energy (DRE)) during 2011/12. 3
7 1.1. Requirements under the Soil Quality Monitoring and Management Program (FK, 2012). The Soil Quality Monitoring and Management Program (SQMMP) was approved by DRE in October 2012 for the two irrigation areas and for the irrigation of up to 70 ML of produced water across an area of up to 40 ha. Overall objectives The overall objectives of the SQMMP are to: Develop and monitor the performance of soils on the irrigation area against baseline soil quality parameters; Develop, manage and monitor the water and salt balances; and Monitor, act and report on any adverse trends or impacts on soil structure and quality parameters. Stage 1A objectives The objectives of the Stage 1A irrigation area are to: Derive information about the use of blended water on improved soils in order to optimise the beneficial use of produced water; Provide information to optimise the design of a water treatment and storage system to match longer term beneficial re-use opportunities; and In order to minimise the overall footprint of the project on the surrounding landscape, the irrigation program is aiming to achieve blended water application rates in the range of 3-5 megalitres/hectare/year. Stage 1B objectives The objectives of the Stage 1B area are to: Allow for the irrigation of the lowest salinity produced water stored in the holding dams to provide improved pasture for stock grazing across the property (which is the traditional land use); Provide freeboard in the holding dams for the blending of the more brackish produced water that is in storage; Derive information about the use of blended water on un-improved soils to assess the suitability of this approach for improved pasture Stage 1A Irrigation Trial description In brief, the Stage 1A Irrigation Trial involves the addition and mixing of ameliorants with the parent soils, the application of blended water (CSG produced water and fresh water) to those soils with the aid of an accurate irrigation system, the regular sampling and testing of the soils, the regular analysis of mass and water balances, analysis of results, and reporting on the results. The main activities are outlined as follows: Baseline 1 soil study A comprehensive baseline soil study to ascertain the characteristics of the parent soils across the Tiedman property but in particular the Stage 1A irrigation area. This data was collected and reported as part of the irrigation trial design during 2011 (FK, 2011). 4
8 Baseline 2 soil study On completion of the soil amelioration, repeat the soil sampling and analysis to ascertain the baseline characteristics of the treated soil prior to irrigation. Compliance Report 1 (FK (2013a) Soil quality monitoring and management, Report 1- Pre irrigation (Activities to 31 March 2013), covered the site soil investigations up to and including the Baseline 2 soil study and prior to the commencement of irrigation of the Stage 1A area. Baseline 3 soil study On completion of irrigation of blended water during the reporting period (1 April 2013 to 30 June 2013), repeat the soil sampling and analysis to ascertain the characteristics of the treated soil after initial irrigation and assess any trends. Compliance Report 2, (FK (2013b) Soil quality monitoring and management, Report 2 - Irrigation (Activities from 1 April to 30 June 2013), covered the site soil investigation and results carried out at the end of this reporting period. Baseline 4 soil study On completion of irrigation of blended water during the reporting period (1 July 2013 to 31 December 2013), repeat the soil sampling and analysis to ascertain the characteristics of the treated soil after extended irrigation and assess any trends. Compliance Report 3, (FK (2014a) Soil quality monitoring and management, Report 3 - Irrigation (Activities from 1 July to 31 December 2013), covers the site soil investigation and results carried out on the 7 and 8 November Baseline 5 soil study On completion of irrigation of blended water during the reporting period (1 January 2014 to 4 July 2014), repeat the soil sampling and analysis to ascertain the characteristics of the treated soil after extended irrigation and assess any trends. Compliance Report 4, (this report) covers the site soil investigation and results carried out on the 19 May Perched water piezometers Paired piezometers to monitor the potential for the development of perched water zones in the shallow soil profile have been installed inside and immediately outside (i.e. down gradient) the area of each of the different soil treatment types. Construction details are provided in FK (2013a) Soil quality monitoring and management, Report 1- Pre irrigation (Activities to 31 March 2013). Irrigation Program The application of blended water to the Stage 1A trial area is subject to recommendations arising from daily water balance monitoring and anticipated weather conditions. In the period from 1 January to 4 July 2014, approximately ML of blended water was irrigated across the Stage 1A area to grow forage sorghum and lucerne. This water was taken from the Tiedman South dam (containing blended water for irrigation) and applied using an overhead linear move irrigator. 5
9 Carry out monitoring and data gathering The requirement is to undertake all detailed monitoring and data gathering, including regular soil sampling and testing, and provide six monthly reports to NSW Trade and Investment (Division of Resources and Energy [DRE]) in accordance with REF approval conditions 3 and 6. On completion of the Stage 1A irrigation program in mid-2014, soil sampling and testing (Baseline 5) was undertaken (similar to the extensive FK baseline study done in 2011) to establish the effect of irrigation on the ameliorated soil, prior to submission of this final report (Compliance Report 4) to DRE Soil quality monitoring and management program requirements In order to manage the ameliorated soils during the Stage 1A irrigation trial, a number of soil quality attributes are being monitored. These include water balance, salt balance, nutrient balance, carbon balance, and soil structure. Crop yield, crop persistence and crop health are also being monitored. Water balance The water balance provides the framework for tracking inputs to calculate salt, nutrient and carbon balances in the receiving soil and for determining trigger points to prevent adverse impacts on soil quality. The water balance is based on the Environmental Guidelines: Use of Effluent by Irrigation (DECC, 2004). The aim of irrigation management during the irrigation program is to maintain a soil moisture deficit, within the optimal soil moisture range for crop growth, which is between wilting point and field capacity. Soil moisture is continually monitored to track soil moisture patterns (surplus or deficit) due to both rainfall and irrigation. Irrigation is only applied when there is both a daily irrigation deficit and a soil moisture deficit (with respect to soil field capacity). The AGL on-site weather station data and available rainfall forecasts are used to guide the applied irrigation water and to monitor the water balance. Salt, nutrient and carbon balances The salt, sodium, nutrient (nitrogen and phosphorus) and soil carbon (Total C) balances are determined during the Stage 1A irrigation program. Monitoring and analysis of blended CSG water applied, soil chemistry and soil-water allow the determination of inputs and outputs, and sources and sinks, to interpret mass balance processes and the management implications for short and long-term irrigation. Soil structure Apart from the physical causes of soil erosion, such as loss of ground cover, key soil chemistry parameters such as soil ph, Cation Exchange Capacity (CEC) and the soil Exchangeable Sodium Percentage (ESP) indicate the potential for loss of soil structure when irrigated with waters of a given electrolyte concentration. The relationship between ESP, the Sodium Adsorption Ratio (SAR) of permeating soil water, and the potential impact on soil structure as summarised in the Environmental Guidelines: Use of Effluent by Irrigation (DECC, 2004), is detailed in Lucas (2009) and discussed further in Section 4. Performance of soils on the Stage 1A irrigation area of this report. Crop growth, persistence and health Crop growth is determined from measuring dry matter yield after harvest over successive cropping cycles. An important aspect of the trial was to establish ground cover as quickly as possible after installation to minimise the risk of erosion of bare ameliorated soil. During the previous reporting period the annual summer crop (forage sorghum) was established, having replaced the winter cereal (triticale). During autumn, the forage sorghum was replaced by the next triticale crop for the winter of
10 Crop persistence is measured by plant counts and monitored at regular intervals. Crop health is measured by pasture sample analysis, leaf tissue analysis, harvested fodder analysis and monitored at regular intervals by an agronomist Stage 1B irrigation program description The principal use of the Stage 1B area is to: i. Initially directly irrigate existing pasture with the lower salinity produced water in the Tiedman South dam so as to create capacity in the dam for blending of the larger volumes of produced water. ii. Establish some shallow rooted pasture species on a 4.1 ha area to evaluate irrigation application rates and irrigability of these traditional pastures in comparison with the more salt tolerant and deeper rooted crops that are established in the Stage 1A area. Blended irrigation water was used for this part of the program. In the period from 1 January to 4 July 2014, approximately 7.48 ML of blended water was irrigated across the Stage 1B area to grow improved pasture. This water was taken from the same dam (Tiedman South) as the blended water applied to Stage 1A and applied using a small travelling irrigator. The Stage 1B improved pasture/grazing area is currently being managed by a lessee. The lessee is using rotational grazing as a method to finish EU-accredited cattle prior to slaughter. There are head of cattle on this area at any one time. 7
11 2. Irrigation program layout, crop selection and planting 2.1. Stage 1A irrigation area Trial layout The Stage 1A irrigation layout was designed to ensure minimum buffer distances from the Avon River (40 m), boundaries (10 m), power lines (15 m) and a copse of trees (10 m). This created an irrigable area of 587 m (oriented east-west) by 322 m (oriented north-south). From within this area the final trial irrigation area was selected to satisfy the following requirements: Four soil treatments; Two crop systems (annuals and perennial); An individual plot size that could accommodate the typical range of agricultural operations; Irrigated by a low pressure overhead spray linear irrigator, creating a rectangular shaped irrigation zone with a central road for the linear cart to traverse; and The need to have a trial area as close as possible to final scale. This resulted in a trial plot area measuring approximately 395 m from east to west by 313 m from north to south. See Attachment 1. There are 16 equal-sized trial plots. Each individual trial plot is approximately 0.75 hectares in size, measuring m by m. This size enables most agricultural equipment to operate within the plot. Factoring in non-productive crop areas taken up by bund walls the green crop area is 0.73 hectares (46.85 m x m). Due to the selection of a centre feed linear move irrigator as the method for applying irrigation water, each treatment and crop combination was split evenly on either side of the centreline of the linear irrigator, resulting in eight plots (Plots 1-8) under the northern leg of the irrigator and eight plots (Plots 9-16) under the southern leg of the irrigator. This accommodated the need for two crop types and four treatment depths on either side of the cart track Crop selection Due to the expected year-round flow characteristics of produced water, perennials and annuals are being trialled to develop crop combinations that will maximise the utilisation of water. The crop types being irrigated for the 18 month program are: Perennials (lucerne) eight plots x four treatment depths Annuals - eight plots x four treatment depths o winter forage cereals (triticale), planted in April 2013 and harvested/removed in September 2013 o followed by a summer forage (forage sorghum), established in September 2013 and harvested/removed in April 2014 o followed by a second triticale crop planted in May Planting The Stage 1A crops and varieties established and planted during the period were as follows: Forage sorghum o Planted 25/09/2013 o Variety BMR Octane 8
12 o Seeding rate 25 kg/ha o Removed and replaced by Triticale o ha Lucerne o Planted - 12/04/2013 o Variety L91 o Seeding rate 20 kg/ha. Triticale o Planted - 5/05/2014 o Variety Monstress o Seeding rate 120 kg/ Crop performance since planting Table 2.1 provides a summary of crop production for the reporting period. The triticale (winter annual) was replaced in September 2013 by forage sorghum (summer annual) and harvested over the summer/autumn period before being replaced by triticale in May All crops have performed satisfactorily. More information is provided in Summary Report 2 (Soil and cropping activities from 1 st September 2013 to 31 st March 2014). Crop Table 2.1: Crop production summary for the reporting period Number of bales Silage Hay bales bales Silage bales (kg) Bale weights Hay bales (kg) Total dry matter yield (tonnes) Total dry matter yield (tonnes/ hectare) Forage Sorghum Harvest 1 (17/01/2014) Harvest 2 (26/02/2014) Harvest 3 (1/05/2014) Total for forage sorghum Lucerne Harvest 1 (17/01/2014) Harvest 2 (26/02/2014) Harvest 3 (3/04/2014) Harvest 4 (1/05/2014) Harvest 5 (20/06/2014) Total for lucerne Total for the period (1/01/2014 4/07/2014) During the period the production volumes were: Forage sorghum harvested in January, February and May ( dry matter (DM) tonnes) Lucerne harvested in January, February, April, May and June (30.04 DM tonnes) The total production of DM tonnes (see Table 2.1) is consistent with the accumulated yield expected for the summer/autumn period. 9
13 Total production since the program commenced is as follows: Gross yield (tonnes) Dry Matter Yield (tonnes) Dry matter yield per hectare (tonnes/ha) Typical forage sorghum plot showing post-harvest regrowth Typical lucerne plot showing post-harvest regrowth 10
14 2.2. Stage 1B irrigation area The four Stage 1B irrigation plots are located just to the south of the Stage 1A trial plots and are sized and named as follows: AL hectares AL hectares AL hectares AL hectares The total area is 4.1 ha and the layout of this area is provided in Attachment Pasture selection The pasture type initially chosen for this area was a pasture mix (71 % Ryegrass, 20 % Clover, and 9 % Chicory) which was the same for all four plots. There was no deep soil treatment across any of these four plots. A second pasture mix was established in autumn Planting Autumn 2013 The pasture mix varieties below were planted on 28/03/2013 at a combined rate of 35 kg/ha: Ryegrass o Variety Knight o Seeding rate 25 kg/ha Clover o Variety USA Red Clover o Seeding rate 7 kg/ha Chicory o Variety Punter o Seeding rate 3 kg/ha Autumn 2014 The pasture mix varieties below were planted on Plots 1 and 2 on 26/03/2014 at a combined rate of 38 kg/ha: Ryegrass o Variety Knight o Seeding rate 12.5 kg/ha Ryegrass o Variety Asset AR37 o Seeding rate 12.5 kg/ha Clover o Variety USA Red Clover o Seeding rate 6 kg/ha Chicory o Variety Punter o Seeding rate 3 kg/ha Kikuyu o Variety N/A o Seeding rate 4 kg/ha 11
15 The pasture mix varieties below were planted on Plots 3 and 4 on 26/03/2014 at a combined rate of 46.5 kg/ha: Ryegrass o Variety Knight o Seeding rate 30 kg/ha o Seeding rate 12.5 kg/ha Chicory o Variety Punter o Seeding rate 4 kg/ha Pasture performance since planting A satisfactory pasture density has been maintained for cattle grazing during the reporting period. 12
 per annum.")
16 3. Mass balance results for the period 3.1. Average rainfall patterns The irrigation site lies within a relatively high rainfall zone, with a mean rainfall of approximately 983 millimetres (mm) per annum. The rainfall pattern is slightly summer-dominant with 56 % occurring between November and March and 44 % occurring between April and October. As a result the consideration of rainfall is a significant factor in determining the timing of when irrigation will be undertaken Rainfall and Evapotranspiration Figure 3.1 summarises rainfall and evapotranspiration (ETo) between the 1 January 4 July 2014 where 303 mm of rain occurred during the period. Most rainfall fell in February (58 mm), March (126 mm) and April (77 mm). Rainfall across the total Stage 1A plot area of 12 ha was 36.4 ML. The equivalent volume across the Stage 1B area of 4.1 ha was 12.4 ML. Figure 3.1: Rainfall and Evapotranspiration for the Period (1 st January 4 th July 2014) There are no ETo data specific to the site (see explanation in FK, 2011), however ETo was interpolated from regionally available data through the iwater service. During the reporting period 41 % of the total water received across the Stage 1A area came from blended water while 59 % came from rainfall (refer Table 3.1). Table 3.1 Rainfall and irrigation for the period Stage 1A Units Rainfall for the period Irrigation for the period Total mm ML %
17 3.3. Irrigation scheduling and water balance Stage 1A The water balance was based on Environmental Guidelines: Use of Effluent for Irrigation (DECC, 2004): Applied CSG water (Qcsg) + Rainfall (Qr) Evapotranspiration (ETo) + Percolation (P) + Runoff (R) + Interception Loss (IL), where R is designed to be zero, therefore the daily water balance is: Qcsg ETo + P + IL Qr Daily Irrigation Deficit (DID) = ETo + P + IL (Qr + Qcsg) Negative values mean irrigation should not be applied. The cumulative DID (over 6 day periods) was used in conjunction with real-time soil moisture to determine if irrigation was possible at a given time. For example, a 25 mm rainfall event may offset 6 days (or more) of low ETo, and if the rainfall event saturates the soil, then irrigation does not occur. Figure 3.2 summarises the Daily Irrigation Deficit (DID), cumulative DID (7-day) and applied irrigation of blended CSG water (1 st January 4 th July 2014). Figure 3.2: Stage 1A - Daily Irrigation Deficit (DID), 7-day cumulative DID and Irrigation applied for the Period (1 st January 4th July 2014) In addition to the water balance, real-time soil moisture monitoring ensured that irrigation was only applied when there was available space in the soil profile. Figures 3.3a and 3.3b show the wetting and drying patterns of MS1 (control area outside the irrigation area) and MS5 (in the deepest treatment zone within the irrigation area). The general similarity between irrigated and non-irrigated soils and their wetting and drying periods indicates that the structure of the receiving soil is being maintained and water is passing 14
 are generally observed in MS5 trends.")
 was applied to MS5 and, while the irrigation spikes increased the presence of soil water during this period, this allowed considerable water uptake by plants in")
18 to the deeper parent soil. For example, comparison of Figure 3.3a to 3.3b shows that water movement through the soil has not been significantly altered by irrigation. That is, the general wetting and drying periods in MS1 (due to rainfall shown by blue columns) are generally observed in MS5 trends. Water is either moving to deeper groundwater or being used by plants to create these similar patterns. However, irrigation (black columns) was applied to MS5 and, while the irrigation spikes increased the presence of soil water during this period, this allowed considerable water uptake by plants in the trial area. Further discussion on soil water dynamics will be provided in Section 4.3 Key Findings Baseline 5(irrigated soils) vs Baseline 4(irrigated soils). Figure 3.3a: Soil moisture monitoring showing wetting and drying periods for MS1 (control, outside irrigation area) from 1 st January th July 2014 Figure 3.3b: Soil moisture monitoring showing wetting and drying periods for MS5 (deepest treatment zone inside irrigation area) from 1 st January th July 2014 Irrigation of blended CSG water occurred intermittently from 1 January 4 July 2014 as indicated by the water balance previously described in the Section Approximately ML of blended CSG water was applied to the Stage 1A area during the period compared to ML in the previous reporting period. The DID, cumulative DID and soil moisture indicated that these 15
19 were optimum irrigation opportunities that would result in zero runoff while maintaining soil moisture levels suitable for crop growth Stage 1B The water balance used for Stage 1A was also used for Stage 1B and is shown in Figure 3.4. Approximately 7.48 ML (~ 182 mm) of blended CSG water was applied to the 4 ha in Stage 1B from 1 st January to 4 th July Figure 3.4: Stage 1B - Daily Irrigation Deficit (DID), 6-day cumulative DID and Irrigation applied for the Period (1 st January 4th July 2014) 3.4. Irrigation water quality Table 3.2 summarises water quality of the blended water used to irrigate Stages 1A and 1B from 1 January to 4 July 2014 (from Parsons Brinckerhoff, 2014c). The water quality results are from the February 2014 quarterly sampling event and are from the Tiedman South dam. The blended water (February 2014) had an average EC of 1540 µs/cm which was close to the mixingmodel design objective for water quality prior to irrigation ( 1500 µs/cm). The elevated lab ph (9.66) is of minor concern to site soils at these EC values as the ph can be attributed to carbonate interactions in the blended water and there is substantial buffering capacity in the amended soils. The field ph of 8.39 is considered more representative. The water monitoring compliance reports (Parsons Brinckerhoff, 2013 and Parsons Brinckerhoff, 2014c) assess blended water quality for irrigation against the ANZECC irrigation guidelines. The ANZECC irrigation guideline ph range is between 6 and 9. The blended irrigation water has elevated ph and this may cause some nutrient uptake problems. The blended irrigation water was generally low in nutrients (nitrate and ortho-phosphate) however at a ph of 9.66 all phosphorus is in the bound form and is not available to plants. Adjustment of the ph to around 7.5 would release phosphorus for crop assimilation. 16
20 Sodium, nutrients and Total Organic Carbon (TOC) values are discussed further in section 3.5 with respect to mass balance results and potential impacts on site soils. Table 3.2: Water quality of the blended CSG water prior to irrigation (from TSD) Parameter Units Value Electrical Conductivity (EC) (lab) µs/m 1540 ph (lab) no units 9.66 Chloride (Cl) mg/l 207 Sodium (Na) mg/l 262 Sodium Adsorption Ratio (SAR) Total Alkalinity mg CaCO 3/L 369 Bicarbonate Alkalinity (HCO 3) mg CaCO 3/L 165 Carbonate Alkalinity (CO - 3 ) mg CaCO 3/L 204 Hardness mg CaCO 3/L 27 Aluminium (Al) mg/l 9.42 Boron (B) mg/l 0.25 Calcium (Ca) mg/l 6 Copper (Cu) mg/l Fluoride (F) mg/l 0.8 Iron (Fe) mg/l 5.38 Magnesium (Mg) mg/l 3 Manganese (Mn) mg/l Nitrate nitrogen (NO 3) mg/l <0.01 Total Kjeldahl Nitrogen (TKN) mg/l 3.1 Total Phosphorus (P) mg/l 1.61 Orthophosphate (PO 3-4 ) mg/l 0.63 Potassium (K) mg/l 92 Sulfate (SO 2-4 ) mg/l 26 Zinc (Zn) mg/l Total Dissolved Solids (TDS) mg/l 1000 Total Organic Carbon (TOC) mg/l 35 Note Water quality analysis is from Parsons Brinckerhoff 2014c, laboratory results are from the Tiedman South dam and are from the February 2014 sampling event 3.5. Sodium, nutrient and carbon balance The aim of using mass balances was to determine how the sodium, nutrient and carbon load in the applied water was accumulating in the receiving soil over time. Mass balance results are presented as mg/kg applied during the reporting period and are compared to soil data to determine changes over time Stage 1A The mass of soil in Stage 1A was calculated as: ha = 119,400 m 2 x m (average treatment depth) x 1200 kg/m 3 (soil bulk density) = 47,712,240 kg of soil in Stage 1A. Table 3.3 provides a summary of mass balances for sodium, nitrate nitrogen, total phosphorus and total organic carbon 17
21 Table 3.3: Stage 1A mass balance summary for sodium, nitrate nitrogen, total phosphorus and total organic carbon (for 6 months and in total) Dam WQ Irrigation applied this period Irrigation applied since 1/4/2013 Total Applied this period Total Applied since 1/4/2013 Site soil mass Total Applied this period Total Applied since 1/4/2013 mg/l ML ML mg mg kg mg/kg mg/kg Sodium (Na) ,678,380,000 16,521,720,000 47,712, Total Nitrogen (TN) Total Phosphorus (P) Total Organic Carbon (TOC) ,019, ,486,000 47,712, ,038, ,526,600 47,712, ,150,000 2,207,100,000 47,712, Approximately 140 mg/kg of sodium has been applied during the reporting period. Soil analysis over this period (discussed in Section 4) indicated that sodium ranged from approximately 407 mg/kg to 1014 mg/kg (to 1200 mm soil depth) with an average of 528 mg/kg (323 mm soil depth). The 140 mg/kg of sodium applied during this period increased soil sodium concentration compared to Baseline 4; however FK has assessed that this increase in sodium concentration is likely to have only a minor impact on soil structure and water movement through the soil at this time. The impact of sodium on soil structure is discussed in Section 4.3 Key Findings Baseline 5 (irrigated soils) vs Baseline 4 (irrigated soils). Nitrate nitrogen, total phosphorus and total organic carbon have been applied in negligible quantities through irrigation during the both the reporting period and the whole of the irrigation period Stage 1B The mass of soil in Stage 1B was calculated as: 4ha = 40,000 m 2 x 0.15 m (average treatment depth) x 1200 kg/m 3 (soil bulk density) = 7,200,000 kg of soil in Stage 1B Table 3.4 provides a summary of mass balances for sodium, nitrate nitrogen, total phosphorus and total organic carbon. Table 3.4: Stage 1B mass balances summary for sodium, nitrate nitrogen, total phosphorus and total organic carbon (for 6 months and in total) Dam WQ Irrigation applied this period Irrigation applied since 1/4/2013 Total Applied this period Total Applied since 1/4/2013 Site soil mass Total Applied this period Total Applied since 1/4/2013 mg/l ML ML mg mg kg mg/kg mg/kg Sodium (Na) ,959,760,000 5,407,680,000 7,200, Total Nitrogen (TN) ,188,000 63,984,000 7,200, Total Phosphorus (P) ,042,800 33,230,400 7,200, Total Organic Carbon (TOC) ,800, ,400,000 7,200, Approximately 272 mg/kg of sodium has been applied during the period. Soil analysis over this period (discussed in Section 4) indicated that sodium increased from 898 mg/kg to 1056 mg/kg (0-20 cm depth) since soil sampling in Baseline 4. The mg/kg of sodium applied during this latest period increased sodium in the soil profile increasing soil Sodium and Exchangeable Sodium Percentage (ESP) from ~ 15 to ~
22 Nitrate nitrogen, total phosphorus and total organic carbon have been applied in minimal quantities through irrigation at this time and pose no threat to soil or crop health Perched water piezometer results Shallow piezometers in the soil profile installed around and within the respective irrigation areas also provided data to assist irrigation scheduling. These sites have no relevance for environmental monitoring. Table 3.5 shows the dual piezometer sites and the monitored water level depths during 2013 and Piezometer locations are shown in Attachments 1 and 2. Table 3.5: Piezometer sites and water level depths in 2013 and 2014 Piezometer Piezometer ID Depth below Water level in Piezometer (mm) on sampling date surface (mm) 6/02/2013 7/03/ /04/ /05/ /06/2013 1/10/2013 8/11/ /01/ /03/ /05/2014 SP1A SP1B SP2A SP2B SP3A SP3B SP4A SP4B SP5A SP5B SP6A * SP6B * SP7A SP7B SP8A SP8B SP9A ^ 500 Not installed until May SP9B ^ 700 Not installed until May SP10A ^ 500 Not installed until May SP10B ^ 700 Not installed until May Rainfall between periods (mm) Irrigation between periods (mm) (Stage 1B in brackets) (0) 0 (0) 0 (0) 29 (0) 10 (75) 108 (88) 131 (59) 159 (0) 48 (0) 33 (0) Total water applied between periods (mm) (Stage 1B in brackets) 82 (82) 101 (101) 28 (28) 63 (34) 108 (173) 162 (142) 140 (68) 351 (0) 198(0) 153 (0) Key * - dual piezometers located upstream and downstream of catch dam 2 (CDW) outside the irrigation area ^ - Stage 1B piezometers The piezometers within the trial area (those denominated by the letter A ) were installed to depths that matched the depth of treatment for each location. The paired piezometers outside of the trial area (those denominated by the letter B ) were all installed to the same depth of 1.2 metres. The piezometers within the Stage 1A irrigation area generally contained more water than the outside piezometers. This is due to the substantially improved infiltration rate of the ameliorated soils inside the trial area, resulting in the promotion of downward movement of water into the soil (to treatment depth), rather than surface runoff which would occur in the parent soils. Also, most piezometers accumulated water during high rainfall however piezometer water level trends indicate that this water either permeated into the surrounding soil over time and/or was transpired by plants. Paired piezometers (SP9a, SP9b, SP10a, and SP10b) were installed in the Stage 1B area (see Attachment 2) to monitor the potential for perched water to develop inside and immediately outside (i.e. down gradient) of the irrigated pasture area. The piezometers were installed to a depth of 500 mm inside the area to be irrigated and 700 mm outside the area to be irrigated. Piezometer water quality was also monitored - based on ph and EC (µs/cm). Table 3.6 shows all samples that were field tested since the irrigation program commenced in April The table does not include laboratory water samples submitted by Parsons Brinckerhoff (PB, 2014a and c). Note that 19
23 not all piezometers contained water during sampling periods and only those tested are provided in Table 3.6. Table 3.6: ph and EC of piezometer waters Date Piezometer ID WL in pipe (mm) ph EC µs/cm 7/03/2013 SP1A /03/2013 SP5B /04/2013 SP1A /04/2013 SP2B /11/2013 SP2A /11/2013 SP5A /11/2013 SP6B /01/2014 SP1A /01/2014 SP2A /01/2014 SP7A /01/2014 SP8A /05/2014 SP5B /05/2014 SP6A maximum minimum standard deviation Salinities reflect the natural salinity in the soil profile. Fluctuations in ph and EC are a function of rainfall, irrigation and crop water use however results provide a basis for estimating water quality that may leach below the root zone to the regional water table in the bedrock Overall salt balance Avon catchment perspective Response to rainfall To understand the impact of irrigation to the Stage 1A area with respect to the EC of off-site discharge it is important to understand how the surrounding Avon River catchment responds to rainfall. Figure 3.5 provides water level and EC data extracted from the NSW Office of Water (NOW) real-time monitoring program for the Avon River (ID Waukivory) for the whole irrigation period (April 2013 to July 2014). 20
24 Figure 3.5: Water level and EC data for the Avon River Three major increases in water level can be observed between the 13/5/2013 and 7/7/2014 (highlighted as 1, 2 and 3). In general, there is an inverse relationship between water level and EC. Using 2 as an example, the trend is a salinity spike (due to salts in the general landscape running off in the first flush) then a reduction to low salinity water as overland flow dominates then a gradual increase again as groundwater base flows contribute. This is followed by a steady increase over (up to) several months in conjunction with decreasing water levels. The rapid decrease in EC and increase in water level during rainfall indicates that the undulating catchment, with poorly drained soils on the slopes, promotes rapid surface runoff to the Avon River. The steady increase in EC in the days, weeks and months after rainfall is attributable to shallow groundwater baseflow as the alluvial groundwater system drains after being recharged after each high rainfall event. These dynamics were also recognised in the Parsons Brinckerhoff Water Compliance Report (PB, 2014a) Leaching fraction estimates To estimate the EC of soil water and leached salts during the Stage 1A irrigation trial it was necessary to determine a leaching fraction. The major inputs and assumptions are outlined below and are based on the methodology prescribed in Ayers & Westcott, Water quality for agriculture, FAO, 1994: o Applied average water salinity (EC w) = 1.54 ds/m o Crop water demand (ET) = 1761 mm (1/4/2013 4/7/2014). o The crop water use pattern is This means the crop will get 40 percent of its ET demand from the upper quarter of the root zone, 30 percent from the next quarter, 20 percent from the next, and 10 percent from the lowest quarter. Crop water use will increase the concentration of the soil-water which drains into the next quarter (EC sw) of the root zone (see Figure 3.6). o Estimated leaching fraction (LF) = The estimated leaching fraction of 0.15 means that 15 percent of the applied irrigation water entering the surface percolates below the 21
25 root zone and 85 percent replaces water used by the crop to meet its ET demand and water lost by surface evaporation. o Repeat calculations based on irrigation + rainfall and weighted EC (1/4/2013 4/7/2014). In Figure 3.6, five points in the root zone are used to determine the average root zone salinity. These five points are soil-water salinity at (1) the soil surface, (EC sw0); (2) bottom of the upper quarter of the root zone, (EC swl); (3) bottom of the second quarter depth, (EC sw2); (4) bottom of the third quarter, (EC sw3) and (5) bottom of the fourth quarter or the soil-water draining from the root zone (EC sw4) which is equivalent to the salinity of the drainage water (EC w). Figure 3.6: Leaching dynamics in the root zone (FAO, 1994) With a LF of 0.15, the applied water (AW) needed to meet both the crop ET and the LF is determined from the following equation: 2072 Equation 1. Since essentially all the applied water enters and leaches through the soil surface, effectively removing any accumulated salts, the salinity of the soil water at the surface (EC sw0) must be very close to the salinity of the applied water as shown using equation (2) and assuming LF0 = / Equation 2 The salinity of the soil-water draining from the bottom of each root zone quarter is found by determining the leaching fraction for that quarter using equation (3) and then determining the soil-water salinity using equation (4). 0 Equation 3 Equation 4 For the bottom of the first quarter: / 22
26 At the bottom of the second quarter: / At the bottom of the third quarter: / At the bottom of the root zone (fourth quarter): / The average soil-water salinity of the root zone is found by taking the average of the five root zone salinities found above: / The same approach shown above was used but rainfall was incorporated using a volume-weighted EC w. Approximately 689 mm of rainfall occurred (EC < 0.02 ds/m) in conjunction with 527 mm of irrigation (EC = 1.54 ds/m). Since rainfall has minimal salts, the EC w used in the new calculation was determined by a simple dilution method resulting in a new EC w of 0.80 ds/m (527mm/1216mm x 1.54 ds/m = 0.67 ds/m). For the bottom of the first quarter: / At the bottom of the second quarter: / At the bottom of the third quarter: / At the bottom of the root zone (fourth quarter): / The average soil-water salinity of the root zone is found by taking the average of the five root zone salinities found above: / 5 23
27 Using the LF calculations above and also considering rainfall EC, the (estimated) average soilwater salinity of the root zone ranges from ds/m Piezometer water quality The range in average soil-water salinity of the root zone as calculated above is very similar to piezometer water EC recorded in the field (~ ds/m). Table 3.6 shows piezometer water ph and EC which was sampled/analysed when water was present. Table 3.6: ph and EC of piezometer waters Date Piezometer ID WL in pipe(mm) ph EC us/cm 7/03/2013 SP1A /03/2013 SP5B /04/2013 SP1A /04/2013 SP2B /11/2013 SP2A /11/2013 SP5A /11/2013 SP6B /01/2014 SP1A /01/2014 SP2A /01/2014 SP7A /01/2014 SP8A /05/2014 SP5B /05/2014 SP6A maximum minimum standard deviation Fluctuations in ph and EC will be a function of rainfall, irrigation and crop water use however results provide a basis for estimating any significant change in soil-water salinity over time. For example, piezometer water sampled (SP1A and SP5B) on the 7/3/2013, after ~ 100 mm rainfall in the previous week, can be considered as background values of soil water EC prior to irrigation. The majority of EC values recorded in various piezometers over the irrigation period rarely exceeded these background values. Note that the presence of soil water in these very shallow piezometers did not occur after any irrigation event and only filled after significant rainfall. 24
28 Salt mass balance Table 3.7 summarises the salt balance for the Stage 1A area and Figures 3.7 and 3.8 conceptually show salt dynamics in the parent soil and irrigated soil respectively. Table 3.7: Salt balance summary Parent soil (tonnes of salt) Amended soil (tonnes of salt) Difference (tonnes of salt) Input Rain Input Irrigation Input Soil Output Salts flushed out* Output Salts leached* Output Crop *estimated values based on required leaching fraction and site observations Rain EC of rain = ~50 us/cm (TDS = 32.5 mg/l) x 82.7 ML = 2.68 tonnes Total salts applied = 2.68 tonnes Soil salts inthe soil to 40 cm = (Ca, Mg, Na, K) = 1,928 mg/kg 47,712,240 kg of soil to m (avge depth over 12 ha) Total salts in soil = tonnes Crop None Total Na removed from soil = 0 tonnes Na flushedto surface after rainfall (~15 %) Total Na removed from soil = 0.40 tonnes Leached below root zone (~15 % of salts present in soil) Total Na leached = tonnes Will depend on rainfall patterns and IFD however poorly drained soils to depth indicate a dominance of runoff over percolation in the Avon River catchment Figure 3.7: Salt mass balance for the parent soil prior to irrigation (gold boxes are assumptions) Rain + Irrigation EC of rain = ~50 us/cm (TDS = 32.5 mg/l) x 82.7 ML = 2.68 tonnes EC of irrigation = (avge) 1850 us/cm (TDS = mg/l ) x ML = tonnes Total salts applied = tonnes Soil salts inthe soil to 40 cm = (Ca, Mg, Na, K) = 3,693 mg/kg 47,712,240 kg of soil to m (avge depth over 12 ha) Total salts in soil = tonnes Leached below root zone (LF = 15 %) Total salts leached = tonnes Low rate irrigation (< 1mm/hr) will not promote deep drainage to the regional water table however significant rainfall events of suitable IFD will promote deep drainage during those times. Poorly drained soils to depth indicating a dominance of runoff over percolation in the Avon River catchment Crop Lucerne: 49.3 t x (Ca, Mg, Na, K = 43,000 mg/kg) = 2.12 tonnes Annuals: 87.9 t x (Ca, Mg, Na, K = 31,590 mg/kg) = 2.78 tonnes Total salts removed from soil by crops = 4.9 tonnes Salts flushedto surface after rainfall (~ 15% of salts applied) Total salts removed from soil = tonnes See EC data from catch dams Figure 3.8: Salt mass balance for the amended soil after irrigation (1/4/2013 4/7/2014) (gold boxes are assumptions) 25
 were defined as the salt load. Where have the salts gone?")


29 The gold boxes in Figures 3.7 and 3.8 represent assumptions based on site observations and typical irrigation principles. The green boxes are inputs and outputs based on measured data where the sum of the average Ca, Mg, Na and K (in mg/kg, 0-40 cm depth) were defined as the salt load. Where have the salts gone? The comparison between the parent soil (Figure 3.7) and the irrigated soil (Figure 3.8) indicate that salt is most likely accumulating in the poorly drained soils. For example, approximately 92 tonnes of salt were present in the parent soil, and after 15 months of irrigation adding tonnes of salt from blended water, we would expect a total salt mass of approximately 170 tonnes. Recent soil results indicate approximately 176 tonnes of salt is present however if the salts removed by the crops (4.9 tonnes) is subtracted from the soil salt mass, the value (~172 tonnes) suggests little movement of salts from the site (net mass balance of near zero). Therefore, it is likely that the LF has been over-estimated considering the poorly drained soils as indicated by low saturated hydraulic conductivity (K sat). Have salts been flushed from the soil during rain events? It is uncertain whether the rapid runoff attributes of the catchment has flushed some salts from the upper 40 cm of soil profile after rainfall and affected flows in surface runoff to the catch dams. Figure 3.9 shows the Catch Dam West (CDW) EC profile in conjunction with rainfall/runoff and timing of antecedent irrigation events (salt load shown in gold shaded area). There are several trends within the EC data collected from the catch dams. The salinity trend for CDW is shown in Figure 3.9 and trends are also similar for Catch Dam East (CDE); and both catch dams are detailed in Parsons Brinckerhoff (refer Figure 4.3 in PB, 2014c). Evaporative concentration effects in CDW Gradual decline in salinity due to flushing and salt removal from feedlot compost Catch dams pumped out in advance of rain Datalogger data is suspect from this period (logger not submerged) Figure 3.9: Catch dam EC profile in conjunction with rainfall/runoff and timing of antecedent irrigation events (salt load) 26
30 The main observations from Figure 3.9 show: EC maximum is only just above the EC of the blended water applied to the 12 ha; The shaded area (gold) shows periods of relatively higher intensity irrigation and the fact that we apply 25 mm over hours would mean that very little moisture would reach lower depths (application rate < 1 mm/hr); Rainfall pushes salts down the profile until the salt backs up (in the upper 40 cm) resulting in surface runoff to catch dams after significant rainfall events; There is a strong evaporation effect (i.e. increase in EC) evident in the residual dam water during spring and summer (periods of no runoff); and There is a gradual decline in salinity in CDW over the monitoring period due to flushing and the salt removal resulting from the application of composted feedlot manure before irrigation began Summary In summary, the key findings of section 3.7 are: 1. The Avon River catchment responds rapidly to significant rainfall due to poorly drained soils on cleared slopes, resulting in low EC runoff (after initial salinity spike); 2. Piezometer EC (soil-water measured in the field) and leaching fraction (based on both rainfall and irrigation) estimates (calculation) were found to reside in a similar range (~ ds/m); 3. Salinity in CDW has been generally decreasing since the commencement of the irrigation program. The application of composted feedlot manure prior to the irrigation trial resulted in a salt loading of ~1000 µs/cm at the commencement of the program. In addition, several salinity spikes in CDW have been recorded during the irrigation period due to minimal water being kept in the catch dams. During drier periods this residual water evaporates and higher salinity water stagnates in base of the dams. 4. The net mass balance for the period is near zero which suggests that salts are accumulating in the soil profile however they are not at a level detrimental to soil structure or crop growth at this time. 27
31 4. Performance of soils on the Stage 1A irrigation area This report (Report 4) was prepared after blended irrigation water was applied to the trial area and after the collection of Baseline 5 soil samples in May Soil analysis parameters The Stage 1A soil analysis program covers measurement of the parameters shown in Table 4.1 Table 4.1 Soil analysis parameters Parameter Measurement Units Chlorides mg/kg Electrical Conductivity - Soil:water (1:5) ds/m ph (1:5 water) - ph (1:5 CaCl 2) - Organic Carbon (OC) % Nitrate Nitrogen (NO 3) mg/kg Phosphorus (Colwell) mg/kg Phosphorus Buffer Index (PBI-Col) - Sulphur mg/kg Copper mg/kg Zinc mg/kg Manganese mg/kg Iron mg/kg Boron mg/kg Potassium mg/kg, meq/100g Calcium mg/kg, meq/100g Magnesium mg/kg, meq/100g Sodium mg/kg, meq/100g Aluminium mg/kg, meq/100g Potassium % % Calcium % % Magnesium % % Sodium % % Aluminium % % Effective Cation Exchange Capacity (ECEC) meq/100g Calcium/Magnesium Ratio - Soil texture - Soil colour - Physical analysis: (bulk density, porosity, and infiltration rate) - 28

32 The 16 soil sampling locations were chosen to sample representative soils in each of the 16 plots that comprise the Stage 1A area. At each location soils are sampled at 20 cm depth intervals to a depth of 1.2m or until refusal on weathered rock. The sampling locations within those plots that have been slotted to different depths are all located within the constructed slots. The reason for sampling within the slots is to assess where the salinity is migrating to in the profile. It is known that most of the irrigation and moisture is concentrated in the slots so the soil sampling to assess salinity trends is also within the slots Baseline 5 Amended soil sampling and test results The 16 soil sampling locations (CS1-CS16) were re-sampled on the 19 May 2014 and subsequently analysed. The location of these 16 sampling sites is shown in Attachment 1. These 16 vertical soil locations have been at the same location since the baseline sampling program in early Soil sampling is within each of the slots where slots are present within the plot. Soil samples were taken manually using a hand auger to the depths dictated by the different treatments in order to minimise disturbance. The full suite of desired samples was extracted (a sample is taken at 20 cm intervals at every location to a maximum depth of 120 cm). At some locations there is refusal on shallow weathered rock hence there is not full coverage to 120 cm. The summarised soil test results are shown in Attachment 3 together with the full sample results from each of these 16 sampling locations Key findings Baseline 5 (irrigated soils) vs Baseline 4 (irrigated soils) The changes in average values between Baseline 5 and Baseline 4 (November 2013) are shown in Attachment 4. In addition, Baseline 5 is also compared against Baseline 1 (parent soil) values. Salinity (as EC) As discussed in Report 2, the salinity spike resulting from the use of compost and the mixing of layer 3 of the parent soil has subsided. However average Baseline 5 data indicates an increase in EC at all depths greater than 20 cm compared to Baseline 4 results (refer Figure 4.1 and Figure 4.2). Figure 4.1: Change in (average) EC for all sites over subsequent sampling periods Figure 4.2 shows change in EC over subsequent sampling periods for a single site (CS3 with a treatment depth of 1200 mm). Salinity has increased at depths greater than 60 cm since the Baseline 4 sampling event in November
 over subsequent sampling periods Sodium and Exchangeable Sodium Percentage (ESP) The average sodium values have slightly increased at all")
33 Figure 4.2: Change in EC for site CS3 (treatment depth = 1200 mm) over subsequent sampling periods Sodium and Exchangeable Sodium Percentage (ESP) The average sodium values have slightly increased at all depths and as a result the exchangeable sodium percentages have also increased. These percentages were above the desirable level of < 6 % to 80 cm depth (refer to the composite changes shown in Figure 4.3). Soil ESP increased from Baseline 4 results at all depths however is still below Baseline 1 values (Parent soil). Additional soil monitoring after a series of large rainfall events will clarify the effectiveness of deep leaching due to rainfall. Figure 4.3. Change in Exchangeable Sodium Percentage (ESP) 30


34 Nitrate Nitrate levels at all sites are very low due to crop uptake. Calcium Calcium levels remained stable and have contributed to minimising soil ESP increases. Calcium/Magnesium Ratio A Calcium/Magnesium ratio of around 2 is considered to represent an optimum balance for plant growth. The calcium/magnesium ratio has increased to the optimum balance at depth. Effective Cation Exchange Capacity (ECEC) The cation exchange capacities have stabilised near the surface at all sites due to the addition of lime after Baseline 2 (refer Figure 4.4). This favours healthy plant growth, as discussed in Crop performance since planting. Figure 4.4: Change in (average) ECEC for all sites over subsequent sampling periods Soil structure Soil amendment and application of blended water has the potential to impact on soil structure. The Tiedman irrigation program has closely monitored soil structure, changes in soil chemistry, and the water quality of applied waters (irrigation and rainfall). Maintenance of soil structure can be interpreted from the leaching dynamics between Baseline soil sampling campaigns. For example, the first 5 columns (in blue) in Table 4.2 show average results for Baseline 1 (B1), Baseline 2 (B2), Baseline 3 (B3), Baseline 4 (B4) and Baseline 5 (B5). The 5 middle columns (in yellow) show the relative difference between each Baseline. The last 5 columns (in grey) show the relative difference between each Baseline compared to Baseline 1 (Parent soil). 31
35 Table 4.2 Leaching dynamics between Baseline soil surveys Changes in Na (mg/kg) cm B1 B2 B3 B4 B5 B2-B1 B3-B2 B4-B3 B5-B4 B2-B1 B3-B1 B4-B1 B5-B Changes in ESP (%) cm B1 B2 B3 B4 B5 B2-B1 B3-B2 B4-B3 B5-B4 B2-B1 B3-B1 B4-B1 B5-B Changes in Ca (mg/kg) cm B1 B2 B3 B4 B5 B2-B1 B3-B2 B4-B3 B5-B4 B2-B1 B3-B1 B4-B1 B5-B Changes in Mg (mg/kg) cm B1 B2 B3 B4 B5 B2-B1 B3-B2 B4-B3 B5-B4 B2-B1 B3-B1 B4-B1 B5-B Changes in Ca/Mg cm B1 B2 B3 B4 B5 B2-B1 B3-B2 B4-B3 B5-B4 B2-B1 B3-B1 B4-B1 B5-B Rainfall (mm) Irrigation (mm) Key: B1 = Baseline 1 soil sampling, B2 = Baseline 2 soil sampling, B3 = Baseline 3 soil sampling, B4 = Baseline 4 soil sampling, B5 = Baseline 5 soil sampling Table 4.2 indicates that, when compared to B1, sodium (Na + ) generally decreased for B2 and B3 then increased in B4 and again in B5. Similar trends can be observed in the soil ESP results which are a result of the balance between Na + and Calcium (Ca 2+ ) and Magnesium (Mg 2+ ). Importantly, both Ca 2+ and Mg 2+ remained relatively stable throughout the profile and their presence maintains soil ESP. Even though soil Na + increased from B3 to B4 to B5, the B5 results still remain less than B1 results (parent soil) at this time. Also, the Ca/Mg ratio has generally increased due to the previous addition of ameliorants and significantly, both cations have minimised Na + accumulation by preferentially occupying exchange sites in the soil. Another key to maintaining soil structure is the sodium adsorption ratio (SAR) of applied waters (irrigation and rainfall) and the subsequent impact on clay dispersion or flocculation. Clay dispersion is one end of diffuse double layer (DDL) theory where clay particles separate into single platelets; clay particle flocculation is where many platelets align together to form clusters. Both depend on the electrolyte concentration of the applied waters and the antecedent ESP of the receiving soil (refer Chapter 2 in Lucas, 2009). 32
36 The degree of clay dispersion that may occur has a direct effect on permeability and, as a result, downward soil water movement. Therefore maintaining clay (micro-aggregate) stability will promote suitable infiltration rates. Lucas (2009) describes the soil ESP/effluent SAR continuum for microaggregate/soil pore stability which predicts clay particle behaviour in a soil of known ESP and irrigated with a water of known SAR. Figure 4.2 Soil ESP/effluent SAR continuum for micro-aggregate/soil pore stability (from Lucas, 2009) Different electrolyte concentrations from blended irrigation water and from rainfall will initiate changes in clay particle behaviour (flocculation to dispersion) in the receiving soil over time. For example, the average soil ESP in the upper 40 cm of the soil profile was 9.2 in Baseline 5. The SAR of irrigation waters was approximately 12.9 during the same period. Based on the equation in Figure 4.2, the threshold concentration (C TH) that maintains micro-aggregate stability would be: C TH = (0.56 x 9.2) + (0.6) = 5.8 Note that the ESP = SAR between 0-32 and soil ESP is used in the equations in Figure 4.2. The applied blended water with a SAR of 12.9 exceeds the C TH indicating that while soil structure would be maintained there would be a small (expected) decrease in infiltration rate. Since the beginning of the irrigation program and in view of (recent) increasing soil ESP at the Gloucester site, has soil structure been significantly altered? Figure 4.3 conceptually shows the predicted susceptibility of clay dispersion (loss of soil structure) over time from irrigation with blended water and rainfall. The columns represent soil ESP at 0 40 cm depth and is an average of all soil sites (CS1 CS16). The C TU (red solid line) and C TH (green solid line) are based on soil ESP and equations in Figure 4.2 and, similar to soil ESP, also fluctuate over time. The purple dotted line represents the SAR of blended water applied to the site (variable SAR) and the light blue dotted line represents the SAR of rainfall (relatively constant SAR). 33

; 3.")

37 How to read Figure. 4.3: 1. Both the C TU and C TH lines will move up or down dependent on soil ESP, but the C TH will always be the same distance above the C TU and provides a zone of optimum permeability and stable soil structure; 2. Blended water SAR is highly variable while rainfall SAR remains relatively constant. Note: Rainfall will cause the most damage to a high ESP soil (> 18 in this case as the C TU and rainfall SAR would then be the same and dispersion will follow); 3. At current soil ESP values the soil structure is being maintained but towards the C TH end of the continuum. Further increases in soil ESP will trend towards poorer soil structure under the existing irrigation/rainfall regime. Figure 4.3: Conceptualisation of predicted susceptibility of clay dispersion from irrigation with blended CSG water and rainfall Problems may occur if Na + is allowed to accumulate over time as the soil ESP would gradually rise and micro-aggregate/soil pore stability would be reflected in the changing C TH and C TU. For example, if soil ESP increased to 20 % in the upper 40 cm of the soil profile then the corresponding C TH and C TU would be 12.6 and 4.2. This means that rainfall would cause complete dispersion of surface microaggregates that would block soil pore spaces and severely reduce infiltration in the upper 10 cm of the soil profile. It is important to note that as ESP increases, the electrolyte concentration of the applied solution must also increase to maintain optimum permeability. For example, Davidson and Quirk (1961) demonstrate the impact of changing the electrolyte concentration of irrigation waters, using Riverina clay (60% clay, ph=7.4, ESP=23) near Deniliquin, NSW. The soil was irrigated with waters that had an electrolyte concentration slightly higher than the C TH (point A in Figure 4.3) and with Murrumbidgee River water, which was approximately half the C TU (point B in Figure 4.3). In the first case, the 7.5 cm of water applied was observed to have permeated completely into the soil after 16 hours (Quirk, 2001). In contrast, large volumes of the Murrumbidgee water remained pooled on the surface after a similar time period. 34
38 Figure 4.3: Permeability as a function of electrolyte concentration and soil ESP (Lucas, 2009) Quirk (2001) states that when the irrigation water electrolyte concentration exceeds the C TH, the soil appears granular and dries to a friable state (flocculated). Conversely, when irrigation water electrolyte concentration is less than the C TU, the surface soil appears white (dispersed clay particles) and water remains pooled on the surface for extended periods (Quirk, 2001). Figure 4.3 shows permeability of a soil (same soil but with ESP s of 5.8, 8.9, 21 and 35 %) as a function of electrolyte concentration and soil ESP. From the graph it can be seen that at low electrolyte concentrations (< 2 mmol(+)/l) all soils (of varying soil ESP) decrease in permeability. This is due to the electrolyte concentration being less than the C TU and clay dispersion occurs. Dispersed clay particles translocate downwards through the soil profile and block soil pores in the upper 10 cm, resulting in a significant decrease in permeability. At higher electrolyte concentrations (> 4 mmol(+)/l) greater permeability can be maintained. This is due to the electrolyte concentration being greater than the C TH and a shift to clay flocculation occurs. Flocculated clay particles, while creating smaller pore spaces, can facilitate downward water movement through the soil profile to promote a leaching regime. Figure 4.3 also shows how soil permeability decreases with increasing soil ESP. Note: therefore, the aim of managing soil structure is about creating a leaching regime that allows the removal of excess Na + from the soil profile. Table 4.2 highlighted the dynamic leaching of Na + and the relatively stable presence of Ca 2+ and Mg 2+ and is mainly due to the seasonal rainfall patterns at Gloucester and optimising irrigation application at appropriate times (by water balance calculation). The soil structure in Stage 1A has significantly improved from the amendments (Baseline 2) however there are increasing soil EC and soil ESP trends after 14 months of irrigation that need to be addressed through a leaching management strategy. Consulting agronomist to AGL, MNC Agronomy, observed that: Soil structure has continued to improve, with heavier soil type areas (high clay %) becoming less noticeable in the top of the soil profile. MNC Agronomy, March/April 2014 Monthly Agronomy Report 35
39 4.4. Natural soil characteristics Independently of Fodder King, Parsons Brinckerhoff completed a survey of the mineral content of shallow soils across the whole of the Tiedman property in April 2014 (Parsons Brinckerhoff, 2014b). This report indicated that aluminium and iron were the highest metal concentrations in the natural soils across the property. Of the major cations, sodium was the most abundant and the highest concentrations observed were within the Stage 1A and Stage 1B irrigation areas. For the trace metals the concentrations were low with the different trace metals varying in concentration from site to site Soil profile descriptions In March 2014 a series of inspection pits were excavated and examined to monitor soil and crop performance in the Stage 1A area. Eight inspection pits were completed and detailed soil profile descriptions, along with high resolution photographs, are provided in Attachment 6. As part of the new TIP REF approval conditions, this 6-monthly compliance report needs to include: Detailed soil profile descriptions, including high resolution photos of soil profiles; and Description of soil structure, soil colour and mottles These aspects are all included in the Stage 1A soil profile descriptions that is included as Attachment Electromagnetic Survey Results The results of the second electromagnetic (EM) survey will be issued as an addendum to this report. The first EM31 survey was completed in June 2011 and the results are presented in Fodder King,
40 5. Performance of soils on the Stage 1B irrigation area 5.1. Irrigation area The area selected for the Stage 1B area has no previous history of cropping or substantial soil improvement, although improved pasture was briefly irrigated in 2009 when small amounts of produced water were irrigated under an earlier REF approval (details provided in AGL, 2010). Some soil sampling and monitoring was completed as part of this earlier irrigation program. The Stage 1B area is approximately 4.1 hectares in area and is located to the south of the Stage 1A trial area. The Stage 1B irrigation area is shown in Attachment 2. A single composite soil sample was prepared from a series of samples collected along diagonal transects across plots AL1/2 and AL3/4 respectively. The same transect has been used each sampling round to assess salinity changes in the shallow soil profile. Soil samples were taken manually using a hand auger to a depth of 200mm in order to minimise disturbance Baseline 4 amended soil sampling and test results A soil composite sample was taken on the 19 May 2014 and subsequently analysed. Soil samples were taken (transect approach) manually using a hand auger (to 200 mm soil depth) in order to minimise disturbance. The full suite of desired samples was extracted. The summarised soil test results are shown in Attachment 5 together with the full sample results from each of the sampling locations Key findings Baseline 4 (irrigated soils) vs Baseline 3 (irrigated soils) Baseline 4 (irrigated soil) vs Baseline 3 (irrigated soil) key findings include (to 200 mm): Decrease in soil EC (0.26 to 0.24 ds/cm) Increase in soil ph (CaCl 2) (4.98 to 5.4) Increase in soil ESP (15 % to 16.7 %) because Na + increased and Ca 2+ and Mg 2+ remained stable Organic carbon remained similar to Baseline 3 at around 2.9 % Ca 2+ slightly increased from 898 to 1056 mg/kg ECEC slightly increased from 10 to 11.4 meq/100g These increases in shallow soil attributes are due to the application of blended irrigation waters with relatively high sodium concentrations and relatively high ph. There was no deep leaching and limited rainfall during the monitoring period to reduce these salt increases in the shallow profile Key findings Baseline 4 (irrigated soils) vs Baseline 1 (parent soil) Baseline 4 (irrigated soil) vs Baseline 1 (parent soil) key findings include (to 200 mm): Increase in soil EC (0.21 to 0.24 ds/cm) Increase in soil ph (CaCl 2) (4.63 to 5.4) Decrease in soil ESP (17 % to 16.7 %) Organic carbon remained similar to Baseline 1 at around 2.9 % Ca 2+ increased from 431 to 1056 mg/kg due to lime addition ECEC increased from 6.3 to 11.4 meq/100g 37
41 6. Sedimentation, runoff and erosion control A number of environmental protection measures were installed across the Stage 1A irrigation area to ensure that bare soils were not eroded during rainfall events and to ensure that soil and sediment was retained within the irrigation plot areas Protection measures The following sedimentation, runoff and erosion control protection measures were installed for the Stage 1A trial irrigation area. Trial plot bunding and drainage to catch dams; Diversion banks to catch all runoff from the trial plots and divert it to the catch dams; Two catch dams with pumps and recycling pipework to collect any runoff from the trial area and recycle it back to the storage dam; Modern overhead spray irrigation system; Diversion drains to prevent the possibility of any overland runoff entering the trial area; and Spray-grassing of all structures. The environmental protection measures were supplemented by the following monitoring locations which are in place to minimise sediment runoff and subsurface water migration: 10 soil moisture monitoring positions; Seven paired sets of piezometers to monitor for soil water (ephemeral and permanent) One pair of piezometers to monitor for sub-surface leakage from the western catch dam; Six rain gauges; and An automatic weather station Summary of weather and irrigation applied The key information relevant to the performance of the sedimentation, runoff and erosion control measures during the reporting period is shown in Table Rainfall Rainfall for the reporting period totalled mm, as recorded by the AGL weather station on Tiedmans. This compares with a total of mm recorded at the Bureau of Meteorology (BOM) site at Gloucester Post Office (site no 60015). January rainfall was 92 % less than the mean, February rainfall was 58% less than the mean, March rainfall was 14 % above the mean, April was 26 % less than the mean, May was 84 % below the mean and June (including to 4 th July) was 64 % less than the mean. Total rainfall for the period (303.4 mm) was 47 % less than the mean (577.4 mm) for the period Rain days Out of the 181 days in the reporting period, 73 days (40 %) were wet. A wet day occurred when 0.2 mm (or more) of rainfall was registered in the Tiedmans weather station rain gauge Rainfall intensity All of the rain events that occurred during the period were below the threshold level of 24.9 mm/hour which defines a 1 in 1 year rainfall event at Tiedmans. See FK (2012) Soil Quality Monitoring and Management Program Tiedman irrigation trial. The highest hourly rainfall intensity rate was 21.2 mm/hour, which occurred on the 16/02/
42 Blended water irrigation Blended water irrigation occurred in all months except April when no water was irrigated. Table Key weather and irrigation information Key information Rainfall AGL weather station (mm) Bureau of Meteorology Gloucester Post Office (mm) Mean monthly rainfall at Gloucester Post Office (mm) Number of rain days ( 0.2mm recorded) Percentage rain days Highest rainfall days Highest hourly rainfall rate (mm/hr) Blended water irrigation application Total applied water (rainfall plus blended water) Blended water salinity January February March April May June- July4th Total for period mm 299.2mm mm % 43 % 48 % 57 % 26 % 50 % 40 % 2.8 mm (23/01/14) 1.6mm/hr (23/01/14) 30.4 mm (17/02/14) 21.2mm/hr (17/02/14) 39.8 mm (1/03/14) 5.4mm/hr (2/03/14) 34.2 mm (25/04/14) 10.6mm/hr (4/04/14) 3.6 mm (12/05/14) 2.2mm/hr (12/05/14) 7.0 mm (22/06/14) 2.6mm/hr (28/06/14) 39.8 mm (1/03/14) 21.2mm/hr (16/02/14) mm 34.7 mm 12.3 mm 0mm 20.4 mm 39.3 mm mm mm 92.9 mm mm 77.0 mm 29.8 mm 65.1 mm mm 1540 µs/cm 1540 µs/cm 1540 µs/cm 1540 µs/cm 1540 µs/cm 1540 µs/cm 1540 µs/cm 6.3. Performance under rainfall and irrigation The combined application of rainfall and blended water irrigation totalled mm, which is approximately 11% lower than the mean rainfall for Gloucester (refer Table 6.1) Trial plot bunding and drainage to catch dams All plot bunds performed to design requirement during the period. Some small non-draining low lying areas occurred at the inside corners of some of the northern plots but the area affected was not considered to be significant enough to warrant any remedial measures. 39
43 Diversion banks to catch runoff from the trial plots and divert it to the catch dams. All diversion banks performed satisfactorily during the monitoring period Two catch dams with pumps and recycling pipework Both Catch Dam 1 (CDE) and Catch Dam 2 (CDW) operated to design requirements. Water collected in the catch dams was pumped back to the blended water dam (TSD) on the Tiedman property Overhead spray system The irrigation system was managed in accordance with the operating procedures and blended water was applied when there was sufficient deficit available in the soil profile Diversion drains All diversion drains operated satisfactorily during the period and erosion had not occurred due to grassing of the drains and installation of silt traps at regular intervals Spray-grassing of all structures All bund walls, diversion banks and diversion drains have a well-established grass cover and are mowed to ensure that there are no flow blockages. The grassed aprons in front of the catch dams, in conjunction with geo-fabric netting, have prevented any erosion from occurring as well as preventing any siltation of the dams. 40
44 7. Stage 1A critical control point monitoring and response plan 7.1. Critical Control Points The following critical control points were nominated in the soil quality monitoring and management plan. Full details are provided in Fodder King (2012) Soil Quality Monitoring and Management Program Tiedman irrigation trial. Table 7.1: Stage 1A Irrigation Area Critical control points Critical Control Point CSG Dam and Mixing Dam Catch Dams Hazard Trigger Response Mitigation Risk Brackish overflow to landscape Brackish overflow to landscape Excessive rainfall Excessive rainfall or irrigation Record and report lost volume from storages Keep dams empty at all times. Record and report lost volume from storages + halt irrigation Continual monitoring of dam depth and salinity with maintenance of adequate freeboard Continual monitoring of dam depth and salinity Low Low Soil moisture monitoring system System failure Sensor fault Halt irrigation Replace defective sensors Low Shallow piezometer water level Perched water tables Excessive rainfall and/or over-irrigation Adjust irrigation rates Review irrigation schedule Low Ameliorated soil in the irrigation area (1) Increasing salinity Soil salinity increase of more than 50% above the average value of the new baseline for the ameliorated soils Review with agencies and if necessary: Increase dilution of CSG water. Adjust irrigation rates. Install collection and recycling system. 6 monthly soil sampling Low Non - ameliorated parent soil (2) Increasing salinity Soil salinity increase of more than 50% above the average value of 0.12 ds/m (1:5) in the root zone to 1m depth Review with agencies and if necessary: Compare against external control site Increase dilution of CSG water. Adjust irrigation rates. 6 monthly soil sampling Very Low Key (1) across the 16 ameliorated soil sampling sites. (2) across 5 proposed parent soil locations (four internal sites within each of the 4 soil treatment types plus one external control site Approximately ML of blended irrigation water was applied across the Stage 1A area during this reporting period compared to the previous reporting period where ML was applied. There were no events that triggered an operational response. Each of the Critical Control Points in Table 7.1 are discussed below. 41
45 7.2. CSG water dam and mixing dam During the reporting period there were no trigger events and consequently there was no brackish water overflow to the landscape from the Tiedman storage dams Catch Dams During the reporting period water levels in the two catch dams were kept low in order to collect any first flush run-off from the Stage 1A irrigation area. As a result of the ongoing monitoring of the daily water balance a soil water buffer storage volume was maintained at all times to minimise the risk of run-off occurring. When run-off was collected in the catch dams, float-activated pumps recycled this water back to the blended water dam (Tiedman South dam). There was one overflow event in March 2014 after a period of heavy rain. The water that discharged as overland flow was low salinity (Parsons Brinckerhoff, 2014c). Consequently there was no overflow of brackish water to the landscape Soil moisture monitoring system There were no system failures to the soil moisture monitoring system. One of the moisture probes will need to be repaired to solve a problem with intermittent readings but this is considered to be a minor maintenance issue Shallow piezometer water level The soil piezometers within the Stage 1A irrigation area generally contained more water than the corresponding piezometers in the non-ameliorated and non-irrigated parent soil. This is due to the substantially improved infiltration rate of the ameliorated soils inside the trial area, resulting in the promotion of downward movement of water into the soil (to treatment depth), rather than surface runoff which would occur in the parent soils. Most piezometers accumulated water during high rainfall however piezometer water level trends indicate that this water either percolated to a lower depth in the soil over time and/or was taken up and transpired by plants Ameliorated soil in the irrigation area Following on from Report 3, there has been a general increase in average soil EC (see Table 7.2). Table 7.2 Percentage change in average soil salinity between Baselines Weighted average salinity (ds/m) Weighted average salinity (ds/m) Weighted average salinity (ds/m) Weighted average salinity (ds/m) Baseline 2 EC Baseline 3 EC Percentage change between Baselines % Baseline 3 EC Baseline 4 EC % Baseline 4 EC Baseline 5 EC % Baseline 2 EC Baseline 4 EC % Baseline 2 EC Baseline 5 EC Weighted average % salinity (ds/m) Note: Weighted average salinity is calculated by taking the EC value at each depth interval and assigning a weighting based on the number of samples taken at that interval, repeated for all intervals and totalled. 42
46 However, as shown in Table 7.2, the percentage changes in the weighted average EC values between Baselines 2, 3, 4 and 5 have not exceeded the trigger point of a 50 % increase in EC over Baseline 2 (ameliorated soil). The weighted average Baseline 5 EC was still 36 % below the Baseline 2 (ameliorated soil) EC Non-ameliorated parent soil Two parent soil sampling points (PS1 and PS2) located downhill and outside of the western end of the irrigation area were selected and sampled as part of Baseline 5. An A horizon (0-200 mm) and B horizon sample ( mm) was extracted and tested for EC as shown in Table 7.3. Table 7.3 Parent soil salinity outside irrigation area Soil sample location A Horizon (0-200 mm) (ds/m) B Horizon ( mm) (ds/m) PS PS Average The trigger point of 50% above the average value of 0.12 ds/m has not been exceeded. 43
47 8. Conclusions A summary of conclusions, focussing on the Stage 1A area (the main focus of the Tiedmans Irrigation Trial) is provided below: 8.1. Stage 1A area A volume of ML of blended water was irrigated across this area in the 6 months from 1 January to 4 July 2014 Water balance management in conjunction with a number of environmental protective measures resulted in all blended water being consumed within the irrigation area. Salinity and sodium concentrations have increased at depths greater than 20 cm across all soil sampling sites in the Stage 1A area but have had a limited effect on improved soil structure at this time. Soil salinity for Baseline 5 is still below the ameliorated soil levels that were measured in Baseline 2. Soil piezometer behaviour indicates that there is no permanent soil water accumulating in the shallow soil profile due to irrigation activities. The Exchangeable Sodium Percentages (ESP) for Baseline 5 are generally lower than the parent soil but slightly above the ameliorated soil, indicating that, while sodium is being mobilised downwards through the ameliorated soil, its further movement may be limited by the lower infiltration rate characteristics of the deeper parent soils. Calcium and Magnesium levels have remained stable while the Sodium has been mobilised downwards, resulting in generally better soil quality for supporting crops, as measured by Effective Cation Exchange Capacity (ECEC). Soil structure has been significantly improved by amelioration and shows no indication of adverse effects, such as abnormal salinity or sodium accumulation, or clay particle dispersion, being caused by irrigation water. The net mass balance is close to zero, indicating that salts are accumulating in the soil profile but not at a level detrimental to soil structure or crop growth. The crops demonstrated healthy growth and yields under the application of blended water Stage 1B area A volume of 7.48 ML of blended water was irrigated across this area in the 6 months from 1 January to 4 July Crop usage has been carried out by grazing of the area with an acceptable stocking rate. Salinity (as EC) and sodium concentrations have increased at a higher rate (in the near surface) than in the Stage 1A area. Soil piezometer behaviour indicates that there is no permanent soil water accumulating due to irrigation. The Exchangeable Sodium Percentages (ESP) for Baseline 4 are now similar to the parent soil. Calcium and magnesium levels have remained stable, resulting in generally better soil quality for supporting crops, as measured by Effective Cation Exchange Capacity (ECEC). There has been a larger increase in salt accumulation in Stage 1B compared to Stage 1A. 44
48 References AGL (2010) Irrigation monitoring report for Stratford Pilot Tiedman Property AGL Upstream Gas. AGL (2012) Water Management Plan for the Tiedman Irrigation Program Gloucester, AGL Upstream Gas. ANZECC (2000) Australian and New Zealand Guidelines for Fresh and Marine Water Quality Volumes 3 and 4. Australian and New Zealand Environment and Conservation Council & Agriculture and Resource Management Council of Australia and New Zealand, Canberra Ayers, R.S & Westcot, D.W (1994) Water quality for agriculture. FAO Irrigation and Drainage Paper No 29, Rev 1. (FAO, Rome). DECC (2004) Environmental Guidelines: Use of Effluent by Irrigation, NSW Department of Environment and Conservation, ISBN Fodder King (2010) Technical Assessment of land in the Gloucester Basin for irrigation of CSG water, Report for AGL Upstream Investments Pty Ltd. Fodder King (2011) Preliminary Investigations and Design of an Irrigation Trial on land in the Gloucester Basin for irrigation of CSG water, Report for AGL Upstream Investments Pty Ltd. Fodder King (2012) Soil Quality Monitoring and Management Program Tiedman irrigation trial, Report for AGL Upstream Investments Pty Ltd. Fodder King (2013a) Soil quality monitoring and management, Report 1- Pre irrigation (Activities to 31 March 2013), Report for AGL Upstream Investments Pty Ltd. Fodder King (2013b) Soil quality monitoring and management, Report 2- Irrigation (Activities from 1 April to 30 June 2013), Report for AGL Upstream Investments Pty Ltd Fodder King (2014a) Soil quality monitoring and management, Report 3- Irrigation (Activities from 1 July to 31 st December 2013), Report for AGL Upstream Investments Pty Ltd Fodder King (2014b) Summary Report 2 (Soil and cropping activities from 1 st September 2013 to 31 st March 2014), Report for AGL Upstream Investments Pty Ltd Lucas S.A (2009) Sodium flux in Woodlot Soils Irrigated with Treated Effluent: The Implications for Sustainable Irrigation and Soil Management, Lambert Academic Publishing, Saarbrucken, p195 Henderson L (2000) Soil Landscapes of the Dungog 1: Sheet. Map and Report. Department of Land and Water Conservation Parsons Brinckerhoff (2011) Gloucester Exploration Program - Irrigation Proposal Review of Environmental Factors, Report PR_5506 for AGL Energy Limited. Parsons Brinckerhoff (2013) Tiedman Irrigation Trial August 2013 Water Compliance Report Gloucester Gas Project. Report RPT 7408 Rev C to AGL Upstream Investments Parsons Brinckerhoff (2014a) Tiedman Irrigation Program - Water Compliance Report for the Period 1 July to 31 December 2013, Report Rpt 7674 RevB to AGL Upstream Investments. Parsons Brinckerhoff (2014b) Tiedman Property Gloucester Analysis of trace metals in soils and general soil chemistry. 11 July AGL Upstream Investments. 45
49 Parsons Brinckerhoff (2014c) Tiedman Irrigation Program - Water Compliance Report for the Period 1 January to 4 July 2014, Report F-WAT-RPT-001 RevC to AGL Upstream Investments Davidson, J. L. and Quirk, J. P. (1961). The influence of dissolved gypsum on pasture establishment on irrigated sodic clays. Australian Journal of Agricultural Research. 12: Quirk, J. P. (2001). The significance of the threshold and turbidity concentrations in relation to sodicity and microstructure. Australian Journal of Soil Research. 39:
50 Attachments Attachment 1 Stage 1A area plot layout Attachment 2 Stage 1B area plot layout Attachment 3 Stage 1A Baseline 5 summary tables and soil test results Attachment 4 Stage 1A Baseline 5 vs Baseline 4 comparisons Attachment 5 Stage 1B soil test summary tables and results Attachment 6 Soil profile descriptions 47
51 Attachment 1. Stage 1A area plot layout A1
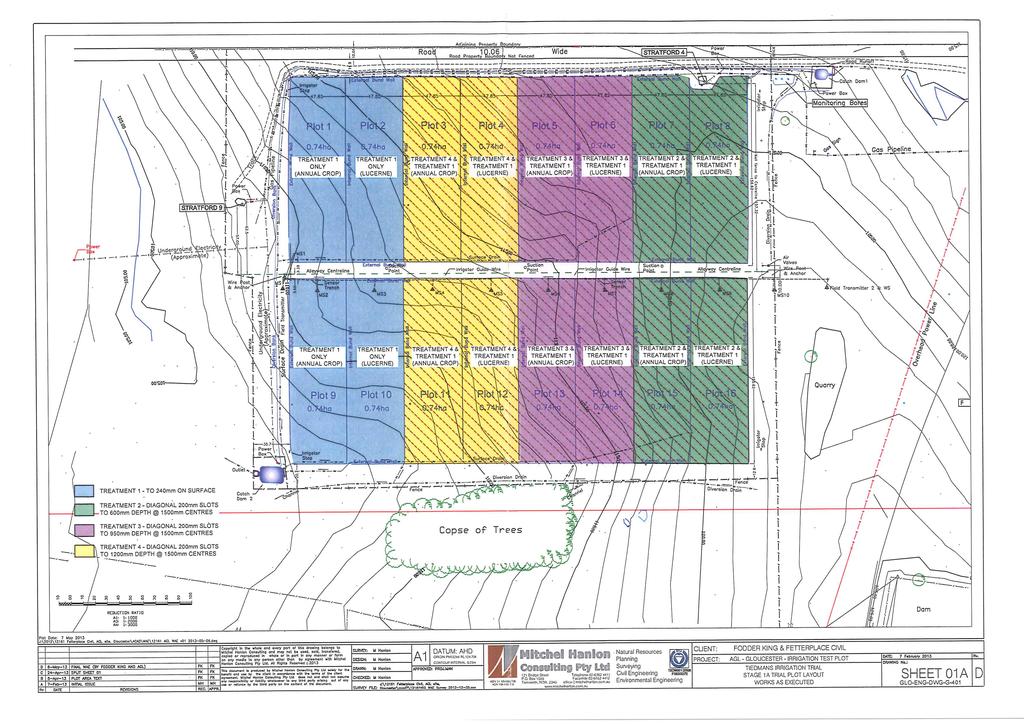
52 A1-1
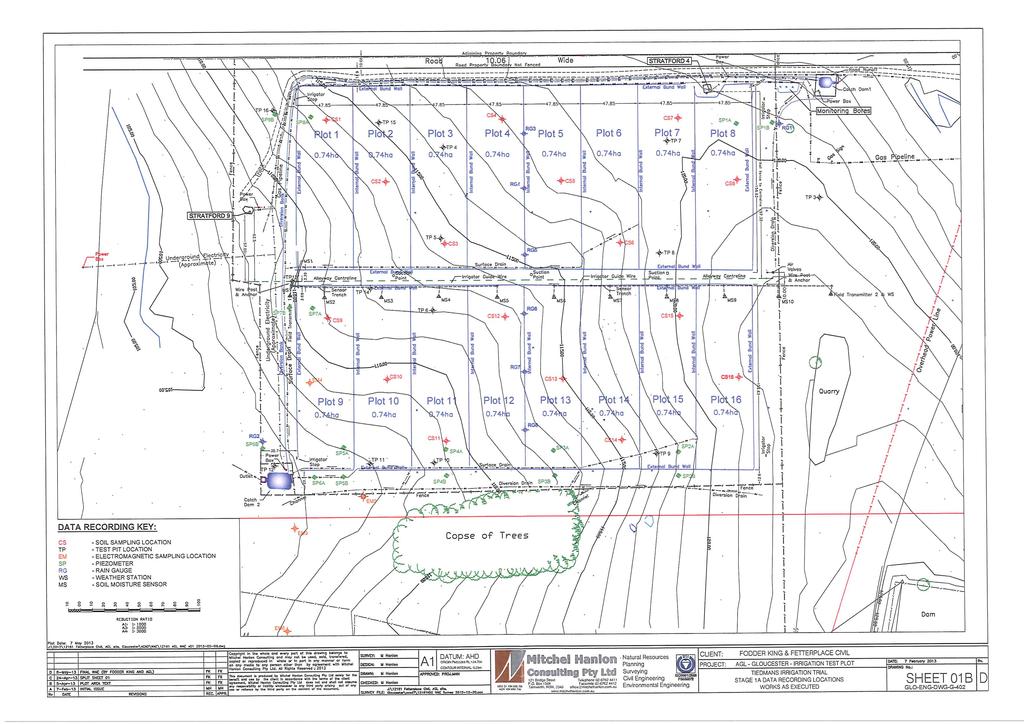
53 A1-2
54 Attachment 2. Stage 1 B area plot layout A2


 A1 DATUM: AHD")


55 AL 1 - AERATE SOIL TO 300mm, SPREAD 4 TONNES/HA LIME, SOWN WITH PASTURE MIX (71% RYEGRASS, 20% CLOVER, 9% CHICORY) AL 2 - AERATE SOIL TO 300mm, SPREAD 4 TONNES/HA LIME & 1 TONNE/HA CALCIUM, SULPHUR TRACE MINERALS, SOWN WITH PASTURE MIX (71% RYEGRASS, 20% CLOVER, 9% CHICORY) AL 3 - AERATE SOIL TO 300mm, SPREAD 4 TONNES/HA LIME, SOWN WITH PASTURE MIX (71% RYEGRASS, 20% CLOVER, 9% CHICORY) AL 4 - AERATE SOIL TO 300mm, SPREAD 4 TONNES/HA LIME & 1 TONNE/HA CALCIUM, SULPHUR TRACE MINERALS, SOWN WITH PASTURE MIX (71% RYEGRASS, 20% CLOVER, 9% CHICORY) A1 DATUM: AHD ORIGIN:PM55266 RL: CONTOUR INTERVAL: 0.25m ABN Bridge Street P.O. Box 1568 Telephone: Facsimile: AL 2 AL 1 AL 3 Natural Resources Planning Surveying Civil Engineering ISO9001:2008 FS Environmental Engineering CLIENT: PROJECT: FODDER KING AGL - GLOUCESTER - IRRIGATION TEST PLOT TIEDMANS IRRIGATION TRIAL STAGE 1B TRIAL PLOT LAYOUT SHEET 05 A2-1
56 Attachment 3. Stage 1A Baseline 5 summary tables and soil test results A3
57 AVERAGE Depth EC (1:5) ph NO3 Org-C K Ca Mg Na Al K Ca Mg Na Al K Ca Mg Na Al ECEC Ca/Mg ESP N = cm ds/m CaCl2 mg/kg % meq/100g meq/100g meq/100g meq/100g meq/100g mg/kg mg/kg mg/kg mg/kg mg/kg % % % % % meq/100g ratio % Standard Deviation Depth EC (1:5) ph NO3 Org-C K Ca Mg Na Al K Ca Mg Na Al K Ca Mg Na Al ECEC Ca/Mg ESP N = cm ds/m CaCl2 mg/kg % meq/100g meq/100g meq/100g meq/100g meq/100g mg/kg mg/kg mg/kg mg/kg mg/kg % % % % % meq/100g ratio % STAGE 1A BASELINE 5 SOIL TEST RESULTS A3-1 Maximum Depth EC (1:5) ph NO3 Org-C K Ca Mg Na Al K Ca Mg Na Al K Ca Mg Na Al ECEC Ca/Mg ESP N = cm ds/m CaCl2 mg/kg % meq/100g meq/100g meq/100g meq/100g meq/100g mg/kg mg/kg mg/kg mg/kg mg/kg % % % % % meq/100g ratio % Minimum Depth EC (1:5) ph NO3 Org-C K Ca Mg Na Al K Ca Mg Na Al K Ca Mg Na Al ECEC Ca/Mg ESP N = cm ds/m CaCl2 mg/kg % meq/100g meq/100g meq/100g meq/100g meq/100g mg/kg mg/kg mg/kg mg/kg mg/kg % % % % % meq/100g ratio %


58 82 Plain Street Tamworth NSW 2340 P F admin@eastwestonline.com.au ABN ANALYSIS REPORT SOIL Project No: EW Date of Issue: 18/6/2014 Customer: Fodder King Report No: 1 Address: PO Box 148 Date Received: 20/05/2014 Dulwich Hill NSW 2203 Attention: Paul McCardell Matrix: Soil Phone: Location: AGL Gloucester Fax: - Sampler ID: Client Supplied fodder@fodderking.com.au Date of Sampling: 20/05/2014 Sample Condition: Acceptable Results apply to the samples submitted. All pages of this report have been checked and approved for release. This report supersedes any previous report. Signed: Stephanie Cameron Operations Manager PROFICIENT LAB Visit to view our certification details. East West is certified by the Australian-Asian Soil & Plant Analysis Council to perform various soil and plant tissue analysis. The tests reported herein have been performed in accordance with our terms of accreditation. This report must not be reproduced except in full and EWEA takes no responsibility of the end use of the results within this report. This analysis relates to the sample submitted and it is the client's responsibility to make certain the sample is representative of the matrix to be tested. Samples will be discarded one month after the date of this report. Please advise if you wish to have your sample/s returned. SSss Document ID: REP-02 Issued By: S. Cameron Issue No: 2 Date of Issue: 21/1/13 A3-2 Page 1 of 18
59 ANALYSIS REPORT Project No: EW Sample ID CS1 CS2 CS3 CS3 Analyte Method Units LOR Chlorides Probe R&L 5A1 mg/kg Electrical Conductivity Soil:Water (1:5) R&L 3A1 ds/m ph (H2O) Electrode R&L 4A1 ph units na ph (CaCl 2 ) Electrode R&L 4B1 ph units na NO 3 -Nitrogen Ex Phosphorus Colwell Aqueous Buffer In House mg/kg 2 UV-Vis R&L 9B1 mg/kg 2 PBI PBI (Col) R&L 9I2a mg/kg 10 Sulphur ICP-OES R&L 10D1 mg/kg Organic Carbon LECO R&L 6B3 % 0.2 Total Carbon LECO R&L 6B2 % 0.2 Copper Ex ICP-OES R&L 12A1 mg/kg Zinc Ex ICP-OES R&L 12A1 mg/kg Manganese Ex ICP-OES R&L 12A1 mg/kg <1.0 Iron Ex ICP-OES R&L 12A1 mg/kg 1 Depth (cm) Boron Ex ICP-OES R&L 12C2 mg/kg mg/kg meq/100g mg/kg meq/100g mg/kg meq/100g mg/kg meq/100g Potassium Ex ICP-OES R&L 15D Calcium Ex ICP-OES R&L 15D Magnesium Ex ICP-OES R&L 15D Sodium Ex ICP-OES R&L 15D Aluminium Ex ICP-OES R&L 15G Ex Potassium % Calc - % na Ex Calcium % Calc - % na Ex Magnesium % Calc - % na Ex Sodium % Calc - % na Ex Aluminium % Calc - % na ECEC Calc - meq/100g na Colwell Potassium AAS R&L 18A1 mg/kg Texture McDonald et al - Class na CL CL CL LMC Colour Munsell - Class na 10YR 2/2 10YR 4/3 10YR 3/2 10YR 3/ Document ID: REP-01 Issued By: S. Cameron Issue No: 2 Date of Issue: 15/11/12 A3-3 Page 2 of 18
60 ANALYSIS REPORT Project No: EW Method Reference Analyte Method Units LOR Chlorides Probe R&L 5A1 mg/kg Electrical Conductivity Soil:Water (1:5) R&L 3A1 ds/m ph (H2O) Electrode R&L 4A1 ph units na ph (CaCl 2 ) Electrode R&L 4B1 ph units na 4.79 NO 3 -Nitrogen Ex Aqueous Buffer In House mg/kg Phosphorus Colwell PBI Sulphur UV-Vis R&L 9B1 mg/kg 2 PBI (Col) R&L 9I2a mg/kg 10 ICP-OES R&L 10D1 mg/kg 1 Organic Carbon LECO R&L 6B3 % 0.2 Total Carbon LECO R&L 6B2 % 0.2 Copper Ex ICP-OES R&L 12A1 mg/kg Zinc Ex ICP-OES R&L 12A1 mg/kg Manganese Ex ICP-OES R&L 12A1 mg/kg 1 <1 <1 <1 <1 Iron Ex ICP-OES R&L 12A1 mg/kg 1 Sample ID CS3 CS3 CS3 CS3 Depth (cm) Boron Ex ICP-OES R&L 12C2 mg/kg 0.25 <0.25 <0.25 <0.25 <0.25 mg/kg meq/100g mg/kg meq/100g mg/kg meq/100g mg/kg meq/100g Potassium Ex ICP-OES R&L 15D Calcium Ex ICP-OES R&L 15D Magnesium Ex ICP-OES R&L 15D Sodium Ex ICP-OES R&L 15D Aluminium Ex ICP-OES R&L 15G Ex Potassium % Calc - % na Ex Calcium % Calc - % na Ex Magnesium % Calc - % na Ex Sodium % Calc - % na Ex Aluminium % Calc - % na ECEC Calc - meq/100g na Colwell Potassium AAS R&L 18A1 mg/kg Texture McDonald et al - Class na MC MC MC MC Colour Munsell - na 10YR 5/4 10YR 4/3 10YR 4/2 10YR 4/3 Document ID: REP-01 Issued By: S. Cameron Issue No: 2 Date of Issue: 15/11/12 A3-4 Page 3 of 18
61 ANALYSIS REPORT Project No: EW Method Reference Analyte Method Units LOR Chlorides Probe R&L 5A1 mg/kg Electrical Conductivity Soil:Water (1:5) R&L 3A1 ds/m ph (H2O) Electrode R&L 4A1 ph units na ph (CaCl 2 ) Electrode R&L 4B1 ph units na NO 3 -Nitrogen Ex Aqueous Buffer In House mg/kg Phosphorus Colwell UV-Vis R&L 9B1 mg/kg PBI Sulphur PBI (Col) R&L 9I2a mg/kg 10 ICP-OES R&L 10D1 mg/kg 1 Organic Carbon LECO R&L 6B3 % 0.2 Total Carbon LECO R&L 6B2 % 0.2 Copper Ex ICP-OES R&L 12A1 mg/kg Zinc Ex ICP-OES R&L 12A1 mg/kg Manganese Ex ICP-OES R&L 12A1 mg/kg <1 <1 <1 Iron Ex ICP-OES R&L 12A1 mg/kg 1 Sample ID CS4 CS4 CS4 CS4 Depth (cm) Boron Ex ICP-OES R&L 12C2 mg/kg <0.25 mg/kg meq/100g mg/kg meq/100g mg/kg meq/100g mg/kg meq/100g Potassium Ex ICP-OES R&L 15D Calcium Ex ICP-OES R&L 15D Magnesium Ex ICP-OES R&L 15D Sodium Ex ICP-OES R&L 15D Aluminium Ex ICP-OES R&L 15G Ex Potassium % Calc - % na Ex Calcium % Calc - % na Ex Magnesium % Calc - % na Ex Sodium % Calc - % na Ex Aluminium % Calc - % na ECEC Calc - meq/100g na Colwell Potassium AAS R&L 18A1 mg/kg Texture McDonald et al - Class na LMC MC MC MC Colour Munsell - Class na 10YR 3/3 10YR 4/3 10YR 4/3 10YR 5/3 Document ID: REP-01 Issued By: S. Cameron Issue No: 2 Date of Issue: 15/11/12 A3-5 Page 4 of 18
62 ANALYSIS REPORT Project No: EW Method Reference Analyte Method Units LOR Chlorides Probe R&L 5A1 mg/kg Electrical Conductivity Soil:Water (1:5) R&L 3A1 ds/m ph (H2O) Electrode R&L 4A1 ph units na ph (CaCl 2 ) Electrode R&L 4B1 ph units na 6.73 NO 3 -Nitrogen Ex Aqueous Buffer In House mg/kg Phosphorus Colwell PBI Sulphur UV-Vis R&L 9B1 mg/kg 2 PBI (Col) R&L 9I2a mg/kg 10 ICP-OES R&L 10D1 mg/kg 1 Organic Carbon LECO R&L 6B3 % 0.2 Total Carbon LECO R&L 6B2 % 0.2 Copper Ex ICP-OES R&L 12A1 mg/kg Zinc Ex ICP-OES R&L 12A1 mg/kg Manganese Ex ICP-OES R&L 12A1 mg/kg 1 <1 < Iron Ex ICP-OES R&L 12A1 mg/kg 1 Sample ID CS4 CS4 CS5 CS5 Depth (cm) Boron Ex ICP-OES R&L 12C2 mg/kg 0.25 < mg/kg meq/100g mg/kg meq/100g mg/kg meq/100g mg/kg meq/100g Potassium Ex ICP-OES R&L 15D Calcium Ex ICP-OES R&L 15D Magnesium Ex ICP-OES R&L 15D Sodium Ex ICP-OES R&L 15D Aluminium Ex ICP-OES R&L 15G Ex Potassium % Calc - % na Ex Calcium % Calc - % na Ex Magnesium % Calc - % na Ex Sodium % Calc - % na Ex Aluminium % Calc - % na ECEC Calc - meq/100g na Colwell Potassium AAS R&L 18A1 mg/kg Texture McDonald et al - Class na HC HC CL LMC Colour Munsell - Class na 10YR 4/3 10YR 4/4 10YR 3/2 10YR 4/2 Document ID: REP-01 Issued By: S. Cameron Issue No: 2 Date of Issue: 15/11/12 A3-6 Page 5 of 18
63 ANALYSIS REPORT Project No: EW Method Reference Analyte Method Units LOR Chlorides Probe R&L 5A1 mg/kg Electrical Conductivity Soil:Water (1:5) R&L 3A1 ds/m ph (H2O) Electrode R&L 4A1 ph units na ph (CaCl 2 ) Electrode R&L 4B1 ph units na NO 3 -Nitrogen Ex Aqueous Buffer In House mg/kg Phosphorus Colwell PBI Sulphur UV-Vis R&L 9B1 mg/kg 2 PBI (Col) R&L 9I2a mg/kg 10 ICP-OES R&L 10D1 mg/kg 1 Organic Carbon LECO R&L 6B3 % 0.2 Total Carbon LECO R&L 6B2 % 0.2 Copper Ex ICP-OES R&L 12A1 mg/kg Zinc Ex ICP-OES R&L 12A1 mg/kg Manganese Ex ICP-OES R&L 12A1 mg/kg <1 3.7 Iron Ex ICP-OES R&L 12A1 mg/kg 1 Sample ID CS5 CS5 CS5 CS6 Depth (cm) Boron Ex ICP-OES R&L 12C2 mg/kg <0.25 < mg/kg meq/100g mg/kg meq/100g mg/kg meq/100g mg/kg meq/100g Potassium Ex ICP-OES R&L 15D Calcium Ex ICP-OES R&L 15D Magnesium Ex ICP-OES R&L 15D Sodium Ex ICP-OES R&L 15D Aluminium Ex ICP-OES R&L 15G Ex Potassium % Calc - % na Ex Calcium % Calc - % na Ex Magnesium % Calc - % na Ex Sodium % Calc - % na Ex Aluminium % Calc - % na ECEC Calc - meq/100g na Colwell Potassium AAS R&L 18A1 mg/kg Texture McDonald et al - Class na LMC SC SC CL Colour Munsell - Class na 10YR 4/4 10YR 4/1 10YR 6/6 10YR 2/2 Document ID: REP-01 Issued By: S. Cameron Issue No: 2 Date of Issue: 15/11/12 A3-7 Page 6 of 18
64 ANALYSIS REPORT Project No: EW Method Reference Analyte Method Units LOR Chlorides. R&L 5A1 mg/kg Electrical Conductivity Soil:Water (1:5) R&L 3A1 ds/m ph (H2O) Electrode R&L 4A1 ph units na ph (CaCl 2 ) Electrode R&L 4B1 ph units na NO 3 -Nitrogen Ex Aqueous Buffer In House mg/kg Phosphorus Colwell UV-Vis R&L 9B1 mg/kg PBI Sulphur PBI (Col) R&L 9I2a mg/kg 10 ICP-OES R&L 10D1 mg/kg 1 Organic Carbon LECO R&L 6B3 % 0.2 Total Carbon LECO R&L 6B2 % 0.2 Copper Ex ICP-OES R&L 12A1 mg/kg Zinc Ex ICP-OES R&L 12A1 mg/kg Manganese Ex ICP-OES R&L 12A1 mg/kg <1 Iron Ex ICP-OES R&L 12A1 mg/kg 1 Sample ID CS6 CS6 CS6 CS6 Depth (cm) < Boron Ex ICP-OES R&L 12C2 mg/kg <0.25 <0.25 mg/kg meq/100g mg/kg meq/100g mg/kg meq/100g mg/kg meq/100g Potassium Ex ICP-OES R&L 15D Calcium Ex ICP-OES R&L 15D Magnesium Ex ICP-OES R&L 15D Sodium Ex ICP-OES R&L 15D Aluminium Ex ICP-OES R&L 15G Ex Potassium % Calc - % na Ex Calcium % Calc - % na Ex Magnesium % Calc - % na Ex Sodium % Calc - % na Ex Aluminium % Calc - % na ECEC Calc - meq/100g na Colwell Potassium AAS R&L 18A1 mg/kg Texture McDonald et al - Class na MC MC MC HC Colour Munsell - Class na 10YR 4/3 10YR 5/3 10YR 4/3 10YR 5/4 Document ID: REP-01 Issued By: S. Cameron Issue No: 2 Date of Issue: 15/11/12 A3-8 Page 7 of 18
65 ANALYSIS REPORT Project No: EW Sample ID CS7 CS7 CS7 CS8 Method Reference Analyte Method Units LOR Chlorides Probe R&L 5A1 mg/kg Electrical Conductivity Soil:Water (1:5) R&L 3A1 ds/m ph (H2O) Electrode R&L 4A1 ph units na ph (CaCl 2 ) Electrode R&L 4B1 ph units na NO 3 -Nitrogen Ex Aqueous Buffer In House mg/kg Phosphorus Colwell PBI Sulphur UV-Vis R&L 9B1 mg/kg 2 PBI (Col) R&L 9I2a mg/kg 10 ICP-OES R&L 10D1 mg/kg 1 Organic Carbon LECO R&L 6B3 % 0.2 Total Carbon LECO R&L 6B2 % 0.2 Copper Ex ICP-OES R&L 12A1 mg/kg Zinc Ex ICP-OES R&L 12A1 mg/kg Manganese Ex ICP-OES R&L 12A1 mg/kg Iron Ex ICP-OES R&L 12A1 mg/kg 1 Depth (cm) Boron Ex ICP-OES R&L 12C2 mg/kg < mg/kg meq/100g mg/kg meq/100g mg/kg meq/100g mg/kg meq/100g Potassium Ex ICP-OES R&L 15D Calcium Ex ICP-OES R&L 15D Magnesium Ex ICP-OES R&L 15D Sodium Ex ICP-OES R&L 15D Aluminium Ex ICP-OES R&L 15G Ex Potassium % Calc - % na Ex Calcium % Calc - % na Ex Magnesium % Calc - % na Ex Sodium % Calc - % na Ex Aluminium % Calc - % na ECEC Calc - meq/100g na Colwell Potassium AAS R&L 18A1 mg/kg Texture McDonald et al - Class na LC LMC LMC CL Colour Munsell - Class na 10YR 2/2 10YR 4/3 10YR 5/4 10YR 2/ Document ID: REP-01 Issued By: S. Cameron Issue No: 2 Date of Issue: 15/11/12 A3-9 Page 8 of 18
66 ANALYSIS REPORT Project No: EW Method Reference Analyte Method Units LOR Chlorides Probe R&L 5A1 mg/kg Electrical Conductivity Soil:Water (1:5) R&L 3A1 ds/m ph (H2O) Electrode R&L 4A1 ph units na ph (CaCl 2 ) Electrode R&L 4B1 ph units na NO 3 -Nitrogen Ex Aqueous Buffer In House mg/kg Phosphorus Colwell UV-Vis R&L 9B1 mg/kg PBI Sulphur PBI (Col) R&L 9I2a mg/kg 10 ICP-OES R&L 10D1 mg/kg 1 Organic Carbon LECO R&L 6B3 % 0.2 Total Carbon LECO R&L 6B Copper Ex ICP-OES R&L 12A1 mg/kg Zinc Ex ICP-OES R&L 12A1 mg/kg < Manganese Ex ICP-OES R&L 12A1 mg/kg < Iron Ex ICP-OES R&L 12A1 mg/kg 1 Sample ID CS8 CS8 CS9 CS10 Depth (cm) Boron Ex ICP-OES R&L 12C2 mg/kg < mg/kg meq/100g mg/kg meq/100g mg/kg meq/100g mg/kg meq/100g Potassium Ex ICP-OES R&L 15D Calcium Ex ICP-OES R&L 15D Magnesium Ex ICP-OES R&L 15D Sodium Ex ICP-OES R&L 15D Aluminium Ex ICP-OES R&L 15G Ex Potassium % Calc - % na Ex Calcium % Calc - % na Ex Magnesium % Calc - % na Ex Sodium % Calc - % na Ex Aluminium % Calc - % na ECEC Calc - meq/100g na Colwell Potassium AAS R&L 18A1 mg/kg Texture McDonald et al - Class na MC MC CL CL Colour Munsell - Class na 10YR 4/3 10YR 5/6 10YR 2/2 10YR 4/3 Document ID: REP-01 Issued By: S. Cameron Issue No: 2 Date of Issue: 15/11/12 A3-10 Page 9 of 18
67 ANALYSIS REPORT Project No: EW Method Reference Analyte Method Units LOR Chlorides Probe R&L 5A1 mg/kg Electrical Conductivity Soil:Water (1:5) R&L 3A1 ds/m ph (H2O) Electrode R&L 4A1 ph units na ph (CaCl 2 ) Electrode R&L 4B1 ph units na 6.90 NO 3 -Nitrogen Ex Aqueous Buffer In House mg/kg Phosphorus Colwell PBI Sulphur UV-Vis R&L 9B1 mg/kg 2 PBI (Col) R&L 9I2a mg/kg 10 ICP-OES R&L 10D1 mg/kg 1 Organic Carbon LECO R&L 6B3 % 0.2 Total Carbon LECO R&L 6B2 % 0.2 Copper Ex ICP-OES R&L 12A1 mg/kg Zinc Ex ICP-OES R&L 12A1 mg/kg Manganese Ex ICP-OES R&L 12A1 mg/kg Iron Ex ICP-OES R&L 12A1 mg/kg 1 Sample ID CS11 CS11 CS11 CS11 Depth (cm) Boron Ex ICP-OES R&L 12C2 mg/kg <0.25 <0.25 mg/kg meq/100g mg/kg meq/100g mg/kg meq/100g mg/kg meq/100g Potassium Ex ICP-OES R&L 15D Calcium Ex ICP-OES R&L 15D Magnesium Ex ICP-OES R&L 15D Sodium Ex ICP-OES R&L 15D Aluminium Ex ICP-OES R&L 15G Ex Potassium % Calc - % na Ex Calcium % Calc - % na Ex Magnesium % Calc - % na Ex Sodium % Calc - % na Ex Aluminium % Calc - % na ECEC Calc - meq/100g na Colwell Potassium AAS R&L 18A1 mg/kg Texture McDonald et al - Class na CL MC MC MC Colour Munsell - Class na 10YR 3/2 10YR 5/4 10YR 6/3 10YR 5/2 Document ID: REP-01 Issued By: S. Cameron Issue No: 2 Date of Issue: 15/11/12 A3-11 Page 10 of 18
68 ANALYSIS REPORT Project No: EW Method Reference Analyte Method Units LOR Chlorides Probe R&L 5A1 mg/kg Electrical Conductivity Soil:Water (1:5) R&L 3A1 ds/m ph (H2O) Electrode R&L 4A1 ph units na ph (CaCl 2 ) Electrode R&L 4B1 ph units na NO 3 -Nitrogen Ex Aqueous Buffer In House mg/kg Phosphorus Colwell UV-Vis R&L 9B1 mg/kg PBI Sulphur PBI (Col) R&L 9I2a mg/kg 10 ICP-OES R&L 10D1 mg/kg 1 Organic Carbon LECO R&L 6B3 % 0.2 Total Carbon LECO R&L 6B2 % 0.2 Copper Ex ICP-OES R&L 12A1 mg/kg Zinc Ex ICP-OES R&L 12A1 mg/kg Manganese Ex ICP-OES R&L 12A1 mg/kg Iron Ex ICP-OES R&L 12A1 mg/kg 1 Sample ID CS11 CS11 CS12 CS12 Depth (cm) Boron Ex ICP-OES R&L 12C2 mg/kg 0.25 <0.25 < mg/kg meq/100g mg/kg meq/100g mg/kg meq/100g mg/kg meq/100g Potassium Ex ICP-OES R&L 15D Calcium Ex ICP-OES R&L 15D Magnesium Ex ICP-OES R&L 15D Sodium Ex ICP-OES R&L 15D Aluminium Ex ICP-OES R&L 15G Ex Potassium % Calc - % na Ex Calcium % Calc - % na Ex Magnesium % Calc - % na Ex Sodium % Calc - % na Ex Aluminium % Calc - % na ECEC Calc - meq/100g na Colwell Potassium AAS R&L 18A1 mg/kg Texture McDonald et al - Class na MC MC CL CL Colour Munsell - Class na 10YR 5/1 10YR 5/3 10YR 3/1 10YR 4/1 Document ID: REP-01 Issued By: S. Cameron Issue No: 2 Date of Issue: 15/11/12 A3-12 Page 11 of 18
69 ANALYSIS REPORT Project No: EW Method Reference Analyte Method Units LOR Chlorides Probe R&L 5A1 mg/kg Electrical Conductivity Soil:Water (1:5) R&L 3A1 ds/m ph (H2O) Electrode R&L 4A1 ph units na ph (CaCl 2 ) Electrode R&L 4B1 ph units na NO 3 -Nitrogen Ex Aqueous Buffer In House mg/kg Phosphorus Colwell PBI Sulphur UV-Vis R&L 9B1 mg/kg 2 PBI (Col) R&L 9I2a mg/kg 10 ICP-OES R&L 10D1 mg/kg 1 Organic Carbon LECO R&L 6B3 % 0.2 Total Carbon LECO R&L 6B2 % 0.2 Copper Ex ICP-OES R&L 12A1 mg/kg Zinc Ex ICP-OES R&L 12A1 mg/kg Manganese Ex ICP-OES R&L 12A1 mg/kg Iron Ex ICP-OES R&L 12A1 mg/kg 1 Sample ID CS12 CS12 CS12 CS12 Depth (cm) Boron Ex ICP-OES R&L 12C2 mg/kg mg/kg meq/100g mg/kg meq/100g mg/kg meq/100g mg/kg meq/100g Potassium Ex ICP-OES R&L 15D Calcium Ex ICP-OES R&L 15D Magnesium Ex ICP-OES R&L 15D Sodium Ex ICP-OES R&L 15D Aluminium Ex ICP-OES R&L 15G Ex Potassium % Calc - % na Ex Calcium % Calc - % na Ex Magnesium % Calc - % na Ex Sodium % Calc - % na Ex Aluminium % Calc - % na ECEC Calc - meq/100g na Colwell Potassium AAS R&L 18A1 mg/kg Texture McDonald et al - Class na MC MC MC MC Colour Munsell - Class na 10YR 3/3 10YR 4/4 10YR 3/1 10YR 5/4 Document ID: REP-01 Issued By: S. Cameron Issue No: 2 Date of Issue: 15/11/12 A3-13 Page 12 of 18
70 ANALYSIS REPORT Project No: EW Method Reference Analyte Method Units LOR Chlorides Probe R&L 5A1 mg/kg Electrical Conductivity Soil:Water (1:5) R&L 3A1 ds/m ph (H2O) Electrode R&L 4A1 ph units na ph (CaCl 2 ) Electrode R&L 4B1 ph units na 6.45 NO 3 -Nitrogen Ex Aqueous Buffer In House mg/kg Phosphorus Colwell PBI Sulphur UV-Vis R&L 9B1 mg/kg 2 PBI (Col) R&L 9I2a mg/kg 10 ICP-OES R&L 10D1 mg/kg 1 Organic Carbon LECO R&L 6B3 % 0.2 Total Carbon LECO R&L 6B2 % 0.2 Copper Ex ICP-OES R&L 12A1 mg/kg Zinc Ex ICP-OES R&L 12A1 mg/kg Manganese Ex ICP-OES R&L 12A1 mg/kg Iron Ex ICP-OES R&L 12A1 mg/kg 1 Sample ID CS13 CS13 CS13 CS13 Depth (cm) Boron Ex ICP-OES R&L 12C2 mg/kg mg/kg meq/100g mg/kg meq/100g mg/kg meq/100g mg/kg meq/100g Potassium Ex ICP-OES R&L 15D Calcium Ex ICP-OES R&L 15D Magnesium Ex ICP-OES R&L 15D Sodium Ex ICP-OES R&L 15D Aluminium Ex ICP-OES R&L 15G Ex Potassium % Calc - % na Ex Calcium % Calc - % na Ex Magnesium % Calc - % na Ex Sodium % Calc - % na Ex Aluminium % Calc - % na ECEC Calc - meq/100g na Colwell Potassium AAS R&L 18A1 mg/kg Texture McDonald et al - Class na CL LMC MC MC Colour Munsell - Class na 7.5YR 3/2 10YR 3/2 10YR 3/3 10YR 4/2 Document ID: REP-01 Issued By: S. Cameron Issue No: 2 Date of Issue: 15/11/12 A3-14 Page 13 of 18
71 ANALYSIS REPORT Project No: EW Method Reference Analyte Method Units LOR Chlorides Probe R&L 5A1 mg/kg Electrical Conductivity Soil:Water (1:5) R&L 3A1 ds/m ph (H2O) Electrode R&L 4A1 ph units na ph (CaCl 2 ) Electrode R&L 4B1 ph units na NO 3 -Nitrogen Ex Aqueous Buffer In House mg/kg Phosphorus Colwell PBI Sulphur UV-Vis R&L 9B1 mg/kg 2 PBI (Col) R&L 9I2a mg/kg 10 ICP-OES R&L 10D1 mg/kg 1 Organic Carbon LECO R&L 6B3 % 0.2 Total Carbon LECO R&L 6B2 % 0.2 Copper Ex ICP-OES R&L 12A1 mg/kg Zinc Ex ICP-OES R&L 12A1 mg/kg Manganese Ex ICP-OES R&L 12A1 mg/kg Iron Ex ICP-OES R&L 12A1 mg/kg 1 Sample ID CS13 CS14 CS14 CS14 Depth (cm) Boron Ex ICP-OES R&L 12C2 mg/kg 0.25 < mg/kg meq/100g mg/kg meq/100g mg/kg meq/100g mg/kg meq/100g Potassium Ex ICP-OES R&L 15D Calcium Ex ICP-OES R&L 15D Magnesium Ex ICP-OES R&L 15D Sodium Ex ICP-OES R&L 15D Aluminium Ex ICP-OES R&L 15G Ex Potassium % Calc - % na Ex Calcium % Calc - % na Ex Magnesium % Calc - % na Ex Sodium % Calc - % na Ex Aluminium % Calc - % na ECEC Calc - meq/100g na Colwell Potassium AAS R&L 18A1 mg/kg Texture McDonald et al - Class na SC CL LMC MC Colour Munsell - Class na 10YR 5/6 10YR 3/2 10YR 5/3 10YR 4/2 Document ID: REP-01 Issued By: S. Cameron Issue No: 2 Date of Issue: 15/11/12 A3-15 Page 14 of 18
72 ANALYSIS REPORT Project No: EW Method Reference Analyte Method Units LOR Chlorides Probe R&L 5A1 mg/kg Electrical Conductivity Soil:Water (1:5) R&L 3A1 ds/m ph (H2O) Electrode R&L 4A1 ph units na ph (CaCl 2 ) Electrode R&L 4B1 ph units na NO 3 -Nitrogen Ex Aqueous Buffer In House mg/kg Phosphorus Colwell PBI Sulphur UV-Vis R&L 9B1 mg/kg 2 PBI (Col) R&L 9I2a mg/kg 10 ICP-OES R&L 10D1 mg/kg 1 Organic Carbon LECO R&L 6B3 % 0.2 Total Carbon LECO R&L 6B2 % 0.2 Copper Ex ICP-OES R&L 12A1 mg/kg Zinc Ex ICP-OES R&L 12A1 mg/kg Manganese Ex ICP-OES R&L 12A1 mg/kg Iron Ex ICP-OES R&L 12A1 mg/kg 1 Sample ID CS14 CS14 CS15 CS15 Depth (cm) Boron Ex ICP-OES R&L 12C2 mg/kg mg/kg meq/100g mg/kg meq/100g mg/kg meq/100g mg/kg meq/100g Potassium Ex ICP-OES R&L 15D Calcium Ex ICP-OES R&L 15D Magnesium Ex ICP-OES R&L 15D Sodium Ex ICP-OES R&L 15D Aluminium Ex ICP-OES R&L 15G Ex Potassium % Calc - % na Ex Calcium % Calc - % na Ex Magnesium % Calc - % na Ex Sodium % Calc - % na Ex Aluminium % Calc - % na ECEC Calc - meq/100g na Colwell Potassium AAS R&L18A1 mg/kg Texture McDonald et al - Class na MC MC LMC CL Colour Munsell - Class na 10YR 5/6 10YR 5/6 10YR 2/2 10YR 4/3 Document ID: REP-01 Issued By: S. Cameron Issue No: 2 Date of Issue: 15/11/12 A3-16 Page 15 of 18
73 ANALYSIS REPORT Project No: EW Method Reference Analyte Method Units LOR Chlorides Probe R&L 5A1 mg/kg Electrical Conductivity Soil:Water (1:5) R&L 3A1 ds/m ph (H2O) Electrode R&L 4A1 ph units na ph (CaCl 2 ) Electrode R&L 4B1 ph units na NO 3 -Nitrogen Ex Aqueous Buffer In House mg/kg Phosphorus Colwell PBI Sulphur UV-Vis R&L 9B1 mg/kg 2 PBI (Col) R&L 9I2a mg/kg 10 ICP-OES R&L 10D1 mg/kg 1 Organic Carbon LECO R&L 6B3 % 0.2 Total Carbon LECO R&L 6B2 % 0.2 Copper Ex ICP-OES R&L 12A1 mg/kg Zinc Ex ICP-OES R&L 12A1 mg/kg Manganese Ex ICP-OES R&L 12A1 mg/kg <1 Iron Ex ICP-OES R&L 12A1 mg/kg 1 Sample ID CS15 CS16 CS16 CS16 Depth (cm) Boron Ex ICP-OES R&L 12C2 mg/kg 0.25 < mg/kg meq/100g mg/kg meq/100g mg/kg meq/100g mg/kg meq/100g Potassium Ex ICP-OES R&L 15D Calcium Ex ICP-OES R&L 15D Magnesium Ex ICP-OES R&L 15D Sodium Ex ICP-OES R&L 15D Aluminium Ex ICP-OES R&L 15G Ex Potassium % Calc - % na Ex Calcium % Calc - % na Ex Magnesium % Calc - % na Ex Sodium % Calc - % na Ex Aluminium % Calc - % na ECEC Calc - meq/100g na Colwell Potassium AAS R&L18A1 mg/kg Texture McDonald et al - Class na LMC CL MC MC Colour Munsell - Class na 10YR 3/3 10YR 5/4 10YR 5/6 10YR 5/4 Document ID: REP-01 Issued By: S. Cameron Issue No: 2 Date of Issue: 15/11/12 A3-17 Page 16 of 18
74 ANALYSIS REPORT Project No: EW Method Reference Analyte Method Units LOR Chlorides Probe R&L 5A1 mg/kg Electrical Conductivity Soil:Water (1:5) R&L 3A1 ds/m ph (H2O) Electrode R&L 4A1 ph units na ph (CaCl 2 ) Electrode R&L 4B1 ph units na NO 3 -Nitrogen Ex Aqueous Buffer In House mg/kg Phosphorus Colwell PBI Sulphur UV-Vis R&L 9B1 mg/kg 2 PBI (Col) R&L 9I2a mg/kg 10 ICP-OES R&L 10D1 mg/kg 1 Organic Carbon LECO R&L 6B3 % 0.2 Total Carbon LECO R&L 6B2 % 0.2 Copper Ex ICP-OES R&L 12A1 mg/kg Zinc Ex ICP-OES R&L 12A1 mg/kg < Manganese Ex ICP-OES R&L 12A1 mg/kg < <1 Iron Ex ICP-OES R&L 12A1 mg/kg 1 Sample ID PS1 A PS1 B PS2 A PS2 B Depth (cm) Boron Ex ICP-OES R&L 12C2 mg/kg < mg/kg meq/100g mg/kg meq/100g mg/kg meq/100g mg/kg meq/100g Potassium Ex ICP-OES R&L 15D Calcium Ex ICP-OES R&L 15D Magnesium Ex ICP-OES R&L 15D Sodium Ex ICP-OES R&L 15D Aluminium Ex ICP-OES R&L 15G Ex Potassium % Calc - % na Ex Calcium % Calc - % na Ex Magnesium % Calc - % na Ex Sodium % Calc - % na Ex Aluminium % Calc - % na ECEC Calc - meq/100g na Colwell Potassium AAS R&L 18A1 mg/kg Texture McDonald et al - Class na FSCL LMC CL MC Colour Munsell - Class na 7.5YR 4/6 10YR 5/3 10YR 4/4 10YR 5/4 Document ID: REP-01 Issued By: S. Cameron Issue No: 2 Date of Issue: 15/11/12 A3-18 Page 17 of 18
75 Attachment 4. Stage 1A Baseline 5 vs Baseline 4 comparisons A4
76 Differences in average values between Baseline 5 (irrigated) and Baseline 4 (irrigated) Differences in average values between Baseline 4 (irrigated) and Baseline 3 (irrigated) Differences in average values between Baseline 3 (irrigated) and Baseline 2 (ameliorated) Depth EC (1:5) ph NO3 Org-C K Ca Mg Na Al K Ca Mg Na Al K Ca Mg Na Al ECEC ESP cm ds/m CaCl2 Mg/kg % meq/100g meq/100g meq/100g meq/100g meq/100g mg/kg mg/kg mg/kg mg/kg mg/kg % % % % % meq/100g % A4-1 Depth EC (1:5) ph NO3 Org-C K Ca Mg Na Al K Ca Mg Na Al K Ca Mg Na Al ECEC ESP cm ds/m CaCl2 mg/kg % meq/100g meq/100g meq/100g meq/100g meq/100g mg/kg mg/kg mg/kg mg/kg mg/kg % % % % % meq/100g % Depth EC (1:5) ph NO3 Org-C K Ca Mg Na Al K Ca Mg Na Al K Ca Mg Na Al ECEC ESP cm ds/m CaCl2 mg/kg % meq/100g meq/100g meq/100g meq/100g meq/100g mg/kg mg/kg mg/kg mg/kg mg/kg % % % % % meq/100g %
77 Differences in average values between Baseline 3 (irrigated) and Baseline 1 (parent soil) Denotes an increase in Baseline soil test values compared to previous Baseline soil test values Depth EC (1:5) ph NO3 Org-C K Ca Mg Na Al K Ca Mg Na Al K Ca Mg Na Al ECEC ESP cm ds/m CaCl2 mg/kg % meq/100g meq/100g meq/100g meq/100g meq/100g mg/kg mg/kg mg/kg mg/kg mg/kg % % % % % meq/100g % A4-2
78 Attachment 5. Stage 1B soil test summary tables and results A5
79 STAGE 1 B SOIL TEST RESULTS Nutrient Units Result- Baseline 1 Result Baseline 2 Result Baseline 3 Result Baseline 4 Chlorides mg/kg Electrical Conductivity ds/m ph (CaCl 2 ) ph units NO 3 - Nitrogen extract mg/kg Phosphorous Colwell mg/kg Sulphur mg/kg Organic Carbon % Copper ex mg/kg 0.49 < Zinc ex mg/kg Manganese ex mg/kg Boron ex mg kg Potassium ex mg/kg Potassium ex meq/100g Calcium ex mg/kg Calcium ex meq/100g Magnesium ex mg/kg Magnesium ex meq/100g Sodium ex mg/kg Sodium ex meq/100g Aluminium ex mg/kg Aluminium ex meq/100g Ex Potassium % Ex Calcium % Ex Magnesium % Ex Sodium % Ex Aluminium % ECEC Meq/100g A5-1
80 ANALYSIS REPORT Project No: EW Analyte Chlorides Electrical Conductivity ph (H2O) ph (CaCl 2 ) NO 3 -Nitrogen Ex Phosphorus Colwell PBI Sulphur Method Method Reference Units Sample ID LOR Probe R&L 5A1 mg/kg 5 Soil:Water (1:5) R&L 3A1 ds/m 0.01 Electrode R&L 4A1 ph units na Electrode R&L 4B1 ph units na Aqueous Buffer In House mg/kg 2 UV-Vis R&L 9B1 mg/kg 2 PBI (Col) R&L 9I2a mg/kg 10 ICP-OES R&L 10D1 mg/kg 1 Organic Carbon LECO R&L 6B3 % 0.2 Total Carbon LECO R&L 6B2 % 0.2 Copper Ex Zinc Ex Manganese Ex Iron Ex Boron Ex ICP-OES R&L 12A1 mg/kg 0.5 ICP-OES R&L 12A1 mg/kg 0.5 ICP-OES R&L 12A1 mg/kg 1 ICP-OES R&L 12A1 mg/kg 1 ICP-OES R&L 12C2 mg/kg B Comp Depth cm mg/kg meq/100g Potassium Ex ICP-OES R&L 15D Calcium Ex ICP-OES R&L 15D Magnesium Ex ICP-OES R&L 15D Sodium Ex ICP-OES R&L 15D Aluminium Ex ICP-OES R&L 15G Ex Potassium % Calc - % na 6.08 Ex Calcium % Calc - % na 46.1 Ex Magnesium % Calc - % na 30.7 Ex Sodium % Calc - % na 16.7 Ex Aluminium % Calc - % na 0.34 ECEC Calc - meq/100g na 11.4 Colwell Potassium AAS R&L 18A1 mg/kg Texture McDonald et al - Class na L Colour Munsell - Class na 10YR 3/2 This Analysis Report shall not be reproduced except in full without the written approval of the laboratory. DOCUMENT END Document ID: REP-01 Issued By: S. Cameron Issue No: 2 Date of Issue: 15/11/12 A5-2 Page 18 of 18
81 Attachment 6. Stage 1A Soil profile descriptions A6

82 1. Introduction Soil test pits were inspected in March 2014 to determine the performance of ameliorated soils in the Stage 1A irrigation area at the Tiedmans site. Observations and soil descriptions were recorded on the day and an A and B horizon sample from each test pit were collected for analysis. Soil classification was determined based on soil description and analysis results. This report summarises test pit observations and soil analysis, description and classification. 2. Method Eight test pits were excavated using a backhoe to reveal the soil profile including at least one slot in each treatment. The location of the test pits in the Stage 1A irrigation area are shown in Figure A. Treatment characteristics of each test pit site are summarised in Table 1. Figure 1: Test pit locations in the Stage 1A irrigation area at Tiedmans 1 A6-1
Analysis of chicken litter
 Using chicken litter to fertilise pastures Raw chicken litter can be a valuable resource to optimise pasture production. It is mostly organic matter and supplies nutrients, helps hold moisture, improves
Holcim (Australia) Pty Limited. Lynwood Quarry Groundwater Monitoring Program Revision 2
 Pty Limited. Lynwood Quarry Groundwater Monitoring Program Revision 2") Holcim (Australia) Pty Limited Lynwood Quarry Groundwater Monitoring Program Revision 2 June 2011 Lynwood Quarry Groundwater Monitoring Program Revision 2 Prepared by on behalf of Holcim (Australia) Pty
Holcim (Australia) Pty Limited Lynwood Quarry Groundwater Monitoring Program Revision 2 June 2011 Lynwood Quarry Groundwater Monitoring Program Revision 2 Prepared by on behalf of Holcim (Australia) Pty
ON THE DISPOSAL OF PRODUCED WATER FROM COAL SEAM GAS PRODUCTION A CASE STUDY, GLOUCESTER NSW. by Philip J Pells FTSE, DSc
 ON THE DISPOSAL OF PRODUCED WATER FROM COAL SEAM GAS PRODUCTION A CASE STUDY, GLOUCESTER NSW 1. INTRODUCTION by Philip J Pells FTSE, DSc This note deals with the proposal for disposal of produced water
Managing Salinity in Walnuts. Janet Caprile Farm Advisor UC Cooperative Extension Contra Costa & Alameda Counties
 Managing Salinity in Walnuts Janet Caprile Farm Advisor UC Cooperative Extension Contra Costa & Alameda Counties jlcaprile@ucdavis.edu Quad County Walnut Institute Stockton - March 6, 2014 Higher Salinity
Wilbur-Ellis Company. Carl Bruice - National Nutrition Technical Manager
 Wilbur-Ellis Company Carl Bruice - National Nutrition Technical Manager Potential Effects of Water Chemistry Total salt accumulation Specific ion toxicity (B, Na, Cl) Reduced infiltration (Na and ECw)
Laboratory Fee Schedule
 JMLord, Inc. Laboratory Fee Schedule Spring 2011 www.jmlordinc.com 267 N. Fulton St. Fresno CA, 93705 (559) 268-9755 (559) 486-6504 (FAX) Laboratory Services Since 1976, JMLord, Inc. has provided consultants
Irrigation and Runoff Management. Water Quality for Irrigation. Soil Salinity and Sodicity
 Irrigation and Runoff Management Water Quality for Irrigation Soil Salinity and Sodicity Dr. Sharon Benes, Fresno State Franz Niederholzer, UC Farm Advisor fjniederholzer@ucdavis.edu Irrigation and Runoff
Lecture 18. Soil Acidity, Alkalinity, and Socidity
 Lecture 18 Soil Acidity, Alkalinity, and Socidity 1 Questions ow can acidification occur in soils? ow does p affects availability of N, P, K? ow can acidic soils be managed? Define a saline and sodic soil.
Lecture 8: Irrigation Water Quality
 The Islamic University of Gaza- Civil Engineering Department Irrigation and Drainage- ECIV 5327 Lecture 8: Irrigation Water Quality Prepared by Husam Al-Najar Physical Parameters used in the evaluation
Understanding Lucerne
 Farming System Understanding Lucerne How to increase the value of the feed produced Break through developments in grazing tolerance How to choose a lucerne Pest and disease ratings Best management practices
Understanding your EAL agricultural soil results
 Understanding your EAL agricultural soil results An EAL agricultural soil test report holds a wealth of information. To assist in its interpretation, please refer to the colour coded text below and within
Educational Farm Walk Aldinga 15 October 2016
 Educational Farm Walk Aldinga 15 October 2016 1 Landholder: Deb Ophof Event Program (9.30am to 12.00noon) Introductions The importance of soil testing Observe horse keeping facilities and welfare of horses
Pebble Project Surface Water Quality Program Streams, Seeps, and Ponds
 Day1_1445_Surface Water Quality_PLP_McCay.mp3 Pebble Project Surface Water Quality Program Streams, Seeps, and Ponds Mark Stelljes SLR International February 1, 2012 Outline Stream Program Overview Results
Salinity. Concentration of Total Dissolved Solids (TDS) Units: milligrams/liter (mg/l) or parts per million (ppm) 1mg/l = 1 ppm
 Units: milligrams/liter (mg/l) or parts per million (ppm) 1mg/l = 1 ppm") Salinity Concentration of Total Dissolved Solids (TDS) Units: milligrams/liter (mg/l) or parts per million (ppm) 1mg/l = 1 ppm Electrical Conductivity (EC) Units: decisiemens per meter (ds/m) 1 ds/m =
Salinity Concentration of Total Dissolved Solids (TDS) Units: milligrams/liter (mg/l) or parts per million (ppm) 1mg/l = 1 ppm Electrical Conductivity (EC) Units: decisiemens per meter (ds/m) 1 ds/m =
Calculating Crop Nutrient Value From Irrigation Water Inputs: A Survey of Southeast Missouri Irrigation
 University of Missouri Extension WQ278, Reviewed January 2009 Calculating Crop Nutrient Value From Irrigation Water Inputs: A Survey of Southeast Missouri Irrigation Paul Tracy and S.G. Hefner Department
Understanding and Managing Salinity for Walnuts. David Doll Farm Advisor UCCE Merced March 15th, 2016
 Understanding and Managing Salinity for Walnuts David Doll Farm Advisor UCCE Merced March 15th, 2016 Salinity Tolerance of Walnuts Walnut How Tough are Walnuts? Sensitive to Na, B, and Cl Unknown, but
SALINITY MANAGEMENT IN PROCESSING TOMATOES. Brenna Aegerter and Michelle Leinfelder-Miles UC Cooperative Extension San Joaquin County
 SALINITY MANAGEMENT IN PROCESSING TOMATOES Brenna Aegerter and Michelle Leinfelder-Miles UC Cooperative Extension San Joaquin County WHERE DO SALTS COME FROM? Irrigation water is the primary source of
The soil is a very. The soil can. The manure. Soil Characteristics. effective manure treatment system if manures are applied at the proper rate.
 The soil is a very effective manure treatment system if manures are applied at the proper rate. The soil can filter pollutants and prevent them from reaching groundwater. The manure application rate should
Subsection 3D: Nutrient Recommendations Forage Crops
 Crop Subsection 3D: Nutrient Recommendations Forage Crops Table of Contents Page Alfalfa... 3D-1 Corn Silage... 3D-5 Grass/Alfalfa Mixtures... 3D-8 Grass/Clover Pastures... 3D-11 Sorghum Silage... 3D-15
Re-examination of water quality criteria for assessing wastewater suitability for irrigation
 Re-examination of water quality criteria for assessing wastewater suitability for irrigation Steve Grattan, Ph.D Department of Land, Air and Water Resources University of California, Davis Multiple types
GROWERS GUIDE. to Soil Health.
 GROWERS GUIDE to Soil Health www.arrowseed.com Feed Your Soil One percent organic matter contains about 1,200 pounds of nitrogen, 345 pounds of phosphorus and 150 pounds of sulfur per acre. Dr. Ray Ward,
Salinity Management Soil and Cropping Systems Strategies
 Salinity Management Soil and Cropping Systems Strategies Michelle Leinfelder-Miles Delta Crops Resource Management Advisor UC Cooperative Extension, San Joaquin County Plant and Soil Conference Fresno,
Estimating annual irrigation water requirements
 Estimating annual irrigation water requirements Findings from the Sustainable dairy farm systems for profit project M5 Project Information Series - Studies on Mutdapilly Research Station and subtropical
Sharon Benes Professor, Dept. Plant Science CSU Fresno. UC-ANR Vegetable Crops Program Team Meeting December 10, 2014; Davis, CA
 Sharon Benes Professor, Dept. Plant Science CSU Fresno UC-ANR Vegetable Crops Program Team Meeting December 10, 2014; Davis, CA 1 Agricultural Salinity & Drainage Hanson, Grattan & Fulton (2006). Ag &
Quality of reclaimed water for turfgrass irrigation. Clinton Williams Lead Research Soil Scientist USDA-ARS ALARC
 Quality of reclaimed water for turfgrass irrigation Clinton Williams Lead Research Soil Scientist USDA-ARS ALARC Cost for Increasing Water Supply Option Cost (acre-ft) Desalination $1,400 Recycling for
Turf Irrigation Series No. 2. Drought Resistance and Efficient Irrigation for the Cool-Humid Region
 Turf Irrigation Series No. 2 Drought Resistance and Efficient Irrigation for the Cool-Humid Region Water Conservation J. Scott Ebdon, Ph.D. and Michelle DaCosta, Ph.D. When rainfall is insufficient and
Soil Testing and Nutrient Management. Craig Cogger Soil Scientist WSU Puyallup
 Soil Testing and Nutrient Management Craig Cogger Soil Scientist WSU Puyallup Soil Testing Nutrients Soil Quality Contaminants Biological Simple Soil Quality Tests Texture Structure Color Texture: Proportions
Best Management Practices for Irrigation Water Salinity and Salt Build-Up in Vineyard Soils
 Irrigation Water Quality in the Limestone Coast Region Best Management Practices for Irrigation Water Salinity and Salt Build-Up in Vineyard Soils GRAPE & WINE COUNCIL INC. 1 Best Management Practices
Irrigation. Branch. Groundwater Quality in the Battersea Drainage Basin
 AGRICULTURE, FOOD AND RURAL DEVELOPMENT Irrigation Branch Groundwater Quality in the Battersea Drainage Basin Groundwater quality in the Battersea drainage basin was monitored between 1995 and 21 to characterize
Special Publication SJ2004-SP22 St. Johns River Water Supply Project Surface Water Treatment and Demineralization Study
 Special Publication SJ2004-SP22 St. Johns River Water Supply Project Surface Water Treatment and Demineralization Study Preliminary Raw Water Characterization TECHNICAL MEMORANDUM PRELIMINARY RAW WATER
Managing Pistachio Tree Health Under Saline Conditions. Mae Culumber, Ph.D. UC Cooperative Extension Advisor Fresno County
 Managing Pistachio Tree Health Under Saline Conditions Mae Culumber, Ph.D. UC Cooperative Extension Advisor Fresno County Pistachios are salt tolerant.right? Higher threshold than other tree crops but
MWELO Providing Insight on Soil and Compost Requirements. Will Bakx
 MWELO Providing Insight on Soil and Compost Requirements Will Bakx www.sonomacompost.com willbakx@sonomacompost.com Soils: 2 Sections 492.5 Soil Management report 492.6(3) Soil Preparation, Mulch and Amendments
Water management: Table Of Contents
 Water management: Table Of Contents TABLE OF CONTENTS...1 INTRODUCTION TO WATER MANAGEMENT...2 EVAPOTRANSPIRATION...2 PERMEABILITY OF THE SOIL...2 DRAINAGE...3 LENGTH OF GROWING PERIOD...4 LAND PREPARATION...4
Hamdy A. (ed.). Regional Action Programme (RAP): Water resources management and water saving in irrigated agriculture (WASIA PROJECT)
. Regional Action Programme (RAP): Water resources management and water saving in irrigated agriculture (WASIA PROJECT)") Sustainable use of highly saline water for irrigation of crops under arid and semi-arid conditions: new strategies. Corn yield response to saline irrigation water applied with a trickle system under Mediterranean
Sustainable use of highly saline water for irrigation of crops under arid and semi-arid conditions: new strategies. Corn yield response to saline irrigation water applied with a trickle system under Mediterranean
With High Fertilizer Prices. Gerald Bryan Extension Agronomist UM Extension Jackson, MO
 With High Fertilizer Prices Gerald Bryan Extension Agronomist UM Extension Jackson, MO 573 243 3581 Good fertility = Good Pastures = Good Crops Know where you are..soil Test What Nutrients Do Plants Require?
Preliminary discussion of salinity and specific ions in LSJR
 MEMO From: To: John Dickey/PlanTierra File Date: July 25, 2014July 24, 2014 Subject: Preliminary discussion of salinity and specific ions in LSJR The purpose of this memo is to share some follow up from
State of the art precision equipment run by dedicated staff guarantee rapid turnaround analyses, a service the Laboratory prides itself on.
 Capability Statement AgVita Analytical has been providing analytical services to clients nationally for over 20 years. We are recognised within agricultural industries as one of Australia's leading laboratories
Water Management in Pecan Orchards. Dr. Jim Walworth Dept. of Soil, Water & Environmental Sci. University of Arizona
 Water Management in Pecan Orchards Dr. Jim Walworth Dept. of Soil, Water & Environmental Sci. University of Arizona Orchard Water Use = Evapotranspiration Soil Evaporation + Plant Transpiration Combined
Principles of nutrient management
 Principles of nutrient management A - Soil balance Tasmanian Office: 1/9 Arnold Street, Penguin PO Box 396 Penguin, Tasmania 7316 T (03) 6437 2264 F (03) 6437 2271 E rm@rmcg.com.au W www.rmcg.com.au ABN
East TX Test Site (1/2 Treated)
") 1 East TX Test Site (1/2 Treated) 2 CATION EXCHANGE CAPACITY ( CEC ) It is a measure of the quantity of cations reversibly adsorbed per unit weight of soil. CEC is expressed in meq/100 g of mass (meq is
1 East TX Test Site (1/2 Treated) 2 CATION EXCHANGE CAPACITY ( CEC ) It is a measure of the quantity of cations reversibly adsorbed per unit weight of soil. CEC is expressed in meq/100 g of mass (meq is
Crops. Information contained in this presentation came from the National Engineering Handbook Irrigation Guide
 Crops Information contained in this presentation came from the National Engineering Handbook Irrigation Guide Crops The purpose of irrigation is to supplement natural precipitation so that the moisture
Steps to making efficient use of water
 Steps to making efficient use of water Findings from the Sustainable dairy farm systems for profit project M5 Project Information Series - Studies on Mutdapilly Research Station and subtropical dairy farms
Soil Properties under Tree Plantations, Crops and Pastures Irrigated with Paper Mill Effluent at Albury in 2013
 Soil Properties under Tree Plantations, Crops and Pastures Irrigated with Paper Mill Effluent at Albury in 213 Peter Hopmans July 21 A commercial in confidence report prepared by Timberlands Research Pty
Fertility and Crop Nutrition. B. Linquist, R. Mutters, J. Hill and C. vankessel Rice Production Workshop, March 21, 2011
 Fertility and Crop Nutrition B. Linquist, R. Mutters, J. Hill and C. vankessel Rice Production Workshop, March 21, 2011 900 800 Fertilizer costs: 1960-2010 Source: USDA 700 600 Nitrogen solutions (30%)
Soil Properties under Tree Plantations, Crops and Pastures Irrigated with Paper Mill Effluent at Albury in 2017
 Soil Properties under Tree Plantations, Crops and Pastures Irrigated with Paper Mill Effluent at Albury in 217 Peter Hopmans July 218 A commercial in confidence report prepared by Timberlands Research
The following checklist provides a convenient framework for making accurate fertiliser decisions.
 Section 7: Grass Checklist for decision making 137 Principles of Fertilising Grassland 139 Protection of the environment 142 Finding the Nitrogen Recommendation 143 Assessing the Soil Nitrogen Supply (SNS)
Chapter 7.2. AFFIRM and Alberta MMP Software. learning objectives
 AFFIRM and Alberta MMP Software learning objectives Identify information required to use the Alberta Farm Fertilizer Information and Recommendation Manager (AFFIRM). Identify information required to use
Environmental Assessment Chapter 8 Surface Water
 Environmental Assessment Chapter 8 Surface Water 8.2.7 Rainfall and Evaporation Based on recorded data for the area of interest, the mean annual rainfall is about 700mm, with maximum monthly rainfalls
Treated Municipal Wastewater Irrigation Guidelines EPB 235
 Treated Municipal Wastewater Irrigation Guidelines EPB 235 JAN 2014 1. Introduction 1.1 General The purpose of this guideline is to assist the owners of wastewater treatment works and consultants considering
EC / EM Data for Salinity and Zones
 Bringing Earth s Resources to Life EC / EM Data for Salinity and Zones Shawn Kasprick Area Agronomist / Precision Ag Manager Bringing Earth s Resources to Life Understanding EC / EM Data Types of equipment?
Salinity Management Soil and Cropping Systems Strategies
 Salinity Management Soil and Cropping Systems Strategies Michelle Leinfelder-Miles Delta Crops Resource Management Advisor UC Cooperative Extension, San Joaquin County Alfalfa and Forage Field Day Kearney
KARUAH EFFLUENT REUSE ENTERPRISE IMPROVING FARMING PRACTICES FOR AGRICULTURAL REUSE. Clara Laydon. Hunter Water Australia
 KARUAH EFFLUENT REUSE ENTERPRISE IMPROVING FARMING PRACTICES FOR AGRICULTURAL REUSE Paper Presented by: Clara Laydon Authors: Clara Laydon, Process Engineer, Hunter Water Australia 2 nd Annual WIOA NSW
COOPERATIVE EXTENSION Bringing the University to You
 COOPERATIVE EXTENSION Bringing the University to You Fact Sheet-02-91 SAMPLING AND INTERPRETATION OF LANDSCAPE IRRIGATION WATER Robert Morris and Dr. Dale Devitt TAKING A WATER SAMPLE FOR ANALYSIS Contact
Chapter 5 DRAINAGE WATER CHARACTERISTICS Sharon Benes 1, Tim Jacobsen 2, and Lisa Basinal 2
 Chapter 5 DRAINAGE WATER CHARACTERISTICS Sharon Benes 1, Tim Jacobsen 2, and Lisa Basinal 2 1 Dept. of Plant Science & Center for Irrigation Technology (CIT), California State University, Fresno, sbenes@csufresno.edu
Autumn Leaf Litter Composting Trial
 Autumn Leaf Litter Composting Trial 2011-2012 Version 1 September 2012 We are the Environment Agency. We protect and improve the environment and make it a better place for people and wildlife. We operate
Crop Nutrition Key Points:
 Crop Nutrition Key Points: Apply N fertiliser using the recommendations table (below) but making allowances for N applied in organic manures. N fertiliser applications should be timed to avoid impairing
NUTRIENT MANAGEMENT PLAN FIELD MONITORING 1. Bradford D. Brown ABSTRACT
 NUTRIENT MANAGEMENT PLAN FIELD MONITORING 1 Bradford D. Brown ABSTRACT Nutrient Management Plan Field Monitoring enables producers to evaluate the effectiveness of their Nutrient Management Plan implementation
Evaluation of Surface Water Quality on Soil Leaching Fraction and Alfalfa Yield in the Delta
 Evaluation of Surface Water Quality on Soil Leaching Fraction and Alfalfa Yield in the Delta Principal Investigators: Michelle Leinfelder Miles (Principal Investigator) Cooperative Extension San Joaquin
CENTRAL PLATTE NATURAL RESOURCES DISTRICT NITROGEN MANAGEMENT CERTIFICATION TEST
 CENTRAL PLATTE NATURAL RESOURCES DISTRICT NITROGEN MANAGEMENT CERTIFICATION TEST NAME: CERT #: ADDRESS: CITY: Section A: The Nitrate Contamination Concern 1) The U.S. Environmental Protection Agency s
Nutrient Management for Field Grown Leafy Vegetables a European Perspective Ian G. Burns
 Nutrient Management for Field Grown Leafy Vegetables a European Perspective Ian G. Burns Warwick Crop Centre, School of Life Sciences, University of Warwick, Wellesbourne, Warwick CV35 9EF, United Kingdom
Big Horn Bas in Irrigation
 GROWERS GUIDE Big Horn Bas in Irrigation Water Management Program Big Horn Bas in Irrigation Water Management Program Index: Basic Crop Information Water Requirements Growing Seasons Drought Tolerant Crop
MANAGEMENT/MONITORING OF IRRIGATION REUSE. Anna Kelliher. Rendell McGuckian
 MANAGEMENT/MONITORING OF IRRIGATION REUSE Paper Presented by : Anna Kelliher Authors: Anna Kelliher, Consultant, Rob Rendell, Principal Consultant, Rendell McGuckian 65 th Annual Water Industry Engineers
MANAGING PHOSPHORUS LOSSES. Rich. McDowell, AgResearch
 MANAGING PHOSPHORUS LOSSES Rich. McDowell, AgResearch BIOAVAILABILITY: N-, CO-, OR P-LIMITATION Co-Limited Co-Limited 14% 19% N-Limited 13% P-Limited 73% N-Limited 17% P-Limited 64% Where does it come
Groundwater Monitoring Report
 Groundwater Monitoring Report Briefing Note 5 SC0690011C Volume 1 of 1 Final Scottish Executive BRIEFING5_FINALJR Enviros Aspinwall, 61 The Shore, Leith, Edinburgh. EH6 6RA Scottish Executive Groundwater
Optimal cattle manure application rate to maximise crop yield and minimise risk of N loss to the environment in a wheat-maize rotation cropping system
 Optimal cattle manure application rate to maximise crop yield and minimise risk of N loss to the environment in a wheat-maize rotation cropping system Yongping Jing 1,2, Yan Li 1,2,4, Yingpeng Zhang 1,2,
Irrigation Water Quality for B.C. Greenhouses
 Greenhouse FACTSHEET July 2015 Irrigation Water Quality for B.C. Greenhouses INTRODUCTION An abundant supply of good irrigation water is the first step to producing high quality greenhouse crops. Small
Soil Development Semi-Arid Landscapes. Section 20 Tier 2 Issues CBNG Development. Nature of the Landscape. Nature of the Landscape
 Section 20 Tier 2 Issues CBNG Development Larry C. Munn, Ph. D. Professor of Soil Science Department of Renewable Resources University of Wyoming Soil Development Semi-Arid Landscapes Precipitation less
PIT LAKES LIABILITY OR LEGACY? David Allen (MBS Environmental) Karen Ganza (MBS Environmental) Rob Garnham (Groundwater Resource Management)
 Karen Ganza (MBS Environmental) Rob Garnham (Groundwater Resource Management)") PIT LAKES LIABILITY OR LEGACY? David Allen (MBS Environmental) Karen Ganza (MBS Environmental) Rob Garnham (Groundwater Resource Management) PRESENTATION OUTLINE Introduction Examples of Pit Lakes Important
PIT LAKES LIABILITY OR LEGACY? David Allen (MBS Environmental) Karen Ganza (MBS Environmental) Rob Garnham (Groundwater Resource Management) PRESENTATION OUTLINE Introduction Examples of Pit Lakes Important
Physiographic zones. and water quality
 Southland Physiographic zones Central Plains Technical information Physiographic zones are part of the Water and Land 2020 & Beyond project that aims to maintain and improve water quality in the Southland
Total Dissolved Solids
 Total Dissolved Solids LabQuest 12 INTRODUCTION Solids are found in streams in two forms, suspended and dissolved. Suspended solids include silt, stirred-up bottom sediment, decaying plant matter, or sewage-treatment
7.0 - nutrient uptake, removal and budgeting
 7.0 - nutrient uptake, removal and budgeting - nutrient uptake - nutrient removal - nutrient budgeting 7.0 nutrient uptake, removal and budgeting NUTRIENT UPTAKE The generalised relationship between plant
15. Soil Salinity SUMMARY THE ISSUE
 15. Soil Salinity AUTHORS: B.H. Wiebe, R.G. Eilers, W.D. Eilers and J.A. Brierley INDICATOR NAME: Risk of Soil Salinization STATUS: Provincial coverage (AB, SK, MB), 1981 to 2001 SUMMARY At very low levels,
Environmental Monitoring Results Summary
 Environmental Monitoring Results Summary Quarter 1 2016 Name of Mine: CSA Mine Environment Protection Licence: EPL 1864 Licensee Name and Operator: Cobar Management Pty Ltd Licensee Address: PO Box 31,
A FIELD DEMONSTRATION OF AN ALTERNATIVE COAL WASTE DISPOSAL TECHNOLOGY GEOCHEMICAL FINDINGS. Paul T. Behum. Liliana Lefticariu. Y.
 A FIELD DEMONSTRATION OF AN ALTERNATIVE COAL WASTE DISPOSAL TECHNOLOGY GEOCHEMICAL FINDINGS Paul T. Behum Office of Surface Mining, Mid-Continent Region, Alton, IL Liliana Lefticariu Department of Geology,
2013 Georgia Grazing School:
 Soil Fertility in Grazed Systems How Soil Holds Nutrients Soil Particle Organic Matter Extension Forage Specialist Crop and Soil Sciences UGA Mg K + Ca K + Al 3+ Mg Ca e.g., CEC = 10 K + K + Mg Ca Ca Mg
Important Notices. BASIS CPD Points PN/47342/1516/g
 Sugarcane February 2016 Important Notices BASIS CPD Points PN/47342/1516/g This document is produced for information only and not in connection with any specific or proposed offer (the Offer ) of securities
Data from CENDRET/SUDRET project, Peru,
 CASE STUDY LEACHING (CHACUPE) R.J.Oosterbaan, March 2003-03-14 On website https://www.waterlog.info public domain, latest upload 20-11-2017 Data from CENDRET/SUDRET project, Peru, 1968-1974 Exercise in
WQD Chapter 1, Section 20 Agricultural Water Supply Proposed Rule. October 24, 2008
 WQD Chapter 1, Section 20 Agricultural Water Supply The 3-tiered decision making process is not a tiered approach at all. Tier I Default Limits Stated purpose is for situations where the irrigated crops
Tower Summer Active Tall Fescue
 Tower Summer Active Tall Fescue Festuca arundinacea Tower is a continental fescue that has a soft and palatable leaf and is being released after excellent performance in production trials. The late heading
How to Collect Your Water Sample and Interpret the Results for the Poultry Analytical Package
 How to Collect Your Water Sample and Interpret the Results for the Poultry Analytical Package Bradley J. Austin, Josh B. Payne, Susan E. Watkins, Mike Daniels, and Brian E. Haggard Arkansas Water Resources
1/21/2019. Where does your water come from? Irrigation Water Testing and Interpretation: Case Studies from the Field
 Where does your water come from? Irrigation Water Testing and Interpretation: Case Studies from the Field DR. JUSTIN QUETONE MOSS, ASSOCIATE PROFESSOR DR. CHARLES FONTANIER, ASSISTANT PROFESSOR HORTICULTURE
Making the best of GPS. Derek Hanton Senior Consultant (Area Manager)
") Making the best of GPS Derek Hanton Senior Consultant (Area Manager) Using GPS +/- variable rate applications to correct soil nutritional problems. VRA fertiliser VRA seed and fertiliser VRA Lime 2 What
Making the best of GPS Derek Hanton Senior Consultant (Area Manager) Using GPS +/- variable rate applications to correct soil nutritional problems. VRA fertiliser VRA seed and fertiliser VRA Lime 2 What
Water Management in Queensland Coal Seam Gas. John Walsh, PhD CETCO Energy Services
 Water Management in Queensland Coal Seam Gas John Walsh, PhD CETCO Energy Services Background: Water Management in the Coal Seam Gas industry in Queensland is a complex and expensive undertaking Huge pipeline
Kirill Ukhanov, GE Water & Process Technologies, Russia, describes how advanced membrane technology is helping a Russian refinery to meet stringent
 Kirill Ukhanov, GE Water & Process Technologies, Russia, describes how advanced membrane technology is helping a Russian refinery to meet stringent wastewater requirements. In Russia, there are strict
Interpreting Irrigation Water Quality Reports
 Interpreting Irrigation Water Quality Reports By Dara M Park, L. B. McCarty, and Sarah A. White. Clemson University Water Chemistry What? Water is not just H 2O? What else could possibly be in there? As
2014 Georgia Grazing School:
 Soil Fertility in Grazed Systems Extension Forage Specialist Crop and Soil Sciences UGA What s in the soil, is in the plant, is in the animal,. Nutrient Storage Capacity How Soil Holds Nutrients Soil Particle
4.2 Irrigated sorghum best practice guide
 Trev Philp Pacific Seeds Graham Harris DAFF Queensland Key point Water required varies from 400 to 850mm Sorghum has a high demand for nitrogen, phosphorus and potassium Full season maturing hybrids use
February Mg Magnesium
 February 2015 INTERPRETING SOIL TEST INFORMATION C Carbon Ca Calcium K Potassium Mg Magnesium N Nitrogen P Phosphorous S - Sulphur Most Australian soils are deficient in one or more nutrients in their
Biological Sweet Corn Trial Lowood Q 2009
 Comparison of the agronomic and economic performance of Ausmin biological fertiliser programs versus a conventional program on a commercial sweet corn crop at Lowood in southern Queensland: Feb to June
tfirst Monitoring alternative fertilisers demonstration
 tfirst Monitoring alternative fertilisers demonstration Moorooduc Plains 2017 Monitoring alternative fertilisers on the Moorooduc Plains Introduction The aim of this demonstration was to provide some information
Dairy Farm with good results in slurry
 Product / Produkt: Penergetic-g, Penergetic-k User / Anwender: Beaver Meadow Farm 1971 Ltd. Adviser / Fachberater: Planistics Management Ltd. Heather Pratt CAN-Vancouver Application report / Anwendungsbericht
Remediation of Brine Spills- What Goes Wrong Kerry Sublette
 Remediation of Brine Spills- What Goes Wrong Kerry Sublette University of Tulsa Spills of produced water or brine on soil result in two types of damage: Excess salinity Creates an osmotic imbalance that
Evapotranspiration Calculations for Stormwater Quality Models
 Bob Pitt Cudworth Professor of Urban Water Systems Department of Civil, Construction, and Environmental Engineering University of Alabama Tuscaloosa, AL USA B.S. Engineering Science, Humboldt State University,
Evapotranspiration Calculations for Stormwater Quality Models
 Bob Pitt Cudworth Professor of Urban Water Systems Department of Civil, Construction, and Environmental Engineering University of Alabama Tuscaloosa, AL USA B.S. Engineering Science, Humboldt State University,
Warm Mineral Springs Sampling by Sarasota County
 Warm Mineral Springs Sampling by Sarasota County John Ryan, Kathryn Meaux, Rene Janneman and Jon S. Perry Sarasota County Environmental Services Sarasota, Florida September 11 Warm Mineral Springs is a
FERTILISING PASTURE ON ACREAGE AND SMALL HOLDINGS
 AGRITOPIC September 2015 FERTILISING PASTURE ON ACREAGE AND SMALL HOLDINGS (New South Wales) 1. INTRODUCTION This Agritopic gives basic information on fertiliser programs for improved pasture in New South
Nutrient composition of dairy effluent ponds
 Queensland the Smart State Nutrient composition of dairy effluent ponds Final report to Subtropical Dairy South-East Queensland Subregional Team Alan Skerman, Theresa Kunde and Caroline Biggs March 2006
12/12/ General. Crop period and base period Duty and delta of a crop Duty and delta of a crop
 2. 1. General The quantity of water, regardless of its source, required by crop in a given period of time for its normal growth under field conditions. Crop period and base period CWR = ET or CU + application
Improving whole farm and infield irrigation efficiencies using Irrimate TM tools
 Improving whole farm and infield irrigation efficiencies using Irrimate TM tools Steven Raine 1,2, Jim Purcell 3 and Erik Schmidt 1,2 1 National Centre for Engineering in Agriculture, University of Southern
Highly winter active for premium lucerne hay production
 Superstrike film coat seed recommended USES: 8-25 kg/ha 350mm p/a BEEF DAIRY SHEEP HAY SILAGE SOWING RATE RAINFALL / IRRIGATION Highly winter active for premium lucerne hay production Bred and selected