2015 Urban Water Management Plan for Santa Clarita Valley
|
|
|
- Anna Bailey
- 6 years ago
- Views:
Transcription
 CLWA Santa Clarita")


1 FINAL 2015 Urban Water Management Plan for Santa Clarita Valley Prepared for Castaic Lake Water Agency (CLWA) CLWA Santa Clarita Water Division Newhall County Water District Valencia Water Company (Los Angeles County Waterworks District No. 36/Cooperating Agency) Prepared by Kennedy/Jenks Consultants Nancy Clemm, P.E. Luhdorff & Scalmanini Consulting Engineers Stacy Miller Public Affairs June 2016
2
3 2775 North Ventura Road, Suite 100 Oxnard, California FAX: Santa Clarita Valley Urban Water Management Plan July 1, 2016 K/J Project No *00
4 Table of Contents List of Tables... vii List of Figures... ix List of Appendices... ix List of Abbreviations and Acronyms... x Section 1: Introduction Overview Purpose Basis for Preparing a Plan Implementation of the Plan Public Water Systems Agencies Serving Multiple Service Areas/Public Water Systems Fiscal or Calendar Year Joint Preparation of the Plan Plan Adoption Public Outreach Resources Maximization Water Management within CLWA s Service Area Castaic Lake Water Agency Retail Water Purveyors Climate Potential Effects of Climate Change Climate Change Vulnerability Analysis Section 2: Water Use Overview Demographics Historical Water Use Projected Water Use (Demand) Purveyor Demand Projections Distribution System Water Loss Population Historical Population Population Projections Comparison to City and County Planning Existing and Targeted Per Capita Water Use Base Daily Per Capita Water Use for SBX7-7 Reduction Urban Water Use Targets for SBX7-7 Reduction Interim Target Compliance Santa Clarita Valley Urban Water Management Plan i
5 Table of Contents (cont d) Purveyor Demand Projections and SBX7-7 Objectives Lower Income Projected Water Demands Other Factors Affecting Water Usage Weather Effects on Water Usage Conservation Effects on Water Usage Section 3: Water Resources Overview Wholesale (Imported) Water Supplies State Water Project Supplies Background SWP Table A Supply Assessment Other Imported Supplies Buena Vista-Rosedale Rio Bravo Nickel Water - Newhall Land Yuba Accord Water Groundwater Santa Clara River Groundwater Basin East Subbasin Adopted Groundwater Management Plan Available Groundwater Supplies Alluvium Saugus Formation Existing and Planned Groundwater Pumping Impacted Well Capacity Alluvium Saugus Formation Summary Transfers and Exchanges Core Transfers Spot Market Transfers Option Contracts Future Market Transfers Water Exchanges Groundwater Banking Programs Semitropic Banking Program Rosedale-Rio Bravo Banking Program Semitropic Banking Program Newhall Land Other Opportunities Planned Water Supply Projects and Programs Development of Desalination Opportunities for Brackish Water and/or Groundwater Desalination Opportunities for Seawater Desalination Santa Clarita Valley Urban Water Management Plan ii
6 Table of Contents (cont d) Section 4: Recycled Water Recycled Water Master Plan Existing Wastewater Treatment Facilities Wastewater Treatment Facility Improvements and Expansions Recycled Water Supply and Demand Other Potential Sources of Recycled Water Recycled Water Demand Recycled Water Comparison Methods to Encourage Recycled Water Use Optimization Plan for Recycled Water Additional Considerations Relating to the Use of Recycled Water SCVSD Chloride Compliance Plan Salt and Nutrient Management Plan Water Quality Control Plan (Basin Plan) Nutrients Projected Salt Levels from Recycled Water Section 5: Water Quality Overview Water Quality Constituents of Interest Perchlorate Metals and Salts Disinfection By-Products Total Trihalomethanes Microbiological Radiological Tests Organic Compounds Imported Water Quality Surface Water Quality Groundwater Quality Water Quality - Alluvium Water Quality - Saugus Formation Aquifer Protection Water Quality Impacts on Reliability Section 6: Reliability Planning Overview Reliability of Water Supplies Normal, Single-Dry, and Multiple-Dry Year Planning Groundwater Recycled Water State Water Project Table A Supply Santa Clarita Valley Urban Water Management Plan iii
7 Table of Contents (cont d) Flexible Storage Account Buena Vista-Rosedale Nickel Water-Newhall Land Yuba Accord Water Semitropic Banking Program Semitropic Banking Program - Newhall Land Rosedale-Rio Bravo Banking Program Rosedale-Rio Bravo Exchange Program West Kern Exchange Program Additional Planned Banking Supply and Demand Comparisons Normal Water Year Single-Dry Year Multiple-Dry Year Summary of Comparisons Section 7: Water Demand Management Measures Demand Management Water Use Efficiency Strategic Plan Castaic Lake Water Agency Foundational DMMs Metering Public Education and Outreach Water Conservation Program Coordination and Staffing Support Other DMMs Implemented Over the Last Five Years Distribution System Asset Management Program Wholesale Supplier Assistance Programs Planned Implementation of DMMs to Achieve Water Use Targets Santa Clarita Water Division Foundational DMMs Water Waste Prohibition Metering Conservation Pricing Public Education and Outreach Programs to Assess and Manage Distribution System Real Loss Water Conservation Program Coordination and Staffing Support Other DMMs Implemented Over the Last Five Years Santa Clarita Valley Urban Water Management Plan iv
8 Table of Contents (cont d) Planned Implementation of DMMs to Achieve Water Use Targets Newhall County Water District Foundational DMMs Water Waste Prohibition Metering Conservation Pricing Public Education and Outreach Programs to Assess and Manage Distribution System Real Loss Water Conservation Program Coordination and Staffing Support Other DMMs Implemented Over the Last Five Years Planned Implementation of DMMs to Achieve Water Use Targets Valencia Water Company Foundational DMMs Water Waste Prohibition Metering Conservation Pricing Public Education and Outreach Programs to Assess and Manage Distribution System Real Loss Water Conservation Program Coordination and Staffing Support Other DMMs Implemented Over the Last Five Years Planned Implementation of DMMs to Achieve Water Use Targets WUESP Planned DMM Implementation Section 8: Water Shortage Contingency Planning Overview Coordinated Planning Stages of Action to Respond to Water Shortages CLWA Stages of Action NCWD Stages of Action SCWD Stages of Action VWC Stages of Action Water Conservation Action Plan Prohibitions and Penalties for Excessive Use NCWD Prohibitions and Penalties SCWD Prohibitions and Penalties Santa Clarita Valley Urban Water Management Plan v
9 Table of Contents (cont d) VWC Prohibitions and Penalties Consumption Reduction Methods Consumption Limits New Demand Water Features and Swimming Pools Defining Water Features Determining Water Shortage Reductions Demand Health and Safety Production Revenue and Expenditure Impacts NCWD Financial Impacts SCWD Financial Impacts VWC Financial Impacts Water Shortage Contingency Resolution or Ordinance Actions to Prepare for Catastrophic Interruption General SWP Emergency Outage Scenarios Scenario 1: Emergency Freshwater Pathway Scenario 2: Complete Disruption of the California Aqueduct in the San Joaquin Valley Scenario 3: Complete Disruption of the West Branch of the California Aqueduct Assessment of Worst-Case Scenario Recommendations for Emergency Storage Regional Power Outage Scenarios CLWA Power Outage Scenario NCWD Power Outage Scenario SCWD Power Outage Scenario VWC Power Outage Scenario Minimum Water Supply Available During Next Three Years Section 9: References Santa Clarita Valley Urban Water Management Plan vi
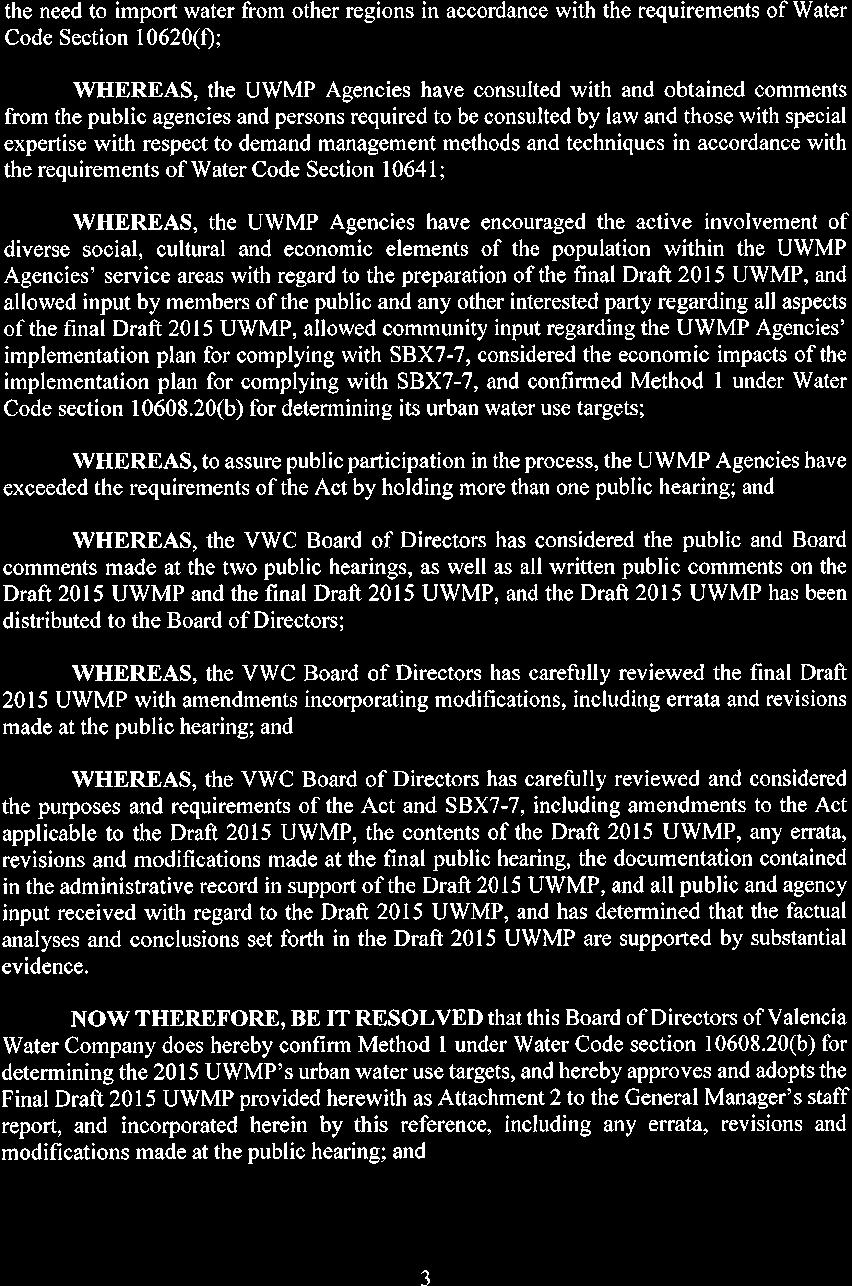
10 Table of Contents (cont'd) List of Tables Table 1-1 Table 1-2 Table 1-3 Table 1-4 Table 1-5 Table 2-1 Table 2-2 Table 2-3 Table 2-4 Table 2-5 Table 2-6 Table 2-7 Table 2-8 Table 2-9 Table 2-10 Table 2-11 Table 2-12 Table 2-13 Table 2-14 Table 2-15 Table 2-16 Table 2-17 Table 2-18 Table 2-19 Table 2-20 Table 2-21 Table 2-22 Table 2-23 Table 2-24 Table 2-25 Table 2-26 Table 2-27 Retail Public Water System Summary of Agency Coordination Public Participation Timeline Evapotranspiration and Temperature Data Annual Rainfall Record for Santa Clara Valley Historical Water Use by Retail Water Purveyors Summary of Projected Water Demands LACWWD 36 Current and Projected Water Deliveries by Customer Type NCWD Current and Projected Water Deliveries by Customer Type SCWD Current and Projected Water Deliveries by Customer Type VWC Current and Projected Water Deliveries by Customer Type Distribution System Water Loss NCWD Historical Population SCWD Historical Population VWC Historical Population LACWWD 36 Historical Population Summary of Current and Historical Population by Retail Purveyor Service Area Projected Population Population Comparison SBX7-7 Calculations NCWD Base Daily Per Capita Water Use SCWD Base Daily Per Capita Water Use VWC Base Daily Per Capita Water Use Option 3-95 Percent of State Hydrologic Region Target (Revised) NCWD Components of Target Daily Per Capita Water Use (Revised) NCWD SBX7-7 Conservation Savings Summary (Revised) SCWD Components of Target Daily Per Capita Water Use (Revised) SCWD SBX7-7 Conservation Savings Summary (Revised) VWC Components of Target Daily Per Capita Water Use (Revised) VWC SBX7-7 Conservation Savings Summary (Revised) LACWWD 36 Conservation Savings (Revised) 2015 Base Daily Per Capita Water Use and 2015 SBX7-7 Compliance Santa Clarita Valley Urban Water Management Plan vii
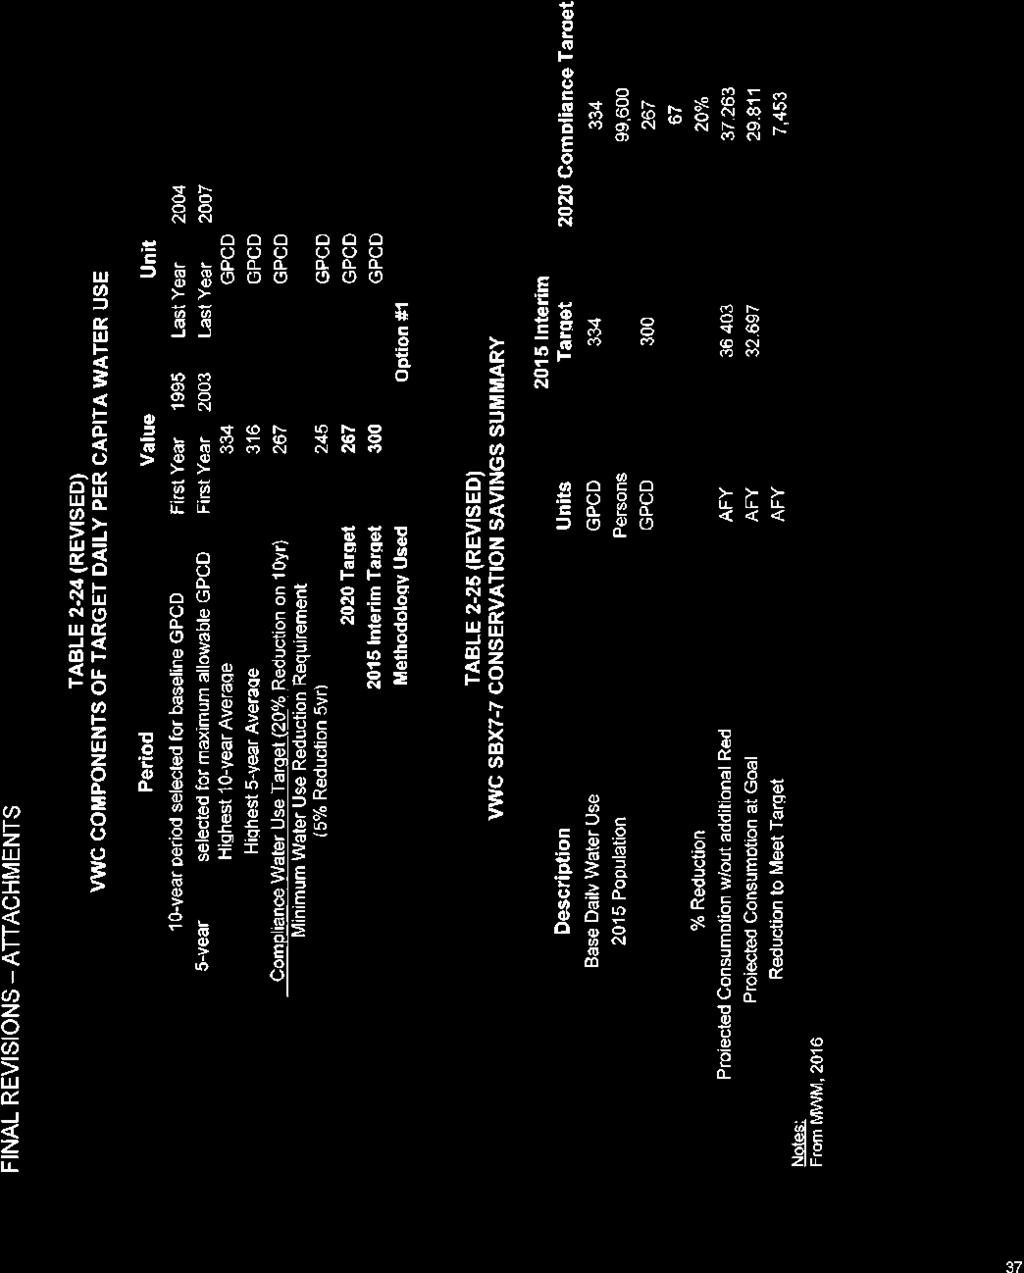
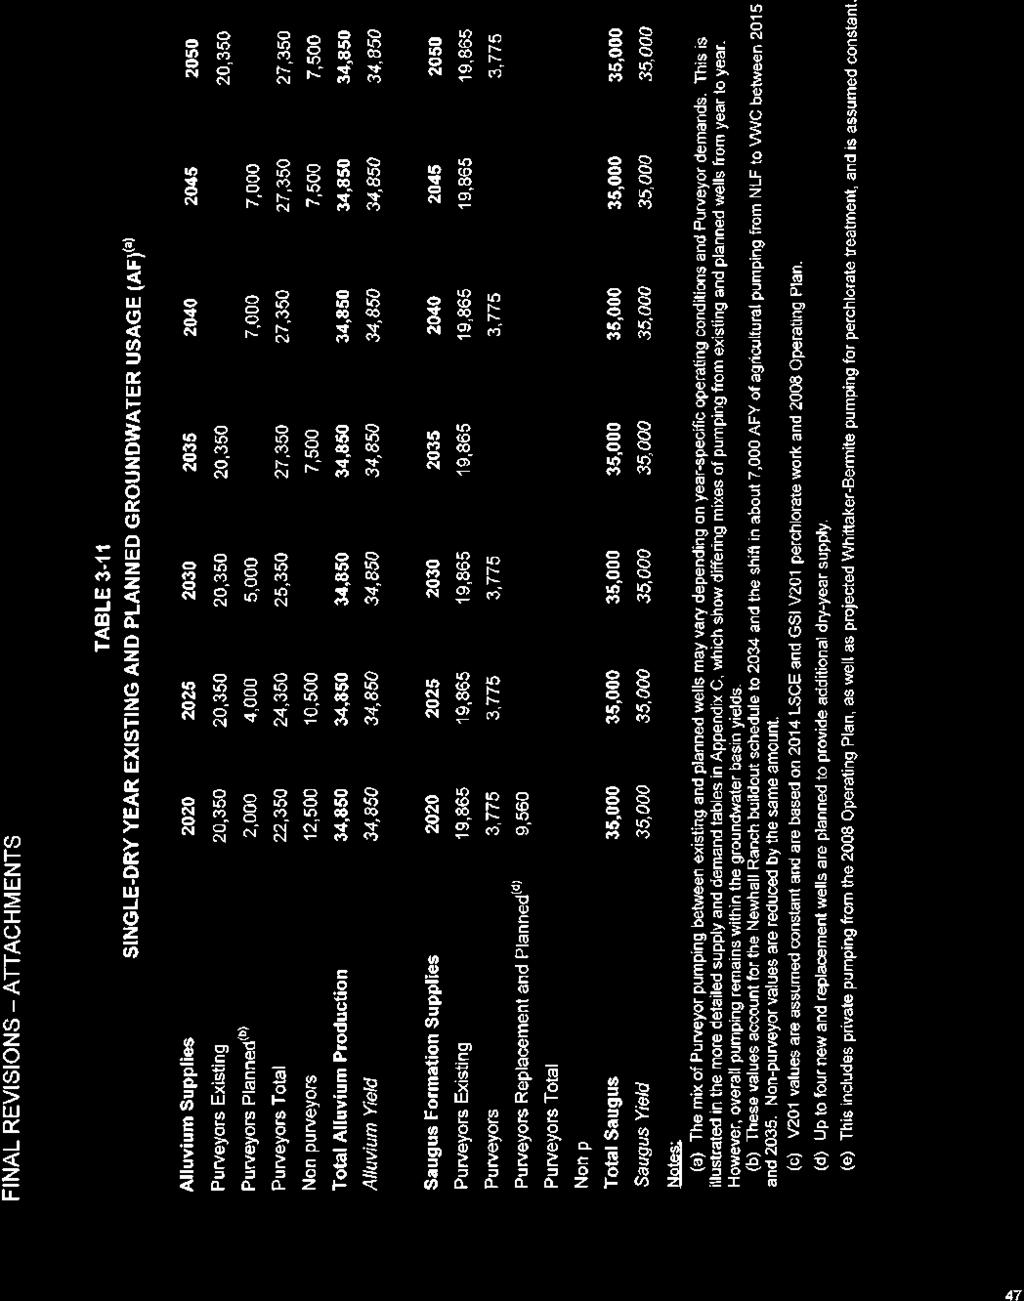
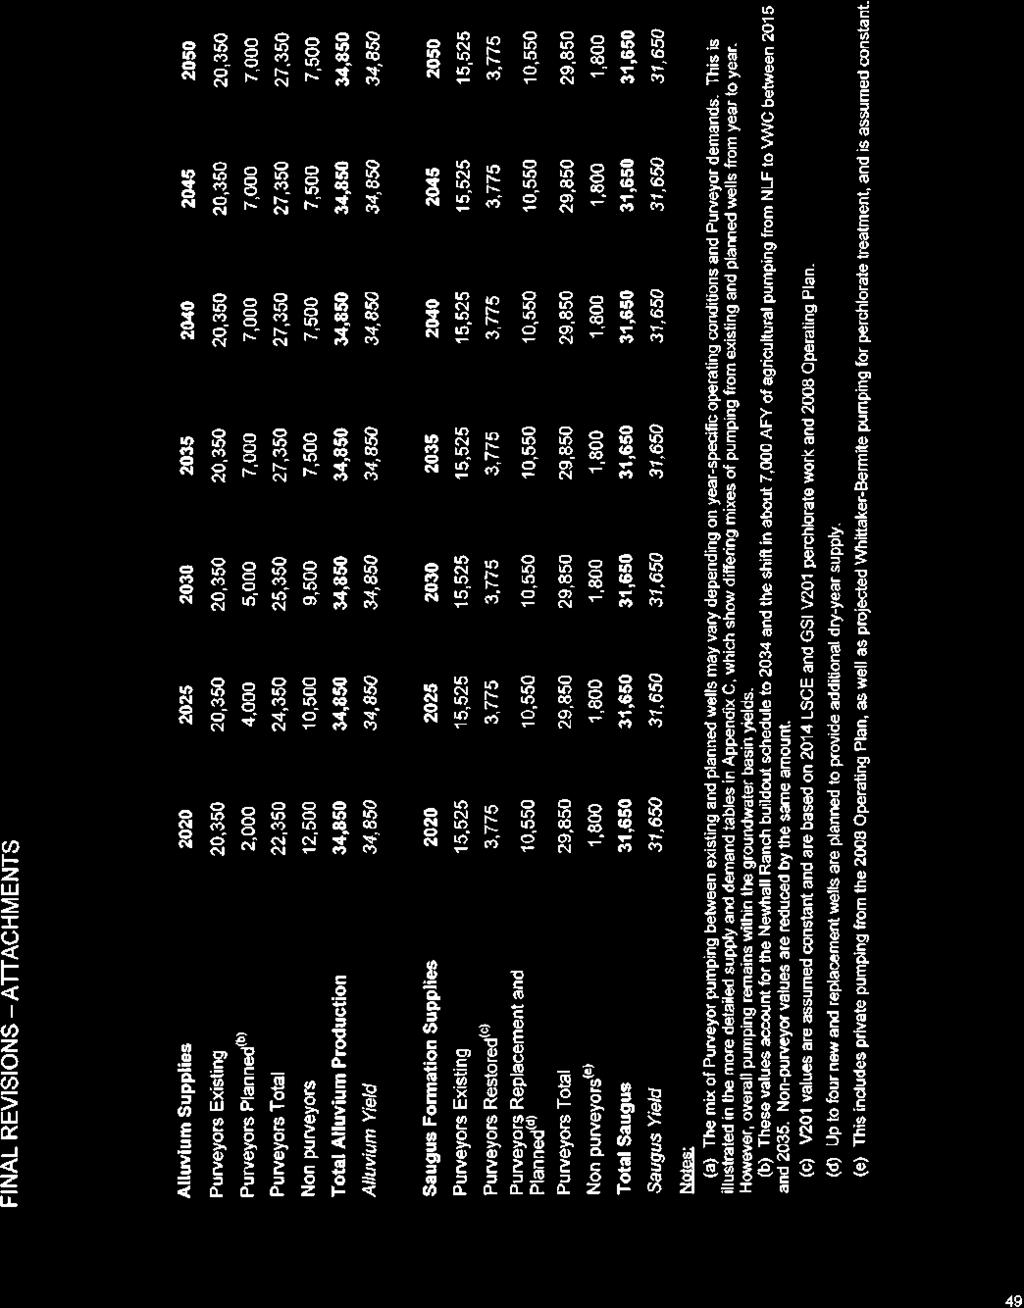
11 Table of Contents (cont'd) Table 2-28 Table 2-29 Table 3-1 Table 3-2 Table 3-3 Table 3-4 Table 3-5 Table 3-6 Table 3-7 Table 3-8 Table 3-9 Table 3-10 Table 3-11 Table 3-12A Table 3-12B Table 3-13 Table 4-1 Table 4-2 Table 4-3 Table 4-4 Table 4-5 Table 4-6 Table 4-7 Table 4-8 Table 4-9 Table 5-1 Table 5-2 Table 6-1 Table 6-2 Table 6-3 Table 6-4A Table 6-4B Table 7-1 Table 7-2 Table 7-3 Normal Year SBX7-7 Demand Calculations Lower Income Demands Summary of Current and Planned Water Supplies and Banking Programs SWP Table A Supply Reliability Historical Imported Supply Deliveries CLWA Demand Projections Provided to Wholesale Suppliers Groundwater Operating Plan for the Santa Clarita Valley Recent Historical Groundwater Production Projected Groundwater Production (Normal Year) Active Municipal Groundwater Source Capacity-Alluvial Aquifer Wells Municipal Groundwater Source Capacity-Existing, Restored, and Planned Saugus Formation Wells Average/Normal Year Existing and Planned Groundwater Usage Single-Dry Year Existing and Planned Groundwater Usage Four-Year Dry Year Existing and Planned Groundwater Usage Three-Year Dry Year Existing and Planned Groundwater Usage Existing and Proposed Seawater Desalination Facilities along the California Coast Participating Entities Projected WRP Production Capacities Projected Recycled Water Supply and Demand Recycled Water Uses-Projection Compared with Actual Use Santa Clara River Surface Water Quality Objectives Water Quality Objectives for Waters in the Santa Clara River Watershed TMDL for Ammonia on the Santa Clara River TMDL for Nitrate Plus Nitrite on the Santa Clara River Projected Salt Levels in Recycled Water Status of Impacted Wells Current and Projected Water Supply Changes Due to Water Quality Basis of Water Year Data Projected Average/Normal Year Supplies and Demands Projected Single-Dry Year Supplies and Demands Projected Four-Year Dry Year Supplies and Demands Projected Three-Year Dry Year Supplies and Demands School Education (Number of Students) Quantity Rates and Tier Level VWC s Conservation Programs (Number of Participants) Santa Clarita Valley Urban Water Management Plan viii
12 Table of Contents (cont'd) Table 8-1 Table 8-2 Table 8-3 Table 8-4 Table 8-5 Table 8-6 Table 8-7 Table 8-8 Table 8-9 Table 8-10 Table 8-11 Table 8-12 Table 8-13 Table 8-14 Water Shortage Resolutions/Ordinances CLWA Stages of Action NCWD Stages of Action SCWD Stages of Action VWC Stages of Action Voluntary Water Conservation Measures Mandatory Water Conservation Measures NCWD Penalties and Charges SCWD Water Conservation Measures and Prohibitions SCWD Penalties and Charges VWC Penalties and Charges Per Capita Health and Safety Water Quantity Calculations Projected Supplies and Demands during Six Month Disruption of Imported Supply Estimate of Minimum Supply for the Next Three Years List of Figures Figure 1-1 Figure 2-1 Figure 2-2 Figure 2-3 Figure 3-1 Figure 3-2 Figure 3-3 Figure 4-1 Figure 4-2 Figure 8-1 Castaic Lake Water Agency Services Area Historical Water Use Historical Water Use and Precipitation SCV Average Monthly Municipal Water Use Santa Clara River Valley East Subbasin Alluvium and Saugus Formation Alluvial Municipal Well Location Map Saugus Municipal Well Location Map Santa Clarita Valley Sanitation District Flow Projections and Planned Expansion Recycled Water Master Plan Phases Primary SWP Facilities List of Appendices A DWR 2015 UWMP Checklist B DWR Standardized Tables Santa Clarita Valley Urban Water Management Plan ix
13 Table of Contents (cont'd) C Purveyor Supply and Demand Tables D AWWA Water Loss Reporting Worksheets E Public Outreach Materials F Groundwater Management Plan (provided on CD) G WSCP Resolution/Ordinance H CUWCC BMP Reports I Climate Change Vulnerability Assessment J Population and Demand Forecasts List of Abbreviations and Acronyms The following abbreviations and acronyms are used in this report. AB ACOE Act ACWA AF AFY Agency AMI AWWARF AVEK Basin BDCP BMPs BO BVWSD CASGEM CCF CCR cm CEQA CII Assembly Bill U.S. Army Corps of Engineers California Urban Water Management Planning Act Affordable Clean Water Alliance acre-feet acre-feet per year Castaic Lake Water Agency Advanced Metering Infrastructure American Water Works Association Research Foundation Antelope Valley-East Kern Water Agency Santa Clara River Valley Groundwater Basin, East Subbasin Bay Delta Conservation Plan Best Management Practices Biological Opinion Buena Vista Water Storage District California Statewide Groundwater Elevation Monitoring One Hundred Cubic Feet Consumer Confidence Report centimeter California Environmental Quality Act commercial, industrial, and institutional Santa Clarita Valley Urban Water Management Plan x
14 Table of Contents (cont'd) CLWA Castaic Lake Water Agency CMMS Computerized Maintenance Management System CUWCC California Urban Water Conservation Council CVP Central Valley Project DBP Disinfection by-products DCR Delivery Capability Report D/DBP Disinfectants and Disinfectant By-Products DDW California Division of Drinking Water Delta Sacramento-San Joaquin Delta DFG California Department of Fish and Game DHS California Department of Health Services District Los Angeles County Waterworks District No. 36 DLR Detection Level of Reporting DMM Demand Management Measure DOF Department of Finance DPH Department of Public Health DPR direct potable reuse DTSC Department of Toxic Substances Control DWR California Department of Water Resources EC Electrical conductivity Edison Southern California Edison EIR Environmental Impact Report EIS Environmental Impact Statement ELT Early Long Term EPA Environmental Protection Agency ESA Endangered Species Act ETo evapotranspiration FEIR Environmental Impact Report FTE full-time equivalent FWS United States Fish and Wildlife Service GIS geographic information system COG Council of Governments GPCD gallons per capita per day gpd gallons per day Santa Clarita Valley Urban Water Management Plan xi
15 Table of Contents (cont'd) gpm gallons per minute GSI GSI Water Solutions GPS groundwater sustainability plan GWMP Groundwater Management Plan HAA5 Haloacetic Acids HCD State Department of Housing and Community Development HE High Efficiency KCWA Kern County Water Agency KVA kilovolt-ampere LACDRP Los Angeles County Department of Regional Planning LACSD Sanitation Districts of Los Angeles County LACWWD 36 Los Angeles County Waterworks District No. 36 LARWQCB Los Angeles Regional Water Quality Control Board LSCE Luhdorff and Scalmanini Consulting Engineers M&I Municipal and Industrial MCL Maximum Contaminant Level Metropolitan Metropolitan Water District of Southern California MAF million acre-feet MGD million gallons per day MF Multi-family MG million gallon mg/l milligrams per liter MOU Memorandum of Understanding MWM Maddaus Water Management Inc. NCWD Newhall County Water District NMFS National Marine Fisheries Service OU operating unit OVOV One Valley One Vision PCE Tetrachloroethylene Plan Urban Water Management Plan 2015 PPH persons-per-household PRZ permeable reactive zone Purveyor Supplier of drinking water at the retail level (also retail purveyor) PWD Palmdale Water District Santa Clarita Valley Urban Water Management Plan xii
16 Table of Contents (cont'd) RAP Remedial Action Plan RCM Resource Conservation Manager RD remedial design RHNA Regional Housing Needs Allocation RO Reverse Osmosis RRBWSD Rosedale-Rio Bravo Water Storage District RWMP Recycled Water Master Plan RWQCB Regional Water Quality Control Board SBX7-7 Water Conservation Bill of 2009 SCAG Southern California Association of Governments SCOPE Santa Clarita Organization for Planning the Environment SCVSD Santa Clarita Valley Sanitation District SCV Santa Clarita Valley SCWD Santa Clarita Water Division SEIR Supplemental Environmental Impact Report SGMA Sustainable Groundwater Management Act SNMP Salt Nutrient Management Plan SRWS self-regenerating water-softeners Semitropic Semitropic Water Storage District SF Single-family SSO site specific objective SOC Synthetic organic compounds SWP State Water Project Suppliers CLWA and purveyors collectively SWRCB State Water Resources Control Board SWRU Stored Water Recovery Unit TCE Trichloroethylene TDS Total Dissolved Solids TMDL Total Maximum Daily Load THM Trihomethanes TTHM Total Trihalomethanes TOC Total Organic Carbon TSS Total Dissolved Solids umhos/cm Micromhos per centimeter Santa Clarita Valley Urban Water Management Plan xiii
17 Table of Contents (cont'd) USCR UWCD UWMP Valley VOC VWC WBIC WET WKWD WRP WQOs WUESP Upper Santa Clara River United Water Conservation District Urban Water Management Plan Santa Clarita Valley Volatile organic compounds Valencia Water Company weather-based irrigation controller Water Efficiency Target West Kern Water District Water Reclamation Plant Water Quality Objectives Water Use Efficiency Strategic Plan Santa Clarita Valley Urban Water Management Plan xiv
18 Adopting Resolutions

19

20

21


22
23
24
25
26

27

28
29

30
31
32
33

34

35

36

37

38


39


40

41

42

43

44

45

46

47

48

49

50

51

52

53

54
55


56

57

58
59

60


61

62
63


64

65


66
67


68
69


70
71

72


73

74


75

76


77

78


79

80

81
82

83

84
85

86

87

88


89

90

91
92

93
94

95

96


97

98


99

100


101

102

103

104

105

106

107

108
109
110

111

112

113

114
115
116

117

118

119


120

121


122

123


124

125

126

127

128

129

130

131

132

133
134

135
136

137

138

139
140

141

142


143

144

145

146

147

148

149
150

151
152


153


154

155
156
157
158

159

160


161

162

163

164

165

166
167

168

169
170
171

172


173

174

175
176
177 Section 1: Introduction 2015 Santa Clarita Valley Urban Water Management Plan 1.1 Overview This volume presents the Urban Water Management Plan 2015 (Plan) for the Castaic Lake Water Agency (Agency, CLWA) service area, which includes four retail water purveyors. These retail purveyors are the Santa Clarita Water Division of CLWA (SCWD), Newhall County Water District (NCWD), Valencia Water Company (VWC) and Los Angeles County Waterworks District 36 (LACWWD 36). Collectively, CLWA and the retail purveyors are the Santa Clarita Valley s water suppliers and have worked together to prepare the Plan as a regional document as authorized by the Urban Water Management Planning Act. This section describes the general purpose of the Plan, discusses Plan implementation and provides general information about CLWA, the purveyors and service area characteristics. 1.2 Purpose An Urban Water Management Plan (UWMP) is a planning tool that generally guides the actions of urban water suppliers. It provides managers and the public with a broad perspective on a number of water supply issues. It is not a substitute for project-specific planning documents, nor was it intended to be when mandated by the State Legislature. For example, the Legislature mandated that a plan include a section which describes the opportunities for exchanges or water transfers on a short-term or long-term basis. (Wat. Code, 10631, subd. (d)). The identification of such opportunities and the inclusion of those opportunities in a plan s general water service reliability analysis neither commits an urban water supplier to pursue a particular water exchange/transfer opportunity, nor precludes it from exploring exchange/transfer opportunities never identified in its plan. Before an urban water supplier is able to implement any potential future sources of water supply identified in a plan, detailed project plans are prepared and approved, financial and operational plans are developed and all required environmental analysis is completed. A plan is intended to function as a planning tool to guide broad-perspective decision making by the management of water suppliers. (Sonoma County Water Coalition v. Sonoma County Water Agency (2010) 189 Cal. App. 4 th 33, 39.) It should not be viewed as an exact blueprint for supply and demand management. Water management in California is not a matter of certainty and planning projections may change in response to a number of factors. [L]ong-term water planning involves expectations and not certainties. Our Supreme Court has recognized the uncertainties inherent in long-term land use and water planning and observed that the generalized information required... in the early stages of the planning process are replaced by firm assurances of water supplies at later stages. (Id., at 41.) From this perspective, it is appropriate to look at the UWMP as a general planning framework, not a specific action plan. It is an effort to generally answer a series of planning questions such as: What are the potential sources of supply and what amounts are estimated to be available from them? What is the projected demand, given a reasonable set of assumptions about growth and implementation of good water management practices? Santa Clarita Valley Urban Water Management Plan Page 1-1
178 2015 Santa Clarita Valley Urban Water Management Plan How do the projected supply and demand figures compare and relate to each other? Using these framework questions and resulting answers, the implementing agency or agencies will pursue feasible and cost-effective options and opportunities to develop supplies and meet demands. As further detailed in this Plan, the water suppliers will continue to explore enhancing and managing supplies from existing sources such as the State Water Project (SWP) as well as other options. These include groundwater extraction, water exchanges and transfers, water conservation, water recycling, brackish water desalination, and water banking/conjunctive use. Additional specific planning efforts may be undertaken in regard to each option, involving detailed evaluations of how each option would fit into the overall supply/demand framework, potential environmental impacts, and how each option would affect customers. The California Urban Water Management Planning Act (Act) requires preparation of a plan that, among other things: Accomplishes water supply planning over a 20-year period in five year increments. (CLWA and the purveyors are going beyond the requirements of the Act by developing a plan which spans thirty-five years.) Identifies and quantifies existing and projected water supplies and water supply opportunities, including recycled water, for existing and future demands, in normal, single-dry and multiple-dry years. Implements conservation and efficient use of urban water supplies. Additionally, Senate Bill 7 of Special Extended Session 7 (SBX7-7) was signed into law in November 2009, which calls for progress towards a 20 percent reduction in per capita water use statewide by SBX7-7, otherwise referred to as the Water Conservation Act of 2009, requires each urban retail water supplier to develop and report a water use target in its 2010 UWMP, and to develop and report an interim 2015 water use target, baseline daily per capita use, and 2020 compliance daily per capita use, along with the basis for determining those estimates. Beginning in 2016, retail water suppliers are required to comply with the water conservation requirements in SBX7-7 in order to be eligible for State water grants or loans. Water suppliers have the ability to revisit the SBX7-7 baseline and water use targets determined in the 2010 UWMPs and update them in the 2015 UWMP updates. SBX7-7 provides four possible methods for an urban retail water supplier to use to calculate its water use target. The California Department of Water Resources (DWR) has also developed methodologies for calculating base daily per capita water use; baseline commercial, industrial and institutional water use; compliance daily per capita water use; gross water use; service area population; indoor residential water use and landscape area water use. In addition, if the 2010 census was not utilized for the SBX7-7 calculations in the 2010 UWMP, that data must be used to update the calculations in the 2015 Plan. In addition to the relatively new requirements of SBX7-7, a number of other changes to the Water Code have been enacted since 2010 which apply to the preparation of the 2015 Plan updates. These changes include: Santa Clarita Valley Urban Water Management Plan Page 1-2
179 2015 Santa Clarita Valley Urban Water Management Plan Demand Management Measures California Water Code (CWC) Section 10631(f)(1) and (2). (Assembly Bill 2067, 2014) Submittal Date CWC Section 10621(d). (Assembly Bill 2067, 2014) Electronic Submittal CWC Section 10644(a)(2). (Senate Bill 1420, 2014) Standardized Forms CWC Section 10644(1a)(2). (Senate Bill 1420, 2014) Water Loss CWC Section 10631(e)(1)(J) and (e)(3)(a) and (B). (Senate Bill 1420, 2014) Estimating Future Water Savings CWC Section 10631(e)(4). (Senate Bill 1420, 2014) Voluntary Reporting of Energy Intensity CWC Section (a) and (b). (Senate Bill 1036, 2014) Defining Water Features CWC Section 10632(b). (Assembly Bill 2409, 2014) A checklist to ensure compliance of this Plan with the Act requirements is provided in Appendix A. It is the stated goal of CLWA and the retail water purveyors to deliver a reliable and high quality water supply to their customers, even during dry periods. Based on conservative water supply and demand assumptions over the next thirty-five years in combination with management of non-essential demands during normal and dry water years, the 2015 UWMP successfully achieves this goal. 1.3 Basis for Preparing a Plan In accordance with the CWC, urban water suppliers providing water for municipal purposes either directly or indirectly to more than 3,000 customers, or supplying more than 3,000 acrefeet of water per year (AFY), are required to prepare an UWMP every five years. The 2015 UWMP must be approved and submitted to DWR by July 1, Implementation of the Plan CLWA has a contract with the State of California, through DWR, to acquire and distribute SWP water to the four retail water purveyors in the Santa Clarita Valley: SCWD, NCWD, VWC and LACWWD 36. This Plan is required for CLWA and three of the purveyors, SCWD, NCWD and VWC. The fourth purveyor, LACWWD 36, is not required to prepare an UWMP because the District does not provide water to more than 3,000 customers or supply more than 3,000 acrefeet (AF) of water annually; however, LACWWD 36 participated in the development of the Plan on a cooperating basis. This subsection provides an overview of the framework within which the Plan has been prepared, including agency coordination, public outreach and resource maximization Public Water Systems Public water systems (PWS) are the systems that provide drinking water for human consumption, which are regulated by the State Water Resources Control Board Division of Santa Clarita Valley Urban Water Management Plan Page 1-3
180 2015 Santa Clarita Valley Urban Water Management Plan Drinking Water (SWRCB DDW). PWSs are required to electronically file Annual Reports to the Drinking Water Program with the SWRCB DDW, which include water usage and other information Agencies Serving Multiple Service Areas/Public Water Systems Table 1-1 provides the names and PWS numbers of each PWS that is covered by this UWMP. TABLE 1-1 RETAIL PUBLIC WATER SYSTEM Public Water System Number Public Water System Name Number of Municipal Connections 2015 Volume of Water Supplied 2015 (AF) CLWA SCWD 30,681 21, NCWD (Castaic) NCWD (Newhall) NCWD (Pinetree) 9,731 8, NCWD (Tesoro) VWC 31,094 23,632 (a) LACWWD 36 1, Total 72,851 54,491 Notes: (a) Includes 450AF of recycled water Fiscal or Calendar Year A water supplier may report on a fiscal year or calendar year basis, but must clearly state in its UWMP the type of year that is used for reporting. The type of year should remain consistent throughout the Plan. DWR prefers that agencies report on a calendar year basis in order to ensure UWMP data is consistent with data submitted in other reports to the State. All data in this Plan is reported in calendar years, and in AF Joint Preparation of the Plan Water suppliers are permitted by the State to work together to develop a cooperative regional UWMP for the CLWA service area. This approach has been adopted by CLWA and the purveyors, which have jointly prepared the current Plan. Water resource specialists with expertise in water resource management were retained to assist in preparing the details of the Plan. Moreover, CLWA and the purveyors have coordinated the preparation of this Plan with other appropriate agencies in the area, including other water suppliers that share a common source, water management agencies, and relevant public agencies, to the extent practicable. Coordination for this Plan is summarized in Table 1-2. Santa Clarita Valley Urban Water Management Plan Page 1-4
181 2015 Santa Clarita Valley Urban Water Management Plan TABLE 1-2 SUMMARY OF AGENCY COORDINATION Participated in UWMP Development Received copy of Draft Commented on Draft Attended Public Meetings Contacted for Assistance Sent Notice of Intent to Adopt Agency Assemblymember Jacqui Irwin (Jeannette Sanchez) X X Assemblymember Scott Wilk (Kris Hough) X X Associated Builders/Contractors of CA Los Angeles Ventura Chapter X X Ben Binninger (Los Angeles Clean Incubator LACI) X X BIA Los Angeles/Ventura Chapter (Tim Piasky) X X CA Department of Water Resources (Mark Stuart) X X Canyon Country Advisory Committee (Alan Ferdman) X X Castaic Area Town Council (John Kunak) X X City of Santa Clarita (Dave Petersen/Planning) X X X X X City of Santa Clarita (James Chow) X X City of Santa Clarita (Jason Crawford/Jeff Hogan) X X City of Santa Clarita (Jason Smisko) X X City of Santa Clarita (Jerrid McKenna) X X College of the Canyons (Bruce Fortine) X X Comprehensive Development Consulting (Alan Cameron) X X Congressman Steve Knight (David Orosco) X X County of Ventura Resource Management Agency (Chris Stephens) X X Director LA County Department of Regional Planning (Richard Bruckner) X X Dolphin Group (Adriana Fernandez) X X Friends of the Santa Clara River (Ron Bottorff) X X Hart School District (Sue Reynolds) X LA County Dept. of Public Works (Mark Pestrella/ Maher Qassis) X X X Invited/Not Involved Santa Clarita Valley Urban Water Management Plan Page 1-5
182 2015 Santa Clarita Valley Urban Water Management Plan Agency Participated in UWMP Development Received copy of Draft Commented on Draft Attended Public Meetings Contacted for Assistance Sent Notice of Intent to Adopt Land Use Planning Southern CA Association of Governments Los Angeles County Department of Regional Planning X X X Los Angeles County Supervisor Mike Antonovich District 5 (Dave Perry) X X X X Los Angeles County Supervisor Mike Antonovich District 5 (Rosalind Wayman) X X X X Los Angeles County Waterworks District #36 (Kirk Allen/Tim Chen/Jessica Bunker) X X X NCWD Newhall County Water District (B.J. Atkins) X X NCWD Newhall County Water District (Lynne Plambeck) X X NCWD Newhall County Water District (Maria Gutzeit) X X NCWD Newhall County Water District (Michael Alvord) X NCWD Newhall County Water District (Steve Cole) X X X Newhall Land (Steve Zimmer, Corey Harpolis Matt Carpenter) X Roger Haring, Natural Resource Conservation Service Earth Team X Santa Clarita Valley Resident Barbara Dinius X Santa Clarita Valley Resident Cesar Galvez X Santa Clarita Valley Resident Craig Cockrell X Santa Clarita Valley Resident Marion Ostrom X Santa Clarita Valley Resident Mayra Galvez X Santa Clarita Valley Resident Phil Quebuven X Santa Clarita Valley Resident Stephanie Knudson X Santa Clarita Valley Residents Mr. and Mrs. Peterson X X Santa Clarita Valley Sanitation District (Matt Bao) X X Santa Clarita Valley Well Owners Association (Robert Fleck) SCOPE/ SCV Resident (Cam Noltemeyer) X X X Invited/Not Involved X X Santa Clarita Valley Urban Water Management Plan Page 1-6
183 Participated in UWMP Development 2015 Santa Clarita Valley Urban Water Management Plan Received copy of Draft Commented on Draft Attended Public Meetings Contacted for Assistance Sent Notice of Intent to Adopt Agency SCV Chamber of Commerce (Terri Crain) X X SCWD Santa Clarita Water District (Keith Abercrombie) X X X X SCWD Santa Clarita Water Division (Brent Payne) X X Sierra Club Angeles Chapter X X State Senator Hannah Beth Jackson (Carla Castilla) X State Senator Sharon Runner (Vanessa Wilk) X X Valencia Water Company (Ken Petersen, Matt Dickens) X X X Valley Industry and Commerce Association X X Ventura County Dept. of Planning (Kim Prillhart) X X West Ranch Town Council (David Bossert) X X Invited/Not Involved Santa Clarita Valley Urban Water Management Plan Page 1-7
184 2015 Santa Clarita Valley Urban Water Management Plan Plan Adoption CLWA and the retail purveyors began preparation of this Plan in July The final version of the Plan was adopted by the Agency Board on June 8, 2016, and submitted to DWR within thirty days of Board approval. NCWD s Board adopted the final Plan on June 8, VWC s Board adopted the final Plan by July 1, This Plan includes all information necessary to meet the requirements of Water Conservation Act of 2009 (Wat. Code, ) and the Urban Water Management Planning Act (Wat. Code, ) Public Outreach The water suppliers have encouraged the active involvement of diverse social, cultural, and economic elements of the population and community throughout the CLWA service area prior to and during preparation of the Plan. Among other outreach efforts, three public workshop sessions were held to solicit input on the outline and approach for preparing the Plan. Interested public agencies and other stakeholders were informed about the development of the Plan along with the schedule of public activities. Notices of public meetings were published in the local press and at the water supplier websites. Copies of the Plan were made available at the water suppliers offices and websites, local public libraries and sent to the City of Santa Clarita, the County of Los Angeles, as well as to interested parties as identified in Table 1-2. The water supplier staffs also convened meetings with various interests to gather data concerning planned development and the probable implementation of approved development. CLWA contracted with a local public relations firm to coordinate preparation of the Plan with the local community and stakeholders. CLWA notified the cities and counties within its service area of the opportunity to provide input regarding the Plan. Table 1-3 presents a timeline for public participation during the development of the Plan. A copy of the public outreach materials, including paid advertisements, newsletter covers, website postings and invitation letters are provided in Appendix E. Santa Clarita Valley Urban Water Management Plan Page 1-8
185 2015 Santa Clarita Valley Urban Water Management Plan TABLE 1-3 PUBLIC PARTICIPATION TIMELINE Public Workshops and Hearings Date Public Participation Task 1 st Public Workshop November 9, 2015 Presented UWMP requirements, updates, and Plan outline 2 nd Public Workshop January 26, 2016 Progress update on UWMP, initial supply and demand approach, recycled water, status of conservation programs and retailer target compliance. 3 rd Public Workshop March 21, 2016 Presented updated supply and demand tables, updated retailer target compliance. 1 st Public Hearing April 13, 2016 Presented overview of Public Draft 2015 UWMP Public Hearing June 8, 2016 Plan Adoption June 8, 2016 Plan Submittal July 1, 2016 Discussed comments on Public Draft 2015 UWMP Adoption Hearing for CLWA and NCWD for Draft 2015 UWMP File 2015 UWMP with DWR within thirty days of adoption The components of public participation include: Local Media (local newspaper notices and paid advertisements) Social Media (websites, Facebook, Twitter, Instagram and Mall Kiosks) Community-Based Outreach (see Table 1-2 for details) Water Suppliers Public Participation (see Table 1-3 for details) City/County Outreach (see Table 1-2 for details) Public Availability of Documents (see Table 1-3 for details) Resources Maximization Several documents have been developed to enable the water suppliers to maximize the use of available resources and minimize use of imported water, including the 2005 and 2010 CLWA UWMPs, CLWA s 2009 Water Supply Reliability Plan Update, the 2014 Integrated Regional Water Management Plan for the Upper Santa Clara River, the 2014 Santa Clarita Valley Water Report, DWR s 2015 State Water Project Delivery Capability Report (2015 DCR), the (2016) Recycled Water Master Plan Update (RWMP Update), the 2015 update of the Santa Clarita Valley Water Use Efficiency Strategic Plan (WUESP), the 2009 Basin Yield Analysis by Luhdorff Santa Clarita Valley Urban Water Management Plan Page 1-9
186 2015 Santa Clarita Valley Urban Water Management Plan and Scalmanini Consulting Engineers and GSI Water Solutions, Inc., the 2010 Data Document 1 and the 2003 Groundwater Management Plan (GWMP). Section 3 of this Plan describes in detail the current and projected water resources available to CLWA and the retail purveyors for the thirty-five-year period covered by the Plan. A complete reference list is provided in Section 9 of this Plan. 1.5 Water Management within CLWA s Service Area Castaic Lake Water Agency CLWA was formed in 1962 for the purpose of contracting with DWR to acquire and distribute imported SWP water to the water purveyors in the Valley. CLWA serves an area of 195 square miles in Los Angeles and Ventura Counties. Adequate planning for, and the procurement of, a reliable water supply is a fundamental function of CLWA. CLWA obtains its water supply for wholesale purposes principally from the SWP and currently has a long-term SWP water supply contract (SWP Contract) with DWR for 95,200 acre-feet (AF) of SWP Table A Amount 2. However, the availability of SWP supply is variable. It fluctuates from year to year depending on precipitation, regulatory restrictions, legislative restrictions and operational conditions and is subject to substantial curtailment during dry years. A more detailed discussion of factors having the potential to affect SWP deliveries is provided in Section 3 of this Plan. Due to this variability, CLWA and the retail purveyors have developed additional water supplies, as well as storage in groundwater banks. The primary additional supply is a surface supply CLWA imports from the Buena Vista Water Storage District (Buena Vista or BVWSD) and the Rosedale-Rio Bravo Water Storage District (Rosedale-Rio Bravo or RRBWSD) in Kern County. This supply, which is developed from Buena Vista s high flow Kern River entitlements, was first delivered to CLWA in 2007 and is available as a firm annual supply delivered to CLWA through SWP facilities. In addition, CLWA is able to manage some of the variability in its SWP supplies under certain provisions of its SWP Contract, including the use of flexible storage at Castaic Lake, as well as through its participation in several groundwater banking/exchange programs in Kern County. All imported water is delivered to Castaic Lake through SWP facilities. From Castaic Lake, which serves as the terminal reservoir of the SWP s West Branch, the water is treated at either CLWA s Earl Schmidt Filtration Plant or Rio Vista Water Treatment Plant and delivered to the retail water purveyors through transmission lines owned and operated by CLWA. CLWA is able to meet approximately half of the Valley s urban demand with imported water. CLWA and the retail purveyors meet the balance of their demands primarily with local 1 CLWA periodically updates its Data Document as the basis for establishing its facility capacity fees. 2 Table A is a schedule of annual water amounts as set forth in long-term SWP delivery contracts. Table A defines the annual volume of water that can be requested by an SWP contractor in a given year under regular contract provisions without consideration of surplus SWP water deliveries or other supplies available to an SWP contractor. Santa Clarita Valley Urban Water Management Plan Page 1-10
187 2015 Santa Clarita Valley Urban Water Management Plan groundwater and a small amount of recycled water. As further set forth in this Plan, CLWA and the retail purveyors have evaluated the long-term water needs (water demand) within their service areas based on applicable population projections and county and city land use plans and has compared these needs against existing and potential water supplies. Results indicate that the total projected water supplies available to CLWA and the retail purveyors over the next 20-year projection and beyond during normal, single-dry, and multiple-dry year periods are sufficient to meet the total projected water demands throughout the Valley; provided that CLWA and the retail purveyors plan to utilize increased proportions of SWP Table A Amounts, and will continue to incorporate conjunctive use, water conservation, water transfers, recycled water, and water banking as part of the total water supply portfolio and management approach to longterm water supply planning and strategy. These water management elements are addressed througout this Plan Retail Water Purveyors Four retail purveyors provide water service to most residents of the Valley. 1. LACWWD 36 s service area includes the Hasley Canyon area in the unincorporated community of Val Verde. During most years, the District obtains its water supply from CLWA. 2. NCWD s service area includes portions of the City of Santa Clarita and unincorporated portions of Los Angeles County in the communities of Castaic, Newhall, Valencia and Canyon Country. The District supplies water from local groundwater and CLWA imported water. 3. SCWD s service area includes portions of the City of Santa Clarita and unincorporated portions of Los Angeles County in the communities of Canyon Country, Newhall and Saugus. SCWD supplies water from local groundwater and CLWA imported water. 4. VWC s service area includes a portion of the City of Santa Clarita and unincorporated portions of Los Angeles County in the communities of Valencia, Stevenson Ranch and portions of Castaic, Saugus and Newhall. VWC supplies water from local groundwater, CLWA imported water and recycled water. The service areas for CLWA and the retail purveyors are shown on Figure 1-1. Santa Clarita Valley Urban Water Management Plan Page 1-11

188 2015 Santa Clarita Valley Urban Water Management Plan FIGURE 1-1 CASTAIC LAKE WATER AGENCY SERVICE AREA Santa Clarita Valley Urban Water Management Plan Page 1-12
189 2015 Santa Clarita Valley Urban Water Management Plan 1.6 Climate The climate in CLWA s service area is generally semi-arid and warm. Summers are dry with temperatures as high as 110 F. Winters are somewhat cool with temperatures as low as 20 F. Average rainfall since 1980 is about 16 inches per year in the flat areas and about 25 to 30 inches in the mountains. The region is subject to wide variations in annual precipitation and also experiences periodic wildfires. The region s average climate conditions are presented in Tables 1-4 and 1-5. TABLE 1-4 EVAPOTRANSPIRATION AND TEMPERATURE DATA Month Average Temperature Standard Monthly Average ETo (degrees Fahrenheit) (inches) Max Min January February March April May June July August September October November December Source: California Irrigation Management System (CIMIS) data provided from Santa Clarita Station No. 204, Los Angeles region, December 2006 to November ETo = evapotranspiration TABLE 1-5 ANNUAL RAINFALL RECORD FOR THE SANTA CLARITA VALLEY Year Annual Rainfall (in.) Year Annual Rainfall (in.) Santa Clarita Valley Urban Water Management Plan Page 1-13
190 2015 Santa Clarita Valley Urban Water Management Plan Year Annual Rainfall (in.) Year Annual Rainfall (in.) Average 16.4 Source: Data provided from rain gage Newhall-Soledad 32c, January 1980 to January Potential Effects of Climate Change A topic of growing interest and research for water planners and managers is climate change and the potential impacts it could have on California s future water supplies. DWR s California Water Plan Update 2013 considers how climate change may affect water availability, water use, water quality, and the ecosystem. 3 Volume 1, Chapter 5 of the California Water Plan, Managing an Uncertain Future, evaluated three different scenarios of future water demand based on alternative but plausible assumptions on population growth, land use changes, water conservation and future climate change. Future updates will test different response packages, or combinations of resource management strategies, for each future scenario. These response packages help decision-makers, water managers, and planners develop integrated water management plans that provide for resource sustainability and investments in actions with more sustainable outcomes. Further detailed guidance is currently being developed by the State of California and the United States Environmental Protection Agency (USEPA) for use in integrated regional water management planning. California faces the prospect of additional water management challenges due to a variety of issues including population growth, regulatory restrictions and climate change. Climate change is of particular interest because of the range of possibilities and their potential impacts on essential operations, including operations of the SWP. The most likely scenarios involve increased temperatures, which will reduce the Sierra Nevada snowpack and shift more runoff to winter months, and accelerated sea level rise. These changes can cause major challenges for the maintenance of the present water export system since water supplies are conveyed through the fragile levee system of the Sacramento-San Joaquin Delta. The other much-discussed climate change scenario is an increase in precipitation variability, with more extreme drought and flood events posing additional challenges to water managers 4. In its 2015 State Water Project Delivery Capability Report (2015 DCR), DWR included the potential effects of climate change in its analysis of SWP delivery capability under future conditions, specifically, the changes to hydrology expected to occur from a 2025 emission level and a 15 centimeter (cm) sea level rise. The current and projected availability and reliability of 3 California Water Plan Update Ibid. Santa Clarita Valley Urban Water Management Plan Page 1-14
191 2015 Santa Clarita Valley Urban Water Management Plan SWP supplies, including the potential effects of climate change, are further discussed in Section 3 of this Plan. Regionally, climate change could mean warmer and drier conditions, with modifications possible in the timing and type of precipitation and the timing and volumes of surface runoff. More extreme storm events could result in reservoir storage capacity being exceeded and therefore result in usable water supplies being discharged to the ocean. Conversely, drought events could also increase in intensity in the future where the drier conditions could impact the natural recharge of the region s groundwater basins. As further discussed herein, these examples related to climate change could potentially decrease the delivery of imported supplies. (DWR 2014). Even without population changes, water demand could increase. Precipitation and temperature influence water demand for outdoor landscaping and irrigated agriculture. Outdoor water use is a large component of water demands in the Santa Clarita Valley. Lower spring rainfall increases the need to apply irrigation water. However, precipitation in the region is essentially all due to rain, and significant shifts in the timing of precipitation are not expected to occur (Kennedy/Jenks 2014). Further, warmer temperatures increase crop evapotranspiration, which increases water demand. These effects and their potential to impact demands are considered in Section 2 of this Plan. 1.8 Climate Change Vulnerability Analysis Identification of watershed characteristics that could potentially be vulnerable to future climate change is the first step in assessing the climate change vulnerabilities in the Santa Clarita Valley Region. In the context of this analysis, vulnerability is defined as the degree to which a system is exposed to, susceptible to, and able to respond and adapt to, the adverse effects of climate change, consistent with the definition in the most recently published Climate Change Handbook for Regional Water Planning (USEPA and DWR, 2011). Water-related issues that are considered important in the Region and potentially sensitive to future climate change include water demands, water supplies, water quality, sea level rise, flooding, and ecosystem and habitat. A qualitative assessment of each of these issues with respect to anticipated climate change impacts has been prepared in the 2014 Integrated Regional Water Management Plan for the Upper Santa Clara River Region. The assessment follows the climate change vulnerability checklist as defined in the Climate Change Handbook for Regional Water Planning and highlights those water-related resources that are important to the Region and are sensitive to climate change. That assessment is incorporated herein and the checklist is provided as Appendix H. Santa Clarita Valley Urban Water Management Plan Page 1-15
192 Section 2: Water Use 2015 Santa Clarita Valley Urban Water Management Plan 2.1 Overview This section describes historic and current water usage and the methodology used to project future demands within CLWA and the retail purveyor service areas. Water use is divided into sectors such as residential, industrial, commercial, landscape, agricultural, and other purposes. To undertake this evaluation, data on existing land uses and planned land use development were compiled from each of the retail water purveyors and the City of Santa Clarita and County of Los Angeles land use plans in order to estimate demand projections out to 2050 (assumed year of designated land use-buildout). In addition, weather and water conservation effects on water usage were considered in the evaluation. Several factors can affect demand projections, including: Land use revisions New regulations Consumer choices Economic conditions Transportation needs Water service costs Environmental factors Conservation programs Building and plumbing codes The foregoing factors affect the amount of water needed, as well as the timing of when it is needed and available. An analysis was performed that combined growth projections with water use data to forecast total water demand in future years. Water uses were broken out into specific categories as defined in the UWMP Act, and assumptions made about each to more accurately project future water use. Three separate data sets were collected and included in the analysis: historical water use by land use type, current population and projected population. The demand projections in the Plan include econometric modeling and plumbing code changes, and the demand projections assume that water conservation programs identified in the 2015 Water Use Efficiency Strategic Plan (WUESP) will be implemented. These projections were documented in the Technical Memorandum No. 2 (Maddaus Water Management [MWM], Inc., 2016, [MWM 2016]), which serves as the final land-use based demand forecast for each retail purveyor and which supports the Plan. Santa Clarita Valley Urban Water Management Plan Page 2-1
193 2.2 Demographics 2015 Santa Clarita Valley Urban Water Management Plan Water service is provided to residential, commercial, industrial, institutional, recreational, and agricultural customers and for environmental and other uses, such as fire protection and landscaping. The total demand for water supplies is expected to continue to rise within the Santa Clarita Valley area (along with most of California) because of population growth, planned development, economic activity, environmental and water quality needs and regulatory requirements. The demand projections included in this Plan are primarily based on current land use and future development within CLWA service area. For SCWD, NCWD and LACWWD 36, land use was based on the Santa Clarita Valley Area Land Use Plan that is part of the One Valley-One Vision (OVOV) joint planning effort between the City of Santa Clarita and the Los Angeles County Department of Regional Planning. For future development within the VWC service area, land use was also based on OVOV and the approved Newhall Ranch Specific Plan, and approved and submitted tentative tract maps. The build out of the land use designations in the OVOV was assumed to occur in the year Historical Water Use Predicting future water use requires accurate historic water use patterns and water usage records. The historical use of all water supplies used to meet municipal water requirements, including the use of local groundwater, imported water supplies and recycled water, are summarized in Table 2-1. Figure 2-1 illustrates this use, which shows an increasing trend in Valley water demand since 1995 with a downturn in recent years likely due to economic conditions and response by customers to dry-year conservation efforts and prolonged drought. TABLE 2-1 HISTORICAL WATER USE BY RETAIL WATER PURVEYORS (AF) Year LACWWD 36 NCWD SCWD VWC All Retail Purveyors ,755 19,898 17,543 45, ,887 22,006 19,721 50, ,801 22,456 22,131 54, ,087 20,319 19,874 48, ,348 24,513 22,735 57, ,718 25,280 25,190 60, ,525 25,544 24,715 60, ,069 10,362 28,434 28,360 68, ,175 10,351 27,092 28,829 67, ,234 11,217 29,191 30,654 72, ,200 10,756 28,921 29,891 70, ,289 11,470 30,302 31,065 74, ,406 11,975 31,355 32,756 77, ,354 11,340 30,476 32,730 75, ,243 10,560 27,816 30,355 69, ,141 9,531 25,795 27,599 64, ,172 9,676 25,826 28,131 64, ,265 10,469 27,956 30,022 69, ,296 10,561 29,596 32,007 73, ,242 9,845 27,530 29,561 68, ,100 21,783 23,632 54,491 Source: 2014 Santa Clarita Valley Water Report (June 2015) and 2015 data provided by each retail purveyor. Santa Clarita Valley Urban Water Management Plan Page 2-2
194 2015 Santa Clarita Valley Urban Water Management Plan FIGURE 2-1 HISTORICAL WATER USE (AF) Source: 2014 Santa Clarita Valley Water Report (June 2015) and 2015 data provided by each retail purveyor. Santa Clarita Valley Urban Water Management Plan Page 2-3
195 2015 Santa Clarita Valley Urban Water Management Plan 2.4 Projected Water Use (Demand) Purveyor Demand Projections The demand projections for each retail purveyor have been updated since the 2010 UWMP and are documented in MWM For this UWMP, a land use based approach was used (which incorporates information from a population-based approach) because such an approach can further reflect assumptions regarding how future development is planned. It can also demonstrate how water usage patterns have evolved from what they were in the past as the Santa Clarita Valley approaches build-out. The projections take results from updated econometric models developed for the purveyors in the 2015 WUESP to project demand to 2020, transitioning to a land use-based approach through 2050 (assumed buildout) based on data provided by the purveyors and as contained in local land use plans. The land use-based demand forecast was conducted for three of the four retail purveyors; NCWD, SCWD, and VWC. Sufficient data was not available to conduct the land use-based analysis for LACWWD 36; that assessment relies on a population based demand forecast. A summary of the approach employed is provided below and in detail in MWM For VWC, NCWD and SCWD, the overall basis for this analysis was to generate future demand forecasts using a land use-based approach by Traffic Analysis Zones (TAZ) for anticipated land development that involved information including: Estimated dwelling units provided by City of Santa Clarita and Los Angeles County data informed by general plans, specific plans, and past and remaining growth anticipated through Geographic Information System (GIS) analysis; Land use-based GIS map shape files from City of Santa Clarita and Los Angeles County planners; Retailer-provided GIS maps of service area boundaries overlaid on land use maps from the City and County; Land use-based details contained in approved specific plans and approved and submitted tentative tract maps inside the VWC service area; Billing data by customer category (single-family, multi-family, non-residential, etc.); and Climate and economic adjustment factors for normalizing demands in 2004 and 2012; and future demand factors. In addition, recent legislation provides that if available and applicable to the Agency or its retail purveyors, demand projections may display and account for the water savings estimated to result from adopted codes, standards, ordinances, or transportation and land use plans identified by the urban water supplier, as applicable to the service area. If such information is reported, the assessment will provide citations of the various codes, standards, ordinances, or transportation and land use plans utilized in making the projections. The UWMP must indicate the extent that the demand projections consider savings from codes, standards, ordinances, or transportation and land use plans (referred to as savings from passive conservation). The demand forecast conducted for this Plan provides an assessment of demands that include quantification of savings from passive conservation and active conservation (discussed in greater detail in the WUESP (MWM 2015 and 2016), Sections 2.7 and 7 of this Plan). This was Santa Clarita Valley Urban Water Management Plan Page 2-4
196 2015 Santa Clarita Valley Urban Water Management Plan done so that each retailer can evaluate what its future demand would likely be if the retailer did not undertake any active conservation programs between now and These passive conservation savings included the following water conservation related agreements, laws, codes and regulations that frame the requirements of the Plan: SB 407 Requires single family residential property owners of pre-1994 buildings or dwelling units to replace existing plumbing fixtures with water conserving fixtures by 2017 and multi-family and commercial property owners of pre-1994 buildings to replace fixtures by Also requires all owners to upgrade existing buildings upon any remodel initiated after January 1, 2014 and authorizes the enactment of local ordinances for greater water savings. Assembly Bill (AB) 715 California Plumbing Code includes the new California Code of Regulations (CCR) Title 20 Appliance Efficiency Standards requiring High Efficiency Toilets and High Efficiency Urinals to be exclusively sold in the state by January 1, AB 1881 State Model Water Efficient Landscape Ordinance adopted by the City of Santa Clarita effective January 1, 2010; improves efficiency in water use in new and existing urban irrigated landscapes. Governor s Drought Executive Order (EO B-29-15), Updated State Model Water Efficient Landscape Ordinance, September 2015 AB 2572 Requires the installation of water meters by January 1, 2025; also requires charging upon volume of delivery. AB 797 Urban Water Management Planning Act requires the implementation of either Demand Management Measures or Best Management Practices (BMPs) California Urban Water Conservation Council (CUWCC) 2008 MOU CLWA and the retailer purveyors have been signatories since 2001 and committed to implementing the Water BMPs. National Plumbing Code Passed in 1992, has long required more efficient plumbing fixtures to be for sale throughout the United States. SB 610 and 221 Passed in 2003, these bills require coordination between land and water agencies to ensure that adequate water supplies are available before approval of large land development projects. In addition, California State Senate Bill (SBX7-7) requires urban water agencies to reduce statewide per capita water consumption 20 percent by This may be achieved through both passive conservation savings and active conservation programs. Table 2-2 provides a summary of each purveyor s projected total water demands, including projected savings from passive conservation, through Active conservation programs identified and evaluated in the 2015 WUESP to meet the SBX7-7 conservation requirements are also reflected in the demands shown. Tables 2-3 through 2-6, for LACWWD 36, NCWD, SCWD and VWC, respectively, show current and projected water demand, by customer type and in total, through Santa Clarita Valley Urban Water Management Plan Page 2-5
197 2015 Santa Clarita Valley Urban Water Management Plan TABLE 2-2 SUMMARY OF PROJECTED WATER DEMANDS (AF) (a)(b)(c) Annual Increase Water Demands LACWWD 36 (d) 2,300 2,700 3,100 3,500 3,900 4,300 4, % NCWD 10,100 10,700 11,200 11,800 12,600 13,400 14, % SCWD 28,400 29,100 29,900 30,800 32,400 33,900 36, % VWC (e) 28,100 32,100 36,600 40,000 39,600 39,300 39, % Total Demand 68,900 74,600 80,800 86,100 88,500 90,900 93, % Notes: (a) Values rounded to the nearest hundred. (b) From MWM Demands exclude non-purveyor demands. Similarly, supplies evaluated in this UWMP exclude non-purveyor supplies. (c) Demands include savings from plumbing code and standards and active conservation as assumed in the 2015 WUESP. (d) LACWWD 36 future demand was based on a growth projection factor and not on land use as was done for the three other purveyors. LACWWD 36 is included for purposes of providing regional completeness; however, it is not required to prepare an UWMP. (e) Refer to GSI 2016 for detail on specific future developments included in the analysis. Santa Clarita Valley Urban Water Management Plan Page 2-6
198 2015 Santa Clarita Valley Urban Water Management Plan TABLE 2-3 LACWWD 36 CURRENT AND PROJECTED WATER DELIVERIES BY CUSTOMER TYPE (a)(b)(c) Year Water Use Sectors Single- Family Residential Multi-Family Residential Commercial Industrial Institutional Irrigation Other Non- Revenue Water (d) No. of accounts 1, ,345 Deliveries (AF) (e) No. of accounts 2, ,200 Deliveries (AF) 1, ,300 No. of accounts 2, ,600 Deliveries (AF) 2, ,700 No. of accounts 3, ,000 Deliveries (AF) 2, ,100 No. of accounts 3, ,400 Deliveries (AF) 2, ,500 No. of accounts 3, ,800 Deliveries (AF) 2, ,900 No. of accounts 4, ,300 Deliveries (AF) 3, ,300 No. of accounts 4, , Deliveries (AF) ,700 Notes: (a) Values rounded to the nearest hundred. (b) 2015 values based on actual use. Projections for 2020 to 2050 from MWM (c) LACWWD 36 future demand was based on a growth projection factor and not on land use as was done for the three other purveyors. LACWWD 36 is included for purposes of providing regional completeness; however, it is not required to prepare an UWMP. (d) Non-revenue water (NRW) may include unbilled authorized consumption as well as water that is lost before it reaches the customer. Losses can be real losses (through leaks, sometimes also referred to as physical losses) or apparent losses (for example through theft or metering inaccuracies). (e) Construction water use. Total Santa Clarita Valley Urban Water Management Plan Page 2-7
199 2015 Santa Clarita Valley Urban Water Management Plan TABLE 2-4 NCWD CURRENT AND PROJECTED WATER DELIVERIES BY CUSTOMER TYPE (a)(b) Year Water Use Sectors Single- Family Residential Multi-Family Residential Commercial Industrial Institutional Irrigation (c) Other Non- Revenue Water (d) No. of accounts 8, ,736 Deliveries (AF) 4,232 1, , ,092 No. of accounts 9, ,700 Deliveries (AF) 5,200 1, , ,100 No. of accounts 10, ,900 Deliveries (AF) 5,500 1, , ,700 No. of accounts 10, ,000 Deliveries (AF) 5,800 1, , ,200 No. of accounts 11, , ,200 Deliveries (AF) 6,100 1, , ,800 No. of accounts 12, , ,300 Deliveries (AF) 6,500 1, , ,600 No. of accounts 13, , ,500 Deliveries (AF) 6,900 1, , ,400 No. of accounts 14, , , Deliveries (AF) 7,400 1, , ,200 Notes: (a) Values rounded to the nearest hundred. (b) 2015 values based on actual use. Projections for 2020 to 2050 from MWM (c) A portion of future irrigation demands are projected to be met with recycled water to the extent recycled water supplies are available. (See the discussion in Section 4 and Table 4-3). (d) NRW may include unbilled authorized consumption as well as water that is lost before it reaches the customer. Losses can be real losses (through leaks, sometimes also referred to as physical losses) or apparent losses (for example through theft or metering inaccuracies). Total Santa Clarita Valley Urban Water Management Plan Page 2-8
200 2015 Santa Clarita Valley Urban Water Management Plan TABLE 2-5 SCWD CURRENT AND PROJECTED WATER DELIVERIES BY CUSTOMER TYPE (a)(b) Year Water Use Sectors Single- Family Residential Multi-Family Residential Commercial Industrial Institutional Irrigation (c) Other Non- Revenue Water (d) No. of accounts 23,132 4, ,064 Deliveries (AF) 11,978 2, , ,845 21,783 No. of accounts 22,900 5,400 1, , ,300 Deliveries (AF) 12,500 3,600 1, , ,100 28,400 No. of accounts 24,000 5,900 1, , ,300 Deliveries (AF) 12,300 3,700 1, , ,200 29,100 No. of accounts 25,100 6,500 1, , ,300 Deliveries (AF) 12,100 3,900 1, , ,300 29,900 No. of accounts 26,200 7,000 2, , ,500 Deliveries (AF) 12,000 4,100 2, , ,400 30,800 No. of accounts 27,300 7,600 2, , ,500 Deliveries (AF) 12,100 4,300 2, , ,700 32,400 No. of accounts 28,400 8,200 2, , ,600 Deliveries (AF) 12,200 4,600 2, , ,700 33,900 No. of accounts 29,600 8,700 2, , , Deliveries (AF) 12,900 4,900 2, , ,900 36,000 Notes: (a) Values rounded to the nearest hundred. (b) 2015 values based on actual use. Projections for 2020 to 2050 from MWM (c) A portion of future irrigation demands are projected to be met with recycled water to the extent recycled water supplies are available. (See the discussion in Section 4 and Table 4-3). (d) NRW may include unbilled authorized consumption as well as water that is lost before it reaches the customer. Losses can be real losses (through leaks, sometimes also referred to as physical losses) or apparent losses (for example through theft or metering inaccuracies). Total Santa Clarita Valley Urban Water Management Plan Page 2-9
201 2015 Santa Clarita Valley Urban Water Management Plan TABLE 2-6 VWC CURRENT AND PROJECTED WATER DELIVERIES BY CUSTOMER TYPE (a)(b) Year Water Use Sectors Single- Family Residential Multi- Family Residential Commercial Industrial Institutional Irrigation (c) Other Recycled Water (d) Non- Revenue Water (e) No of Accounts 27, , ,100 Deliveries (AF) 10,310 1,332 3, , ,166 23,632 No of Accounts 30, , , ,400 Deliveries (AF) 12,100 1,500 4,400 1, , ,000 1,500 28,100 No of Accounts 32, , , ,600 Deliveries (AF) 12,700 2,400 4,800 1, , ,800 1,700 32,100 No of Accounts 35,500 1,200 1, , ,900 Deliveries (AF) 13,400 3,200 5,200 2, , ,600 1,900 36,600 No of Accounts 37,500 1,500 1, , ,400 Deliveries (AF) 13,800 3,900 5,600 2,500 1,000 5, ,100 2,000 40,000 No of Accounts 37,500 1,500 1, , ,400 Deliveries (AF) 13,700 3,900 5,500 2,500 1,000 4, ,100 2,000 39,600 No of Accounts 37,500 1,500 1, , ,400 Deliveries (AF) 13,600 3,800 5,400 2,500 1,000 4, ,100 2,000 39,300 No of Accounts 37,500 1,500 1, , , Deliveries (AF) 13,400 3,800 5,400 2,500 1,000 4, ,100 2,000 39,000 Notes: (a) Values rounded to the nearest hundred. (b) 2015 values based on actual use. Projections for 2020 to 2050 from MWM (c) A portion of future irrigation demands are projected to be met with recycled water to the extent recycled water supplies are available. (See, e.g., discussion in Section 4 and Table 4-3; also see following note). (d) Recycled water numbers shown here for 2020 to 2050 reflect various demands that VWC anticipates could be met with recycled water in the future. Recycled water demands that are projected to be economically feasible, based on Kennedy/Jenks Consultants 2016a, are higher and will include a portion of projected irrigation demands shown here. For planning purposes, total projected recycled water supplies and demands are discussed in Section 4 and shown in Table 4-3. (e) NRW may include unbilled authorized consumption as well as water that is lost before it reaches the customer. Losses can be real losses (through leaks, sometimes also referred to as physical losses) or apparent losses (for example through theft or metering inaccuracies). Total Santa Clarita Valley Urban Water Management Plan Page 2-10
202 2015 Santa Clarita Valley Urban Water Management Plan 2.5 Distribution System Water Loss New legislation requires the analysis for the 2015 UWMP to include the reporting of distribution system water loss for the most recent 12-month period available. This is provided in Table 2-7. For future UWMP updates (i.e., 2020, 2025, etc.) the distribution system water loss shall be quantified for each of the five years preceding the plan update. It should be noted that recent legislation requires that as of January 1, 2017, distribution water loss must be reported on an annual basis. The data from these audits will be reported in future UWMP cycles. TABLE 2-7 DISTRIBUTION SYSTEM WATER LOSS (a) Reporting Period Start Date (Month/Year) Volume of Water Loss (AF) (b) % Water Loss (c) CLWA July/ % NCWD January/ % SCWD July/ % VWC January/ % Note: (a) Based on the most recent 12-month period available. (b) Sum of real and apparent losses. (c) System water loss as percent of total water supplied. 2.6 Population Historical Population The methodology for estimating the historical populations of areas served by the retail water purveyors is prescribed by DWR 5. The method enables those suppliers whose service areas are not fully contained in existing city boundaries to obtain service area population from a data source such as a regional planning agency or an association of governments (such as Southern California Association of Governments, SCAG), assuming that their estimates use the State Department of Finance (DOF) or U.S. Census Bureau data as a basis. MWM, Inc. updated the 2010 UWMP assessment of historical population for the purposes of the WUESP and this Plan (MWM, 2014). This assessment was conducted using U.S. Census block data from the years 2000 and The population assessment was conducted by evaluating the population in each census block to determine what portion of the population residing in that block was located in a particular retail agency service area. The population assessments were verified by using high resolution aerial maps to visually review census blocks which contained more than one service area. 5 See Appendix A in Methodologies for Calculating Baseline and Compliance per Capita Urban Water Use (DWR 2010). 6 The 2015 DWR Guidelines for preparing the 2015 UWMP Update require agencies to use the 2010 Census for calculation of historical population if the 2010 Census was not used in the 2010 UWMP (most of the 2010 Census data was not available until after the 2010 UWMPs were submitted to DWR). As such, this evaluation uses the 2010 Census data. Santa Clarita Valley Urban Water Management Plan Page 2-11
203 2015 Santa Clarita Valley Urban Water Management Plan It is noteworthy that for the year 2010, the total population was estimated to be 258,229, which is approximately 10% lower than the population estimate of 286,751 that was identified in the 2010 UWMP. A similar pattern was seen for the year 2000 where the population was estimated at 189,748, versus the 2000 UWMP population of 207,690 (a difference of approximately 8.6%) The population for each purveyor was estimated by taking the number of single-family (SF) and multi-family (MF) accounts in a given year and multiplying by a persons per household (PPH) factor for the number of people living at each type of account, confirmed by the review of the census blocks and verified by aerial images, and then summing the result. Using a PPH factor, identified and anchored to the 2000 and 2010 Census, annual historical populations were calculated for each purveyor from 1995, as shown in Tables 2-8 to A summary table of total historical population for the Santa Clarita Valley is shown in Table Santa Clarita Valley Urban Water Management Plan Page 2-12
204 2015 Santa Clarita Valley Urban Water Management Plan TABLE 2-8 NCWD HISTORICAL POPULATION Year SF Residential Units (a) MF Residential Units (a) Census Population SF Persons Per Unit MF Persons Per Unit Updated Population Estimate (b)(c) Production (AFY) (d) ,680 4, ,395 7, ,723 4, ,647 7, ,035 4, ,821 8, ,037 4, ,852 8, ,202 4, ,482 9, ,255 4,713 34, ,859 9, ,428 4, ,783 9, ,777 4, ,371 10, ,199 4, ,169 10, ,873 4, ,886 11, ,163 4, ,127 10, ,292 4, ,751 11, ,431 4, ,365 11, ,450 4, ,595 11, ,492 4, ,911 10, ,398 4,995 45, ,036 9, ,478 4, ,305 9, ,515 4, ,452 10, ,530 4, ,503 10, ,675 5, ,079 9,845 Notes: (a) Single Family (SF) and Multi-Family (MF) residential units provided by each retail purveyor, updated (MWM, 2016). (b) Population estimated for non-census years assuming consistent exponential growth and (c) Population derived from 2000 and 2010 U.S. Census Bureau, Census Block Data, and verified via MWM, Inc. using each retailer's GIS service area boundary maps. (d) Production from the 2014 Santa Clarita Valley Water Report. Santa Clarita Valley Urban Water Management Plan Page 2-13
205 2015 Santa Clarita Valley Urban Water Management Plan TABLE 2-9 SCWD HISTORICAL POPULATION Year SF Residential Units (a) MF Residential Units (a) Census Population SF Persons Per Unit MF Persons Per Unit Updated Population Estimate (b)(c) Production (AFY) (d) ,632 10, ,674 19, ,812 10, ,350 22, ,856 9, ,909 22, ,222 9, ,205 20, ,671 9, ,927 24, ,408 10,527 87, ,455 25, ,145 10, ,348 25, ,691 11, ,674 28, ,278 11, ,602 27, ,152 12, ,700 29, ,035 12, ,967 28, ,620 13, ,736 29, ,347 13, ,846 31, ,398 13, ,364 30, ,374 13, ,748 27, ,707 13, , ,296 25, ,039 13, ,644 25, ,372 13, ,991 27, ,704 13, ,339 29, ,141 13, ,423 27,530 Notes: (a) Single Family (SF) and Multi-Family (MF) residential units provided by each retail purveyor, updated (MWM, 2016). (b) Population estimated for non-census years assuming consistent exponential growth and (c) Population derived from 2000 and 2010 U.S. Census Bureau, Census Block Data, and verified via MWM, Inc. using each retailer's GIS service area boundary maps. (d) Production from the 2014 Santa Clarita Valley Water Report. Santa Clarita Valley Urban Water Management Plan Page 2-14
206 2015 Santa Clarita Valley Urban Water Management Plan TABLE 2-10 VWC HISTORICAL POPULATION Year SF Residential Units (a) MF Residential Units (a) Census Population SF Persons Per Unit MF Persons Per Unit Updated Population Estimate (b)(c) Production (AFY) (d) ,834 3, ,165 17, ,571 4, ,420 19, ,856 4, ,095 22, ,891 4, ,745 19, ,844 4, ,850 22, ,759 5,101 63, ,922 25, ,211 5, ,409 24, ,398 6, ,192 28, ,402 7, ,757 28, ,773 7, ,816 30, ,533 7, ,425 29, ,624 7, ,304 31, ,711 7, ,174 32, ,791 7, ,026 32, ,751 8, ,925 30, ,098 8,179 92, ,851 27, ,252 8, ,765 28, ,439 8, ,888 30, ,708 8, ,687 32, ,162 9, ,748 29,561 Notes: (a) Single Family (SF) and Multi-Family (MF) residential units provided by each retail purveyor, updated (MWM, 2016). (b) Population estimated for non-census years assuming consistent exponential growth and (c) Population derived from 2000 and 2010 U.S. Census Bureau, Census Block Data, and verified via MWM, Inc. using each retailer's GIS service area boundary maps. (d) Production from the 2014 Santa Clarita Valley Water Report. Santa Clarita Valley Urban Water Management Plan Page 2-15
207 2015 Santa Clarita Valley Urban Water Management Plan TABLE 2-11 LACWWD 36 HISTORICAL POPULATION Updated Population Estimate (b)(c) Year SF Residential Units (a) MF Residential Units (a) Census Population SF Persons Per Unit MF Persons Per Unit Production (AFY) (d) , , , , , ,285 1, , ,556 1, , ,680 1, , ,755 1, , ,830 1, , ,879 1, , ,942 1, , ,982 1, , , ,046 1, , ,042 1, , ,059 1, , ,090 1, , ,200 1,242 Notes: (a) Single Family (SF) and Multi-Family (MF) residential units provided by each retail purveyor, updated (MWM, 2016). (b) Population estimated for non-census years assuming consistent exponential growth and (c) Population derived from 2000 and 2010 U.S. Census Bureau, Census Block Data, and verified via MWM, Inc. using each retailer's GIS service area boundary maps. (d) Production from the 2014 Santa Clarita Valley Water Report. Santa Clarita Valley Urban Water Management Plan Page 2-16
208 2015 Santa Clarita Valley Urban Water Management Plan TABLE 2-12 SUMMARY OF CURRENT AND HISTORICAL POPULATION BY RETAIL PURVEYOR SERVICE AREA (a) Year NCWD SCWD VWC LACWWD 36 (c)(d) Total CLWA Service Area ,395 80,674 48, , ,647 81,350 50, , ,821 80,909 54, , ,852 82,205 57, , ,482 83,927 60, , ,859 87,455 63,922 3, , ,783 91,348 69,409 3, , ,371 94,674 74,192 4, , ,169 97,602 78,757 4, , , ,700 83,816 4, , , ,967 87,425 4, , , ,736 88,304 4, , , ,846 89,174 4, , , ,364 90,026 4, , , ,748 90,925 4, , , ,296 92,851 5, , , ,644 93,765 5, , , ,991 94,888 5, , , ,339 95,687 5, , , ,423 97,748 7, , (b) 46, ,700 97,300 6,000 (d) 272,500 Notes: (a) NCWD, SCWD, and VWC historical populations ( ) from Tables 2-8 to (b) 2015 population estimated using the land use-based approach used to project demands as described in Section (MWM, 2016). (c) Detailed land use information was not available for LACWWD 36. Therefore, population for LACWWD 36 assessed using the OVOV growth rate (WUESP and MWM, 2016). (d) LACWWD 36 included for purposes of providing regional completeness; however, it is not required to prepare an UWMP Population Projections Retailer-specific population projections are based on the land use dwelling unit projections using buildout estimates and the PPH estimates presented in MWM (2016) and GSI (2016). The projections are shown in Table Based on these results, population in the CLWA service area is projected to grow at an average annual rate of approximately 1.3 percent per year over the 35-year planning period to 2050 (buildout). Santa Clarita Valley Urban Water Management Plan Page 2-17
209 2015 Santa Clarita Valley Urban Water Management Plan TABLE 2-13 PROJECTED POPULATION (a) Year NCWD SCWD VWC LACWWD 36 Total CLWA Service Area , ,500 99,600 9, , , , ,700 10, , , , ,800 12, , , , ,900 14, , , , ,900 16, , , , ,900 17, , , , ,900 19, ,400 Notes: (a) MWM, Comparison to City and County Planning OVOV is a joint planning effort by the City of Santa Clarita and Los Angeles County representing the buildout of the entire Santa Clarita Valley, including Canyon Country, Newhall, Saugus and Valencia and the County communities of Stevenson Ranch, Castaic, Val Verde, Agua Dulce and the future Newhall Ranch. OVOV includes both City and County jurisdictions in its planning effort, which includes the development of a General Plan and associated EIR. Both the OVOV area and the Santa Clarita Valley planning area (defined by SCAG) are slightly larger than the CLWA service area and factor into modest differences in population projections shown in Table TABLE 2-14 POPULATION COMPARISON Year Total CLWA Service Area (a) OVOV (b) , , , , , , , , , , , , , , , , , , , , ,000 Notes: (a) See Table (b) OVOV General Plan Environmental Impact Report (EIR). As shown in Table 2-14, the OVOV projections indicate a 1.6 to 1.8 percent annual growth rate of population for the Santa Clarita Valley. The purveyor projections of population growth are just slightly below this, with a 1.3 percent annual growth rate. These population growth rates align with the annual rate of increase in the purveyors projected water demands of 1.1 percent (Table 2-2). Based on a detailed analysis of the OVOV Planning Area conducted by traffic analysis zones, County and City staff have determined that population of the Santa Clarita Valley at full build out of the uses shown on the land use map of the Area Plan will be approximately 460,000 to 482,000 residents. The total population projected in this UWMP for the CLWA service area in 2050 is approximately 421,400 residents. The principal reason for the difference between this and the OVOV population projections is because the projections done for this UWMP were confined to only existing service Santa Clarita Valley Urban Water Management Plan Page 2-18
210 2015 Santa Clarita Valley Urban Water Management Plan areas and annexations actively pending 7. There is some development in the OVOV Plan that is left outside of these areas and where annexations to the CLWA service area have been proposed. Additionally, the OVOV Plan assumed a single PPH figure for each residential land use in the entire Santa Clarita Valley; this Plan uses a Census-derived PPH figure that varies based on the data collected for each retailer. As a result, some of the purveyors PPH figures are less than the valley-wide figure used for the OVOV Plan. 2.7 Existing and Targeted Per Capita Water Use Base Daily Per Capita Water Use for SBX7-7 Reduction The Water Conservation Act of 2009 (SBX7-7) is one of four bills enacted as part of the November 2009 Comprehensive Water Package (Special Session Policy Bills and Bond Summary). The Water Conservation Act of 2009 provides the regulatory framework to support the goal of achieving a statewide reduction in urban per capita water use as described in the 20x20 Water Conservation Plan (DWR, 2010). Consistent with SBX7-7, each retail water supplier must determine and report its existing baseline water consumption and establish water use targets in gallons per capita per day (GPCD), and compare actual water use against the target. Reporting began with the 2010 UWMP. The primary calculations required by SBX7-7 are summarized in Table Base Daily Water Use calculation (average GPCD used in past years) Interim Water Use Target (target GPCD in 2015) Compliance Water Use Target (target GPCD in 2020) Actual 2015 Water Use (in GPCD) TABLE 2-15 SBX7-7 CALCULATIONS 2010 UWMP 2015 UWMP 2020 UWMP May be revised in 2015 Plan; must be revised if 2010 Census data not used in original calculation NA First calculated and reported in the 2010 plan First calculated and reported in 2010 Plan First calculated and reported in 2010 Plan NA May be revised in 2015 Plan; must be revised if 2010 Census data not used in original calculation May be revised in 2015 Plan; must be revised if 2010 Census data not used in original calculation In 2015 Plan must compare actual 2015 GPCD against 2015 target Actual 2020 Water Use (in GPCD) NA NA NA NA NA In 2020 Plan must compare actual 2020 GPCD against 2020 target The retail purveyors first reported their Base Daily Water Use in the 2010 UWMP. At the time the 2010 UWMP was prepared full 2010 Census data was not available. As noted above, the retail 7 The total build out population for the CLWA service area used undeveloped parcels in the existing service area and the three proposed annexations for Legacy Village Development, Tapia, and Tesoro Canyons along with potential future annexations to the existing retailer service areas, but within the current CLWA service area boundary. Santa Clarita Valley Urban Water Management Plan Page 2-19
211 2015 Santa Clarita Valley Urban Water Management Plan purveyors are therefore required to use the 2010 Census data to revise their Base Daily Water Use calculations in this Plan. The Base Daily Water Use calculation is based on gross water use by a retail agency in each year and can be based on a ten-year average ending no earlier than 2004 and no later than 2010, or a 15-year average if ten percent of 2008 demand was met by recycled water. Base Daily Water Use must account for all water sent to retail customers, excluding: Recycled water Water sent to another water agency Water that went into storage It is at an agency s discretion whether or not to exclude agricultural water use from the Base Daily Water Use Calculation. If agricultural water use is excluded from the Base Daily Water Use calculation it must also be excluded from the calculation of actual water use in later urban water management plans. The retail purveyors did not supply water to agriculture during the period 1995 to 2010 and so agricultural water does not factor into the revised SBX7-7 calculations. An urban retail water supplier must set a 2020 water use target (herein called the Compliance Water Use Target) and a 2015 interim target (herein called the Interim Water Use Target). There are four methods for calculating the Compliance Water Use Target: 1. Eighty percent of the urban water supplier s baseline per capita daily water use 2. Per capita daily water use estimated using the sum of the following: a. For indoor residential water use, 55 GPCD water use as a provisional standard. Upon completion of DWR s 2016 report to the Legislature reviewing progress toward achieving the statewide 20 percent reduction target, this standard may be adjusted by the Legislature by statute. b. For landscape irrigated through dedicated or residential meters or connections, water use efficiency equivalent to the standards of the Model Water Efficient Landscape Ordinance set forth in section 490 et seq. of Title 23 of the California Code of Regulations, as in effect the later of the year of the landscape s installation or c. For commercial, industrial, and institutional (CII) uses, a ten percent reduction in water use from the baseline CII water use by Ninety-five percent of the applicable state hydrologic region target as stated in the state s April 30, 2009, draft 20 by 2020 Water Conservation Plan. The retail purveyors are located within the South Coast Hydrologic Region (target for this region is 149 GPCD). 4. Reduce the 10 or 15-year Base Daily Per Capita Water Use a specific amount for different water sectors: a. Indoor residential water use to be reduced by 15 GPCD or an amount determined by use of DWR s Best Management Practice (BMP) Calculator. b. A 20 percent savings on all unmetered uses. c. A 10 percent savings on baseline CII use. d. A 21.6 percent savings on current landscape and water loss uses. Santa Clarita Valley Urban Water Management Plan Page 2-20
212 2015 Santa Clarita Valley Urban Water Management Plan The Interim Water Use Target is set as a halfway point between the Base Daily Water Use GPCD and the 2020 Compliance Water Use Target GPCD. ly, the selected Compliance Water Use Target must be compared against what DWR calls the Maximum Allowable GPCD. The Maximum Allowable GPCD is based on 95 percent of a 5- year average base gross water use ending no earlier than 2007 and no later than The Maximum Allowable GPCD use is used to determine whether a supplier s 2015 and 2020 per capita water use targets meet the minimum water use reduction requirements of SBX7-7. If an agency s Compliance Water Use Target is higher than the Maximum Allowable GPCD, the agency must instead use the Maximum Allowable GPCD as its target. As shown below, the Maximum Allowable GPCD does not apply to any of the water retailers herein. Tables 2-16 to 2-18 provide the data used to calculate the Base Daily Per Capita Water Use in GPCD, and the 10-year and 5-year base periods for each purveyor. Tables 22-20, 2-22, and 2-24 provides the data used to determine whether the purveyor s 2015 and 2020 per capita water use targets meet the legislation s minimum water use reduction requirement of five percent. If the 2020 target is greater than the 5-year value, the target is reduced to this value. These tables show that the 2020 targets do not exceed these minimum values. Per SBX7-7 requirements, the 2015 interim targets were therefore set to the mid-point between the 10-year baseline per capita water use and the 2020 target. TABLE 2-16 (REVISED) NCWD BASE DAILY PER CAPITA WATER USE Base Period Year Distribution Annual System Annual Daily Per 10-Year 5-Year Sequence Calendar System Gross Water Capita Water Use Average Average Year Year Population Use (AFY) (GPCD) (GPCD) (GPCD) ,395 7, ,647 7, ,821 8, ,852 8, ,482 9, ,859 9, ,783 9, ,371 10, ,169 10, ,886 11, ,127 10, ,751 11, ,365 11, ,595 11, ,911 10, ,036 9, Period Selected Note: Shaded cells show calendar years used in selected 5-year average. Santa Clarita Valley Urban Water Management Plan Page 2-21
213 2015 Santa Clarita Valley Urban Water Management Plan TABLE 2-17 (REVISED) SCWD BASE DAILY PER CAPITA WATER USE Base Period Year Distribution Annual System Annual Daily Per 10-Year 5-Year Sequence Calendar System Gross Water Capita Water Use Average Average Year Year Population Use (AFY) (GPCD) (GPCD) (GPCD) ,674 19, ,350 22, ,909 22, ,205 20, ,927 24, ,455 25, , , , ,700 29, , , , ,364 30, ,748 27, ,296 25, Period Selected Note: Shaded cells show calendar years used in selected 5-year average. TABLE 2-18 (REVISED) VWC BASE DAILY PER CAPITA WATER USE Base Period Year Distribution Annual System Annual Daily Per 10-Year 5-Year Sequence Calendar System Gross Water Capita Water Use Average Average Year Year Population Use (AFY) (a) (GPCD) (GPCD) (GPCD) ,165 17, ,420 19, ,095 22, ,745 19, ,850 22, ,922 25, ,409 24, ,192 28, ,757 28, ,816 30, ,425 29, ,304 30, ,174 32, ,026 32, ,925 30, ,851 27, Period Selected Notes: Shaded cells show calendar years used in selected 5-year average. (a) Excludes recycled water use in years Santa Clarita Valley Urban Water Management Plan Page 2-22
214 2015 Santa Clarita Valley Urban Water Management Plan Urban Water Use Targets for SBX7-7 Reduction As explained above, SBX7-7 requires that NCWD, SCWD and VWC, as retail purveyors, identify their demand reduction targets for years 2015 and 2020 by utilizing one of four options. Option percent of baseline GPCD water use (i.e., a 20 percent reduction). Option 2. The sum of the following performance standards: indoor residential use (provisional standard set at 55 GPCD); plus landscape use, including dedicated and residential meters or connections equivalent to the State Model Landscape Ordinance (80 percent ETo existing landscapes, 70 percent of ETo for future landscapes); plus 10 percent reduction in baseline commercial, industrial institutional use by Option percent of the applicable state hydrologic region target as set in the DWR 20x2020 Water Conservation Plan (February, 2010) (20x2020 Plan). Option 4. Savings by Water Sector: this provisional method developed by DWR, identifies water savings obtained through identified practices and subtracts them from the base daily per capita water use value identified for the water supplier. Option 2 and Option 4 were considered and not selected because they required data not currently being collected within the purveyors service areas. The CLWA service area is within the South Coast Hydrologic Region (No. 4) as defined by DWR and this hydrologic region has been assigned a 2020 water use target of 149 GPCD per the DWR 20x2020 Water Conservation Plan. Therefore, in order to use Option 3, each purveyor s daily per capita water use for the 5-year base period would have to be close to 95 percent of the 149 GPCD target, or 142 GPCD. Since none of the purveyors 5-year base period is within this limit, as shown in Table 2-19, none of the purveyors chose this option as the target method. TABLE 2-19 (REVISED) OPTION 3 95 PERCENT OF STATE HYDROLOGIC REGION TARGET Purveyor 5-Year Base Period (.95 * 5-yr base) 95% of 5-Year Base Period (149 GPCD) NCWD > 149 SCWD > 149 VWC > 149 Option 1 is the most applicable of the options provided and requires reduction to 80 percent of baseline per capita water use. Each of the purveyors selected Option 1 to calculate its SBX7-7 target. This results in the 2020 GPCD targets (Compliance Water Use Targets) for the purveyors as shown in Tables 2-20, 2-22, and Each purveyor plans to meet the water use targets implementing conservation methods that are discussed in Section 7 of this Plan, including existing and potentially available recycled water as described in Section 4. Tables 2-21, 2-23, and 2-25 show the calculation of reduction in demand required by each purveyor. SBX7-7 allows for both conservation and recycled water supply to assist in meeting these SBX7-7 conservation requirements. Santa Clarita Valley Urban Water Management Plan Page 2-23
215 2015 Santa Clarita Valley Urban Water Management Plan TABLE 2-20 (REVISED) NCWD COMPONENTS OF TARGET DAILY PER CAPITA WATER USE Period Value Unit 10-year period selected for baseline GPCD First Year 1999 Last Year year period selected for maximum allowable GPCD First Year 2003 Last Year 2007 Highest 10-year Average 238 GPCD Highest 5-year Average 235 GPCD Compliance Water Use Target (20% Reduction on 10yr) 190 GPCD Minimum Water Use Reduction Requirement (5% Reduction 5yr) 223 GPCD 2020 Target 190 GPCD 2015 Interim Target 214 GPCD Methodology Used Option #1 Santa Clarita Valley Urban Water Management Plan Page 2-24
216 2015 Santa Clarita Valley Urban Water Management Plan TABLE 2-21 (REVISED) NCWD SBX7-7 CONSERVATION SAVINGS SUMMARY 2015 Interim 2020 Compliance Description Units Target Target Base Daily Water Use GPCD Population Persons 46,500 (a) 49,000 Method 1 Compliance Target GPCD GPCD Reduction % Reduction 10% 20% Projected Consumption w/out additional Reduction AFY 12,397 13,063 Projected Consumption at Goal AFY 11,157 10,450 Reduction to Meet Target AFY 1,240 2,613 Notes: (a) From MWM, TABLE 2-22 (REVISED) SCWD COMPONENTS OF TARGET DAILY PER CAPITA WATER USE Period Value Unit 10-year period selected for baseline GPCD First Year 1999 Last Year year period selected for maximum allowable GPCD First Year 2003 Last Year 2007 Highest 10-year Average 251 GPCD Highest 5-year Average 247 GPCD Compliance Water Use Target (20% Reduction on 10yr) 201 GPCD Minimum Water Use Reduction Requirement (5% Requirement 5yr) 235 GPCD 2020 Target 201 GPCD 2015 Interim Target 226 GPCD Methodology Used Option #1 TABLE 2-23 (REVISED) SCWD SBX7-7 CONSERVATION SAVINGS SUMMARY Description Units 2015 Interim Target 2020 Compliance Target Base Daily Water Use GPCD Population Persons 122,700 (a) 131,500 Method 1 Compliance Target GPCD GPCD Reduction % Reduction 10% 20% Projected Consumption w/out additional Reduction AFY 34,498 36,972 Projected Consumption at Goal AFY 31,048 29,578 Reduction to Meet Target AFY 3,450 7,394 Notes: (a) From MWM, Santa Clarita Valley Urban Water Management Plan Page 2-25
217 2015 Santa Clarita Valley Urban Water Management Plan TABLE 2-24 (REVISED) VWC COMPONENTS OF TARGET DAILY PER CAPITA WATER USE Period Value Unit 10-year period selected for baseline GPCD First Year 1995 Last Year year period selected for maximum allowable GPCD First Year 2003 Last Year 2007 Highest 10-year Average 334 GPCD Highest 5-year Average 316 GPCD Compliance Water Use Target (20% Reduction on 10yr) 267 GPCD Minimum Water Use Reduction Requirement (5% Reduction 5yr) 245 GPCD 2020 Target 267 GPCD 2015 Interim Target 300 GPCD Methodology Used Option #1 TABLE 2-25 (REVISED) VWC SBX7-7 CONSERVATION SAVINGS SUMMARY Description Units 2015 Interim Target 2020 Compliance Target Base Daily Water Use GPCD Population Persons 97,300 (a) 99,600 Method 1 Compliance Target GPCD GPCD Reduction % Reduction 10% 20% Projected Consumption w/out additional Reduction AFY 36,403 37,263 Projected Consumption at Goal AFY 32,697 29,811 Reduction to Meet Target AFY 3,706 7,453 Notes: (a) From MWM, LACWWD 36 is not required to comport with the requirements of SBX7-7. However the District does implement conservation measures and will contribute to the conservation savings as indicated in Table TABLE 2-26 (REVISED) LACWWD 36 CONSERVATION SAVINGS Description Units Projected Consumption w/out additional Reduction AFY 1,500 2,400 Projected Consumption at Goal AFY 1,350 1,920 Reduction to Meet Target AFY Santa Clarita Valley Urban Water Management Plan Page 2-26
218 2015 Santa Clarita Valley Urban Water Management Plan Interim Target Compliance In the 2015 UWMP each retail purveyor must demonstrate compliance with the target established for 2015 and demonstrate that the agency is on track to achieve its 2020 target. Compliance is done through the review of the SBX7-7 Verification Tables submitted with the 2015 Plan (included as Appendix B). Table 2-27 summarizes each purveyor s 2015 compliance GPCD. Again, LACWWD 36 is not required to prepare an UWMP, and is therefore not required to show compliance with SBX7-7, however, the District s conservation is reported to show its contribution to overall conservation efforts. As shown in Table 2-27, NCWD, SCWD, and VWC all meet their 2015 Interim Water Use Targets. TABLE BASE DAILY PER CAPITA WATER USE AND 2015 SBX7-7 COMPLIANCE NCWD SCWD VWC LACWWD 36 (c) 2015 Distribution System (a) Population 46, ,700 97,300 6, Annual System Gross Water Use (AFY) (b) 8,100 21,783 22,970(e) Annual Daily Per Capita (d) Water Use (GPCD) Interim Goal NA Goal Met? YES YES YES NA Notes: (a) From MWM, (b) Actual 2015 data provided by each purveyor (c) LACWWD 36 is not required to prepare an UWMP, and is therefore not required to show compliance with SBX7-7 however it is reported to show the District s contribution to overall conservation efforts. (d) Water consumption by customer type varies by retail water purveyor. SBX7-7 requires all water uses be included to determine GPCD. To determine the ratio of GPCD by sector for each purveyor, refer to Tables 2-3 through 2-6. (e) Excludes 450 AF of delivered recycled water and 212 AF delivered to SCWD through the SCWD Drought Intertie Purveyor Demand Projections and SBX7-7 Objectives Table 2-28 summarizes the retail purveyors projected water demands through This summary includes demands without passive savings, demands inclusive of passing savings, and demands with passive savings and with active conservation, using the SBX7-7 requirements discussed previously in Section Specific conservation programs are addressed in the WUESP and are summarized in Section 7. In addition, Section 6 and Appendix C of this Plan include demand projections for a single-dry water year and a multiple-dry year period, assuming a ten percent increase in demand with conservation in dry years. As the regional wholesaler, CLWA assists SCWD, VWC and NCWD with DMM implementation and reporting (LACWWD 36 implementation and reporting is done by the County of Los Angeles on behalf of all its Waterworks Districts). As the regional wholesaler, CLWA is responsible for the implementation of a subset of the Foundational DMMs, as described in Section 7 of this Plan. However, CLWA in partnership with the retail purveyors has taken a leadership role in the implementation and support of a number of the DMMs and other measures to assist the retailers in meeting their targets, as required by SBX7-7. Santa Clarita Valley Urban Water Management Plan Page 2-27
219 2015 Santa Clarita Valley Urban Water Management Plan CLWA provides the funding and administration for many of the DMMs and related programs that are implemented Valley-wide. Together the water suppliers have been administering, managing and financing the WUESP programs. Since SBX7-7 was enacted, CLWA and the purveyors developed an implementation plan that is reflected in the updated 2015 WUESP, while accelerating and expanding its goals to identify other opportunities that will help meet long-term goals such as those required by SBX7-7. Santa Clarita Valley Urban Water Management Plan Page 2-28
220 2015 Santa Clarita Valley Urban Water Management Plan TABLE 2-28 NORMAL YEAR SBX7-7 DEMAND CALCULATIONS (AF) Water Demands (a) LACWWD 36 (b) Demand w/out Plumbing Code Savings 2,500 3,000 3,500 4,000 4,500 5,000 5,500 Demand w/ Plumbing Code Savings 2,400 2,900 3,300 3,700 4,200 4,600 5,100 Demand w/ Plumbing Code Savings and Active Conservation 2,300 2,700 3,100 3,500 3,900 4,300 4,700 NCWD Demand w/out Plumbing Code Savings 11,500 13,200 14,400 15,600 16,800 18,000 19,200 Demand w/ Plumbing Code Savings 11,500 12,400 13,200 14,100 15,100 16,100 17,100 Demand w/ Plumbing Code Savings and Active Conservation 10,100 10,700 11,200 11,800 12,600 13,400 14,200 SCWD Demand w/out Plumbing Code Savings 32,500 35,200 37,900 40,600 43,300 46,000 48,700 Demand w/ Plumbing Code Savings 31,500 33,400 35,300 37,400 39,500 41,700 43,900 Demand w/ Plumbing Code Savings and Active Conservation 28,400 29,100 29,900 30,800 32,400 33,900 36,000 VWC Demand w/out Plumbing Code Savings 32,900 38,700 44,600 49,300 49,300 49,300 49,300 Demand w/ Plumbing Code Savings 31,300 36,100 40,900 44,800 44,600 44,400 44,300 Demand w/ Plumbing Code Savings and Active Conservation 28,100 32,100 36,600 40,000 39,600 39,300 39,000 Regional Summary Demand w/out Plumbing Code Savings 79,400 90, , , , , ,700 Demand w/ Plumbing Code Savings 76,700 84,800 92, , , , ,400 Demand w/ Plumbing Code Savings and Active Conservation 68,900 74,600 80,800 86,100 88,500 90,900 93,900 Notes: (a) From MWM (b) LACWWD 36 is not required to prepare an UWMP, and is therefore not required to show compliance with SBX7-7, however it is reported to show the District s contribution to overall conservation efforts. Santa Clarita Valley Urban Water Management Plan Page 2-29
221 2015 Santa Clarita Valley Urban Water Management Plan Lower Income Projected Water Demands The UWMP Act requires that water use projections of a UWMP include the projected water use for single-family and multi-family residential housing for lower income households as identified in the housing element of any city, county, or city and county general plan in the service area of the supplier. Housing elements rely on the Regional Housing Needs Allocation (RHNA) generated by the State Department of Housing and Community Development (HCD) to allocate the regional need for housing to the regional Council of Governments (COG) (or a HCD for cities and counties not covered by a COG) for incorporation into housing element updates. Before the housing element is due, the HCD determines the total regional housing need for the next planning period for each region in the state and allocates that need. The COGs then allocate to each local jurisdiction its fair share of the RHNA, broken down by income categories very low, low, moderate and above moderate over the housing element s planning period. The City of Santa Clarita and the County last updated their housing elements in 2008, and it covers the planning period These elements incorporate the formally transmitted Los Angeles County housing allocation that was incorporated into the RHNA approved by the SCAG Regional Council on October 4, 2012 (SCAG 2013). The allocation for very low and low income classes as defined by the California Health and Safety Code were the following for the City of Santa Clarita: Very Low 9.98% Low 6.75% Neither the SCAG RHNA nor the City of Santa Clarita and County housing elements further classify the allocation of low income households into single-family and multi-family residential housing units. For this reason, it is not possible to project water use for lower income households by this specific land use category. However, to remain consistent with the intent and requirements of the UWMP Act, the water use projections for very low and low residential income households based on the income category were identified and their classification percentage was applied to the purveyors demand projections with the plumbing code and Active Conservation as shown in Table 2-29 below. Neither the City of Santa Clarita nor the County will deny or condition approval of water services, or reduce the amount of services applied for by any proposed development unless one of the following occurs: City of Santa Clarita and/or the County specifically find that it does not have sufficient water supply. City of Santa Clarita and/or the County is subject to a compliance order issued by the State Division of Drinking Water (DDW) that prohibits new water connections. The applicant has failed to agree to reasonable terms and conditions relating to the provision of services. Santa Clarita Valley Urban Water Management Plan Page 2-30
222 2015 Santa Clarita Valley Urban Water Management Plan TABLE 2-29 LOWER INCOME DEMANDS (AF) (a)(b) LACWWD 36 Demand w/ Plumbing Code Savings and Active Conservation (c) 2,300 2,700 3,100 3,500 3,900 4,300 4,700 Very Low (d) Low (e) Subtotal NCWD Demand w/ Plumbing Code Savings and Active Conservation (c) 10,100 10,700 11,200 11,800 12,600 13,400 14,200 Very Low (d) 1,008 1,068 1,118 1,178 1,257 1,337 1,417 Low (e) Subtotal 1,690 1,790 1,874 1,974 2,108 2,242 2,376 SCWD Demand w/ Plumbing Code Savings and Active Conservation (c) 28,400 29,100 29,900 30,800 32,400 33,900 36,000 Very Low (d) 2,834 2,904 2,984 3,074 3,234 3,383 3,593 Low (e) 1,917 1,964 2,018 2,079 2,187 2,288 2,430 Subtotal 4,751 4,868 5,002 5,153 5,421 5,671 6,023 VWC Demand w/ Plumbing Code Savings and Active Conservation (c) 28,100 32,100 36,600 40,000 39,600 39,300 39,000 Very Low (d) 2,804 3,204 3,653 3,992 3,952 3,922 3,892 Low (e) 1,897 2,167 2,471 2,700 2,673 2,653 2,633 Subtotal 4,701 5,370 6,123 6,692 6,625 6,575 6,525 Total 11,527 12,481 13,518 14,405 14,806 15,208 15,709 Notes: (a) Demands already included within purveyor projections. (b) 2012 Adopted SCAG RHNA; allocation for very low income (9.98%) and low income (6.75%). (c) From Table (d) 9.98% of total purveyor Demand w/ Plumbing Code Savings and Active Conservation. (e) 6.75% of total purveyor Demand w/ Plumbing Code Savings and Active Conservation. Santa Clarita Valley Urban Water Management Plan Page 2-31
223 2015 Santa Clarita Valley Urban Water Management Plan 2.8 Other Factors Affecting Water Usage A major factor that affects water usage is weather. Historically, when the weather is hot and dry, water usage increases. The amount of increase varies according to the number of consecutive years of hot, dry weather and the conservation activities imposed. During cool, wet years, historical water usage has decreased, reflecting less water usage for exterior landscaping. This factor is discussed below in detail Weather Effects on Water Usage Figure 2-2 shows the purveyors overall water use since 2000 as well as total precipitation occurring over the same time period. Past studies have indicated that during dry years within the Santa Clarita Valley, demands can increase from between five to ten percent. This Plan assumes a conservative ten percent increase in per capita demands during dry periods. Figure 2-3 shows the purveyors annual average monthly water use since In the Santa Clarita Valley, the largest amount of water use occurs during the end of summer and in the beginning of fall months (July, August and September). Water is used least in the cooler months leading into spring (February, March). This variation gives some indication about how weather affects water demands in the CLWA service area Conservation Effects on Water Usage In recent years, water conservation has become an increasingly important factor in water supply planning and management in California. Over the past ten years there have been a number of regulatory changes related to conservation including new standards for plumbing fixtures, a new landscape ordinance, a state universal retrofit ordinance, new Green Building standards, mandatory demand reduction goals and more. The California plumbing code has also instituted requirements for new construction that mandate the installation of ultra-low-flow toilets and lowflow showerheads. During the 1987 to 1992 drought period, overall demands due to the effects of hot, dry weather were projected to increase by approximately ten percent. As a result of extraordinary conservation measures enacted during the period, the overall water demand actually decreased by more than ten percent. During the current drought, Governor Brown issued a January 2014 drought proclamation and April 2014 emergency declaration, calling on urban water suppliers to implement their local water shortage contingency plans. In April 2015, following the lowest snowpack ever recorded, Governor Brown directed the SWRCB to implement mandatory water reductions to reduce water usage by 25 percent. In May 2015, the SWRCB adopted an emergency regulation requiring an immediate 25 percent reduction in overall potable urban water use. (See SWRCB Resolution No ) The SWRCB began to track water conservation for each of the state s larger urban retail water suppliers (those with more than 3,000 connections) on a monthly basis; compliance with Santa Clarita Valley Urban Water Management Plan Page 2-32
224 2015 Santa Clarita Valley Urban Water Management Plan individual water supplier conservation requirements and the statewide 25 percent mandate is based on cumulative savings. Cumulative tracking means that conservation savings will be added together from one month to the next and compared to the amount of water used during the same months in The three retail purveyors have been complying with these regulations and through increased conservation and outreach programs have seen significant reductions in demand as a result. In February 2016, the SWRCB approved an updated and extended emergency regulation that will continue mandatory reductions through October 2016, unless revised before then. The extended regulation provides more flexibility to urban water suppliers in meeting their conservation requirements and provides credits for certain factors that affect water use such as hotter-than-average climates, population growth, and significant investments in new local drought resilient water sources such as recycled water. Residential, commercial, and industrial usage can be expected to decrease as a result of the implementation of more aggressive water conservation practices. In southern California, the greatest opportunity for conservation is in developing greater efficiency and reduction in landscape irrigation. The irrigation demand can typically represent as much as seventy percent of the water demand for residential customers depending on lot size and amount of irrigated turf and plants. Conservation efforts will increasingly target this component of water demand. Santa Clarita Valley Urban Water Management Plan Page 2-33

225 2015 Santa Clarita Valley Urban Water Management Plan FIGURE 2-2 HISTORICAL WATER USE AND PRECIPITATION Source: Precipitation data from the rain gage at Newhall Fire Station No. 73. Total water use from Table 2-1. Santa Clarita Valley Urban Water Management Plan Page 2-34

226 2015 Santa Clarita Valley Urban Water Management Plan FIGURE 2-3 SCV AVERAGE MONTHLY MUNICIPAL WATER USE Source: Purveyor Records Santa Clarita Valley Urban Water Management Plan Page 2-35
227 2015 Santa Clarita Valley Urban Water Management Plan Section 3: Water Resources 3.1 Overview This section describes the water resources available to CLWA and the purveyors through 2050 for the next thirty-five (35) years. The suppliers existing water resources include wholesale (imported) supplies, local groundwater, recycled water and water from existing groundwater banking programs. Planned supplies include new groundwater production as well as additional banking programs. These existing and planned supplies are summarized in Table 3-1 and discussed in more detail in this Section. The distribution of water supplies presented in this Plan does not represent an allocation of water rights among the retail water purveyors. Local and imported water resources in the Santa Clarita Valley are managed cooperatively between CLWA and the purveyors. Just as the demands on the sources of supply were identified on an individual purveyor basis in Section 2, the existing and planned sources of supply have also been broken down by source on an individual purveyor basis. These tables have been included in Appendix C. Santa Clarita Valley Urban Water Management Plan Page 3-1
228 2015 Santa Clarita Valley Urban Water Management Plan TABLE 3-1 SUMMARY OF CURRENT AND PLANNED WATER SUPPLIES AND BANKING PROGRAMS (AF) (a) Existing Supplies Existing Groundwater (b) Alluvial Aquifer 24,100 24,100 24,100 24,100 24,100 24,100 24,100 24,100 Saugus Formation 7,445 7,445 7,445 7,445 7,445 7,445 7,445 7,445 Total Groundwater 31,545 31,545 31,545 31,545 31,545 31,545 31,545 31,545 Recycled Water (c) Total Recycled Imported Water State Water Project (d) 59,000 58,800 58,500 58,300 58,100 58,100 58,100 58,100 Flexible Storage Accounts (e) 6,060 6,060 6,060 4,680 4,680 4,680 4,680 4,680 Buena Vista-Rosedale 11,000 11,000 11,000 11,000 11,000 11,000 11,000 11,000 Nickel Water - Newhall Land (f) 1,607 1,607 1,607 1,607 1,607 1,607 1,607 1,607 Yuba Accord Water (g) 1,000 1,000 1, Total Imported 78,667 78,467 78,167 75,587 75,387 75,387 75,387 75,387 Existing Banking and Exchange Programs Rosedale Rio-Bravo Bank (h) 3,000 3,000 3,000 3,000 3,000 3,000 3,000 3,000 Semitropic Bank (h) 5,000 5,000 5,000 5,000 5,000 5,000 5,000 - Semitropic Newhall Land (h)(i) Bank 4,950 4,950 4,950 4,950 4,950 4,950 4,950 4,950 Rosedale Rio-Bravo Exchange (j) 9,500 9, West Kern Exchange (j) Total Bank/Exchange 22,950 22,950 12,950 12,950 12,950 12,950 12,950 7,950 Total Existing Supplies 134, , , , , , , ,332 Planned Supplies Future Groundwater (k) Alluvial Aquifer (l) - 2,000 4,000 5,000 7,000 7,000 7,000 7,000 Saugus Formation (Restored) (m) - 3,230 3,230 3,230 3,230 3,230 3,230 3,230 Saugus Formation (New) (n) Total Groundwater - 5,230 7,230 8,230 10,230 10,230 10,230 10,230 Recycled Water (o) Total Recycled ,156 7,627 9,604 9,604 9,604 9,604 Planned Banking Programs Rosedale Rio-Bravo Bank (p) - 7,000 7,000 17,000 17,000 17,000 17,000 17,000 Additional Bank (q) ,000 Total Banking - 7,000 7,000 17,000 17,000 17,000 17,000 22,000 Total Planned Supplies - 12,795 19,386 32,857 36,834 36,834 36,834 41,834 Santa Clarita Valley Urban Water Management Plan Page 3-2
229 2015 Santa Clarita Valley Urban Water Management Plan Notes: (a) The values shown under "Existing Supplies" and "Planned Supplies" are projected to be available in average/normal years to CLWA and the retail water purveyors. The values shown under "Existing Banking and Exchange Programs" and "Planned Banking Programs" are the maximum capacity of program withdrawals, and would typically be used only during dry years. (b) Existing groundwater supplies represent the quantity of groundwater anticipated to be pumped with existing wells. As indicated in Tables 3-8 and 3-9, and in Tables 3-4 and 3-5 of the 2009 Groundwater Basin Yield Analysis, individual purveyors may have well capacity in excess of quantities shown in this table. As indicated in Table 3-10, existing and planned groundwater pumping remain within the groundwater operating plan shown on Table 3-5. (c) Existing recycled water is actual use in CLWA currently has 1,600 AFY under contract. (d) SWP supplies are based on average deliveries from DWR s 2015 DCR. (e) Includes both CLWA and Ventura County entities flexible storage accounts. Extended term of agreement with Ventura County entities expires after (f) Existing Newhall Land supply committed under approved Newhall Ranch Specific Plan. Assumed to be transferred to CLWA or VWC during Newhall Ranch development, and available for annual purchase prior to that. (g) Supply shown is amount available in dry periods, after delivery losses. This supply would typically be used only during dry years and is available through (h) Supplies shown are annual amounts that can be withdrawn using existing firm withdrawal capacity and would typically be used only during dry years. (i) Existing Newhall Land supply. Assumed to be transferred to CLWA or VWC during Newhall Ranch development, with firm withdrawal capacity made available to CLWA prior to that. (j) Supplies shown are totals recoverable under the exchange and would typically be recovered only during dry years. (k) Planned groundwater supplies represent new groundwater well capacity that may be required by an individual purveyor s production objectives in the Alluvial Aquifer and the Saugus Formation. When combined with existing purveyor and non-purveyor groundwater supplies, total groundwater production remains within the sustainable ranges identified in Table 3-8 of 2009 Groundwater Basin Yield Analysis. As indicated in Table 3-10, existing and planned groundwater pumping remain within the basin operating plan shown on Table 3-5. (l) Represents a shift in current agricultural pumping by Newhall Land and Farming to VWC due to the development of Newhall Ranch. (m) VWC Well 201 is planned to be returned to service by 2017 with treatment under a permit from the DDW. (n) Up to four new and replacement wells are planned to provide additional dry-year supply and would typically be used only during dry years. (o) Planned recycled water is total projected recycled water demand from Table 4-3 less existing use.. Recycled water demand projection is based on implementation of complete build-out system described in the RWMP Update and reflects demands that can cost-effectively be served. Refer to Section 4, including Section 4.4, for further discussion and information regarding factors having the potential to affect the reliability of recycled water supplies. (p) Firm withdrawal capacity under existing Rosedale Rio-Bravo Banking Program to be expanded by 7,000 AFY by 2017 (for a combined total of 10,000 AFY) and an additional 10,000 AFY by (q) Additional banking program with firm withdrawal capacity of 5,000 AFY by Santa Clarita Valley Urban Water Management Plan Page 3-3
230 2015 Santa Clarita Valley Urban Water Management Plan The term "dry" is used throughout this section and in subsequent sections concerning water resources and reliability as a measure of supply availability. As used in this Plan, dry years are those years when supplies are the lowest and demands are the highest, which occurs primarily when precipitation is lower than the long-term average precipitation. The impact of low precipitation in a given year on a particular source of supply may differ based on how low the precipitation is, or whether the year follows a high-precipitation year or another low-precipitation year. For the State Water Project (SWP), a low-precipitation year may or may not affect supplies, depending on how much water is in SWP storage at the beginning of the year. Also, dry conditions can differ geographically. For example, a dry year can be local to the Valley area (thereby affecting local groundwater replenishment and production), local to northern California (thereby affecting SWP water deliveries), or statewide (thereby affecting both local groundwater and the SWP). When the term "dry" is used in this Plan, statewide drought conditions are assumed, affecting both local groundwater and SWP supplies at the same time. 3.2 Wholesale (Imported) Water Supplies CLWA s imported water supplies consist primarily of SWP supplies, which were first delivered to CLWA in From the SWP, CLWA also has access to water from Flexible Storage Accounts in Castaic Lake, which are planned for dry-year use, but are not strictly limited as such. More detail on SWP supplies is provided in Section In addition to its SWP supplies, CLWA has an imported surface supply from the Buena Vista Water Storage District (BVWSD) and Rosedale Rio-Bravo Water Storage District (RRBWSD) in Kern County, which was first delivered to CLWA in More information on this supply is provided in Section CLWA wholesales both these imported supplies to each of the retail purveyors. Additionally, Newhall Land has acquired a water transfer supply from a source in Kern County. This supply, referred to as Nickel Water, is assumed to be available to VWC through CLWA. More information on this supply is provided in Section below State Water Project Supplies Background SWP Facilities The SWP is the largest state-built, multi-purpose water project in the country. It was authorized by the California State Legislature in 1959, with the construction of most initial facilities completed by Today, the SWP includes 28 dams and reservoirs, 26 pumping and generating plants and approximately 660 miles of aqueducts. The primary water source for the SWP is the Feather River, a tributary of the Sacramento River. Storage released from Oroville Dam on the Feather River flows down natural river channels to the Sacramento-San Joaquin River Delta (Delta). While some SWP supplies are pumped from the northern Delta into the North Bay Aqueduct, the vast majority of SWP supplies are pumped from the southern Delta into the 444-mile-long California Aqueduct. The California Aqueduct conveys water along the west side of the San Joaquin Valley to Edmonston Pumping Plant, where water is pumped over the Tehachapi Mountains and the aqueduct then divides into the East and West Branches. CLWA takes delivery of its SWP water at Castaic Lake, a terminal reservoir of the West Branch. Santa Clarita Valley Urban Water Management Plan Page 3-4
231 2015 Santa Clarita Valley Urban Water Management Plan From Castaic Lake, CLWA delivers its SWP supplies to the local retail water purveyors through an extensive transmission pipeline system SWP Water Supply Contracts DWR provides water supply from the SWP to 29 urban and agricultural public water supply agencies located throughout northern, central and southern California, in exchange for payment by these agencies of all costs associated with providing that supply. In the early 1960s, DWR and each of these agencies entered into substantially uniform long-term SWP water supply contracts (SWP Contracts) that spelled out the water service and payment terms. CLWA is one of the 29 water agencies (commonly referred to as contractors ) that have an SWP Contract with DWR. SWP Contract Term The SWP Contracts entered into in the 1960s had initial 75-year terms, which thus would begin to expire in While the SWP Contracts provide for continued water service to the contractors beyond the initial term, efforts are currently underway to extend the SWP Contracts to improve financing for the SWP. The majority of the capital costs associated with the development and maintenance of the SWP is financed using revenue bonds, historically sold with 30-year terms. It has become more challenging in recent years to affordably finance capital expenditures for the SWP because bonds used to finance these expenditures are limited to terms that only extend to the year 2035, less than 30 years from now. To ensure continued affordability of debt service to contractors, it is necessary to extend the term of the SWP Contracts, which will allow DWR to continue to sell bonds with 30-year terms. Negotiations on extending the SWP Contracts took place between DWR and the contractors during 2013 and 2014, and were open to the public. The following terms were agreed to and are currently the subject of analysis under the requirements of the California Environmental Quality Act (CEQA) (Notice of Preparation dated September 12, 2014): Extend the term of the 29 SWP Contracts to December 31, Provide for increased SWP financial operating reserves during the extended term of the SWP Contracts. Provide additional funding mechanisms and accounts to address SWP needs and purposes. Develop a revised payment methodology with a corresponding billing system that better matches the timing of future SWP revenues to future expenditures. It is anticipated that the term of the SWP Contracts will be extended to December 31, The Contracts and associated amendments are scheduled to be finalized summer To improve Santa Clarita Valley Urban Water Management Plan Page 3-5
232 2015 Santa Clarita Valley Urban Water Management Plan coordination between supply and demand projections beyond the year 2035, the data and information contained in this UWMP reflect that assumption, as provided in the Urban Water Management Planning Act. (CWC Section 10631(b).) SWP Water Supplies Each SWP contractor s SWP Contract contains a Table A, which lists the maximum amount of contract water supply, or Table A water, an agency may request each year throughout the life of the contract. The Table A Amounts in each contractor s SWP Contract ramped up over time, based on projections at the time the contracts were signed of future increases in population and water demand, until they reached a maximum Table A Amount. Most contractor s Table A Amounts reached their maximum levels in the early to mid-1990s. Table A Amounts are used in determining each contractor s proportionate share, or allocation, of the total SWP water supply DWR determines to be available each year. The total planned annual delivery capability of the SWP and the sum of all contractors maximum Table A Amounts was originally 4.23 million acre-feet (MAF). The initial SWP storage facilities were designed to meet contractors water demands in the early years of the SWP, with the construction of additional storage facilities planned as demands increased. However, essentially no additional SWP storage facilities have been constructed since the early 1970s. SWP conveyance facilities were generally designed and have been constructed to deliver maximum Table A amounts to all contractors. After the permanent retirement of some Table A amount by two agricultural contractors in 1996, the maximum Table A Amounts of all SWP contractors now totals about 4.17 MAF. Currently, CLWA s annual Table A Amount is 95,200 AF 8. The primary supply of SWP water made available under the SWP Contracts is allocated Table A supply. An estimation of Table A supply availability is provided in Section In addition to Table A supplies, the SWP Contracts provide for additional types of water that may periodically be available, including Article 21 water and Turnback Pool water. Article 21 water (which refers to the SWP Contract provision defining this supply) is water that may be made available by DWR when excess flows are available in the Delta (i.e., when Delta outflow requirements have been met, SWP storage south of the Delta is full and conveyance capacity is available beyond that being used for SWP operations and delivery of allocated and scheduled Table A supplies). Article 21 water is made available on an unscheduled and interruptible basis and is typically available only in average to wet years, generally only for a limited time in the late winter. The Turnback Pool is a program through which contractors with allocated Table A supplies in excess of their needs in a given year may turn back that excess supply for purchase by other contractors who need additional supplies that year. The Turnback Pool can make water available in all types of hydrologic years, although generally less excess water is 8 CLWA s original SWP Contract with DWR was amended in 1966 for a maximum annual Table A Amount of 41,500 AF. In 1991, CLWA purchased 12,700 AF of annual Table A Amount from a Kern County water district, and in 1999 purchased an additional 41,000 AF of annual Table A Amount from another Kern County water district, for a current total annual Table A Amount of 95,200 AF. Santa Clarita Valley Urban Water Management Plan Page 3-6
233 2015 Santa Clarita Valley Urban Water Management Plan turned back in dry years. As urban contractor demands have increased, the amount of water turned back and available for purchase has diminished. The availability of Article 21 water and Turnback Pool water is uncertain. When available, these supplies provide additional water that CLWA may be able to use, either directly to meet demands or for later use after storage in its groundwater banking programs. Due to the uncertainty in availability of Article 21 water and Turnback Pool water, supplies of these types of SWP water are not included in this report. However, to the extent CLWA is able to make use of these supplies when available, CLWA may be able to improve the reliability of its SWP supplies beyond the values used throughout this Plan. While not specifically provided for in the SWP Contracts, DWR has in critically dry years created Dry Year Water Purchase Programs for contractors needing additional supplies. Through these programs, water is purchased by DWR from willing sellers in areas that have available supplies and is then sold by DWR to contractors willing to purchase those supplies. The availability of these supplies is uncertain, and are therefore not included in this report. However, CLWA s access to these supplies when they are available would enable it to improve the reliability of its dry-year supplies beyond the values used throughout this report. Flexible Storage Account As part of its SWP Contract with DWR, CLWA has access to a portion of the storage capacity of Castaic Lake. This Flexible Storage Account allows CLWA to utilize up to 4,684 AF of the storage in Castaic Lake. Any of this amount that CLWA borrows must be replaced by CLWA within five years of its withdrawal. CLWA manages this storage by keeping the account full in normal and wet years and then delivering that stored amount (or a portion of it) during dry periods. The account is refilled during the next year that adequate SWP supplies are available to CLWA to do so. In 2005 and again in 2015, CLWA negotiated with Ventura County SWP contractor agencies to obtain the use of their Flexible Storage Account. This allows CLWA access to another 1,376 AF of storage in Castaic Lake. With the extension to the term of the agreement, CLWA access to this additional storage is available on a year-to-year basis through While it is expected that CLWA and Ventura County will extend the existing flexible storage agreement beyond the 2025 term, it is not assumed to be available beyond 2025 in this Plan. Water Management Provisions The SWP Contract includes a number of provisions that give each contractor flexibility in managing the supplies that are available to it in a given year. For example, a contractor may take delivery of its allocated SWP supplies for direct use or storage within its service area, store that water outside its service area for later withdrawal and use within its service area, carry over a portion of that supply for storage on an as-available-basis in SWP reservoirs for delivery in following years (commonly referred to as carryover ), or exchange a portion of that supply with others for return in a future year. The SWP Contract also provides for DWR to deliver non-swp water supplies for contractors through SWP conveyance facilities. Santa Clarita Valley Urban Water Management Plan Page 3-7
234 2015 Santa Clarita Valley Urban Water Management Plan CLWA takes advantage of these water management provisions in wetter years by storing, either in groundwater banking programs or as carryover, or by exchanging supplies with another contractor or water agency, those allocated SWP supplies that are in excess of its needs. Then in drier years, CLWA withdraws its previously stored supplies or recovers water from its exchange partner(s). Water stored in groundwater banking programs has the benefit of remaining available until needed, and the water CLWA currently has in storage is assumed to be available as described in this Plan. At current demand levels, CLWA also regularly stores a portion of any excess supply as carryover in SWP reservoirs, which can provide it with additional supply for use in following years. Carryover is a no-added-cost storage option, is an easily and quickly accessible supply, and is a valuable benefit if the next year is dry. However, CLWA carryover water may be lost when SWP reservoirs fill, which can occur in wetter years. Because of the variability in how frequently SWP reservoir space would be available to store CLWA s carryover, it is not specifically included in the supply projections of this Plan. CLWA s participation in several groundwater banking and water exchange programs is discussed in Sections 3.5 and CLWA also takes advantage of the provision for transport of non-swp water supplies for delivery of all its other imported supplies, which are discussed in Section Factors Affecting SWP Table A Supplies While Table A identifies the maximum annual amount of Table A water a SWP contractor may request, the amount of SWP water actually available and allocated to SWP contractors each year is dependent on a number of factors and can vary significantly from year to year. The primary factors affecting SWP supply availability include: the availability of water at the source of supply in northern California, the ability to transport that water from the source to the primary SWP diversion point in the southern Delta and the magnitude of total contractor demand for that water. Availability of SWP Source Water SWP supplies originate in northern California, primarily from the Feather River watershed. The availability of these supplies is dependent on the amount of precipitation in the watershed, the amount of that precipitation that runs off into the Feather River, water use by others in the watershed and the amount of water in storage in the SWP s Lake Oroville at the beginning of the year. Variability in the location, timing, amount and form (rain or snow) of precipitation, as well as how wet or dry the previous year was, produces variability from year to year in the amount of water that flows into Lake Oroville. However, Lake Oroville acts to regulate some of that variability, storing high inflows in wetter years that can be used to supplement supplies in dry years with lower inflows. As discussed in Section 1.7 and in DWR s 2015 State Water Project Delivery Capability Report (2015 DCR), climate change adds another layer of uncertainty in estimating the future availability of SWP source water. Current literature suggests that global warming may change precipitation patterns in California from the patterns that occurred historically. While different climate change models show differing effects, potential changes could include more Santa Clarita Valley Urban Water Management Plan Page 3-8
235 2015 Santa Clarita Valley Urban Water Management Plan precipitation falling in the form of rain rather than snow and earlier snowmelt, which would result in more runoff occurring in the winter rather than spread out over the winter and spring. Ability to Convey SWP Source Water As discussed previously, water released from Lake Oroville flows down natural river channels into the Delta. The Delta is a network of channels and reclaimed islands at the confluence of the Sacramento and San Joaquin rivers. The SWP and the federal Central Valley Project (CVP) use Delta channels to convey water to the southern Delta for diversion, making the Delta a focal point for water distribution throughout the state. A number of issues affecting the Delta can impact the ability to divert water supplies from the Delta, including water quality, fishery protection and levee system integrity. Water quality in the Delta can be adversely affected by both SWP and CVP diversions, which primarily affect salinity, as well as by urban discharge and agricultural runoff that flows into the Delta, which can increase concentrations of constituents such as mercury, organic carbon, selenium, pesticides, toxic pollutants and reduce dissolved oxygen. The Delta also provides a unique estuarine habitat for many resident and migratory fish species, some of which are listed as threatened or endangered. The decline in some fish populations is likely the result of a number of factors, including water diversions, habitat destruction, degraded water quality and the introduction of non-native species. Delta islands are protected from flooding by an extensive levee system. Levee failure and subsequent island flooding can lead to increased salinity requiring the temporary shutdown of SWP pumps. In order to address some of these issues, SWP and CVP operations in the Delta are limited by a number of regulatory and operational constraints. These constraints are primarily incorporated into the SWRCB Water Rights Decision 1641 (D-1641), which establishes Delta water quality standards and outflow requirements that the SWP and CVP must comply with. In addition, SWP and CVP operations are further constrained by requirements included in Biological Opinions (BOs) for the protection of threatened and endangered fish species in the Delta, issued by the United States Fish and Wildlife Service (FWS) in December 2008 and the National Marine Fishery Service (NMFS) in June The requirements in the BOs are based on real-time physical and biological phenomena (such as turbidity, water temperature and location of fish), which results in uncertainty in estimating potential impacts on supply of the additional constraints imposed by the BOs. Demand for SWP Water The reliability of SWP supplies is affected by the total amount of water requested and used by SWP contractors, since an increase in total requests increases the competition for limited SWP supplies. As previously mentioned, contractor Table A Amounts in the SWP Contracts ramped up over time, based on projected increases in population and water demand at the time the contracts were signed. Urban SWP contractors requests for SWP water were low in the early years of the SWP, but have increased steadily over time, although more slowly than the rampup in their Table A Amounts, which reached a maximum for most contractors in the early to mid- 1990s. Since that time, urban contractors requests for SWP water have continued to increase Santa Clarita Valley Urban Water Management Plan Page 3-9
236 2015 Santa Clarita Valley Urban Water Management Plan until recent years when nearly all SWP contractors are requesting their maximum Table A Amounts. Consistent with other urban SWP contractors, SWP deliveries to CLWA have increased as its requests for SWP water have increased. Historical total SWP deliveries to CLWA are shown at the end of this Section 3.2 in Table 3-3. The table shows deliveries to the CLWA service area for supply to the purveyors, as well as delivery of CLWA water to storage programs outside the service area and to exchange partners. SWP demand projections provided by CLWA to DWR are shown at the end of this Section 3.2 in Table 3-4. CLWA demand projections provided to DWR are typically conservative in order to maximize water deliveries available to CLWA in any given year for both deliveries to purveyors and to current and future storage programs SWP Table A Supply Assessment DWR prepares a biennial report to assist SWP contractors and local planners in assessing the near and long-term availability of supplies from the SWP. DWR issued its most recent update, the 2015 DWR State Water Project Delivery Capability Report (2015 DCR), in July In the 2015 DCR, DWR provides SWP supply estimates for SWP contractors to use in their planning efforts, including for use in their 2015 UWMPs. The 2015 DCR includes DWR s estimates of SWP water supply availability under both current (2015) and future (2035) conditions Analysis Assumptions DWR s estimates of SWP deliveries are based on a computer model that simulates monthly operations of the SWP and CVP systems. Key assumptions and inputs to the model include the facilities included in the system, hydrologic inflows to the system, regulatory and operational constraints on system operations, and projected contractor demands for SWP water. In the 2015 DCR, DWR uses the following assumptions to model current conditions: existing facilities; hydrologic inflows to the model based on 82 years of historical inflows (1922 through 2003), adjusted to reflect current levels of development in the supply source areas; current regulatory and operational constraints, including D-1641, the 2008 FWS BO, and the 2009 NMFS BO; and contractor demands for SWP water at maximum Table A Amounts. To evaluate SWP supply availability under future conditions, the 2015 DCR included four model studies. The first of the future-conditions studies, the Early Long Term (ELT) scenario, used all of the same model assumptions for current conditions, but reflected changes expected to occur from climate change, specifically, a 2025 emission level and a 15 cm sea level rise. The other three future-conditions studies also include varying model assumptions related to the Bay Delta Conservation Plan (BDCP)/California Water Fix (Cal WaterFix), such as changes to facilities and/or regulatory and operational constraints. BDCP/Cal WaterFix plans are currently in flux, environmental review is ongoing, and several regulatory and legal requirements must be met prior to any construction. (See Section for further discussion of BDCP/Cal WaterFix.) Santa Clarita Valley Urban Water Management Plan Page 3-10
237 2015 Santa Clarita Valley Urban Water Management Plan This UWMP uses the ELT scenario to estimate future SWP supply availability because it is based on existing facilities and regulatory constraints, with hydrology adjusted for the expected effects of climate change. This scenario is consistent with the studies DWR has used in its previous SWP Delivery Reliability Reports for supply availability under future conditions. Therefore, in this UWMP, future SWP supply availability is based on the ELT study included in the 2015 DCR Analysis Results In the 2015 DCR, DWR estimates that for all contractors combined, the SWP can deliver on a long-term average basis a total Table A supply of 62 percent of total maximum Table A Amounts under current conditions and 61 percent under future conditions. In the worst-case single critically dry year, DWR estimates the SWP can deliver a total Table A supply of 11 percent of total maximum Table A Amounts under current conditions and 8 percent under future conditions. DWR estimates the SWP can deliver a total Table A supply during a four-year dry period averaging 33 percent of total maximum Table A Amounts under current and future conditions, and during a three-year dry period averaging 21 percent under current conditions and 20 percent under future conditions. DWR s analysis of current (2015) conditions is used in this Plan to estimate 2015 SWP supplies and its analysis of future (2035) conditions is used to estimate SWP supplies. As has been suggested by DWR, SWP supplies for the five-year increments between 2015 and 2035 are interpolated between these values. SWP supplies for years beyond 2035 are assumed to be the same as for The extremely dry sequence from the beginning of January 2013 through the end of 2015 was one of the driest two-year periods in the historical record. Water year 2013 was a year with two hydrologic extremes. 9 October through December 2012 was one of the wettest fall periods on record, but was followed by the driest consecutive 12 months on record. Accordingly, the 2013 SWP supply allocation was a low 35 percent of SWP Table A Amounts. The 2013 hydrology ended up being even drier than DWR s conservative hydrologic forecast, so the SWP began 2014 with reservoir storage lower than targeted levels and less stored water available for 2014 supplies. Compounding this low storage situation, 2014 also was an extremely dry year, with runoff for water year 2014 the fourth driest on record. Due to extraordinarily dry conditions in 2013 and 2014, the 2014 SWP water supply allocation was a historically low 5 percent of Table A Amounts. The dry hydrologic conditions that led to the low 2014 SWP water supply allocation were extremely unusual, and to date this hydrology has not been included in the SWP delivery estimates presented in DWR s 2015 DCR. It is anticipated that the hydrologic record used in the DWR model will be extended to include the period through 2014 during the next update of the model, which is expected to be completed prior to issuance of the next update to the biennial DCR. For the reasons stated above, this UWMP uses a conservative assumption that a 5 percent allocation of SWP Table A Amounts represents the worst case scenario. 9 A water year begins in October and runs through September. For example, water year 2013 is October 2012 through September Santa Clarita Valley Urban Water Management Plan Page 3-11
238 2015 Santa Clarita Valley Urban Water Management Plan Table 3-2 shows SWP supplies projected to be available to CLWA in average/normal years (based on the average delivery over a repeat of the study s historic hydrologic period from 1922 through 2003). Table 3-2 also summarizes estimated SWP supply availability in a single dry year (based on a repeat of the historic hydrologic conditions of 1977, as well as the worst-case actual allocation of 2014) and over two multiple dry year periods (based on a repeat of the historic four-year drought of 1931 through 1934, and three-year drought of 1990 through 1992). Santa Clarita Valley Urban Water Management Plan Page 3-12
239 2015 Santa Clarita Valley Urban Water Management Plan TABLE 3-2 SWP TABLE A SUPPLY RELIABILITY (AF) (a)(b) Wholesaler (Supply Source) Average Water Year (c) DWR (SWP) Table A Supply 59,000 58,800 58,500 58,300 58,100 % of Table A Amount (d) 62% 62% 61% 61% 61% Single-Dry Year DWR (SWP) Table A Supply (e) 10,500 9,800 9,000 8,300 7,600 % of Table A Amount (d) 11% 10% 9% 9% 8% Table A Supply (f) 4,800 4,800 4,800 4,800 4,800 % of Table A Amount (d) 5% 5% 5% 5% 5% Multiple-Dry Year DWR (SWP) Four-Year Period (g) Table A Supply 31,400 31,400 31,400 31,400 31,400 % of Table A Amount (d) 33% 33% 33% 33% 33% Three-Year Period (h) Table A Supply 20,000 19,800 19,500 19,300 19,000 % of Table A Amount (d) 21% 21% 20% 20% 20% Notes: (a) Supplies to CLWA are based on DWR analyses presented in its 2015 DCR, assuming existing SWP facilities and current regulatory and operational constraints (except as otherwise indicated in Note f). (b) Table A supplies include supplies allocated in one year that are carried over for delivery the following year. (c) Based on average deliveries over a repeat of the study s historic hydrologic period of 1922 through (d) Supply as a percentage of CLWA s Table A Amount of 95,200 AF. (e) Based on a repeat of the worst case historic single dry year of 1977 (from 2015 DCR). (f) Based on the worst-case actual allocation of (g) Supplies shown are annual averages over four consecutive dry years, based on a repeat of the historic fouryear dry period of (h) Supplies shown are annual averages over three consecutive dry years, based on a repeat of the historic three-year dry period of Potential Future SWP Supplies An ongoing planning effort to increase long-term supply reliability for both the SWP and CVP is taking place through the BDCP process. The co-equal goals of the BDCP are to improve water supply reliability and restore the Delta ecosystem. The BDCP is being prepared through a collaboration of state, federal and local water agencies, state and federal fish agencies, environmental organizations and other interested parties. Several isolated conveyance system alternatives are being considered in the plan that would divert water from the north Delta to the south Delta where water is pumped into the south-of-delta stretches of the SWP and CVP. The new conveyance facilities would allow for greater flexibility in balancing the needs of the estuary with the reliability of water supplies. The plan could also provide other benefits, such as reducing the risk of long outages from Delta levee failures. Santa Clarita Valley Urban Water Management Plan Page 3-13
240 2015 Santa Clarita Valley Urban Water Management Plan The BDCP has been in development since 2006 and is currently undergoing extensive environmental review. The Draft BDCP and its associated Draft Environmental Impact Report (EIR)/Environmental Impact Statement (EIS) were released for public review in December In response to public comments, the BDCP was reevaluated, and in April 2015 the lead agencies announced a modified alternative which effectively split the project into two parts: the conveyance portion (known as Cal WaterFix), and the restoration portion (known as EcoRestore). The Cal WaterFix alternative is evaluated in a partially recirculated draft environmental document (Recirculated Draft EIR/Supplemental Draft EIR) that was released for public review in July That environmental document is not anticipated to be final until at least While there is support for the BDCP/Cal WaterFix project, plans are currently in flux and environmental review is ongoing. Additionally, several regulatory and legal requirements must be met prior to any construction. Because of this uncertainty, any improvements in SWP supply reliability or other benefits that could result from this proposed project are not included in this Plan Other Imported Supplies The following supplies are available to CLWA and the purveyors through transfers that have been executed since These supplies are now part of the imported supplies available to the service area Buena Vista-Rosedale Rio Bravo CLWA has executed a long-term transfer agreement for 11,000 AFY with BVWSD and RRBWSD. These two districts, both located in Kern County, joined together to develop a program that provides both a firm water supply and a water banking component. Both districts are member agencies of the Kern County Water Agency (KCWA), a SWP contractor and both districts have contracts with KCWA for SWP Table A Amounts. The supply is based on existing long-standing Kern River water rights held by BVWSD, and is delivered by exchange of the two districts SWP Table A supplies or directly to the California Aqueduct via the Cross Valley Canal. This water supply is firm; that is, the total amount of 11,000 AFY is available in all water year types based on the Kern River water right. CLWA began taking delivery of this supply in 2007 as shown in Table 3-3. CLWA has entered into agreements that reserved 3,000 AF of the Buena Vista-Rosedale Rio Bravo water for potential annexations into its service area. 500 AF is reserved for the second phase of the Tesoro Del Valle development. This development would be served by NCWD and is assumed to occur by ,500 AF is reserved for the planned Legacy Village development. This development would be served by the VWC and is assumed to occur after 2030 but before During the periods before demands for these developments occur, these quantities of water are available to the entire CLWA service area. Should these developments not occur, the water would continue to be available to the entire CLWA service area. If these developments occur but do not use all of the amounts reserved for them in any year or years, the remaining supply would be available to the entire CLWA service area. Santa Clarita Valley Urban Water Management Plan Page 3-14
241 2015 Santa Clarita Valley Urban Water Management Plan Nickel Water - Newhall Land Newhall Land has acquired a water transfer from Kern County sources known as the Nickel water. This source of supply totals 1,607 AFY. The Nickel water comes from a firm source of supply. This source of supply was acquired in anticipation of the development of Newhall Ranch, and is a supply that is contractually committed by Newhall Land under the Newhall Ranch Specific Plan approved by the Los Angeles County Board of Supervisors. Under its acquisition agreement, Newhall Land may assign its rights to this supply to VWC or CLWA, and in the meantime may sell on an annual basis any or all of this supply. In this UWMP it is assumed for planning purposes that Newhall Ranch will be developed at some time in the future and that this water supply will be transferred to VWC or CLWA at the time of development, and that it will then be available as an annual supply to the VWC. Prior to any transfer, it is assumed that CLWA may purchase this supply from Newhall Land, among other alternatives, in a year in which additional supply may be needed Yuba Accord Water In 2008, CLWA entered into the Yuba Accord Agreement, which allows for the purchase of water from the Yuba County Water Agency through DWR to 21 SWP contractors (including CLWA) and the San Luis and Delta-Mendota Water Authority. Yuba Accord water comes from north of the Delta, and the water purchased under this agreement is subject to losses associated with transporting it through the Delta. These losses can vary from year to year, depending on Delta conditions at the time the water is transported. Under the agreement, an estimated average of up to 1,000 AFY of non-swp supply (after losses) is available to CLWA in dry years, through Under certain hydrologic conditions, additional water may be available to CLWA from this program. CLWA received 445 AF from this source in Santa Clarita Valley Urban Water Management Plan Page 3-15
242 2015 Santa Clarita Valley Urban Water Management Plan TABLE 3-3 HISTORICAL IMPORTED SUPPLY DELIVERIES (AF) SWP Deliveries to CLWA Service Area (a) SWP Deliveries to Out-of- Service Area Storage/ Exchange (b) Withdrawals from Out-of- Service Area Storage/ Exchange (b) Other Imported Deliveries to CLWA Service Area (c) Other Imported Deliveries to Out of- Service Area Storage/ Exchange Total Imported Supplies to CLWA Service Area Year , , , , , , , , , , , , , , , , , , , , , , , , , , , , , , , , ,448-1, , ,586 1, , , , , , ,085-2, , ,632 2, , ,080 24, , , , ,463 32, , ,747 20, , ,622 20, , ,919 8,200-11,000-45, , ,000-42, ,096-1,650 11,000-38, ,988 33,024 3,300 11,000-31, ,445 23,796-11,000-31, ,153 18, ,000 36, ,126 28,628-11,000-44, ,673-14,198 11,000-33, ,196 4,339 2,998 10,995-29,189 Sources: DWR Bulletin 132, Management of the California State Water Project; and DWR delivery files. Notes: (a) Includes deliveries of Table A supplies, carryover water, Article 21 water, Turnback Pool water, local supply (from West Branch reservoirs), Yuba Accord water and water purchased through DWR. Santa Clarita Valley Urban Water Management Plan Page 3-16
243 2015 Santa Clarita Valley Urban Water Management Plan (b) Out-of-service area storage includes flexible storage in Castaic Lake, the Semitropic Banking Program and the Rosedale-Rio Bravo Banking Program and deliveries to Devil s Den, and exchange includes the Rosedale-Rio Bravo Exchange and West Kern Exchange. (c) Deliveries from Buena Vista. TABLE 3-4 CLWA DEMAND PROJECTIONS PROVIDED TO WHOLESALE SUPPLIERS (AF) (a) Wholesaler (Supply Source) DWR (SWP) (b) 95,200 95,200 95,200 95,200 95,200 95,200 95,200 95,200 BVWSD/RRBWSD (Kern River) (c) 11,000 11,000 11,000 11,000 11,000 11,000 11,000 11,000 Notes: (a) Nickel Water is excluded from this table because it is not contractually a CLWA supply. It is a Newhall Land supply that would be conveyed by CLWA and made available to VWC. Under Newhall Land s agreement for this fixed water supply, the provider is required to provide the amount contracted for every year. (b) CLWA has provided demand projections to DWR through 2035 based on its maximum Table A Amount and anticipates that its demands beyond 2035 will also be at maximum Table A Amounts. (c) Under the agreement for this fixed water supply, the wholesale provider is required to provide the amount contracted for every year. Therefore, no demand projections are actually provided to BVWSD and RRBWSD. 3.3 Groundwater This section presents information about the purveyors groundwater supplies, including a summary of the adopted groundwater management plan (GWMP). The passage of the Sustainable Groundwater Management Act (SGMA) in 2014 replaces the GWMP with a requirement that a Groundwater Sustainability Plan (GSP) be prepared by 2022 in those basins the DWR has identified as medium to high priority. A summary of the SGMA is presented below and how it may influence the current sustainable use of groundwater resources in the Valley Santa Clara River Groundwater Basin East Subbasin The sole source of local groundwater for urban water supply in the Valley is the groundwater Basin identified in the DWR Bulletin 118, 2003 Update as the Santa Clara River Valley Groundwater Basin, East Subbasin (Basin) (Basin No ). The Basin is comprised of two aquifer systems, the Alluvium and the Saugus Formation. The Alluvium generally underlies the Santa Clara River and its several tributaries, to maximum depths of about 200 feet; and the Saugus Formation underlies practically the entire Upper Santa Clara River area, to depths of at least 2,000 feet. There are also some scattered outcrops of Terrace deposits in the Basin that likely contain limited amounts of groundwater. However, since these deposits are located in limited areas situated at elevations above the regional water table and are also of limited thickness, they are of no practical significance as aquifers for municipal water supply; consequently they have not been developed for any significant water supply in the Basin and are not included as part of the existing or planned groundwater supplies described in this UWMP. Figure 3-1 illustrates the extent of the Santa Clara River Valley East Subbasin in DWR Bulletin 118 (DWR, 2003). The Basin is defined in Bulletin 118 as being bordered on the north by the Piru Mountains, on the west by impervious rocks of the Modelo and Saugus Formations and a constriction in the alluvium, on the south by the Santa Susana Mountains, and on the south and east by the Gabriel Mountains (DWR, 2003). The extent of the basin generally Santa Clarita Valley Urban Water Management Plan Page 3-17
244 2015 Santa Clarita Valley Urban Water Management Plan coincides with the outer extent of the Alluvium and Saugus Formation. The CLWA service area is also shown on Figure Adopted Groundwater Management Plan As part of legislation authorizing CLWA to provide retail water service to individual municipal customers, Assembly Bill (AB) 134 (2001) included a requirement that CLWA prepare a GWMP (provided as Appendix F) in accordance with the provisions of Water Code Section 10753, which was originally enacted by AB This legislation has since been superseded by the passage of SGMA in 2014, however, the existing GWMP will be in effect until a GSP or alternative plan is submitted to DWR by The implementation and compliance with the SGMA is currently being discussed among CLWA, the retail purveyors and other entities in the basin. The general contents of the GWMP were outlined in 2002, and a detailed plan was adopted in 2003 to satisfy the requirements of AB 134. The plan both complements and formalizes a number of existing water supply and water resource planning and management activities in CLWA s service area, which effectively encompasses the East Subbasin of the Santa Clara River Valley Groundwater Basin. Notably, the GWMP also includes a basin-wide monitoring program, the results of which provide input to annual reporting on water supplies and water resources in the Basin, as well as input to assessment of Basin yield for water supply as described herein. Groundwater level data from the existing groundwater monitoring program is reported to DWR as part of SBX7-6 implementation (California Statewide Groundwater Elevation Monitoring [CASGEM]). CLWA and the purveyors have executed an MOU to jointly perform as the monitoring entity for CASGEM for the basin. Available groundwater level data for the CASGEM program is submitted twice a year. CLWA and the water purveyors will continue to provide groundwater level data consistent with the CASGEM program. Santa Clarita Valley Urban Water Management Plan Page 3-18
245 Legend Alluvium Miles Saugus Formation Santa Clara River Valley East Groundwater Subbasin LO LO S S ANG ANG EL EL ES ES C C OUNTY OUNTY VE VE NTUR NTUR A A COUNT COUNT Y Y Castaic Lake Water Agency Boundary SAUGUS FORMATION E Y C A S T A I C V A L L ALLUVIUM S A N F R A N C I S Q U I T O C A N Y O N Santa Clara River BOUQUET CANYON M I N T C A N Y O N Map Location Sources: Esri, DeLorme, HERE, USGS, Intermap, increment P Corp., NRCAN, Esri Japan, METI, Esri China (Hong Kong), Esri (Thailand), TomTom, Copyright: 2014 Esri Path: Y:\Santa Clarita\Water Report\Data\SCV\GIS\2015 UWMP Figures\Figure 3-1 GW Basin.mxd Figure 3-1 Santa Clara River Valley East Subbasin - Alluvium and Saugus Formation 2015 Santa Clarita Valley Urban Water Management Plan
246 2015 Santa Clarita Valley Urban Water Management Plan The GWMP contains four management objectives, or goals, for the Basin including (1) development of an integrated surface water, groundwater and recycled water supply to meet existing and projected demands for municipal, agricultural and other water uses; (2) assessment of groundwater basin conditions to determine a range of operational yield values that use local groundwater conjunctively with supplemental SWP supplies and recycled water to avoid groundwater overdraft; (3) preservation of groundwater quality, including active characterization and resolution of any groundwater contamination problems and (4) preservation of interrelated surface water resources, which includes managing groundwater to not adversely impact surface and groundwater discharges or quality to downstream basin(s). Prior to preparation and adoption of the GWMP, a local Memorandum of Understanding (MOU) process among CLWA, the retail water purveyors and United Water Conservation District (UWCD) in neighboring Ventura County, downstream of the East Subbasin of the Santa Clara River Valley, had produced the beginning of local groundwater management, now embodied in the GWMP. Prepared and implemented in 2001, the MOU was a collaborative and integrated approach to several of the aspects of water resource management included in the GWMP. As a result of the MOU, the cooperating agencies integrated their respective database management efforts and continued to monitor and report on the status of Basin conditions, as well as on geologic and hydrologic aspects of their respective parts of the overall stream-aquifer system. Following adoption of the GWMP, the water suppliers developed and utilized a numerical groundwater flow model for analysis of groundwater basin yield and for analysis of extraction and containment of groundwater contamination. The results of those basin yield and contamination analyses, most recently updated in 2009 by Luhdorff and Scalmanini Consulting Engineers and GSI Water Solutions, Inc. (LSCE & GSI, 2009), are bases for the amounts and allocations of groundwater supplies in this UWMP. The adopted GWMP includes 14 elements intended to accomplish the Basin management objectives listed above. In summary, the plan elements include: Monitoring of groundwater levels, quality, production and subsidence Monitoring and management of surface water flows and quality Determination of Basin yield and avoidance of overdraft Development of regular and dry-year emergency water supply Continuation of conjunctive use operations Long-term salinity management Integration of recycled water Identification and mitigation of soil and groundwater contamination, including involvement with other local agencies in investigation, cleanup and closure Development and continuation of local, state and federal agency relationships Santa Clarita Valley Urban Water Management Plan Page 3-20
247 Groundwater management reports 2015 Santa Clarita Valley Urban Water Management Plan Continuation of public education and water conservation programs Identification and management of recharge areas and wellhead protection areas Identification of well construction, abandonment and destruction policies Provisions to update the groundwater management plan Work on a number of the GWMP elements had been ongoing for some time prior to the formal adoption of the GWMP, and expanded work on implementation of the GWMP will continue on an ongoing basis and are anticipated to be included in the SGMA GSP or SGMA alternative plan. The results of some of that work were incorporated in the last UWMP, and subsequent analyses of the groundwater basin are reflected in this current UWMP. Notable in the implementation of the GWMP has been the annual preparation of a Santa Clarita Valley Water Report that summarizes (1) water requirements, (2) all three sources of water supply (groundwater, imported surface water and recycled water, all as part of the GWMP s overall management objectives) and (3) projected water supply availability to meet the following year s projected water requirements Available Groundwater Supplies The groundwater component of overall water supply in the Valley derives from a groundwater operating plan developed and analyzed to meet water requirements (municipal, agricultural, small domestic) while maintaining the Basin in a sustainable condition, specifically no long-term depletion of groundwater or interrelated surface water. The operating plan also addresses groundwater contamination issues in the Basin, all consistent with the GWMP described above. The groundwater operating plan is based on the concept that pumping can vary from year to year to allow increased groundwater use in dry periods and increased recharge during wet periods to collectively assure that the groundwater Basin is adequately replenished through various wet/dry cycles. As ultimately formalized in the GWMP, the operating yield concept has been quantified as ranges of annual pumping volumes to capture year-to-year pumping fluctuations in response to both hydrologic conditions and customer demand. Ongoing work through implementation of the GWMP has produced three detailed technical reports in addition to the annual Water Reports (the most recent of which, for 2014, was the seventeenth annual report). The first detailed technical report (CH2M Hill, April 2004) documents the construction and calibration of the groundwater flow model for the Valley. The second report (CH2M Hill and LSCE, August 2005) presents the initial modeling analysis of the purveyors original groundwater operating plan. The most recent report, an updated analysis of the basin (LSCE & GSI, 2009) presents the modeling analysis of the current groundwater operating plan, including restoration of two Saugus Formation wells for municipal supply after treatment and also presents a range of potential impacts deriving from climate change considerations. All those results are reflected in this UWMP. The primary conclusion of the technical analysis is that the groundwater operating plan will not cause detrimental short or long term effects to the groundwater and surface water resources in the Valley and is therefore Santa Clarita Valley Urban Water Management Plan Page 3-21
248 2015 Santa Clarita Valley Urban Water Management Plan sustainable. The analysis of sustainability for groundwater and interrelated surface water is described in detail in Analysis of Groundwater Supplies and Groundwater Basin Yield, Upper Santa Clara River Groundwater Basin, East Subbasin (Basin Yield Analysis) prepared August 2009 (LSCE & GSI, 2009). The updated groundwater operating plan, summarized in Table 3-5, is as follows: Alluvium: Pumping from the Alluvial Aquifer in a given year is governed by local hydrologic conditions in the eastern Santa Clara River watershed. Pumping for municipal, agricultural, and private purposes ranges between 30,000 and 40,000 AFY during normal and above-normal rainfall years. However, due to hydrogeologic constraints in the eastern part of the Basin, pumping is reduced to between 30,000 and 35,000 AFY during locally dry years. Saugus Formation: Pumping from the Saugus Formation in a given year is tied directly to the availability of other water supplies, particularly from the SWP. During averageyear conditions within the SWP system, Saugus pumping ranges between 7,500 and 15,000 AFY. Planned dry-year pumping from the Saugus Formation ranges between 15,000 and 25,000 AFY during a drought year and can increase to between 21,000 and 25,000 AFY if SWP deliveries are reduced for two consecutive years and between 21,000 and 35,000 AFY if SWP deliveries are reduced for three consecutive years. Such high pumping would be followed by periods of reduced (average-year) pumping, at rates between 7,500 and 15,000 AFY, to further enhance the effectiveness of natural recharge processes that would recover water levels and groundwater storage volumes after the higher pumping during dry years. TABLE 3-5 GROUNDWATER OPERATING PLAN FOR THE SANTA CLARITA VALLEY Groundwater Production (AF) Aquifer Normal Years Dry Year 1 Dry Year 2 Dry Year 3 Alluvium 30,000 to 40,000 30,000 to 35,000 30,000 to 35,000 30,000 to 35,000 Saugus Formation 7,500 to 15,000 15,000 to 25,000 21,000 to 25,000 21,000 to 35,000 Total 37,500 to 55,000 45,000 to 60,000 51,000 to 60,000 51,000 to 70,000 Within the groundwater operating plan, three factors affect the availability of groundwater supplies: sufficient source capacity (wells and pumps), sustainability of the groundwater resource to meet pumping demand on a renewable basis and protection of groundwater sources (wells) from known contamination, or provisions for treatment in the event of contamination. The first two factors are briefly discussed below, and more completely addressed in the 2014 Annual Water Report and the aforenoted Basin Yield Analysis (LSCE & GSI, 2009). Protection of groundwater sources and provisions for treatment in the event of contamination are discussed further in Section 5. Santa Clarita Valley Urban Water Management Plan Page 3-22
249 2015 Santa Clarita Valley Urban Water Management Plan Recent historical groundwater pumping by the retail water purveyors and other groundwater users is summarized in Table 3-6. Planned future groundwater pumping in normal years, by the retail water purveyors as well as by other groundwater users, is summarized in Table 3-7. Existing and planned groundwater pumping by the retail water purveyors as well as by other groundwater users, for normal, single-dry and two different multiple-dry year periods, are summarized in Section and in Tables 3-10 through 3-12B below. Santa Clarita Valley Urban Water Management Plan Page 3-23
250 2015 Santa Clarita Valley Urban Water Management Plan TABLE 3-6 RECENT HISTORICAL GROUNDWATER PRODUCTION (AF) (a) Santa Clara River Valley East Subbasin SCWD 12,979 13,148 10,370 6,723 7,558 Alluvium 10,195 10,192 7,262 4,220 4,597 Saugus Formation (b) 2,784 2,956 3,108 2,503 2,961 LACWWD Alluvium Saugus Formation NCWD 7,605 6,712 5,240 5,232 4,828 Alluvium 3,216 2,631 1,405 1,383 1,131 Saugus Formation 4,389 4,081 3,835 3,849 3,697 VWC 13,040 13,072 13,358 21,419 16,534 Alluvium 12,775 12,770 12,764 19,080 13,605 Saugus Formation ,339 2,929 Total Purveyor 33,624 33,726 29,779 34,612 29,893 Alluvium 26,186 25,593 21,431 24,683 19,333 Saugus Formation 7,438 8,133 8,348 9,929 10,560 Agricultural and Other (c) 15,550 16,032 16,151 12,885 12,079 Alluvium 14,562 15,108 15,461 12,213 11,359 Saugus Formation Total Basin 49,174 49,758 45,930 47,497 41,972 Alluvium 40,748 40,701 36,892 36,896 30,692 Saugus Formation 8,426 9,057 9,038 10,601 11,280 Groundwater Fraction of Total Municipal Water Supply 52% 48% 41% 51% 55% Notes: (a) From 2014 Santa Clarita Valley Water Report (June 2015) and recorded amounts for (b) Represents pumping from Saugus 1 and Saugus 2 wells. (c) Includes agricultural and other small private well pumping. Santa Clarita Valley Urban Water Management Plan Page 3-24
251 Basin Name Santa Clara River Valley East Subbasin 2015 Santa Clarita Valley Urban Water Management Plan TABLE 3-7 PROJECTED GROUNDWATER PRODUCTION (NORMAL YEAR) (AF) (a) Groundwater Pumping (AF) Purveyor Alluvium (b) 26,100 28,100 29,100 31,100 31,100 31,100 31,100 Saugus Formation 10,675 10,675 10,675 10,675 10,675 10,675 10,675 Total Purveyor 36,775 38,775 39,775 41,775 41,775 41,775 41,775 Agricultural and Other (c) Basin Alluvium 12,500 10,500 9,500 7,500 7,500 7,500 7,500 Saugus Formation 1,800 1,800 1,800 1,800 1,800 1,800 1,800 Total Agricultural and Other 14,300 12,300 11,300 9,300 9,300 9,300 9,300 Alluvium 38,600 38,600 38,600 38,600 38,600 38,600 38,600 Saugus Formation 12,475 12,475 12,475 12,475 12,475 12,475 12,475 Total Basin 51,075 51,075 51,075 51,075 51,075 51,075 51,075 Notes: (a) Includes both existing and planned pumping. A breakdown of both existing and planned pumping by individual purveyors is shown in Appendix C. The distribution of pumping does not represent a formal allocation of water resources among the retail purveyors. (b) Alluvium pumping by VWC assumes a portion of Newhall Land and Farming agricultural production is shifted to VWC. The total shift is 7,000 AFY, with 2,000 AFY occurring between 2015 and 2020 and the remaining 5,000 AFY occurring between 2020 and (c) Agricultural and other small private well pumping, including Newhall Land, Robinson Ranch Golf Course, Wayside Honor Rancho, Valencia Golf Course, and Whittaker-Bermite. Santa Clarita Valley Urban Water Management Plan Page 3-25
252 2015 Santa Clarita Valley Urban Water Management Plan As reflected in Table 3-7, the groundwater operating plan recognizes ongoing pumping for the two major uses of groundwater in the Basin, municipal and agricultural (including private pumpers) water supply. Consistent with the groundwater operating plan, projected groundwater pumping includes an ongoing conversion of pumping, coincident with planned land-use changes, from agricultural to municipal water supply. This is shown in Table 3-7, with projected pumping by agricultural and other users decreasing as purveyor pumping increases by a similar amount, resulting in total pumping remaining essentially constant through The reduction in pumping for agricultural supply is primarily due to the development of Newhall Ranch (expected buildout date of 2034) and is expected to shift to an increase in pumping by VWC. The groundwater operating plan and projected pumping also includes other small private domestic and related pumping. As shown in Table 3-7, total projected groundwater pumping by all users within each aquifer is within the ranges for normal year pumping identified in the groundwater operating plan (Table 3-5). The Agency and the retail water purveyors recognize that these estimates of projected groundwater use are subject to adjustment based on various factors and conditions occurring from time to time. These estimates are provided for the planning purposes of this report and the UWMP, and do not constitute an allocation of groundwater from the local groundwater basins Alluvium Based on a combination of historical operating experience and groundwater modeling analyses (2005 and 2009), the Alluvial Aquifer can supply groundwater on a long-term sustainable basis in the overall range of 30,000 to 40,000 AFY, with a probable reduction in dry years to a range of 30,000 to 35,000 AFY. Both of those ranges include almost 15,000 AFY of Alluvial pumping for current agricultural and other non-municipal water uses. The dry year reduction is a result of practical constraints in the eastern part of the Basin, where lowered groundwater levels in dry periods have the effect of reducing pumping capacities in that shallower portion of the aquifer. Over time, directly related to the rate of suburban development and corresponding decrease in agricultural land use the amount of Alluvial pumping for agricultural water supply is expected to decrease, with an equivalent increase in the amount of Alluvial pumping for municipal water supply. On an overall basis, Alluvial pumping is intended to remain within the sustainable ranges in the groundwater operating plan. Adequacy of Supply For municipal water supply, with existing wells and pumps, the three retail water purveyors with Alluvial wells (NCWD, SCWD and VWC) have a combined pumping capacity from active wells of nearly 42,000 gallons per minute (gpm), which translates into a current full-time Alluvial source capacity of approximately 67,000 AFY. Alluvial pumping capacity from all the active municipal supply wells is summarized in Table 3-8. The locations of the various municipal Alluvial wells throughout the Basin are illustrated on Figure 3-2. In terms of adequacy and availability, the combined active Alluvial groundwater source capacity of municipal wells, approximately 67,000 AFY, is more than sufficient to meet the current and potential future municipal, or urban, component of groundwater supply from the Alluvium, which in the near term is about 26,000 AFY (Table 3-7 for 2020) of the total planned Alluvial pumping of 38,600 AFY, which is within the 30,000 to 40,000 AFY basin yield. The higher individual and Santa Clarita Valley Urban Water Management Plan Page 3-26
253 2015 Santa Clarita Valley Urban Water Management Plan cumulative pumping capacities are, of course, primarily for operational reasons (i.e., to meet daily and other fluctuations from average day to maximum day and peak hour system demands). As noted above, the balance of Alluvial pumping in the operating plan is for agricultural and other non-municipal, including small private, pumping. Santa Clarita Valley Urban Water Management Plan Page 3-27
254 Legend!< Municipal Alluvial Well Alluvium Saugus Formation Miles LO LO S S ANG ANG EL EL ES ES C C OUNTY OUNTY VE VE NTUR NTUR A A COUNT COUNT Y Y Santa Clara River Valley East Groundwater Subbasin Castaic Lake Water Agency Boundary!<!<!< Map Location!<!<!<!<!<!<!<!<!<!<!<!<!<!<!<!<!<!<!<!<!<!<!<!<!<!<!<!<!<!<!<!<!<!<!<!<!< Sources: Esri, DeLorme, HERE, USGS, Intermap, increment P Corp., NRCAN, Esri Japan, METI, Esri China (Hong Kong), Esri (Thailand), TomTom, Copyright: 2014 Esri Path: Y:\Santa Clarita\Water Report\Data\SCV\GIS\2015 UWMP Figures\Figure 3-2 Alluvial Wells.mxd Figure 3-2 Alluvial Municipal Well Location Map 2015 Santa Clarita Valley Urban Water Management Plan
255 2015 Santa Clarita Valley Urban Water Management Plan TABLE 3-8 ACTIVE MUNICIPAL GROUNDWATER SOURCE CAPACITY ALLUVIAL AQUIFER WELLS Well Pump Capacity (gpm) Max. Annual Capacity (AF) Simulated Basin Yield Analysis Usage (a) Normal Year (AF) Dry Year (AF) NCWD Castaic , Castaic Castaic Castaic 7 1,450 2, Pinetree Pinetree Pinetree Pinetree NCWD Subtotal 4,620 7,400 1,950 1,250 SCWD Clark Guida 1,000 1,610 1,300 1,200 Honby 950 1,530 1, Lost Canyon , Lost Canyon 2A 825 1, Mitchell 5A 950 1, Mitchell 5B 700 1, N. Oaks Central 1,275 2, N. Oaks East 950 1, N. Oaks West 1,300 2, Sand Canyon 1,050 1, Santa Clara 1,500 2,420 1,200 1,200 Sierra 1,500 2,420 1, Valley Center 1,200 1,930 1,200 1,200 SCWD Subtotal 14,650 23,780 11,050 8,300 VWC (b) Well D 1,050 1, Well E-15 1,400 2, Santa Clarita Valley Urban Water Management Plan Page 3-29
256 2015 Santa Clarita Valley Urban Water Management Plan Well N 1,250 2, Well N7 2,500 4,030 1,160 1,160 Well N8 2,500 4,030 1,160 1,160 Well Q2 1,200 1,930 1,100 1,100 Well S6 2,000 3,220 1,000 1,000 Well S7 2,000 3, Well S8 2,000 3, Well T7 1,200 1, Well U4 1,000 1, Well U6 1,250 2, Well W ,290 1,000 1,000 Well W10 1,500 2, Well W11 1,000 1, VWC Subtotal 22,650 36,470 12,850 12,850 Total Purveyors 41,920 67,650 25,850 22,400 Note: (a) Usage amounts are simulated results from the updated Basin Yield analysis (LSCE & GSI, 2009) for Purveyors' existing wells. (b) Does not include new or improved wells that may be required to accommodate the planned shift of pumping from existing agricultural use to municipal use. Santa Clarita Valley Urban Water Management Plan Page 3-30
257 2015 Santa Clarita Valley Urban Water Management Plan Sustainability Until 2003, the long-term renewability of Alluvial groundwater was empirically determined from approximately 60 years of pumping and groundwater level records. Generally, those long-term observations included stability in groundwater levels and storage, with some dry-period fluctuations in the eastern part of the Basin. During this period, the total Alluvial pumpage ranged from a low of about 20,000 AFY to as high as about 43,000 AFY. Those empirical observations have since been complemented by the development and application of a numerical groundwater flow model, which has been used to simulate aquifer response to the planned operating ranges of pumping. The numerical groundwater flow model has also been used to analyze the control of perchlorate contaminant migration as discussed in Section The model was used to evaluate the likelihood of perchlorate migration to VWC wells, in particular Well Q2 and the wells in the VWC Pardee wellfield. The assessment of perchlorate migration also evaluated the sustainability and reliability of water supplies from the Alluvial aquifer. This analysis (LSCE, 2005) concluded that there was sufficient production capacity in the Alluvium to meet water demands in the case of VWC Well Q2 and/or the Pardee well field being temporarily out of service due to perchlorate impacts. To examine the yield of the Alluvium, or the sustainability of the Alluvium on a renewable basis, the original groundwater flow model was used to examine the long-term projected response of the aquifer to pumping for municipal and agricultural uses in the 30,000 to 40,000 AFY range under average/normal and wet conditions and in the 30,000 to 35,000 AFY range under locally dry conditions, documented in the 2005 basin yield analysis (2005 Basin Yield Analysis), prepared by CH2M Hill & LSCE, To examine the response of the entire aquifer system, the original model also incorporated pumping from the Saugus Formation in accordance with the normal (7,500 to 15,000 AFY) and dry year (15,000 to 35,000 AFY) operating plan for that aquifer. The model was run over a synthetic 78-year hydrologic period, which was selected from actual historical precipitation to examine a number of hydrologic conditions expected to affect both groundwater pumping and groundwater recharge. Simulated Alluvial Aquifer response to the range of hydrologic conditions and pumping stresses was essentially a long-term repeat of the historical conditions that have resulted from similar pumping over the last several decades. The resultant response included (1) generally constant groundwater levels in the middle to western portion of the Alluvium, and fluctuating groundwater levels in the eastern portion as a function of wet and dry hydrologic conditions, (2) variations in recharge that directly correlate with wet and dry hydrologic conditions and (3) no long-term decline in groundwater levels or storage. Consequently, the Alluvial Aquifer was considered in the 2005 UWMP to be a sustainable water supply source to meet the Alluvial portion of the operating plan for the groundwater Basin. In 2008, partly in preparation for the 2010 UWMP, and partly in response to concerns about events expected to impact the future reliability of supplemental water supply from the SWP, an updated analysis was undertaken to assess groundwater development potential and possible augmentation of the groundwater operating plan. In addition to extending the model s calibration, the updated analysis simulated the historical record of climate and incorporated SWP deliveries for those climatic conditions for an 86-year period from 1922 through 2007, in place of the original model s synthetic 78-year hydrologic period that had been developed prior Santa Clarita Valley Urban Water Management Plan Page 3-31
258 2015 Santa Clarita Valley Urban Water Management Plan to the availability of combined climate and SWP deliveries since While the overall operating plan ranges in the updated basin yield analysis did not change from the original operating plan, prevailing land-use conditions and the specific distributions of pumping reflected in Tables 3-8 and 3-9 were found to produce the same kinds of resultant Alluvial groundwater conditions as concluded to be sustainable in 2005 (1) no long-term declines in Alluvial groundwater levels and storage; (2) multi-year periods of locally declining, or locally increasing, groundwater levels in response to cycles of below-normal and above-normal precipitation and (3) short-term impacts on pumping capacities in eastern parts of the basin due to declining groundwater levels during dry periods, mitigable by some redistribution of pumping (reflected in pumping volumes included in this UWMP) and by conformance with the dry-period reduction in Alluvial pumping in the operating plan (Table 3-5). Based on the results of the updated basin yield analysis (LSCE & GSI, 2009), the operating plan is considered to reflect ongoing sustainable groundwater supply rates. In the Alluvium, sustainability was found via explicit simulation of pumping in wet/normal years near the upper end of the operating plan range. In dry years, sustainability was found via explicit simulation of pumping throughout the dry-year operating plan range, with the additional consideration that some redistribution of municipal pumping (reflected in this UWMP, and experienced in the dry years of 2014 and 2015) be implemented to achieve pumping rates near the dry-period range Saugus Formation Based on historical operating experience and recent (2005 and 2009) groundwater modeling analysis, the Saugus Formation can supply water on a long-term sustainable basis in a normal range of 7,500 to 15,000 AFY. Intermittent increases to 25,000 to 35,000 AF in dry years has not been historically experienced operationally, however, investigations of the Saugus Formation, historical groundwater level monitoring data, and numerical modeling indicate that the Saugus Formation can be pumped sustainably at these higher rates, followed by reductions in pumping in wet to normal years. The dry-year increases, based on modeled projections, demonstrate that the 25,000 to 35,000 AFY is a small amount of the large groundwater storage in the Saugus Formation and these amounts can be pumped over a relatively short (dry) period. This would be followed by recharge (replenishment) of that storage during a subsequent normal-to-wet period when the Saugus pumping would be reduced to 7,500 to 15,000 AFY. Adequacy of Supply For municipal water supply with existing wells, the three retail water purveyors (NCWD, SCWD and VWC) have a combined pumping capacity from active Saugus wells of nearly 17,000 gpm, which translates into a full-time Saugus source capacity of about 27,000 AFY. Additionally, LACWWD 36 completed a Saugus Well with a pumping capacity estimated at 2,000 gpm and an annual capacity of 3,220 AFY. Saugus pumping capacity from all the existing active municipal supply wells is summarized in Table 3-9, as well as restored, replacement, and planned new supply wells. The locations of the various active municipal Saugus wells are illustrated on Figure 3-3. The active wells include two Saugus wells contaminated by perchlorate (Saugus 1 and 2), which were returned to service in 2010 with treatment facilities for use of the treated water for municipal supply under permit from the California Department of Public Health (DPH), now DDW. The active wells also include the most recent replacement well, VWC s Well 207, in a non-impacted part of the basin. Also included in Table 3-9 is VWC Santa Clarita Valley Urban Water Management Plan Page 3-32
259 2015 Santa Clarita Valley Urban Water Management Plan Well 201, which was impacted by the detection of perchlorate and removed from service in The well is expected to be restored to service by 2017 with treatment facilities for use of the treated water for municipal supply under a permit from DDW (previously DPH), similar to the Saugus 1 and Saugus 2 wells. VWC Well 201 provides a total of 2,400 gpm of pumping capacity (for a dry-year production capacity of 3,775 AFY), and is shown in Table 3-9 under Restored Wells. Following the shutdown of VWC Well 201, VWC reduced pumping from a nearby well (VWC Well 205) to minimize influences on perchlorate migration. VWC Well 205 was voluntarily removed from service in 2012 when perchlorate was detected at concentrations below the detection level for reporting. VWC Well 205 will be returned to service with VWC Well 201. Because VWC Well 205 was voluntarily removed from service, it is considered an active existing well. In terms of adequacy and availability, the combined active (existing) Saugus groundwater source capacity of municipal wells of about 30,700 AFY is more than sufficient to meet the planned use of Saugus groundwater in normal years of 7,500 to 15,000 AFY. This existing active capacity is also more than sufficient to meet near term dry year water demands, in combination with other sources. In order to supplement long term dry-year supplies, additional Saugus Formation wells are planned to be operational within the next three years. With the restored capacity of the VWC Well 201 and the additional planned replacement and new Saugus wells, the total dry year combined capacity will increase from about 30,700 AFY to about 48,570 AFY. This combined capacity is more than sufficient to meet the multiple dry year municipal production target of 34,000 AFY. Santa Clarita Valley Urban Water Management Plan Page 3-33
260 2015 Santa Clarita Valley Urban Water Management Plan TABLE 3-9 MUNICIPAL GROUNDWATER SOURCE CAPACITY-EXISTING, RESTORED, AND PLANNED SAUGUS FORMATION WELLS (a) Existing Wells LACWWD36 NCWD VWC SCWD Restored Well Replacement Well Planned Wells Well Pump Capacity (gpm) Max. Annual Capacity (AF) Simulated Basin Yield Analysis Usage (b) Normal Year Dry Year (AF) (AF) Adjusted Basin Yield Usage(c) Normal Year (AF) Dry Year (AF) Palmer 2,000 3, ,400 3,870 1,762 2,488 1,587 2, ,250 3,630 1,762 2,488 1,587 2,488 NCWD Subtotal 4,650 7,500 3,525 4,975 3,175 4, ,000 3, (d) 2,700 4, , , ,500 4, , , ,500 4, , ,500 VWC Subtotal 10,200 16, , ,090 Saugus 1 1,100 1,772 1,650 1,650 1,650 1,650 Saugus 2 1,100 1,772 1,650 1,650 1,650 1,650 SCWD Subtotal 2,200 3,545 3,300 3,300 3,300 3,300 Total Existing 19,050 30,700 8,245 19,865 7,445 19,865 VWC 201 (d) 2,400 3,870 3,230 3,775 3,230 3,775 Future #1 2,500 4, , ,000 Future #2, #3, #4 (e) 6,200 10, , ,560 Total Purveyors 30,150 48,570 11,475 34,000 10,675 33,200 Santa Clarita Valley Urban Water Management Plan Page 3-34
261 2015 Santa Clarita Valley Urban Water Management Plan Notes: (a) The quantities of groundwater extracted by existing or planned well capacity will vary depending on operating conditions experienced such as the quantity of an individual retailers existing capacity. This is illustrated in the more detailed supply and demand tables in Appendix C, which show differing mixes of pumping from existing and planned wells. However, overall pumping remains within the groundwater basin yields. (b) Usage amounts are results from simulations in the updated Basin Yield analysis (LSCE & GSI, 2009) and from analysis conducted in 2014 for Well 201 restoration and containment investigation. Dry-year production represents maximum dry year production (Dry Year 3 in Table 3-5). (c ) Simulated results adjusted to reduce Purveyor pumping by projected 800 AFY of Whittaker-Bermite pumping for perchlorate treatment. (c) VWC Well 201 is planned to be returned to service by 2017 with treatment under a permit from the DDW. The operation of VWC Well 205 was temporarily suspended on a voluntary basis until Well 201 is returned to service. (d) A portion of production from Future well #2 would be used to restore Saugus Formation well capacity lost due to perchlorate impacts, and the remainder for new additional dry year capacity. Santa Clarita Valley Urban Water Management Plan Page 3-35


262 Legend!A Municipal Saugus Well Alluvium Saugus Formation Miles LO LO S S ANG ANG EL EL ES ES C C OUNTY OUNTY VE VE NTUR NTUR A A COUNT COUNT Y Y Santa Clara River Valley East Groundwater Subbasin Castaic Lake Water Agency Boundary Map Location!A!A! A!A!A!A!A A!!A!A!A Sources: Esri, DeLorme, HERE, USGS, Intermap, increment P Corp., NRCAN, Esri Japan, METI, Esri China (Hong Kong), Esri (Thailand), TomTom, Copyright: 2014 Esri Path: Y:\Santa Clarita\Water Report\Data\SCV\GIS\2015 UWMP Figures\Figure 3-3 Saugus Wells.mxd Figure 3-3 Saugus Municipal Well Location Map 2015 Santa Clarita Valley Urban Water Management Plan
263 Sustainability 2015 Santa Clarita Valley Urban Water Management Plan Until 2003, the long-term sustainability of Saugus groundwater was empirically estimated from limited historical experience. Historically (and continuing to the present), pumping from the Saugus has been fairly low in most years, with one four-year period of increased pumping up to about 15,000 AFY that had short-term water level impacts but produced no long-term depletion of the substantial groundwater storage in the Saugus. Those empirical observations have now been complemented by the development and application of the numerical groundwater flow model. The numerical groundwater flow model has also been used to analyze the control of perchlorate contaminant migration on two separate occasions under selected pumping conditions. The first occasion resulted in the implementation of a plan to restore, with treatment, pumping capacity that was formerly inactivated due to perchlorate contamination detected in the Saugus 1 and Saugus 2 wells in the Basin. The second occasion utilized the numerical groundwater flow model to evaluate preferred plans to control the migration of perchlorate in the vicinity of VWC Well 201. As discussed in Section those restoration efforts have been undertaken and the restoration of that pumping is reflected in this UWMP as part of the Saugus operating plan (Table 3-5) and pumping distribution (Table 3-9). To examine the yield of the Saugus Formation, or its sustainability on a renewable basis, the original groundwater flow model was used to examine long-term projected response to pumping from both the Alluvium and the Saugus over the synthetic 78-year period of hydrologic conditions that incorporated alternating wet and dry periods as have historically occurred (CH2M Hill and LSCE, 2005). The model was based upon field investigations and historical data collected from numerous sources including annual reports prepared by LSCE and investigations of Saugus and Alluvial aquifers by CH2M Hill and Richard C. Slade and Associates among others (CH2M Hill, 2004a, 2004b, 2005a; CH2M Hill & LSCE 2005; LSCE 2005; Slade & Associates 1986, 1988, 2002). The pumping simulated in the model was in accordance with the then-current operating plan for the Basin. For the Saugus, simulated pumping included the then-planned restoration of historic pumping from the wells impacted by perchlorate at that time (Saugus 1 and Saugus 2). The originally simulated Saugus Formation response to the ranges of operating plan pumping under assumed recurrent historical hydrologic conditions was consistent with actual experience under smaller pumping rates: (1) short-term declines in groundwater levels and storage near pumped wells during dry-period pumping, (2) recovery of groundwater levels and storage after cessation of dry-period pumping and (3) no long-term decreases or depletion of groundwater levels or storage. The combination of actual experience with Saugus recharge and pumping up to about 15,000 AFY, complemented by modeled projections of aquifer response that showed long-term utility of the Saugus at 7,500 to 15,000 AFY in normal years and rapid recovery from higher pumping rates during intermittent dry periods, was the basis for concluding that the Saugus Formation could be considered a sustainable water supply source to meet the Saugus portion of the operating plan for the groundwater Basin. As discussed under Sustainability of the Alluvium above, an updated basin yield analysis was undertaken in 2008 to assess groundwater development potential and possible augmentation of the groundwater operating plan. After extended and updated model calibration and incorporation of extended historical records, the overall operating plan (Table 3-5) and specific Santa Clarita Valley Urban Water Management Plan Page 3-37
264 2015 Santa Clarita Valley Urban Water Management Plan distribution of Saugus pumping (Table 3-9) were found to produce the same kinds of resultant Saugus groundwater conditions as concluded to be sustainable in 2005 (1) long-term stability of groundwater levels, with no sustained declines; (2) groundwater levels slightly below historic Saugus levels, in response to greater long-term utilization of the Saugus and (3) maintenance of sufficiently high Saugus groundwater levels to ensure achievement of planned individual pumping capacities (Table 3-9). Thus, the operating plan for the Saugus, with fairly low pumping in wet/normal years and increased pumping through dry periods, is concluded to reflect sustainable groundwater supply rates Existing and Planned Groundwater Pumping Impacted Well Capacity As discussed in the 2010 UWMP and in Section of this Plan, certain wells in the Basin were impacted by perchlorate contamination and thus represented a temporary loss of well capacity within CLWA s service area. Six wells were initially taken out of service upon the detection of perchlorate including four Saugus wells and two Alluvial wells. All have either been (1) abandoned and replaced, (2) returned to service with the addition of treatment facilities that allow the wells to be used for municipal water supply as part of the overall water supply systems permitted by DDW or (3) will be replaced under an existing perchlorate litigation settlement agreement (see Section 5). The restored wells (two Saugus wells and one Alluvial well), one Saugus well which is currently being restored, and the replacement wells (one Saugus and one Alluvial well), which collectively restore much of the temporarily lost well capacity, are now included as parts of the municipal groundwater source capacities delineated in Tables 3-8 and 3-9. Additional wells will be drilled to fully restore the impacted well capacity, thus restoring the operational flexibility that existed prior to the perchlorate being discovered. In August 2010, VWC s Well 201, located downgradient from the Whittaker-Bermite site and downgradient from the initially impacted Saugus 1, Saugus 2 and VWC well157, had detectable concentrations of perchlorate and the well was taken out of service (the seventh well to be taken out of service). Water sampling tests conducted since August 2010 have confirmed the presence of perchlorate over the adopted regulatory standard. This well was immediately taken out of service in August This well is planned on being restored to service by 2017, as discussed above, and its capacity is included in the restored groundwater sources delineated in Table 3-9. Following the shutdown of VWC Well 201, VWC reduced pumping from a nearby well (VWC Well 205) to minimize influences on perchlorate migration. VWC Well 205 was voluntarily removed from service in 2012 when perchlorate was detected at concentrations below the detection level for reporting. VWC Well 205 will be returned to service with VWC Well 201. Because VWC Well 205 was voluntarily removed from service, it is considered an active existing well. In addition, low levels of VOCs have been detected at Saugus 1 and 2, as well as in CLWA s distribution system, although concentrations have been below the respective Maximum Contaminant Levels (MCLs). Santa Clarita Valley Urban Water Management Plan Page 3-38
265 2015 Santa Clarita Valley Urban Water Management Plan Alluvium In terms of adequacy and availability, the combined active Alluvial Aquifer groundwater source municipal well capacity of approximately 67,000 AFY is more than sufficient to meet the current and potential future urban component of the groundwater supply from the Alluvium. The potential future urban component of groundwater supply from the Alluvium in the near-term is about 26,000 to 28,000 AFY of the total planned Alluvial pumping of 30,000 to 40,000 AFY. The higher individual and cumulative pumping capacities of the purveyors are for operational reasons (i.e., to meet daily and other fluctuations from average day to maximum day and peak hour system demands). Tables 3-10, 3-11, 3-12A, and 3-12B and Tables 6-2, A, and 6-4B, as well as Tables C- 2, C-5, C-8A, and C-8B include planned Alluvial Aquifer supplies. These planned supplies do not increase the total quantity of water being withdrawn from the Alluvial Aquifer, but represent anticipated or potential shifts in pumping involving different or new wells. For example, as shown on Table 3-7, planned Alluvial Aquifer supplies include a shifting of pumping from Newhall Land agricultural uses to VWC for the anticipated Newhall Ranch project. While new or improved wells would be required, no significant changes in total Alluvial production are anticipated. There is also a potential that SCWD may require additional well capacity to meet the total anticipated pumping for a single dry year as described in Tables C-4 and C-5. Total purveyor and non-purveyor supplies remain consistent with the operating plan shown on Table Saugus Formation In terms of adequacy and availability, the combined active Saugus groundwater source municipal well capacity of 30,700 AFY is more than sufficient to meet the planned use of Saugus groundwater in normal years of 7,500 to 15,000 AFY. Near term dry-year supplies will be augmented once VWC Well 201 is restored to service by 2017 utilizing treatment technologies currently being used in the Santa Clarita Valley (see Section 5). In order to accommodate the longer-term demands, work is currently being conducted to construct additional Saugus wells to meet the planned use of 35,000 AFY of Saugus groundwater during a multiple-dry year period. Tables 3-10, 3-11, 3-12A, and 3-12B and Tables 6-2, 6-3, 6-4A, and 6-4B, as well as Tables C- 2, C-5, C-8A, and C-8B include planned Saugus Formation supplies. Planned Saugus Formation pumping would only increase the quantity of water being withdrawn from Saugus Formation to levels consistent with the operating plan shown on Table 3-5. To obtain full Saugus Formation supplies of 35,000 AFY in certain dry years, restoration of the perchlorate-impacted well (VWC Well 201) along with additional wells with a collective combined total capacity of approximately 14,000 AFY is being implemented. The need for additional new Saugus Formation wells to achieve full dry-year pumping has been planned for some time. Most notably, as part of the 2009 updated Basin Yield Analysis, three new Saugus wells were simulated in the western part of the basin, remote from the Whittaker-Bermite site and perchlorate-impacted Saugus wells. The conclusion of the analysis that Saugus pumping is Santa Clarita Valley Urban Water Management Plan Page 3-39
266 2015 Santa Clarita Valley Urban Water Management Plan sustainable included multiple-dry year pumping at a combined capacity for the three wells of nearly 10,000 AFY. The construction and operation of these new Saugus wells is expected to occur prior to Summary Overall, the total municipal supply in this Plan includes a groundwater component that is, in turn, part of the overall groundwater supply of the Valley. As such, the municipal groundwater supply, distributed among the retail purveyors, recognizes the existing and projected future uses of groundwater by overlying interests in the Valley such that the combination of municipal and all other groundwater pumping remains within the groundwater operating plan (Table 3-5) that has been analyzed for sustainability. The distribution of groundwater among the purveyors are detailed in Appendix C and aggregated for all the purveyors in Section 6 for normal years, single dry years, and both four-year and three-year multiple dry year periods. Total groundwater pumping, by all other pumpers as well as by the purveyors from their existing and planned wells, is summarized in Tables 3-10 through 3-12B for normal, single-dry and multiple-dry years. Santa Clarita Valley Urban Water Management Plan Page 3-40
267 2015 Santa Clarita Valley Urban Water Management Plan TABLE 3-10 AVERAGE/NORMAL YEAR EXISTING AND PLANNED GROUNDWATER USAGE (AF) (a) Alluvium Supplies Purveyors Existing 24,100 24,100 24,100 24,100 24,100 24,100 24,100 Purveyors Planned (b) 2,000 4,000 5,000 7,000 7,000 7,000 7,000 Purveyors Total 26,100 28,100 29,100 31,100 31,100 31,100 31,100 Non purveyors 12,500 10,500 9,500 7,500 7,500 7,500 7,500 Total Alluvium Production 38,600 38,600 38,600 38,600 38,600 38,600 38,600 Alluvium Yield 38,600 38,600 38,600 38,600 38,600 38,600 38,600 Saugus Formation Supplies Purveyors Existing 7,445 7,445 7,445 7,445 7,445 7,445 7,445 Purveyors Restored (c) 3,230 3,230 3,230 3,230 3,230 3,230 3,230 Purveyors Replacement and Planned (d) Purveyors Total 10,675 10,675 10,675 10,675 10,675 10,675 10,675 Non purveyors (e) 1,800 1,800 1,800 1,800 1,800 1,800 1,800 Total Saugus 12,475 12,475 12,475 12,475 12,475 12,475 12,475 Saugus Yield 12,475 12,475 12,475 12,475 12,475 12,475 12,475 Notes: (a) The mix of Purveyor pumping between existing and planned wells may vary depending on year-specific operating conditions and Purveyor demands. This is illustrated in the more detailed supply and demand tables in Appendix C, which show differing mixes of pumping from existing and planned wells from year to year. However, overall pumping remains within the groundwater basin yields. (b) These values account for the Newhall Ranch buildout schedule to 2034 and the shift in about 7,000 AFY of agricultural pumping from NLF to VWC between 2015 and Non-purveyor values are reduced by the same amount. (c) V201 values are assumed constant and are based on 2014 LSCE and GSI V201 perchlorate work and 2008 Operating Plan. (d) Up to four new and replacement wells are planned to provide additional dry-year supply and would not typically be operated during average/normal years. (e) This includes private pumping from the 2008 Operating Plan, as well as projected Whittaker-Bermite pumping for perchlorate treatment, and is assumed constant. Santa Clarita Valley Urban Water Management Plan Page 3-41
268 2015 Santa Clarita Valley Urban Water Management Plan TABLE 3-11 SINGLE-DRY YEAR EXISTING AND PLANNED GROUNDWATER USAGE (AF) (a) Alluvium Supplies Purveyors Existing 20,350 20,350 20,350 20,350 20,350 20,350 20,350 Purveyors Planned (b) 2,000 4,000 5,000 7,000 7,000 7,000 7,000 Purveyors Total 22,350 24,350 25,350 27,350 27,350 27,350 27,350 Non purveyors 12,500 10,500 9,500 7,500 7,500 7,500 7,500 Total Alluvium Production 34,850 34,850 34,850 34,850 34,850 34,850 34,850 Alluvium Yield 34,850 34,850 34,850 34,850 34,850 34,850 34,850 Saugus Formation Supplies Purveyors Existing 19,865 19,865 19,865 19,865 19,865 19,865 19,865 Purveyors Restored (c) 3,775 3,775 3,775 3,775 3,775 3,775 3,775 Purveyors Replacement and Planned (d) 9,560 9,560 9,560 9,560 9,560 9,560 9,560 Purveyors Total 33,200 33,200 33,200 33,200 33,200 33,200 33,200 Non purveyors (e) 1,800 1,800 1,800 1,800 1,800 1,800 1,800 Total Saugus 35,000 35,000 35,000 35,000 35,000 35,000 35,000 Saugus Yield 35,000 35,000 35,000 35,000 35,000 35,000 35,000 Notes: (a) The mix of Purveyor pumping between existing and planned wells may vary depending on year-specific operating conditions and Purveyor demands. This is illustrated in the more detailed supply and demand tables in Appendix C, which show differing mixes of pumping from existing and planned wells from year to year. However, overall pumping remains within the groundwater basin yields. (b) These values account for the Newhall Ranch buildout schedule to 2034 and the shift in about 7,000 AFY of agricultural pumping from NLF to VWC between 2015 and Non-purveyor values are reduced by the same amount. (c) V201 values are assumed constant and are based on 2014 LSCE and GSI V201 perchlorate work and 2008 Operating Plan. (d) Up to four new and replacement wells are planned to provide additional dry-year supply. (e) This includes private pumping from the 2008 Operating Plan, as well as projected Whittaker-Bermite pumping for perchlorate treatment, and is assumed constant. Santa Clarita Valley Urban Water Management Plan Page 3-42
269 2015 Santa Clarita Valley Urban Water Management Plan TABLE 3-12A FOUR-YEAR DRY YEAR EXISTING AND PLANNED GROUNDWATER USAGE (AF) (a) Alluvium Supplies Purveyors Existing 20,350 20,350 20,350 20,350 20,350 20,350 20,350 Purveyors Planned (b) 2,000 4,000 5,000 7,000 7,000 7,000 7,000 Purveyors Total 22,350 24,350 25,350 27,350 27,350 27,350 27,350 Non purveyors 12,500 10,500 9,500 7,500 7,500 7,500 7,500 Total Alluvium Production 34,850 34,850 34,850 34,850 34,850 34,850 34,850 Alluvium Yield 34,850 34,850 34,850 34,850 34,850 34,850 34,850 Saugus Formation Supplies Purveyors Existing 15,825 15,825 15,825 15,825 15,825 15,825 15,825 Purveyors Restored (c) 3,775 3,775 3,775 3,775 3,775 3,775 3,775 Purveyors Replacement and Planned (d) 11,100 11,100 11,100 11,100 11,100 11,100 11,100 Purveyors Total 30,700 30,700 30,700 30,700 30,700 30,700 30,700 Non purveyors (e) 1,800 1,800 1,800 1,800 1,800 1,800 1,800 Total Saugus 32,500 32,500 32,500 32,500 32,500 32,500 32,500 Saugus Yield 32,500 32,500 32,500 32,500 32,500 32,500 32,500 Notes: (a) The mix of Purveyor pumping between existing and planned wells may vary depending on year-specific operating conditions and Purveyor demands. This is illustrated in the more detailed supply and demand tables in Appendix C, which show differing mixes of pumping from existing and planned wells from year to year. However, overall pumping remains within the groundwater basin yields. (b) These values account for the Newhall Ranch buildout schedule to 2034 and the shift in about 7,000 AFY of agricultural pumping from NLF to VWC between 2015 and Non-purveyor values are reduced by the same amount. (c) V201 values are assumed constant and are based on 2014 LSCE and GSI V201 perchlorate work and 2008 Operating Plan. (d) Up to four new and replacement wells are planned to provide additional dry-year supply. (e) This includes private pumping from the 2008 Operating Plan, as well as projected Whittaker-Bermite pumping for perchlorate treatment, and is assumed constant. Santa Clarita Valley Urban Water Management Plan Page 3-43
270 2015 Santa Clarita Valley Urban Water Management Plan TABLE 3-12B THREE-YEAR DRY YEAR EXISTING AND PLANNED GROUNDWATER USAGE (AF) (a) Alluvium Supplies Purveyors Existing 20,350 20,350 20,350 20,350 20,350 20,350 20,350 Purveyors Planned (b) 2,000 4,000 5,000 7,000 7,000 7,000 7,000 Purveyors Total 22,350 24,350 25,350 27,350 27,350 27,350 27,350 Non purveyors 12,500 10,500 9,500 7,500 7,500 7,500 7,500 Total Alluvium Production 34,850 34,850 34,850 34,850 34,850 34,850 34,850 Alluvium Yield 34,850 34,850 34,850 34,850 34,850 34,850 34,850 Saugus Formation Supplies Purveyors Existing 15,525 15,525 15,525 15,525 15,525 15,525 15,525 Purveyors Restored (c) 3,775 3,775 3,775 3,775 3,775 3,775 3,775 Purveyors Replacement and Planned (d) 10,550 10,550 10,550 10,550 10,550 10,550 10,550 Purveyors Total 29,850 29,850 29,850 29,850 29,850 29,850 29,850 Non purveyors (e) 1,800 1,800 1,800 1,800 1,800 1,800 1,800 Total Saugus 31,650 31,650 31,650 31,650 31,650 31,650 31,650 Saugus Yield 31,650 31,650 31,650 31,650 31,650 31,650 31,650 Notes: (a) The mix of Purveyor pumping between existing and planned wells may vary depending on year-specific operating conditions and Purveyor demands. This is illustrated in the more detailed supply and demand tables in Appendix C, which show differing mixes of pumping from existing and planned wells from year to year. However, overall pumping remains within the groundwater basin yields. (b) These values account for the Newhall Ranch buildout schedule to 2034 and the shift in about 7,000 AFY of agricultural pumping from NLF to VWC between 2015 and Non-purveyor values are reduced by the same amount. (c) V201 values are assumed constant and are based on 2014 LSCE and GSI V201 perchlorate work and 2008 Operating Plan. (d) Up to four new and replacement wells are planned to provide additional dry-year supply. (e) This includes private pumping from the 2008 Operating Plan, as well as projected Whittaker-Bermite pumping for perchlorate treatment, and is assumed constant. Santa Clarita Valley Urban Water Management Plan Page 3-44
271 3.4 Transfers and Exchanges 2015 Santa Clarita Valley Urban Water Management Plan An opportunity available to CLWA to increase water supplies is to participate in voluntary water transfer programs. Since the drought of , the concept of water transfer has evolved into a viable supplemental source to improve supply reliability. The initial concept for water transfers was codified into law in 1986 when the California Legislature adopted the Katz Law (California Water Code, Sections ) and the Costa-Isenberg Water Transfer Law of 1986 (California Water Code, Sections 470, 475, ). These laws help define parameters for water transfers and set up a variety of approaches through which water or water rights can be transferred among individuals or agencies. Up to 27 MAF of water are delivered for agricultural use every year. Over half of this water use is in the Central Valley, and much of it is delivered by, or adjacent to, SWP and CVP conveyance facilities. This proximity to existing water conveyance facilities could allow for the voluntary transfer of water to many urban areas, including CLWA, via the SWP. Such water transfers can involve water sales, conjunctive use and groundwater substitution and water sharing. They usually occur as a form of spot, option or core transfers agreements. The costs of a water transfer would vary depending on the type, term and location of the transfer. The most likely voluntary water transfer programs would probably involve the Sacramento or southern San Joaquin Valley areas. One of the most important aspects of any resource planning process is flexibility. A flexible strategy minimizes unnecessary or redundant investments (or stranded costs). The voluntary transfer of water between willing sellers and buyers can be an effective means of achieving flexibility. However, not all water transfers have the same effectiveness in meeting resource needs. Through the resource planning process and ultimate implementation, several different types of water transfers could be undertaken Core Transfers Core transfers are agreements to purchase a defined quantity of water every year. These transfers have the benefit of more certainty in costs and supply, but in some years can be surplus to imported water (available in most years) that is already paid for Spot Market Transfers Spot market transfers involve water purchased only during the time of need (usually a drought). Payments for these transfers occur only when water is actually requested and delivered, but there is usually greater uncertainty in terms of costs and availability of supply. Examples of such transfers were the Drought Water Banks of 1991, 1992 and 1994 and DWR Dry Year Water Purchase Programs in 2001 through 2004 and 2008 along with transfers between willing sellers and buyers during the current drought period. An additional risk of spot market transfers is that the purchases may be subject to institutional limits or restricted access (e.g., requiring the purchasing agency to institute rationing before it is eligible to participate in the program). Santa Clarita Valley Urban Water Management Plan Page 3-45
272 3.4.3 Option Contracts 2015 Santa Clarita Valley Urban Water Management Plan Option contracts are agreements that specify the amount of water needed and the frequency or probability that the supply will be called upon (an option). Typically, a relatively low up-front option payment is required and, if the option is actually called upon, a subsequent payment would be made for the amount called. These transfers have the best characteristics of both core and spot transfers. With option contracts, the potential for redundant supply is minimized, as are the risks associated with cost and supply availability. CLWA has entered into one such transfer, for Yuba Accord water, as discussed previously in Section CLWA and a number of other entities entered into the Yuba Accord Agreement, which allows for the purchase of water from the Yuba County Water Agency through DWR. Under the agreement, an estimated average of up to 1,000 AFY of water (after losses) is available to CLWA in dry years, through Under certain hydrologic conditions, additional water may be available to CLWA under this program Future Market Transfers The most viable types of water transfers are core and option transfers and, as such, represent CLWA s long-term strategy. The most recent costs for this type of transfer is estimated to be about $700 per AFY for core transfers Water Exchanges In addition to water transfers, short-term water exchanges may also serve as a means to enhance water reliability. In 2011 CLWA entered into two unbalanced exchange agreements to enhance the management of its water supplies. CLWA executed a Two-for-One Water Exchange Program with RRBWSD whereby CLWA can recover one acre-foot of water for each two acre-feet CLWA delivered to RRBWSD (less losses). CLWA delivered 15,602 AF to the program in 2011, delivered another 3,969 AF in 2012 and, after program losses, has about 9,500 AF of recoverable water. The term for this agreement is ten years. Up to this entire amount may be recovered in a single year when requested by CLWA and when SWP exchange water is available from RRBWSD. CLWA also entered into a Two-for-One Water Exchange Program with the West Kern Water District (WKWD) in Kern County and CLWA delivered 5,000 AF in 2011, resulting in a recoverable total of 2,500 AF. The term of the agreement is ten years. In 2014, 2,000 AF of water was withdrawn from this exchange program leaving a balance of 500 AF. Up to this entire amount may be recovered in a single year when requested by CLWA and when SWP exchange water is available from WKWD. 3.5 Groundwater Banking Programs With the development of conjunctive use and groundwater banking, the water supply reliability for CLWA has improved significantly. Conjunctive use is the coordinated operation of multiple water supplies to achieve improved supply reliability. Most conjunctive use concepts are based Santa Clarita Valley Urban Water Management Plan Page 3-46
273 2015 Santa Clarita Valley Urban Water Management Plan on storing surface supplies in groundwater basins in times of surplus for withdrawal and use during dry periods and drought when surface water supplies would likely be reduced. Groundwater banking programs involve storing available SWP surface water supplies during wet years in groundwater basins in, for example, the San Joaquin Valley. Water would be stored either directly by surface spreading or injection, or indirectly by supplying surface water to farmers for their use in lieu of their intended groundwater pumping. During water shortages, the stored water could be pumped out and conveyed through the California Aqueduct to CLWA as the banking partner, or used by the farmers in exchange for their surface water allocations, which would be delivered to CLWA as the banking partner through the California Aqueduct. CLWA is a partner in two existing groundwater banking programs, the Semitropic Banking Program and RRBWSD Banking Program, discussed below in Sections and 3.5.2, respectively. Newhall Land is also a partner in the Semitropic Banking Program, as discussed in Section 3.5.3, with its supplies assumed to be available to VWC. In addition, CLWA has updated its plan to enhance its overall supply reliability, including the need for additional banking programs, as discussed in Section Semitropic Banking Program Semitropic Water Storage District (Semitropic) provides SWP water to farmers for irrigation. Semitropic is located in the San Joaquin Valley in the northern part of Kern County immediately east of the California Aqueduct. Using its available groundwater storage capacity (approximately 1.65 MAF), Semitropic has developed a groundwater banking program, that takes available SWP supplies in wet years and returns the water in dry years. As part of this dry-year return, Semitropic can either leave its SWP water in the Aqueduct for delivery to a banking partner and increase its groundwater production for its farmers, or Semitropic can pump groundwater that can be pumped into a Semitropic canal and, through reverse pumping plants, be delivered to the California Aqueduct. Semitropic s original banking program currently has six long-term first priority banking partners: the Metropolitan Water District of Southern California (Metropolitan), Santa Clara Valley Water District, Alameda County Water District, Alameda County Flood Control and Water Conservation District Zone 7, Newhall Land and Farming, and San Diego County Water Authority. The total amount of storage capacity under contract in the original banking program is 1 MAF, with approximately 700,000 AF currently in storage. Under its original program, Semitropic can pump back a maximum of 90,000 AFY of water into the California Aqueduct. Semitropic has recently expanded its groundwater banking program to incorporate its Stored Water Recovery Unit (SWRU). This supplemental program includes an additional storage capacity of 650,000 AF and an expansion of pumpback recovery capacity by 200,000 AFY. That pumpback capacity includes well connections and conveyance facility improvements to increase the existing Semitropic pumpback capacity to the California Aqueduct by an additional 50,000 AFY, and the future development of a new well field with approximately 65 wells along with new collection and transmission facilities to convey an additional 150,000 AFY to the California Aqueduct. Participants in the SWRU include Poso Creek Water Company, San Santa Clarita Valley Urban Water Management Plan Page 3-47
274 2015 Santa Clarita Valley Urban Water Management Plan Diego County Water Authority, City of Tracy, Homer LLC, Harris Farms, Shows Family Farms, Lazy Dog Orchard, and CLWA. In 2002, CLWA entered into a temporary storage agreement with Semitropic, and stored an available portion of its Table A supply (24,000 AF) in an account in Semitropic s program. In 2004, 32,522 AF of CLWA s available 2003 Table A supply was stored in a second temporary Semitropic account. In accordance with the terms of CLWA s storage agreements with Semitropic, 90 percent of the banked amount, or a total of 50,870 AF, was recoverable through 2013 to meet CLWA water demands when needed. CLWA executed an amendment for a tenyear extension of each banking agreement with Semitropic in April After storage withdrawals in 2009, 2010, and 2014 (and with 5,000 AF given to Newhall Land in consideration for CLWA s use of Newhall Land s first priority extraction capacity), the storage balance available to CLWA was 35,970 AF. In 2015 CLWA entered into an agreement with Semitropic to participate in the SWRU. Under this agreement, the two short-term accounts containing 35,970 AF were transferred into this new program. Under the SWRU agreement, CLWA can store and recover additional water within a 15,000 AF storage account. The term of the Semitropic Banking Program extends through 2035 with the option of a 10 year renewal. CLWA may withdraw up to 5,000 AFY from its account. Current operational planning includes use of the water stored in Semitropic for dry-year supply. Accordingly, it is reflected in the available supplies delineated in this section and in the Annual Reports prepared for CLWA and the retail water purveyors. It is also reflected as contributing only to dry-year supply reliability in Section 6, through Rosedale-Rio Bravo Banking Program Also located in Kern County, immediately adjacent to the Kern Water Bank, RRBWSD has developed a Water Banking and Exchange Program. CLWA has entered into a long-term agreement with RRBWSD with a total storage capacity of 100,000 AF. Between 2005 and 2012 CLWA delivered sufficient water from the SWP and other supplies to fill its 100,000 AF account. CLWA began storing water in this program in 2005 and has stored water in 2005, 2006, 2007, 2010, 2011, and In 2012, the maximum storage capacity of 100,000 AF was reached. Withdrawals from the water bank occurred in 2014 and 2015 for a total recovery of 5,822 AF leaving 94,178 AF currently available for withdrawal. CLWA s existing firm withdrawal capacity in this program is 3,000 AFY. To enhance dry-year recovery capacity, in 2015 CLWA in cooperation with RRBWSD and Irvine Ranch Water District initiated construction of additional facilities that are anticipated to be available at the end of 2016 or the beginning of Some of the wells constructed for this program have tested above the MCL for arsenic. The project proponents are currently investigating means to modify these well by sealing off higher arsenic zones and implementing blending strategies. With these facilities the firm extraction capacity is estimated to increase to 10,000 AFY even in exceptionally dry conditions such as those experienced in 2014 and In addition, CLWA has the right under the contract to develop four additional wells which would bring the firm Santa Clarita Valley Urban Water Management Plan Page 3-48
275 2015 Santa Clarita Valley Urban Water Management Plan recovery capacity to 20,000 AFY. This additional capacity is anticipated to be available by In addition to this firm recovery capacity, in moderately dry years Rosedale is required to use up to 20,000 AFY of other available recovery capacity to meet its recovery obligations under the banking agreement. This project is a water management program to improve the reliability of CLWA s existing dryyear supplies; it is not an annual supply that could support growth. Accordingly, it is reflected in the available supplies delineated in this section and it is also reflected as contributing only to dry-year supply reliability in Section Semitropic Banking Program Newhall Land As mentioned above, one of Semitropic s long-term groundwater banking partners is Newhall Land. In its agreement with Semitropic, Newhall Land has available to it a pumpback capacity of 4,950 AFY and a storage capacity of 55,000 AF. At the end of 2015, Newhall Land had a storage balance of 32,507 AF. Newhall Land entered into this banking program in anticipation of the development of Newhall Ranch. Under its agreement with Semitropic, Newhall Land may assign its rights to this program to CLWA. In this UWMP, it is assumed for planning purposes that Newhall Ranch will be developed at some time in the future and that Newhall Land s rights in this banking program will be transferred to CLWA at the time of development. In the meantime, it is assumed that Newhall Land will make its withdrawal capacity in this program available to CLWA for withdrawal of CLWA s own stored water supplies, as occurred in 2009 and This supply is assumed to be available to VWC and is planned to be used only in dry years. Accordingly, it is reflected in the available supplies delineated in this section, and it is also reflected as contributing only to dry-year supply reliability in Section Other Opportunities Based on analysis of water demands and supplies in the Plan a need for additional banking programs is identified after 2045 to replace the Semitropic Banking Program. A specific banking program has not yet been identified. CLWA plans on development of additional groundwater banking programs with a pumpback capacity of at least an additional 5,000 AFY for use in a single-dry year and multiple-dry year period. 3.6 Planned Water Supply Projects and Programs CLWA in cooperation with the purveyors prepared the Water Resources Reconnaissance Study (Study) (Carollo, 2015). The Study discusses the potential for acquiring additional water supplies. The Study evaluated a series of supply measures in the hopes that an additional 10,000 AFY of supply could be made available to the service area. The study identified two measures that might be able to go at least part way to that goal: a groundwater recharge project using recycled water and an imported water injection project during wet years to augment Saugus formation groundwater storage. Both of the projects were evaluated at the conceptual level, but significantly more investigation would need to be completed before either would be implemented. Santa Clarita Valley Urban Water Management Plan Page 3-49
276 2015 Santa Clarita Valley Urban Water Management Plan 3.7 Development of Desalination The California UWMP Act requires a discussion of potential opportunities for use of desalinated water (Water Code Section 10631[i]). CLWA has explored such opportunities, and they are described in the following section, including opportunities for desalination of brackish water, groundwater and seawater. However, at this time, none of these opportunities are practical or economically feasible for CLWA and CLWA has no current plans to pursue them. Therefore, desalinated supplies are not included in the supply summaries in this Plan (e.g., Tables 3-1, 6-2, 6-3 and 6-4) Opportunities for Brackish Water and/or Groundwater Desalination As discussed in Section 3.3, the two sources of groundwater in the Santa Clarita Valley are drawn from the Alluvial Aquifer and from the Saugus Formation. Neither of these supplies can be considered brackish in nature, and desalination is not required. However, CLWA and the retail water purveyors could team with other SWP contractors and provide financial assistance in construction of other regional groundwater desalination facilities in exchange for SWP supplies. The desalinated water would be supplied to users in communities near the desalination plant, and a similar amount of SWP supplies would be exchanged and allocated to CLWA from the SWP contractor. A list summarizing the groundwater desalination plans of other SWP contractors is not available; however, CLWA would begin this planning effort should the need arise. In addition, should an opportunity emerge with a local agency other than a SWP contractor, an exchange of SWP deliveries would most likely involve a third party, such as Metropolitan. Most local groundwater desalination facilities would be projects implemented by retail purveyors of SWP contractors and, if an exchange program was implemented, would involve coordination and wheeling of water through the contractor s facilities to CLWA Opportunities for Seawater Desalination Because the Santa Clarita Valley is not in a coastal area, it is neither practical nor economically feasible for CLWA and its purveyors to implement a seawater desalination program. However, similar to the brackish water and groundwater desalination opportunities described above, CLWA and the purveyors could provide financial assistance to other SWP contractors in the construction of their seawater desalination facilities in exchange for SWP supplies. CLWA and the purveyors have been following the existing and proposed seawater desalination projects along California s coast. Table 3-13 provides a summary of the status of several of California s municipal/domestic seawater desalination facilities. As of December 2015, there was an estimated 10 active proposals for seawater desalination plants along the California Coast, as well as two additional proposed plants in Baja California, Mexico that would provide water to southern California communities (Pacific Institute, 2015). This is down from an estimated 21 proposals in 2006 and 19 in 2012 (Pacific Institute, 2015). Santa Clarita Valley Urban Water Management Plan Page 3-50
277 2015 Santa Clarita Valley Urban Water Management Plan As shown Table 3-13, most of the existing and proposed seawater desalination facilities are/would be operated by agencies that are not SWP contractors. However, in these cases as described above, an exchange for SWP deliveries would most likely involve a third party (SWP contractor), the local water agency and CLWA. TABLE 3-13 EXISTING AND PROPOSED SEAWATER DESALINATION FACILITIES ALONG THE CALIFORNIA COAST Member Agency Project Service Area or Project Developer MGD Status Carlsbad Seawater Desalination Project San Diego County Water Authority/Poseidon Water 50 Operational Marina Desalination Plant Marina Coast Water District 0.27 Idle Sand City Coastal Desalination Facility City of Sand City 0.3 Operational Monterey Bay Aquarium Monterey Bay Aquarium Operational Morro Bay Desalination Facility City of Morro Bay 0.6 Idle Diablo Canyon Power Plant Pacific Gas and Electric 0.58 Operational Gaviota Oil Heating Facility Chevron Corporation 0.41 Operational Santa Catalina Island City of Avalon/Southern California Edison Operational San Nicholas Island U.S. Navy Operational West Basin Seawater Desalination Project West Basin Municipal Water District Proposed Huntington Beach Seawater Desalination Project Orange County Water District 50 Proposed DeepWater Desalination Project DeepWater Desal, LLC 25 Proposed Charles Meyer Desalination Plant City of Santa Barbara 2.8 Idle Expanding Diablo Canyon Nuclear Power s Desalination Plant PG&E and San Luis Obispo County 1.5 Proposed Monterey Peninsula Water Supply Project Cal Am, Monterey County, Monterey Peninsula Regional Water Authority, Monterey Peninsula Water Management District 6.4 to 9.6 Proposed The People s Moss Landing Water Desalination Project Nader Agha 12 Proposed Doheny Ocean Desalination Project South Coast Water District and Laguna Beach County Water District 15 to 20 Proposed City of Oceanside City of Oceanside 5 to 10 Proposed Rosarito Beach Seawater Desalination Plant San Diego County Water Authority 25 to 75 Proposed Binational Rosarito Desalination Project NSC Agua and Otay Water District 100 Proposed Total MGD MGD Source: Pacific Institute, December 2015, Available at: Santa Clarita Valley Urban Water Management Plan Page 3-51
278 Section 4: Recycled Water 2015 Santa Clarita Valley Urban Water Management Plan This section of the Plan describes the existing and future recycled water opportunities available to the CLWA service area. The description includes estimates of potential recycled water supply and demand through 2050 in five year increments, as well as CLWA s and the retailer s proposed incentives and implementation plan for recycled water. 4.1 Recycled Water Master Plan In normal years, approximately half of the demand within CLWA s service area is met with imported water, with the balance met with local groundwater provided by the purveyors. However, the reliability of the imported SWP supply is variable (due in part to its dependence on current year hydrology in northern California and prior year storage in SWP reservoirs). When sufficient imported water is not available, the balance is met primarily with additional local groundwater and with water previously stored in water banking programs. It is anticipated that water demands will continue to increase. Accordingly, additional reliable sources of water are being planned to help meet projected water demands. CLWA and the purveyors recognize that recycled water is an important and reliable source of additional water that should be pursued as an integral part of the Valley s water supply portfolio. Recycled water enhances reliability in that it provides an additional source of supply and allows for more efficient utilization of groundwater and imported water supplies. Draft Recycled Water Master Plans for the CLWA service area were completed in 1993 and These master plans considered various factors affecting recycled water sources, supplies, users and demands so that CLWA could develop a cost-effective recycled water system within its service area. In 2007, CLWA completed CEQA analysis of the 2002 Recycled Water Master Plan (RWMP). This analysis consisted of a Programmatic EIR covering the various phases for a recycled water system as outlined in the RWMP. The Programmatic EIR was certified by the CLWA Board in March CLWA is in the process of updating the RWMP based on recent developments affecting recycled water sources, supplies, uses and demands. A draft of the updated RWMP is anticipated in summer of 2016, and is scheduled to be finalized by October 2016, with a new Programmatic EIR completed by December The supply and demand estimates contained herein are based in part on the information available from the updated RWMP (RWMP Update, Kennedy/Jenks 2016). Table 4-1 provides a list of entities that participate in the implementation of the RWMP and RWMP Update. In accordance with Water Code section 10633, the preparation of this Plan was also coordinated with these entities. Santa Clarita Valley Urban Water Management Plan Page 4-1
279 2015 Santa Clarita Valley Urban Water Management Plan TABLE 4-1 PARTICIPATING ENTITIES (a) Participating Entities Role in Plan Development Castaic Lake Water Agency Wholesale water provider Newhall County Water District Retail water purveyor Santa Clarita Water Division Retail water purveyor Valencia Water Company Retail water purveyor Los Angeles County Waterworks District No. 36 Retail water purveyor Santa Clarita Valley Sanitation District Recycled water supplier Berry Petroleum Potential recycled water supplier City of Santa Clarita (b) Potential recycled water supplier Notes: (a) The Newhall Ranch Water Reclamation Plant would serve the Newhall Ranch Specific Plan. A new County Sanitation District is anticipated to be created to operate and maintain the plant. (b) The City of Santa Clarita will eventually operate the Vista Canyon Water Reclamation Plant. CLWA has constructed Phase I of the 2002 RWMP (Kennedy/Jenks 2002), which is designed to deliver up to 1,700 AFY of water to the VWC service area (Phase 1 as constructed currently delivers about AFY). Deliveries of recycled water began in 2003 for irrigation water supply at a golf course and in roadway median strips. In 2015, recycled water deliveries were 450 AF. Phase 2 is planned to expand recycled water use within Santa Clarita Valley and consists of four projects currently in various stages of design. Additional details are presented in Section 4.6 Recycled Water Demand. All of the available recycled water in the peak summer months is anticipated to be used to meet demands that include existing Phase 1 projects, Phase 2 expansions currently in design, planned developments (including Newhall Ranch and Vista Canyon) and future nearby customers served by extending off the Phase 2 system. 4.2 Existing Wastewater Treatment Facilities The Santa Clarita Valley Sanitation District (SCVSD) of Los Angeles County owns and operates two Water Reclamation Plants (WRPs), the Saugus WRP and the Valencia WRP, within the CLWA service area. The water is treated to tertiary levels and, with the exception of water used in Phase I of the RWMP, is discharged to the Santa Clara River. The Newhall Ranch and Vista Canyon developments are also planning to construct WRPs, and non-potable recycled water from these sources when available may be incorporated directly into the recycled water system. The Valencia WRP, completed in 1967, is located on The Old Road near Magic Mountain Amusement Park. The Valencia WRP has a current treatment capacity of 21.6 million gallons per day (MGD), equivalent to 24,190 AFY, developed over time in stages. In 2014, the Valencia WRP produced an average of 13.8 MGD (15,460 AFY) of tertiary recycled water. Use of recycled water from the Valencia WRP is permitted under Los Angeles Regional Water Quality Control Board (LARWQCB) Order Nos and The Saugus WRP, completed in 1962, is located southeast of the intersection of Bouquet Canyon Road and Soledad Canyon Road. The Saugus WRP has a current treatment capacity of 6.5 MGD (7,280 AFY). No future expansions are possible at the plant due to space limitations at the site. In 2014, the Saugus WRP produced an average of 5.5 MGD (6,160 AFY) of tertiary recycled water. Use of recycled water from this facility is permitted under LARWQCB Santa Clarita Valley Urban Water Management Plan Page 4-2
280 Order Nos and Santa Clarita Valley Urban Water Management Plan The Saugus and Valencia WRPs operated independently of each other until 1980, at which time the two plants were linked by a bypass interceptor. The interceptor was installed to transfer a portion of flows received at the Saugus WRP to the Valencia WRP. Together, the Valencia and Saugus WRPs have a design capacity of 28.1 MGD (31,470 AFY). In 2014 they produced an average of 19.3 MGD (21,560 AFY). The primary sources of wastewater to the Saugus and Valencia WRPs are domestic. Both plants are tertiary treatment facilities and produce high quality effluent. Historically, the effluent from the two WRPs has been discharged to the Santa Clara River. The Saugus WRP effluent outfall is located at Bouquet Canyon Road. Effluent from the Valencia WRP is discharged to the Santa Clara River at a point approximately 2,000 feet downstream (west) of The Old Road Bridge. 4.3 Wastewater Treatment Facility Improvements and Expansions To accommodate anticipated growth in the Santa Clarita Valley, the SCVSD projects average daily wastewater flow rates to determine the design capacity of their wastewater treatment facilities. The Santa Clarita Valley Sanitation District Chloride Compliance Facilities Plan and EIR (LACSD 2013) estimated future wastewater flow within the SCVSD s service area based on population statistics published by SCAG and a GPCD specific to the SCVSD s service area. An 80 GPCD was assumed for future flow projections along with the average residential and commercial wastewater flow measured at the Valencia and Saugus WRPs divided by the number of people who were served. The results of the SCVSD wastewater flow and required capacity analysis are shown in Figure 4-1. Santa Clarita Valley Urban Water Management Plan Page 4-3
281 2015 Santa Clarita Valley Urban Water Management Plan FIGURE 4-1 SANTA CLARITA VALLEY SANITATION DISTRICT FLOW PROJECTIONS AND PLANNED EXPANSION Source: Santa Clarita Valley Sanitation District Chloride Compliance Facilities Plan and EIR (2013) Figure 4-3 Projected Wastewater Flow for the SCVSD Planning Area; refer to Section 4.4 for information about the recent trial court decision regarding this EIR. The current combined capacity of the SCVSD system is 28.1 MGD (31,470 AFY), of which 21.6 MGD (24,190 AFY) can be treated at Valencia WRP and 6.5 MGD (7,280 AFY) at Saugus WRP. The current capacity is sufficient to treat influent flows until approximately 2036, at which time planned expansion at the Valencia WRP would bring the total system treatment capacity to 34.1 MGD (38,190 AFY). No expansion is planned at the Saugus WRP. A third Valley reclamation plant, the Newhall Ranch WRP, is proposed as part of the Newhall Ranch project. This proposed facility would be located near the western edge of the development project along the south side of State Route 126. The Newhall Ranch WRP would serve the Newhall Ranch Specific Plan and a new County Sanitation District would be created to operate and maintain the Newhall Ranch WRP. The Newhall Ranch WRP is anticipated to produce 3.7 MGD (4,140 AFY) of recycled water, which would be available to meet a portion of the 7,200 AFY of non-potable demands anticipated for the development at buildout (GSI, 2016). Recycled water from the Valencia WRP would be used to meet the remainder of the nonpotable demands there, to the extent available. If for any reason, however, recycled water supplies from the Valencia WRP and/or other local WRPs were not available in the amounts identified in Section 4.4 (Table 4-3) to meet the projected demands for recycled water, other Santa Clarita Valley Urban Water Management Plan Page 4-4
282 2015 Santa Clarita Valley Urban Water Management Plan sources of supply available to CLWA and the water purveyors as provided in this Plan would be utilized to serve non-potable demands until such time as recycled water supplies may become available. A fourth Valley reclamation plant, the Vista Canyon Water Factory, is proposed as a part of the Vista Canyon Project. This proposed facility would be located near Highway 14, just south of the Santa Clara River and will eventually be operated by the City of Santa Clarita. The plant is anticipated to come online in 2017 and would have an ultimate capacity of 0.40 MGD (450 AFY). The Vista Canyon Development is anticipated to use 137 AF of the recycled water supply and the remaining excess flow would be available for reuse by SCWD as part of Phase 2B of the RWMP. Table 4-2 summarizes the total production from the Valley s existing and proposed WRPs. For planning purposes, it was assumed in this analysis that the Newhall Ranch WRP would initially become available by 2025, with the WRP design capacity incrementally increased to accommodate wastewater generated from the development and reaching its full production by Prior to Newhall Ranch WRP being available, Newhall Ranch-generated wastewater would be temporarily treated at the Valencia WRP, based on the need to build up an adequate, steady flow of wastewater before constructing the initial increment of capacity at Newhall Ranch WRP. The Valencia WRP has sufficient capacity to tertiary-treat wastewater from Newhall Ranch during this interim period, consistent with the Interconnection Agreement approved by SCVSD in Expansion of the Valencia WRP and implementation of the proposed facilities are projected to provide surplus WRP capacity beyond 2050, based on estimated wastewater generation rates. Santa Clarita Valley Urban Water Management Plan Page 4-5
283 2015 Santa Clarita Valley Urban Water Management Plan TABLE 4-2 PROJECTED WRP PRODUCTION WRP Production Capacity Valencia WRP WRP Treatment Capacity (MGD) WRP Treatment Capacity (AF) (a) 15,350 16,350 17,250 18,260 19,150 20,050 20,950 Saugus WRP WRP Treatment Capacity (MGD) WRP Treatment Capacity (AF) (a) 6,050 6,050 6,050 6,050 6,050 6,050 6,050 Proposed Newhall Ranch WRP (b) WRP Treatment Capacity (MGD) WRP Treatment Capacity (AF) (a) 110 1,570 3,020 4,140 4,140 4,140 4,140 Proposed Vista Canyon WRP (c) WRP Treatment Capacity (MGD) WRP Treatment Capacity (AF) (a) Total WRP Production Capacity (AF) 21,960 24,420 26,770 28,900 29,790 30,690 31,590 Notes: (a) AF values rounded to the nearest 10. (b) For the purpose of this analysis it is assumed that the Newhall Ranch WRP will incrementally increase its design capacity to accommodate the developments as completed and be at full production by (c) For the purpose of this analysis it is assumed that the Vista Canyon Water Factory will be at full production by Santa Clarita Valley Urban Water Management Plan Page 4-6
284 2015 Santa Clarita Valley Urban Water Management Plan 4.4 Recycled Water Supply and Demand The use of wastewater effluent from the WRPs is limited by various state water laws, codes and court decisions. These regulatory limitations are described in greater detail in the RWMP Update (refer to Section 4.5 in the RWMP Update). CLWA has a current contract with the SCVSD to use 1,700 AFY of recycled water from the Valencia WRP. CLWA was granted a temporary increase in recycled water allotment for FY and FY to support the use of recycled water for construction activities, which increased the total allotment to 2,200 AFY. Future increases in recycled water use beyond 1,700 AFY would require a new contract with the SCVSD, and would depend on the amount of effluent available after required discharge to the Santa Clara River, with that discharge based on meeting anticipated instream flow requirements to protect biological resources in the river and potential water rights issues related to downstream legal users of water. SCVSD has prepared initial technical analyses showing that 13 MGD (14,560 AFY) of discharge to the Santa Clara River will be required to sustain biological resources (SCVSD 2013). For the purpose of the RWMP Update, that amount is assumed to be met by maintaining 8.5 MGD (9,520 AFY) of discharge to the river at the Valencia WRP and 4.5 MGD (5,040 AFY) of discharge at the Saugus WRP. From a long term regional water supply planning perspective, recycled water supplies that are not obligated to be discharged to the river have been identified as supplies that could be available for non-potable reuse within Santa Clarita Valley. Additional information regarding recent factors having the potential to affect the availability of recycled water supplies is provided below. Specifically, a recent trial court decision has indicated that SCVSD s technical analyses regarding the discharge level of 13 MGD require additional detail. Such studies may result in higher or lower quantities of water being available. Table 4-3 below provides the projected wastewater flows in each retail water purveyor s service area, as well as current and projected potential recycled water supplies and demands. As noted above, the amount of wastewater available for WRP treatment was estimated by the SCVSD for the purpose of its planned WRP expansion based on an assumed wastewater generation rate of 80 GPCD; the recycled water supply assessment in Table 4-3 assumes a conservative 65 GPCD for planning purposes. Information from the SCVSD indicates that for the last five years, the per capita generation rate has been lower. This results in a lower estimated wastewater effluent volume from the WRPs in the RWMP Update than the current volume being used by the SCVSD for its wastewater capacity planning purposes, which is conservative in terms of assumed available supply. Santa Clarita Valley Urban Water Management Plan Page 4-7
285 2015 Santa Clarita Valley Urban Water Management Plan TABLE 4-3 PROJECTED RECYCLED WATER SUPPLY AND DEMAND (AF) Projected Populations (a) LACWWD 36 9,000 10,800 12,500 14,300 16,000 17,800 19,500 NCWD 49,000 52,200 55,500 58,800 62,000 65,300 68,500 SCWD 131, , , , , , ,500 VWC 99, , , , , , ,900 Total Projected Populations 289, , , , , , ,400 Wastewater Generation LACWWD ,078 1,205 1,339 1,465 NCWD 3,735 3,961 4,195 4,432 4,669 4,912 5,148 SCWD 10,024 10,562 11,097 11,647 12,214 12,773 13,339 VWC 7,592 9,082 10,568 11,752 11,739 11,727 11,716 Total Wastewater Generated (AF) (b) 22,037 24,425 26,805 28,909 29,826 30,751 31,668 Total Wastewater Treated (AF) (c) 22,037 24,425 26,805 28,909 29,826 30,751 31,668 Projected Recycled Water Supply Valencia WRP 15,350 16,350 17,250 18,260 19,150 20,050 20,950 Saugus WRP 6,050 6,050 6,050 6,050 6,050 6,050 6,050 Proposed Newhall Ranch WRP 110 1,570 3,020 4,140 4,140 4,140 4,140 Proposed Vista Canyon WRP Total Projected Recycled Water Effluent 21,960 24,420 26,770 28,900 29,790 30,690 31,590 Instream Flow Requirement (d) -14,560-14,560-14,560-14,560-14,560-14,560-14,560 Recycled Water Available For Use 7,400 9,860 12,210 14,340 15,230 16,130 17,030 Projected Recycled Water Demand (e) LACWWD NCWD SCWD VWC 715 4,833 7,304 9,281 9,281 9,281 9,281 Total Projected Recycled Water Demand 1,015 5,606 8,077 10,054 10,054 10,054 10,054 Notes: (a) From Table (b) Based on projected populations and an estimated wastewater generation rate planning factor of 65 GPCD. (c) Lesser of Wastewater Generated and Total WRP Production Capacity (Table 4-2). (d) 13 MGD (14,560 AFY) required discharge per SCVSD (e) Projected recycled water demand based on implementation of complete build-out system described in the RWMP Update. Projections reflect that portion of the irrigation demands identified in Tables 2-3 to 2-6 that can cost-effectively be served. Santa Clarita Valley Urban Water Management Plan Page 4-8
286 2015 Santa Clarita Valley Urban Water Management Plan As noted above, the use of recycled water from the WRPs is limited and can be affected by various state water laws, codes, and regulatory and court decisions, which are summarized in the RWMP Update. The production, discharge, distribution, and use of recycled water are subject to federal, state, and local regulations; the primary objectives of which are to protect public health. Appendix B of the RWMP summarizes the regulatory requirements and their administration, with an emphasis on regulations relating to the distribution and use of recycled water in California. Use of recycled water from the Valencia and Saugus WRPs is permitted under Los Angeles RWQCB Order Nos and 87-49, respectively. Copies of these recycled water permits along with SCVSD Ordinances and Requirements for Recycled Water Users in Santa Clarita Valley and Los Angeles County Department of Public Health (LACDPH) guidelines and inspection requirements are provided in the Santa Clarita Valley Rules and Regulations Handbook (Kennedy/Jenks 2016b). A specific example of how recycled water supplies can be affected by legal and regulatory factors is the recent March 9, 2016 Judgment entered by the Los Angeles Superior Court in Affordable Clean Water Alliance v. Santa Clarita Valley Sanitation District of Los Angeles (Los Angeles County Superior Court Case No. BS145869). At issue in that case was the SCVSD s approval of its Chloride Compliance Facilities Plan (Facilities Plan) and Environmental Impact Report (FEIR) for the Facilities Plan. By way of background, the SCVSD prepared the Facilities Plan and FEIR to comply with the Upper Santa Clara River Chloride TMDL (Chloride TMDL) adopted by LARWQCB. As adopted by LARWQCB, the Chloride TMDL imposes a chloride limit of 100 mg/l for the treated recycled water discharged to the Santa Clara River. The Facilities Plan and FEIR analyzed four alternatives to reduce chloride (salts) in the recycled water before being discharged into the River in order to comply with the Chloride TMDL. Another important objective of the Facilities Plan is to provide treated recycled water to CLWA to be used for non-potable municipal and industrial uses, including but not limited to irrigation and potential groundwater recharge. Currently the SCVSD discharges approximately 19.5 MGD of treated recycled water into the River. Under the Facilities Plan and FEIR, the SCVSD would be required to discharge 13 MGD of recycled water into the River, while some or all of the remaining supply would be made available to CLWA for reasonable and beneficial non-potable use in accordance with State law and policy to maximize the use of recycled water. The discharge of 13 MGD to the River was determined to be an amount sufficient to avoid harm to biological resources in the River, including the endangered fish species known as the unarmored threespine stickleback (stickleback). As noted above, the FEIR analyzed four alternatives to meet the dual purposes of reducing chloride and increasing the use of recycled water to help offset demands for potable water in the Santa Clarita Valley. Alternatives 1 through 3 proposed various combinations of chloride reduction technologies to directly meet the Chloride TMDL, although they varied in the method for disposing the brine byproduct from additional chloride treatment. Alternative 4 focused on reducing chloride on a watershed basis (according to the Alternative Water Resource Management approach, or AWRM) rather than meeting the specific Chloride TMDL at the point of discharge to the River. The FEIR evaluated the Alternatives according to a variety of criteria such as potential environmental impacts, costs, risks, and time for implementation. Initially Alternative 4 was topranked and recommended by SCVSD staff. Alternative 2 (involving brine disposal by deep well injection into the subsurface) was second-ranked as a backup to Alternative 4. At the time the SCVSD initially met to consider approval of the Facilities Plan and FEIR. In October 2013, the District received a letter from Ventura County stakeholders withdrawing their support for Alternative 4. Subsequently, the SCVSD conducted a public hearing wherein it certified the Santa Clarita Valley Urban Water Management Plan Page 4-9
287 2015 Santa Clarita Valley Urban Water Management Plan FEIR and approved Alternative 2. When SCVSD later became aware that the site analyzed for the deep well injection of brine was unavailable due to the imposition of a conservation easement, the District voted to abandon the injection sites under Alternative 2. In the trial court case cited above, the petitioner Affordable Clean Water Alliance (ACWA) challenged the SCVSD s approvals of the FEIR and Alternative 2, based mainly on concerns that the District did not adequately analyze the environmental impacts of the recycled water discharge of 13 MGD to the River. The trial court agreed that the SCVSD s approval of Alternative 2 must be set aside because the District has already abandoned that alternative. (Decision at p. 12.) With regard to the FEIR, the trial court did not determine that the SCVSD s analyses were necessarily wrong about whether the recycled water discharge of 13 MGD would impact the protected stickleback populations and its habitat in the River. However, the court ruled that the SCVSD s analysis did not contain enough detail. As explained in the court s decision, the SCVSD prepared a Reduced Discharge Technical Study (Study) in support of the Facilities Plan and the FEIR to identify a discharge amount from the WRPs that would not result in a significant impact to protected species. Among other things, the Study evaluated hydrology, biological species and habitat, and river morphology in relation to the proposed discharge of 13 MGD. According to the trial court, the Study also included an in-river survey that was performed in 2009 showing the presence and location of sticklebacks, and relied in part for its conclusions about available stickleback habitat on a comparison of 1995 and 2008 aerial photos of the River s configuration. The court noted that the Study included a complete, recent assessment of stickleback issues and that the team of professionals who prepared the Study included two of the foremost experts on stickleback. (Decision at p. 15.) The court found that the SCVSD complied with CEQA and its obligation as a lead agency to include information in the FEIR that was recommended by the California Department of Fish and Wildlife. (Decision at p. 16.) The court further held that the SCVSD is not required to remedy the impacts to stickleback that may have occurred over the years, but is only required to reduce the impact of the proposed recycled water discharge on stickleback when considered with other cumulative effects. (Decision at p. 20.) Moreover, the court determined that the FEIR contained substantial evidence to support the SCVSD s conclusion that the stickleback populations are roughly equivalent now to what they were in the 1990s, when the level of recycled water discharge to the River was about 13 MGD. (Decision at p. 20.) Thus, in several respects the trial court ruled that the FEIR analysis was sufficient. Yet ultimately the court ruled that more specific details were needed to support the SCVSD s conclusion that reduced recycled water discharge levels will not impact stickleback habitat or populations. (Decision at p. 21.) In November 2015, the SCVSD released a draft Supplemental Environmental Impact Report (SEIR) for the chloride compliance project to meet the chloride discharge limits established by the LARWQCB. According to SCVSD, the project will utilize new reverse osmosis equipment at the Valencia WRP, and limited trucking of concentrated brine to an existing industrial facility, the Los Angeles County Sanitation Districts Joint Water Pollution Control Point in Carson. The SEIR provides responses to all comments received during the public comment period and concludes that the modified chloride compliance project would not result in any significant impacts to the environment. On March 23, 2016, the SCVSD Board recertified the 2013 EIR as augmented by the SEIR and approved the modified chloride compliance project. The SCVSD has indicated that in order to avoid delays in meeting the chloride compliance deadline, the recycled water reuse component is not part of the modified chloride compliance project, and that the recycled water component will be separately considered by the SCVWD Board after further environmental and public review in a separate environmental document. Santa Clarita Valley Urban Water Management Plan Page 4-10
288 2015 Santa Clarita Valley Urban Water Management Plan The decision by SCVSD to approve the modified chloride compliance project has been challenged in a separate lawsuit filed in Los Angeles Superior Court on or about April 20, 2016 entitled Affordable Clean Water Alliance v. Santa Clarita Valley Sanitation District of Los Angeles (Los Angeles County Superior Court Case No. BS161742). According to the court docket, that case is in its early stages and has not been fully presented to or decided by the Superior Court. Furthermore, in the first lawsuit described above (Affordable Clean Water Alliance v. Santa Clarita Valley Sanitation District of Los Angeles (Los Angeles County Superior Court Case No. BS145869), on June 2, 2016 the Superior Court issued a subsequent ruling that the SCVSD cannot take further action on its modified chloride compliance project until it completes the additional environmental review that the court required in its ruling dated March 9, 2016 as discussed above. The trial court decision in Affordable Clean Water Alliance v. Santa Clarita Valley Sanitation District of Los Angeles raises important policy issues with respect to the role and potential uses of recycled water in the Valley. For example, California s Water Recycling Law (Water Code section et seq.) provides, in part: It is hereby declared that the people of the state have a primary interest in the development of facilities to recycle water containing waste to supplement existing surface and underground water supplies and to assist in meeting the future water requirements of the state. The Legislature finds and declares that a substantial portion of the future water requirements of this state may be economically met by beneficial use of recycled water. The Legislature further finds and declares that the utilization of recycled water by local communities for domestic, agricultural, industrial, recreational, and fish and wildlife purposes will contribute to the peace, health, safety and welfare of the people of the state. It is the intention of the Legislature that the state undertake all possible steps to encourage development of water recycling facilities so that recycled water may be made available to help meet the growing water requirements of the state. (Water Code ) These and other state laws and policies demonstrate that recycled water must be used for multiple purposes, and not only in support of fish and wildlife. This is particularly the case in the Santa Clarita Valley, where a substantial portion of the recycled water is comprised of return flows from imported water that otherwise would not exist in the Santa Clara River watershed. Table 4-3 above illustrates the importance of recycled water and the critical role it has the potential to play in the Valley. While the trial court decision above affects the ability of this Plan to specify how much recycled water will be available from the Valencia WRP, it appears reasonably likely that supplies will be available from that facility once a minimum discharge amount to the River is established according to further environmental and public review as noted by the SCVSD. Furthermore, Table 4-3 shows that planned recycled water supplies from the Newhall Ranch and Vista Canyon WRPs, which would not require discharge to the Santa Clara River, will be available to meet a considerable portion of the total projected long-term recycled water demands. In accordance with the UWMP Act, this Chapter and other portions of the Plan describe and quantify the potential uses of recycled water in the Valley based on the Santa Clarita Valley Urban Water Management Plan Page 4-11
289 2015 Santa Clarita Valley Urban Water Management Plan substantial wastewater flows and recycled water generated by the local WRPs. However, as noted above, if recycled water supplies from the Valencia WRP and/or other local WRPs are not available in the amounts identified in Table 4-3 to meet potential uses because of regulatory or other constraints, other sources of supply available to CLWA and the water purveyors as provided in this Plan would be utilized to meet non-potable demands until such time as recycled water supplies may become available. 4.5 Other Potential Sources of Recycled Water Oilfield produced water is a by-product of oil production generated when oil is extracted from the oil reservoir. It is generally of poor quality and unsuitable for potable, industrial or irrigation use without treatment. Because of the poor water quality, reinjection has often been the most costeffective disposal option. Treatment processes can produce potable quality water; yet, because of the poor initial water quality and the organic constituents, it is often more appropriate for treated oilfield produced water to be used for irrigation or industrial purposes to offset potable water demand. The economics of oil production are market-driven and are different from those of drinking water supplies. As oil prices rise or drop, oilfield production is increased or decreased as dictated by economics. Also, oilfields are eventually depleted of supply and abandoned. Therefore, while oilfield produced water should be considered as long-term, it is not a completely firm supply and is not permanent. Berry Petroleum has expressed interest in the past in treating oilfield produced water from the Placerita Oilfield for sale to CLWA for non-potable uses. Studies of the potential reuse of treated oilfield produced water from the Placerita Oilfield have indicated that approximately 44,000 barrels per day (1.8 MGD or 2,016 AFY) of treated oilfield produced water may be available. Pilot studies performed at the Placerita Oilfield have indicated that, even with reverse osmosis (RO) treatment, some organic compounds such as naphthalene, 2-butanone and ethylbenzene can be detected in the RO effluent. For irrigation reuse, the produced water would need to be cooled and treated to remove hardness, silica, total dissolved solids (TDS), boron, ammonia and total organic carbon (TOC). Due to water reliability and water quality issues, the use of oilfield produced water for a source of recycled water was not considered in the 2016 Salt and Nutrient Management Plan (SNMP) or in the RWMP Update, and is not included as a supply opportunity in this UWMP. 4.6 Recycled Water Demand Currently, recycled water is served to landscape irrigation customers, including the Tournament Players Club Golf Course. Potential recycled water users have been identified through a number of sources including: 1993 Recycled Water Master Plan Water consumption records for LACWWD 36, NCWD, SCWD and VWC Land use maps General Plans and Specific Plans for the City of Santa Clarita and County of Los Angeles Discussions with City, County, water purveyor and land developer staff Santa Clarita Valley Urban Water Management Plan Page 4-12
290 2015 Santa Clarita Valley Urban Water Management Plan On-site surveys of the CLWA service area 2002 Recycled Water Master Plan 2016 Recycled Water Master Plan Update (in development) In order to be considered as a potential recycled water user, the user has to be located within CLWA s service area and have a potential non-potable water demand of at least 50,000 gallons per day. At this time no specific or Valley-wide ordinance(s) or other enactments are proposed that would require the installation of dual distribution systems for recycled water, or that would require the use of recycled water for recirculating uses. A total existing demand of approximately 12,000 AFY (based on current non-potable uses from irrigation meters) and a future demand of 8,200 AFY (based on planned developments), totaling approximately 20,200 AFY are identified in the RWMP Update. The potential available recycled water supply is 6,268 AF in 2015 and 17,108 AF in the year 2050 (Table 4-3); however, this entire supply cannot be cost-effectively used due to the variability in demand during the year (i.e., summer vs. winter) for recycled water use within the CLWA service area. Moreover, recent legal and regulatory factors limit the ability of this Plan to specify or rely upon exactly how much recycled water may be available from the Valencia WRP, although it appears reasonably likely that supplies will be available from that facility once a minimum discharge amount to the Santa Clara River is established according to further environmental and public review as noted by the SCVSD. The majority of recycled water uses are projected to be landscape and golf course irrigation, both of which have high demands in the summer and low demands in the winter. In optimizing the customers served to eliminate the need to provide a backup supply of potable water in the summer, an anticipated 10,054 AFY is planned to be served in As noted above, Phase 1 of the RWMP has been constructed and begins with a 4,000 gpm pump station at the Valencia WRP that connects to a 1.5 MG reservoir in the Westridge area with 15,600 linear feet of 24- and 20-inch pipeline. It serves landscape customers along The Old Road and the Tournament Players Club golf course, all of which are VWC customers. Four projects planned to expand recycled water use within Santa Clarita Valley, which are collectively known as Phase 2, are depicted in Figure 4-2, and are currently in various stages of design. Santa Clarita Valley Urban Water Management Plan Page 4-13

291 2015 Santa Clarita Valley Urban Water Management Plan FIGURE 4-2 RECYCLED WATER MASTER PLAN PHASES Santa Clarita Valley Urban Water Management Plan Page 4-14
292 2015 Santa Clarita Valley Urban Water Management Plan Phase 2A, 2C and 2D would use recycled water from the Valencia WRP and Phase 2B would use recycled water produced at the Vista Canyon Water Factory, which is being constructed to treat flows from the planned Vista Canyon Development. Phase 2A would serve Central Park and customers along the path from the Valencia WRP to the park. Phase 2B would serve the proposed Vista Canyon Development and nearby irrigation customers. Phase 2C would serve Valencia Country Club, Vista Valencia Golf Course, College of the Canyons, California Institute of the Arts, Hart High School, and Newhall Elementary School. Phase 2D would serve Ranch Pico Junior High School and customers along the way. Anticipated annual demands, completion dates and purveyors for each phase are listed below: Phase 2A: 560 AFY in 2024 (224 AFY in SCWD and 336 AFY in VWC) Phase 2B: 300 AFY in 2018 (163 AFY in SCWD and 137 AFY in Vista Canyon Development) Phase 2C: 1,374 AFY in 2020 (249 AFY in NCWD and 1,125 AFY in VWC) Phase 2D: 186 AFY in 2019 (186 AFY in VWC) Other planned future developments and their anticipated annual demands, dates for construction of facilities to deliver the recycled water, and purveyors include: Newhall Ranch: 4,840 AFY (VWC) by 2023 Westside Communities (Entrada North and South, Commerce Center Expansion, Legacy Village): 2,344 AFY (VWC) by 2024 Northlake Development: 800 AFY (NCWD) by 2030 Val Verde Community Regional Park: 50 AFY (LACWWD 36) by 2030 Sand Canyon Development: 95 AFY (SCWD) with a construction completion date yet to be determined Five Knolls Development: 152 AFY (SCWD) with a construction completion date yet to be determined Future recycled water use expansion beyond Phase 2 is being explored as part of the RWMP Update and would include extensions off the Phase 2 alignments to utilize available effluent from the Valencia WRP. Currently there is no plan to use recycled water from the Saugus WRP since the majority of the effluent is committed to meeting discharge requirements in the Santa Clara River. The RWMP Update also includes a high level assessment of opportunities for potable reuse within the Santa Clarita Valley via groundwater recharge, surface water augmentation and direct potable reuse. Groundwater recharge ( indirect potable reuse ) via surface spreading at an offstream location near the Santa Clara River could provide for recharge of excess available recycled water in the winter and off-peak irrigation months. A more detailed feasibility study would be required to confirm the volume of recycled water that could be Santa Clarita Valley Urban Water Management Plan Page 4-15
293 2015 Santa Clarita Valley Urban Water Management Plan recharged and recovered based on current regulations, source water quality, operational and cost considerations. Surface water augmentation at Castaic Lake would require full advanced treatment of the recycled water from SCVSD, brine disposal and significant conveyance requirements at a very high cost. It is also uncertain at this time whether a surface water augmentation project would be able to meet applicable regulatory criteria and how much water could be augmented. Direct potable reuse (DPR), though not currently permitted in California, would involve the purposeful introduction of highly purified recycled water into a drinking water supply, immediately upstream of a drinking water treatment plant or directly into the potable water supply distribution system downstream of a water treatment plant. A DPR concept could potentially utilize recycled water not already allocated or planned for non-potable reuse or determined necessary for instream use, and would require full advanced treatment of the recycled water from SCVSD, brine disposal and only minimal conveyance requirements. CLWA and the purveyors intend to track direct potable reuse developments in California and revisit the feasibility DPR in the future. 4.7 Recycled Water Comparison The 2010 UWMP projected a total recycled water demand of 1,300 AFY by the year Actual data shows 450 AF was served in 2015, of which 393 AF served Tournament Players Club Golf Course and 57 AF served other landscaping. Current demand is lower than originally predicted due to lack of funding available to expand the recycled water distribution system. Table 4-4 provides a comparison of the 2010 projected demand versus the actual 2015 demand. TABLE 4-4 RECYCLED WATER USES - PROJECTION COMPARED WITH ACTUAL USE (AFY) User Type 2010 Projection for Use Landscape Golf Course Landscape Total 1, Methods to Encourage Recycled Water Use Currently, to the extent feasible the purveyors are offering recycled water as available at a lower rate to encourage the use of recycled water and to help offset some of the conversion costs. CLWA and the purveyors are discussing pricing options to encourage participation in the recycled water program. In addition to pricing incentives CLWA and the purveyors are committed to a Valley-wide messaging regarding recycled water benefits and costs. Other incentives may include financial assistance to offset the costs to convert (or retrofit) potable water systems or the development of a Valley-wide recycled water ordinance, which would require the use of recycled water if available, rather than relying solely on pricing incentives and voluntary connections. These principles are also being considered by agencies participating in the RWMP Update and will be summarized in more detail in the RWMP Update as potential options. Santa Clarita Valley Urban Water Management Plan Page 4-16
294 2015 Santa Clarita Valley Urban Water Management Plan 4.9 Optimization Plan for Recycled Water Currently, the amount of recycled water available from the WRPs is not adequate to meet the total demands of the completed recycled water system, which relates to both infrastructure and regulatory factors. Notably, however, as potable water demands increase in the Valley over time, wastewater flows will increase and the amount of recycled water production to meet future system demands would also increase. Therefore, it is recommended that construction of the recycled water system be phased to utilize the increases in WRP production. A detailed discussion of the recommended phasing plan is provided in the RWMP Update. Phasing implementation of the recycled water system is recommended for the following reasons: A number of the potential recycled water users are future users that do not yet need recycled water. The current amount of recycled water available from the Valencia WRP is not adequate to meet the total demands of all the existing and planned future identified recycled water users (see section 4.6). Capital funding requirements would be spread over current planning period through 2050 for CLWA and the purveyors. The implementation phases are prioritized based on the status of the potential recycled water users (existing or future), the anticipated construction schedule of future users and the proximity of the users to the non-potable water source (e.g., Valencia WRP, Vista Canyon Water Factory and Newhall Ranch WRP). As discussed in Section 4.6, Phase 2A, 2B, 2C and 2D are planned for construction in the next 4 to 10 years, and would increase recycled water deliveries to 2,420 AFY. These projects are being prioritized to take advantage of available funding for recycled water projects under Proposition 1 and to align with the construction schedule for the Vista Canyon Ranch Development. The Newhall Ranch and the Westside Communities Developments represent the next major increase in recycled water use, and are anticipated to be constructed in the next 4 to 23 years. Once these uses are on-line, additional recycled water would not be available supply in the summer months to serve irrigation demands, thus the implementation for future users would be based on the following considerations: Service area boundaries and purveyor involvement Ease or willingness of customers to connect to recycled water Capital and operational costs Funding availability Community impacts and development requirements Supply reliability and system flexibility considerations Santa Clarita Valley Urban Water Management Plan Page 4-17
295 2015 Santa Clarita Valley Urban Water Management Plan Availability of recycled water supplies due to regulatory or other legal constraints 4.10 Additional Considerations Relating to the Use of Recycled Water SCVSD Chloride Compliance Plan Salinity and nutrient management concerns in the Upper Santa Clara River Watershed are primarily driven by salt sensitive crops located downstream. High chloride levels are of particular concern since high value, chloride sensitive crops like strawberries and avocados grown in the lower watershed utilize surface waters or ground water influenced by surface water for irrigation. Findings from previous reports cite the sources of chloride as source waters and residential self-regenerating water-softeners (SRWS). In 2003, SCVSD passed an ordinance banning the installation of all new SRWSs, and by passage of Senate Bill 475, the District has authority to remove all SRWSs remaining in the Santa Clarita Valley that were installed prior to A Total Maximum Daily Load (TMDL) for chloride in the Upper Santa Clara River (Reaches 5 and 6) was adopted by the LARWQCB and became effective on May 5, The Basin Plan Amendment for the chloride TMDL in the Upper Santa Clara River was adopted by the LARWQCB on December 11, The TMDL established waste load allocations of 100 mg/l for the Saugus and Valencia WRPs. The TMDL implementation schedule allows for several special studies to determine whether existing Water Quality Objectives (WQOs) and waste-load allocations for chloride can be revised, and provides for an 11-year schedule to attain compliance with the final water quality objectives and waste-load allocations for chloride. The SCVSD operates the Saugus WRP and Valencia WRP, which discharge highly treated recycled water to the Santa Clara River. The SCVSD spent more than ten years attempting to achieve the most reasonable chloride limit possible and develop the most cost-effective and environmentally responsible solution. In October 2013, the SCVSD Board of Directors completed its Facilities Plan to comply with the State-mandated chloride limit after nearly two years of extensive public input, meetings, hearings, and environmental review. As explained above, the SCVSD s initial approval of the Plan and related EIR were challenged in court. The currently proposed chloride compliance project will add advanced treatment equipment to the Valencia WRP to reduce chloride levels in treated wastewater. Part of the advanced treatment equipment is reverse osmosis, which works by using pressure to push water through a membrane with microscopic openings. The water that has passed through the reverse osmosis membrane becomes ultraclean water and the remaining salty water becomes a byproduct called brine that requires proper disposal. The resulting brine will be concentrated and removed by trucking, likely to the Joint Water Pollution Control Plant in Carson, which treats wastewater from much of the Los Angeles Basin (over 270 MGD) and discharges to the ocean. This plant can easily accommodate the small proposed Santa Clarita brine flow. A Draft SEIR was released for public review in late This document identifies the potential environmental impacts of the proposed brine concentration equipment at the Valencia WRP and the limited trucking operation. Comments on the Draft SEIR were due January 8, On March 23, 2016, the SCVSD Board recertified the 2013 EIR as augmented by the SEIR and approved the modified chloride compliance project. The SCVSD has indicated that in order Santa Clarita Valley Urban Water Management Plan Page 4-18
296 2015 Santa Clarita Valley Urban Water Management Plan to avoid delays in meeting the chloride compliance deadline, the recycled water reuse component is not part of the modified chloride compliance project, and that the recycled water reuse component will be separately considered by the SCVSD Board after further environmental and public review in a separate environmental document. The State has set a strict compliance deadline of July 2019 for the chloride compliance project to be fully operational. As discussed above, SCVSD s approval of the modified chloride compliance project has been challenged in a separate lawsuit filed in Los Angeles Superior Court on or about April 20, 2016 entitled Affordable Clean Water Alliance v. Santa Clarita Valley Sanitation District of Los Angeles (Los Angeles County Superior Court Case No. BS161742). That case is in its early stages and has not been fully presented to or decided by the Superior Court. Furthermore, in the first lawsuit described above (Affordable Clean Water Alliance v. Santa Clarita Valley Sanitation District of Los Angeles (Los Angeles County Superior Court Case No. BS145869), on June 2, 2016 the Superior Court issued a subsequent ruling that SCVSD cannot take further action on its modified chloride compliance project until it completes the additional environmental review that the court required in its ruling dated March 9, 2016 as discussed above in Section 4.4. Resolution No, R14-10, adopted by the LARWQCB in 2014, amends the basin plan for the Santa Clara River watershed (Basin Plan) to add 3-month averaging periods to the chloride water quality objectives to Reach 4B, 5, and 6, and to incorporate conditional site specific objectives (SSOs) for chloride in Reaches 5 and 6 of the Upper Santa Clara River equal to 150 mg/l (as a 3-month average). Further the resolution includes revisions to the Upper Santa Clara River Chloride TMDL to reflect the amended water quality objectives and conditional SSOs (LARWQCB 2014). The Basin Plan amendment adopted under Resolution No. R was approved by the SWRCB in 2014 and by EPA in New surface water quality objectives for Reaches 4B, 5, and 6 of the Santa Clara River are as follows: TABLE 4-5 SANTA CLARA RIVER SURFACE WATER QUALITY OBJECTIVES Reach Chloride (mg/l) Rolling Average Period (a) 3-month 5 (upstream of Valencia WRP outfall 001) 150 (a) 3-month 5 (downstream of Valencia WRP outfall 001) month 4B month Note: (a) The SSO shall apply and supersede the existing water quality objective of 100 mg/l as a 3-month rolling average only when flow weighting projects are in operation by the SCVSD Salt and Nutrient Management Plan The SWRCB adopted a statewide Recycled Water Policy (Policy) on February 3, 2009 to establish uniform requirements for the use of recycled water. The purpose of this Policy is to increase the use of recycled water from municipal wastewater sources that meet the definition in Water Code Section 13050, subdivision (n), in a manner that implements state and federal Santa Clarita Valley Urban Water Management Plan Page 4-19
297 2015 Santa Clarita Valley Urban Water Management Plan water quality laws. As part of this Policy, the preparation of a salt and nutrient management plan for each basin/subbasin in California, including compliance with CEQA and participation by LARWQCB staff is required. The Policy states that salts and nutrients from all sources should be managed on a basin wide or watershed wide basis in a manner that ensures attainment of water quality objectives and protection of beneficial uses. The SWRCB has found that the appropriate way to address salt and nutrient issues is through the development of regional or sub-regional salt and nutrient management plans rather than through imposing requirements solely on individual recycled water projects. These plans must be consistent with the DWR Bulletin 160 as appropriate and must be locally developed. The salt and nutrient plan will include a basin/sub basin-wide monitoring plan that specifies an appropriate network of monitoring locations. The monitoring plan will also be site specific and adequate to provide a reasonable, cost-effective means of determining whether the concentrations of salt, nutrients and other constituents of concern as identified in the salt and nutrient plans are consistent with applicable water quality objectives. CLWA, along with other Upper Santa Clara River Integrated Regional Water Management Plan participants, is currently in the process of preparing a salt and nutrient management plan. The salt and nutrient management plan is intended to fulfill the requirements of the Statewide Recycled Water Policy and provide the framework for the environmentally safe disposal of salts and nutrients that occur in the Upper Santa Clara River groundwater basins in compliance with the Basin Plan. This would be achieved through the implementation of management measures in areas of the groundwater basin where the salt and nutrient loads would exceed the water quality objectives for the sub-basin if recycled water projects were to be implemented. The plan is anticipated to be completed by summer/fall of Water Quality Control Plan (Basin Plan) The Santa Clara River watershed has water quality objectives for the basin established by the LARWQCB, which are included in the Water Quality Control Plan (Basin Plan). Water quality objectives were established, by specific water body or reach, to protect the various beneficial uses within that water body or reach. Table 4-6 shows the water quality objectives for salt and nutrients for the Santa Clara River watershed. Santa Clarita Valley Urban Water Management Plan Page 4-20
298 2015 Santa Clarita Valley Urban Water Management Plan TABLE 4-6 WATER QUALITY OBJECTIVES FOR WATERS IN THE SANTA CLARA RIVER WATERSHED TDS (mg/l) Chloride (mg/l) (a) Sulfate (mg/l) Nitrogen (mg/l) SAR (mg/l) (b) Inland Surface Waters Above Lang gaging station Between Lang gaging station and Bouquet Canyon Road Bridge Between Bouquet Canyon Road Bridge and West Pier Highway (g) Between West Pier Highway 99 and Blue Cut gaging station (g) Between Piru Creek and A Street, Fillmore (c) Between Blue Cut gaging station and Piru Creek, Fillmore (c) Between A Street, Fillmore and Freeman Diversion Dam near Saticoy (d) Between Freeman Diversion Dam near Saticoy and Highway 101 Bridge Between Highway 101 Bridge and Santa Clara River Estuary (e) See Basin Plan Santa Paula Creek above Santa Paula Water Works diversion Dam Sespe Creek above gaging station 500 downstream from Little Sespe Creek Piru Creek above gaging station below Santa Felicia Dam Groundwater Basins Acton Valley ;45;10;1 (f) NA 1.0 Sierra Pelona Valley (Agua Dulce) ;45;10;1 (f) NA 0.5 Upper Mint Canyon ;45;10;1 (f) NA 0.5 Upper Bouquet Canyon ;45;10;1 (f) NA 0.5 Green Valley ;45;10;1 (f) NA - Lake Elizabeth-Lake Hughes area ;45;10;1 (f) NA 0.5 Santa Clara-Mint Canyon ;45;10;1 (f) NA 1.0 South Fork ;45;10;1 (f) NA 0.5 Placerita Canyon ;45;10;1 (f) NA 0.5 Santa Clara-Bouquet and San Francisquito Canyons ;45;10;1 (f) NA 1.0 Castaic Valley ;45;10;1 (f) NA 1.0 Saugus Formation NA - Notes: (a) LARWQCB Order No. R and Resolution No. R (b) SAR = Sodium adsorption ratio. (c) The reach of the Santa Clara River between Blue Cut gaging station and A Street, Fillmore has been split into two reaches, between the confluence of Piru Creek and A Street, Fillmore and between the Blue Cut gaging station and the confluence of Piru Creek under LARWQCB Resolution No. R (d) The chloride objective for this reach has been revised from 80 mg/l to 100 mg/l under LARWQCB Resolution No (e) The reach between Highway 101 bridge and the Santa Clara River Estuary have not be designated with specific water quality objectives. In this case general objectives to protect specific beneficial uses are assigned in the basin plan. (f) 10 mg/l nitrogen (as nitrate + nitrite); 45 mg/l nitrate (as NO 3 ); 10 mg/l nitrate-nitrogen; 1 mg/l nitrite-nitrogen (g) 3-month rolling average (LARWQCB Resolution No. R ) Boron (mg/l) Santa Clarita Valley Urban Water Management Plan Page 4-21
299 Nutrients 2015 Santa Clarita Valley Urban Water Management Plan The LARWQCB previously found that the Santa Clara River was being impacted by ammonia and nitrate plus nitrite (nitrogen compounds) with the primary source being wastewater discharge into the river. Nitrogen compounds can cause or contribute to eutrophic effects such as low dissolved oxygen, algae blooms and reduced benthic macro invertebrates. Three reaches in the Santa Clara River have been identified as impaired due to ammonia (Reaches 3, 7 and 8), two of which exceed Basin Plan water quality objectives. These findings led to a Basin Plan Amendment for a nitrogen compounds TMDL for the Santa Clara River that was adopted on March 23, The TMDL values in the Upper Santa Clara River for ammonia are summarized in Table 4-7 below, and for nitrate plus nitrite in Table 4-8. Following upgraded treatment processes, the 2011 average ammonia levels in the Valencia and Saugus WRP recycled water were 1.02 mg/l and 1.32 mg/l, respectively. The 2011 average nitrate plus nitrite levels in Valencia and Saugus WRP recycled water were 2.60 mg/l and 4.36 mg/l, respectively. These levels are within the regulatory limits and the Santa Clara River is no longer considered to have impairments related to nitrate; the river no longer appears on the 303(d) list for nitrate. TABLE 4-7 TMDL FOR AMMONIA ON THE SANTA CLARA RIVER Reach One-hour NT (mg-n/l) Thirty-day NT (mg-n/l) Reach Reach 7 above Saugus Reach 6 below Valencia Reach 5 at County Line Source: LARWQCB Basin Plan, Chapter 7, Updated December 2011 TABLE 4-8 TMDL FOR NITRATE PLUS NITRITE ON THE SANTA CLARA RIVER Reach Thirty-day Average (mg-n/l) Reach Reaches 3 and 7 above Valencia 4.5 Source: LARWQCB Basin Plan, Chapter 7, Updated December Projected Salt Levels from Recycled Water Salt balances depend on the amount of salt imported and the amount exported. The total salt and nutrient loads in waste water discharges primarily depend on the levels in source waters and the type of treatment process that is used. Recycled water does not import additional salt into the watershed; instead the salt is transferred and cycled within the watershed. Recycled water generally contains salt levels around 50 mg/l above potable water levels. Santa Clarita Valley Urban Water Management Plan Page 4-22
300 2015 Santa Clarita Valley Urban Water Management Plan Within California, agricultural irrigation is the largest consumer of recycled water followed by landscape irrigation, which are also typical uses in the Santa Clara River watershed. However, in the Los Angeles region, which is governed by LARWQCB (Region 4), groundwater recharge is the largest use of recycled water. Table 4-9 represents the amount of salt above baseline levels that will need management. These levels are projected and may vary due to regulatory changes or changes in the source waters. The amounts do not represent the total loading but represent salt that will not be exported from the watershed through discharge into surface waters. Management of salts and nutrients within the watershed is anticipated to be addressed through the Chloride Compliance Plan described in Section and the development of Salt and Nutrient Management Plan discussed in Section TABLE 4-9 PROJECTED SALT LEVELS IN RECYCLED WATER Projected recycled water use (AF) (a) 450 1,015 5,606 8,077 10,054 10,054 10,054 10,054 Non-exported salt levels (tons/yr) (b)(c)(d) ,428 1,777 1,777 1,777 Notes: (a) From Table 4-3. (b) Amounts are in addition to baseline levels. (c) Assumes the average salt concentration in effluent from the Valencia and Saugus WRPs is 130 mg/l (SCVSD, 2013). (d) Based on the following conversions: 1,233,481 L/AF; 1.10e-09 tons/mg; 130 mg/l. Santa Clarita Valley Urban Water Management Plan Page 4-23
301 Section 5: Water Quality 2015 Santa Clarita Valley Urban Water Management Plan 5.1 Overview The quality of any natural water is dynamic in nature. This is true for both the SWP and the local groundwater of the Basin. During periods of intense rainfall or snowmelt, routes of surface water movement are changed and new constituents are mobilized and enter the water while other constituents are diluted or eliminated. The quality of water changes over the course of a year. These same basic principles apply to groundwater. Depending on water depth, groundwater will pass through different layers of rock and sediment and potentially leach different materials from those strata. Water depth is a function of recharge from local rainfall and snowmelt and withdrawal from groundwater pumping. During periods of drought, the mineral content of groundwater increases. Water quality is not a static feature of water, and these dynamic variables must be recognized. Water quality regulations also change. This is the result of the discovery of new contaminants, changing understanding of the health effects of previously known as well as new contaminants, development of new analytical technology and the introduction of new treatment technology. All water suppliers are subject to drinking water standards set by the USEPA and the SWRCB DDW, formerly the California Department of Public Health (DPH). Additionally, each year prior to July 1 st, a Consumer Confidence Report (CCR) or Water Quality Report is provided to all Valley residents who receive water from CLWA and one of the four retail water purveyors. That report includes detailed information about the results of quality testing of the groundwater and treated SWP water supplied during the preceding year (CCR, Water Quality Report 2015). Water quality is also addressed in the annual Santa Clarita Valley Water Report, which describes the current water supply conditions in the Valley and provides information about the water requirements and water supplies of the Santa Clarita Valley. The quality of water received by individual customers will vary depending on whether they receive imported water, groundwater or a blend. Some will receive only imported water at all times, while others will receive only groundwater. Others may receive water from one well at one time, water from another well at a different time, different blends of well and imported water at other times, and only imported water at yet other times. These times may vary over the course of a day, a week, or a year. This section provides a general description of the water quality of the supplies within the Valley, aquifer protection and a discussion of potential water quality impacts on the reliability of these supplies. 5.2 Water Quality Constituents of Interest CLWA and the purveyors are committed to providing their customers with high quality water that meets all federal and state primary drinking water standards. Some contaminants are naturallyoccurring minerals and radioactive material. In some cases the presence of animals or human Santa Clarita Valley Urban Water Management Plan Page 5-1
302 2015 Santa Clarita Valley Urban Water Management Plan activity can contribute to the constituents in the source waters. The following sections address constituents reported in the 2015 CCR and the 2014 Santa Clarita Valley Water Report (June 2015) that may impact water quality Perchlorate Perchlorate, a chemical used in making rocket and ammunitions propellants as well as flares and fireworks, has been a water quality concern in the Santa Clarita Valley since 1997 when it was originally detected in four wells operated by the purveyors in the eastern part of the Saugus Formation, near the former Whittaker-Bermite facility. In late 2002, the contaminant was detected in a fifth well, this one located in the Alluvial Aquifer (SCWD s Stadium Well) but also located near the former Whittaker-Bermite site, and which was immediately taken out of service. Perchlorate was detected again in early 2005 in a second Alluvial well (VWC s Well Q2) near the former Whittaker-Bermite site, and in 2006 in very low concentrations (below the detection limit for reporting) in a fifth Saugus well (NCWD s NC-13) near one of the originally impacted wells. In response to the detection of perchlorate at alluvial well Q2, VWC removed the well from active service, and commissioned the preparation of an analysis and report assessing the impact of, and response to, the perchlorate contamination of that well. A capture zone analysis utilizing the numerical groundwater flow model was conducted to assess the potential risk of perchlorate migration to Well Q2 and other nearby VWC alluvial wells. This analysis determined that there was a low risk of perchlorate migration to Well Q2, Valencia s response for Well Q2 was to obtain permitting for installation of wellhead treatment, followed by installation of treatment facilities and returning the well to water supply service in October After nearly two years of operation with wellhead treatment, including regular monitoring specified by the DPH, all of which resulted in no detection of perchlorate in Well Q2, VWC requested that DPH allow treatment to be discontinued. DPH approved that request in August 2007, and treatment was subsequently discontinued. DPH-specified monitoring for perchlorate continues at Well Q2; there has been no detection of perchlorate since discontinuation of wellhead treatment. NCWD s Well NC-13 has remained in service with regular sampling per DDW requirements, with no subsequent detections of perchlorate. In 2007, the DPH (which is currently the DDW) established an MCL for perchlorate of 6 micrograms per liter (µg/l). For Saugus wells 1 and 2, DDW has imposed a requirement that perchlorate levels be below the Detection Level for Reporting (DLR) of 4 µg/l. In August 2010, perchlorate was detected in a sixth Saugus well (VWC s Well 201). Confirmation sampling in the months that followed confirmed the detection of perchlorate at concentrations that ranged from 5.7 to 12 µg/l. VWC removed Well 201 from service when perchlorate was first detected and is currently pursuing remediation alternatives for Well 201 that are expected to involve methodologies already employed at other previously impacted wells. Pending regulatory approval by the DDW, it is planned that the approved DDW restoration alternative will be implemented by 2017, resulting in the return of VWC s Well 201 to service. Following the detection of perchlorate in Well 201 in 2010, VWC elected to minimize pumping from a nearby Saugus well (VWC s Well 205) to reduce potential perchlorate Santa Clarita Valley Urban Water Management Plan Page 5-2
303 2015 Santa Clarita Valley Urban Water Management Plan migration. In April 2012, Well 205 was voluntarily taken out of service entirely when perchlorate was detected in low concentrations below the DLR (<4.0 µg/l). This well is planned to resume service as part of the implementation of the restoration and containment program at Well 201. To date, perchlorate has been detected in a total of nine wells, seven located in the Saugus Formation and two in the Alluvium. Table 5-1 summarizes the current remediation status of all wells where perchlorate has been detected. The following is a summary of the status of perchlorate remediation and restoration of perchlorate-impacted groundwater supply. The following discussion is provided to illustrate the work that has occurred over the last 15 years to reactivate the impacted Saugus 1 and Saugus 2 groundwater supply wells, and that has been expanded to include VWC s Wells 201 and 205. The groundwater model that was developed for use in analyzing the operating yield and sustainability of groundwater in the Basin was also used to analyze the capture and control of perchlorate contamination in the originally impacted Saugus wells. As part of the evaluation of the containment system s effectiveness, the Basin groundwater model was updated and recalibrated using actual pumping data. The updated model was also utilized by VWC to evaluate restoration and containment options and select the preferred approach to contain the migration of perchlorate downgradient of the Whittaker-Bermite site and restore VWC s Wells 201 and 205 to service. It is expected that these wells will be returned to service by Santa Clarita Valley Urban Water Management Plan Page 5-3
304 2015 Santa Clarita Valley Urban Water Management Plan TABLE 5-1 STATUS OF IMPACTED WELLS Year Perchlorate Detected Purveyor Well Groundwater Aquifer 1997 SCWD Saugus 1 Saugus 1997 SCWD Saugus 2 Saugus 1997 VWC Well 157 Saugus 1997 NCWD Well 11 Saugus 2002 SCWD Stadium Well Alluvium 2005 VWC Well Q2 Alluvium 2006 NCWD Well NC-13 Saugus 2010 VWC Well 201 Saugus 2012 VWC Well 205 Saugus Status DPH (now DDW) approved well return to service in January 2011; well in active service utilizing approved perchlorate treatment. DPH (now DDW) approved wells return to service in January 2011; well in active service utilizing approved perchlorate treatment. Sealed and capacity replaced by new well. Out of service. Sealed and capacity replaced by new well. DPH (now DDW) approved perchlorate treatment removal in 2005; treatment was installed in 2005 and removed and relocated in 2007 for potential future use; well remains in service with no perchlorate detections. DPH (now DDW) approved annual monitoring, results have always been below the detection limit for reporting; well remains in service. Out of service pending implementation of approved restoration plan with target date of 2016/2017. Voluntarily out of service pending implementation of approved restoration plan for VWC Well 201 with target date of 2016/2017. Saugus 1 and Saugus 2 In 2002 CLWA and the U.S. Army Corps of Engineers (ACOE) signed a cost-sharing agreement for a feasibility study of the area. Under federal and state law, the owners of the Whittaker- Bermite property have the responsibility for the groundwater cleanup. CLWA, the purveyors, and the Department of Toxic Substances Control (DTSC) signed an oversight agreement in 2003 (amended in 2012) regarding studies of treatment technologies for removing perchlorate from water supplies, and also worked with DDW to obtain the necessary permits for these treatment processes. Treatment method pilot studies were conducted during 2003, and in 2004 CLWA and the purveyors selected ion exchange as the preferred treatment method for removing perchlorate. Although that agreement expired in January 2005 the parties, under DTSC oversight, jointly developed a plan to pump and treat contaminated water from two of the purveyors impacted Santa Clarita Valley Urban Water Management Plan Page 5-4
305 2015 Santa Clarita Valley Urban Water Management Plan wells to stop migration of the contaminant plume and to partially restore the municipal well capacity that had been impacted by perchlorate. The containment plan specified that wells Saugus 1 and Saugus 2 operate at an initial continuous pumping rate of 1,100 gpm (1,772 AFY) at each well, for a combined total of 2,200 gpm (3,544 AFY) from the two wells. The annual pumping volume of 1,772 AFY per well assumes that pumping will occur continuously, except for occasional maintenance purposes. A final settlement to fund, remediate and treat the contaminated water was completed and executed by the parties in April Construction of the treatment facility and pipelines began in November 2007 and treatment of the water began in Water from Saugus 1 and Saugus 2 was initially treated and discharged into the Santa Clara River. DDW issued an amendment to CLWA s Operating Permit in December 2010, and the wells were placed back in water supply service in January Since then, CLWA has included this water as part of its supply and has been delivering this water to purveyors. This water is shown as part of the regional supply in Section 3, and as part of SCWD s supply in the detailed supply tables by purveyor in Appendix C. VWC Wells 201 and 205 VWC and CLWA have submitted a recommendation plan to restore VWC Well 201 to service that utilized funding from the Whittaker Corporation and its insurer for installing wellhead treatment of contaminated water from VWC Well 201. Restoring service to Wells 201 and 205 is projected to occur by During the time VWC s Well 201 and 205 have been removed from service, the temporary loss of capacity was made up for from the remaining, non-impacted Saugus production facilities and imported water supplies. Restoration of VWC Well 201, operation of VWC Well 205, and new Saugus well construction to replace lost capacity and to expand production capacity from the Saugus Formation are planned to achieve target Saugus Formation capacity through single and multiple dry years as discussed in Section 3. Returning the impacted Saugus well (VWC Well 201) to municipal water supply service by installing treatment requires DDW approval before the water can be considered potable and safe for delivery to customers. The permit requirements are contained in Policy Memo for direct domestic use of impaired water sources. Before issuing a permit to a water utility for use of an impaired source as part of the utility s overall water supply permit, DDW requires that studies and engineering work be performed to demonstrate that pumping the well and treating the water will be protective of public health for users of the water. The Policy Memo requires that DDW review the local retail water purveyor s plan, establish appropriate permit conditions for the wells and treatment system, and provide overall approval of returning the impacted wells to service for potable use. The Policy Memo requires, among other things, the completion of a source water assessment for the impacted well intended to be returned to service. The purpose of the assessment is to determine the extent to which the aquifer is vulnerable to continued migration of perchlorate and other contaminants of interest from the Whittaker-Bermite site. The assessment has been completed and the initial draft was submitted to DDW for approval in The assessment includes the following: Santa Clarita Valley Urban Water Management Plan Page 5-5
306 2015 Santa Clarita Valley Urban Water Management Plan Delineation of the groundwater capture zone caused by operating the impacted wells. Identification of contaminants found in the groundwater at or near the impacted wells. Identification of chemicals or contaminants used or generated at the Whittaker-Bermite facility. Determination of the vulnerability of pumping the impacted wells to these contaminant sources. The draft submittal is currently undergoing revision to address DDW comments. It is estimated that the assessment will be finalized by 2016/2017, along with DDW issuing an amendment to VWC s Operating Permit to return Well 201 to service. Ultimately, VWC s plan and the DDW requirements are intended to ensure that the water introduced to the potable water distribution system has no detectable concentration of perchlorate and all water currently discharged from the potable water distribution system complies with all applicable drinking water standards Metals and Salts Metals and salts are tested in wells at least every three years and in Castaic Lake water every month. Small quantities of naturally occurring arsenic are found in Castaic Lake and in a few wells. Inorganic compounds such as salts and metals can be naturally occurring or result from urban storm water runoff, industrial or domestic wastewater discharges, oil and gas production, mining or farming. Arsenic levels in the Santa Clarita Valley are below the MCL (2015 CCR). Nitrate in drinking water at levels above 45 mg/l is a health risk for infants less than six months of age due to the possibility of methemoglobinemia. Nitrate levels may rise quickly for short periods of time because of rainfall or agricultural activity. Principal sources of nitrogen to a watershed typically include discharges from water reclamation plants and runoff from agricultural activities. Elevated nitrogen concentrations (ammonia, nitrate and nitrite) can cause impairments in warm water fish and wildlife habitat, along with contributing to eutrophic effects such as algae growth and low dissolved oxygen. Nitrates are tested at least annually and the drinking water meets federal and state MCL standards (2015 CCR). A TMDL for chloride in the Upper Santa Clara River (Reaches 5 and 6) was adopted by the LARWQCB and became effective on May 5, The Basin Plan Amendment for the chloride TMDL in the Upper Santa Clara River was unanimously adopted by the LARWQCB on December 11, The TMDL established waste load allocations of 100 mg/l for the Saugus and Valencia WRPs. The TMDL implementation schedule allows for several special studies to determine whether existing Water Quality Objectives (WQOs) and waste-load allocations for chloride can be revised, and provides for an 11-year schedule to attain compliance with the final water quality objectives and waste-load allocations for chloride. In October 2013, the SCVSD Board of Directors approved a project to comply with the Statemandated chloride limit after nearly two years of extensive public input, meetings, hearings, and environmental review. The approved chloride compliance project will add advanced treatment equipment to the Valencia WRP to reduce chloride levels in treated wastewater. The resulting Santa Clarita Valley Urban Water Management Plan Page 5-6
307 2015 Santa Clarita Valley Urban Water Management Plan brine will be concentrated and removed by trucking, likely to the Joint Water Pollution Control Plant in Carson, which treats wastewater from much of the Los Angeles Basin (over 270 MGD) and discharges to the ocean. Refer to Section 4.4 for a discussion regarding the current status of the SCVSD s chloride compliance project Disinfection By-Products CLWA uses ozone and chloramines to disinfect its water. Disinfection By-Products (DBPs), which include Trihalomethanes (THMs) and Haloacetic Acids (HAA5), are generated by the interaction between naturally occurring organic matter and disinfectants such as chlorine and ozone. THMs and HAA5 are measured at several points in each system and averaged once per quarter and reported as a running annual average. Ozone is a very powerful disinfectant that not only kills organisms that no other disinfectant can, but also destroys organic chemicals that cause unpleasant tastes and odors. However, ozone can also interact with bromide, a naturally occurring salt, to produce bromate. As a result, CLWA is required to analyze the water leaving its two treatment plants for bromate once a month under federal regulations and the State s adopted Disinfectants and Disinfection Byproducts Rule (D/DBP Rule) Total Trihalomethanes In December 2005, the EPA implemented a Stage 2 Disinfectants and Disinfection Byproducts Rule. In part, this rule did not change the existing MCL of 80 ug/l for Total Trihalomethanes (TTHM), however, it requires water systems to apply that MCL at each compliance monitoring location (instead of as a system-wide average as in previous rules). TTHMs are byproducts created when chlorine is used as a means for disinfection. CLWA and NCWD implemented an alternative method of disinfection, chloramination, in 2005 to maintain compliance with the new rule and future regulations relating to disinfection byproducts. TTHM concentrations have remained significantly below the MCL since implementation of alternative disinfection. VWC and SCWD continue to use chlorination (using calcium hypochlorite) to disinfect groundwater and have been in compliance with the EPA s Disinfection Byproducts Rule Microbiological Microbial contaminants, such as viruses and bacteria, can be naturally occurring or result from urban storm water runoff, sewage treatment plants, septic systems, agricultural livestock operations and wildlife. Water is tested throughout the systems weekly for Total Coliform bacteria and testing for Escherichia coli (E. coli) occurs when coliform testing is positive. No E. coli was detected in any drinking waters in The MCL for total coliforms is 5 percent of all monthly tests showing positives for larger systems. Bacteriological tests met federal and state requirements. Additional microbiological tests for the water-borne parasites Cryptosporidium parvum and Giardia lamblia were performed on Castaic Lake water, and none were detected. Santa Clarita Valley Urban Water Management Plan Page 5-7
308 5.2.6 Radiological Tests 2015 Santa Clarita Valley Urban Water Management Plan Radioactive compounds can be found in both ground and surface waters, and can be naturally occurring or be the result of oil and gas production and mining activities. Testing is conducted for two types of radioactivity: alpha and beta. If none is detected at concentrations above five picocuries per liter no further testing is required. If it is detected, the water must be checked for uranium and radium. Although naturally occurring radioactivity can be detected, the levels meet the federal and state MCL standards Organic Compounds Organic chemical contaminants, including synthetic and volatile organic chemicals, are byproducts of industrial processes and petroleum production, and can also come from gas stations, urban storm water runoff and septic systems. Organic compounds also include pesticides and herbicides, which may come from a variety of sources such as agriculture, urban storm water runoff and residential uses. Water is tested for two types of organic compounds, volatile organic compounds (VOCs) and non-volatile synthetic organic compounds (SOCs). These organic compounds are synthetic chemicals produced from industrial and agricultural uses. Castaic Lake water is checked annually for VOCs and SOCs. Local wells are tested at least annually for VOCs and periodically for SOCs. Trichloroethylene (TCE) and Tetrachloroethylene (PCE), which are VOCs, have been found in low levels below the MCL in groundwater in the Santa Clarita Valley. Since perchlorate treatment for Saugus 1 and 2 wells was initiated in 2011, periodic detections of VOCs have been experienced at the wellheads, in the treated water, and in CLWA s distribution system. The retail purveyors operate their groundwater supply wells under operating permits from the DDW. These operating permits include operational goals for water quality constituents in drinking water. In the case of TCE and PCE, the operational goal is at or below the DLR, which is less than the State drinking water MCL for these constituents. These constituents have been occasionally detected at concentrations above the DLR, but there have never been any detections above the regulatory standard MCL. Therefore, the retail water purveyors are in compliance with the Safe Drinking Water Act and the DDW-issued operating permits. In addition, groundwater pumped from supply wells is put into the Valley-wide drinking water pipeline system which blends groundwater with imported water supplies. Mixing of the groundwater with imported water supplies further reduces the concentration of any PCE and TCE in the water provided to users. Based on the low levels of detection and blending practices, VOCs are not anticipated to impact groundwater supply availability or reliability. In addition, the retail purveyors operate their groundwater supply wells under operating permits from the DDW. These operating permits include operational goals for water quality constituents in drinking water. In the case of TCE and PCE, the operational goal is at or below the DLR, which is less than the State drinking water MCL for these constituents. These constituents have been occasionally detected at concentrations above the DLR, but there have never been any detections above the regulatory standard MCL. Therefore, the retail water purveyors are in compliance with the Safe Drinking Water Act and the DDW-issued operating permits. In addition, groundwater pumped from supply wells is put into the Valley-wide drinking water Santa Clarita Valley Urban Water Management Plan Page 5-8
309 2015 Santa Clarita Valley Urban Water Management Plan pipeline system which blends groundwater with imported water supplies. Mixing of the groundwater with imported water supplies further reduces the concentration of any PCE and TCE in the water provided to users. It should be noted that the remedial action plan (RAP) for groundwater for the Whittaker-Bermite site and the associated CEQA document were approved by DTSC on December 2, The DTSC-approved RAP presents an evaluation of identified remedial alternatives for containment and cleanup of impacted groundwater at the Whittaker-Bermite site. In accordance with the RAP, among other activities, a fluidized bed reactor (FBR) system has been designed and delivered to the site. The FBR will provide biological treatment of perchlorate and granular activated carbon will be used to remove VOCs in groundwater, which will be extracted at an approximate combined rate of 800 AFY for on-site containment purposes. Because CLWA is concerned about any detection of VOCs, CLWA performed a VOC source identification study. The July 2015 study concluded that the likely source was either the Whittaker-Bermite site or the Saugus Industrial Center and additional monitoring would be necessary to identify the specific source. CLWA and the purveyors are currently working with DTSC to develop additional monitoring requirements for both sites. 5.3 Imported Water Quality CLWA provides SWP and other imported water to the Valley. The source of SWP water is rain and snow of the Sierra Nevada, Cascade and Coastal mountain ranges. This water travels to the Delta through a series of rivers and various SWP structures. From there it is pumped into a series of canals and reservoirs, which provide water to urban and agricultural users throughout the San Francisco Bay Area and central and southern California. The most southern reservoir on the West Branch of the SWP California Aqueduct is Castaic Lake. CLWA receives water from Castaic Lake and distributes it to the purveyors following treatment. CLWA operates two water treatment plants, the Earl Schmidt Filtration Plant located near Castaic Lake and the Rio Vista Water Treatment Plant located in Saugus. CLWA produces water that meets drinking water standards set by the U.S. EPA and DDW. SWP water has different aesthetic characteristics than groundwater, with lower dissolved mineral concentrations (total dissolved solids) of approximately 250 to 360 mg/l, and lower hardness (as calcium carbonate) of about 105 to 135 mg/l. Historically, the chloride content of SWP water varies widely from over 100 mg/l to below 40 mg/l, depending on Delta conditions; however as discussed below, SWP operations have changed significantly since high historical levels of chloride were experienced. Historically, the SWP delivered only surface water from the Sacramento-San Joaquin River Delta. However, CLWA and other SWP users, in anticipation of increased demand and dry periods, began water banking programs where SWP water could be stored or exchanged during wet years and withdrawn in dry years. The last three years have seen severe statewide drought. As a result, water has been withdrawn from the banking programs. This withdrawn water can either be delivered by exchange with SWP supplies allocated to others, or by pumping it into the SWP system. During the period of 2013 through 2015, a greater portion of Santa Clarita Valley Urban Water Management Plan Page 5-9
310 2015 Santa Clarita Valley Urban Water Management Plan water in the SWP has been this pumped-in water. The pumped-in water has met all water quality standards established by DWR under its anti-degradation policy for the SWP. In general, the pumped-in water serves to reduce the chloride concentration in SWP water. The SWP water chemistry may fluctuate and is influenced by its passage through the Delta, where large amounts of organic material are present and where mixing with salt water from San Francisco Bay, which contributes bromide and chlorides, may occur. Chloride levels from the Delta elevate chloride locally resulting in concern for local agriculture that grows chloride sensitive crops. Additionally, bromide and TOC may react with disinfectants such as ozone, chlorine, or DBPs. All constituents meet the federal and state MCL levels as reported in the 2015 CCR but remain a management concern in the watershed. 5.4 Surface Water Quality CLWA does not deliver and treat water from the Santa Clara River as a source of supply; however, this source is a source of recharge to the underlying groundwater basin. The LARWQCB Basin Plan (Basin Plan, 1994) provides water quality objectives for surface water in the Upper Santa Clara River. These objectives were established to protect the various beneficial uses for that particular water body or reach. The water bodies of the Upper Santa Clara River watershed, which include streams, natural lakes and reservoirs, span a wide variety of existing, potential and/or intermittent beneficial uses. The following is a list of the beneficial uses identified in the Upper Santa Clara River: Municipal and Domestic Supply Industrial Service Supply Industrial Process Supply Agricultural Supply Groundwater Recharge Freshwater Replenishment Hydropower Generation Water Contact and Non-contact Water Recreation Warm and Cold Freshwater Habitat Wildlife Habitat Rare, Threatened, and Endangered Species Spawning, Reproduction, and/or Early Development Santa Clarita Valley Urban Water Management Plan Page 5-10
311 2015 Santa Clarita Valley Urban Water Management Plan All of the surface water bodies in the Upper Santa Clara River watershed support the designated beneficial uses (either existing or intermittent) of municipal and domestic supply, agricultural supply, groundwater recharge, water contact recreation, non-contact water recreation, wildlife habitat, and warm freshwater habitat. In addition, many water bodies (such as Bouquet, San Francisquito, and Soledad Canyons) support the designated beneficial uses (either existing or intermittent) of rare, threatened or endangered species; wetland habitat; and/or spawning, reproduction, and/or early development. Regional reservoirs that support hydropower generation include Elderberry Forebay, Castaic Lake, Dry Canyon Reservoir, Bouquet Reservoir, and Pyramid Lake. Local surface waters are not a direct source of drinking water supply in the Region, but they are a continual source of recharge to groundwater which is used to meet municipal water demands. The 2010 Section 303(d) Impaired Waterbodies List for the Upper Santa Clara River Watershed was approved by the SWRCB on September 21, 2009 and was approved by the US EPA on October 11, There are a number of constituents that are on the (d) list for Reaches 5, 6 and 7 of the Santa Clara River, and for Lake Hughes, Lake Elizabeth and Munz Lake, which are also within the watershed. The Santa Clara River currently has three adopted TMDLs due to non-attainment of water quality objectives, one pertaining to chloride (see Section 5.2.2), another pertaining to nitrogen compounds (see Section 5.2.2), and a third pertaining to bacteria (see Section 5.2.5). Another TMDL is in place for three lakes within the Region that are impaired with trash. Water quality objectives for the basin established by the LARWQCB in the Basin Plan are provided in Table 4-6. Surface water quality is monitored in numerous locations throughout the Valley. Continuous sampling records are taken at two gaging stations at the Old Highway 99 Bridge and at the Los Angeles-Ventura County Line ( Blue Cut ). 5.5 Groundwater Quality The groundwater basin has two sources of groundwater, the Alluvial Aquifer whose quality is primarily influenced by rainfall and stream flow, and the Saugus Formation, which is a much deeper aquifer and recharged primarily by a combination of rainfall and deep percolation from the partially overlying Alluvium. A larger part of the Valley s groundwater supply is from the Alluvial Aquifer, between 30,000 to 40,000 AFY; and a smaller portion of the Valley s water supply is drawn from the Saugus Formation, with a target production level between 7,500 and 15,000 AFY in normal water years. Local groundwater does not have microbial water quality problems. Parasites, bacteria and viruses are filtered out as the water percolates through the soil, sand and rock on its way to the aquifer. Even so, disinfectants (calcium hypochlorite) are added to local groundwater when it is pumped by wells to protect public health. Local groundwater has very little TOC and generally Santa Clarita Valley Urban Water Management Plan Page 5-11
312 2015 Santa Clarita Valley Urban Water Management Plan has very low concentrations of bromide, minimizing potential for DPB formation. Taste and odor problems from algae are not an issue with groundwater. The mineral content of local groundwater is very different from SWP water. The groundwater is very hard, and it has high concentrations of calcium and magnesium (approximately 250 to 600 mg/l total hardness as CaCO 3 ). Groundwater may also contain higher concentrations of nitrates and sulfates when compared to SWP water. However, all groundwater meets drinking water standards Water Quality - Alluvium Groundwater quality is a key factor in assessing the Alluvial Aquifer as a municipal and agricultural water supply. Groundwater quality details and long-term conditions, examined by integration of individual records from several wells completed in the same aquifer materials and in close proximity to each other, have been discussed previously in the annual Water Reports and in the 2010 UWMP. Historical groundwater quality as represented by specific conductance (which is a measure of the salinity or amount of dissolved minerals) values from representative wells in the Valley have been below the DDW Secondary Maximum Levels ( Recommended Level and Upper Level ). While over the last 10 years, specific conductance values generally responded to wet periods by exhibiting a downward trend, followed by an increasing trend during a dry period, the historical specific conductance data do not exhibit a long-term overall trend and, most notably, no long-term decline in Alluvial groundwater quality. In general, groundwater quality exhibits a gradient from east to west, with lowest dissolved mineral content to the east, increasing in a westerly direction; and periodic fluctuations in some parts of the basin, where groundwater quality has inversely varied with recharge from precipitation and stream flow. Those variations are typically characterized by increased mineral concentrations through dry periods of lower stream flow and lower groundwater recharge, followed by lower mineral concentrations through wetter periods of higher stream flow and higher groundwater recharge. Specific conductance throughout the Alluvium is currently below the Secondary (aesthetic) MCL of 1,600 micromhos per centimeter (µmhos/cm). The presence of long-term consistent water quality patterns, although intermittently affected by wet and dry cycles, supports the conclusion that the Alluvial aquifer is a viable ongoing water supply source in terms of groundwater quality. The most notable groundwater quality issue in the Alluvium is perchlorate contamination. Section describes this issue in detail Water Quality - Saugus Formation As discussed above for the Alluvium, groundwater quality is a key factor in also assessing the Saugus Formation as a municipal and agricultural water supply. Long-term Saugus groundwater quality data are not sufficiently extensive to permit any sort of basin-wide analysis or assessment of pumping-related impacts on quality. However, integration of individual records from several wells has been used to examine general water quality trends. Based on those records, water quality in the Saugus Formation has not historically exhibited the Santa Clarita Valley Urban Water Management Plan Page 5-12
313 2015 Santa Clarita Valley Urban Water Management Plan precipitation-related fluctuations seen in the Alluvium. Based on available data over the last fifty years, groundwater quality in the Saugus has exhibited a slight overall increase in dissolved mineral content. Between 2000 and 2005, several wells within the Saugus Formation exhibited an increase in dissolved mineral content, similar to the short term changes in the Alluvium, possibly as a result of recharge to the Saugus Formation from the Alluvium. Since 2005, however, these levels have been steadily dropping or remaining constant. Dissolved mineral concentrations in the Saugus Formation remain below the Secondary (aesthetic) MCL. Groundwater quality within the Saugus will continue to be monitored to ensure that degradation which may present concern relative to the long-term viability of the Saugus as an agricultural or municipal water supply does not occur. As with the Alluvium, the most notable groundwater quality issue in the Saugus Formation is perchlorate contamination (described in detail in Section 5.2.1), although VOC contamination is also a growing concern. To date, nine wells, seven Saugus Formation wells and two Alluvial wells, have been impacted by perchlorate. Perchlorate was originally detected in four Saugus wells operated by the retail water purveyors in the eastern part of the Saugus Formation in 1997, near the former Whittaker-Bermite facility. Two of those impacted wells have now been restored and returned to municipal water supply service as described in Section A third impacted well has been abandoned and replaced by a new well, distant from the perchlorateimpacted part of the Saugus Formation. The fourth impacted well remains out of service, with its capacity made up for from the restored and other non-impacted Saugus wells. The inactivation of that well does not limit the ability of the purveyors to meet supply needs. While perchlorate was detected in a fifth Saugus well nearby, the concentration was very low and below the detection limit for reporting. The sixth impacted Saugus well (VWC Well 201) was taken out of service when perchlorate concentrations that exceed the maximum contaminant levels for drinking water was detected in The seventh impacted Saugus well, located nearby, was voluntarily removed from service in April 2012 when perchlorate was detected in low concentrations below the limit for reporting. Both of these wells are expected to be placed back into service by 2017, pending approval by DDW of a restoration and perchlorate contaminant plan that includes wellhead treatment at VWC Well 201. The temporary loss of capacity from VWC Well 201 and 205 has been made up for from the remaining, non-impacted Saugus wells and imported water supplies. There has been no additional detection of perchlorate above the detection limit for reporting in any other municipal Saugus well. The local retail water purveyors continue to test for perchlorate in active water supply wells near the Whittaker-Bermite site. 5.6 Aquifer Protection There has been extensive investigation of the extent of perchlorate and VOC contamination both on the Whittaker Bermite site and in off-site downgradient areas. The off-site areas are primarily located to the north and west of the Whittaker-Bermite site. Investigations have been conducted on-site since 1987 when the facility ceased operations and off-site areas following the detection of perchlorate in This section will focus on investigations and aquifer protection efforts by CLWA and the retail water purveyors that have occurred after the 2010 UWMP was prepared. Santa Clarita Valley Urban Water Management Plan Page 5-13
314 2015 Santa Clarita Valley Urban Water Management Plan Since 2010, the primary focus and efforts for aquifer protection in the off-site areas has been on the Saugus Formation as there have not been any further perchlorate detected in Alluvial supply wells. In January 2011, after many years of being out of service due to perchlorate contamination, the Saugus 1 and Saugus 2 wells were returned to service with wellhead treatment to augment existing Saugus Formation pumping capacity. NCWD s Well NC-11 has remained out of service with a portion of its capacity replaced by a combination of imported water supplies and treated water from CLWA s Saugus Perchlorate Treatment Facility. In August 2010, perchlorate was detected in VWC Well 201. While the initial detection was below regulatory standards, the well was immediately taken out of active supply service. Subsequently, an investigation was conducted to further investigate the occurrence of perchlorate in the Saugus Formation and evaluate the potential for other Saugus wells to be impacted. The investigation included a modeling component to evaluate several operational scenarios coupled with water treatment to contain perchlorate migration and prevent further migration of perchlorate to other Saugus Formation supply wells located west of VWC s Well 201. It was concluded that VWC Wells 201 and 205 could be returned to service with wellhead treatment to both contain and capture perchlorate that is not captured by the Saugus 1 and Saugus 2 containment system while also restoring Saugus Formation well capacity to meet water demands. The investigation included a recommended restoration and containment program submitted in 2015 to DDW for implementation. The recommended restoration and containment program requires the continued operation of the Saugus 1 and Saugus 2 wells to contain further migration of perchlorate. Pending regulatory approval in 2017, it is estimated that the approved restoration alternative will be implemented by 2017, resulting in the return of VWC s Wells 201 and 205 to service. Following the detection of perchlorate in Well 201 in 2010, VWC elected to minimize pumping from VWC Well 205. Well 205 was voluntarily taken out of service entirely when perchlorate was detected in low concentrations below the Detection Limit for Reporting (<4.0 μg/l) in April These proactive actions to remove these wells from service helped limit perchlorate migration. Well 205 is planned to resume service as part of the implementation of the restoration and containment program at Well 201. The replacement and reactivation of these two wells, augmented by planned and funded replacement wells, adds to the overall ability to meet the groundwater component of total water supply in the Valley. As part of the restoration and containment programs in the off-site area west of the Whittaker-Bermite site, the groundwater monitoring program is being expanded to evaluate the effectiveness of perchlorate containment and restoration activities to contain the perchlorate in groundwater and prevent further migration to down-gradient Saugus wells. This monitoring program has involved the construction of several depth-specific monitoring wells at two sites (DW-1 and DW-2) that have expanded the off-site monitoring network of groundwater conditions in the Saugus Formation along with recent construction of monitoring wells near VWC Well 201 and the former site of VWC Well 157. Since 2010, monitoring of municipal wells near the Whittaker-Bermite site in the Saugus Formation and Alluvium has shown no detections of perchlorate in any additional Saugus Formation wells down-gradient of VWC Wells 201 and 205 or Alluvial wells. The recent installation of dedicated monitoring wells off-site of the Whittaker-Bermite site will be used to augment the existing off-site monitoring network and allow CLWA and the retail water purveyors Santa Clarita Valley Urban Water Management Plan Page 5-14
315 2015 Santa Clarita Valley Urban Water Management Plan to monitor the effectiveness of the Saugus-1/Saugus-2 and VWC Well 201 restoration and containment program to prevent further perchlorate migration and impacts on other municipal supply wells and protect the groundwater resources in the Valley. On the Whittaker-Bermite site, a site-wide soils remedial design (RD) was approved by DTSC in January 2013 for operating units (OU) 2 through 6. Out of these five OUs, remediation of soils was completed at OU5 in November 2015 and remediation activities were initiated in September 2015 at OU2, OU3, and OU4. In addition to soil remediation, soil vapor extraction (SVE) operations have occurred since May 2012 to remove volatile organic compounds from selected areas of OUs 2 through 6. Full scale SVE operations in all areas identified in the approved RAP and RD are currently being planned for the site. The long term action for OU6 (Area 1) is to complete the SVE and request clean closure of this area from DTSC. The SVE work at OU6 addresses residual VOC concentrations that were remaining as part of site-wide cleanup efforts. As mentioned previously, the RAP for groundwater (OU7) and associated CEQA document were approved by DTSC in December The RAP focuses on three areas where groundwater at the site is impacted. The three areas are the Northern Alluvium, the Saugus Formation, and perched groundwater. The RAP includes an evaluation of remedial alternatives to contain and clean up impacted groundwater in these three areas. Pilot studies and interim measures have been initiated in the Saugus Formation and the Northern Alluvium and are at different stages of progress. The Saugus Aquifer Extraction Pilot Program (Pilot Program) was implemented following DTSC approval of the work plan in December 2008 (AMEC, 2009). The work continues today and has included the development of a multi-layer groundwater flow model to simulate various groundwater pumping scenarios to capture impacted groundwater in the Saugus Aquifer underlying the Whittaker-Bermite site and surrounding areas. The number and location of extraction wells to achieve capture of impacted groundwater were determined based on the modeling effort, these extraction wells, as well as performance monitoring wells have been installed. The performance monitoring wells will monitor the effectiveness of the extraction wells to capture impacted groundwater. A treatment system has been designed and delivered to the Site and site preparation work is being conducted to convey groundwater from the extraction wells to the treatment system. Monitoring data collected as part of the Pilot Program along with additional modeling will be incorporated into the OU7 RAP and RD document. Short term actions include the construction and operation of the Saugus Aquifer containment pump and treat system. This system is currently being installed and is expected to be operational in 2017 with an annual extraction of 800 AFY from the Saugus Formation. The extracted groundwater will be treated for perchlorate and VOC removal and returned to the Santa Clara River pursuant to system-related permits. It is anticipated that a portion of the treated water may recharge the Alluvium, especially in dry periods when there may be available vacated aquifer storage. Plans between CLWA, the retail purveyors, and Whittaker-Bermite to utilize the treated water for municipal purposes have not been fully explored at this time due to an absence of conveyance facilities to transport the treated water to the municipal distribution system. An Interim Remediation Pumping Program was started in selected areas of the Northern Alluvium in 2006 and as of the end of 2015, the system has treated about 41 million gallons of impacted water (about 12 AFY on average). Due to declines in Alluvial groundwater elevations Santa Clarita Valley Urban Water Management Plan Page 5-15
316 2015 Santa Clarita Valley Urban Water Management Plan in this area of the basin, the extraction wells are not always able to operate. Monitoring of groundwater levels in the Northern Alluvium area continue and the extraction system will resume operation once groundwater levels recover. In addition to the Interim Remediation Pumping Program described above, a work plan for a permeable reactive zone (PRZ) pilot test has been approved by DTSC in April, Following approval, the installation of the permeable treatment columns and performance monitoring wells was conducted and completed by September Baseline groundwater sampling has been conducted in December 2015 along with a pilot test. Following the test, additional sampling was conducted from the monitoring wells at the end of December Performance monitoring and pilot system evaluation is ongoing and the results of the pilot study will be incorporated into the OU7 RAP. A Rapid Response Fund has been established under the terms of the CLWA Litigation Settlement Agreement. The fund can be used if remedies to contain perchlorate contamination in the Alluvial Aquifer and Saugus Formation do not prevent migration of the perchlorate plume towards down-gradient threatened wells (identified in the Settlement Agreement as VWC Wells N, N-7, N-8, S6, S7, S8, 201 and 205 and NCWD Wells NC-10, NC-12 and NC-13). The Rapid Response Fund can be utilized to provide up to $10 million for any additional costs of providing replacement water, associated operations and maintenance costs of treatment equipment and resin under the terms of the Settlement Agreement. As noted, VWC Well 201 was a downgradient threatened well, however, Whittaker-Bermite elected to fund the evaluation and implementation of the restoration and containment plan for this well through other funding sources, rather than utilizing the Rapid Response Fund. 5.7 Water Quality Impacts on Reliability Three factors affecting the availability of groundwater are sufficient source capacity (wells and pumps), sustainability of the groundwater resource to meet pumping demand on a renewable basis and protection of groundwater sources (wells) from known contamination, or provisions for treatment in the event of contamination. The first two of those factors are addressed in Section 3. The resolution of contamination for aquifer protection is addressed below. Perchlorate has been a water quality concern in the Valley since 1997 when it was originally detected in four wells operated by the purveyors in the eastern part of the Saugus Formation, near the former Whittaker-Bermite facility. Subsequent monitoring well installation has been completed; and a focused study of the Saugus Formation has ultimately been incorporated into the overall groundwater remediation and perchlorate containment. All remedial action has been reviewed by the DTSC and DDW. Generally, DDW provides final approval for returning wells to service, while DTSC provides oversight for overall perchlorate contamination and remediation. The developed groundwater remediation and containment program before DTSC and DDW has been designed to maximize the likelihood of preventing further westward migration of perchlorate. Indeed, modeling analyses indicate that other alternatives (such as not pumping Valencia wells 201 and 205, and/or reducing pumping at the Saugus 1/Saugus 2 wellfield) could Santa Clarita Valley Urban Water Management Plan Page 5-16
317 2015 Santa Clarita Valley Urban Water Management Plan increase the likelihood of further westward migration of perchlorate to currently non-impacted water supply wells. In addition, as was discussed in Sections and 5.6, the RAP for groundwater (OU7) for the Whittaker-Bermite site and the associated CEQA document were approved by DTSC on December 2, In accordance with the RAP, among other activities, a treatment system has been designed and delivered to the Whittaker-Bermite site which will provide biological treatment of perchlorate and use of granular activated carbon to remove VOCs for on-site containment purposes. As discussed in Section above, the retail purveyors operate their groundwater supply wells pursuant to operating permits from DDW. These operating permits include operational goals for water quality constituents in drinking water, specifically including TCE and PCE, which are classified as VOCs. The operational goal for VOCs is at or below the DLR. Notably, the DLR is less than the State drinking water MCL for these constituents. These constituents have been occasionally detected at concentrations above the DLR, but there have has never been any detections above the regulatory standard MCL. Therefore, the retail water purveyors are in compliance with the Safe Drinking Water Act and the DDW-issued operating permits. In addition, groundwater pumped from supply wells is put into the Valley-wide drinking water pipeline system which blends groundwater with imported water supplies. Mixing of the groundwater with imported water supplies further reduces the concentration of any PCE and TCE in the water provided to users. Based on the low levels of detection and blending practices, VOCs are not anticipated to impact groundwater supply availability or reliability. In 2015, CLWA initiated a preliminary design engineering study for the Saugus Formation replacement wells and dry year wells. The objectives of the study were to determine the optimum approach to replacing the Saugus Formation pumping capacity lost due to perchlorate contamination (two replacement wells) as well as to installing additional capacity to extract Saugus Formation groundwater during times when imported water deliveries are significantly curtailed (two dry-year wells). The capacity objectives of the four wells that would be required to achieve these objectives is 2,100 to 2,400 gpm (3,390 to 3,870 AFY) per well. To minimize the risk of future perchlorate migration, the draft recommended approach to implementation of the project is to install two wells near Round Mountain and two wells near Castaic Junction. Each site would have a deeper well and a shallower well, each with a capacity of 2,100 to 2,400 gpm. The extracted water would be conveyed in new pipelines that would allow distribution throughout CLWA s service area. CLWA is currently evaluating the draft recommended approach. Overall, the plans developed for groundwater operation will allow CLWA and the retail purveyors to meet near term and long term demand within the CLWA service area. For water supply planning purposes, this UWMP assumes that the existing and planned monitoring and treatment programs in place for perchlorate and VOCs will remain in place through Any well impacted by perchlorate will be removed from service in the near term and the loss of capacity will be met by near-term excess capacity in non-impacted wells or through the installation of replacement well(s), if necessary, until remediation alternatives, including wellhead treatment, and DDW approval is obtained for restoration of the impacted supply. The current removal of VWC Well 201 from service does not limit the reliability of the water supply since there is Santa Clarita Valley Urban Water Management Plan Page 5-17
318 2015 Santa Clarita Valley Urban Water Management Plan sufficient excess capacity in existing Saugus wells, along with imported water supplies to meet water supply projections during the period required for its restoration, expected by Therefore, no anticipated change in reliability or supply due to water quality is anticipated based on the present data, as is shown in Table 5-2. TABLE 5-2 CURRENT AND PROJECTED WATER SUPPLY CHANGES DUE TO WATER QUALITY (PERCENTAGE CHANGE) Water source Groundwater Alluvial 0% 0% 0% 0% 0% 0% 0% 0% Saugus 16% (a) 0% 0% 0% 0% 0% 0% 0% Imported Water 0% 0% 0% 0% 0% 0% 0% 0% Recycled Water 0% 0% 0% 0% 0% 0% 0% 0% Banking Programs 0% 0% 0% 0% 0% 0% 0% 0% Note: (a) The removal from service of VWC Well 201 has temporarily reduced the quantity of water available from the Saugus Formation by up to 3,775 AFY in dry years. While the operation of VWC Well 205 has been suspended until VWC Well 201 is returned to service, the suspension is voluntary and the well is still considered active. The 16% water supply impact shown in this table represents the percentage of VWC Well 201 dry year capacity to the total 23,640 AFY dry year well capacity from existing Saugus Formation wells (including VWC Well 201), as indicated in Table It is expected that the water supply change shown for 2015 will no longer be present by The temporary loss of capacity from VWC Well 201, as discussed in Sections 3, 5, 6 and 8 and Appendix C, does not result in a shortage to the water suppliers. Santa Clarita Valley Urban Water Management Plan Page 5-18
319 2015 Santa Clarita Valley Urban Water Management Plan Section 6: Reliability Planning 6.1 Overview The Act requires urban water suppliers to assess water supply reliability that compares total projected water use with the expected water supply over the next twenty years in five year increments. The Act also requires an assessment for a single dry year and multiple dry years. While not required, this Plan includes an assessment of two different multiple-dry year periods: a four-year dry period and a three-year dry period. This section presents the reliability assessment for CLWA s service area. It is the stated goal of CLWA and the retail water purveyors to deliver a reliable and high quality water supply for their customers, even during dry periods. Based on conservative water supply and demand assumptions over the next thirty-five years in combination with conservation of non-essential demand during certain dry years, the Plan successfully achieves this goal. 6.2 Reliability of Water Supplies Each water supply source has its own reliability characteristics. In any given year, the variability in weather patterns around the state may affect the availability of supplies to the Valley differently, depending on whether supplies are from local sources or are imported from other parts of the state. For example, from 2000 through 2002, southern California experienced dry conditions in all three years, while during that same period northern California experienced one dry year and two normal years. The Valley is typical in terms of water management in southern California; local groundwater supplies are used to a greater extent when imported supplies are less available due to dry conditions in the north, and larger amounts of imported water supplies are used during periods when northern California has wetter conditions. This pattern of conjunctive use has been in effect since SWP supplies first came to the Valley in SWP and other imported water supplies have supplemented the overall supply of the Valley, which previously depended solely on local groundwater supplies. To supplement these local groundwater supplies, CLWA contracted with DWR for delivery of SWP water, providing an imported water supply to the Valley. However, the variability in SWP supplies affects the ability of the purveyors to meet the overall water supply needs for the service area. While each of the Valley s available supply sources has some variability, the variability in SWP supplies has the largest effect on overall supply reliability. As discussed in Section 3.2, each SWP contractor s Water Supply Contract contains a Table A Amount that identifies the maximum amount of Table A water that contractor may request each year. However, the amount of SWP water actually allocated to contractors each year is dependent on a number of factors than can vary significantly from year to year. The primary factors affecting SWP supply availability include the availability of water at the source of supply in northern California, the ability to transport that water from the source to the primary SWP diversion point in the southern Delta and the magnitude of total contractor demand for that water. In many years, the availability of SWP supplies to CLWA and the other SWP contractors is less than their maximum Table A Amounts, and can be significantly less in very dry years. Santa Clarita Valley Urban Water Management Plan Page 6-1
320 2015 Santa Clarita Valley Urban Water Management Plan DWR s 2015 DCR, prepared biennially, assists SWP contractors and local planners in assessing the reliability of the SWP component of their overall supplies. In its reports, DWR presents the results of its analysis of the availability of SWP supplies, based on model studies of SWP operations. In general, DWR model studies show the estimated amount of SWP supply that would be available for a given SWP water demand, given an assumed set of physical facilities and operating constraints, based on 82 years of historic hydrology. The results are interpreted as the capability of the SWP to meet the assumed SWP demand, over a range of hydrologic conditions, for that assumed set of physical facilities and operating constraints. DWR s 2015 DCR presents the results of model studies to estimate SWP delivery capability under both current (2015) and future (2035) conditions. In these model studies, DWR assumed existing SWP facilities and operating constraints, with all contractor demand at maximum Table A Amounts, for both current and future conditions. The primary difference between the two studies are the inclusion in the future conditions study of the potential impacts on historic hydrology of the effects of climate change and accompanying sea level rise. In the report, DWR presents the SWP delivery capability resulting from these studies as a percent of maximum contractor Table A Amounts. To estimate delivery capability in intermediate years between 2015 and 2035, DWR has suggested interpolating between the results of those two studies. SWP delivery capability for years beyond 2035 is assumed to be the same as for Normal, Single-Dry, and Multiple-Dry Year Planning CLWA and the water purveyors have various water supplies available to meet demands during normal, single-dry, and multiple-dry years. The following sections elaborate on the different supplies available including groundwater, recycled water and imported supplies Groundwater In accordance with the groundwater operating plan for the basin, groundwater supplies for all uses from the Alluvial Aquifer are planned to be in the range 30,000 to 40,000 AFY in average years and 30,000 to 35,000 AFY in dry years; supplies from the Saugus Formation are projected to be 7,500 to 15,000 AFY in average years and 15,000 to 35,000 AFY in dry years. The updated Basin Yield analysis (LSCE & GSI, 2009) concluded pumping in those ranges to be sustainable. While there is sufficient Alluvial pumping capacity to achieve the Alluvial groundwater supply (Table 3-8), it is planned that VWC will develop some future capacity as it constructs municipal supply wells to replace existing agricultural wells when planned development converts existing agricultural land use to municipal land use. Existing Saugus pumping capacity, after two wells are returned to service by 2017, is sufficient to achieve about 34,570 AFY (Table 3-9), which is slightly less than the upper end of the Saugus operating plan. To provide for operational flexibility and maintenance outages, it is planned that future Saugus pumping capacity (new wells) will be added to achieve the full range of the Saugus operating plan. The existing and planned groundwater supplies used in this Plan are generally the pumping rates, within the operating plan ranges, that were analyzed in the Basin Yield update. As such, they tend toward the upper ends of the respective ranges except for normal year Saugus pumping, which is closer to mid-range of the Saugus operating plan. For the multiple-dry year periods, it was assumed that pumping from the Saugus Formation would be governed by the groundwater operating plan summarized in Table 3-5, with average purveyor pumping from Santa Clarita Valley Urban Water Management Plan Page 6-2
321 2015 Santa Clarita Valley Urban Water Management Plan existing and planned wells of 30,700 AFY over a four-year dry period, and about 29,900 AFY over a three-year dry period. Total projected Alluvial and Saugus pumping, including pumping by the purveyors and by agricultural and other users, is shown by year type in Tables 3-10 to 3-12B in Section 3. As shown there, total pumping in each year type remains within the pumping ranges in the groundwater operating plan Recycled Water The existing and projected availability of recycled water supplies, including various factors having the potential to affect the amounts and availability of those supplies, are discussed in detail in Section 4. CLWA is currently in the process of updating the RWMP (RWMP Update) based on recent developments affecting recycled water sources, supplies, uses and demands. The RWMP Update is expected to be finalized by October 2016 and a new Programmatic EIR is expected to be completed by December CLWA has constructed Phase I of the RWMP, which can deliver up to1,700 AFY of water to the VWC service area. Deliveries of recycled water began in 2003 for irrigation water supply at a golf course and in roadway median strips. In 2015, recycled water deliveries were 450 AF. Phase 2 is planned to expand recycled water use within Santa Clarita Valley and consists of four projects currently in various stages of design. Additional details are presented in Section 4.6 Recycled Water Demand. The RWMP Update projects providing up to 10,054 AF of treated (tertiary) recycled water suitable for reuse on golf courses, landscaping and other non-potable uses in Santa Clarita Valley to the extent those supplies are available as discussed in Section 4. All of the available recycled water in the peak summer months would be used to meet demands that include existing Phase 1 projects, Phase 2 expansions currently in design, planned developments (including Newhall Ranch and Vista Canyon) and future nearby customers served by extending off the Phase 2 system State Water Project Table A Supply For this Plan, the availability of SWP supplies to CLWA was based primarily on DWR s 2015 DCR. For the four hydrologic conditions evaluated here, the SWP deliveries to CLWA were taken from DWR s analyses based on the following: average/normal year based on the average deliveries over the studies 82-year historical hydrologic study period ( ), single-dry year based on a repeat of the worst-case actual allocation of 2014, four year dry period based on a repeat of the historical drought of , and three-year dry period based on a repeat of the historical drought of While contractors may store their unused Table A supply as carryover, and additional types of water such as Article 21 water and Turnback Pool water may periodically be available from the SWP, these are not included as supplies in Section 6 because of the uncertainty in their availability. However, to the extent CLWA is able to make use of these supplies when available, CLWA may be able to improve the reliability of its SWP supplies beyond the values used in this section. Santa Clarita Valley Urban Water Management Plan Page 6-3
322 2015 Santa Clarita Valley Urban Water Management Plan As discussed in more detail in Section 3 (see Section ), a planning effort to increase long-term supply reliability for both the SWP and CVP is taking place through the BDCP/Cal WaterFix process. While the proposed conveyance facilities that are part of the BDCP/Cal WaterFix would increase SWP supply reliability, that increase is not included here. Any of the proposed facilities that are completed could increase SWP reliability beyond the values used throughout this Plan Flexible Storage Account Under the Supply Contracts with DWR for SWP water, the contractors that share in the repayment of Castaic Lake may access a portion of the storage in that reservoir. This accessible storage is referred to as flexible storage. The contractors may withdraw water from flexible storage, in addition to their allocated Table A supplies, on an as-needed basis. A contractor must replace any water it withdraws from this storage within five years of withdrawal. As one of the three contractors sharing in the repayment of Castaic Lake, CLWA has access to this flexible storage. Its share of the total flexible storage is currently 4,684 AF. After negotiations with Ventura County water agencies in 2005 and again in 2015, CLWA gained access to their 1,376 AF of flexible storage through The terms of the existing flexible storage agreement will expire after 2025, and in this Plan is not assumed to be available beyond CLWA plans to use this supply only in dry years. For the single-dry year condition, it was assumed the entire amount would be used. For the two multiple-dry year conditions, it was assumed that the entire amount would be used sometime during the dry period, so the average annual supply during that period would be one fourth of the total for the four-year period and one third for the three-year period. Any water withdrawn was assumed to be replaced in intervening average and wet years and would be available again for use in the next dry year Buena Vista-Rosedale BVWSD and RRBWSD, both member districts of KCWA, have jointly developed a program that provides both a firm water supply of 11,000 AFY and a water banking component. This supply program provides a firm annual water supply available every year based on existing and longstanding Kern River water rights, which is delivered by exchange of Buena Vista s and Rosedale s SWP Table A supplies or directly to the California Aqueduct via the Cross Valley Canal. As discussed in Section 3.2.2, up to 3,000 AF of this supply is reserved for delivery to specific developments. Distribution of supply among the retailers is reflected in the tables in Appendix C Nickel Water-Newhall Land This supply is similar to the Buena Vista-Rosedale supply both in regard to its source (Kern River water rights) and level of reliability. The supply from this program is up to 1,607 AFY of firm supply, which is available in every year. It was acquired by the developer of the Newhall Ranch project to supplement groundwater and recycled water sources of supply for that project, which is in the CLWA service area. In this Plan, it is anticipated that this water supply will be available to VWC. Santa Clarita Valley Urban Water Management Plan Page 6-4
323 2015 Santa Clarita Valley Urban Water Management Plan Yuba Accord Water In 2008, CLWA entered into the Yuba Accord Agreement, which allows for the purchase of water from the Yuba County Water Agency through DWR to 21 SWP contractors (including CLWA) and the San Luis and Delta-Mendota Water Authority. Yuba Accord water comes from north of the Delta, and the water purchased under this agreement is subject to losses associated with transporting it through the Delta. These losses can vary from year to year, depending on Delta conditions at the time the water is transported. Under the agreement, an estimated average of up to 1,000 AFY of non-swp supply (after losses) is available to CLWA in dry years, through Under certain hydrologic conditions, additional water may be available to CLWA from this program. CLWA plans to use this supply only in dry years. For the single-dry year, it was assumed that no water would be available under this agreement. For the multiple-dry year periods, it was assumed that CLWA would purchase the maximum it could, at an average of 1,000 AFY (after losses) during the dry period Semitropic Banking Program In 2002, CLWA stored 24,000 AF of its allocated SWP Table A supply through a groundwater banking agreement with Semitropic. In 2004, CLWA stored 32,522 AF of its 2003 allocated SWP Table A supply in a second Semitropic storage account. Under the terms of those agreements, and after consideration for losses within the groundwater basin, CLWA could withdraw up to 50,870 AF through 2013 to meet CLWA water demands when needed. CLWA executed an amendment for a ten-year extension of each banking agreement with Semitropic in April After withdrawals in 2009, 2010, and 2014, the storage balance available to CLWA was 35,970 AF. In 2015 the Agency entered into an agreement with Semitropic to participate in the SWRU. Under this agreement, the two short-term accounts containing 35,970 AF were transferred into this new program. Under the SWRU agreement the Agency can store and recover additional water within a 15,000 AF account. The term of the Semitropic Banking Program extends through 2035 with the option of a 10 year renewal. The Agency may withdraw 5,000 AFY from its account. Current operational planning includes use of the water stored in Semitropic for dry-year supply. It was assumed that 5,000 AFY of supplies would be available in both single-dry year and multiple-dry year periods, through Semitropic Banking Program - Newhall Land As was the case for the Nickel water, the banking program was entered into by the developer of the Newhall Ranch project to firm up the reliability of the water supply for the project, which is in the CLWA service area. The storage capacity of this program is 55,000 AF. At the end of 2015, Newhall Land had 32,507 AF stored in this program. It is anticipated that this supply will be available to VWC. VWC plans to use this supply only in dry years. For the single-dry year, supplies were assumed at the program s maximum withdrawal capacity of 4,950 AFY. For the multiple-dry year period, Santa Clarita Valley Urban Water Management Plan Page 6-5
324 2015 Santa Clarita Valley Urban Water Management Plan supplies in each year of the dry period were assumed at the program s maximum withdrawal capacity of 4,950 AFY and that additional supplies would be banked during wetter years to allow withdrawal of this amount Rosedale-Rio Bravo Banking Program RRBWSD has also developed a water banking and exchange program. CLWA has entered into a long-term agreement with RRBWSD which provides it with a total storage capacity of 100,000 AF. Withdrawals from the program can be made by exchange of Rosedale s SWP Table A supply, or by pumpback into the California Aqueduct. CLWA began storing water in this program in At the beginning of 2014, the recoverable storage in the program after groundwater and other losses was 100,000 AF. Withdrawals from the water bank occurred in 2014 and 2015 for a total recovery of 5,822 AF leaving 94,178 AF currently available for withdrawal. CLWA s existing firm withdrawal capacity in this program is 3,000 AFY. To enhance dry-year recovery capacity, in 2015, CLWA in cooperation with RRBWSD and Irvine Ranch Water District initiated construction of additional facilities that are anticipated to be available at the end of 2016 or the beginning of With these facilities the firm extraction capacity is estimated to increase to 10,000 AFY even in exceptionally dry conditions such as those experienced in 2014 and In addition, CLWA has the right under the contract to develop four additional wells which would bring the firm recovery capacity to 20,000 AFY. This additional capacity is anticipated to be available by In addition to this firm capacity, in moderately dry years, Rosedale is required to use up to 20,000 AFY of other available recovery capacity to meet its recovery obligations under the banking agreement. For both the single-dry year and multipledry year periods, it was assumed that only the firm withdrawal capacity would be available, with the existing capacity of 3,000 AFY available through 2050, and planned expansions of 7,000 AFY (to a total of 10,000 AFY) available through 2025 and an additional 10,000 AFY (to a total of 20,000 AFY) available by While during a multiple-dry year period RRBWSD would likely be able to use its other recovery capacity to make additional withdrawals, to be conservative in this Plan, no additional withdrawals were assumed to be made Rosedale-Rio Bravo Exchange Program In 2011, CLWA executed a ten-year Two-for-One Water Exchange Program with RRBWSD where CLWA can recover one acre-foot of water for each two acre-feet it delivered to RRBWSD (less losses). In 2011, CLWA delivered 15,602 AF to the program, delivered another 3,969 AF in 2012 and, after program losses, has 9,509 AF of recoverable water. For a single dry year it was assumed that this supply would not be available to CLWA. For the multiple-dry year periods, it was assumed that the entire amount would be accessible and used sometime during the dry period, so the average annual supply during that period would be one fourth of the total available for the four-year period, and one third for the three-year period, through West Kern Exchange Program In 2011, CLWA also executed a ten-year Two-for-One Water Exchange Program with the West Kern Water District in Kern County and delivered 5,000 AF in 2011, resulting in a recoverable total of 2,500 AF. In 2014, 2,000 AF of water was withdrawn from the West Kern Water District Two-for-One exchange program leaving a balance of 500 AF. For a single dry year it was Santa Clarita Valley Urban Water Management Plan Page 6-6
325 2015 Santa Clarita Valley Urban Water Management Plan assumed that this supply would not be available to CLWA. For the multiple-dry year periods, it was assumed that the entire amount would be accessible and used sometime during the dry period, so the average annual supply during that period would be one fourth of the total available for the four-year period, and one third for the three-year period, through Additional Planned Banking CLWA has identified a need for additional banking programs to replace the Semitropic Banking Program that will expire in While a specific banking program has not yet been identified, CLWA s plans call for development of additional groundwater banking programs with firm pumpback capacity of at least an additional 5,000 AFY for use in single-dry year and multipledry year periods. 6.4 Supply and Demand Comparisons The available supplies and water demands for CLWA s service area were analyzed to assess the region s ability to satisfy demands during four scenarios: a normal water year, a single-dry year, and two multiple-dry year periods. The tables in this section present the supplies and demands for these scenarios for the projected planning period of in five year increments. The available supplies and water demands broken down by purveyor during the same four scenarios were also analyzed over the project planning period, and these tables are provided in Appendix C. Table 6-1 presents the base years for the development of water year data. Tables 6-2, 6-3, 6-4A, and 6-4B at the end of this section summarize, respectively, Normal Water Year, Single-Dry Year, Four-Year Dry Period, and Three-Year Dry Period supplies and demands. The reader is referred to Section 2 for development of retail purveyor demands and current and projected water supplies are developed in Sections 3 and 4. TABLE 6-1 BASIS OF WATER YEAR DATA Water Year Type Base Years Historical Sequence Normal Water Year Average Single-Dry Year Multiple-Dry Years -- Four-Year Dry Period Three-Year Dry Period Normal Water Year Table 6-2 summarizes the supplies available to meet demands over the 35-year planning period during an average/normal year. As presented in the table, the water supply is broken down into existing and planned water supply sources, including wholesale (imported) water, local supplies and banking programs. The demands shown include reductions from projected passive conservation savings, and both with and without active conservation savings. See Appendix C for the breakdown by purveyor of supplies available to meet demands over the 35-year planning period during an average/normal year. Santa Clarita Valley Urban Water Management Plan Page 6-7
326 2015 Santa Clarita Valley Urban Water Management Plan TABLE 6-2 PROJECTED AVERAGE/NORMAL YEAR SUPPLIES AND DEMANDS (AF) Existing Supplies Existing Groundwater (a) Alluvial Aquifer 24,100 24,100 24,100 24,100 24,100 24,100 24,100 Saugus Formation 7,445 7,445 7,445 7,445 7,445 7,445 7,445 Total Groundwater 31,545 31,545 31,545 31,545 31,545 31,545 31,545 Recycled Water (b) Total Recycled Imported Water State Water Project (c) 58,800 58,500 58,300 58,100 58,100 58,100 58,100 Flexible Storage Accounts (d) Buena Vista-Rosedale 11,000 11,000 11,000 11,000 11,000 11,000 11,000 Nickel Water - Newhall Land (e) 1,607 1,607 1,607 1,607 1,607 1,607 1,607 Yuba Accord (d) Total Imported 71,407 71,107 70,907 70,707 70,707 70,707 70,707 Banking and Exchange Programs (d) Rosedale Rio-Bravo Bank Semitropic Bank Semitropic - Newhall Land Bank Rosedale Rio-Bravo Exchange West Kern Exchange Total Bank/Exchange Total Existing Supplies 103, , , , , , ,702 Planned Supplies Future Groundwater (f) Alluvial Aquifer (g) 2,000 4,000 5,000 7,000 7,000 7,000 7,000 Saugus Formation (Restored) (h) 3,230 3,230 3,230 3,230 3,230 3,230 3,230 Saugus Formation (New) (i) Total Groundwater 5,230 7,230 8,230 10,230 10,230 10,230 10,230 Recycled Water (j) Total Recycled 565 5,156 7,627 9,604 9,604 9,604 9,604 Planned Banking Programs (d) Santa Clarita Valley Urban Water Management Plan Page 6-8
327 2015 Santa Clarita Valley Urban Water Management Plan Rosedale Rio-Bravo Bank Additional Bank Total Banking Total Planned Supplies 5,795 12,386 15,857 19,834 19,834 19,834 19,834 Total Existing and Planned Supplies 109, , , , , , ,536 Demands (k) Demand w/ Plumbing Code Savings 76,700 84,800 92, , , , ,400 Demand w/ Plumbing Code savings 68,900 74,600 80,800 86,100 88,500 90,900 93,900 and Active Conservation Notes: (a) Existing groundwater supplies represent the quantity of groundwater anticipated to be pumped with existing wells. As indicated in Tables 3-8 and 3-9, and in Tables 3-4 and 3-5 of the 2009 Groundwater Basin Yield Analysis, individual purveyors may have well capacity in excess of quantities shown in this table. As indicated in Table 3-10, existing and planned groundwater pumping remain within the groundwater operating plan shown on Table 3-5. (b) Existing recycled water is actual use in (c) SWP supplies from Table 3-2, based on average deliveries from 2015 DCR. (d) Not needed in average/normal years. (e) Existing Newhall Land supply committed under approved Newhall Ranch Specific Plan. Assumed to be transferred to CLWA or VWC during Newhall Ranch development, and available for annual purchase prior to that. (f) Planned groundwater supplies represent new groundwater well capacity that may be required by an individual purveyor s production objectives in the Alluvial Aquifer and the Saugus Formation. As indicated in Table 3-10, existing and planned groundwater pumping remain within the groundwater operating plan shown on Table 3-5. (g) Represents a shift in current agricultural pumping by Newhall Land and Farming to VWC due to the development of Newhall Ranch. (h) VWC Well 201 is planned to be returned to service by 2017 with treatment under a permit from the DDW. (i) Up to four new and replacement wells are planned to provide additional dry-year supply and would typically be used only during dry years. (j) Planned recycled water is total projected recycled water demand from Table 4-3 less existing use. Refer to Section 4, including Section 4.4, for further discussion and information regarding factors having the potential to affect the availability of recycled water supplies. (k) Demands are Regional Summary demands from Table Santa Clarita Valley Urban Water Management Plan Page 6-9
328 2015 Santa Clarita Valley Urban Water Management Plan Single-Dry Year The water supplies and demands for the water suppliers over the 35-year planning period were analyzed in the event that a single-dry year occurs, similar to the drought that occurred in California in Table 6-3 summarizes the existing and planned supplies available to meet demands during a single-dry year. The demands shown include reductions from projected passive conservation savings, and both with and without active conservation savings. The demand during dry years was assumed to increase by 10 percent. See Appendix C for the breakdown by purveyor of supplies available to meet demands over the 35-year planning period during a single-dry year. Santa Clarita Valley Urban Water Management Plan Page 6-10
329 2015 Santa Clarita Valley Urban Water Management Plan TABLE 6-3 PROJECTED SINGLE-DRY YEAR SUPPLIES AND DEMANDS (AF) Existing Supplies Existing Groundwater (a) Alluvial Aquifer 20,350 20,350 20,350 20,350 20,350 20,350 20,350 Saugus Formation 19,865 19,865 19,865 19,865 19,865 19,865 19,865 Total Groundwater 40,215 40,215 40,215 40,215 40,215 40,215 40,215 Recycled Water (b) Total Recycled Imported Water State Water Project (c) 4,800 4,800 4,800 4,800 4,800 4,800 4,800 Flexible Storage Accounts (d) 6,060 6,060 4,680 4,680 4,680 4,680 4,680 Buena Vista-Rosedale 11,000 11,000 11,000 11,000 11,000 11,000 11,000 Nickel Water - Newhall Land (e) 1,607 1,607 1,607 1,607 1,607 1,607 1,607 Yuba Accord (f) Total Imported 23,467 23,467 22,087 22,087 22,087 22,087 22,087 Banking and Exchange Programs Rosedale Rio-Bravo Bank (g) 3,000 3,000 3,000 3,000 3,000 3,000 3,000 Semitropic Bank (h) 5,000 5,000 5,000 5,000 5,000 5,000 - Semitropic - Newhall Land Bank (i) 4,950 4,950 4,950 4,950 4,950 4,950 4,950 Rosedale Rio-Bravo Exchange (j) West Kern Exchange (j) Total Bank/Exchange 12,950 12,950 12,950 12,950 12,950 12,950 7,950 Total Existing Supplies 77,082 77,082 75,702 75,702 75,702 75,702 70,702 Planned Supplies Future Groundwater (k) Alluvial Aquifer (l) 2,000 4,000 5,000 7,000 7,000 7,000 7,000 Saugus Formation (Restored) (m) 3,775 3,775 3,775 3,775 3,775 3,775 3,775 Saugus Formation (New) (n) 9,560 9,560 9,560 9,560 9,560 9,560 9,560 Total Groundwater 15,335 17,335 18,335 20,335 20,335 20,335 20,335 Recycled Water (o) Total Recycled 565 5,156 7,627 9,604 9,604 9,604 9,604 Planned Banking Programs Rosedale Rio-Bravo Bank (p) 7,000 7,000 17,000 17,000 17,000 17,000 17,000 Additional Bank (q) ,000 Total Banking 7,000 7,000 17,000 17,000 17,000 17,000 22,000 Santa Clarita Valley Urban Water Management Plan Page 6-11
330 2015 Santa Clarita Valley Urban Water Management Plan Total Planned Supplies 22,900 29,491 42,962 46,939 46,939 46,939 51,939 Total Existing and Planned Supplies 99, , , , , , ,641 Demands (r) Demand w/ Plumbing Code Savings 84,400 93, , , , , ,400 Demand w/ Plumbing Code Savings 75,800 82,100 88,900 94,700 97, , ,300 and Active Conservation Notes: (a) Existing groundwater supplies represent the quantity of groundwater anticipated to be pumped with existing wells. As indicated in Tables 3-8 and 3-9 and Tables 3-4 and 3-5 of the 2009 Groundwater Basin Yield Analysis, individual purveyors may have well capacity in excess of quantities shown in this table. As indicated in Table 3-11, existing and planned groundwater pumping remain within the groundwater operating plan shown on Table 3-5. (b) Existing recycled water is actual use in (c) SWP supplies from Table 3-2, based on worst case actual allocation of (d) Includes both CLWA and Ventura County entities flexible storage accounts. Extended term of agreement with Ventura County entities expires after (e) Existing Newhall Land supply committed under approved Newhall Ranch Specific Plan. Assumed to be transferred to CLWA or VWC during Newhall Ranch development, and available for annual purchase prior to that. (f) For single dry year, it was assumed that no water would be available under Yuba Accord. (g) CLWA has an existing firm withdrawal capacity of 3,000 AFY and a storage capacity of 100,000 AF. There is currently 94,178 AF of recoverable water in storage. (h) CLWA has a maximum firm withdrawal capacity of 5,000 AFY and a storage capacity of 15,000 AF. Additionally, CLWA has 35,970 AF of recoverable water stored which may be recovered using this withdrawal capacity. (i) Newhall Land has a maximum withdrawal capacity of 4,950 AFY and a storage capacity of 55,000 AF. At the end of 2015 there was 32,507 AF of recoverable water. This is an existing Newhall Land supply, assumed to be transferred to CLWA or VWC during Newhall Ranch development, with firm withdrawal capacity made available to CLWA prior to that. Delivery of stored water from this program is assumed available to VWC. (j) Exchange recovery assumed to be unavailable in single dry year. Term of exchange program is through (k) Planned groundwater supplies represent supplies from new groundwater wells that may be required by an individual purveyor s production objectives in the Alluvial Aquifer and the Saugus Formation, including 3,775 AFY of restored production from VWC Well 201 and approximately 9,560 AFY from replacement and new Saugus Formation wells. When combined with existing purveyor and non-purveyor groundwater supplies, total groundwater production is consistent with the 1977 single dry-year levels identified in Table 3-8 of the 2009 Groundwater Basin Yield Analysis. As indicated in Table 3-11, existing and planned groundwater pumping remain within the groundwater operating plan shown on Table 3-5. (l) Represents a shift in current agricultural pumping by Newhall Land and Farming to VWC due to the development of Newhall Ranch. (m) VWC Well 201 is planned to be returned to service by 2017 with treatment under a permit from the DDW. (n) Up to four new and replacement wells are planned to provide additional dry-year supply and would typically be used only during dry years. (o) Planned recycled water is total projected recycled water demand from Table 4-3 less existing use. Refer to Section 4, including Section 4.4, for further discussion and information regarding factors having the potential to affect the availability of recycled water supplies. (p) Firm withdrawal capacity under existing Rosedale Rio-Bravo Banking Program to be expanded by 7,000 AFY by 2017 (for a total of 10,000 AFY) and an additional 10,000 AFY by (q) Additional banking program with firm withdrawal capacity of5,000 AFY by (r) Demands are Regional Summary demands from Table Includes a 10 percent increase in demand during dry years. Santa Clarita Valley Urban Water Management Plan Page 6-12
331 2015 Santa Clarita Valley Urban Water Management Plan Multiple-Dry Year The water supplies and demands for the water suppliers water supply over the 35-year planning period were analyzed in the event that a four-year dry period occurs, similar to the drought that occurred during the years 1931 to 1934, as well as a three-year dry period, similar to the drought that occurred during the years Tables 6-4A and 6-4B summarize the existing and planned supplies available to meet demands during a four-year dry period and a three-year dry period, respectively. The demands shown include reductions from projected passive conservation savings, and both with and without active conservation savings. The demand during dry years was assumed to increase by 10 percent. See Appendix C for the breakdown by purveyor of supplies available to meet demands over the 35-year planning period during these two multiple-dry year periods. Santa Clarita Valley Urban Water Management Plan Page 6-13
332 2015 Santa Clarita Valley Urban Water Management Plan TABLE 6-4A PROJECTED FOUR-YEAR DRY YEAR SUPPLIES AND DEMANDS (AF) Existing Supplies Existing Groundwater (a) Alluvial Aquifer 20,350 20,350 20,350 20,350 20,350 20,350 20,350 Saugus Formation 15,825 15,825 15,825 15,825 15,825 15,825 15,825 Total Groundwater 36,175 36,175 36,175 36,175 36,175 36,175 36,175 Recycled Water (b) Total Recycled Imported Water State Water Project (c) 31,400 31,400 31,400 31,400 31,400 31,400 31,400 Flexible Storage Accounts (d) 1,515 1,515 1,170 1,170 1,170 1,170 1,170 Buena Vista-Rosedale 11,000 11,000 11,000 11,000 11,000 11,000 11,000 Nickel Water - Newhall Land (e) 1,607 1,607 1,607 1,607 1,607 1,607 1,607 Yuba Accord (f) 1,000 1, Total Imported 46,522 46,522 45,177 45,177 45,177 45,177 45,177 Banking and Exchange Programs Rosedale Rio-Bravo Bank (g) 3,000 3,000 3,000 3,000 3,000 3,000 3,000 Semitropic Bank (h) 5,000 5,000 5,000 5,000 5,000 5,000 - Semitropic - Newhall Land Bank (i) 4,950 4,950 4,950 4,950 4,950 4,950 4,950 Rosedale Rio-Bravo Exchange (j) 2, West Kern Exchange (j) Total Bank/Exchange 15,450 12,950 12,950 12,950 12,950 12,950 7,950 Total Existing Supplies 98,597 96,097 94,752 94,752 94,752 94,752 89,752 Planned Supplies Future Groundwater (k) Santa Clarita Valley Urban Water Management Plan Page 6-14
333 Recycled Water (o) Total Recycled 565 5,156 7,627 9,604 9,604 9,604 9, Santa Clarita Valley Urban Water Management Plan Alluvial Aquifer (l) 2,000 4,000 5,000 7,000 7,000 7,000 7,000 Saugus Formation (Restored) (m) 3,775 3,775 3,775 3,775 3,775 3,775 3,775 Saugus Formation (New) (n) 11,100 11,100 11,100 11,100 11,100 11,100 11,100 Total Groundwater 16,875 18,875 19,875 21,875 21,875 21,875 21,875 Planned Banking Programs Rosedale Rio-Bravo Bank (p) 7,000 7,000 17,000 17,000 17,000 17,000 17,000 Additional Bank (q) ,000 Total Banking 7,000 7,000 17,000 17,000 17,000 17,000 22,000 Total Planned Supplies 24,440 31,031 44,502 48,479 48,479 48,479 53,479 Total Existing and Planned Supplies 123, , , , , , ,231 Demands (r) Demand w/ Plumbing Code Savings 84,400 93, , , , , ,400 Demand w/ Plumbing Code Savings 75,800 82,100 88,900 94,700 97, , ,300 and Active Conservation Notes: (a) Existing groundwater supplies represent the quantity of groundwater anticipated to be pumped with existing wells. As indicated in Tables 3-8 and 3-9, and in Tables 3-4 and 3-5 of the 2009 Groundwater Basin Yield Analysis, individual purveyors may have well capacity in excess of quantities shown in this table. As indicated in Table 3-12A, existing and planned groundwater pumping remain within the groundwater operating plan shown on Table 3-5. (b) Existing recycled water is actual use in (c) SWP supplies from Table 3-2, based on supplies from 2105 DCR. (d) Includes both CLWA and Ventura County entities flexible storage accounts. Extended term of agreement with Ventura County entities expires after (e) Existing Newhall Land supply committed under approved Newhall Ranch Specific Plan. Assumed to be transferred to CLWA or VWC during Newhall Ranch development, and available for annual purchase prior to that. (f) For the multiple-dry year period, it was assumed that CLWA would purchase the maximum it could, an estimated average of 1,000 AFY (after losses) during the four-year period, through (g) CLWA has an existing firm withdrawal capacity of 3,000 AFY and a storage capacity of 100,000 AF. There is currently 94,178 AF of recoverable water in storage. (h) CLWA has a maximum firm withdrawal capacity of 5,000 AFY and a storage capacity of 15,000 AF. Additionally, CLWA has 35,970 AF of recoverable water stored which may be recovered using this withdrawal capacity. (i) Newhall Land has a maximum withdrawal capacity of 4,950 AFY and a storage capacity of 55,000 AF. At the end of 2015 there was 32,507 AF of recoverable water. This is an existing Newhall Land supply, assumed to be transferred to CLWA or VWC during Newhall Ranch development, with firm Santa Clarita Valley Urban Water Management Plan Page 6-15
334 2015 Santa Clarita Valley Urban Water Management Plan withdrawal capacity made available to CLWA prior to that. Delivery of stored water from this program is assumed available to VWC. (j) Exchange recovery was assumed to occur sometime during the four-year dry period, for an average annual supply of one-fourth of the total recoverable water available (total recoverable is 9,509 AF from Rosedale-Rio Bravo and 500 AF from West Kern exchange programs). (k) Planned groundwater supplies represent supplies from new groundwater wells that may be required by an individual purveyor s production objectives in the Alluvial Aquifer and the Saugus Formation, including 3,775 AFY of restored production from VWC Well 201 and approximately 11,000 AFY from replacement and new Saugus Formation wells. When combined with existing purveyor and non-purveyor groundwater supplies, total groundwater production is consistent with the multiple dry-year levels identified in Table 3-8 of the 2009 Groundwater Basin Yield Analysis. As indicated in Table 3-12A, existing and planned groundwater pumping remain within the groundwater operating plan shown on Table 3-5. (l) Represents a shift in current agricultural pumping by Newhall Land and Farming to VWC due to the development of Newhall Ranch. (m) VWC Well 201 is planned to be returned to service by 2017 with treatment under a permit from the DDW. (n) Up to four new and replacement wells are planned to provide additional dry-year supply and would typically be used only during dry years. (o) Planned recycled water is total projected recycled water demand from Table 4-3 less existing use. Refer to Section 4, including Section 4.4, for further discussion and information regarding factors having the potential to affect the availability of recycled water supplies. (p) Firm withdrawal capacity under existing Rosedale Rio-Bravo Banking Program to be expanded by 7,000 AFY by 2017 (for a total of 10,000 AFY) and an additional 10,000 AFY by (q) Additional banking program with firm withdrawal capacity of 5,000 AFY by (r) Demands are Regional Summary demands from Table Includes a 10 percent increase in demand during dry years. Santa Clarita Valley Urban Water Management Plan Page 6-16
335 2015 Santa Clarita Valley Urban Water Management Plan Existing Supplies Existing Groundwater (a) TABLE 6-4B PROJECTED THREE-YEAR DRY YEAR SUPPLIES AND DEMANDS (AF) Alluvial Aquifer 20,350 20,350 20,350 20,350 20,350 20,350 20,350 Saugus Formation 15,525 15,525 15,525 15,525 15,525 15,525 15,525 Total Groundwater 35,875 35,875 35,875 35,875 35,875 35,875 35,875 Recycled Water (b) Total Recycled Imported Water State Water Project (c) 19,800 19,500 19,300 19,000 19,000 19,000 19,000 Flexible Storage Accounts (d) 2,020 2,020 1,560 1,560 1,560 1,560 1,560 Buena Vista-Rosedale 11,000 11,000 11,000 11,000 11,000 11,000 11,000 Nickel Water - Newhall Land (e) 1,607 1,607 1,607 1,607 1,607 1,607 1,607 Yuba Accord (f) 1,000 1, Total Imported 35,427 35,127 33,467 33,167 33,167 33,167 33,167 Banking and Exchange Programs Rosedale Rio-Bravo Bank (g) 3,000 3,000 3,000 3,000 3,000 3,000 3,000 Semitropic Bank (h) 5,000 5,000 5,000 5,000 5,000 5,000 - Semitropic - Newhall Land Bank (i) 4,950 4,950 4,950 4,950 4,950 4,950 4,950 Rosedale Rio-Bravo Exchange (j) 3, West Kern Exchange (j) Total Bank/Exchange 16,284 12,950 12,950 12,950 12,950 12,950 7,950 Total Existing Supplies 88,036 84,402 82,742 82,442 82,442 82,442 77,442 Planned Supplies Future Groundwater (k) Alluvial Aquifer (l) 2,000 4,000 5,000 7,000 7,000 7,000 7,000 Santa Clarita Valley Urban Water Management Plan Page 6-17
336 Recycled Water (o) Total Recycled 565 5,156 7,627 9,604 9,604 9,604 9, Santa Clarita Valley Urban Water Management Plan Saugus Formation (Restored) (m) 3,775 3,775 3,775 3,775 3,775 3,775 3,775 Saugus Formation (New) (n) 10,550 10,550 10,550 10,550 10,550 10,550 10,550 Total Groundwater 16,325 18,325 19,325 21,325 21,325 21,325 21,325 Planned Banking Programs Rosedale Rio-Bravo Bank (p) 7,000 7,000 17,000 17,000 17,000 17,000 17,000 Additional Bank (q) ,000 Total Banking 7,000 7,000 17,000 17,000 17,000 17,000 22,000 Total Planned Supplies 23,890 30,481 43,952 47,929 47,929 47,929 52,929 Total Existing and Planned Supplies 111, , , , , , ,371 Demands (r) Demand w/ Plumbing Code Savings 84,400 93, , , , , ,400 Demand w/ Plumbing Code Savings 75,800 82,100 88,900 94,700 97, , ,300 and Active Conservation Notes: (a) Existing groundwater supplies represent the quantity of groundwater anticipated to be pumped with existing wells. As indicated in Tables 3-8 and 3-9, and in Tables 3-4 and 3-5 of the 2009 Groundwater Basin Yield Analysis, individual purveyors may have well capacity in excess of quantities shown in this table. As indicated in Table 3-12B, existing and planned groundwater pumping remain within the groundwater operating plan shown on Table 3-5. (b) Existing recycled water is actual use in (c) SWP supplies from Table 3-2, based on supplies from 2105 DCR. (d) Includes both CLWA and Ventura County entities flexible storage accounts. Extended term of agreement with Ventura County entities expires after (e) Existing Newhall Land supply committed under approved Newhall Ranch Specific Plan. Assumed to be transferred to CLWA or VWC during Newhall Ranch development, and available for annual purchase prior to that. (f) For the multiple-dry year period, it was assumed that CLWA would purchase the maximum it could, an estimated average of 1,000 AFY (after losses) during the four-year period, through (g) CLWA has an existing firm withdrawal capacity of 3,000 AFY and a storage capacity of 100,000 AF. There is currently 94,178 AF of recoverable water in storage. (h) CLWA has a maximum firm withdrawal capacity of 5,000 AFY and a storage capacity of 15,000 AF. Additionally, CLWA has 35,970 AF of recoverable water stored which may be recovered using this withdrawal capacity. (i) Newhall Land has a maximum withdrawal capacity of 4,950 AFY and a storage capacity of 55,000 AF. At the end of 2015 there was 32,507 AF of recoverable water. This is an existing Newhall Land supply, assumed to be transferred to CLWA or VWC during Newhall Ranch development, with firm withdrawal capacity made available to CLWA prior to that. Delivery of stored water from this program is assumed available to VWC. Santa Clarita Valley Urban Water Management Plan Page 6-18
337 2015 Santa Clarita Valley Urban Water Management Plan (j) Exchange recovery was assumed to occur sometime during the three-year dry period, for an average annual supply of one-third of the total recoverable water available (total recoverable is 9,509 AF from Rosedale-Rio Bravo and 500 AF from West Kern exchange programs). (k) Planned groundwater supplies represent supplies from new groundwater wells that may be required by an individual purveyor s production objectives in the Alluvial Aquifer and the Saugus Formation, including 3,775 AFY of restored production from VWC Well 201 and approximately 10,550 AFY from replacement and new Saugus Formation wells. When combined with existing purveyor and non-purveyor groundwater supplies, total groundwater production is consistent with the multiple dry-year levels identified in Table 3-8 of the 2009 Groundwater Basin Yield Analysis. As indicated in Table 3-12B, existing and planned groundwater pumping remain within the groundwater operating plan shown on Table 3-5. (l) Represents a shift in current agricultural pumping by Newhall Land and Farming to VWC due to the development of Newhall Ranch. (m) VWC Well 201 is planned to be returned to service by 2017 with treatment under a permit from the DDW. (n) Up to four new and replacement wells are planned to provide additional dry-year supply and would typically be used only during dry years. (o) Planned recycled water is total projected recycled water demand from Table 4-3 less existing use. Refer to Section 4, including Section 4.4, for further discussion and information regarding factors having the potential to affect the availability of recycled water supplies. (p) Firm withdrawal capacity under existing Rosedale Rio-Bravo Banking Program to be expanded by 7,000 AFY by 2017 (for a total of 10,000 AFY) and an additional 10,000 AFY by (q) Additional banking program with firm withdrawal capacity of 5,000 AFY by (r) Demands are Regional Summary demands from Table Includes a 10 percent increase in demand during dry years. Santa Clarita Valley Urban Water Management Plan Page 6-19
338 6.4.4 Summary of Comparisons 2015 Santa Clarita Valley Urban Water Management Plan As shown in the analyses above, CLWA and the purveyors have adequate supplies to meet CLWA service area demands during normal, single-dry, and multiple-dry year periods throughout the 35-year planning period. Santa Clarita Valley Urban Water Management Plan Page 6-20
339 2015 Santa Clarita Valley Urban Water Management Plan Section 7: Water Demand Management Measures This section describes the water Demand Management Measures (DMMs) that CLWA and the purveyors have implemented, are currently implementing, and plan to implement in order to meet their urban water use reduction targets as part of the effort to reduce water demand in the Valley (see Section 2.7 for a discussion of SBX7-7). In the CLWA service area, demand management is addressed at both the local (retail agency) and regional (Santa Clarita Valleywide) levels. Recent UWMP legislation significantly revised the UWMP Act to simplify and clarify the DMM reporting requirements for the 2015 UWMP cycle since the 2010 UWMP. Further, since the Agency and the purveyors are members of the California Urban Water Conservation Council (CUWCC) and are signatories of the CUWCC s Memorandum of Understanding (MOU), they may submit their annual Best Management Practice (BMP) reports as required by Section 6.2 of the MOU in order to comply with this section of the UWMP Act. The Agency, SCWD, NCWD, and VWC provided their 2013 and 2014 BMP reports to satisfy the UWMP Act, all of which are included in Appendix G. It is noted that for the purposes of the UWMP Act, BMPs are equated to DMMs. Beginning with 2015 UWMPs, the purveyors must indicate how planned implementation of DMMs will help them achieve their SBX7-7 water use targets. CLWA provides both technical and financial assistance to the purveyors for this effort. CLWA also provides program support for several DMMs, and overall program implementation planning for all the purveyors on a service area-wide basis. 7.1 Demand Management For the purposes of this UWMP the DMMs are categorized as Foundational and Other. Foundational DMMs, listed below, are those DMMs that the UWMP Act and Water Code specifically mention that apply to a wholesaler such as CLWA: a) Metering b) Public education and outreach c) Water conservation program coordination and staffing support d) Other demand management measures that have a significant impact on water use as measured in gallons per capita per day, including innovative measures, if implemented. e) A narrative description of the wholesale supplier s distribution system asset management program f) Wholesale supplier assistance programs Activities outside of the Foundational DMMs that encourage less water use in the Agency s service area fall in the Other DMM category. Santa Clarita Valley Urban Water Management Plan Page 7-1
340 2015 Santa Clarita Valley Urban Water Management Plan DMMs for the water purveyors are also presented in this section. Foundational DMMs for retail purveyors, listed below, are those DMMs that the UWMP Act and Water Code specifically mention: a) Water waste prevention ordinances b) Metering c) Conservation pricing d) Public education and outreach e) Programs to assess and manage distribution system real loss a) Water conservation program coordination and staffing support Activities outside of the Foundational DMMs that encourage less water use in the Agency s service area fall in the Other DMM category Water Use Efficiency Strategic Plan In addition to meeting MOU commitments, CLWA and the purveyors are working together to identify and implement water use efficiency programs that meet long-term reduction goals. In 2008, CLWA collaborated with its retail water purveyors to complete a Santa Clarita Valley Water Use Efficiency Strategic Plan (WUESP). An update to the WUESP was prepared in The purpose of the effort is to provide a comprehensive long-term conservation plan for the Santa Clarita Valley by identifying objectives, policies and programs to meet SBX7-7 targets and attain water use efficiency goals in the most cost-effective manner. The WUESP provides a detailed study of historical and projected demands along with an analysis of historical and current DMMs, resulting in water conservation recommendations designed to ensure that future demands can be met and achieve water conservation targets of 20 percent by the year The programs are designed to provide Valley residents with the tools and education to use water more efficiently. A total of 32 water use efficiency measures were evaluated in the study, including, but not limited to high efficiency appliance and device rebates, outreach and education, and operational programs. Many of these programs have been implemented by CLWA and the purveyors since the mid-2000s. By implementing a portfolio of water use efficiency programs, CLWA, the retail purveyors and their customers benefit in a number of ways: Cost Avoidance for Purchased Water: Although the Santa Clarita Valley has projected adequate water supply for the near future, the cost of water has risen dramatically and is expected to continue to rise. The best way to avoid purchasing expensive imported water is to use less water through more efficient use. These programs are an effective efficiency mechanism. Limited State Resources: California s water resources are becoming increasingly strained due to population increases, housing growth and decreased water supply from Santa Clarita Valley Urban Water Management Plan Page 7-2
341 2015 Santa Clarita Valley Urban Water Management Plan major water projects. The current drought has further strained limited supplies. Agencies need to stretch water supplies and increase water use efficiencies. Drought Preparedness: It is inevitable that southern California, as well as the state, will experience another drought. Recent events have taught valuable lessons. The big question is when and how severe the next one will be. One way to lessen the severity of a drought s effect on the Santa Clarita Valley is to prepare in advance for this event by creating a community that uses water at a high level of efficiency. Reduced Carbon Footprint: The production, treatment and delivery of water require a tremendous amount of energy on both a statewide and local level. The Santa Clarita Valley can do its part to reduce greenhouse gases by using water more efficiently. Reduced Waste Water Flows: Sanitation plants and systems must be sized to meet historic and planned wastewater flows. Increasing the efficient use of water will result in a reduction of wastewater into the system. Reduced Urban Runoff: Achieving increased water use efficiency outdoors means less water running off landscaped areas into the streets, storm drains and ultimately into the Santa Clara River. Education efforts and installation of efficient technologies will ensure that more of our valuable water is used appropriately for landscaping and less lost to urban runoff. Improved and More Accessible Water Use Efficiency Tracking for the SWRCB: Water use efficiency metrics help determine and validate progress made in the Valley and will enable CLWA and the retail purveyors to assess if they are on track and adapt as necessary. Participation in Market Transformation: CLWA will be able to influence, among other things, water use and savings metrics as they are developed, methods for calculating metrics, and regulations that may affect the retail purveyors and their customers. 7.2 Castaic Lake Water Agency In 2001 CLWA became a signatory to the MOU and a member of the CUWCC, establishing a commitment to the implementation of water conservation BMPs or DMMs (the UWMP Act equates BMPs with DMMs). The CUWCC is a consensus-based partnership of agencies and organizations concerned with water supply and conservation of natural resources in California. By becoming a signatory, CLWA committed to implement a specific set of locally cost-effective conservation practices in its service area. Santa Clarita Valley Urban Water Management Plan Page 7-3
342 7.2.1 Foundational DMMs 2015 Santa Clarita Valley Urban Water Management Plan Metering As a wholesale entity for the Santa Clarita Valley, CLWA does not have retail customers to meter. However, CLWA does record volumetric sales to the four retail agencies in the Santa Clarita Valley Public Education and Outreach Public Information CLWA has a strong conservation outreach campaign with numerous activities and information outlets. CLWA has a water-efficient landscape demonstration garden and learning center open to the public and which hosts about 60 school classes each year. CLWA also maintains an active website ( and Facebook page with water saving tips for residents and businesses, conservation checklists and program and incentive information. CLWA uses a range of printed materials and other outreach activities to raise awareness of conservation measures available to customers. These efforts include announcements in newsletters, bill stuffers, brochures, local newspapers, billboards, signage at purveyor offices and signs on public buses School Education Started in 1993, CLWA's award-winning Education Program is dedicated to helping students learn about water treatment and conservation through age-appropriate programs. The program provides hands-on field trips and in-class presentations for every grade level at public and private schools in the Santa Clarita Valley, on behalf of all the retail purveyors service areas. More than 13,000 students attend the educational program each year. TABLE 7-1 SCHOOL EDUCATION (NUMBER OF STUDENTS) Grade Level K - 3 5,679 7,683 7,877 4,921 5, ,249 5,310 4,244 2,640 2, ,255 2, ,520 1, ,118 Totals 10,844 15,287 14,746 10,695 14, Water Conservation Program Coordination and Staffing Support CLWA has four full-time staff that works in collaboration with the retail purveyors and exclusively on conservation programs. CLWA also employs a few consultants to work on program implementation. Santa Clarita Valley Urban Water Management Plan Page 7-4
343 2015 Santa Clarita Valley Urban Water Management Plan Other DMMs Implemented Over the Last Five Years Numerous water conservation activities are described under Section below Distribution System Asset Management Program CLWA incorporates various asset management practices and procedures throughout its treatment and distribution system. Asset management practices in use or in the process of being implemented include: 1. Use and continued development and upgrade of GIS systems. 2. Implementation and ongoing maintenance of a Computerized Maintenance Management System (CMMS) for tracking and scheduling maintenance, repair and replacement of system assets. 3. Implementation of a comprehensive pipeline inspection program. 4. Annual electro-potential pipeline-to-soil surveys and evaluation of pipeline system. 5. Ongoing update of system hydraulic model and system evaluation. 6. Installation and monitoring of purveyor telemetry equipment and programming. 7. Development and update of long term (20 years or longer) repair and rehabilitation schedule and costs Wholesale Supplier Assistance Programs CLWA provides both technical and financial assistance to the retail purveyors for implementation of BMP or DMM programs. In addition to the requirements specified in the BMPs, CLWA provides the following support to its retail purveyors: Program Planning: CLWA has been working closely with the purveyors to implement the programs identified in the updated 2015 WUESP. Residential Landscape Program: This program targeting homeowners in the Santa Clarita Valley is a distribution program of weather-based irrigation controllers (WBICs). After completing a training class, a resident receives one free WBIC to install on their property within the service area. The installation is inspected by a consultant of CLWA. Lawn Replacement Program: In July of 2014, CLWA launched a Lawn Replacement Program providing $2 for each square foot of living grass removed, up to a maximum of 2,500 square feet per residence. Due to the overwhelming popularity of the program, a wait list was begun in September 2015 for customers still interested in participating. Customers are pulled from the wait list and accepted into the program as funds become available. Santa Clarita Valley Urban Water Management Plan Page 7-5
344 2015 Santa Clarita Valley Urban Water Management Plan Large Landscape/Commercial, Industrial & Institutional (CII) Program: This program offers businesses and institutions, homeowners associations, parks and landscape maintenance divisions the opportunity to receive rebates for weather-based irrigation controllers and turf removal. High Efficiency (HE) Toilet Replacement Program: HE toilet replacement vouchers were provided to retail purveyors for distribution from 2006 through Homes older than 1993 were eligible for rebates up to $80 per toilet. HE Clothes Washing Machine Program: CLWA and the retail purveyors offered $200 rebates toward the purchase of high efficiency clothes washers from early 2012 through August Landscape Education Program: Free workshops are provided in a classroom and garden setting through the Santa Clarita Valley-Friendly Gardening Program for residents who want to learn more about gardening and water conservation. Workshops are offered both on Saturdays once a month and during the evening once a month. CLWA also has a water-efficient landscape demonstration garden and learning center open to the public. School and Public Information Programs: See Section Planned Implementation of DMMs to Achieve Water Use Targets CLWA will continue to implement the DMMs described in this section, and will continue to collaborate with the other retail purveyors to begin implementation of the measures outlined in the 2015 WUESP update, on a Valley-wide basis. These programs, taken together, will assist CLWA in helping its retail agencies achieve their SBX target as described in Section 2 of this UWMP. 7.3 Santa Clarita Water Division SCWD is implementing programs locally as well as leveraging the conservation resources available through CLWA. SCWD is currently implementing all of the BMPs and DMMs as required in the MOU and UWMP Act. The following sections provide an overview of the various programs and conservation activities implemented by SCWD. The 2013 and 2014 BMP reports are included in Appendix G. SCWD is in compliance with the requirements of the MOU. SCWD joined CLWA and the other retail water purveyors in completing the 2008 WUESP, and in the update to the WUESP in The updated WUESP recommended programs to reduce the overall valley-wide water demand by twenty percent by These programs were designed to provide Valley residents with the tools and education to use water more efficiently. Santa Clarita Valley Urban Water Management Plan Page 7-6
345 7.3.1 Foundational DMMs 2015 Santa Clarita Valley Urban Water Management Plan Water Waste Prohibition SCWD supports water waste prevention activities through both direct Board activities and in collaboration with the City of Santa Clarita and County of Los Angeles. In 2008, the Santa Clarita Valley Family of Water Suppliers, which includes SCWD, prepared a Voluntary Water Conservation Action Plan, calling on residents and businesses to take actions to reduce water use and eliminate waste. Both indoor and outdoor water use efficiency guidelines were outlined. In February 2014, in response to drought conditions, a Santa Clarita Valley Water Action Plan was developed with voluntary actions for indoor and outdoor water use efficiency, and was updated in August with mandatory actions. Ordinance No. 43, which was adopted in June 2015 and now takes precedence, outlines water use restrictions that are applicable to SCWD at all times. These restrictions are intended to promote water conservation and prevent the waste, unreasonable use or unreasonable method of use of water and include: restrictions on specific outdoor watering and potable water use; restrictions for food service establishments, hotels and motels; and requirements on leak repairs. The Ordinance is included in Appendix F Metering All of SCWD s customers are metered and billed volumetrically on a monthly basis. Commercial, industrial and institutional accounts and parks are encouraged to have dedicated irrigation meters, and many do. In addition, SCWD has identified the Automated Meter Reading (AMR)/ Advanced Metering Infrastructure (AMI) technologies as a conservation priority. This technology is being implemented and will be very helpful in identifying leaks, mitigating losses, and monitoring customer usage. During the 2013/14 fiscal year, SCWD successfully conducted an AMR pilot program. Full implementation began in fiscal year 2014/15 and will continue in phases until it is implemented system-wide by fiscal year 2017/18. During the 2014/15 fiscal year, 13,500 AMR meters were installed, making up approximately 46 percent of the system Conservation Pricing To encourage conservation, SCWD transitioned its single-family residential customers to a three-tiered rate structure on January 1, All other customers are charged a flat rate, with irrigation customers charged at the third tier rate from the Single Family Residential customer tiered rate structure, and all other customer categories charged at the second tier rate from that rate structure. In addition, penalties will be imposed on customers for failure to comply with water conservation restrictions outlined in Ordinance No. 43. Under that ordinance, a second violation (within twelve months of the first violation) can be penalized with a fine of $50 per violation. Third and subsequent violations result in a fine of $100 per violation and an increase of $100 for each subsequent violation, up to $500 per day. Further, if a flow restrictor is installed as a result of violations, the violating customer will be responsible for the cost of installation and removal of Santa Clarita Valley Urban Water Management Plan Page 7-7
346 2015 Santa Clarita Valley Urban Water Management Plan such devices. Revenue generated from those drought penalties are used to cover staff time for drought enforcement. If surplus revenues are generated, the balance will be used for future conservation programs Public Education and Outreach Public outreach is a critical component of SCWD s conservation efforts. SCWD participates in a variety of community events, such as Earth/Arbor Day, CLWA s Open House, and Green Up! The Green Up conference, for example, was presented in 2014 by the SCV Family of Water Suppliers and promoted community action and education related to environmental sustainability. SCWD customers can attend classes about gardening and water conservation, which are provided annually through the Santa Clarita Valley-Friendly Gardening Program. SCWD provides water conservation tips and related information on its website ( monthly bill statements, bill stuffers, Twitter account, Facebook page and monthly e-newsletter. SCWD also communicates with its customers in coordination with CLWA through a variety of media outlets including flyers, local television, radio and newspapers. School Education Programs SCWD implements its school programs in coordination with the CLWA, reaching thousands of students a year since The CLWA s award winning program is available to grades K through high school and includes in-class presentations and field trips Programs to Assess and Manage Distribution System Real Loss SCWD monitors its water losses on a monthly basis. SCWD has also completed AWWA s M36 Water Loss analysis, which consists of a component analysis of leaks into revenue and nonrevenue categories, among others, and an economic analysis of recoverable loss. The most recent component analysis was completed during the 2014/15 fiscal year. SCWD s M36 Reporting Worksheet is provided in Appendix D Water Conservation Program Coordination and Staffing Support SCWD s conservation program is managed and administered in various ways. Internally, management, administration and oversight of SCWD conservation programs have been the responsibility of the Associate Water Resources Planner and the Retail Manager. In addition, SCWD has helped fund a conservation coordinator position at CLWA since 2004; this position supports regional planning and implementation. SCWD has also utilized consultant services to support program planning and management as well as to implement the various programs including residential landscape training as well as residential, CII and large landscape audits. During the 2015/16 fiscal year, a full-time conservation coordinator position was created to lead the SCWD water conservation program. Major tasks that the water conservation coordinator will assist in completing by the end of the 2016 fiscal year include enforcement of Ordinance Santa Clarita Valley Urban Water Management Plan Page 7-8
347 2015 Santa Clarita Valley Urban Water Management Plan No. 43 water use restrictions, reevaluation and prioritization of outreach targets and methods, and additional promotion of water conservation programs Other DMMs Implemented Over the Last Five Years Over the last five years, SCWD has been offering and promoting numerous water conservation programs, including the following: Lawn replacement program: SCWD customers can apply for turf removal rebates through CLWA s program. Large landscape turf removal rebates are also offered for HOAs, parks, businesses, and schools through CLWA s programs. Drip conversion kit program: Kits are offered to SCWD residential customers to convert their existing spray heads into a drip system. Each customer account can receive up to 3 kits. HE sprinkler nozzles: SCWD customers can receive free high efficiency sprinkler nozzles, up to 25 per residence and 100 for businesses, non-profits or schools. The program is administered through the FreeSprinklerNozzles.com program. WBIC rebate program: SCWD s customers can apply for free WBICs through the program administered by CLWA. Smart controller rebates are also available for large landscapes, including HOA s, parks, businesses, and schools. HE clothes washer: In a partnership with CLWA, SCWD offered rebates of $200 for high efficiency clothes washing machines. The program, administered by the SCV Family of Water Suppliers, was in effect from early 2012 through August HE toilet program: SCWD customers were offered rebates for purchase and installation of high efficiency toilets through CLWA s program. This program in partnership with CLWA, ended in fiscal year 2013/14, however SCWD provides a link on its website to the ongoing DWR toilet rebate program. Faucet and kitchen aerators: SCWD offers bathroom faucet aerators that use 1 gallon per minute and swivel kitchen aerators that use 1.5 gallons per minute. Hose nozzles: SCWD customers can receive up to 2 free automatic shutoff hose nozzles. Low-flow showerheads: SCWD customers can receive up to 2 free low-flow shower heads. Drip irrigation conversion: SCWD customers served by commercial, dedicated irrigation, single family residential, or multi-family water meters may receive rebates of $0.25 per square foot of area converted to drip irrigation. Santa Clarita Valley Urban Water Management Plan Page 7-9
348 2015 Santa Clarita Valley Urban Water Management Plan Large Landscape Budgets: SCWD completed water budgets both internally and through an outside consultant for large landscape users to review usage and to compare usage with estimated water budgets Planned Implementation of DMMs to Achieve Water Use Targets SCWD will focus its investments on drip irrigation, sprinkler nozzle rebates, HE devices, and water waste enforcement programs outlined in the 2015 WUESP. To compliment these efforts in conservation, SCWD encourages its customers to participate in turf removal and SMART controller programs available through CLWA. SCWD is also evaluating and budgeting for new programs to assist customers with understanding their water usage and purchasing additional water saving devices. 7.4 Newhall County Water District NCWD is dedicated to water conservation through public outreach, education, and various incentive tools by implementing programs locally as well as leveraging the conservation resources available through CLWA. In 2002, NCWD became a signatory to the CUWCC MOU, establishing a firm commitment to the implementation of the BMPs or DMMs. Many of NCWD s conservation programs have been ongoing since 2003 or earlier. NCWD subsequently joined CLWA and the other retail water purveyors in completing the 2008 WUESP, and in the update to the WUESP prepared in The updated WUESP recommends programs to reduce the overall valley-wide water demand by twenty percent by These programs were designed to provide Valley residents with the tools and education to use water more efficiently. NCWD is currently implementing all of the BMPs and DMMs as required in the MOU and UWMP Act. The following sections provide an overview of the various programs and conservation activities implemented by NCWD. The 2013 and 2014 BMP reports are included in Appendix G Foundational DMMs Water Waste Prohibition Ordinance No. 112, adopted in 2005, outlines a water conservation plan which states that no water user shall waste water or make, cause, or permit the use of water for any purpose contrary the provisions in the ordinance. It lists water use efficiency guidelines and mandatory practices, as well as associated enforcement procedures. In addition, State of California, County of Los Angeles, and City of Santa Clarita ordinances also apply to NCWD customers. The ordinance is attached as Appendix F. Santa Clarita Valley Urban Water Management Plan Page 7-10
349 2015 Santa Clarita Valley Urban Water Management Plan Metering All of NCWD s customers are metered and billed volumetrically on a monthly basis. NCWD has an ongoing replacement and testing program. Approximately meters are replaced annually based on volume, age, and meter condition. In addition, meters are randomly flow tested for accuracy and the data is used to continuously revise and update the meter replacement and testing program Conservation Pricing As of July 1, 2012 a uniform volume rate structure was put in place, with a current rate of $1.85 per unit (hundred cubic feet) for all customer classes. Newly approved rates are designed to appropriately recover water system costs, address customer affordability issues and promote efficient water use. Along with the rates, on January 1, 2015 the district implemented its Water Efficiency Target WET Program for individually metered single-family and multi-family residential customers. For each residential property in the program, the customer s WET is calculated based on individually measured landscape areas using aerial imagery, specific crop coefficients (Kc), real-time evapotranspiration rates (ETo) through the states CIMIS program, and a population factor. The WET is calculated and is displayed on the customer s monthly water bill. Each WET has five tiers ranging from super-efficient (0-indoor target use), efficient (indoor target- 100% of target use), inefficient ( % of target use), excessive ( % of target use), and unsustainable (over 200% of target use). The customer can then see which tier their usage is in each month, thus allowing the customer to regulate and adjust their own water use based on their own property requirements. Through the program, NCWD also provides customers tools and incentives to help reduce water usage. By combining a uniform volume rate and our WET Program, NCWD has been able to exceed the CUWCC BMP 1.4, which is based on meeting the 70/30 volumetric/fixed rate requirement. The rates can also incorporate a Water Revenue Adjustment Factor to allow for adjustments to the commodity rate based on fluctuations in real demand. In addition to the volume rate, customers are charged a CLWA pass through charge due to increased imported water from CLWA, and a service charge based on meter size Public Education and Outreach NCWD has had a public information program since the late 1990s. NCWD distributes conservation information to new residential customers as part of a welcome package and to children through free activity books. NCWD participates in community outreach events including the Emergency Expo, Earth/Arbor Day, CLWA Water Awareness, River Rally, the Assistance League Operation School Bell, Celebrate Life Festival, Taste of Expo and Make a Difference Day throughout the year. NCWD mails its customers quarterly newsletters that include conservation tips and provide information on available rebate programs, conservation tips and links to other conservation resources on its website. Water bills were redesigned in 2015 to use new smart phone technology to allow customers to use their cell phone to link Santa Clarita Valley Urban Water Management Plan Page 7-11
350 2015 Santa Clarita Valley Urban Water Management Plan directly to conservation programs and show water usage for the prior 13 months with the current water reductions and suggest potential conservation actions. Further outreach is implemented in coordination with CLWA. Refer to Section for information on specific programs administered by CLWA. NCWD s school education program is implemented by CLWA at no cost to school districts and has reached over 10,000 students in NCWD s service area since Refer to the Section for CLWA s DMM summary of detailed information on age-appropriate presentations, activities and field trips offered to schools, as well as the Water Challenge scholarship program. NCWD has also developed a mobile app called iconserve. This app allows customers to report any type of water waste from their mobile device. Pictures, GPS coordinates, and other information can be attached to the report. In addition, customers can pay their bill, find news and information about NCWD, as well as conservation tips Programs to Assess and Manage Distribution System Real Loss NCWD conducts annual pre-screening system audits which calculate verifiable use as a percent of total production. NCWD also compares production and sales records monthly to identify losses. NCWD has completed AWWA s M36 Water Loss analysis, which consists of a component analysis of leaks into revenue and non-revenue categories, among others, and an economic analysis of recoverable loss. NCWD s M36 Reporting Worksheet for 2015 is provided in Appendix D. Results of the preliminary analysis show an Infrastructure Leakage Index (ILI) of 1.22 and a score of 76, which indicates appropriate loss control. NCWD will continue its water loss practices and review the recommendations, which include annual audits and other incremental improvements. NCWD s maintenance and water main replacement programs also help minimize water loss and help keep the NCWD production system in optimal working condition. The district annually inspects the age of pipe and leak frequency as part of its main replacement program, and schedules to replace those areas to mitigate potential water loss. The district s maintenance program consists of daily inspections of water wells and pumping equipment, weekly inspections of water tanks and exercising system valves. NCWD s meter change-out program replaces water meters in accordance with AWWA standards, both by age and usage to ensure metering accuracy. The meters installed features technology that during the meter reading process allows the district to receive a report that indicates a potential private plumbing leak. This allows the district to make contact with customers to make repairs to their plumbing system and lessen the amount of water wasted due to private plumbing leaks. Santa Clarita Valley Urban Water Management Plan Page 7-12
351 2015 Santa Clarita Valley Urban Water Management Plan Water Conservation Program Coordination and Staffing Support NCWD has had a conservation coordinator since The coordinator manages DMM implementation and other water conservation implementation and planning activities. Including the coordinator, NCWD has four full-time equivalent staff positions that focus part-time on conservation Other DMMs Implemented Over the Last Five Years Residential Water Use Assessment Program NCWD offers its customers free water surveys that are performed by its consultant, WaterWise Consulting. The surveys consist of an approximately hour-long house visit to check for leaks, evaluate water use efficiency, install water savings devices and provide conservation information to the customer Customized Water Efficiency Rebate Program NCWD allows its customers to apply for the same rebates offered by other Southern California Water Districts. Customers are required to provide NCWD with the details of the rebate that they are applying for. When approved, NCWD will then rebate the customer Planned Implementation of DMMs to Achieve Water Use Targets NCWD will continue to implement the DMMs described in this section, and will continue to cooperate with CLWA and the other retail purveyors to implement the measures as outlined in the 2015 WUESP update on a valley wide basis as necessary. These programs combined with public outreach programs will assist NCWD in achieving its SBX targets as described in Section Valencia Water Company VWC recognizes that conserving water is an integral component of a responsible water strategy and is committed to providing education, tools and incentives to help its customers reduce the amount of water they use. VWC is implementing programs locally as well as leveraging the conservation resources available through CLWA. In 2006, VWC became a signatory to the CUWCC MOU, establishing a firm commitment to the implementation of the BMPs or DMMs. Prior to signing the MOU, VWC had been actively engaged in conservation and implemented several of the CUWCC recommended conservation programs. VWC is implementing all of the BMPs and DMMs as required in the MOU and UWMP Act. The following sections provide an overview of the various programs and conservation activities implemented by VWC. The 2013 and 2014 BMP reports are included in Appendix G. VWC is in compliance with the requirements of the MOU. Santa Clarita Valley Urban Water Management Plan Page 7-13
352 7.5.1 Foundational DMMs 2015 Santa Clarita Valley Urban Water Management Plan Water Waste Prohibition VWC Schedule No became effective in May of 2015 and was adopted with Resolution (provided in Appendix F). This Schedule outlines water use restrictions intended to promote water conservation and prevent the waste of water, as well as the penalties for noncompliance. VWC Rule No. 20 came into effect in 2003 and consists of VWC s Water Conservation rule to ensure that water resources are put to reasonable beneficial use. VWC Rule No.11, which became effective in 1993, outlines procedures for the discontinuance and restoration of service, specifying specific actions related to waste of water under 11.B.3. In addition, Chapter 9.38 of the City of Santa Clarita Municipal Code contains regulations on water conservation Metering All of VWC s customers are metered and billed volumetrically on a monthly basis. The same applies for all new service connections Conservation Pricing On February 1, 2011 VWC changed its single volumetric rate structure to a tiered structure. The tiered system was designed to support the WaterSMART Allocation (WSA) program, which sets customer specific allocations for all individually metered residential customers. Starting in 2009, customer bills included information on their allocation, allowing time for acclimation to the new approach before it was fully implemented with tiered rates in In 2012, dedicated landscape irrigation meters were also placed in the WaterSMART Allocation Program with a tiered rate structure. The method used to determine each month s allocation for irrigation customers is based on the State s 2010 Model Efficient Landscape Ordinance. The rate structure is designed to provide support and encourage appropriate use. If a customer s water use is within the designated efficient range for their allocated volume, the customer is charged standard rates for water use in the efficient tier. If the customer uses less than the efficient tier, the customer is charged at a lower rate and, conversely, if the customer uses more, the customer is charged at the higher rates. There are five (5) tiers, ranging from Super-Efficient to Wasteful, as shown in Table 7-2. Customers are encouraged to access their allocation and billing information on the company s website. Non-residential metered service is charged a flat rate of $1.598 per 100 cubic feet (ccf), as of January 1, Santa Clarita Valley Urban Water Management Plan Page 7-14
353 2015 Santa Clarita Valley Urban Water Management Plan TABLE 7-2 QUANTITY RATES AND TIER LEVEL Quantity Rates per Ccf Residential (RES) Dedicated Irrigation Tier Name Level Meter (DIM) Super-Efficient Tier 1: DIM-0-35% of monthly water allocation $1.342 $1.342 RES-0-Indoor monthly water allocation Efficient Tier 2: DIM % of monthly allocation $1.598 $1.598 RES-Indoor monthly allocation-100% of monthly allocation Inefficient Tier 3: 101% to 150% of monthly water allocation $1.997 $1.758 Excessive Tier 4: 151%-200% of monthly water allocation $2.597 $2.021 Wasteful Tier 5: Use in excess of 200% of monthly water allocation $3.376 $2.527 Source: Schedule No. 1-R (Effective (1/1/16) and Schedule No. 1-DIM (Effective: 1/1/16) Public Education and Outreach VWC implements public outreach in coordination with CLWA and also provides information on efficient water use through various other media, including on customer bills and on its website. VWC has made use of flyers, brochures, bill stuffers, messages printed on bills, and information packets. Bills regularly show current water usage in comparison with the previous year s usage for that period, and for dedicated irrigation metered customers it shows their WaterSMART allocations. VWC maintains an active website that provides information on the various programs available to customers, conservation tips, links and full details on the WaterSMART program. In addition, VWC representatives promote conservation at local special events, including the Home and Garden Show, Emergency Expo, Earth/Arbor Day, CLWA Water Awareness, River Rally and Make a Difference Day. VWC has been conducting Water Smart Irrigation and Garden Care Workshops since In addition to learning valuable tips on indoor and outdoor water use efficiency, VWC customers can also receive a $20 water bill credit for attending. VWC plans to offer the WaterSMART Workshop online to customers in In 2013, 201 VWC customers participated in other various workshops held by CLWA. In 2014, VWC started providing personal drought reports to customers that stated their 2013 water use, their conservation target and how to track their progress via customer online accounts. The customized online tool shows individual water-saving targets to help customers see how much water they must save to meet statewide water use reduction targets. The reports also provide specific information on ways they can reduce weekly or monthly water use without impacting their lifestyles. VWC s school education program is implemented in coordination with CLWA at no cost to school districts. The CLWA s award winning program is available to grades K through 12 and includes in-class presentations and field trips, as described in Section VWC works in partnership with SoCal Gas to implement the Living Wise School Program that promotes energy Santa Clarita Valley Urban Water Management Plan Page 7-15
354 2015 Santa Clarita Valley Urban Water Management Plan and water savings. As part of the program, 500 conservation kits were provided to students within the VWC service area in Programs to Assess and Manage Distribution System Real Loss VWC s overall water delivery system is relatively new with a weighted average plant in service life of under twenty years. As a newer system, VWC doesn t experience a significant amount of water loss. Nonetheless, VWC conducts quarterly pre-screening system audits which calculate verifiable use as a percent of total production. VWC s historic annual water loss since 2000, as a percent of total production, is on average 4.5%. VWC has completed AWWA s M36 Water Loss analysis, which consists of a component analysis of leaks into revenue and non-revenue categories, among others, and an economic analysis of recoverable loss. The most recent component analysis was completed in October of VWC s M36 Reporting Worksheet is provided in Appendix D. Results of the preliminary audits show a water audit validity score of 82 for 2015, and ILI of VWC intends to refine and improve its assumptions used per the M36 manual as its system expands and matures. VWC s maintenance program also helps minimize water losses and helps keep the VWC production system in optimal condition, thus reducing water losses. This program includes, among other things, daily inspections of water wells and pumping equipment, weekly inspections of water tanks and exercising critical system valves. VWC also calibrates its production meters annually. When a leak occurs, VWC responds quickly to isolate the leak and repair it. VWC tracks leaks in its GIS system, which gives it the ability to visually monitor leak locations and identify potential problem areas or trends. VWC s meter change-out program replaces its older water meters on a regular basis to ensure metering accuracy. Based on AWWA standards and VWC s experience, this program targets change-outs at 15 years or less Water Conservation Program Coordination and Staffing Support VWC has had a full-time conservation coordinator since 2005 and added the Resource Conservation Manager RCM in 2010; there are currently two full-time equivalent (FTE) positions dedicated to conservation. The RCM and conservation coordinator manage BMP implementation and other water conservation implementation and planning activities. VWC also utilizes consultant services to implement the various programs including water audits, landscape training and public outreach Other DMMs Implemented Over the Last Five Years Conservation Program Participation The following table illustrates the participation of the community in VWC s conservation programs over the last five years. Santa Clarita Valley Urban Water Management Plan Page 7-16
355 2015 Santa Clarita Valley Urban Water Management Plan TABLE 7-3 VWC S CONSERVATION PROGRAMS (NUMBER OF PARTICIPANTS) Program Residential Surveys Commercial Surveys HE Toilet Incentives Ultra HE Toilet Incentives HE Clothes Washer Rebates , HELIUM (a) Incentives HE Devices (b) Kits (c) WaterSMART Workshops Notes: (a) High Efficiency Landscape Irrigation Upgrade Measures (HELIUM) (b) HE Devices includes Free HE Showerheads and Hose Nozzles (not included in Kits or Surveys) (c) Kits include those offered via the Living Wise Program (VWC School Program) and Kits offered by VWC. Kits offered by VWC include 2 HE Showerheads, 2 HE Faucet Aerators, 1 Hoze Nozzle, 2 Toilet Detection Dye Tablets, 1 Toilet Flapper, and 1 Flowrate Bag Residential Water Use Efficiency Survey Program VWC offers its customers free water surveys that are performed by its consultant, WaterWise Consulting. The surveys consist of an approximately hour-long house visit to check for leaks, evaluate water use efficiency, install water savings devices and provide conservation information to the customer. VWC also offers free landscape irrigation surveys to CII and dedicated irrigation metered customers HELIUM Program VWC provides funding incentives via its High Efficiency Landscape Irrigation Upgrade Measures (HELIUM) Program. The following rebates are offered under that program: Drip Irrigation: VWC offers rebates of $0.25 per square foot for converting spray irrigation to drip irrigation. HE nozzles and Pressure Regulation: Rebates are offered for replacing old spray sprinklers with high-efficiency irrigation equipment and by installing pressure regulating sprinkler bodies, or master pressure regulating devices. Free Sprinkler Nozzles: VWC residential customers can receive up to 25 high efficiency nozzles and CII customers can receive 100 or more nozzles. Free WBICs: VWC offered free WBICs to CII customers for irrigation controllers with 16 stations. Santa Clarita Valley Urban Water Management Plan Page 7-17
356 2015 Santa Clarita Valley Urban Water Management Plan Other Rebate/Incentive Programs VWC offers a pool cover rebate program, offering up to $75 for the purchase of a pool cover and up to $200 for the purchase of a permanent pool cover. Purchases between March 1, 2015 and December 31, 2016 are eligible. VWC also participated in the incentive programs administered by CLWA including free WBICs, turf conversion, and HE clothes washers as described above. The HE clothes washer program was discontinued in August Planned Implementation of DMMs to Achieve Water Use Targets VWC will continue to implement the DMMs described in this section, and will continue to cooperate with CLWA and the other retail purveyors to implement the measures as outlined in the 2015 WUESP update on a valley wide basis as necessary. These programs combined with public outreach programs will assist VWC in achieving its SBX targets as described in Section WUESP Planned DMM Implementation The 2015 WUESP update is a valuable planning tool for improving water use efficiency in a cost-effective manner, while meeting mandated conservation targets as well as local objectives. With guidance of the 2015 WUESP, CLWA and the retail purveyors will build upon the success of previous conservation efforts to continue to effectively manage demands and meet future water use targets. The 2015 WUESP evaluated historical, existing and potential new water use efficiency measures to provide a recommended conservation program. CLWA and the retail purveyors are committed to implementing the recommended conservation program which includes all measures that are currently being implemented, in addition to new measures deemed feasible and effective. The following measures are ongoing as of 2015: Public and school education Turf replacement program WBIC free controller program HE fixture installation Pool cover rebates The following measures are planned for future implementation, starting in 2017: School building retrofit: Program gives schools a grant to replace fixtures and upgrade irrigation systems. Santa Clarita Valley Urban Water Management Plan Page 7-18
357 2015 Santa Clarita Valley Urban Water Management Plan Ultra HE toilet rebates for CII customers: Rebates for installation of ultra-high efficiency toilets, i.e. toilets that use 1 gallon per flush (gpf) of water or less and include dual flush technology. HE urinal rebates: Rebates for the installation of high efficiency urinals, which may be 0.5 gpf or less. Pre-rinse spray nozzle: Program offers free 1.3 gpm (or lower) spray nozzles and potentially free installation for rinse and clean operations in restaurants and other commercial kitchens. Soil moisture sensor rebates: Rebates to install soil moisture sensors Section of the SCV WUESP contains an analysis of the economic impacts of the implementation of the DMMs. Santa Clarita Valley Urban Water Management Plan Page 7-19
358 2015 Santa Clarita Valley Urban Water Management Plan Section 8: Water Shortage Contingency Planning 8.1 Overview Water supplies may be interrupted or reduced in a number of ways, such as a drought that limits supplies, an earthquake that damages water delivery or storage facilities, a regional power outage or a toxic spill that affects water quality. This Section of the Plan describes how CLWA and the retail purveyors have planned to respond to various potential stages of shortage. CLWA along with SCWD, NCWD, and VWC, have each developed Draft Water Shortage Contingency Ordinances (included as Appendix G) that provide a framework and guide their actions in the event of a water shortage emergency. The draft ordinances include voluntary and mandatory stages to address a possible reduction in water supply of up to or more than 50 percent. Prohibitions, penalties and financial impacts of potential shortages have been developed by SCWD, NCWD, and VWC and are summarized in this Section. Ordinances and resolutions related to water shortage contingency actions have been prepared by CLWA and each retail purveyor and are summarized in Table 8-1 below. TABLE 8-1 WATER SHORTAGE RESOLUTIONS/ORDINANCES Ordinance/ Resolution No. Percentage Reduction Number of Stages Penalties Outlined? CLWA Draft Resolution No. X Up to 75% 3 No, does not, include penalties SCWD Ordinance No. 43 Up to or more than 50% 4 Yes, includes penalties NCWD Ordinance No. 112 Up to or more than 50% 5 Yes, includes penalties VWC Rule No Up to or more than 50% 4 Yes, includes penalties and/or drought allocation and tiered rates In addition, due to recent drought conditions and the Governor s emergency declarations that require a 25 percent reduction in overall potable urban water use statewide, CLWA in conjunction with SCWD, NCWD, and VWC have developed ordinances and other planning documents to incentivize individual customer conservation and reduce overall water demands. 8.2 Coordinated Planning CLWA and the purveyors have coordinated efforts recently and in the past to meet potential water shortages. During 1991 (the fifth year of a six-year drought), the purveyors and CLWA prepared a Water Shortage Contingency Plan. Since this plan was first prepared, the Valley has experienced three water shortage periods: in due to the continuation of the drought; in 1994 due to the January 17, 1994 Northridge earthquake; and from 2013 to the present due to the prolonged current drought. The plan has worked extremely well in all instances, and updates have been made to incorporate actual experience during these periods. Santa Clarita Valley Urban Water Management Plan Page 8-20
359 2015 Santa Clarita Valley Urban Water Management Plan The Santa Clarita Valley Water Committee, formed in 2008, regularly meets to monitor water supply conditions and prepare actions that may need to be taken in the event of drought or other water shortage conditions. Committee members include CLWA, the City of Santa Clarita, Los Angeles County and the four local retail purveyors. The same entities participate in the SCV Family of Water Suppliers. Together, they work to promote the efficient use of water and fund programs to reduce the per capita water use in the Santa Clarita Valley. 8.3 Stages of Action to Respond to Water Shortages CLWA and the purveyors carefully plan and manage water supplies to minimize the social and economic impact of water shortages. Demand reduction strategies are designed to overcome supply deficiencies of up to 50 percent or more during a severe or extended water shortage condition. Circumstances may also arise where the purveyors may implement additional measures, such as recently when the Governor declared a water shortage emergency and the SWRCB adopted statewide emergency conservation regulations. Demand reduction stages may be triggered by a shortage in any one of the water sources in the Valley or by shortages in a combination of supplies. CLWA and the retail purveyors have adopted respective ordinances that outline specific stages of action as described in the following sections CLWA Stages of Action CLWA s Board of Directors determines when to declare a level 0, 1, 2, or 3 water supply shortage in response to drought, regulatory requirements, or other water supply conditions, and what reduction in water use is necessary to make the most efficient use of water, protect public health and safety, and respond to existing water supply and/or regulatory conditions. Table 8-2 presents the three-stage water supply shortage action plan for CLWA. These stages are outlined in CLWA Draft Resolution No. X, and described in further detail below. See Appendix G for the complete Draft Resolution. TABLE 8-2 CLWA STAGES OF ACTION Stage Percent Supply Water Supply Condition Reduction (a) 0 0% Year when 65% of its normal year wholesale imported supply is available to the Agency % Agency has sufficient SWP surface storage to meet the reduction in supply % Agency has sufficient SWP surface storage plus other low-cost water resources to meet the reduction in supply % Agency has sufficient SWP surface storage plus other low-cost water resources plus other potential actions to meet the reduction in supply Notes: (a) Based on average SWP Table A amount of 58,800 AF and Buena Vista-Rosedale supply of 11,000 AF. Santa Clarita Valley Urban Water Management Plan Page 8-21
360 8.3.2 NCWD Stages of Action 2015 Santa Clarita Valley Urban Water Management Plan NCWD s Board of Directors determines when to declare a level 1, 2, 3, 4 or 5 water supply shortage in response to drought, state regulations, or other water supply conditions, and what reduction in water use is necessary to make the most efficient use of water, protect public health and safety, and respond to existing water supply and/or regulatory conditions. Table 8-3 presents the four-stage water supply shortage action plan for NCWD. These stages are outlined in Ordinance No. 116, see Appendix G for the complete ordinance. TABLE 8-3 NCWD STAGES OF ACTION Stage Percent Supply Water Supply Condition Reduction % Up to 20% % 20-30% % 30-40% % 40-50% 5 More than 50% More than 50% SCWD Stages of Action SCWD s Board of Directors determines when to declare a level 1, 2, 3 or 4 water supply shortage in response to drought, state regulations, or other water supply conditions, and what reduction in water use is necessary to make the most efficient use of water, protect public health and safety, and respond to existing water supply and/or regulatory conditions. Table 8-4 presents the four-stage water supply shortage action plan for SCWD. These stages are outlined in Ordinance No. 43, see Appendix F for the complete ordinance. TABLE 8-4 SCWD STAGES OF ACTION Stage Percent Supply Water Supply Condition Reduction 1 25% 25% 2 32% 32% 3 40% 40% 4(a) 50% 50% VWC Stages of Action VWC s Board of Directors determines when to declare a level 1, 2, 3 or 4 water supply shortage in response to drought, state regulations, or other water supply conditions, and what reduction in water use is necessary to make the most efficient use of water, protect public health and safety, and respond to existing water supply and/or regulatory conditions. Table 8-5 presents the four-stage water supply shortage action plan for VWC. Santa Clarita Valley Urban Water Management Plan Page 8-22
361 2015 Santa Clarita Valley Urban Water Management Plan These stages are outlined in Rule No. 14.1, see Appendix F for the complete ordinance. TABLE 8-5 VWC STAGES OF ACTION Stage Percent Supply Water Supply Condition Reduction 1 Up to 20% Up to 20% 2 20 to 35% 20 to 35% 3 35 to 50% 35 to 50% 4 50% 50% 8.4 Water Conservation Action Plan In February 2014, the Santa Clarita Valley Water Committee declared a water supply alert and implemented voluntary water conservation measures to be taken by Valley customers. The Committee and all four local retail purveyors adopted Stage 1 water conservation measures. In August 2014, in response to the ongoing drought conditions and the Governor s emergency declarations, the Santa Clarita Valley Water Committee developed a Water Conservation Action Plan calling for mandatory water conservation measures to be taken by customers in response to drought conditions. The following voluntary and mandatory water conservation measures (Tables 8-6 and 8-7, respectively) are based on the Water Conservation Action Plan. TABLE 8-6 VOLUNTARY WATER CONSERVATION MEASURES Outdoor Guidelines Repair all leaks in irrigation systems immediately and maintain systems, including sprinklers, so overspray, runoff and water waste is avoided. Use the most water-efficient irrigation, including drip irrigation when appropriate. Choose drought-tolerant vegetation to minimize the need for irrigation, and group plants with similar water needs together for more efficient irrigation. See Santaclaritagardens.com for resources. Use mulch on exposed dirt to lessen evaporation. Water during optimal watering hours of 2-6 a.m. to avoid wind and evaporation. Adjust run times to minimum values. See the Watering Guide on santaclaritagardens.com for samples of irrigation schedules. Minimize water use on decorative fountains, ponds or other types of water streams by incorporating a recycling system so water is continually recovered and reused. Use pool and spa safety covers or evaporation-reducing water treatments, if safe and appropriate for the situation. Pool and spa chemistry should be balanced and maintained to help reduce the frequency of pool/spa draining and refilling. Indoor Guidelines Repair all leaks in faucets, toilets, and indoor pipes immediately. Install WaterSense labeled high-efficiency toilets (1.28 gallons per flush). Install WaterSense labeled low-flow aerators in bathroom and kitchen sinks. Install WaterSense labeled low-flow showerheads in showers. Install water-efficient Energy Star approved appliances, including clothes washers and dishwashers. Run only full loads in clothes washers and dishwashers. All commercial establishments where food or beverages are provided should serve water to their customers only when specifically requested by the customer. Santa Clarita Valley Urban Water Management Plan Page 8-23
362 2015 Santa Clarita Valley Urban Water Management Plan TABLE 8-7 MANDATORY WATER CONSERVATION MEASURES Prohibitions The application of potable water to outdoor landscapes in a manner that causes runoff such that water flows onto adjacent property, non-irrigated areas, private and public walkways, roadways, parking lots and structures. The use of a hose that dispenses potable water to wash a motor vehicle, except where the hose is fitted with a shut-off nozzle or device attached to it to cause it to cease dispensing water immediately when not in use. The application of potable water to driveways and sidewalks. The use of potable water in a fountain or other decorative water feature, except where the water is part of a re-circulating system. During the months of April, May, June, July, August, September and October, outdoor irrigation of ornamental landscapes or turf with potable water is restricted to no more than three (3) days per week. Customers with street addresses ending in an odd number (1, 3, 5, 7 or 9) can water on Monday, Wednesday and Friday. Customers with street addresses ending in an even number (0, 2, 4, 6 or 8) can water Tuesday, Thursday and Sunday. No watering is allowed on Saturday. During the months of November, December, January, February and March outdoor irrigation of ornamental landscapes or turf with potable water is restricted to no more than two (2) days per week. Customers with street addresses ending in an odd number (1, 3, 5, 7 or 9) can water on Monday, and Thursday. Customers with street addresses ending in an even number (0, 2, 4, 6 or 8) can water Tuesday and Friday. No watering is allowed on Wednesday, Saturday and Sunday. 8.5 Prohibitions and Penalties for Excessive Use NCWD Prohibitions and Penalties On May 12, 2016 NCWD s Board of Directors adopted Ordinance No. 116, amending Ordinance No. 112, which addresses water conservation, shortage, drought and emergency response procedures. NCWD s Water Conservation Action Plan states that no water user shall waste water or make, cause or permit the use of water for any purpose contrary to any provision of Ordinance No. 116, or in quantities in excess of the use permitted by the conservation stage in effect. If excessive use (water leaks and/or waste) is detected from any water user, the following enforcement plan will be followed: Efficient Water Use and Stage 1 Enforcement: - Any sign of water leaks and/or waste will be documented. - NCWD will then determine the appropriate level of action to inform the water user of the guidelines in Ordinance No. 116 and will encourage more efficient water use. Stages 2, 3, 4 and 5 Enforcement: - Courtesy Notice: NCWD shall issue a written warning to the water user along with water conservation materials. - First Violation: For non-compliance within 12 calendar months of the courtesy notice NCWD shall issue a written warning to the water user and recommend corrective action. - Second and Subsequent Violations: A fine of $50 per day and increase of $50 for each subsequent violation of up to a maximum of $500 per day shall be added to the water user s bill if the corrective action is not taken. Santa Clarita Valley Urban Water Management Plan Page 8-24
363 2015 Santa Clarita Valley Urban Water Management Plan - Separate Violation: Each day a violation of Ordinance No. 116 occurs is a separate violation. NCWD Enforcement Costs: - NCWD shall be reimbursed for its costs and expenses in enforcing the provisions of Ordinance No. 116, including costs incurred for staff to investigate and monitor the water user s compliance with the terms of the Ordinance. Charges for installation of flow-restricting devices or for discontinuing or restoring water service, as NCWD incurs those charges, shall be added to the water user s bill at the property where the enforcement costs were incurred. In response to the need for additional reductions, NCWD adopted Resolution which included prohibitions, in addition to those outlined under the Water Conservation Action Plan, as described below. - The application of potable water to outdoor landscape during and within 48 hours after measurable rainfall - The irrigation with potable water of ornamental turf on public street medians - The irrigation with potable water of landscapes outside of newly constructed homes and buildings in a manner inconsistent with regulations or other requirements established by the California Building Standards Commission and the Department of Housing and Community Development - Operators of hotels and motels shall provide guests with the option of choosing not to have towels and linens laundered. - The serving of drinking water other than upon request in eating or drinking establishments. The following penalties (Table 8-8) apply to NCWD customers that do not comply with provisions of the Resolution. TABLE 8-8 NCWD PENALTIES AND CHARGES Penalties or Charges Violation Level Courtesy Notice written warning First complaint Written warning in form of a non-compliance, correctiveaction letter First violation (a) $50 fine per day for second violation Second (a) and Subsequent $50 for each subsequent violation up to $500 per day Violations Note: (a) Within 12 calendar months of previous violation SCWD Prohibitions and Penalties On June 10, 2015, the SCWD adopted Ordinance No. 43, which establishes water conservation and water supply shortage restrictions and regulations, and outlines water shortage stages, including an emergency stage of up to or more than a 50 percent reduction in supplies. Individual measures are required depending on the declared level of water shortage. Table 8-9 presents the shortage levels and associated water supply conditions. Santa Clarita Valley Urban Water Management Plan Page 8-25
364 2015 Santa Clarita Valley Urban Water Management Plan TABLE 8-9 SCWD WATER CONSERVATION MEASURES AND PROHIBITIONS Water Conservation Measure/Prohibition Stage When Enacted Irrigating outdoor lawns, turf, or vegetated area of landscape during and within At all times 48 hours after measurable precipitation The irrigation with potable water of landscapes outside of newly constructed At all times homes and buildings in a manner inconsistent with regulations or other requirements established by the California Building Standards Commission and the Department of Housing and Community Development Watering or irrigating of outdoor lawns, turf, landscape or other vegetated area At all times with potable water during 9 a.m. to 5 p.m. on all days except by use of handheld bucket or similar container or for very short periods of time for the purpose of adjusting or repairing an irrigation system Watering or irrigating outdoor lawns, turf, landscape, or other vegetated area At all times with potable water using a landscape irrigation system or watering device that is not continuously attended for more than ten minutes per day per station. Excludes low-flow drip irrigation systems. The irrigation with potable water of ornamental turf on public street medians At all times Restaurants and other food service establishments may not serve water to At all times customers unless requested Operators of hotels and motels shall provide guests with the option of choosing At all times not to have towels and linens laundered. All water system leaks must be repaired within 24 hours of detection or At all times notification of such. During the months of April, May, June, July, August, September and October, Level 1 outdoor irrigation of ornamental landscapes or turf with potable water is restricted to no more than three (3) days per week. Customers with street addresses ending in an odd number (1, 3, 5, 7 or 9) can water on Monday, Wednesday and Friday. Customers with street addresses ending in an even number (0, 2, 4, 6 or 8) can water Tuesday, Thursday and Sunday. No watering is allowed on Saturday. During the months of November, December, January, February and March Level 1 outdoor irrigation of ornamental landscapes or turf with potable water is restricted to no more than two (2) days per week. Customers with street addresses ending in an odd number (1, 3, 5, 7 or 9) can water on Monday and Thursday. Customers with street addresses ending in an even number (0, 2, 4, 6 or 8) can water Tuesday and Friday. No watering is allowed on Wednesday, Saturday and Sunday. Outdoor irrigation of ornamental landscapes or turf with potable water is Level 2 restricted to no more than two (2) days per week. Customers with street addresses ending in an odd number (1, 3, 5, 7 or 9) may only water on Monday and Thursday. Customers with street addresses ending in an even number (0, 2, 4, 6 or 8) can water Tuesday and Friday. Outdoor irrigation of ornamental landscapes or turf with potable water is prohibited on Wednesdays, Saturdays, and Sundays. Outdoor irrigation of ornamental landscapes or turf with potable water is Level 3 restricted to one (1) day per week. Customers with street addresses ending in an odd number (1, 3, 5, 7 or 9) may only water on Monday. Customers with street addresses ending in an even number (0, 2, 4, 6 or 8) may only water on Thursday. Outdoor irrigation of ornamental landscapes or turf with potable water is prohibited on Tuesdays, Wednesdays, Fridays, Saturdays, and Sundays. Watering or irrigating of outdoor lawns, landscape, or other vegetated area with Level 4 potable water is prohibited. Santa Clarita Valley Urban Water Management Plan Page 8-26
365 2015 Santa Clarita Valley Urban Water Management Plan Water Conservation Measure/Prohibition No new potable water service will be provided, no new temporary meters or permanent meters will be provided, and no statements of immediate ability to serve or provide potable water service will be issued. (some exceptions apply) Stage When Enacted Level 4 SCWD customers found to be violating mandatory restrictions shall be subject to progressive warnings, fines and/or disconnection of service, depending on the number of violations, as well as the stage of action. Table 8-10 outlines the penalties established, by level of violation. TABLE 8-10 SCWD PENALTIES AND CHARGES Penalties or Charges Written notice provided to customer by mail or personal delivery Written notice of non-compliance Fine of $50 per violation Written notice of non-compliance Fine of $100 per violation Increase of $100 for each subsequent violation, up to $500 per day Flow restrictor may be installed Note: (a) Within 12 calendar months of previous violation. Violation Level First Violation Second Violation (a) Third (a) and Subsequent Violations SCWD may also shut off a customer s water service for willful violations of mandatory restrictions. In instances of observed leaks of a dedicated irrigation system or water meter, SCWD may shut off the related system and issue a notice of violation VWC Prohibitions and Penalties During times of threatened or actual water shortage, VWC is authorized to apportion its available water supply among its customers. VWC will apportion the supply in the manner that appears most equitable under circumstances then prevailing and with the cooperation of the other water purveyors with due regard to public health and safety. In the event of a declared water shortage, the VWC Board of Directors is authorized to impose mandatory conservation and rationing in accordance with VWC Schedule No. 14.1, Mandatory Water Conservation and Rationing. Schedule No sets forth conservation measures including, but not limited to; water use violation fines, charges for removal of flow restrictors, and the period during which mandatory conservation and rationing measures will be in effect. On June 16, 2015, VWC adopted the State s Resolution No, , which includes mandatory conservation measures specific to its service area, according to the VWC Schedule No The prohibitions include those outlined under the Water Conservation Action Plan as well as the following: - The application of potable water to outdoor landscapes during and within 48 hours after measurable rainfall - The serving of drinking water other than that upon request in eating or drinking establishments Santa Clarita Valley Urban Water Management Plan Page 8-27
366 2015 Santa Clarita Valley Urban Water Management Plan - The irrigation with potable water of ornamental turf on public street medians - The irrigation with potable water of landscapes outside of newly constructed homes and buildings in a manner inconsistent with regulations or other requirements established by the California Building Standards Commission and the Department of Housing and Community Development - Watering or irrigating of outdoor lawns, turf, landscape or other vegetated area with potable water during 9 a.m. to 5 p.m. on all days except by use of hand-held bucket or similar container or for very short periods of time for the purpose of evaluating, adjusting or repairing an irrigation system - Irrigation with potable water of outdoor landscapes is restricted to two (2) days per week. Customers with street addresses ending in an odd number (1, 3, 5, 7 or 9) can water on Monday and Thursday. Customers with street addresses ending in an even number (0, 2, 4, 6 or 8) can water Tuesday and Friday. Irrigation with potable water of outdoor landscapes is prohibited on Wednesdays, Saturdays, and Sundays. - Operators of hotels and motels shall provide guests with the option of choosing not to have towels and linens laundered. The following penalties (Table 8-11) apply to VWC customers that do not comply with provisions of VWC Schedule No TABLE 8-11 VWC PENALTIES AND CHARGES Penalties or Charges Written notice provided to customer by mail of personal delivery Leak notifications must be repaired within 48 hours Written warning in form of non-compliance notice Written notice of non-compliance Fine of $100 per violation Increase of $100 for each subsequent violation, up to $500 per day Flow restrictor may be installed Note: (a) Within 12 calendar months of previous violation. Violation Level First Violation Second Violation (a) Third (a) and Subsequent Violations In addition to, or in lieu of, the penalties and charges described in Table 8-11, VWC has developed the Drought Smart Allocation structure to supplement the existing Water Smart Allocation and Tiered Rates Program. The Drought Smart Allocation structure includes: (1) Mandatory Water Waste Reduction Steps (1-3): a. Step 1 Reduce Tier 3 and Tier 4 widths by 20% b. Step 2 - Reduce Tier 3 and Tier 4 widths by 50% c. Step 3 - Reduce Tier 3 and Tier 4 widths by 100% Santa Clarita Valley Urban Water Management Plan Page 8-28
367 2015 Santa Clarita Valley Urban Water Management Plan (2) Mandatory Outdoor Water Use Reduction Steps (1-4): a. Step 1 Reduce Tier 2 budget by 10% b. Step 2 Reduce Tier 2 budget by 20% c. Step 3 Reduce Tier 2 budget by 50% d. Step 4 Reduce Tier 2 budget by 100% 8.6 Consumption Reduction Methods Consumption Limits The Valley-wide Water Conservation Action Plan consumption allocation method for each customer type is as follows: Single Family Hybrid of Per-capita and Percentage Reduction Multi Family Hybrid of Per-capita and Percentage Reduction Commercial Percentage Reduction Industrial Percentage Reduction Governmental Percentage Reduction Recreational Percentage Reduction Irrigation Percentage Reduction The percentage reductions at each stage and for each customer type correspond to those in Section 8.3. In a drought situation (such as a multiple-dry year period), individual customer allotments will be based on a normal year consumption table. The water purveyors will classify each customer and calculate each customer s allotment according to the demand reduction goals. Each customer will be notified of its classification and allotment by mail before the implementation of a mandatory program. New customers and connections will be notified at the time service commences if a mandatory program is in effect. Any customer may appeal its classification on the basis of use or the allotment on the basis of incorrect calculation. In a disaster or catastrophic outage, prior notice of allotment may not be possible. Notice will be provided by the most efficient means available, if necessary, through the terms of the water purveyors emergency response plans New Demand During any declared water shortage emergency requiring mandatory rationing, CLWA and the retail purveyors recommend that the City and County building departments continue to process applications for grading and building permits, but not issue the actual permits until mandatory rationing is rescinded. In Stages 3 and 4, it may be necessary to discontinue all use of grading water, even if permits have been issued, and consider banning all use of water for non-essential uses, such as new landscaping and pools. Santa Clarita Valley Urban Water Management Plan Page 8-29
368 2015 Santa Clarita Valley Urban Water Management Plan Water Features and Swimming Pools Health and safety issues are a primary concern in water shortage responses, thus limitations on water features and swimming pool uses are based on the severity of the water shortage condition. Generally swimming pool filling and refilling would be impacted in the later stages (4) of a water shortage condition. Water features are a relatively small discretionary use and may be impacted at any time during a triggered water shortage condition Defining Water Features The retail purveyors would identify water features and estimate water use and consider these as potential targets for future demand reductions required during a water shortage condition. 8.7 Determining Water Shortage Reductions Demand NCWD, SCWD, and VWC bill their customers on a monthly basis. The prior year s consumption is included on most customer bills. This allows comparison of the total consumption from each billing period to the same billing period from the prior year Health and Safety Priorities for use of available retail water supplies are generally as follows: Health and Safety: Interior residential, sanitation and fire protection Commercial, Industrial, and Governmental: Maintain jobs and economic base Existing Landscaping: Especially trees and shrubs New Demand: Projects with permits when shortage declared Water quantity calculations used to determine the interior household GPCD requirements for health and safety are provided in Table As set forth in Table 8-12, the California Water Code health and safety allotments are 68 GPCD, or 33 CCF (100 cubic feet) per person per year. When considering this allotment and the Valley population of 289,100 in 2020 as presented in Section 2 (Table 2-13), the total annual water supply required to meet the first priority use during a declared water shortage is approximately 22,021 AFY. TABLE 8-12 PER CAPITA HEALTH AND SAFETY WATER QUANTITY CALCULATIONS Non-Conserving Fixtures Habit Changes Conserving Fixtures Toilets 5 flushes x 5.5 gpf = flushes x 5.5 gpf = flushes x 1.6 gpf = 8.0 Showers 5 min x 4.0 gpm = min x 3.0 gpm = min x 2.0 gpm = 10.0 Washers 12.5 GPCD (1/3 load) = GPCD (1/3 load) = GPCD (1/3 load) = 11.5 Kitchens 4 GPCD = GPCD = GPCD = 4.0 Other 4 GPCD = GPCD = GPCD = 4.0 Total GPCD CCF per capita per year Santa Clarita Valley Urban Water Management Plan Page 8-30
369 8.7.3 Production 2015 Santa Clarita Valley Urban Water Management Plan Under normal conditions, CLWA, NCWD, SCWD, and VWC prepare monthly production reports, which are reviewed and compared to production reports and pumping statistics from the same period of the prior year. Under declared water shortage conditions, these production reports could be prepared as often as daily. In the case of a catastrophic supply interruption, CLWA and the purveyors would continually monitor production figures, and will work to transfer water and use each other s distribution facilities where feasible. 8.8 Revenue and Expenditure Impacts The following section addresses the financial impacts of actions during water shortages for NCWD, SCWD and VWC NCWD Financial Impacts For FY 2015, water sales made up approximately 86 percent of total revenues. With such a high proportion of revenue dependent on water sales, the implementation of water shortage responses can impact overall revenues. At the same time, the majority of the operating costs are fixed in nature and do not increase or decrease in direct proportion with increases or decreases in water use by customers. If water availability issues or shortages cause NCWD to implement water reduction measures, a bulk of the normal operating costs will remain the same even though less water is sold. This would result in a substantial revenue shortfall. In an effort to address this shortfall, NCWD established a reserve policy (Resolution ) that includes a rate stabilization fund to be used in situations where actual consumption of water is reduced as a direct result of a water shortage and associated conservation measures. In the event of a declaration of a water shortage situation, NCWD s Board of Directors will consider options and actions intended to replenish the rate stabilization reserve to its ideal level. These actions may include but are not limited to rate increases or surcharges, per customer assessments and utilization of other reserve funds. As a means of mitigating potential fluctuations in water commodity revenues resulting from SWRCB-mandated conservation measures, NCWD adopted Resolution which allows use of a Water Revenue Adjustment Factor. The Water Revenue Adjustment Factor will help recover shortages of revenue due to fluctuations in water sales. In addition, a per unit water cost of service balancing account will help mitigate fluctuations in water commodity revenues. New water rates were also established with Resolution in 2015 to reflect the current conditions of drought and statewide demand reduction mandates SCWD Financial Impacts SCWD s rates were developed to meet the cost of service. The retail water bill includes two major components: a meter service charge and a water usage charge. In the FY 2015/2016 Budget, water usage accounts for 58 percent of total operating revenues. Due to this high proportion of water use charges, supply reductions resulting from water shortage actions could affect the financial stability of SCWD and may impact its ability to meet payment obligations. Santa Clarita Valley Urban Water Management Plan Page 8-31
370 2015 Santa Clarita Valley Urban Water Management Plan For example, the water usage charge for the 2015/2016 budget is 21 percent lower than the prior year budget as a result of SWRCB-mandated conservation goals of 32 percent. A Rate Stabilization Fund was established in January 2004 and is to be used when there are variations in water sales resulting from unusual seasons, major consumption reduction due to voluntary or mandatory conservation or to correct for a net loss of revenues in the event of a catastrophic loss of imported water supplies. The Rate Stabilization Fund is used to defer rate increases due to temporary reductions in water sales. Currently the Rate Stabilization Fund is set at 10 percent of the annual operating revenue budget VWC Financial Impacts VWC maintains a Revenue Stabilization Account (RSA) to track any discrepancies between VWC s projected revenue and actual revenue attributable to certain conservation and drought response efforts. The RSA is also used to track changes in variable costs associated with revenue fluctuations. This ensures that VWC maintains the funding necessary to continue to provide high-quality water service and to implement conservation and incentive programs for ratepayers, even if the latter results in an unforeseen revenue shortfall. Notably, conservation often causes a revenue shortfall, but not a corresponding decrease in all variable costs nor any decrease in fixed costs. Any unanticipated additional funds in the account beyond those needed to make up for unforeseen revenue shortfalls will be used to offset VWC customers rates in the next rate assessment. Any charge associated with the account is paid by all VWC customers. 8.9 Water Shortage Contingency Resolution or Ordinance In June 2015, CLWA and each retail purveyor adopted resolutions calling for the implementation of the Water Shortage Contingency Plan to comply with SWRCB Resolution No , promulgated under the Governor s emergency declarations. NCWD is required to reduce water use by 28%. SCWD is required to reduce water use by 32%. VWC is required to reduce water use by 24%. In March 2015, the following activities were mandated by the SWRCB (some of these were previously incorporated into the various ordinances and plans of the purveyors): No washing down sidewalks and driveways; No watering outdoor landscapes in a manner that causes excess runoff; No washing a motor vehicle with a hose, unless the hose is fitted with a shut off nozzle; No operating a fountain or decorative water feature, unless the water is part of a recirculating system; No irrigating turf or ornamental landscapes during and 48 hours following measurable precipitation; Restaurants and other food service establishments can only serve water to customers on request; and Santa Clarita Valley Urban Water Management Plan Page 8-32
371 2015 Santa Clarita Valley Urban Water Management Plan Hotel/motel operators must provide guests with the option of choosing not to have towels and linens laundered daily Actions to Prepare for Catastrophic Interruption General The Valley is located approximately 20 miles southwest of the San Andreas Fault, which traverses the length of the southern San Joaquin Valley. A major earthquake along this portion of the San Andreas Fault could affect water supplies available to the Santa Clarita Valley. The California Division of Mines and Geology has stated that two of the aqueduct systems that import water to southern California (including the California Aqueduct) could be ruptured by displacement on the San Andreas Fault. The situation could be further complicated by physical damage to pumping equipment and local loss of electrical power. DWR has an Aqueduct Outage Plan for restoring the California Aqueduct to service should a major break occur, which it estimates could take approximately four months to repair. Limitations on supplies of groundwater and/or imported water for an extended period, due to power outages and/or equipment damage, could result in severe water shortages until the supplies could be restored. Combined water storage of CLWA and the purveyors totals approximately 190 MG of water in storage tanks, which can be gravity fed to Valley businesses and residences, even if there is a power outage. The public would be asked to reduce consumption to minimum health and safety levels, extending the supply to a minimum of seven days. This would provide sufficient time to restore a significant amount of groundwater production. After the groundwater supply is restored, the pumping capacity of the four retail purveyors could meet the reduced demand until such time that the imported water supply was reestablished. Updates on the water situation would be made as often as necessary. The Valley s water sources are generally of good quality, and no insurmountable problems resulting from industrial or agricultural contamination are foreseen. If contamination did result from a toxic spill or similar accident, the contamination would be isolated and should not significantly impact the total water supply. In addition, such an event would be covered by the purveyors Emergency Response Plans SWP Emergency Outage Scenarios In addition to earthquakes, the SWP could experience other emergency outage scenarios. Past examples include slippage of aqueduct side panels into the California Aqueduct near Patterson in the mid-1990s, the Arroyo Pasajero flood event in 1995 (which also destroyed part of Interstate 5 near Los Banos) and various subsidence repairs needed along the East Branch of the Aqueduct since the 1980s. All these outages were short-term in nature (on the order of weeks), and DWR s Operations and Maintenance Division worked diligently to devise methods to keep the Aqueduct in operation while repairs were made. Thus, the SWP contractors experienced no interruption in deliveries. One of the SWP s important engineering design features is the ability to isolate parts of the system. The Aqueduct is divided into pools. Thus, if one reservoir or portion of the California Santa Clarita Valley Urban Water Management Plan Page 8-33


372 2015 Santa Clarita Valley Urban Water Management Plan Aqueduct is damaged in some way, other portions of the system can still remain in operation. The principal SWP facilities are shown on Figure 8-1. FIGURE 8-1 PRIMARY SWP FACILITIES Santa Clarita Valley Urban Water Management Plan Page 8-34
373 2015 Santa Clarita Valley Urban Water Management Plan Other events could result in significant outages and potential interruption of service. Examples of possible nature-caused events include a levee breach in the Delta near the Harvey O. Banks Pumping Plant, a flood or earthquake event that severely damages the Aqueduct along its San Joaquin Valley traverse, or an earthquake event along either the West or East Branches. Such events could impact some or all SWP contractors south of the Delta. The response of DWR, CLWA and other SWP contractors to such events would be highly dependent on the type and location of any such events. In typical SWP operations, water flowing through the Delta is diverted at the SWP s main pumping facility, located in the southern Delta, and is pumped into the California Aqueduct. During the relatively heavier runoff period in the winter and early spring, Delta diversions generally exceed SWP contractor demands and the excess is stored in San Luis Reservoir. Storage in SWP aqueduct terminal reservoirs, such as Pyramid and Castaic Lakes, is also refilled during this period. During the summer and fall, when diversions from the Delta are generally more limited and less than contractor demands, releases from San Luis Reservoir are used to make up the difference in deliveries to contractors. The SWP share of maximum storage capacity at San Luis Reservoir is 1,062,000 AF. CLWA receives its SWP deliveries through the West Branch of the California Aqueduct at Castaic Lake. The only other contractors receiving deliveries from the West Branch are Metropolitan and Ventura County Watershed Protection District (formerly known as the Ventura County Flood Control District). The West Branch has two terminal reservoirs, Pyramid Lake and Castaic Lake, which were designed to provide emergency storage and regulatory storage (i.e., storage to help meet peak summer deliveries) for CLWA and the other two West Branch contractors. Maximum operating capacity at Pyramid and Castaic lakes is 171,200 and 323,700 AF, respectively. In addition to SWP storage south of the Delta in San Luis and the terminal reservoirs, a number of contractors have stored water in groundwater banking programs in the San Joaquin Valley, and many also have surface and groundwater storage within their own service areas. Three scenarios that could impact the delivery to CLWA of its SWP supply, previously banked supplies or other supplies delivered to it through the California Aqueduct are described below. For each of these scenarios, it was assumed that an outage of six months could occur. CLWA s ability to meet demands during the worst of these scenarios is presented following the scenario descriptions Scenario 1: Emergency Freshwater Pathway DWR has estimated that in the event of a major earthquake in or near the Delta, regular water supply deliveries from the SWP could be interrupted for up to three years, posing a substantial risk to the California business economy. Accordingly, a post-event strategy has been developed which would provide necessary water supply protections. The plan has been coordinated through DWR, ACOE, the Bureau of Reclamation, California Office of Emergency Services (Cal OES), Metropolitan, and the State Water Contractors. Full implementation of the plan would enable resumption of at least partial deliveries from the SWP in less than six months. DWR Delta Flood Emergency Management Plan. DWR has developed the Delta Flood Emergency Management Plan to provide strategies for a response to Delta levee failures, which addresses a range of failures up to and including earthquake-induced multiple island failures during dry conditions when the volume of flooded islands and salt water intrusion are large. Under such severe conditions, the plan includes a strategy to establish an emergency Santa Clarita Valley Urban Water Management Plan Page 8-35
374 2015 Santa Clarita Valley Urban Water Management Plan freshwater pathway from the central Delta along Middle River and Victoria Canal to the export pumps in the south Delta. The plan includes the pre-positioning of emergency construction materials at existing and new stockpiles and warehouse sites in the Delta, and development of tactical modeling tools (DWR Emergency Response Tool) to predict levee repair logistics, water quality conditions, and timelines of levee repair and suitable water quality to restore exports. The Delta Flood Emergency Management Plan has been extensively coordinated with state, federal and local emergency response agencies. DWR, in conjunction with local agencies, the Corps and Cal OES, regularly conduct simulated and field exercises to test and revise the plan under real time conditions. DWR and the Corps provide vital Delta region response to flood and earthquake emergencies, complementary to an overall Cal OES structure. Cal OES is preparing its Northern California Catastrophic Flood Response Plan that incorporates the DWR Delta Flood Emergency Management Plan. These agencies utilize a unified command structure and response and recovery framework. DWR and the Corps, through a Draft Delta Emergency Operations Integration Plan (April 2015), would integrate personnel and resources during emergency operations. Levee Improvements and Prioritization. The DWR Delta Levees Subvention Program has prioritized, funded, and implemented levee improvements along the emergency freshwater pathway and other water supply corridors in the central and south Delta region. These efforts have been complementary to the DWR Delta Flood Emergency Management Plan, which along with use of pre-positioned emergency flood fight materials in the Delta, relies on pathway and other levees providing reasonable seismic performance to facilitate restoration of the freshwater pathway after a severe earthquake. Together, these two DWR programs have been successful in implementing a coordinated strategy of emergency preparedness for the benefit of SWP and CVP export systems. Significant improvements to the central and south Delta levee systems along Old and Middle Rivers began in 2010 and are continuing to the present time at Holland Island, Bacon Island, Upper and Lower Jones Tracts, Palm Tract and Orwood Tract. This complements substantially improved levees at Mandeville and McDonald Islands and portions of Victoria and Union Islands. Together, levee improvements along the pathway and Old River levees consisting of crest raising, crest widening, landside slope fill and toe berms, meet the needs of local reclamation districts and substantially improve seismic stability to reduce levee slumping and create a more robust flood-fighting platform. Many urban water supply agencies have participated or are currently participating in levee improvement projects along the Old and Middle River corridors. Assuming that the Banks Pumping Plant would be out of service for six months, DWR could continue making at least some SWP deliveries to all southern California contractors from water stored in San Luis Reservoir. The water available for such deliveries would be dependent on the storage in San Luis Reservoir at the time the outage occurred and could be minimal if it occurred in the late summer or early fall when San Luis Reservoir storage is typically low. In addition to supplies from San Luis Reservoir, water from the West Branch terminal reservoirs would also be available to the three West Branch contractors, including CLWA. CLWA water stored in groundwater banking programs in the San Joaquin Valley may also be available for withdrawal and delivery to CLWA. Santa Clarita Valley Urban Water Management Plan Page 8-36
375 2015 Santa Clarita Valley Urban Water Management Plan Scenario 2: Complete Disruption of the California Aqueduct in the San Joaquin Valley The 1995 flood event at Arroyo Pasajero demonstrated vulnerabilities of the California Aqueduct (the portion that traverses the San Joaquin Valley from San Luis Reservoir to Edmonston Pumping Plant). Should a similar flood event or an earthquake damage this portion of the aqueduct, deliveries from San Luis Reservoir could be interrupted for a period of time. DWR has informed the SWP contractors that a four-month outage could be expected in such an event. CLWA s assumption for this Plan is a more conservative six-month outage. Arroyo Pasajero is located downstream of San Luis Reservoir and upstream of the primary groundwater banking programs in the San Joaquin Valley. Assuming an outage at a location near Arroyo Pasajero that takes the California Aqueduct out of service for six months, supplies from San Luis Reservoir would not be available to those SWP contractors located downstream of that point. However, CLWA water stored in groundwater banking programs in the San Joaquin Valley could be withdrawn and delivered to CLWA, and water from the West Branch terminal reservoirs would also be available to the three West Branch contractors, including CLWA. Assuming an outage at a location on the California Aqueduct south of the groundwater banking programs in the San Joaquin Valley, these supplies would not be available to CLWA, but water from the West Branch terminal reservoirs would be available to the three West Branch contractors, including CLWA Scenario 3: Complete Disruption of the West Branch of the California Aqueduct The West Branch of the California Aqueduct begins at a bifurcation of the Aqueduct south of Edmonston Pumping Plant, which pumps SWP water through and across the Tehachapi Mountains. From the point of bifurcation, the West Branch is an open canal through Quail Lake, a small flow regulation reservoir, to the Peace Valley Pipeline, which conveys water into Pyramid Lake. From Pyramid Lake, water is released into the Angeles Tunnel, through Castaic Powerplant into Elderberry Forebay, and then into Castaic Lake. If a major earthquake (an event similar to or greater than the 1994 Northridge earthquake) were to damage a portion of the West Branch, deliveries could be interrupted. The exact location of such damage along the West Branch would be key to determining emergency operations by DWR and the three West Branch SWP contractors. For this scenario, it was assumed that the West Branch would suffer a single-location break and deliveries of SWP water from north of the Tehachapi Mountains or of CLWA water stored in groundwater banking programs in the San Joaquin Valley would not be available. It was also assumed that Pyramid and Castaic dams would not be damaged by the event and that water in Pyramid and Castaic Lakes would be available to the three West Branch SWP contractors, including CLWA. In any of these three SWP emergency outage scenarios, DWR and the SWP contractors would coordinate operations to minimize supply disruptions. Depending on the particular outage scenario or outage location, some or all of the SWP contractors south of the Delta might be affected. But even among those contractors, potential impacts would differ given each contractor s specific mix of other supplies and available storage. During past SWP outages, the SWP contractors have worked cooperatively to minimize supply impacts among all contractors. Past examples of such cooperation have included certain SWP contractors agreeing to rely more heavily on alternate supplies, allowing more of the outage-limited SWP supply to be delivered to other contractors, and exchanges among SWP contractors, allowing delivery of one contractor s SWP or other water to another contractor, with that water being returned after the outage was over. Santa Clarita Valley Urban Water Management Plan Page 8-37
376 2015 Santa Clarita Valley Urban Water Management Plan Assessment of Worst-Case Scenario Of these three SWP outage scenarios, the West Branch outage scenario presents the worstcase scenario for the CLWA service area. In this scenario, CLWA and the purveyors would rely on local supplies and water available to CLWA from Pyramid and Castaic Lakes. See Section regarding recommendations for emergency outage storage using co-agreements with other SWP contractors and individual groundwater banking programs. An assessment of the supplies available to meet demands in CLWA s service area during a six-month West Branch outage and the additional levels of conservation projected to be needed are presented in Table 8-4 for 2010 through During an outage, the local supplies available would consist of groundwater from the Alluvial Aquifer and the Saugus Formation, as well as recycled water to the extent available. It was assumed that local well production would be unimpaired by the outage and that the outage would occur during a year when average/normal supplies would be available from the Alluvial Aquifer. Pumping from the Saugus was assumed to be one-half of the single-dry year supplies. Note that adequate well and aquifer capacity exists to pump at levels higher than those assumed in this assessment, particularly during a temporary period such as an outage. However, to be conservative, groundwater production was assumed to be one-half of annual supplies. Furthermore, based on the assumption that additional voluntary and/or mandatory conservation could reduce the amount of waste discharge, and therefore reduce the amount of recycled water produced by the WRPs, the amount of recycled water potentially available for non-potable use is assumed to be at least 25 percent less than during normal conditions. The water available to CLWA from Pyramid and Castaic Lakes includes flexible storage available to CLWA at Castaic Lake and emergency and potentially regulatory storage available in both Pyramid and Castaic Lakes. Regulatory storage, which is used to help meet high peak summer deliveries, may or may not be available depending on what time of year an outage occurs. For this assessment, regulatory storage was assumed to be unavailable. The amount of emergency storage assumed to be available to CLWA was based on CLWA s proportionate share of usable storage in each reservoir, where usable storage is maximum operating storage, less regulatory and dead pool storage. At Castaic Lake, this usable storage determination also excludes the three West Branch contractors total Flexible Storage Accounts. CLWA s proportionate share of usable storage was assumed to be slightly less than three percent, based on its share of capital cost repayment at each reservoir. On this cost repayment basis, the proportionate shares of Metropolitan and Ventura County Watershed Protection District are about 96 percent and one percent, respectively. Table 8-13 shows that, for a six-month emergency outage, demands with passive savings and Active Conservation described in Section 2 would be met. In such an emergency, and depending in the conditions at the time, additional conservation may be needed to meet demands and protect public health and safety. The acquisition of emergency storage, as discussed in Section , could reduce or eliminate the need for additional conservation if deemed necessary. Santa Clarita Valley Urban Water Management Plan Page 8-38
377 2015 Santa Clarita Valley Urban Water Management Plan TABLE 8-13 PROJECTED SUPPLIES AND DEMANDS DURING SIX MONTH DISRUPTION OF IMPORTED SUPPLY (AF) (a) Existing Supplies Existing Groundwater Alluvial Aquifer (b) 12,050 12,050 12,050 12,050 12,050 12,050 12,050 Saugus Formation (c) 9,933 9,933 9,933 9,933 9,933 9,933 9,933 Recycled Water (d)(e) Planned Supplies Future Groundwater Alluvial Aquifer (b) 1,000 2,000 2,500 3,500 3,500 3,500 3,500 Saugus Formation (Restored) (c) 1,887 1,887 1,887 1,887 1,887 1,887 1,887 Saugus Formation (New) (c) 4,780 4,780 4,780 4,780 4,780 4,780 4,780 Recycled Water (d)(e) 212 1,934 2,860 3,602 3,602 3,602 3,602 Total Existing and Planned Supplies 30,031 32,753 34,179 35,921 35,921 35,921 35,921 SWP West Branch Storage Available Flexible Storage Accounts (f) 6,060 6,060 4,680 4,680 4,680 4,680 4,680 Emergency Storage Pyramid Lake (g) 4,370 4,370 4,370 4,370 4,370 4,370 4,370 Castaic Lake (h) 3,370 3,370 3,370 3,370 3,370 3,370 3,370 Total West Branch Storage 13,800 13,800 12,420 12,420 12,420 12,420 12,420 Total Supplies and West Branch Storage 43,831 46,553 46,599 48,341 48,341 48,341 48,341 Demands (i) Demand w/ Plumbing Code Savings 38,400 42,400 46,400 50,000 51,700 53,400 55,200 Demand w/ Plumbing Code Savings and Active Conservation 34,500 37,300 40,400 43,100 44,300 45,500 47,000 Notes: (a) Assumes complete disruption in SWP supplies and in deliveries through the California Aqueduct for six months. (b) Pumping from the Alluvial Aquifer is assumed to be one-half of the average normal year supplies (see Table 6-2). (c) Pumping from the Saugus Formation is assumed to be one-half of the single-dry year supplies (see Table 6-3). (d) Recycled water supply is based on one-half of existing and planned use. (e) Assumes 25% reduction in waste discharge, and therefore in recycled water availability, due to additional voluntary conservation. (f) Includes both CLWA and Ventura County entities flexible storage accounts. Extended term of agreement with the Ventura County entities expires after (g) CLWA's share of usable storage at Pyramid Lake, based on its 2.817% proportionate share of capital cost repayment of the reservoir, and assumed usable storage of 155,100 AF. (h) CLWA's share of usable storage at Castaic Lake, based on its 2.927% proportionate share of capital cost repayment of the reservoir, and assumed usable storage of 115,100 AF. (i) Demands are assumed to be one-half of average/normal year Regional Summary demands from Table Santa Clarita Valley Urban Water Management Plan Page 8-39
378 2015 Santa Clarita Valley Urban Water Management Plan Recommendations for Emergency Storage The various outage scenarios described in Section highlight the benefit of CLWA having water stored in multiple banking programs south of the Delta. Banking programs located in Kern County, which have access to the California Aqueduct, are ideally suited to meet at least part of CLWA s emergency needs. The worst-case scenario described above (a complete disruption on the West Branch of the aqueduct) demonstrates the desirability that CLWA also has water stored in at least one water banking program geographically located south of the Tehachapi Mountains. Storage located south of the Tehachapi Mountains may necessitate an exchange agreement with another West Branch contractor so that the contractor could be served from CLWA s banked water, and CLWA could be served by a portion of the contractor s water in Pyramid or Castaic Lake (this worst case scenario also assumes that CLWA has access to its full Flexible Storage Account in Castaic Lake, in addition to emergency storage). The most likely and utilizable arrangement would be with Metropolitan, which retains a significant portion of the storage capacity in Castaic Lake. CLWA could store varying amounts of its water in groundwater storage or banking programs within or adjacent to Metropolitan s service area. In the event of an outage or other emergency, Metropolitan would serve its customers with CLWA s stored water and CLWA would serve its customers with a like amount of Metropolitan s water in Castaic Lake. Potential banking programs, where CLWA could be served by a portion of the contractor s water in Pyramid or Castaic Lake for a potential exchange of emergency outage storage include the following locations: Willow Springs Water Bank, Antelope Valley - This project is located in eastern Kern County, in the northern portion of the Antelope Valley. It is adjacent to both the East Branch of the California Aqueduct and the Los Angeles Aqueduct. This program is active and is seeking participants. Antelope Valley-East Kern Water Agency Water Supply Stabilization Program and Groundwater Recharge Project - This is a project proposed by the Antelope Valley-East Kern Water Agency (AVEK), a SWP wholesaler located in the Antelope Valley area of southeastern Kern County and northern Los Angeles County. The project is adjacent to the East Branch of the California Aqueduct. AVEK is conducting the environmental analysis for the proposed project. Palmdale Regional Groundwater Recharge and Recovery Project - The Palmdale Water District (PWD), a SWP wholesaler, is implementing a largescale groundwater recharge and recovery project located adjacent to the East Branch of the California Aqueduct. The project will obtain water for recharge from the SWP and also from recycled water produced by the Los Angeles County Sanitation District Palmdale Water Reclamation Plant. CLWA could be a potential Santa Clarita Valley Urban Water Management Plan Page 8-40
379 2015 Santa Clarita Valley Urban Water Management Plan partner in the project by banking excess supply in wet years and recovering that supply in dry years Regional Power Outage Scenarios For a major emergency such as an earthquake, Southern California Edison (Edison) has declared that in the event of an outage, power would be restored within a 24 hour period. Following the Northridge earthquake, Edison was able to restore power within 19 hours. Edison experienced extensive damage to several key power stations, yet was still able to recover within a 24-hour timeframe CLWA Power Outage Scenario To specifically address the concern of water outages due to loss of power, CLWA has equipped its two treatment plants with generators to produce power for treating water to comply with the California Safe Drinking Water Act and the Health and Safety Code. The Rio Vista Water Treatment Plant and Intake Pump Station emergency generator system provides electrical power to treat 30 MGD for 72 hours without fuel replacement. The Earl Schmidt Filtration Plant emergency generator system provides electrical power to treat 33 MGD for 72 hours without fuel replacement NCWD Power Outage Scenario NCWD has procedures for earthquakes, major fire emergencies, water outages due to loss of power, localized flooding, water contamination and acts of sabotage. To specifically address the concerns of water outages due to loss of power, NCWD has purchased and maintains three mobile generators. The generators are trailer mounted and have the following capacities: 600 kilovolt-ampere (KVA); 300 KVA; and 180 KVA. These capacities provide the capability to run any facility within NCWD s service area. All primary pumping facilities are equipped with emergency transfer switches, and NCWD employees are trained regularly to maximize the speed to install and operate the generators. The generator run time is only limited by the amount of available diesel fuel. NCWD has an above ground diesel fuel storage tank with a capacity of 1,000 gallons located at its main office in the City of Santa Clarita. Multiple crew trucks are equipped with 100 gallon diesel tanks and the necessary fueling equipment to refill the generators. NCWD would respond to power outages on a prioritized basis and would continue its response to the power emergency as long as necessary. In addition to the generators, NCWD has one gas driven pump and one diesel driven pump capable of delivering 600 gpm and 1,200 gpm, respectively. All NCWD pumping facilities have been equipped with the necessary appurtenances to quickly connect the portable pumps to restore pumping operations SCWD Power Outage Scenario SCWD has prepared emergency operations procedures for the effective use of resources during various emergency situations. Emergency situations include but are not limited to earthquakes, Santa Clarita Valley Urban Water Management Plan Page 8-41
380 2015 Santa Clarita Valley Urban Water Management Plan major fire emergencies, water outages due to loss of power, localized flooding, water contamination and acts of sabotage. To specifically address the concerns of water outages due to loss of power, SCWD has purchased and maintains five mobile generators and has the ability to obtain emergency access to others. The current generators are trailer mounted and have the capability of supplying up to 450 KVA. This capacity provides the capability to run any facility within its service area. Most primary pumping facilities are equipped with emergency transfer switches and SCWD employees are trained regularly to install and operate the generators. The generator s run time is only limited by the amount of available diesel fuel. SCWD has an above-ground diesel fuel storage tank with a capacity of 1,000 gallons located at its warehouse in the City of Santa Clarita. SCWD also has the assistance of a commercial fuel supplier when needed. SCWD maintains a trailer-mounted 100-gallon diesel tank that will be deployed as required to maintain service. SCWD would respond to power outages on a prioritized basis and would continue its response to the power emergency as long as necessary. In addition to the generators, SCWD has a gas driven pump capable of delivering a maximum 2,000 gpm. This pump can be installed at select facilities and run as required VWC Power Outage Scenario In the event that a power outage occurs, VWC has two mobile generators capable of powering any of VWC s wells, turnouts, or booster stations. The trailer mounted generators are 600 KVA and 400 KVA. A majority of VWC facilities are equipped with emergency transfer switches. VWC conducts annual preparedness activities which include the mobilization and operations of certain emergency equipment. VWC has emergency contractors available to both transport and fuel equipment. Although VWC does not locally store fuel, it has acknowledgement from regional contractors to provide necessary resources such as fuel and equipment. VWC would prioritize response to power outages and would continue its response to the power emergency as long as necessary. For regional power outages, VWC would rely on Edison s reliability criteria for restoring service with the longest outage assumed not to exceed 24 hours. This length of outage would not have a significant impact on the water service. VWC continually updates an emergency operations plan which includes procedures for emergency situations which include but are not limited to earthquakes, major fires, water outages, localized flooding, water contamination, and acts of sabotage Minimum Water Supply Available During Next Three Years The minimum water supply available during the next three years would occur during a threeyear multiple-dry year event between the years 2016 to As shown in Table 8-14, the total water supply available next year is about 94,000 AF, and during each of the following two years is about 105,000 AFY. When comparing these supplies to the demand projections provided in Chapter 2 of this Plan, CLWA and the purveyors have adequate supplies available to meet projected demands should a multiple-dry year period occur during the next three years. Santa Clarita Valley Urban Water Management Plan Page 8-42
381 2015 Santa Clarita Valley Urban Water Management Plan TABLE 8-14 ESTIMATE OF MINIMUM SUPPLY FOR THE NEXT THREE YEARS (AF) Existing Supplies Existing Groundwater Alluvial Aquifer (a) 20,350 20,350 20,350 Saugus Formation (a) 15,525 15,525 15,525 Total Groundwater 35,875 35,875 35,875 Recycled Water Total Recycled Imported Water State Water Project Table A (b) 20,000 20,000 20,000 State Water Project Carryover (c) 6,016 6,016 6,016 Flexible Storage Accounts (d) 2,020 2,020 2,020 Buena Vista-Rosedale 11,000 11,000 11,000 Nickel Water - Newhall Land (e) 1,607 1,607 1,607 Yuba Accord (f) 1,000 1,000 1,000 Total Imported 41,643 41,643 41,643 Banking and Exchange Programs Rosedale-Rio Bravo Bank (g) 3,000 3,000 3,000 Semitropic Bank (g) 5,000 5,000 5,000 Semitropic - Newhall Land Bank (g)(h) 4,950 4,950 4,950 Rosedale Rio-Bravo Exchange (i) 3,167 3,167 3,167 West Kern Exchange (i) Total Bank/Exchange 16,284 16,284 16,284 Total Existing Supplies 94,252 94,252 94,252 Planned Supplies Future Groundwater Saugus Formation (Restored Well) (j) - 3,775 3,775 Planned Banking Programs Rosedale-Rio Bravo Bank (k) - 7,000 7,000 Total Planned Supplies 10,775 10,775 Total Existing and Planned Supplies 94, , ,027 Notes: (a) Based on existing groundwater supplies available during a three-year dry period from Table 3-12B. (b) SWP Table A supplies to CLWA based on deliveries from DWR s 2015 DCR for the worst case three-year dry period of , from Table 3-2. (c) Based on current total of CLWA Table A supply unused from previous year that is carried over in SWP reservoir storage, divided by three (three-year dry period). It is assumed during this dry period that SWP reservoir space remains available to store this supply. (d) Total amount of storage available divided by 3 (three-year dry period). (e) Existing Newhall Land supply committed under approved Newhall Ranch Specific Plan. Assumed to be available for annual purchase. (f) Reflects an estimated average of 1,000 AFY (after losses) during the three-year period. (g) Based on maximum firm annual pumpback capacity. (h) Existing Newhall Land supply, with firm withdrawal capacity assumed to be available to CLWA. (i) Based on current total of recoverable exchange water divided by three (three-year dry period). (j) Based on restored well supply during a three-year dry period from Table 3-12B, with supply available as of (k) Based on maximum of expanded firm annual pumpback capacity, with expanded capacity available as of Santa Clarita Valley Urban Water Management Plan Page 8-43
382 Section 9: References 2015 Santa Clarita Valley Urban Water Management Plan AMEC Geomatrix Former Whittaker-Bermite Facility, Santa Clarita, CA Summary Report for Month of August AMEC Geomatrix, September 15, 2009, Progress Letter Report. California Department of Water Resources. March Methodologies for Calculating Baseline and Compliance Urban Per Capita Water Use, Urban Water Management Plan Guidebook. California Department of Water Resources Bulletin Management of the California State Water Project. California Department of Water Resources, Bulletin 118 Update 2003 California Department of Water Resources. February x2020 Water Conservation Plan. California Department of Water Resources. November Climate Change Handbook for Regional Water Planning California Department of Water Resources, July State Water Project Delivery Capability Report California Department of Water Resources, October California Water Plan 2013 Update California Department of Water Resources and the Army Corps of Engineers, April Draft Delta Emergency Operations Integration Plan. California Division of Drinking Water, November Policy Memo : Policy Guidance for Direct Domestic Use of Extremely Impaired Sources. California Irrigation Management System (CIMIS) Santa Clarita Station No. 204, Los Angeles Region, 12/ / California State Water Resources Control Board, March Revised Water Right Decision Carollo Engineers, June Castaic Lake Water Agency Water Resources Reconnaissance Study. Castaic Lake Water Agency. May Water Supply Reliability Plan Update, prepared by Kennedy/Jenks Consultants. Castaic Lake Water Agency. November Urban Water Management Plan. Santa Clarita Valley Urban Water Management Plan References 9-1
383 2015 Santa Clarita Valley Urban Water Management Plan Castaic Lake Water Agency, June Urban Water Management Plan. Castaic Lake Water Agency, February Integrated Regional Water Management Plan for the Upper Santa Clara River Castaic Lake Water Agency, July, Ordinance No. 41: An Ordinance of the Board of Directors of the Castaic Lake Water Agency to Implement the Water Shortage Contingency Plan to Comply with the State Water Resources Control Board Resolution No and Adopt Water Conservation Requirements. Available at: Castaic Lake Water Agency, July Castaic Lake Water Agency 2015 Strategic Plan Castaic Lake Water Agency, et al. June The Santa Clarita Valley 2014 Water Quality Report Castaic Lake Water Agency, et al. The Santa Clarita Valley 2015 Water Quality Report CH2M Hill, 2004a. Regional Groundwater Flow Model for the Santa Clarita Valley, Model Development and Calibration. April. CH2M Hill, 2004 b. Analysis of Perchlorate Containment in Groundwater Near the Whittaker- Bermite Property, Santa Clarita, California, Prepared in support of the Permit Application, December. CH2M Hill, 2005a. Technical Memorandum, Calibration Update of the Regional Groundwater Flow Model for the Santa Clarita Valley, Santa Clarita, California, August. CH2M Hill and Luhdorff & Scalmanini, Consulting Engineers, Analysis of Groundwater Basin Yield, Upper Santa Clara River Groundwater Basin, East Subbasin, Los Angeles County, California, prepared for Upper Basin Water Purveyors, August. GSI Water Solutions, Inc Updated Water Demand Projections for West Side Communities (Valencia, California). Technical Memorandum. March. GSI & LSCE Draft Report: Perchlorate Containment Plan for Well V201 and Saugus Formation Groundwater in the Santa Clarita Valley (Task 3 of the Well V201 Restoration Program). H. Cooley, and K. Donnelly. July Key Issues in Seawater Desalination in California: Propose Seawater Desalination Facilities. Pacific Institute. Available at: Impact Sciences, Inc. January Program EIR for the County of Los Angeles Proposed Santa Clarita Valley Area Plan. Kennedy/Jenks Consultants. 2016a. Recycled Water Master Plan Update. Santa Clarita Valley Urban Water Management Plan References 9-2
384 2015 Santa Clarita Valley Urban Water Management Plan Kennedy/Jenks Consultants. 2016b. Santa Clarita Valley Recycled Water Rules and Regulations Handbook. Adopted by the CLWA Board of Directors on 10 February Kennedy/Jenks Consultants Integrated Regional Water Management Plan for the Upper Santa Clara River Region. February. Kennedy/Jenks Consultants CLWA Recycled Water Master Plan. Los Angeles Regional Water Quality Control Board (LARWQCB). October Resolution No. R Available here: Accessed on January 22, Los Angeles Regional Water Quality Control Board (LARWQCB). May Resolution No. R Available here: Accessed on March 14, Los Angeles Regional Water Quality Control Board (LARWQCB). November Resolution No. R Available here: 4/santaclara_river_attachment_rs2007_018.pdf. Accessed on March 14, Los Angeles Regional Water Quality Control Board (LARWQCB) Resolution No Amendment to the Water Quality Control Plan for the Los Angeles Region to Update the Chloride Objective for Reach 3 at Santa Paula in the Lower Santa Clara River. Los Angeles Regional Water Quality Control Board (LARWQCB). Water Quality Control Plan: Los Angeles Region Basin Plan for the Coastal Watersheds of Los Angeles and Ventura Counties. Luhdorff and Scalmanini, Consulting Engineers, Impact and Response to Perchlorate Contamination, Valencia Water Company Well Q2, prepared for Valencia Water Company, April. Luhdorff & Scalmanini and GSI Water Solutions. August Analysis of Groundwater Supplies and Groundwater Basin Yield, Upper Santa Clara River Groundwater Basin, East Subbasin Luhdorff & Scalmanini, Consulting Engineers, December Groundwater Management Plan for the Santa Clara Valley Groundwater Basin, East Subbasin Luhdorff & Scalmanini, Consulting Engineers, June Santa Clarita Valley Water Report Maddaus Water Management (MWM), Inc SCV Demand Study Update: Land-Use Based Demand Forecast, Technical Memorandum No.2. March. Santa Clarita Valley Urban Water Management Plan References 9-3
385 2015 Santa Clarita Valley Urban Water Management Plan Maddaus Water Management (MWM), Inc SCV Family of Water Supplies Water Use Efficiency Strategic Plan. June. Maddaus Water Management (MWM), Inc CLWA Population Assessment and GPCD Review, Draft Technical Memorandum. November. Newhall County Water District, Resolution of the Board of Directors of Newhall County Water District Rescinding Resolution to Update the Water Shortage Contingency Plan to Comply with the Expanded and Extended State Water Resources Control Board Water Conservation Requirements. June. Newhall County Water District, Water Conservation, Shortage, Drought and Emergency Response Ordinance No Board and Directors Adopted Ordinance No July. Richard C. Slade & Associates, LLC,2001 Update Report, Hydrogeologic Conditions in the Alluvial and Saugus Formation Aquifer Systems, prepared for Santa Clarita Valley Water Purveyors, July Sanitation Districts of Los Angeles County, Santa Clarita Valley Sanitation District Chloride Compliance Facilities Plan and Environmental Impact Report. October. Santa Clarita Water Division. June Ordinance No. 43: An Ordinance of the Board of Directors of the Castaic Lake Water Agency to Establish Water Conservation and Water Supply Shortage Restrictions and Regulations for the Santa Clarita Water Division. Available here: 43.pdf. Accessed on March Slade, R. C.,Hydrogeologic Assessment of the Saugus Formation in the Santa Clara Valley of Los Angeles County, California, Vols. I and II, prepared for Castaic Lake Water Agency,1988. Slade, R. C.,Hydrogeologic Investigation of Perennial Yield and Artificial Recharge Potential of the Alluvial Sediments in the Santa Clarita River Valley of Los Angeles County, California, Vols. I and II, prepared for Upper Santa Clara Water Committee, Southern California Association of Governments (SCAG), October Regional Housing Needs Assessment Allocation Plan (October October 2021). Available at: Tanji, K.; Grattan, S.; Grieve, C.; Harivandi, A.; Rollins, L.; Shaw, D.; Sheikh, B., and Wu, L Salt Management Guide for Landscape Irrigation with Recycled Water in Coastal Southern California- A Comprehensive Literature Review. Valencia Water Company, A Resolution of the Board of Directors of the Valencia Water Company to Implement the Water Shortage Contingency Plan to Comply with the State Santa Clarita Valley Urban Water Management Plan References 9-4
386 2015 Santa Clarita Valley Urban Water Management Plan Water Resources Control Board Resolution No and Adopt Water Conservation Requirements. June. Valencia Water Company, January Schedule No. 1-R: Residential General Metered Service. Available at: W.pdf Valencia Water Company, January Schedule No. 1-DIM: Dedicated Irrigation Mixed Sources Metered Service. Available at: DIM-MS_705-W_to_707-W.pdf Santa Clarita Valley Urban Water Management Plan References 9-5


387
Water Supply Study for the Lyons Canyon Project
 for the Lyons Canyon Project Prepared by: Science Applications International Corporation TABLE OF CONTENTS 1.0 INTRODUCTION... 1 1.1 Lyons Canyon Project... 1 1.2 Purpose of the Water Supply Study...
Santa Clarita Valley Family of Water Suppliers WATER USE EFFICIENCY STRATEGIC PLAN. June 24, 2015 WESTERN POLICY RESEARCH
 Santa Clarita Valley Family of Water Suppliers WATER USE EFFICIENCY STRATEGIC PLAN June 24, 2015 WESTERN POLICY RESEARCH TABLE OF CONTENTS W A T E R U S E E F F I C I E N C Y S T R A T E G I C P L A N
SB 610 Water Supply Assessment
 SB 610 Water Supply Assessment UPDATED WATER SUPPLY ASSESSMENT Henry Mayo Newhall Memorial Hospital Master Plan Prepared for: The City of Santa Clarita April 2008 Prepared by Valencia Water Company 24631
ADMIN DRAFT (SECTIONS 1-7) Castaic Lake Water Agency Recycled Water Master Plan
 Castaic Lake Water Agency Recycled Water Master Plan") 2775 North Ventura Road, Suite 100 Oxnard, California 93036 805-973-5700 FAX: 805-973-1440 ADMIN DRAFT (SECTIONS 1-7) Castaic Lake Water Agency Recycled Water Master Plan January to April 2016 Prepared
2775 North Ventura Road, Suite 100 Oxnard, California 93036 805-973-5700 FAX: 805-973-1440 ADMIN DRAFT (SECTIONS 1-7) Castaic Lake Water Agency Recycled Water Master Plan January to April 2016 Prepared
2010 Urban Water Management Plan
 200 New Stine Road, Suite 205 Bakersfield, California 93309-2663 661-835-9785 FAX: 661-831-5196 2010 Urban Water Management Plan June 2011 Prepared for West Kern Water District P.O. Box 1105 Taft, CA 93268
2015 Urban Water Management Plan for Mojave Water Agency
 Courtesy: Google Earth FINAL 2015 Urban Water Management Plan for Mojave Water Agency Prepared by Kennedy/Jenks Consultants June 2016 300 North Lake Avenue, Suite 1020 Pasadena, California 91101 626-568-4300
UWMP Checklist Arranged by Subject
 Checklist Arranged by CWC 10620(b) 10620(d)(2) Requirement Every person that becomes an urban water supplier shall adopt an urban water management plan within one year after it has become an urban water
2015 Urban Water Management Plan for District 40
 2015 Urban Water Management Plan for District 40 County of Los Angeles Department of Public Works Los Angeles County Waterworks District No. 40, Antelope Valley Alhambra, California February 2017 Table
Notice of Public Hearing. Notice of Public Hearing
 2015 URBAN WATER MANAGEMENT PLAN Table 8-2: Notification to Cities and Counties Retail: Notification to Cities and Counties City Name 60 Day Notice Notice of Public Hearing Dana Point Mission Viejo County
Ventura County Waterworks District No. 8. Amended 2015 Urban Water Management Plan for. Ventura County Waterworks District No. 8
 Ventura County Waterworks District No. 8 Amended 2015 Urban Water Management Plan for Ventura County Waterworks District No. 8 April 2017 RESOLUTION NO. WWD-263 A RESOLUTION OF THE BOARD OF DIRECTORS
Section 3: Water Supplies and Water Demand
 Section : Water Supplies and Water Demand 1 1 1 1 1 1 1 1 0 1 0 1 As summarized in Section, the Regional water supplies include groundwater, imported water, and recycled water. This Section describes the
FINAL JUNE 2016 CITY OF WOODLAND Urban Water Management Plan
 FINAL JUNE 2016 CITY OF WOODLAND 2015 Urban Water Management Plan (THIS PAGE LEFT BLANK INTENTIONALLY) 2015 Urban Water Management Plan Prepared for City of Woodland June 2016 204-12-15-53 Project Manager
Las Virgenes Municipal Water District 2010 Urban Water Management Plan Contact Sheet
 2010 Urban Water Management Plan Contact Sheet Date plan submitted to the Department of Water Resources: June 29, 2011 Name of person(s) preparing this plan: Mr. David Lippman, P.E., Director, Facilities
Eastern Municipal Water District 2015 Urban Water Management Plan
 FINAL Prepared by June 2016 Table of Contents EXECUTIVE SUMMARY ES-1 PLAN PURPOSE AND OVERVIEW... XI ES-2 SERVICE AREA AND WATER SUPPLIES... XII ES-3 WATER DEMANDS... XIII ES-4 WATER SUPPLY FORECAST...
2015 Urban Water Management Plan
 East Niles Community Services District 2015 Urban Water Management Plan June 2016 Prepared for: East Niles Community Services District 1417 Vale Street Bakersfield, CA 93306 Prepared by: MKN & Associates
The City and MID adopted this 2010 UWMP in Copies of the adoption resolutions are included in Appendix B. ES-1
 ES.1 INTRODUCTION This (UWMP) has been prepared for the City of Modesto (City) and the Modesto Irrigation District (MID) by West Yost Associates (West Yost) as a joint UWMP. This 2010 UWMP for the City
INDIAN WELLS VALLEY WATER DISTRICT 2010 URBAN WATER MANAGEMENT PLAN MAY Prepared by
 INDIAN WELLS VALLEY WATER DISTRICT (760) 375-5086 500 WEST RIDGECREST BOULEVARD POST OFFICE BOX 1329 RIDGECREST, CALIFORNIA 93556 RIDGECREST, CALIFORNIA 93556-1329 INDIAN WELLS VALLEY WATER DISTRICT 2010
2015 Urban Water Management Plan
 2015 Urban Water Management Plan FINAL June 2016 Prepared by Page intentionally left blank. 2015 Urban Water Management Plan Final Prepared By: June 27, 2016 Sweetwater Authority 2015 Urban Water Management
Section 1: Introduction
 Section 1: Introduction The Salt and Nutrient Management Plan (SNMP) for the Antelope Valley (AV) has been prepared in cooperation with the water and wastewater agencies, the cities of Lancaster and Palmdale,
Irvine Ranch Water District s Groundwater Banking Program
 Irvine Ranch Water District s Groundwater Banking Program National Water Research Institute Drought Response Workshop October 8, 2013 1 Today s Discussion Introduction to IRWD Drought Preparedness at IRWD:
Final Draft City of Manteca 2015 Urban Water Management Plan
 10850 Gold Center Drive, Suite 350 Rancho Cordova, CA 95670 916-858-2700 916-858-2754 (Fax) Final Draft 2015 Urban Water Management Plan July 2016 Prepared for 1001 W. Center St. Manteca, California 95337
SB 606 (Hertzberg) Summary As Chaptered on 5/31/18
 Summary As Chaptered on 5/31/18") SB 606 (Hertzberg) Summary As Chaptered on 5/31/18 Urban Water Use Objectives and Water Use Reporting Requirements: SB 606 requires the State Water Resources Control Board (State Water Board) and the Department
SB 606 (Hertzberg) Summary As Chaptered on 5/31/18 Urban Water Use Objectives and Water Use Reporting Requirements: SB 606 requires the State Water Resources Control Board (State Water Board) and the Department
PUBLIC NOTICE OF AVAILABILITY
 / COUNTY SANITATION DISTRICTS OF LOS ANGELES COUNTY 1955 Workman Mill Road, Whittier, CA 90601-1400 Mailing Address : P.O. Box 4998, Whittier, CA 90607-4998 Telephone : (562) 699-7 411, FAX: (562) 699-5422
Draft Program EIR for thecity of Santa Clarita s Proposed One Valley One Vision General Plan
 Draft Program EIR for thecity of Santa Clarita s Proposed One Valley One Vision General Plan SCH# 2008071133 One Valley One Vision 2010 Volume III Appendix 3.13 (continued) One Valley One Vision 2010 Draft
Section 7: Resource Management Strategies Used to Meet Plan Objectives
 Section : Resource Management Strategies Used to Meet Plan Objectives 1 1 1 1 1 1 1 1 0 1 0 1.1 Overview Section of this IRWMP introduced the resource management objectives for the Region, as identified
Santa Clarita Valley Hydrogeology. Production Cost = $100 / acre foot
 August 2014 Santa Clarita Valley Hydrogeology Production Cost = $100 / acre foot State Water Project 5,000 to 95,000 AFY Kern County Partners 11,000 AFY 158,000 AF Banked Local Groundwater 37,500 to 55,000
Appendix D: Public Meeting Notice
 California Water Service 2015 Urban Water Management Plan Kern River Valley District Appendix D: Public Meeting Notice Notice of Intent Proof of Publication Public Meeting Agenda Public Meeting Comment
PALMDALE WATER DISTRICT
 Since 1918 Board of Directors ROBERT E. ALVARADO Division 1 JOE ESTES Division 2 MARCO HENRIQUEZ Division 3 KATHY MAC LAREN Division 4 VINCENT DINO Division 5 ALESHIRE & WYNDER LLP Attorneys PALMDALE WATER
2010 Urban Water Management Plan San Dimas
 Final Report 2010 Urban Water Management Plan San Dimas Corporate Office 630 E. Foothill Blvd. San Dimas CA 91773 August 2011 Final Report 2010 Urban Water Management Plan San Dimas Corporate Office 630
APPENDIX A. Legislative Requirements. Urban Water Management Planning Act SBx7-7 Water Conservation Act of 2009 SB1478
 APPENDIX A Legislative Requirements Urban Water Management Planning Act SBx7-7 Water Conservation Act of 2009 SB1478 Section K: California Water Code, Division 6, Part 2.6: Urban Water Management Planning
2015 URBAN WATER MANAGEMENT PLAN VOLUME 1 FINAL REPORT
 CITY OF HEMET 2015 URBAN WATER MANAGEMENT PLAN VOLUME 1 FINAL REPORT JUNE 2016 Prepared by CITY OF HEMET 2015 URBAN WATER MANAGEMENT PLAN VOLUME 1 FINAL REPORT JUNE 2016 PREPARED FOR CITY OF HEMET 445
1.1 Introduction
 Table of Contents Executive Summary ES.1 Introduction... ES-1 ES.2 Plan Adoption... ES-1 ES.3 Plan Overview... ES-2 ES.3.1 Service Area... ES-2 ES.3.2 Water Demand... ES-3 ES.3.3 Projected Water Supply...
2015 Urban Water Management Plan
 Final for the San Lorenzo Valley Water District Prepared by 12/2/2016 Table of Contents TABLE OF CONTENTS Table of Contents... i List of Tables... v List of Figures... vi List of Terms and Acronyms...
City of Rio Vista Urban Water Management Plan 2010
 1. Plan Preparation: City of Rio Vista Urban Water Management Plan 2010 The City of Rio Vista (City), as defined in the California Waster Code section 10617, qualifies as an "Urban Water Supplier". The
UWMP Standardized Tables. Los Altos Suburban District Urban Water Management Plan Appendix H
 UWMP Standardized Tables Los Altos Suburban District 2015 Urban Water Management Plan Appendix H Table 2-1 Retail Only: Public Water Systems Public Water System Number Public Water System Name Number of
UWMP Standardized Tables. City of Hawthorne District Urban Water Management Plan Appendix H
 UWMP Standardized Tables City of Hawthorne District 2015 Urban Water Management Plan Appendix H Table 2-1 Retail Only: Public Water Systems Public Water System Number Public Water System Name Number of
Hollister Urban Area Water and Wastewater Master Plan Update
 Hollister Urban Area Water and Wastewater Master Plan Update City of Hollister, San Benito County Water District, and Sunnyslope County Water District June 2017 Robert H. Ellis NO. 24679 EXP. 12/31/17
NOTICE OF PREPARATION. California Office of Planning and Research, Responsible Agencies, Trustee Agencies, and Other Interested Parties
 COUNTY SANITATION DISTRICTS OF LOS ANGELES COUNTY 1955 Workman Mill Road, Whittier, CA 90601-1400 Mailing Address: P.O. Box 4998, Whittie r, CA 90607-4998 Telephone: (562) 699-7411, FAX: (562) 699-5422
City of Anaheim. Amendments to 2015 Urban Water Management Plan
 City of Anaheim Amendments to 2015 Urban Water Management Plan December 2016 City of Anaheim Amendments to 2015 Urban Water Management Plan (Plan) Contents Revisions to Section 5.2.3 - Provide an outline
URBAN WATER MANAGEMENT PLAN
 2015 URBAN WATER MANAGEMENT PLAN Working Draft December 2015 THE METROPOLITAN WATER DISTRICT OF SOUTHERN CALIFORNIA 2015 URBAN WATER MANAGEMENT PLAN JUNE 2016 Working Draft December 2015 Planning for the
2010 Urban Water Management Plan Claremont
 Final Report 2010 Urban Water Management Plan Claremont Corporate Office 630 E. Foothill Blvd. San Dimas CA 91773 September 2011 Final Report 2010 Urban Water Management Plan Claremont Corporate Office
2015 Urban Water Management Plan
 2015 Urban Water Management Plan DRAFT Temescal Valley Water District 22646 Temescal Canyon Road Corona, California 92883 (951) 277-1414 December 2017 Prepared by: 2015 Urban Water Management Plan Page
Suisun-Solano Water Authority Urban Water Management Plan
 Suisun-Solano Water Authority Urban Water Management Plan FINAL August 8, 2016 TABLE OF CONTENTS LIST OF FIGURES...4 LIST OF TABLES...5 LIST OF ACRONYMS...6 1. INTRODUCTION AND OVERVIEW...8 1.1 Background
UWMP Standardized Tables. Dominguez District Urban Water Management Plan Appendix H
 UWMP Standardized Tables Dominguez District 2015 Urban Water Management Plan Appendix H Table 2-1 Retail Only: Public Water Systems Public Water System Number Public Water System Name Number of Municipal
2015 Urban Water Management Plan
 Prepared for City of Stockton 2015 Urban Water Management Plan July 2016 11020 White Rock Road, Suite 200 Rancho Cordova, California 95670 Tel: 916-444-0123 Fax: 916-635-8805 www.brownandcaldwell.com
ENVIRONMENTAL IMPACT ANALYSIS WATER RESOURCES: WATER SUPPLY 1. ENVIRONMENTAL CONDITIONS. a. Physical Setting. (1) Water Supply
 Water Supply") IV. E.2. ENVIRONMENTAL IMPACT ANALYSIS WATER RESOURCES: WATER SUPPLY 1. ENVIRONMENTAL CONDITIONS a. Physical Setting (1) Water Supply The Los Angeles Department of Water and Power (LADWP) owns, operates,
IV. E.2. ENVIRONMENTAL IMPACT ANALYSIS WATER RESOURCES: WATER SUPPLY 1. ENVIRONMENTAL CONDITIONS a. Physical Setting (1) Water Supply The Los Angeles Department of Water and Power (LADWP) owns, operates,
Palmdale Water District. Strategic Water. Resources. Final Report March Water and Environment
 Palmdale Water District Strategic Water Resources Plan Final Report March 2010 Water and Environment Final Report Prepared by: Water andenvironment In Association with: A&N Technical Services Wildermuth
URBAN WATER MANAGEMENT PLAN
 CITY OF POMONA URBAN WATER MANAGEMENT PLAN 2010 Final City of Pomona 2010 Urban Water Management Plan Prepared by: July 2011 City of Pomona 2010 Urban Water Management Plan FINAL Table of Contents Section
2015 Urban Water Management Plan. for the City of Lompoc
 2015 Urban Water Management Plan for the City of Lompoc June 21, 2016 Final 2015 Urban Water Management Plan Final for the City of Lompoc Prepared Under the Responsible Charge of: Ron Munds Associate Planner,
UWMP Standardized Tables. Palos Verdes District Urban Water Management Plan Appendix H
 UWMP Standardized Tables Palos Verdes District 2015 Urban Water Management Plan Appendix H Table 2-1 Retail Only: Public Water Systems Public Water System Number Public Water System Name Number of Municipal
Basin Yield Update (2009)
") Basin Yield Update (2009) Analysis of Groundwater Supplies and Groundwater Basin Yield Upper Santa Clara River Groundwater Basin, East Subbasin prepared for Santa Clarita Valley Municipal Water Purveyors
Basin Yield Update (2009) Analysis of Groundwater Supplies and Groundwater Basin Yield Upper Santa Clara River Groundwater Basin, East Subbasin prepared for Santa Clarita Valley Municipal Water Purveyors
IV. Environmental Impact Analysis L.1 Utilities and Service Systems Water Supply and Infrastructure
 IV. Environmental Impact Analysis L.1 Utilities and Service Systems Water Supply and Infrastructure 1. Introduction This section of the Draft EIR provides an analysis of the Project s potential impacts
EVALUATION OF WATER SAVINGS FROM WEATHER BASED IRRIGATION CONTROLLERS IN SANTA CLARITA VALLEY
 EVALUATION OF WATER SAVINGS FROM WEATHER BASED IRRIGATION CONTROLLERS IN SANTA CLARITA VALLEY Submitted to: Stephanie Anagnoson Castaic Lake Water Agency 27234 Bouquet Canyon Road Santa Clarita, CA January
UWMP Standardized Tables. Livermore District Urban Water Management Plan Appendix H
 UWMP Standardized Tables Livermore District 2015 Urban Water Management Plan Appendix H Table 2-1 Retail Only: Public Water Systems Public Water System Number Public Water System Name Number of Municipal
2015 URBAN WATER MANAGEMENT PLAN FINAL
 2015 URBAN WATER MANAGEMENT PLAN FINAL B&V PROJECT NO. 188535 Black & Veatch Holding Company 2015. All rights reserved. PREPARED FOR JUNE 2016 CALLEGUAS MUNICIPAL WATER DISTRICT 2015 URBAN WATER MANAGEMENT
California Water Service Urban Water Management Plan. Antelope Valley District June Quality. Service. Value. Quality. Service. Value.
 2015 Urban Water Management Plan June 2016 Quality. Service. Value. Quality. Service. Value Table of Contents List of Tables... 5 List of Figures... 7 List of Acronyms... 8 Chapter 1 Introduction and
7.0 GROWTH-INDUCING IMPACTS
 7.0 GROWTH-INDUCING IMPACTS 1. PURPOSE The California Environmental Quality Act (CEQA) requires a discussion of the ways in which a project could foster economic or population growth, or the construction
Cost Sharing Agreement For The Los Vaqueros Reservoir Expansion Project Planning. ACWD Board Meeting December 8, 2016
 Cost Sharing Agreement For The Los Vaqueros Reservoir Expansion Project Planning ACWD Board Meeting December 8, 2016 Los Vaqueros Reservoir (LV) Owned and operated by CCWD Off-stream reservoir, adjacent
FREQUENTLY ASKED QUESTIONS
 State-Mandated Chloride (Salt) Requirements in Santa Clarita Valley About the Santa Clarita Valley Sanitation District 1. Who is the Santa Clarita Valley Sanitation District? The Santa Clarita Valley Sanitation
Mammoth Community Water District 2015 URBAN WATER MANAGEMENT PLAN
 Mammoth Community Water District 2015 URBAN WATER MANAGEMENT PLAN January 2017 (This page intentionally blank.) Table of Contents Executive Summary... 1 ES.1 Scope and Purpose of the 2015 Urban Water Management
California League of Cities Briefing on Water Supply Issues
 California League of Cities Briefing on Water Supply Issues Stephen N. Arakawa Manager, Bay-Delta Initiatives The Metropolitan Water District of Southern California May 5, 2016 California WaterFix: Securing
Section 3: Plan Objectives
 Section 3: Plan Objectives The purpose of this section is to identify objectives for the IRWMP, or broadly what the Stakeholders and the RWMG have determined they would like the IRWMP to accomplish when
FINAL - MAY 2016 CITY OF ROSEVILLE Urban Water Management Plan
 FINAL - MAY 2016 CITY OF ROSEVILLE 2015 Urban Water Management Plan (THIS PAGE LEFT BLANK INTENTIONALLY) Final 2015 Urban Water Management Plan Prepared for The City of Roseville May 2016 415-12-15-26
4.21 WASTEWATER DISPOSAL
 4.21 WASTEWATER DISPOSAL 1. SUMMARY The proposed project includes a wastewater reclamation plant (WRP), which would be owned and operated by the City of Santa Clarita and recycle up to 395,411 gallons
Section 1. Executive Summary
 EXECUTIVE SUMMARY 1.1 Introduction The purpose of this report is to address measures taken and planned to be taken by the Santa Clarita Valley Sanitation District (District) to quantify and control sources
UWMP Standardized Tables. King City District Urban Water Management Plan Appendix H
 UWMP Standardized Tables King City District 2015 Urban Water Management Plan Appendix H Table 2-1 Retail Only: Public Water Systems Public Water System Number Public Water System Name Number of Municipal
8-3. Water Planning and Stewardship. Board of Directors. 4/14/2015 Board Meeting. Subject. Executive Summary. Details
 Board of Directors Water Planning and Stewardship 4/14/2015 Board Meeting Subject Express support for Governor s Executive Order B-29-15; declare Water Supply Condition for 2015; approve implementation
Urban Water Management Plan
 DR af t 2015 Urban Water Management Plan June 8, 2016 2015 Urban Water Management Plan Santee, California June 8, 2016 Prepared by: 9665 Chesapeake Dr., Suite 201 San Diego, CA 92123 Project Participants
CHAPTER 3 Water Supply
 CHAPTER 3 3.1 WATER SUPPLY OVERVIEW This chapter describes the sources of water available to the City and MID. The chapter includes a description of each water source, including limitations, water quality
URBAN WATER MANAGEMENT PLAN UPDATE FOR 2010
 URBAN WATER MANAGEMENT PLAN UPDATE FOR 2010 City of Shafter Public Works Department 336 Pacific Avenue Shafter, CA 93263 Michael James, P.E. Public Works Director City of Shafter R.C.E. #60021 Exp. 6-30-12
UWMP Standardized Tables. Chico-Hamilton City District Urban Water Management Plan Appendix H
 UWMP Standardized Tables Chico-Hamilton City District 2015 Urban Water Management Plan Appendix H Table 2-1 Retail Only: Public Water Systems Public Water System Number Public Water System Name Number
UWMP Standardized Tables. Kern River Valley District Urban Water Management Plan Appendix H
 UWMP Standardized Tables Kern River Valley District 2015 Urban Water Management Plan Appendix H Table 2-1 Retail Only: Public Water Systems Public Water System Number Public Water System Name Number of
Executive Summary for the CII Task Force Water Use Best Management Practices
 0//0 Executive Summary for the CII Task Force Water Use Best Management Practices Formatted 0 0 0 Background and History California s water demands have begun to reach and, at some times in some places,
California Water Service Urban Water Management Plan. Bakersfield District June Quality. Service. Value
 2015 Urban Water Management Plan June 2016 Quality. Service. Value Table of Contents List of Tables... 7 List of Figures... 9 List of Acronyms... 10 Chapter 1 Introduction and Overview... 11 1.1 Background
URBAN WATER MANAGEMENT PLAN
 2015 URBAN WATER MANAGEMENT PLAN FINAL JUNE 2016 2015 URBAN WATER MANAGEMENT PLAN 2015 URBAN WATER MANAGEMENT PLAN City of Anaheim FINAL Prepared for: Thomas McCarthy Water Planning and Resources Manager
UWMP Standardized Tables. Salinas District Urban Water Management Plan Appendix H
 UWMP Standardized Tables Salinas District 2015 Urban Water Management Plan Appendix H Table 2-1 Retail Only: Public Water Systems Public Water System Number Public Water System Name Number of Municipal
This page is intentionally left blank.
 This page is intentionally left blank. STATE OF CALIFORNIA CALIFORNIA NATURAL RESOURCES AGENCY EDMUND G. BROWN JR., Governor DEPARTMENT OF WATER RESOURCES 1416 NINTH STREET, P.O. BOX 942836 SACRAMENTO,
California Water Service Urban Water Management Plan. East Los Angeles District June Quality. Service. Value
 2015 Urban Water Management Plan June 2016 Quality. Service. Value Table of Contents List of Tables... 5 List of Figures... 8 List of Acronyms... 9 Chapter 1 Introduction and Overview... 11 1.1 Background
Metropolitan Water District. July 25, 2013
 Metropolitan Water District July 25, 2013 The Mission of the Metropolitan Water District is to provide its service area with adequate and reliable supplies of high-quality water to meet present and future
Sustainable Water Future for the City of Los Angeles
 Sustainable Water Future for the City of Los Angeles National Research Council Pathways to Urban Sustainability: Challenges & Opportunities April 29, 2015 Nancy Sutley Chief Sustainability & Economic Development
CHAPTER 4 Water Demand
 CHAPTER 4 4.1 OVERVIEW OF WATER USE As described in Chapter 2, the City s water service area consists of one large contiguous service area and several outlying non-contiguous service areas. The City is
California Urban Water Agencies Water Supply Reliability Report
 Progress Update on Water Conservation, Supply Diversification and Resource Management California Urban Water Agencies Water Supply Reliability Report August 2012 San Francisco Public Utilities Commission;
2O15 Urban Water Management Plan
 2O15 Urban Water Management Plan CITY OF SANTA ROSA 2015 URBAN WATER MANAGEMENT PLAN PREPARED BY: In conjunction with: West Yost Associates & Maddaus Water Management JUNE 2016 This page intentionally
Water for Southern California: How Bay-Delta is Key to All of the Above Strategy
 Water for Southern California: How Bay-Delta is Key to All of the Above Strategy Stephen N. Arakawa Manager, Bay-Delta Initiatives The Metropolitan Water District of Southern California October 15, 2016
City of Arcata Urban Water Management Plan 2015
 City of Arcata Urban Water Management Plan 2015 Completed: May 2016 UPDATED FEBRUARY 2018 Table of Contents Chapter 1 Introduction and Overview... 6 Chapter 2 Plan Preparation... 7 2.1 Basis for Preparing
California Water Service Urban Water Management Plan. Dominguez District June Quality. Service. Value. Quality. Service. Value.
 2015 Urban Water Management Plan June 2016 Quality. Service. Value. Quality. Service. Value Table of Contents List of Tables... 5 List of Figures... 8 List of Acronyms... 9 Chapter 1 Introduction and
URBAN WATER MANAGEMENT PLAN
 2015 URBAN WATER MANAGEMENT PLAN FINAL DRAFT JULY 2016 2015 URBAN WATER MANAGEMENT PLAN City of San Juan Capistrano DRAFT [Signature 1 Name] [Title] Prepared for: Eric Bauman Utilities Department City
2015 URBAN WATER MANAGEMENT PLAN Final Report
 PREPARED FOR Coachella Valley Water District 2015 URBAN WATER MANAGEMENT PLAN Final Report July 1, 2016 This page left intentionally blank TABLE OF CONTENTS Section 1 Introduction and Overview... 1-1 1.1
California Water Service Urban Water Management Plan. Visalia District June Quality. Service. Value
 2015 Urban Water Management Plan June 2016 Quality. Service. Value Table of Contents List of Tables... 5 List of Figures... 7 List of Acronyms... 8 Chapter 1 Introduction and Overview... 9 1.1 Background
California Drought Update. The 2016 CALAFCO Annual Conference Program. Water Status Update: Where Are We? Where Are We Going?
 California Drought Update The 2016 CALAFCO Annual Conference Program Water Status Update: Where Are We? Where Are We Going? October 26, 2016 David Inouye Water Management Branch Chief Department of Water
City of Escondido 2010 Urban Water Management Plan. July 2011
 City of Escondido 2010 Urban Water Management Plan July 2011 City of Escondido 2010 Urban Water Management Plan July 2011 Project No. 139583 9665 Chesapeake Drive, Suite 201 San Diego, California 92123
Overview of Conjunctive Management in California Let s Have a Frank Discussion
 Overview of Conjunctive Management in California Let s Have a Frank Discussion Mark S. Nordberg, P.G. Division of Integrated Regional Water Management North Central Region Office Geology and Groundwater
CITY OF VACAVILLE URBAN WATER SHORTAGE CONTINGENCY PLAN FINAL
 CITY OF VACAVILLE URBAN WATER SHORTAGE CONTINGENCY PLAN FINAL AN AMENDMENT TO THE URBAN WATER MANAGEMENT PLAN ADOPTED JANUARY 1991 REVISED AUGUST 214 Prepared by: City of Vacaville Utilities Department
SECTION 5.15 Wastewater
 SECTION 5.15 Wastewater 5.15 WASTEWATER This section addresses the impacts of the proposed project on wastewater conveyance and treatment facilities. The analysis identifies the service area the project
2009 Comprehensive Water Package
 DWR, 2009 Comprehensive Water Package, Special Session Policy Bills and Bond Summary, Special Session Policy Bills and Bond Summary The California Depa r t men t of W ater R eso u rce s Bill Summary SB
Indirect Potable Reuse for Groundwater Recharge Succession Strategy for Recycled Water
 EASTERN MUNICIPAL WATER DISTRICT Indirect Potable Reuse for Groundwater Recharge Succession Strategy for Recycled Water Paul D. Jones II, P.E. General Manager, Eastern Municipal Water District March 11,
4.16 Utilities and Service Systems
 4.16 Utilities and Service Systems This section describes utilities and services in the area of the Proposed Project and assesses the potential environmental impacts. The Proposed Project would not result
Urban Water MANAGEMENT PLAN UPDATE. Prepared by:
 2015 Urban Water MANAGEMENT PLAN UPDATE Draft Report May 2016 Prepared by: Table of Contents 1 Introduction and Executive Summary... 1-1 1.1 Plan Preparation... 1-1 1.2 District Overview... 1-1 1.3 District
our LOCAL SEWAGE SYSTEM
 our LOCAL SEWAGE SYSTEM santa clarita valley sanitation district HOW OUR SEWAGE SYSTEM WORKS FOLLOW THE FLOW 3 * * State Permit with Strict Standards Required for Discharge to the River* 2 Who operates
6.7 Desalinated Water Opportunities Exchanges or Transfers Future Water Projects Summary of Existing and Planned
 TABLE OF CONTENTS LIST OF FIGURES... 4 LIST OF TABLES... 4 LIST OF ACRONYMS... 5 1. INTRODUCTION AND OVERVIEW... 6 1.1 Background and Purpose... 6 1.2 Urban Water Management Planning and the California