Annual Review November Submitted to Government on 24 November Climate Change Advisory Council
|
|
|
- Shona Porter
- 6 years ago
- Views:
Transcription


1 Annual Review 2017
2
3 Annual Review 2017 November 2017 Submitted to Government on 24 November 2017 Climate Change Advisory Council McCumiskey House Richview, Clonskeagh Road, Dublin 14, D14 YR62 Phone: ISBN: Climate Change Advisory Council 2017
4 CLIMATE CHANGE ADVISORY COUNCIL ANNUAL REVIEW 2017 Acknowledgements The Climate Change Advisory Council would like to acknowledge the contributions of the Secretariat of the Climate Change Advisory Council, Rory Kelleher, Dr. Frank McGovern of the Environmental Protection Agency (EPA), Maria Galavan, the Central Statistics Office (CSO), the EPA, the Sustainable Energy Authority of Ireland (SEAI) and Teagasc in the preparation of the Annual Review Climate Change Advisory Council The Climate Change Advisory Council is an independent advisory body tasked with assessing and advising on how Ireland can achieve the transition to a low-carbon, climate-resilient and environmentally sustainable economy. The Climate Change Advisory Council was established on 18 January 2016 under the Climate Action and Low Carbon Development Act Climate Change Advisory Council Members: Prof. John Fitzgerald (Chair) Prof. Alan Barrett (ESRI) Prof. Gerry Boyle (Teagasc) Laura Burke (EPA) Prof. Peter Clinch Prof. Frank Convery Joseph Curtin Prof. Anna Davies Prof. Ottmar Edenhofer Jim Gannon (SEAI) Prof. Alan Matthews Climate Change Advisory Council Adaptation Committee At its meeting on 6 April 2016, the Climate Change Advisory Council established an Adaptation Committee to consider matters relating to climate change adaptation. Adaptation Committee Members: Prof. John Fitzgerald (Chair) Mark Adamson Prof. Gerry Boyle (Teagasc) Laura Burke (EPA) Prof. Robert Devoy Jim Gannon (SEAI) Ciarán Hayes Dr. Ina Kelly Eoin Moran Dr. Conor Murphy Roger Street Cover Photo: Tina Claffey iv ii
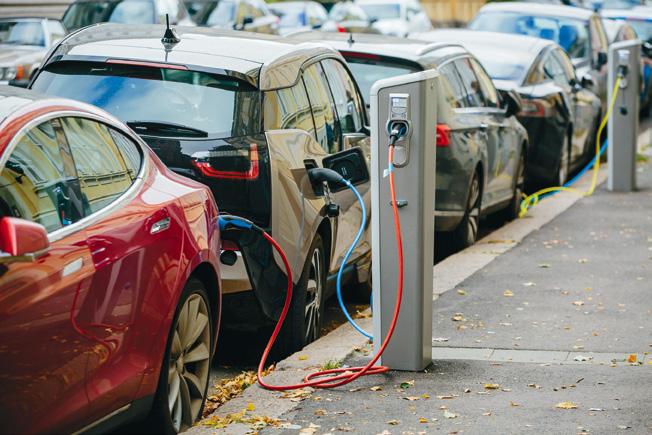
5 EXECUTIVE SUMMARY Executive Summary The Climate Change Advisory Council is an independent advisory body tasked with reviewing national climate policy, progress on the achievement of the national transition objective and progress towards compliance with existing EU and international obligations of the State. As set out in the legislation, a key task of the Council is to conduct an Annual Review of progress made over the previous year in reducing greenhouse gas emissions and furthering transition to a lowcarbon, climate-resilient and environmentally sustainable economy by Key Messages The Council s assessment of progress to date on meeting our climate change commitments clearly shows that Ireland will miss its agreed emissions reduction target for 2020 by a substantial margin. Without major new policies and measures, Ireland will also miss both its proposed 2030 EU target and its objective of reducing emissions of carbon dioxide by at least 80% (relative to 1990 levels) by 2050 by a very large margin. Both the pace and scale of emissions reduction need to be accelerated across all sectors. In its First Report and Periodic Review Report, the Council pointed to the urgent requirement for new policies and measures, beyond what is committed to in the National Mitigation Plan, if Ireland is to move onto a sustainable path to meet its 2030 and 2050 targets for tackling climate change. These new measures should include a planned and substantial increase in the carbon tax in the coming years, a phasing out of coal and peat for both residential heating and power generation and, in particular, ending the subsidy for peat-fired electricity generation. Future investments in the public transport fleet should avoid fossil fuel lock-in. Rebalancing spending away from roads and towards public transport would make a significant contribution to minimising future emissions. Planning and incentivising the take-up of electric vehicles over the coming decade will be vital in moving Ireland to a sustainable growth path. The implementation of a system of planning that will minimise commuting in the future is also important. All cost-effective measures to reduce emissions in the agriculture and land sector should be adopted, and there remains a pressing need to define what is meant by carbon neutrality. It is important that this low-carbon transition be carried out in a cost-effective manner. The Council will monitor the cost-effectiveness of policies to reduce emissions each year. It also recommends that the government report annually on the costs and impacts of planned and implemented measures in the National Mitigation Plan. Greenhouse Gas Emissions Ireland s greenhouse gas emissions increased by 3.7%, or 2.1 million tonnes of carbon dioxide equivalent, in 2015, according to greenhouse gas data published by the Environmental Protection Agency (EPA). While Ireland s emissions in the years 2013, 2014 and 2015 were below the annual targets agreed with the European Union (EU), projections indicate that emissions will exceed annual limits in 2016 and in each year up to and including Economic growth has been the main driver of the growth in emissions in recent years, demonstrating that Ireland s economy and emissions are still coupled. There were increases in emissions across all the main sectors in 2015, with the largest increases coming from energy industries and transport. Emissions from both the agriculture and residential sectors also increased. iii
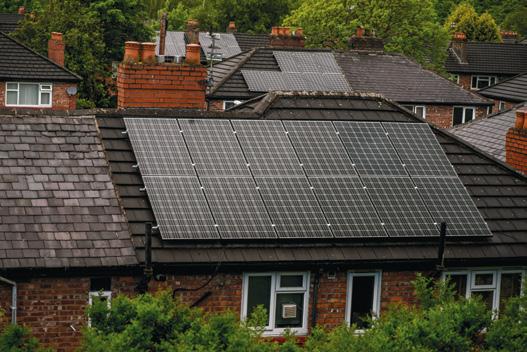
6 CLIMATE CHANGE ADVISORY COUNCIL ANNUAL REVIEW 2017 Projections In the absence of significant additional measures to reduce emissions, the EPA s projections indicate that there will be strong growth in emissions nationally and across key sectors to Emissions from transport are projected to increase by between 10% and 12% by 2020, relative to 2015 levels, reflecting strong economic growth. In agriculture, emissions are expected to rise by between 4% and 5% by 2020, reflecting expansion in this sector. By 2020, transport and agriculture are projected to account for 74% of emissions outside of electricity generation and heavy industry. Simply put, Ireland will miss its target of reducing emissions by 20% by 2020 by a large margin. Compliance with Existing Obligations New policies and measures that break the link between greenhouse gas emissions and economic growth are essential if targets for reducing emissions are to be achieved. Ireland s emissions of carbon dioxide need to be reduced each year by approximately 2.4%, or 0.9 million tonnes of carbon dioxide equivalent, to achieve the national objective of at least an 80% reduction by 2050, relative to 1990 levels. While Ireland can comply with its EU Effort Sharing Decision targets for 2020 by purchasing emissions units, this use of public funds will leave Ireland with a bigger and more expensive task to meet its future targets to 2030 and beyond. Current Trends While some progress has been made in the built environment and the energy sectors, Ireland has the third highest emissions per capita for residential energy use in the EU, reflecting a high dependency on fossil fuels, such as coal and peat, and minimal deployment of renewable and district heating. Transport emissions have been increasing with a return to economic growth, driven by a rise in private vehicle and freight traffic. Addressing emissions from transport can bring additional benefits for air quality and human health as well as reducing congestion. Future investments, including in public transport fleets, need to avoid fossil fuel lock-in. A more ambitious approach, capitalising on recent technology and market developments, should be taken in transport to move Ireland to a sustainable path to decarbonisation by While some progress has been made in improving the greenhouse gas efficiency of food production, it has not resulted in a reduction in absolute emissions. The agriculture and land sector must first adopt all available cost-effective measures to reduce emissions and enhance removals within the sector. This should involve more efficient use of inputs and changes in land use. There remains a pressing need to define what is meant by carbon neutrality with respect to agriculture and land use, and to implement policies to ensure delivery on this objective. Decarbonisation of electricity generation will require the phasing out of coal and peat burning for power generation. To this end, the subsidy for peat-fired electricity generation should be ended as soon as the current Public Service Obligation expires in Ireland is still over-reliant on solid fossil fuels, which have significant implications for both greenhouse gas emissions and air quality, with associated impacts on health. A clear medium-term strategy to phase out fossil fuels in the electricity, transport and residential sectors is required. iv
7 EXECUTIVE SUMMARY Cost-effectiveness As part of the Annual Review 2017, the Council has laid out a number of principles it will employ to review cost-effectiveness in future Annual Reviews. These principles include assessing the impact and effectiveness of existing measures, employing updated marginal abatement cost curves, pursuing co-benefits (such as improvements to health) to increase the effectiveness of policies, integrating behavioural responses in the design of policies, and enabling and encouraging innovative responses. The Council recommends that the government monitor and report annually on the costs and impacts of planned and implemented policies, measures and actions included in the National Mitigation Plan. The Council also stresses the importance of integrating measures introduced in the annual budget into a strategy for reducing Ireland s greenhouse gas emissions. European Policy Ireland s involvement in the development at EU level of proposals on the governance of the Energy Union, on the Emissions Trading Scheme, on the Effort Sharing Regulation, and on flexibilities in land use and land-use change and associated accounting rules is important to ensure consistency with the National Policy Position. Conclusion Ireland is not on a pathway to economy-wide decarbonisation by Proposed actions under the National Mitigation Plan need to be prioritised to allow urgent implementation of the most significant actions. However, to achieve Ireland s objective of decarbonisation, major new policies and measures, along with changes in current practices are required. v
8 CLIMATE CHANGE ADVISORY COUNCIL ANNUAL REVIEW 2017 Contents Executive Summary iii 1. Introduction 1 2. A Summary of the National Greenhouse Gas Emissions Inventory Ireland s Greenhouse Gas Emissions Inventory Sectoral Greenhouse Gas Emissions 3 3. A Summary of Future Greenhouse Gas Emissions Ireland s Greenhouse Gas Emissions Projections Future Sectoral Greenhouse Gas Emissions 7 4. Compliance with Existing Obligations of the State Climate and Energy Package Emissions Trading Scheme and Effort Sharing Decision Effort Sharing Decision: Targets to Proposed EU Effort Sharing Regulation International Agreements National Policy Position Emissions of Carbon Dioxide Advice and Recommendations Progress Made in Furthering Transition Progress Across the Sectors Electricity Generation Built Environment Transport Agriculture and Land Use Public Participation Institutions and Governance Climate Justice Indicators of Transition Advice and Recommendations 27 vi
9 6. Achieving the National Transition Objective in a Cost-effective Manner Assessing a Cost-effective Approach Monitor Impact and Effectiveness of Measures Marginal Abatement Cost Curve Pursue Co-benefits to Increase Effectiveness Integrate Behavioural and Societal Responses in Design of Policies and Measures Avoid Contradictory or Conflicting Policy Enable and Encourage Innovative Responses Make Best Use of Available Resources Advice and Recommendations Special Focus: European Union Climate Policy Greenhouse Gas Monitoring and Reporting Governance of the Energy Union Integrated National Energy and Climate Plans European Union Climate and Energy Package and Framework Emissions Trading System (Scheme) Effort Sharing Decision/Regulation and National Emissions Land Use, Land Use-Change and Forestry and Agriculture Adaptation EU Multi-annual Financial Framework: the EU Budget The EU and International Climate Policy Advice and Recommendations Activities of the Council 38 References 42 Appendix 1 Legislation on Annual Review Report 47 Appendix 2 Data Sources for Transition Indicators 48 vii
10
11 EXECUTIVE INTRODUCTION SUMMARY 1. Introduction The Climate Change Advisory Council is an independent advisory body tasked with reviewing national climate policy, progress on the achievement of the national transition objective and progress towards compliance with existing EU and international obligations of the State. A key task of the Council, mandated under the Climate Action and Low Carbon Development Act 2015, 1 is to conduct an Annual Review of the progress made during the previous year in achieving greenhouse gas emissions reductions and in furthering the transition to a low-carbon, climateresilient and environmentally sustainable economy. This report describes the results of the Annual Review The structure of this report reflects the requirements set out in legislation. Chapter 2 presents an overview of the greenhouse gas emissions inventory data provided by the Environmental Protection Agency (EPA), submitted to the European Union (EU) and United Nations Framework Convention on Climate Change (UNFCCC), and focuses on the changes that occurred in Chapter 3 presents an overview of the most recent greenhouse gas emissions projections for the period 2016 to 2035; developments in the main sectors responsible for these emissions are outlined. Chapter 4 describes progress in meeting the EU 2020 emissions reduction target in 2015 and the cumulative emissions target for the period 2013 to 2020, and provides an assessment of progress towards the 2050 national transition objective. Chapter 5 explores progress in transition across the sectors and presents some potential indicators for transition. Advice and recommendations are provided on the achievement of the national transition objective. Chapter 6 presents principles and approaches that the Council will employ in future Annual Reviews to assess and provide advice on the cost-effectiveness of climate action. Some recommendations are provided on actions that can be taken in the short term to enhance cost-effectiveness. Chapter 7 has a special focus on the EU and describes the most recent climate change policy developments. Chapter 8 documents the activities of the Council in As the National Adaptation Framework is not expected to be finalised until late 2017, issues related to climate resilience are not considered here. 1
12 CLIMATE CHANGE ADVISORY COUNCIL ANNUAL REVIEW A Summary of the National Greenhouse Gas Emissions Inventory Key Messages Emissions of greenhouse gases increased by 3.7%, or 2.1 million tonnes of carbon dioxide equivalent, in Economic growth has been the main driver of the growth in emissions in recent years, demonstrating that Ireland s economy and emissions have not undergone the level of decoupling required to put us on a pathway to a low-carbon transition. Increases in greenhouse gas emissions were recorded in all the main sectors. The Climate Action and Low Carbon Development Act 2015 tasked the Council, as part of its Annual Review, to provide a summary of the findings as set out in the national greenhouse gas emissions inventory prepared by the EPA. Ireland s greenhouse gas emissions inventory in 2015 is provided below. The inventory is the quantitative basis for the Council s review of progress made in achieving greenhouse gas emissions reductions to enable the achievement of the national transition objective. 2.1 Ireland s Greenhouse Gas Emissions Inventory The annual greenhouse gas emissions inventory is central to the development of national climate change mitigation policy. It reflects the effectiveness of measures taken to achieve policy goals. Each year the EPA prepares and publishes Ireland s official greenhouse gas emissions inventory. The inventory is reported to the EU and the UNFCCC and is subject to in-depth international review. The current inventory, which provides data from 1990 to 2015, was submitted to the EU on 15 March 2017 and to the UNFCCC on 12 April According to the inventory data, Ireland s greenhouse gas emissions increased by 3.7%, or 2.1 million tonnes of carbon dioxide equivalent, from 57.8 million tonnes of carbon dioxide equivalent in 2014 to 59.9 million tonnes of carbon dioxide equivalent in In the period 2006 to 2015 some of the most significant emissions reductions were recorded in three years during the financial recession. These reductions were largely the result of the downturn in Ireland s economy over the period 2009 to Data for 2015, showing an increase in emissions, demonstrate that the growth of Ireland s economy and emissions of greenhouse gases remain coupled. 2 Carbon dioxide equivalent is a measure used to compare the emissions from various greenhouse gases based on their global warming potential. 2
13 A Summary of the National Greenhouse Gas Emissions Inventory Greenhouse gas emissions Million tonnes of CO 2 equivalent Gross National Income at constant prices Billion Euro Carbon Dioxide Other Greenhouse Gases Gross National Income 0 Figure 2.1: Greenhouse gas emissions for base years 1990 (National Policy Position) and 2005 (EU 2020 targets) and the decade 2006 to 2015 showing carbon dioxide (in blue) and other greenhouse gases (in orange) in units of million tonnes of carbon dioxide equivalent (Mt CO 2 e). Gross National Income at constant prices (grey line) in billions of euros is also shown (right-hand scale). Data source: EPA National Emissions Inventory and Central Statistics Office, National Accounts Sectoral Greenhouse Gas Emissions The EPA provides inventory data broken down into 10 sectors. A summary of data for greenhouse gas emissions from these sectors in 2015 is listed in Table 2.1. Changes in sectoral greenhouse gas emissions and how each of those sectors contributed to the overall increase in 2015 is shown in Figure 2.2. Increases are evident across all the main sectors, with the largest increase shown in energy industries at 0.6 million tonnes of carbon dioxide equivalent, followed by transport at 0.5 million tonnes of carbon dioxide equivalent. Agriculture and residential sectors are next at 0.3 million tonnes of carbon dioxide equivalent each. Increases in carbon dioxide emissions were recorded in all the main sectors. 3
14 CLIMATE CHANGE ADVISORY COUNCIL ANNUAL REVIEW 2017 Table 2.1: Greenhouse gas emissions for base years 1990 (National Policy Position) and 2005 (EU 2020 targets), and for 2013, 2014 and 2015, broken down by sector and detailing the change in emissions in 2015, relative to 1990, 2005 and Data source: EPA National Emissions Inventory Sector (% of total greenhouse gas emissions in 2015) Agriculture (33.1%) Transport (19.8%) Greenhouse gas emission inventory Change in 2015 relative to Mt CO2 e Absolute Mt CO2 e Change in 2015 relative to 2005 % Absolute Mt CO2 e Change in 2015 relative to 2014 % Absolute Mt CO2 e % Key drivers relative to 2014 as identified in the EPA National Emissions Inventory 2017 Increased dairy cow numbers Increased passenger diesel cars Energy industries (19.7%) Increased coal use for electricity generation and decreased gas use Residential (10.1%) Increased oil, gas and kerosene consumption Manufacturing combustion (7.6%) Industrial processes (3.3%) F-gases (1.9%) Waste (1.6%) Commercial services (1.6%) Public services (1.3%) , Increased use of natural gas and petroleum coke Increased cement production Impact of Directive 2006/40/EC Decreased methane recovery Reduction of gasoil use Reduction of gasoil use Total Directive 2006/40/EC relating to emissions from air-conditioning systems in motor vehicles and amending Council Directive 70/15/EEC. F-gases, fluorinated gases; Mt CO 2 e, million tonnes of carbon dioxide equivalent. 4
15 A Summary of the National Greenhouse Gas Emissions Inventory Greenhouse gas emissions Million tonnes of CO 2 equivalent Agriculture Transport Energy Industries Residential Manufacturing Combustion Industrial Processes F- Gases Waste Commercial Services Public Services Figure 2.2: Greenhouse gas emissions for base years 1990 (National Policy Position) and 2005 (EU 2020 targets) and the last decade, 2006 to 2015, presented by sector in units of million tonnes of carbon dioxide equivalent. Data source: EPA, National Emissions Inventory
16 CLIMATE CHANGE ADVISORY COUNCIL ANNUAL REVIEW A Summary of Future Greenhouse Gas Emissions Key Messages Projections indicate strong growth in emissions nationally and across key sectors in the coming decades in the absence of significant additional measures. The most significant increases in emissions are projected to come in the transport and agriculture sectors. The Climate Action and Low Carbon Development Act 2015 tasked the Council, as part of its Annual Review, to provide a summary of the most recent projections of greenhouse gas emissions prepared by the EPA. In this chapter, Ireland s future greenhouse gas emissions are provided below. They are considered in the light of the EU Effort Sharing Decision emission reduction targets to Official projections of greenhouse gas emissions based on policies and measures applied to these sectors are provided for the period 2016 to Ireland s Greenhouse Gas Emissions Projections Every year, the EPA releases greenhouse gas projections for Ireland. Every second year, these projections are submitted to the EU in accordance with reporting requirements. These biennial projections are reported to the EU, as part of the Monitoring Mechanism Regulation, and to the UNFCCC every four years. As with the greenhouse gas inventory, the projections are subject to in-depth international review. The current set of projections, which provide two scenarios with existing measures and with additional measures from 2015 to 2035, were submitted to the EU on 25 April The with existing measures scenario assumes that no additional policies and measures, beyond those already in place by the end of 2015, are implemented. The with additional measures scenario assumes that the policies and measures in the with existing measures scenario have been implemented and includes further implementation of the renewable and energy efficiency targets for 2020 as described in the National Energy Efficiency Action Plan and the National Renewable Energy Action Plan. It accounts for the shortfall expected in achieving Ireland s energy efficiency targets and renewable energy targets for electricity, transport and heat to Greenhouse gas emissions projections are prepared using data from several key sources. The energy forecast is provided by the Sustainable Energy Authority of Ireland (SEAI). This information was prepared with the Economic and Social Research Institute (ESRI) and University College Cork (UCC). The ESRI uses macro-economic projections produced by the Core Structural Model of the Irish Economy (COSMO) model. 7 Projections of global economic activity are based on the National Institute s Global Econometric Model (NiGEM) from the National Institute of Economic and Social Research in the UK. 8 Agricultural forecasts are provided by Teagasc. These include data on animal numbers, crop areas and fertiliser use. It should be noted that in some sectors projections under with existing measures and with additional measures use identical policies and that measures are implemented to the same degree in both. In these sectors, there is no difference between the scenarios. The sectors in which identical policies and measures are implemented to the same degree are F-gases and waste. The industrial processes sector has similar numbers for both scenarios but not identical levels of implementation. 6
17 A Summary of Future Greenhouse Gas Emissions Ireland s target under the Effort Sharing Decision is a 20% reduction in greenhouse gas emissions by 2020, relative to 2005 levels. The EPA s emissions projections indicate that between 2013 and 2020, the period that the Effort Sharing Decision covers, a reduction of between 4% and 6% will be achieved. Simply put, Ireland will achieve, at most, one-third of its Effort Sharing Decision 2020 target. Projections indicate strong growth in emissions nationally and across key sectors in the coming decade, in the absence of significant additional measures. 3.2 Future Sectoral Greenhouse Gas Emissions The EPA provides projections broken down into sectors like those in the inventories. A summary of the projected emissions of greenhouse gases from these sectors for 2020 and 2030 is shown in Table 3.1. In 2020, the transport and agriculture sectors account for 57%, or 33.7 million tonnes of carbon dioxide equivalent, of total emissions and dominate emissions in the Effort Sharing Decision sector under the with additional measures scenario. Emissions from transport are projected to increase between 10% and 12%, or 1.2 to 1.5 million tonnes of carbon dioxide equivalent, by 2020, relative to 2015 levels. This increase reflects the strong economic growth predicted out to Agricultural emissions are projected to increase by between 4% and 5%, or between 0.8 and 1 million tonnes of carbon dioxide equivalent, by 2020, relative to 2015, as a result of increased production. Emissions projections from this sector already reflect efficiency gains associated with fertiliser use under the with additional measures scenario. Other sectors that predict emissions increases include residential, manufacturing combustion and industrial processes. Emissions reductions of 26%, or 3.1 million tonnes of carbon dioxide equivalent, relative to 2015, are projected in the energy industries sector by 2020 under the with additional measures scenario. Emissions decreases are also predicted for f-gases, for waste and in the commercial and public service sectors. Projections for both with existing measures and with additional measures, broken down by sector, are shown in Table 3.1 and Figure
18 CLIMATE CHANGE ADVISORY COUNCIL ANNUAL REVIEW 2017 Table 3.1: Projections of total greenhouse gas by sector from 2015 to 2020 and 2030 under the with additional measures scenario. Data source: EPA National Emissions Inventory and Ireland s Greenhouse Gas Emissions Projections Sector (% of total greenhouse gas emissions in 2015) Greenhouse gas emission inventory Greenhouse gas emission projections for with additional measures Change in 2020 relative to 2015 Change in 2030 relative to 2015 Key assumptions as identified in Ireland s Greenhouse Gas Emissions Projections Mt CO 2 e Mt CO 2 e Absolute Mt CO 2 e % Absolute Mt CO2 e % Agriculture (33.1%) Transport (19.8%) Energy industries (19.7%) Residential (10.1%) Manufacturing combustion (7.6%) Industrial processes (3.3%) F-gases (1.9%) Waste (1.6%) Commercial and public (2.9%) Increased dairy cow and nitrogen use VAT, taxes (motor and carbon), efficiencies in public transport, improved fuel economy, reach 5.5% of Renewable Energy Sources for transport by Impact of increased renewables Increased renewables in heating, increased energy efficiency Increased renewables in heating, increased energy efficiency Based on gross domestic product increase (identical scenarios) Impact of Directive 2006/40/EC (identical scenarios) Decrease in methane recovery (identical scenarios) Impact of energy efficiency measures Total Directive 2006/40/EC relating to emissions from air-conditioning systems in motor vehicles and amending Council Directive 70/15/EEC. Mt CO 2 e, million tonnes of carbon dioxide equivalent. 8
19 A Summary of Future Greenhouse Gas Emissions 70 (a) with existing measures scenario 60 Greenhouse gas emissions Million tonnes of CO 2 equivalent (b) with additional measures scenario Greenhouse gas emissions Million tonnes of CO 2 equivalent Agriculture Transport Energy Industries Residential Manufacturing Combustion F-Gases Waste Industrial Processes Commercial & Public Services Figure 3.1: Greenhouse gas emissions for (a) with existing measures and (b) with additional measures scenarios, base years 1990 (National Policy Position) and 2005 (EU 2020 targets), 2015 data and projections to 2020 and 2030, broken down by sector in units of million tonnes of carbon dioxide equivalent. Data source: EPA National Emissions Inventory and Ireland s Greenhouse Gas Emissions Projections
20 CLIMATE CHANGE ADVISORY COUNCIL ANNUAL REVIEW Compliance with Existing Obligations of the State Key Messages Emissions in the years 2013, 2014 and 2015 were below the annual limits under the EU Effort Sharing Decision. Projections indicate that emissions will exceed annual limits in 2016 and in each following year up to and including Projections indicate that, despite existing and planned policies and measures, emissions will continue to increase and targets may be missed by a substantial margin. Carbon dioxide emissions need to be reduced each year by approximately 2.4%, or 0.9 million tonnes of carbon dioxide equivalent, to achieve at least an 80% reduction by 2050, relative to Implementing measures that break the link between emissions and economic growth is essential if current and future targets are to be met. Without urgent action, Ireland will breach its 2020 targets and face an increasingly difficult and expensive task of decarbonisation in the medium and long terms. The Climate Action and Low Carbon Development Act 2015 tasked the Council, as part of its Annual Review, to provide advice and recommendations in relation to compliance with existing obligations of the State under the law of the EU or international agreements. Ireland s performance in relation to reducing greenhouse gas emissions in accordance with national, EU and international targets is considered below. 4.1 Climate and Energy Package 2020 The Climate and Energy Package 2020 is a collection of directives and decisions to ensure that the EU meets its climate and energy targets for the year The package has three key objectives: (1) to cut greenhouse gas emissions by 20%, relative to 1990, (2) to produce 20% of EU energy from renewables and (3) to improve energy efficiency by 20% by There are two areas that relate directly to the objective to reduce emissions of greenhouse gases, namely the Emissions Trading Scheme and the Effort Sharing Decision. Under the Emissions Trading Scheme, the EU aims to reduce emissions from large industrial and institutional facilities, especially electricity generation. The Emissions Trading Scheme covers 45% of the EU s greenhouse gas emissions and aims to reduce these emissions to 20% below 2005 levels by The Effort Sharing Decision covers emissions that are not covered in the Emissions Trading Scheme. Each Member State has binding targets for reducing emissions in the non-emissions Trading Scheme sector between 2013 and Emissions Trading Scheme and Effort Sharing Decision The increase in Ireland s greenhouse gas emissions from 2014 to 2015 is observed in both the Emissions Trading Scheme and Effort Sharing Decision sectors (see Figure 4.1). Emissions of greenhouse gases under the Emissions Trading Scheme increased by 5.4%, or 0.9 million tonnes 10
21 Compliance with Existing Obligations of the State of carbon dioxide equivalent from 2014 to Emissions from sectors covered by the Effort Sharing Decision increased in total by 3%, or 1.3 million tonnes of carbon dioxide equivalent. In Ireland, the Emissions Trading Scheme covers 28%, or 16.8 million tonnes of carbon dioxide equivalent, of Ireland s total greenhouse gas emissions, while the majority, 72%, or 43.1 million tonnes of carbon dioxide equivalent, is covered by the Effort Sharing Decision. The EU Commission, which manages the Emissions Trading Scheme, has key responsibility for ensuring a reduction in emissions through the Emissions Trading Scheme sector. The Irish Government has primary responsibility for achieving the targets in the non-emissions Trading Scheme sector Greenhouse gas emissions Milliion tonnes of CO2 equivalent Emissions Trading Scheme Effort Sharing Decision Figure 4.1: Greenhouse gas emissions for the Emissions Trading Scheme (in dark green) and the Effort Sharing Decision (in yellow) over the period 2006 to 2015 and the base year 2005 of EU Climate and Energy 2020 targets in units of million tonnes of carbon dioxide equivalent. Data source: EPA National Emissions Inventory Effort Sharing Decision: Targets to 2020 Under the EU Effort Sharing Decision, Ireland has both annual targets and a cumulative target for greenhouse gas emission reduction from 2013 to Emissions in the years 2013, 2014 and 2015, were below the annual targets (see Figure 4.2). Emission savings accrued in these years may contribute to meeting future annual targets to 2020 and the cumulative target from 2013 to Projections for both with existing measures and with additional measures scenarios indicate that emissions will exceed the annual targets from 2016 onwards (see Figure 4.2 and Table 4.1). Over the period 2013 to 2020, greenhouse gas emissions are projected to exceed annual limits by a cumulative total of between 11.6 million tonnes of carbon dioxide equivalent and 13.8 million tonnes of carbon dioxide equivalent. This takes into consideration emissions savings accrued from 2013 to These projections indicate that, despite existing and planned additional policies and measures, greenhouse gas emissions continue to increase, suggesting that our targets may be missed by a substantial margin. 11
22 CLIMATE CHANGE ADVISORY COUNCIL ANNUAL REVIEW Projections Greenhouse gas emissions Million tonnes of CO 2 equivalent Historical Emissions Annual Limits EU Effort Sharing Decision Figure 4.2: Ireland s greenhouse gas emissions (black line) from 2005 to Annual targets (yellow line) as included under the Effort Sharing Decision for the period 2013 to 2020, without use of flexibilities, and emissions projections for with existing measures (dashed blue line) and with additional measures (dashed grey line) are presented here in units of million tonnes of carbon dioxide equivalent. Data source: EPA National Emissions Inventory 2017, 14 Ireland s Greenhouse Gas Emissions Projections and European Commission Decision (EU) 2017/ Table 4.1: Actual (black italics) and projected (blue and grey text) greenhouse gas emissions, covered under the EU Effort Sharing Decision targets, relative to annual totals and total cumulative emissions targets. Data source: EPA National Emissions Inventory 2017, 17 Ireland s Greenhouse Gas Emissions Projections and European Commission Decision (EU) 2017/ Year Limits Mt CO 2 e Emissions Mt CO 2 e Distance to target Mt CO 2 e With existing measures Actual With additional measures With existing measures Actual With additional measures Cumulative ( ) Remaining ( ) Total Mt CO 2 e, million tonnes of carbon dioxide equivalent. 12
23 Compliance with Existing Obligations of the State Proposed EU Effort Sharing Regulation 2030 The proposed Effort Sharing Regulation, the successor to the Effort Sharing Decision, is part of EU climate policies and the EU Energy Union strategy. The objective of the Effort Sharing Regulation is to reduce EU-wide emissions in the non-emissions Trading Scheme sector by 30% by 2030, relative to 2005 levels. It will set annual national limits on Member States emissions of greenhouse gases in the non-emissions Trading Scheme sector for the period 2021 to The proposed national target for Ireland is 30% by 2030, relative to 2005 levels. As with the Effort Sharing Decision, emissions savings accrued in one year can be carried over to meet annual limits in subsequent years. Member States can transfer or buy annual emission allocations (AEAs) to and from other Member States. In addition to the existing flexibilities, the proposed Effort Sharing Regulation offers two new flexibilities. The first is a one-off flexibility that allows Member States to achieve their targets using Emissions Trading Scheme allowances that would otherwise be auctioned. The second flexibility acknowledges the difficulty of achieving emissions reductions in agriculture and allows the use of removals within the land use sector to achieve the target. If Ireland uses both these flexibilities, the proposed national target would become 20.5%, relative to 2005 levels. Annual limits for Ireland are presented in Figure 4.3. As these are proposed limits, it is possible that Ireland could receive a more challenging target when the regulations are finalised. 50 Projections Greenhouse gas emissions Million tonnes of CO 2 equivalent Historical Emissions Annual Limits EU Effort Sharing Regulation Figure 4.3: Ireland s greenhouse gas emissions (black line) from 2005 to Annual targets as included under the Effort Sharing Regulation (green line) for the period 2021 to 2030 and emissions projections for with existing measures (dashed blue line) and with additional measures (dashed grey line) are presented here in units of million tonnes of carbon dioxide equivalent. Data source: EPA National Emissions Inventory 2017, 20 Ireland s Greenhouse Gas Emissions Projections and European Commission Fact Sheet on the proposed Effort Sharing Regulation
24 CLIMATE CHANGE ADVISORY COUNCIL ANNUAL REVIEW International Agreements Ireland is a Party to the UNFCCC and has ratified both the Kyoto Protocol and the Paris Agreement under the Convention. The Kyoto Protocol, agreed in 1997, sets legally binding emission limitation and reduction targets based on levels of greenhouse gas emissions in As a Member State of the EU, Ireland participates in meeting the EU Emission Reduction Target. There are two distinct commitment periods, namely from 2008 to 2012 and from 2013 to The EU met its 2012 binding greenhouse gas emissions reduction target and is on track to meet its binding greenhouse gas emissions reduction targets to The Paris Agreement was adopted in 2015 and entered into force in The Paris Agreement requires countries to submit nationally determined contributions, which, for developed countries, include emissions reduction targets to 2025 or As a Member State of the EU, Ireland s contribution to the Paris Agreement is captured in the EU s Nationally Determined Contribution. The EU contribution to the Paris Agreement reflects the EU-wide ambition and targets as set out in section National Policy Position Ireland s national transition objective, as defined in the National Policy Position 23 and Climate Action and Low Carbon Development Act 2015, is to transition to a low-carbon, climate-resilient and environmentally sustainable economy by In terms of mitigation, it is broken down into two components. The first aims to reduce emissions of carbon dioxide in three key sectors electricity generation, the built environment and transport by 80% by 2050, relative to 1990 levels. The second is related to agriculture, land use and forestry. It identifies an approach to carbon neutrality without compromising sustainable food production as its primary objective. The level of ambition expressed in relation to mitigation in the National Policy Position is broadly in line with European and international objectives. The National Policy Position gives particular focus to carbon dioxide emissions from fossil fuel sources. This recognises the importance of reducing carbon dioxide emissions that will continue to warm the planet long into the future. The targets under the National Policy Position are not legally binding Emissions of Carbon Dioxide In 2015, greenhouse gas emissions increased by 3.7%, or 2.1 million tonnes of carbon dioxide equivalent, relative to 2014, while emissions of carbon dioxide increased by 4.8%, or 1.8 million tonnes of carbon dioxide equivalent. Although emissions of carbon dioxide peaked at 48 million tonnes of carbon dioxide equivalent in 2005, they have not yet dropped below 1990 levels and are currently around 17%, or 5.5 million tonnes of carbon dioxide equivalent, higher than in While some years have seen reductions, these have for the most part been associated with the economic downturn. Annual carbon dioxide emissions reductions of the order of 2.4%, or 0.9 million tonnes of carbon dioxide equivalent, per year, relative to 2015, will be required to achieve an at least 80% reduction in carbon dioxide emissions by This would bring Ireland onto a pathway that is consistent with the low-carbon transition as described in the National Policy Position (see Figure 4.4). 14
25 Compliance with Existing Obligations of the State 50 Carbon dioxide emissions Million tonnes of CO 2 equivalent Historical Emissions Projected Emissions Illustrative linear pathway to 80% reduction in CO 2 emissions by Figure 4.4: Emissions of carbon dioxide in Ireland from 1990 to 2015 (solid black line) and projections from 2016 to 2035 (blue dashed line). An illustrative linear pathway for achievement of the low-carbon transition to 2050 (orange dashed line) is shown here in units of million tonnes of carbon dioxide equivalent. Data source: EPA National Emissions Inventory and Ireland s Greenhouse Gas Emissions Projections Advice and Recommendations Projections indicate continued growth in emissions nationally and across key sectors in the coming decade despite the current and envisaged policies and measures. Designing and implementing policies and measures that break the link between greenhouse gas emissions and economic growth is essential if current and future targets are to be achieved. Ireland may comply with its EU Effort Sharing Decision targets through the purchase of emissions units. This would represent a use of public funds to meet targets that would produce no local co-benefits or national investment in the low-carbon transition. Achieving compliance in this manner does not avoid the costs of emission reduction but rather delays the cost to the post period, when further emissions reductions are required, and increases the challenge of achieving our emissions reduction objective for Putting Ireland on track to a low-carbon transition for 2050 that is in line with the Paris Agreement requires decarbonisation of all sectors of the economy. The National Policy Position, with respect to electricity generation, the built environment, transport, agriculture and land sectors, is an excellent starting point. Any sector that has not been addressed in the National Mitigation Plan, for example waste, should be included in future plans, and its inclusion should be based on inventories compiled by the EPA. Understanding the gap to target will require better monitoring of progress through a coherent set of actions, data and analysis nationally and across all sectors. It will also require the ability to map and understand low-carbon pathways and uncertainties, for example those associated with technology, behaviour and changes in practice, for This can be achieved through creating and assessing a suite of suitable scenarios and developing policies and measures that deliver 15
26 CLIMATE CHANGE ADVISORY COUNCIL ANNUAL REVIEW 2017 emissions reductions in all sectors that are compatible with Ireland s own 2050 targets and represent the most cost-efficient means of meeting our national objective on climate change. Without urgent action, Ireland will not only exceed its 2020 emissions reduction targets but will also have an increasingly difficult and expensive task of decarbonisation to complete in the medium and long term. Reliance on technological breakthroughs and significantly reduced costs to enable rapid, substantial and sustained emissions reductions to put us on track to a low-carbon society and economy by 2050 is a high-risk strategy. Decisions need to be based on sound analytical assessments that also address the increased cost and associated pressures that accompany such rapid decarbonisation. 16
27 Progress Made in Furthering Transition 5. Progress Made in Furthering Transition Key Messages The Council will monitor progress annually in implementation of the National Mitigation Plan. To assess progress on low-carbon transition, the Council will monitor trends, technology deployment, public engagement and behaviour change, as well as a range of other indicators. There has been some progress in the built environment and the energy sectors but little progress in reducing emissions from transport. It is unclear if progress is being made in achieving neutrality in agriculture. Initiatives are in place; however, data are lacking and overall emissions are increasing. There has been some progress in institutions and in community engagement in transition; however, much more is required. A strategy for phasing out peat and coal in both the electricity and residential sectors is required. A more ambitious approach in transport will bring clear co-benefits and avoid fossil lock-in, while agriculture should move to define neutrality and adopt all cost-effective reduction measures to that end. The overall direction of travel is not in line with reaching our 2050 transition objective under the National Policy Position. The Climate Action and Low Carbon Development Act 2015 tasked the Council, as part of its Annual Review, to assess progress made in furthering transition to a low-carbon, climateresilient and environmentally sustainable economy. It is the Council s intention to monitor and review implementation of the National Mitigation Plan each year, as it is the primary statutory instrument supporting national transition. The first National Mitigation Plan under the Climate Action and Low Carbon Development Act 2015 was published on 17 July The National Mitigation Plan contains 106 actions; however, the Council is concerned at the lack of specific detail or commitment on new policies and measures. In particular, the Council would like to see the actions linked to expected outcomes or impacts, to allow effective monitoring of implementation and progress. Given the large number of actions contained in the National Mitigation Plan, prioritisation will be required to advance implementation of the National Mitigation Plan in a cost-effective manner. This is the first Annual Review by the Council. Given the very recent publication of the National Mitigation Plan, it is too early to review its implementation. Therefore, this year we offer a highlevel review of progress made across the sectors in the year under review, including progress in public engagement, institutions and governance, before finally presenting a potential range of indicators for transition in the sectors. The indicators offer one perspective on progress 17
28 CLIMATE CHANGE ADVISORY COUNCIL ANNUAL REVIEW 2017 made in furthering transition by looking at progress in behavioural, technical, structural and infrastructural change that are key to long-term achievement of the national transition objective. Future Annual Reviews will assess progress in implementation of the National Mitigation Plan, including progress on the agreed actions contained therein. They will also continue to consider sectoral progress, transition indicators and broader policy developments with significance for greenhouse gas emissions, compliance with obligations of the State in respect of climate change, and the transition to a low-carbon, climate-resilient and environmentally sustainable economy. 5.1 Progress Across the Sectors Electricity Generation There has been some progress in reducing greenhouse gas emissions from electricity generation, with an almost 50% reduction in the carbon intensity of electricity production between 1990 and More recently, this is evidenced by the contribution of renewable electricity to gross electricity consumption, increasing from 22.9% in 2014 to 25.3% in 2015 (see Table 5.1). However, in 2015, emissions associated with electricity generation increased by 5.4%, or 0.6 million tonnes of carbon dioxide equivalent, relative to 2014 levels. The emissions intensity of electricity generation also increased from 456 to 468 thousand tonnes (kilotonnes; kt) of carbon dioxide equivalent between 2014 and 2015 (see Table 5.1). The increase in the carbon intensity of emissions and in absolute emissions from this sector in 2015 was largely caused by the increased use of coal in electricity generation. Emissions from burning peat and coal increased from 8,505 to 9,200 kilotonnes of carbon dioxide equivalent from 2014 to 2015 (see Table 5.1). Electricity consumption in Ireland increased between 2014 and 2015, while net imports of electricity decreased. While Ireland is close to the EU average when it comes to the proportion of renewables in electricity generation, there is a reliance on imported fossil fuels to meet electricity generation demands. Ongoing use of peat and coal for electricity generation will continue to keep per capita emissions in this sector well above the EU average. The pace of decarbonisation of the electricity generation sector is not currently compatible with a low-carbon transition to The electricity sector is covered under the EU Emissions Trading Scheme, which sets an EU-wide cap on emissions in the covered sectors. So far the Emissions Trading Scheme has failed to deliver a carbon price signal strong enough to drive down emissions from electricity generation. For this reason, the Council has recommended that the Irish government support reform of the Emissions Trading Scheme to make it an effective tool for driving decarbonisation. The Council recommends that an EU-wide carbon floor price, that is a minimum price for carbon in the emissions-trading sector, to incentivise decarbonisation of electricity generation should be considered. The current Public Service Obligation subsidy for the burning of peat in electricity generation exacerbates this problem. The Public Service Obligation subsidy supports a peat generation capacity of 250 megawatts at an estimated cost of 110 million, compared to supports for a renewable generation capacity of 3,334 megawatts at an estimated cost of 351 million. 26 In the absence of an adequately performing EU Emissions Trading Scheme, coal and peat will probably continue to be used in electricity generation in Ireland. The decarbonisation of electricity generation will require the phasing out of peat and coal burning for electricity generation. The National Mitigation Plan has initiated a process to identify the best option for replacing Moneypoint power station as well as commissioning a report on Bord na Móna s peat generation plants. 18
Annual Review July Submitted to Government on 17 July Climate Change Advisory Council
 Annual Review 2018 Annual Review 2018 July 2018 Submitted to Government on 17 July 2018 Climate Change Advisory Council McCumiskey House Richview, Clonskeagh Road, Dublin 14, D14 YR62 Phone: 01 2680180
Periodic Review Report 2017
 Periodic Review Report 2017 Periodic Review Report 2017 July 2017 Submitted to Government on 12 July 2017 Climate Change Advisory Council McCumiskey House Richview, Clonskeagh Road, Dublin 14, D14 YR62
Prof. John Fitzgerald. The Citizens Assembly
 Paper of Prof. John Fitzgerald Chair of the Climate Change Advisory Council delivered to The Citizens Assembly on 05 November 2017 Tackling Climate Change in Ireland John FitzGerald, Chairman, The Climate
Niall Cussen National Planning Framework Department of Housing, Planning, Community and Local Government Custom House Dublin 1 D01 W6X0
 Niall Cussen National Planning Framework Department of Housing, Planning, Community and Local Government Custom House Dublin 1 D01 W6X0 16 March 2017 Dear Mr Cussen, RE: Climate Change Advisory Council
EPA 2018 GHG Emissions Projections Report May Ireland s Greenhouse Gas Emissions Projections May 2018
 Ireland s Greenhouse Gas Emissions Projections 2017-2035 May 2018 Table of Contents Key Insights... i Executive Summary... ii 1. Introduction... 1 2. Approach... 1 3. Key Trends Emissions projections out
Ireland s Provisional Greenhouse Gas Emissions
 Ireland s Provisional Greenhouse Gas Emissions 1990-2017 December 2018 CONTENTS KEY HIGHLIGHTS... 3 Introduction... 4 Ireland s Greenhouse Gas Emissions in 2017... 4 Changes in Emissions from Sectors between
Ireland s Final Greenhouse Gas Emissions
 Ireland s Final Greenhouse Gas Emissions 1990-2016 April 2018 CONTENTS KEY HIGHLIGHTS... 2 Introduction... 3 Ireland s Greenhouse Gas Emissions in 2016... 3 Changes in Emissions from Sectors between 2015
IRELAND S GREENHOUSE GAS EMISSIONS IN 2012 KEY HIGHLIGHTS
 EPA Headquarters PO Box 3000 Johnstown Castle Estate County Wexford, Ireland T +353 53 9160600 LoCall 1890 33 55 99 www.epa.ie 15 th April 2014 IRELAND S GREENHOUSE GAS EMISSIONS IN 2012 KEY HIGHLIGHTS
Ireland s Provisional Greenhouse Gas Emissions
 Ireland s Provisional Greenhouse Gas Emissions 1990-2016 November 2017 CONTENTS KEY HIGHLIGHTS... 2 Introduction... 3 Ireland s Greenhouse Gas Emissions in 2016... 3 Changes in Emissions from Sectors between
Annual Transition Statement 2016
 Annual Transition Statement 2016 1 P a g e Table of Contents Introduction and legal requirements... 4 Summary... 5 Background to climate change and impacts... 8 EU and international policy developments...
Working Paper No. 4. November 2018
 Working Paper No. 4 November 2018 Carbon Price Floor in Ireland Author: Paul Deane 1, John FitzGerald 2 and Gemma O Reilly 3 1 MaREI Centre/Environmental Research Institute, University College Cork 2 Chair
Conclusions on the Clean Air Dialogue with Ireland
 13 th March 2017 Ireland has made significant progress in reducing air pollution and improving air quality, to the benefit of public health and welfare, the environment and its ecosystems, as well as reducing
National Mitigation Plan JULY 2017
 National Mitigation Plan JULY 2017 Contents Table of Contents Message from the Taoiseach 3 Foreword 4 Chapter 1: Introduction 7 Chapter 2: Climate Action Policy Framework 11 2.1 The Global Response to
Greenhouse Gas Emissions in Ireland Trends and Projections
 State of the Environment in Ireland 201 2 Meeting the Main Environmental Challenges Workshop - 27 June 201 2 2012 Greenhouse Gas Emissions in Ireland Trends and Projections Dr Maria Martin Climate Change
Draft National Mitigation Plan MARCH 2017
 Draft National Mitigation Plan MARCH 2017 Contents Table of Contents Ministerial Foreword 2 Chapter 1: Climate Action and the Climate Challenge 4 1.1 The Climate Challenge 4 1.2 Climate Action 5 1.3 Conclusion
UK Committee on Climate Change Call for Evidence: Scottish Climate Change Bill. Response from Stop Climate Chaos Scotland February 2017
 UK Committee on Climate Change Call for Evidence: Scottish Climate Change Bill Response from Stop Climate Chaos Scotland February 2017 The Scottish Government has committed to introducing a new Scottish
IRELAND S GREENHOUSE GAS EMISSIONS IN 2006
 EPA Headquarters PO Box 3000 Johnstown Castle Estate County Wexford, Ireland T +353 53 9160600 LoCall 1890 33 55 99 www.epa.ie IRELAND S GREENHOUSE GAS EMISSIONS IN 2006 Summary The EPA has submitted the
Opening Statement to Joint Committee on Climate Action. Mark Griffin, Secretary General, Department of Communications, Climate Action and Environment
 Opening Statement to Joint Committee on Climate Action Mark Griffin, Secretary General, Department of Communications, Climate Action and Environment 26 September 2018 Addressing climate change, whether
IRELAND S GREENHOUSE GAS EMISSIONS PROVISIONAL ESTIMATE FOR 2005
 EPA Headquarters PO Box 3000 Johnstown Castle Estate County Wexford, Ireland T +353 53 9160600 LoCall 1890 33 55 99 www.epa.ie IRELAND S GREENHOUSE GAS EMISSIONS PROVISIONAL ESTIMATE FOR 2005 Summary The
Climate Change and the Transport Sector
 Climate Change and the Transport Sector National Sustainable Transport and Business Conference LIT Campus Thurles 25 th May Laura Behan Climate Change Unit Department of Transport, Tourism and Sport Overview
GHG emissions per capita. (tco 2. e/cap) Source: UNDP, data for 2015 Source: World Bank Indicators, data for 2012 Source: IEA, data for 2013
 Source: UNDP, data for 2015 Source: World Bank Indicators, data for 2012 Source: IEA, data for 2013") CLIMATE ACTION TRACKER BROWN TO GREEN: G2 TRANSITION TO A LOW CARBON ECONOMY European Union This profile assesses the European Union s past, present and indications of future performance towards a low-carbon
CLIMATE ACTION TRACKER BROWN TO GREEN: G2 TRANSITION TO A LOW CARBON ECONOMY European Union This profile assesses the European Union s past, present and indications of future performance towards a low-carbon
IRELAND S GREENHOUSE GAS EMISSIONS IN 2007
 EPA Headquarters PO Box 3000 Johnstown Castle Estate County Wexford, Ireland T +353 53 9160600 LoCall 1890 33 55 99 www.epa.ie 15 April 2009 IRELAND S GREENHOUSE GAS EMISSIONS IN 2007 Summary The EPA produced
IF IRELAND WAS A LEADER IN TACKLING CLIMATE CHANGE WHAT WOULD AGRICULTURE / LAND USE POLICY LOOK LIKE IN IRELAND?
 IF IRELAND WAS A LEADER IN TACKLING CLIMATE CHANGE WHAT WOULD AGRICULTURE / LAND USE POLICY LOOK LIKE IN IRELAND? Presentation to The Citizens Assembly 4 November 2017 Alan Matthews Professor Emeritus
IRELAND S EMISSIONS OF GREENHOUSE GASES FOR THE PERIOD
 Summary IRELAND S EMISSIONS OF GREENHOUSE GASES FOR THE PERIOD 1990-2004 March 2006 The Environmental Protection Agency (EPA) has finalised its latest inventory of Ireland s Greenhouse Gas (GHG) emissions.
The First Biennial Report of Malta
 The First Biennial Report of Malta annex to the National Communication (3rd, 4th, 5th and 6th) of Malta under the UNFCCC The Malta Resources Authority on behalf of the Ministry for Sustainable Development,
Royal Society response to the UK Climate Change Bill consultation
 Royal Society response to the UK Climate Change Bill consultation This document is the response to the UK Climate Change Bill consultation published by Defra in March 2007. This submission has been approved
GHG emissions per capita. (tco 2. e/cap) Source: UNDP, data for 2015 Source: World Bank Indicators, data for 2012 Source: IEA, data for 2013
 Source: UNDP, data for 2015 Source: World Bank Indicators, data for 2012 Source: IEA, data for 2013") BROWN TO GREEN: G2 TRANSITION TO A LOW CARBON ECONOMY CLIMATE ACTION TRACKER France This country profile assesses France s past, present and indications of future performance towards a low-carbon economy
BROWN TO GREEN: G2 TRANSITION TO A LOW CARBON ECONOMY CLIMATE ACTION TRACKER France This country profile assesses France s past, present and indications of future performance towards a low-carbon economy
Ireland s Transboundary Gas Emissions
 1990-2016 March 2018 CONTENTS KEY HIGHLIGHTS... 3 Introduction and Background... 3 Ceilings and summary tables... 4 Sulphur Dioxide... 7 Nitrogen Oxides... 9 Ammonia...12 Non-Methane Volatile Organic Compound
Share of global GHG emissions. GHG emissions per capita. (tco
 CLIMATE ACTION TRACKER BROWN TO GREEN: G2 TRANSITION TO A LOW CARBON ECONOMY South Africa This country profile assesses the South Africa s past, present and indications of future performance towards a
GHG emissions per capita. Share of global GHG emissions. e/cap) (tco
 (tco") CLIMATE ACTION TRACKER BROWN TO GREEN: G2 TRANSITION TO A LOW CARBON ECONOMY India This country profile assesses India s past, present and indications of future performance towards a low-carbon economy
CLIMATE ACTION TRACKER BROWN TO GREEN: G2 TRANSITION TO A LOW CARBON ECONOMY India This country profile assesses India s past, present and indications of future performance towards a low-carbon economy
27 th October Re. Draft National Adaptation Framework Mitigation (NAF) Dear Mr Ó Laoi,
 Dear Mr Ó Laoi,") Consultation on National Adaptation Framework, Climate Adaptation Unit, Department of Communications, Climate Action and Environment, 29-31 Adelaide Road, Dublin 2, D02 X285 Regional Inspectorate, Inniscarra,
Consultation on National Adaptation Framework, Climate Adaptation Unit, Department of Communications, Climate Action and Environment, 29-31 Adelaide Road, Dublin 2, D02 X285 Regional Inspectorate, Inniscarra,
Questions and Answers on the Commission's proposal for effort sharing
 MEMO/08/34 Brussels, 23 January 2008 Questions and Answers on the Commission's proposal for effort sharing 1. What is the Commission proposing? On 10 January 2007 the Commission adopted an energy and climate
2.14 Environmental Profile of Spain 2012
 TRANSPORT 2.14 Environmental Profile of Spain 2012 Transport is a crucial sector for social and economic development. In Europe it provides direct employment to 10 million people and represents around
GHG emissions per capita. (tco 2. e/cap) Source: UNDP, data for 2015 Source: World Bank Indicators, data for 2012 Source: IEA, data for 2013
 Source: UNDP, data for 2015 Source: World Bank Indicators, data for 2012 Source: IEA, data for 2013") CLIMATE ACTION TRACKER BROWN TO GREEN: G2 TRANSITION TO A LOW CARBON ECONOMY Russia This country profile assesses Russia s past, present and indications of future performance towards a low-carbon economy
CLIMATE ACTION TRACKER BROWN TO GREEN: G2 TRANSITION TO A LOW CARBON ECONOMY Russia This country profile assesses Russia s past, present and indications of future performance towards a low-carbon economy
Questions and answers on 2030 framework on climate and energy
 EUROPEAN COMMISSION MEMO Brussels, 22 January 2014 Questions and answers on 2030 framework on climate and energy 1. Why does the EU need a new climate and energy framework for the period up to 2030? The
CLIMATE CHANGE (EMISSIONS REDUCTION TARGETS) (SCOTLAND) BILL
 (SCOTLAND) BILL") CLIMATE CHANGE (EMISSIONS REDUCTION TARGETS) (SCOTLAND) BILL FINANCIAL MEMORANDUM INTRODUCTION 1. As required under Rule 9.3.2 of the Parliament s Standing Orders, this Financial Memorandum is published
CLIMATE CHANGE (EMISSIONS REDUCTION TARGETS) (SCOTLAND) BILL FINANCIAL MEMORANDUM INTRODUCTION 1. As required under Rule 9.3.2 of the Parliament s Standing Orders, this Financial Memorandum is published
Background and objectives
 Workshop on greenhouse gas emission projections 12-13 December 2006, European Environment Agency, Copenhagen Background and objectives André Jol Head of Group climate change and energy European Environment
GHG emissions per capita. (tco 2. e/cap) Source: UNDP, data for 2015 Source: World Bank Indicators, data for 2012 Source: IEA, data for 2013
 Source: UNDP, data for 2015 Source: World Bank Indicators, data for 2012 Source: IEA, data for 2013") CLIMATE ACTION TRACKER BROWN TO GREEN: G2 TRANSITION TO A LOW CARBON ECONOMY Saudi Arabia This country profile assesses Saudi Arabia s past, present and indications of future performance towards a low-carbon
CLIMATE ACTION TRACKER BROWN TO GREEN: G2 TRANSITION TO A LOW CARBON ECONOMY Saudi Arabia This country profile assesses Saudi Arabia s past, present and indications of future performance towards a low-carbon
REPORT FROM THE COMMISSION TO THE EUROPEAN PARLIAMENT AND THE COUNCIL. The state of the European carbon market in (Text with EEA relevance)
") EUROPEAN COMMISSION Brussels, 14.11.2012 COM(2012) 652 final REPORT FROM THE COMMISSION TO THE EUROPEAN PARLIAMENT AND THE COUNCIL The state of the European carbon market in 2012 (Text with EEA relevance)
EUROPEAN COMMISSION Brussels, 14.11.2012 COM(2012) 652 final REPORT FROM THE COMMISSION TO THE EUROPEAN PARLIAMENT AND THE COUNCIL The state of the European carbon market in 2012 (Text with EEA relevance)
UK experience of and plans for reducing emissions of greenhouse gases
 UK experience of and plans for reducing emissions of greenhouse gases David Warrilow UK Department of Energy and Climate Change COP16, Cancun, 30 November 2010 The UK experience Historic trends and progress
CLIMATE CHANGE: IRELAND S CHALLENGE
 CLIMATE CHANGE: IRELAND S CHALLENGE Presentation to the Safefood workshop The Dairy Industry and Climate Change: Assessing future risks from a farmer, processor and customer perspective Teagasc, Ashtown,
Trends and projections in Europe 2018
 Trends and projections in Europe 2018 Tracking progress towards Europe s climate and energy targets (First release, 26 October 2018) Introduction 1 Introduction 1.1 Objective This early release of the
Achieving a Greenhouse Gas (GHG) Neutral Ireland (07-CCRP-3.1) CCRP Report
 Neutral Ireland (07-CCRP-3.1) CCRP Report") EPA CCRP Programme 2007-2013 Achieving a Greenhouse Gas (GHG) Neutral Ireland (07-CCRP-3.1) CCRP Report Prepared for the Environmental Protection Agency by Environment Research Centre, EPA Authors: Gemma
EPA CCRP Programme 2007-2013 Achieving a Greenhouse Gas (GHG) Neutral Ireland (07-CCRP-3.1) CCRP Report Prepared for the Environmental Protection Agency by Environment Research Centre, EPA Authors: Gemma
The Fifth Carbon Budget - Call for Evidence. Question and Response form
 The Fifth Carbon Budget - Call for Evidence www.theccc.org.uk/call-for-evidence Question and Response form When responding please provide answers that are as specific and evidence-based as possible, providing
Published by the Stationery Office, Dublin, Ireland. To be purchased from the:
 Published by the Stationery Office, Dublin, Ireland. To be purchased from the: Central Statistics Office, Information Section, Skehard Road, Cork. Government Publications Sale Office, Sun Alliance House,
How New Zealand, a climate mitigation laggard,, can become a leader - - with the help of local and regional governments
 BOP Regional Council Rotorua, 7 December 2017 Prof Ralph Sims Massey University R.E.Sims@massey.ac.nz How New Zealand, a climate mitigation laggard,, can become a leader - - with the help of local and
21 st November 2016 Our Ref: SCP
 National Policy Framework for Alternative Fuels Infrastructure for Transport in Ireland Climate Change Unit Department of Transport, Tourism and Sport Leeson Lane Dublin 2 21 st November 2016 Our Ref:
GHG emissions per capita. (tco 2. e/cap) Source: UNDP, data for 2015 Source: World Bank Indicators, data for 2012 Source: IEA, data for 2013
 Source: UNDP, data for 2015 Source: World Bank Indicators, data for 2012 Source: IEA, data for 2013") CLIMATE ACTION TRACKER BROWN TO GREEN: G2 TRANSITION TO A LOW CARBON ECONOMY Australia This country profile assesses Australia s past, present and indications of future performance towards a low-carbon
CLIMATE ACTION TRACKER BROWN TO GREEN: G2 TRANSITION TO A LOW CARBON ECONOMY Australia This country profile assesses Australia s past, present and indications of future performance towards a low-carbon
FCCC/TRR.1/IRL. United Nations. Report of the technical review of the first biennial report of Ireland. Distr.: General 30 November 2014.
 United Nations FCCC/TRR.1/IRL Distr.: General 30 November 2014 English only Report of the technical review of the first biennial report of Ireland Developed country Parties are requested, in accordance
COMMISSION STAFF WORKING DOCUMENT EXECUTIVE SUMMARY OF THE IMPACT ASSESSMENT. Accompanying the document. A Strategy
 EUROPEAN COMMISSION Brussels, 21.5.2014 SWD(2014) 159 final COMMISSION STAFF WORKING DOCUMENT EXECUTIVE SUMMARY OF THE IMPACT ASSESSMENT Accompanying the document A Strategy for Reducing Heavy Duty Vehicles'
Ervia s response to Ireland s Draft National Energy & Climate Plan (NECP)
") Ervia s response to Ireland s Draft National Energy & Climate Plan (NECP) 2021-2030 February 2019 1 Introduction to Ervia Ervia is a commercial semi-state company with responsibility for the delivery of
Ervia s response to Ireland s Draft National Energy & Climate Plan (NECP) 2021-2030 February 2019 1 Introduction to Ervia Ervia is a commercial semi-state company with responsibility for the delivery of
Eoin Ó Broin TD. Sinn Féin Spokesperson on Housing, Planning, and Local Government ACHIEVING ENERGY EFFICIENCY IN HOUSING
 Eoin Ó Broin TD Sinn Féin Spokesperson on Housing, Planning, and Local Government ACHIEVING ENERGY EFFICIENCY IN HOUSING MARCH 2019 Achieving Energy Efficiency in Housing Contents Homes and Carbon Emissions...
Energy Projections
 www.seai.ie Energy Projections 2017 2030 Overview SEAI National Energy Projections Process Modelling Framework Scenarios 2020 insights 2030 insights Summary and next steps 3 www.seai.ie National Energy
Visiting fellow in the School of Economics at the University of Queensland
 Prospects for meeting Australia s 2020 carbon targets, given a growing economy, uncertain international carbon markets and the slow emergence of renewable energies Colin Hunt Visiting fellow in the School
COMMUNICATION FROM THE COMMISSION TO THE EUROPEAN PARLIAMENT, THE COUNCIL, THE EUROPEAN ECONOMIC AND SOCIAL COMMITTEE AND THE COMMITTEE OF THE REGIONS
 EUROPEAN COMMISSION Brussels, 20.7.2016 COM(2016) 500 final COMMUNICATION FROM THE COMMISSION TO THE EUROPEAN PARLIAMENT, THE COUNCIL, THE EUROPEAN ECONOMIC AND SOCIAL COMMITTEE AND THE COMMITTEE OF THE
Greenhouse gas emission trends and projections in Greece 2006 GREECE
 GREECE Overview... 2 Sources of Information... 3 Overview of CCPM implementation in MS... 3 Quality and Transparency of Reporting... 4 Assessment of Policies and Measures... 5 Policies and measures in
COMMISSION OF THE EUROPEAN COMMUNITIES REPORT FROM THE COMMISSION TO THE EUROPEAN PARLIAMENT AND THE COUNCIL
 EN EN EN COMMISSION OF THE EUROPEAN COMMUNITIES Brussels, 12.11.2009 COM(2009)630 final REPORT FROM THE COMMISSION TO THE EUROPEAN PARLIAMENT AND THE COUNCIL PROGRESS TOWARDS ACHIEVING THE KYOTO OBJECTIVES
Ireland s Second Biennial Report 2016
 Ireland s Second Biennial Report 2016 1 Ireland s Second Biennial Report Contents 1. Introduction... 4 2. Information on GHG emissions and trends, GHG inventory including information on national inventory
Malta s national report submitted to the European Commission under the Monitoring Mechanism, Decision 280/2004/EC. May 2007.
 Malta Contents 1. SOURCES OF INFORMATION 1 2. SUMMARY 3 3. REPORTED INDICATORS 4 4. OVERVIEW OF CCPM IMPLEMENTATION IN MALTA 5 5. COMPLETESS OF REPORTING 7 6. ASSESSMENT OF POLICIES AND MEASURES 8 7. EVALUATION
SUBMISSION BY DENMARK AND THE EUROPEAN COMMISSION ON BEHALF OF THE EUROPEAN UNION AND ITS MEMBER STATES
 SUBMISSION BY DENMARK AND THE EUROPEAN COMMISSION ON BEHALF OF THE EUROPEAN UNION AND ITS MEMBER STATES This submission is supported by Bosnia and Herzegovina, Croatia, the Former Yugoslav Republic of
Implementing Paris: Delivering the EU s at least 40% GHG reduction by 2030
 Implementing Paris: Delivering the EU s at least 40% GHG reduction by 2030 Webinar Series on NDCs June 22, 2017 Climate Action Tom van Ierland Head of unit DG CLIMA European Commission Outline 1. Overview
Green House Gas Emissions from Agriculture
 Green House Gas Emissions from Agriculture The story so far Mark Gibson Environment, Knowledge Transfer Gary J. Lanigan Agri-environment Research Outline of talk Green House Gases (GHG s) The challenge
Session SBI41 (2014)
") Session SBI41 (2014) Session started at 01-09-2014 00:00:00 [GMT+1] Session closed at 28-11-2014 23:59:59 [GMT+1] A compilation of questions to - and answers by Switzerland Exported 29/11-2014 by the UNITED
Session SBI41 (2014) Session started at 01-09-2014 00:00:00 [GMT+1] Session closed at 28-11-2014 23:59:59 [GMT+1] A compilation of questions to - and answers by Switzerland Exported 29/11-2014 by the UNITED
Low-down on the new emissions caps for European countries
 Low-down on the new emissions caps for European countries A guide to the proposed EU Effort Sharing Regulations, covering emissions outside of the EU Emission Trading Scheme On the 20 th July, the European
TASK FORCE ON INTEGRATED ASSESSMENT MODELLING (TFIAM) 42 nd session, April 2013 Copenhagen, Denmark. Draft Chairs report I.
 42 nd session, April 2013 Copenhagen, Denmark. Draft Chairs report I.") TASK FORCE ON INTEGRATED ASSESSMENT MODELLING (TFIAM) 42 nd session, 22-23 April 2013 Copenhagen, Denmark Draft Chairs report I. INTRODUCTION 1. This report describes the results of the 42 nd session of
TASK FORCE ON INTEGRATED ASSESSMENT MODELLING (TFIAM) 42 nd session, 22-23 April 2013 Copenhagen, Denmark Draft Chairs report I. INTRODUCTION 1. This report describes the results of the 42 nd session of
ANNEX 1 FIRST BIENNIAL REPORT OF THE SLOVAK REPUBLIC
 ANNEX 1 FIRST BIENNIAL REPORT OF THE SLOVAK REPUBLIC Accompanying the document SIXTH NATIONAL COMMUNICATION OF THE SLOVAK REPUBLIC UNDER THE UN FRAMEWORK CONVENTION ON CLIMATE CHANGE (UNFCCC) BR1-1 INTRODUCTION
ENERGY-RELATED CO 2 EMISSIONS IN IRELAND Report
 ENERGY-RELATED CO 2 EMISSIONS IN IRELAND 2005-2016 Sustainable Energy Authority of Ireland SEAI is Ireland s national energy authority investing in, and delivering, appropriate, effective and sustainable
Taking a stand for a sustainable energy future
 Taking a stand for a sustainable energy future Jim Scheer SEAI Fourth National Forum on Education for Sustainable Development (ESD) Clock Tower, Marlborough Street, Dublin 1 28 th November, 2018 1 What
NEW ZEALAND Submission to the Ad Hoc Working Group on the Durban Platform for enhanced Action Work Stream 2 September, 2013
 NEW ZEALAND Submission to the Ad Hoc Working Group on the Durban Platform for enhanced Action Work Stream 2 September, 2013 Context 1. This submission responds to the invitation from the Ad Hoc Working
Ireland s report on Demonstrable Progress under Article 3.2 of the Kyoto Protocol
 Ireland s report on Demonstrable Progress under Article 3.2 of the Kyoto Protocol Summary 5 Chapter 1 Policies to Address Climate Change 6 1.1 Ireland s target and the International Context 6 1.2 National
Transport Sector GHG Emission Reduction Strategies
 Transport Sector GHG Emission Reduction Strategies Hirofumi Ohnishi Chair, WG on Transport GHG Reduction Strategy OECD/ITF Joint Transport Research Center 1 Recent Development of Climate Change Issue GHG
This paper outlines the carbon footprint and greenhouse gas assessment for HS2 Phase One.
 HIGH SPEED TWO INFORMATION PAPER E10: CARBON This paper outlines the carbon footprint and greenhouse gas assessment for HS2 Phase One. It will be of particular interest to those potentially affected by
CONTENTS TABLE OF PART A GLOBAL ENERGY TRENDS PART B SPECIAL FOCUS ON RENEWABLE ENERGY OECD/IEA, 2016 ANNEXES
 TABLE OF CONTENTS PART A GLOBAL ENERGY TRENDS PART B SPECIAL FOCUS ON RENEWABLE ENERGY ANNEXES INTRODUCTION AND SCOPE 1 OVERVIEW 2 OIL MARKET OUTLOOK 3 NATURAL GAS MARKET OUTLOOK 4 COAL MARKET OUTLOOK
New Zealand Emissions Trading Scheme - considerations for the waste and transport sectors. Kay Harrison Ministry for the Environment October 2009
 New Zealand Emissions Trading Scheme - considerations for the waste and transport sectors Kay Harrison Ministry for the Environment October 2009 Outline of presentation Climate Change The Kyoto Protocol
GLOBAL REDUCTION IN CO2 EMISSION FROM CARS: A CONSUMER S PERSPECTIVE
 GLOBAL REDUCTION IN CO2 EMISSION FROM CARS: A CONSUMER S PERSPECTIVE POLICY RECOMMENDATIONS FOR DECISION MAKERS November 2015 FOREWORD As part of the FIA mission to promote clean transport systems available
COMMISSION OF THE EUROPEAN COMMUNITIES REPORT FROM THE COMMISSION
 COMMISSION OF THE EUROPEAN COMMUNITIES Brussels, 28.11.2003 COM(2003) 735 final REPORT FROM THE COMMISSION under Council Decision 93/389/EEC as amended by Decision 99/296/EC for a monitoring mechanism
GHG emissions per capita. (tco 2. e/cap) Source: UNDP, data for 2015 Source: World Bank Indicators, data for 2012 Source: IEA, data for 2013
 Source: UNDP, data for 2015 Source: World Bank Indicators, data for 2012 Source: IEA, data for 2013") CLIMATE ACTION TRACKER BROWN TO GREEN: G2 TRANSITION TO A LOW CARBON ECONOMY Turkey This country profile assesses Turkey s past, present and indications of future performance towards a low-carbon economy
CLIMATE ACTION TRACKER BROWN TO GREEN: G2 TRANSITION TO A LOW CARBON ECONOMY Turkey This country profile assesses Turkey s past, present and indications of future performance towards a low-carbon economy
Key data supporting climate policy in Europe
 François Dejean 16th EUROSAI WGEA Annual Meeting 25.09.2018 Key data supporting climate policy in Europe Training Seminar on Climate Change: Focus on Data The European Environment Agency The EU body dedicated
Ireland s Draft National Allocation Plan
 Ireland s Draft National Allocation Plan 2008 2012 Public Consultation 12 May 2006 NAP2 FD PC1 INTRODUCTION Background The European Union (EU) and its Member States are signatories to the Kyoto Protocol,
A Global Platform for Accelerating Coal Efficiency
 A Global Platform for Accelerating Coal Efficiency Concept Paper A Global Platform for Accelerating Coal Efficiency 1 This is a concept paper on the Platform for Accelerating Coal Efficiency (PACE). The
The 2030 Effort Sharing Regulation
 The 2030 Effort Sharing Regulation How can the EU s largest climate tool spur Europe s low-carbon transition? Carbon Market Watch Policy Briefing September 2016 TRANSPORT BUILDINGS WASTE AGRICULTURE 1
Technical Paper Kyoto Ambition Mechanism Report
 Technical Paper Kyoto Ambition Mechanism Report 30 April 2014 EN EN Table of Contents 1. Summary... 2 2. Progress towards meeting the Kyoto targets in the first commitment period (2008-2012)... 4 2.1.
CLIMATE PROTECTION POLICY OF THE CZECH REPUBLIC. Executive summary 2017
 CLIMATE PROTECTION POLICY OF THE CZECH REPUBLIC Executive summary 2017 1 The Climate Protection Policy of the Czech Republic was prepared by the Ministry of the Environment in a cooperation with the inter-ministerial
Transitioning to Low Carbon
 Transitioning to Low Carbon Professor John Loughhead OBE FREng FTSE Chief Scientific Advisor, Department of Energy and Climate Change ETI Stakeholder Event 10 Years to Prepare for a Low Carbon Economy
Key performance indicators to underpin Scottish climate change policy
 1. Background Key performance indicators to underpin Scottish climate change policy The Climate Change (Scotland) Act sets targets to reduce Scotland s emissions of the basket of six Kyoto Protocol greenhouse
MEMO/12/176. Brussels, 12 March 2012
 MEMO/12/176 Brussels, 12 March 2012 Questions & Answers on accounting rules and action plans on greenhouse gas emissions and removals resulting from activities related to land use, land use change and
UK climate change policy. Presentation to the CTF Trust Fund Committee 11th May 2009
 UK climate change policy Presentation to the CTF Trust Fund Committee 11th May 2009 UK greenhouse gas emissions: progress towards targets and goals Why do we want to reduce UK emissions? There are important
Department of the Environment, Community and Local Government consultation. EU Commission Proposal for the Reform of the EU Emissions Trading Scheme
 Department of the Environment, Community and Local Government consultation EU Commission Proposal for the Reform of the EU Emissions Trading Scheme Submission by Cement Manufacturers Ireland December 2015
Denmark. Sources of information. The following communications have been made available for this study.
 Denmark Sources of information The following communications have been made available for this study. Follow-up on 21 Status of energy planning, Danish Agency, June 1999. Projections of emissions of greenhouse
Executive summary. Final report prepared in November 2014 by Jozef Stefan Institute, Energy Efficiency Centre (JSI-EEC)
") Executive summary of the REPORT on the assessment of monitoring of the implementation and efficiency of measures and the definition of proposals for upgrading of the monitoring system Final report prepared
Executive summary of the REPORT on the assessment of monitoring of the implementation and efficiency of measures and the definition of proposals for upgrading of the monitoring system Final report prepared
Results from the Swedish Environmental Protection Agency analysis of the ESR-proposal
 1(15) SW E D I SH E N V IR O N M EN T A L P R OT E C T IO N AG E NC Y Results from the Swedish Environmental Protection Agency analysis of the ESR-proposal In short: The ambition in the 2030 climate framework
An independent assessment of the Clean Growth Strategy
 An independent assessment of the Clean Growth Strategy Technical annex Industry Under the Climate Change Act, the government is required to publish a set of policies and proposals that will enable the
Life in the Fast Lane: Evolving Paradigms for Mobility and Transportation Systems of the Future
 IEA Experts Group on R&D Priority Setting and Evaluation (EGRD) Life in the Fast Lane: Evolving Paradigms for Mobility and Transportation Systems of the Future 26-27 October 2016 United States Department
Proposal for a REGULATION OF THE EUROPEAN PARLIAMENT AND OF THE COUNCIL
 EUROPEAN COMMISSION Brussels, 3.2.2017 COM(2017) 54 final 2017/0017 (COD) Proposal for a REGULATION OF THE EUROPEAN PARLIAMENT AND OF THE COUNCIL amending Directive 2003/87/EC to continue current limitations
A.S.A. Johnstown Castle
 1 The challenge of sustainability for Irish Agriculture Karl Richards, Trevor Donnellan, Kevin Hanrahan, Laurence Shalloo, Mary Ryan, John Finnan, Pat Murphy, Gary Lanigan A.S.A. Johnstown Castle 16 January
POLICY GUIDELINES by the Energy Community Secretariat
 POLICY GUIDELINES by the Energy Community Secretariat on the development of National Energy and Climate Plans under Recommendation 2018/01/MC-EnC PG 03/2018 / June 2018 www.energy-community.org PG 03/2018
Seventh Annual Workshop on Greenhouse Gas. Catherine Leining, NZ Emissions Trading Group
 NZ EMISSIONS TRADING SCHEME Seventh Annual Workshop on Greenhouse Gas Emissions i Trading Catherine Leining, NZ Emissions Trading Group October 2007 Overview of presentation Context for developing the
RE: Renewable Gas Forum Ireland Opening Statement & Executive Summary
 Joint Committee on Communications, Climate Action & Environment The House of the Oireachtas Service Kildare Street Dublin 2 20 th February 2018 RE: Renewable Gas Forum Ireland Opening Statement & Executive
Energy Matters. How COP21 can shift the energy sector onto a low-carbon path that supports economic growth and energy access
 Energy Matters How COP21 can shift the energy sector onto a low-carbon path that supports economic growth and energy access Kamel Ben Naceur Director, Sustainable Energy Policy and Technology IEA webinar,