A new, comprehensive database for social LCA: PSILCA
|
|
|
- Mary Gallagher
- 6 years ago
- Views:
Transcription
1 A new, comprehensive database for social LCA: PSILCA Andreas Ciroth, Franziska Eisfeldt GreenDelta GmbH New Delhi, ILCM 2015, September 2015
2 PSILCA database Agenda 1. Background and motivation 2. Approach 3. Application 4. Current Status 5. Results and conclusion
3 1 Background and motivation
4 Background and Motivation Social LCA studies typically cover global life cycles consisting of many different, interlinked processes Impossible and inefficient to collect specific information for every single process Generic information for generic processes Obvious and urgent need for a comprehensive, generic database for S-LCA
5 Background and Motivation Challenges to be addressed Social data is often qualitative hard to access, measure and organize Indicators (social measures) are needed to capture social observations, but no consensus about important social impacts Selection of indicators and assessment of impacts is subjective different approaches, individual evaluation and interpretation


6 Background and Motivation A new database created, called PSILCA (Product Social Impact Life Cycle Assessment)
7 2 Approach
8 Approach Eora MRIO database as backbone (Lenzen et al.): 189 individual countries represented by a total of 15,909 sectors high-resolution heterogeneous classification, or 26- sector harmonized classification continuous coverage for the period (satellite accounts to 2010) raw data drawn from the UN's System of National Accounts and COMTRADE databases, Eurostat
9 Structure of processes 26 harmonized sectors (industries) for Afghanistan 1022 detailed sectors (industries and commodities) for UK
10 Indicator structure Social indicators and its structure mainly inspired by UNEP/SETAC guidance book: STAKEHOLDER SUBCATEGORY INDICATOR (SUBINDICATOR) Currently, there are 88 qualitative and quantitative indicators addressing 23 subcategories (topics) and 5 affected stakeholder groups
11 Stakeholders and Subcategories Stakeholder Workers Value chain actors Society Local community Consumers Subcategory Child labour Forced labour Fair salary Working time Discrimination Health and Safety Social benefits, legal issues Workers rights Fair competition Corruption Promoting social responsibility Supplier relationships Health and Safety Contribution to economic development Prevention and mitigation of conflicts Access to material resources Respect of indigenous rights Safe and healthy living conditions Local employment Migration Health and Safety Transparency End of life responsibility
12 Data sources Variety of sources is considered for data collection: Reputable, statistical agencies (World Bank, International Labour Organization, World Health Organization, United Nations ) Private or governmental databases (ICTWSS database about trade unions etc. by University of Amsterdam, United States Department of Labor ) Various case studies and own investigation Big data analyses planned
13 Data attribution In many cases, data is not directly attributable or not available for specific sectors, data attribution through: Interpolation (from higher level clusters to lower levels) Extrapolation of known values (from lower level clusters to higher levels) Average values (over countries of country groups, over sectors within one country) This extrapolation of data is documented as part of data quality
14 Data quality Data quality assessed by a square, pedigree matrix (based on Weidema and Wesnæs (1996), but adapted to social LCA, Ciroth and Franze 2014) Reliability of source Conformance of the data set

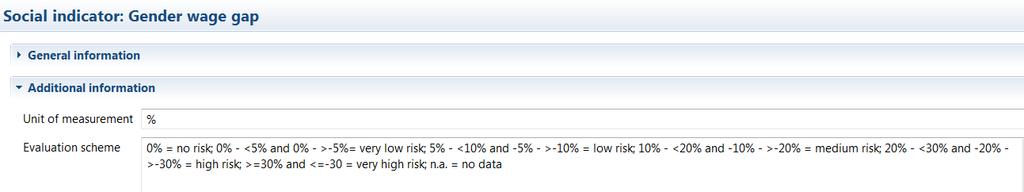
15 Indicator assessment Assessed by an ordinal risk scale of typically 6 different risk levels: no risk, very low risk, low risk, medium risk, high risk, very high risk
16 Indicator assessment For some indicators, additionally positive aspects will be considered (e.g. Respect of indigenous rights, Fair salary): high opportunity, medium opportunity, low opportunity Evaluation of indicator risk levels is subjective both the indicator values and the indicator risk levels are provided Risk levels can be modified individually
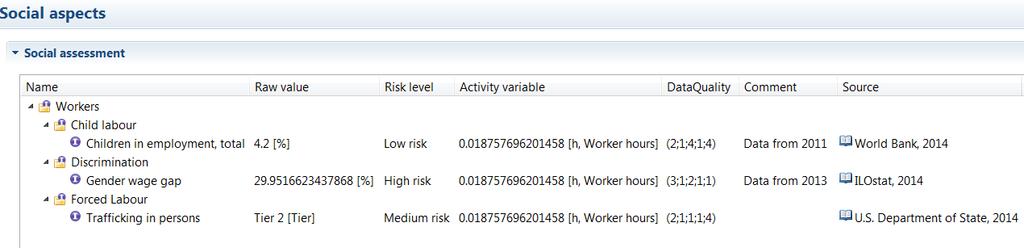
17 Indicator assessment in openlca
18 Activity variable So-called activity variables (Norris 2006) are necessary to describe the relevance of impacts caused by a process in a life cycle Worker hours are applied (initially to all indicators, also those not concerning labor conditions) (also used by Benoît-Norris et al in SHDB) = h/usd output for each process Further activity variables for other stakeholders are currently being assessed
19 Owner-occupied dwellings Re-export & Re-import Mining of uranium and thorium ores Metal ores Fishery and fish breeding Manufacture of coke; refined petroleum products and nuclear fuels Recycling Food & Beverages Processed seafood and by products Other Livestock Manufacture of fertilizers and nitrogen compounds Real estate activities Cotton fabric Bread; fresh pastry goods and cakes; rusks and biscuits; preserved Life insurance Others Hotels and restaurants Animal breeding Seafood preparations Agricultural products other Food products and beverages Electrical and Machinery Fishing services Motor Vehicles Other Food Productos de caucho Wheat Aquaculture Furniture and other manufacturing Shipping Industrial chemicals Maintenance and Repair TEXTILES; CLOTHING AND LEATHER GOODS Non-ferrous metallic minerals Casting M&E Post and Telecommunications Manufacture of textiles electricity water and gas Crude oil and natural gas Other Costr. Materials Steam generators; water (except hot water boilers for central heating) onfectionery manufacturing Electricity; gas; steam and hot water supply Manufacture of tobacco products Retail trade of motor fuel Manufacture of railway and tramway locomotives and rolling stock Construction work Other recreational services Movie theaters Equipment hire Cereals; oilseeds and forage Fertilizers & pesticides Clay products Machinery and equipment n.e.c. Banking Services Hotel and restaurant services Wholesale trade and commission trade; except of motor vehicles and evice manufacturing Chemicals; chemical products and man-made fibres Collected and purified water; distribution services of water Other iron or steel products Specialized construction work Textile weaving Tobacco products Financial Institutions Financial intermediation; except insurance and pension funding Real estate services Manufacture of other transport equipment Construction for agriculture and manufacturing Growing of pome fruits Activities of membership organisation n.e.c. Maintenance and Repair Publishing of newspapers Civic; social; professional; and similar organizations News agency activities Retail Trade Wholesale Trade Health insurance Re. sale of clothing; footwear etc. Other service activities Manufacture of other transport equipment Hospitals Postal service ,1 0,01 0,001 0,0001, E-08 1E-09 1E-10 1E-11 Worker hour example, ordered, all sectors (PSILCA) Worker 2011_worker_h_per_$ hours per $ Most values range between 0.01 and 1
20 4 Application
21 Application Policy-type application (Entire economy/ specific industry sector in a country is assessed) Derive recommendations for political actors in key policy issues, e.g. sustainable consumption, development cooperation, legislation Ex.: - Socially sustainable coffee import - Legislation for sustainable construction Application for hybrid cases Connect specific information of foreground processes to generic information of PSILCA for background processes
22 5 Current status
23 Interactive database Network of collaborators is created data collection and provision; local customer support Scientific Advisory Council (SAC): - To ensure feedback on selected approach, method and on updates of database User Advisory Council (UAC): - To provide practical feedback and to steer the database development and maintenance
24 Outcome At present PSILCA is available for openlca Versions for other LCA software systems (especially SimaPro) are being prepared Database available in 3 different versions (Starter, Professional, Developer), distinguished by: Provision of original indicator values Provision of information about data quality Applied cut-off-criterion
25 6 Results and conclusion
26 Results PSILCA is one important step towards increasing data availability for social LCA; Unique features: Transparent indicators Data quality Really comprehensive and up-to date MRIO database as backbone
27 Results However, social data are more difficult to capture and to maintain Group of external (non-greendelta) data collectors and evaluators established, including ENEA (Italy), Ciraig (Canada)
28 Thank you Contact: Dr. Andreas Ciroth GreenDelta GmbH Müllerstrasse 135, Berlin, Germany
What s new in PSILCA 2.0
 Webinar What s new in PSILCA 2.0 Franziska Eisfeldt GreenDelta GmbH 14 December 2017 Agenda Agenda 1. About PSILCA 2. What s new in PSILCA 2.0? 3. PSILCA variants 4. More information About PSILCA PSILCA
Canadian International Merchandise Trade
 Catalogue no. 65-001-X Vol. 69, no. 9. Canadian International Merchandise Trade. Statistical tables Table 1 Merchandise trade of Canada, balance of payments basis, seasonally adjusted - Current dollars
Canadian International Merchandise Trade
 Catalogue no. 65-001-X Vol. 69, no. 7. Canadian International Merchandise Trade. Statistical tables Table 1 Merchandise trade of Canada, balance of payments basis, seasonally adjusted - Current dollars
Canadian International Merchandise Trade
 Catalogue no. 65-001-X Vol. 69, no. 12. Canadian International Merchandise Trade. Statistical tables Table 1 Merchandise trade of Canada, balance of payments basis, seasonally adjusted - Current dollars
Canadian International Merchandise Trade
 Catalogue no. 65-001-X Vol. 66, no. 9. Canadian International Merchandise Trade. Statistical tables Table 1 Merchandise trade of Canada, balance of payments basis, seasonally adjusted Current dollars Export
Life Cycle Sustainability Assessment of photovoltaic panels using soca
 Life Cycle Sustainability Assessment of photovoltaic panels using soca Franziska Eisfeldt, Cristina Rodríguez, Andreas Ciroth GreenDelta GmbH Brussels, SETAC Europe 2017, 10/05/2017 PSILCA database Agenda
Contribution of Social Life Cycle Assessment to reach the Sustainable Development Goals
 Contribution of Social Life Cycle Assessment to reach the Sustainable Development Goals Franziska Eisfeldt, Andreas Ciroth GreenDelta GmbH Medellín, CILCA 2017, 14/06/2017 Introduction: Sustainable Development
ENERGY USE OF PRIVATE HOUSEHOLDS BY PURPOSES OF FINAL CONSUMPTION
 STATISTICAL COMMISSION and ECONOMIC COMMISSION FOR EUROPE CONFERENCE OF EUROPEAN STATISTICIANS Joint ECE/Eurostat Work Session on Methodological Issues of Environment Statistics (Ma ale Hachamisha (15
GUIDELINES FOR DESCRIBING THE ACCREDITATION SCOPE OF CERTIFICATION BODIES CERTIFYING MANAGEMENT SYSTEMS
 GUIDELINES FOR DESCRIBING THE ACCREDITATION SCOPE OF CERTIFICATION BODIES CERTIFYING MANAGEMENT SYSTEMS Reviewed by: Natalija Jovičić Zarić MSc, Quality Manager (QM) Approved by: Dejan Krnjaić PhD, Director
UN List of Industrial Products
 UN List of Industrial Products United Nations Statistics Division Workshop on Classifications, Montevideo, Uruguay, 14-18 March 2005 25/04/2005 1 History UN list of industrial products was developed in
IAF Informative Document for QMS Scopes of Accreditation
 IAF ID 1:2010 International Accreditation Forum, Inc. IAF Informative Document IAF Informative Document for QMS Scopes of Accreditation (IAF ID 1:2010) IAF ID 1:2010 International Accreditation Forum,
Policy on Witnessing Activities and Scope Management for Certification and Verification Bodies
 Policy on Witnessing Activities and Scope Management for Certification and Verification Bodies PS22 1) Purpose In order to conform with ISO/IEC 17011 clause 7.5.6, INAB shall: ensure that appropriate mechanisms
LA VERSION ELECTRONIQUE FAIT FOI
 International Forum, Inc. IAF Informative Document IAF Informative Document For QMS and EMS Scopes of Issue 2 (IAF ID 1: 2014) International Forum, Inc. 2014 International Forum, Inc. Issue 2 IAF Informative
BUSINESS-FACTS: 2 DIGIT SIC SUMMARY
 Project : South Tulsa BUSINESS-FACTS: 2 DIGIT SUMMARY Prepared For You 1.00 Mile Radius TOT All Industries MAN All Manufacturing ( 20-39) RET All Retailing ( 52-59) 01 Agricultural Production - Crops 02
China. Liu Yu 1 and Li Xiangyang Data Source
 China Liu Yu 1 and Li Xiangyang 2 The China IO table in the GTAP 8 Data Base is constructed from key 2007 IO table published by National Bureau of Statistics of China (NBS) and some other data sources,
Holistic environmental accounting for businesses - Efficiently addressing the upstream value chains through life cycle based information
 Holistic environmental accounting for businesses - Efficiently addressing the upstream value chains through life cycle based information Christian Solli* a, Hogne N. Larsen, Camilla Haugsten b, Edvard
Explaining small firms TFP gap: An analysis with Italian, Spanish and French firm-level data
 Explaining small firms TFP gap: An analysis with Italian, Spanish and French firm-level data Cristina Fernández and Paloma Lopez-Garcia CompNet Workshop 20-21 September, Paris SERVICIO DE ESTUDIOS DEL
To all accredited and applicant Certification Bodies operating QMS, ISMS and ITSM certification.
 To all accredited and applicant Certification Bodies operating QMS, ISMS and ITSM certification. To all interested Bodies Our ref.: DC2017SSV324 Milan, 06/11/2017 Object: Technical circular N 22/2017 -
Business-Facts: 2 Digit SIC Summary 2010
 Business-Facts: Digit Summary Radius : 777 RICHMOND HWY, ALEXANDRIA, VA 6-8,. -. Miles, s + TOT All Industries 9 8,86,8. 6 MAN All Manufacturing ( -9).7 RET All Retailing ( -9) 8,9.7 9 ADM Public Administration
I. MAIN ECONOMIC INDICATORS OF INDUSTRY
 I. MAIN ECONOMIC INDICATORS OF INDUSTRY MAIN INDICATORS OF INDUSTRY * 1995 Number of establishments 773 1050 1177 1234 1713 1816 2053 Output volume (at current prices), mln. drams 172048.2 261167.6 283484.8
INDUSTRIAL PRODUCTION INDICES IN JULY Figure 1. Industrial Production Indices (2010 = 100)
") INDUSTRIAL PRODUCTION INDICES IN JULY 2017 1 According to the preliminary data the Industrial Production Index 2, seasonally adjusted 3, increased by 0.2% in July 2017 as compared to June 2017. In July
INDUSTRIAL PRODUCTION INDICES IN JULY 2017 1 According to the preliminary data the Industrial Production Index 2, seasonally adjusted 3, increased by 0.2% in July 2017 as compared to June 2017. In July
Convergence of NACE and NAICS
 VOORBURG GROUP ON SERVICES STATISTICS 16th Meeting Örebro, 17-21 September 2001 Convergence of NACE and NAICS Implications for Services Statistics Session on Classification Paul Johanis Statistics Canada
Experiences From Human Resource Development Fund Malaysia
 Experiences From Human Resource Development Fund Malaysia Regional TVET Conference - TVET Quality Breakthrough 10 & 11 th October 2012 Melia Hotel, Hanoi, Viet Nam PEMBANGUNAN SUMBER MANUSIA BERHAD (545143-D)
2. The Original Input-Output Table
 Azerbaijan Jesper Jensen and David Tarr 1 1. Introduction Azerbaijan is not represented individually in version 6 of the GTAP Data Base. The country is only represented indirectly via the composite region
2008 Census of Industrial Production (NACE Rev 2)
") 30 November 2009 Census of Industrial Production (NACE Rev 2) Early Estimates Other 33% Chemicals 7% Computers 18% Food Products 19% Basic Pharmaceutical 23% Industrial Gross value Wages & Year added salaries
30 November 2009 Census of Industrial Production (NACE Rev 2) Early Estimates Other 33% Chemicals 7% Computers 18% Food Products 19% Basic Pharmaceutical 23% Industrial Gross value Wages & Year added salaries
INDUSTRIAL PRODUCTION INDICES IN OCTOBER
 INDUSTRIAL PRODUCTION INDICES IN OCTOBER 2017 1 According to the preliminary data the Industrial Production Index 2, seasonally adjusted 3, decreased by 0.6% in October 2017 as compared to September 2017.
NACE codes per hoofdcategorie (Rev. 2)
") NACE codes per hoofdcategorie (Rev. 2) A - Agriculture, forestry and fishing A1 - Crop and animal production, hunting and related service activities A2 - Forestry and logging A3 - Fishing and aquaculture
NACE codes per hoofdcategorie (Rev. 2) A - Agriculture, forestry and fishing A1 - Crop and animal production, hunting and related service activities A2 - Forestry and logging A3 - Fishing and aquaculture
A3.2 - Aquaculture A Marine aquaculture A Freshwater aquaculture B - Mining and quarrying B5 - Mining of coal and lignite B5.
 NACE CODES A - Agriculture, forestry and fishing A1 - Crop and animal production, hunting and related service activities A1.1 - Growing of non-perennial crops A1.1.1 - Growing of cereals (except rice),
Some thoughts on productivity and Greece
 Some thoughts on productivity and Greece Nikos Vettas Professor, Athens University of Economics and Business General Director, IOBE (vettas@iobe.gr, www.iobe.gr, http://www.aueb.gr/users/vettas) Bank of
Estimated Employment Multipliers for the City of Johannesburg
 Estimated Employment Multipliers for the City of Johannesburg Undertaken by Trade & Industrial Policy Strategies (TIPS) for The City of Johannesburg Metro 2015 Estimation of employment multipliers for
Nachhaltigkeit in der Wertschöpfungskette verankern Wie kommt das Thema CR in die Kernprozesse?
 Nachhaltigkeit in der Wertschöpfungskette verankern Wie kommt das Thema CR in die Kernprozesse? Andreas Streubig, Division Manager CR, Otto Group, Hamburg The Otto Group - 123 major companies in more than
Using databases from different data providers in parallel for a case study on light bulbs
 Using databases from different data providers in parallel for a case study on light bulbs Andreas Ciroth GreenDelta GmbH San Francisco, LCAXIV, Oct 8 2014 Using databases from different data providers
Appendix C: NACE keywords
 Merlin User Guide - updated 28 April 2015 Appendix C: NACE keywords The NACE keywords are structured into 21 main sectors listed alphabetically (A-U), which is broken down further by 88 sub-sectors and
ABN AMRO Group N.V. Overview total assets 2016
 ABN AMRO Group N.V. Overview total assets 06 This document provides an overview of ABN AMRO s balance sheet composition and loan portfolio in 06, as part of the bank s commitment to provide further transparency
The Game of Trading Jobs for Emissions
 The Game of Trading Jobs for Emissions I. Arto, J. M. Rueda-Cantuche, E. Dietzenbacher, V. Andreoni, I. Mongelli, A. Genty and A. Villanueva Groningen, April 24-26, 2012 Joint Research Centre The European
Factors affecting output and employment
 Table V 2. Factors affecting industry output and employment, 2004 14 111 Crop production Output is expected to grow more slowly than GDP. Employment is projected to fall as a result of increasing productivity,
ASSESSMENT OF BACKWARD AND FORWARD LINKAGES IN INDIAN ECONOMY: AN INPUT-OUTPUT BASED ANALYSIS
 CHAPTER 6 ASSESSMENT OF BACKWARD AND FORWARD LINKAGES IN INDIAN ECONOMY: AN INPUT-OUTPUT BASED ANALYSIS 6.1 Introduction Over the years the Indian economy has undergone a structural change in its sectoral
in Korean Industries ( ): Estimates from KIP Database
: Estimates from KIP Database") RIETI/G-COE Hi-Stat International Workshop on Establishing Industrial Productivity Database for China, India, Japan and Korea October 22, 2010, Tokyo The Productivity Performance in Korean Industries (1990-2008):
RIETI/G-COE Hi-Stat International Workshop on Establishing Industrial Productivity Database for China, India, Japan and Korea October 22, 2010, Tokyo The Productivity Performance in Korean Industries (1990-2008):
CONSUMER PRICE INDEX (BASE PERIOD NOVEMBER 2009 = 100)
") CONSUMER PRICE INDEX (BASE PERIOD NOVEMBER 2009 = 100) No. 559 October 2016 StatisticalNews BRIEF METHODOLOGY: The CPI measures the over time in prices of goods and services consumed by people for day-to-day
CONSUMER PRICE INDEX (BASE PERIOD NOVEMBER 2009 = 100) No. 559 October 2016 StatisticalNews BRIEF METHODOLOGY: The CPI measures the over time in prices of goods and services consumed by people for day-to-day
Economic Impacts. Refineries in Skagit County
 Economic Impacts of the Refineries in Skagit County February 13, 2015 Center for Economic and Business Research Prepared for the Economic Development Association of Skagit County Table of Contents Executive
The Gross National Product (GNP) is GDP added by net foreign income. National Income is GNP deducted by indirect net taxes (net) and depreciation.
 is GDP added by net foreign income. National Income is GNP deducted by indirect net taxes (net) and depreciation.") M E T A D A T A BASIC INFORMATION 1 Data Category : Gross Domestic Product (GDP) 2 Statistics Disseminator : Statistics Department, Bank Indonesia 3 Address : Jl. M.H. Thamrin No. 2 Jakarta 4 Contact :
M E T A D A T A BASIC INFORMATION 1 Data Category : Gross Domestic Product (GDP) 2 Statistics Disseminator : Statistics Department, Bank Indonesia 3 Address : Jl. M.H. Thamrin No. 2 Jakarta 4 Contact :
The annual variation of the Industrial Price Index stood at 2.8%, seven tenths below that registered in September
 24 November 2017 Industrial Price Index. Base 2010 October 2017. Provisional data The annual variation of the Industrial Price Index stood at 2.8%, seven tenths below that registered in September The monthly
Classification of Industry Group and Sector
 -1- Classification of Industry Group and Sector The classification of listed company s industry structure is to incorporate similar businesses into the same group, so as to provide appropriate investment
2. The Original Input-Output Table
 Sri Lanka Jeevika Weerahewa and Jayatilleke S. Bandara 1. Introduction The main purpose of this document is to briefly describe the process of incorporating the new Sri Lankan input-output (I-O) data base
Executive Summary Central region Number of establishments by division of industry manufacturing
 Executive Summary At present the structure of business trade, services and industrial activity, has changed dramatically. There are new kind of business in the economy, including the small scale industries
INTERNATIONAL TRADE REPORT ON ADRIATIC AND IONIAN AREA. STATISTICS DATA Update 2014
 INTERNATIONAL TRADE REPORT ON ADRIATIC AND IONIAN AREA STATISTICS DATA Update 2014 Ancona, May 2015 The aim of this work is to provide a contribution to identify the economic and commercial dimension of
ING loan portfolio overview
 ING loan portfolio overview As at 31 December 2016 All amounts x 1000 EUR Outstandings ACCOMMODATION AND FOOD SERVICE ACTIVITIES 3,409,643 Beverage serving activities 243,478 Camping grounds, recreational
LITHUANIA-DENMARK BILATERAL TRADE review
 LITHUANIA-DENMARK BILATERAL TRADE review Published: 01.08.2017 SUMMARY Denmark is one of the most important trade partners for Lithuania. In 2016 the trade turnover in goods between the two countries slightly
The Forward and Backward Linkage Effects of the Energy Sector in Turkey
 The Forward and Backward Linkage Effects of the Energy Sector in Turkey Mehmet MERCAN mmercan48@hotmail.com Abdullah ÖZDEMIR abdullahozdemir@hotmail.com Introduction Abstract: Energy sector has a great
Measuring Global Value Chains with. (World Input-Output Database)
") This project is funded by the European Commission, Research Directorate General as part of the 7th Framework Programme, Theme 8: Socio-Economic Sciences and Humanities. Grant Agreement no: 225 281 Measuring
This project is funded by the European Commission, Research Directorate General as part of the 7th Framework Programme, Theme 8: Socio-Economic Sciences and Humanities. Grant Agreement no: 225 281 Measuring
Energy and Resources-- Cuba
 Energy and Resources-- Cuba EarthTrends Country Profiles Energy Production and Consumption Cuba Central America & Caribbean World (in thousand metric tons of oil equivalent) {a} Total energy production,
Overview on NACE codes. Table of content
 IMP³rove European Innovation Management Academy Dreischeibenhaus 1 40211 Düsseldorf, Germany +49 211 1377 0 info@improve-innovation.de Overview on NACE codes This document provides you with an overview
CONSUMER PRICE INDEX (BASE PERIOD NOVEMBER 2009 = 100)
") CONSUMER PRICE INDEX (BASE PERIOD NOVEMBER 2009 = 100) No. 555 JUNE 2016 StatisticalNews BRIEF METHODOLOGY: The CPI measures the over time in prices of goods and services consumed by people for day-to-day
CONSUMER PRICE INDEX (BASE PERIOD NOVEMBER 2009 = 100) No. 555 JUNE 2016 StatisticalNews BRIEF METHODOLOGY: The CPI measures the over time in prices of goods and services consumed by people for day-to-day
European Union, Trade in goods with Thailand
 European Union, Trade in goods with Thailand Table of Contents pg - Key Figures 2 - / 2016 2 - - AMA/NAMA product Groups 2 - - SITC product Groups 2 - - Top 5 - HS sections 2 - - Top 5 - SITC sections
Balassa (1965) Comparative Advantage by Sector of Industry, Brazil
 Comparative Advantage by Sector of Industry, Brazil") Balassa (1965) Comparative Advantage by Sector of Industry, Brazil 1986-2001 Marc-Andreas Muendler University of California, San Diego August 17, 2007 This report describes the construction of a series
Balassa (1965) Comparative Advantage by Sector of Industry, Brazil 1986-2001 Marc-Andreas Muendler University of California, San Diego August 17, 2007 This report describes the construction of a series
Production & Turnover. 10/12/2017 Technology Industries of Finland
 Production & Turnover 10/12/2017 Technology Industries of Finland 1 Industrial Production Volume Around the World 10/12/2017 Technology Industries of Finland Annualized seasonally adjusted volume index
European Union, Trade in goods with Uganda
 European Union, Trade in goods with Uganda Table of Contents pg - Key Figures 2 - / 2017 2 - - AMA/NAMA product Groups 2 - - SITC product Groups 2 - - Top 5 - HS sections 2 - - Top 5 - SITC sections 2
Gross Domestic Product of Georgia in 2010
 Gross Domestic Product of Georgia in 2010 The real growth of Gross Domestic Product (GDP) of Georgia in 2010 amounted to 6.4 percent and deflator grew by 8.7 percent year-on-year. In the same period the
European Union, Trade in goods with MEDA (excluding EU) - (Mediterranean Countries In The Euro-Mediterranean Partnership)
 - (Mediterranean Countries In The Euro-Mediterranean Partnership)") European Union, Trade in goods with MEDA (excluding EU) - (Mediterranean Countries In The Euro- MEDA (excluding EU) - (Mediterranean Countries In The Euro- Albania, Algeria, Bosnia-Herzegovina, Egypt,
European Union, Trade in goods with MEDA (excluding EU) - (Mediterranean Countries In The Euro- MEDA (excluding EU) - (Mediterranean Countries In The Euro- Albania, Algeria, Bosnia-Herzegovina, Egypt,
CENSUS OF INDUSTRIAL PRODUCTION
 CENSUS OF INDUSTRIAL PRODUCTION TANZANIA MAINLAND 2013 SUMMARY REPORT Vision To become a one stop centre for official statistics in Tanzania Mission To produce quality official statistics and service that
SUB-SAHARAN AFRICA S EXPORT TRENDS AND THE EPAS
 SC/TDP/AN/EPA/28 Original: English SUB-SAHARAN AFRICA S EXPORT TRENDS AND THE EPAS EXECUTIVE SUMMARY Trade trends are changing quite rapidly for Africa. A careful analysis of Africa s export statistics
Central Bank of the Islamic Republic of Iran. Wholesale Price Index in Iran
 Central Bank of the Islamic Republic of Iran General Directorate of Economic Statistics Wholesale Price Index in Iran Mordad 1383 (July 22 - August 21, 2004) Monthly Report Economics Statistics Department
European Union, Trade in goods with South Korea
 European Union, Trade in goods with South Korea Table of Contents pg - Key Figures 2 - / 2016 2 - - AMA/NAMA product Groups 2 - - SITC product Groups 2 - - Top 5 - HS sections 2 - - Top 5 - SITC sections
Information was retrieved from CIA World Factbook in August https://www.cia.gov/library/publications/the-worldfactbook/index.
 Information was retrieved from CIA World Factbook in August 2013. https://www.cia.gov/library/publications/the-worldfactbook/index.html UK has a Mixed economic system. It s actually closer to a Market
Statistics on Environmental Accounts: Water Use by Industries
 Statistics on Environmental Accounts: Water Use by Industries 2006 Final Report to EUROSTAT Agreement No. ESTAT 200471401002 incl. Amendment No 1. - Action 2 - Statistics Norway, 31. May 2006 Project Leader:
Labour productivity growth and industry structure
 Johanna Sinkkonen Labour productivity growth and industry structure The impact of industry structure on productivity growth, export prices and labour compensation Bank of Finland Research Discussion Papers
International Recommendations for Energy Statistics. International Recommendations for Energy Statistics
 International Recommendations for Energy Statistics Environment and Energy Statistics Workshop for the Arab Region Amman, Jordan 8-12 September 2013 Environment and Energy Statistics Branch United Nations
Energy use in manufacturing 2015
 Energy 2016 Energy use in manufacturing 2015 Energy use in manufacturing diminished by 3 per cent in 2015 According to Statistics Finland, energy use in manufacturing decreased by three per cent from the
ENERGY BALANCE COMPILATION
 ENERGY BALANCE COMPILATION Study tour on Energy statistics and Energy balances under INOGATE programme Sofia, 5-7 November 2013 Maria Georgieva OVERVIEW INTRODUCTION DATA SOURCES FOR ENERGY BALANCES STRUCTURE
European Union, Trade in goods with ACP -- West Africa
 European Union, Trade in goods with ACP -- West Africa ACP -- West Africa Benin, Burkina Faso, Cape Verde, Gambia, Ghana, Guinea, Guinea Bissau, Ivory Coast, Liberia, Mali, Mauritania, Niger, Nigeria,
Map of proposed GRI Business Activity Groups to Industry Classification Benchmark (ICB)
") Additional information about the project can be found at https://www.globalreporting.org/reporting/sector-guidance/topics-research/pages/default.aspx Map of proposed GRI Business Activity Groups to Industry
Additional information about the project can be found at https://www.globalreporting.org/reporting/sector-guidance/topics-research/pages/default.aspx Map of proposed GRI Business Activity Groups to Industry
Map of proposed GRI Business Activity Groups to Global Industry Classification Standard (GICS)
") Additional information about the project can be found at https://www.globalreporting.org/reporting/sector-guidance/topics-research/pages/default.aspx Map of proposed GRI Business Activity Groups to Global
Additional information about the project can be found at https://www.globalreporting.org/reporting/sector-guidance/topics-research/pages/default.aspx Map of proposed GRI Business Activity Groups to Global
This note provides some measures of the economic importance of logistics and
 Activity in the Louisville Economy by Paul Coomes, Ph.D. Professor of Economics, and National City Research Fellow and Barry Kornstein Senior Research Analyst University of Louisville September 2003 This
Trade and employment linkages in Indonesian Agriculture
 Trade and employment linkages in Indonesian Agriculture David Vanzetti and Rina Oktaviani 1 Australian National University and Bogor Agricultural University Contributed paper at the 55th AARES Annual Conference,
ANNEX 3 RULES OF ORIGIN
 ANNEX 3 RULES OF ORIGIN In determining the origin of a good eligible for preferential tariff treatment pursuant to Article 5 of this Agreement, the following Rules shall apply: For the purposes of this
Definition: Refers to the industry in which the person s occupation lies.
 Definition: Refers to the industry in which the person s occupation lies. Source: Census Question The table below indicates, for each census year, the numbers of the census questions corresponding to this
Cornwall and the Isles of Scilly LEP REPORT
 Cornwall and the Isles of Scilly LEP REPORT Contents 3...Foreword 4...Overview of our region s economy 5...High level overview of our region s industries and occupations 6...What are our top industries?
The Heterogeneous Effects of Workplace Diversity on Wages and Productivity
 The Heterogeneous Effects of Workplace Diversity on Wages and Productivity Andrea Garnero ENS, Paris School of Economics and SBS-EM (DULBEA) François Rycx ULB, SBS-EM (CEB, DULBEA) and IZA IAB, Nuremberg
CITY OF CALERA BUSINESS LICENSE FEE CODE SCHEDULE **All licenses issued are required to pay a $10.00 issuance fee in addition to their license fee**
 CITY OF CALERA BUSINESS LICENSE FEE CODE SCHEDULE **All licenses issued are required to pay a $10.00 issuance fee in addition to their license fee** Code Description Schedule 111 Farming and Crop Production
Chapter 11 Industry and Energy
 Chapter 11 Industry and Energy Industry and Energy: Key Issues 1. Where Is Industry Distributed? 2. Why Are Situation and Site Factors Important? 3. Why Do Industries Face Resource Challenges? 4. Why Are
Kansas. Estimated Economic Impact of Agriculture, Food, and Food Processing Sectors 08/01/2017
 Estimated Economic of Agriculture, Food, and Food Processing Sectors 08/01/2017 Using the most recent IMPLAN data available (2015) adjusted for 2017, 65 agriculture, food, and food processing sectors were
MANUFACTURING IN IOWA
 MANUFACTURING IN IOWA NOVEMBER 2011 INSIDE: SECTOR SIZE 2 KEY INDUSTRIES EARNINGS 4 EXPORTS 5 JOB TRENDS 6 GDP TRENDS 7 COUNTY DEPENDENCE 3 8 OVERVIEW Iowa s competitive strengths in manufacturing emerged
Revenue Freight Traffic Statistics for the Major North American Railroads. Weekly Railroad Traffic
 Revenue Freight Traffic Statistics for the Major North American Railroads Weekly Railroad Traffic Week 26, Ended June 28, Notes 1. Traffic of Canadian railroads reflects their Canadian and U.S. operations,
Chicago s Manufacturing Base:
 CHICAGO S MANUFACTURING BASE: Chicago s Manufacturing Base: Chicago s manufacturing base is represented by companies that sell their goods outside of the region. By exporting, these manufacturers bring
Copyright: SFSO Neuchâtel 2002 Reproduction with mention of source authorized (except for commercial purposes)
") NOGA General Classification of Economic Activities Title Berne, 2002 Information: Esther Nagy, BFS Tel. ++41 32 713 66 72 / E-Mail: esther.nagy@bfs.admin.ch Jean Wiser, BFS Tel. ++41 32 713 67 92 / E-Mail:
NOGA General Classification of Economic Activities Title Berne, 2002 Information: Esther Nagy, BFS Tel. ++41 32 713 66 72 / E-Mail: esther.nagy@bfs.admin.ch Jean Wiser, BFS Tel. ++41 32 713 67 92 / E-Mail:
Consumer Price Index (CPI). Base 2011 December Monthly change Change over last December. December
. Base 2011 December Monthly change Change over last December. December") 15 January 2014 Consumer Price Index (CPI). Base 2011 2013 all index Monthly change Change over last Annual change 0.1 Main results The annual change of the CPI for the month of stands at %, tenth over
15 January 2014 Consumer Price Index (CPI). Base 2011 2013 all index Monthly change Change over last Annual change 0.1 Main results The annual change of the CPI for the month of stands at %, tenth over
Guidance note I Result Indicator Fiches
 Guidance note I Result Indicator Fiches This guidance note presents a fiche for each result in the CMEF. Each fiche contains the following elements: Type of Measure Code Definition of the Subdivision Unit
INTERNATIONAL RECOMMENDATIONS FOR INDUSTRIAL STATISTICS 2008
 Statistical Commission Thirty-ninth session 26-29 February 2008 Item 3 (h) of the provisional agenda Background document Available in English only Items for discussion and decision: Industrial statistics
Peneliti Ekonomi di Grup Riset Ekonomi (GRE), Direktorat Riset Ekonomi dan Kebijakan Moneter (DKM), Bank Indonesia. Pandangan dalam paper ini
, Direktorat Riset Ekonomi dan Kebijakan Moneter (DKM), Bank Indonesia. Pandangan dalam paper ini") 1 Peneliti Ekonomi di Grup Riset Ekonomi (GRE), Direktorat Riset Ekonomi dan Kebijakan Moneter (DKM), Bank Indonesia. Pandangan dalam paper ini merupakan pandangan penulis dan tidak semata-mata merefleksikan
1 Peneliti Ekonomi di Grup Riset Ekonomi (GRE), Direktorat Riset Ekonomi dan Kebijakan Moneter (DKM), Bank Indonesia. Pandangan dalam paper ini merupakan pandangan penulis dan tidak semata-mata merefleksikan
Technical Note: Global Industry Classification Standards (GICS)
") Technical Note: Global Industry Classification Standards (GICS) 1 The Global Industry Classification Standard structure consists of 10 sectors, 24 industry groups, 68 industries and 154 sub-industries.
Technical Note: Global Industry Classification Standards (GICS) 1 The Global Industry Classification Standard structure consists of 10 sectors, 24 industry groups, 68 industries and 154 sub-industries.
A Look Into 2017 Vertical Markets and SMBs: IDC European Vertical Markets Survey Methodology, 2016
 Industry Developments and Models A Look Into 2017 Vertical Markets and SMBs: IDC European Vertical Markets Survey Methodology, 2016 Giacomo Laurini IDC OPINION Between July and October 2016, the IDC European
Life Cycle Costing and calculation of Value Added in openlca
 Life Cycle Costing and calculation of Value Added in openlca Version: openlca 1.5.0 Datum: 3 March 2016 Author: Andreas Ciroth GreenDelta GmbH, Müllerstrasse 135, 13349 Berlin, Germany; gd@greendelta.com
Working Party on the Information Economy
 Unclassified DSTI/ICCP/IE(2004)10/FINAL DSTI/ICCP/IE(2004)10/FINAL Unclassified Organisation de Coopération et de Développement Economiques Organisation for Economic Co-operation and Development 22-Apr-2005
Sample. Copyright Pearson Education. PART 1 Production. Chapter 16: The factors of production and productivity SECTION B: BUSINESS ECONOMICS
 SECTION B: BUSINESS ECONOMICS PART 1 Chapter The factors 16: of The production factors of and production productivity and productivity PART 1 Production Chapter 16: The factors of production and productivity
Policy Brief Does Import Protection Save Jobs?
 Policy Brief Does Import Protection Save Jobs? The Estimated Impacts of Proposed Tariffs on Imports of U.S. Steel and Aluminum March 5, 018 THE TRADE PARTNERSHIP www.tradepartnership.com By Dr. Joseph
Regional Workshop on Measuring the Informal Sector and the Non-Observed Economy 4 7 October 2015 Tehran NON OBSERVED ECONOMY IN NATIONAL ACCOUNTS
 Regional Workshop on Measuring the Informal Sector and the Non-Observed Economy 4 7 October 2015 Tehran NON OBSERVED ECONOMY IN NATIONAL ACCOUNTS Bengi YOSUNKAYA (Annual Accounts Group) 1 Content Introduction
# Group STT COMPANY / ORGAN BUSINESS SCOPES / OBLIGATIONS. Vietnam Chamber of Commerce and Industry
 # STT COMPANY / ORGAN BUSINESS SCOPES / OBLIGATIONS 1 Vietnam Chamber of Commerce and Industry www.vcci.com.vn E-commerce, Business training programs, Trade & Investment promotion, Linking enterprises
Unit 4. The secondary sector 1. The secondary sector - Industry is the activity that transforms raw materials into manufactured products.
 Unit 4. The secondary sector 1. The secondary sector - Industry is the activity that transforms raw materials into manufactured products. Industry requires raw materials, energy sources (provide the force)
Greater Cambridge/Greater Peterborough LEP REPORT
 Greater Cambridge/Greater Peterborough LEP REPORT Contents 3...Foreword 4...Overview of our region s economy 5...High level overview of our region s industries and occupations 6...What are our top industries?
Social Life cycle Metrics
 The World Business Council for Sustainable Development Social Life cycle Metrics for Chemical Products in their Applications DRAFT VERSION June 22 nd, 2016 Andrea Brown, brown@wbcsd.org 1 What is the Social