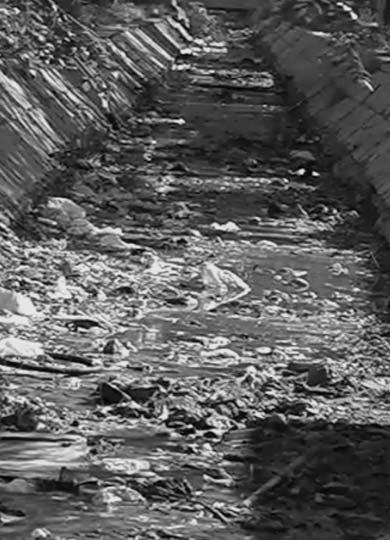
NON-HEALTH IMPACT OF WATER POLLUTION
|
|
|
- Merilyn Morton
- 6 years ago
- Views:
Transcription

1 NON-HEALTH IMPACT OF WATER POLLUTION 5
2
3 Water Scarcity and Pollution 5.1 Water scarcity is most prevalent in northern China. High pollution in this region exacerbates water scarcity. Polluted water is held back from supply and becomes a source of water scarcity. However, some water is allowed in the supply despite being too polluted; in such a case, pollution becomes a consequence of water scarcity. Groundwater depletion is a partly overlapping consequence of water scarcity that also creates a major environmental problem in China. We found that between 2000 and 2003 polluted water supply constituted about 47 billion cubic meters of water while polluted water held back from supply constituted about 25 billion cubic meters. Groundwater depletion constituted about 24 billion cubic meters. The economic cost of the pollutionrelated sources of water scarcity is estimated to be 147 billion RMB yuan, with a 95 percent confidence interval relative to uncertainty in valuation of 95 and 199 billion RMB. The cost of groundwater depletion comes at a further 92 billion RMB. Water scarcity is predominantly an issue in northern China. While most of China s water resources are in the south, the greatest need for these resources is in the northern and eastern part of the country, where most of the people live. The four northern river basins contain less than 20 percent of national water resources, but account for two-thirds of the farmland and 45 percent of GDP. By contrast, the southwestern areas contain slightly more water resources (21.3 percent), but account for only 8.3 percent of GDP. 1 The concentration of people and economic activity leads to water scarcity. Water scarcity has a number of different definitions. The United Nations Environment Programme (UNEP) defines it as a state in which the amount of water withdrawn from lakes, rivers or groundwater is so great that water supplies are no longer adequate to satisfy all human or ecosystem requirements, bringing about increased competition among potential demands. ( The statement invites an interpretation in which there is a deficit of water: water withdrawn is larger than supply, which is no longer adequate. An economist, on the other hand, would routinely define water scarcity as a situation in which demand for water, or water withdrawn, exceeds supply at a price of zero. This means that the available water is not sufficient for everybody to meet their needs at no financial cost. The economist s definition is echoed in part of the UNEP definition regarding competition among potential demands. In the absence of sufficient quantities, there must be competition between demands and an associated opportunity cost as reflected by the price of water. In this chapter, we define water scarcity as a state in which available water resources per capita fall (far) below sustainable levels. Under such circumstances, there is a competition among potential demands and not all human and ecosystem requirements are met, as suggested by the UNEP definition. There is also a real risk that water supplies are no longer adequate to meet demand, and there is insufficient capacity to satisfy everyone s needs at a price of zero, as suggested by the economist s definition. CHINA ENVIRONMENTAL COST OF POLLUTION 81
4 WATER SCARCITY AND POLLUTION A combination of historical and contemporary trends can explain water scarcity in China s north and east. For various historical reasons, people have settled and prospered in the northern and eastern parts of the country, despite the low water resources, so contemporary China has inherited relatively high population density in these regions. Recent population growth and high economic growth have further increased the demand for water, while pollution of water basins as well as technical deficiencies in the water supply facilties, such as leaky pipes and canal, have reduced available water resources. In this chapter, we are focusing on pollution as a cause of water scarcity. We attempt to estimate the economic costs that arise from the inability to make productive use of polluted water. In addition, we seek to identify environmentally unsustainable responses to water scarcity. In China, about 10 percent of the current water supply is too polluted to be usable. Pollution, therefore, increases the volume of water that is held back from use, but some of this water is supplied despite pollution, which also has a high economic cost. Industry and agriculture are the largest consumers of polluted water, despite fairly lax standards for what passes as acceptable water. We also attempted to estimate the environmental cost of consumption of such highly polluted water. In addition to pollution in the sense of not meeting the standards, there is also an issue of water that passes as acceptable but is fairly dirty. We do not attempt to estimate the environmental cost of that water. Water scarcity in China also leads to depletion of groundwater resources. Depletion of groundwater resources, particularly deep aquifers, is another environmentally unsustainable response and adds to China s environmental costs. In some areas of China, the groundwater table has fallen more than 50 meters since 1960, and it continues to fall two meters annually. Groundwater depletion is, to some extent, linked to the pollution problem. In several provinces, like in the lower reaches of the Yangtze, polluted water is withheld at the expense of more groundwater depletion. Furthermore, groundwater itself is often polluted by both natural and anthropogenic sources. An investigation of drinking water in 118 cities carried out by the Ministry of Water Resources (MWR) found that groundwater was polluted to varying degrees in 97 percent of the cities. Figure 4.6 shows that the two main groundwater pollutants are arsenic and fluoride. We sought to estimate the cost of groundwater pollution as a way of estimating pollution as a source of water scarcity. We also estimated total groundwater depletion, because it is a serious environmental problem and the method for separating out pollution related to groundwater depletion has some uncertainties. The cost of total groundwater depletion is not added to the total environmental cost estimate, but is available as stand-alone information. WATER RESOURCES IN CHINA To understand the nature of water scarcity in China, it is useful to begin with a survey of available, rechargeable water resources. A common indicator is the water crowding index of population per million cubic meters per year. Here we use the inverse measure of cubic meters per person. Levels of 1,000 1,700 cubic meters per person indicate water stress, and less than 1,000 cubic meters per person indicates extreme water scarcity (Vörösmarty et al. 2006; Falkenmark 1997). Figure 5.1, with data from NBS (2004), shows that in six provinces in China, per capita water resources fall below 500 cubic meters. 2 In a further five provinces, water resources falls below 1,000 cubic meters, meaning that one-third of China s provinces qualify for extreme and more than extreme water scarcity. 3 Available resources depend on precipitation. Data for water resources are from 2003, which was an average year in terms of water resources nationwide. 4 The figure shows that per capita water resources are lowest in the Huang-Huai-Hai river 82 CHINA ENVIRONMENTAL COST OF POLLUTION
5 WATER SCARCITY AND POLLUTION FIGURE 5.1 Per Capita Water Resources in China in 2003 N W E S Kilometers per capita water resources (cu.m/person) < >1700 basins, especially the lower reaches. The lower reaches of the Huang River, also called the Yellow River, used to dry up until the construction of the Xiaolangdi Dam (Berkoff 2003). The middle reaches of the Huang River have also experienced dry spells (Zhu 2006). The middle and lower reaches of some tributaries of the Hai River tend to be dry all year round. On the other hand, several provinces in southwestern China have abundant water resources, including Yunnan, Qinghai, and Tibet. The Yangtze River (Changjiang), Pearl River, and the rivers in the east and south together have 80 percent of the water resources of China (see Table 5.1) (MWR 2005a). The average per capita water resources for all of China was 2,131 cubic meters in The scarcity of water resources in the Huang- Huai-Hai is particularly pressing in dry years. The Hai and Huai flows fall to 70 percent of average in one year in four and to 50 percent one year in twenty (Berkoff 2003). Dry years tend to come in succession, accentuating the problem. POLLUTION AS A SOURCE OF WATER SCARCITY As discussed in chapter 3, the most polluted water basins in China are located in the northern and eastern parts of the country in the same regions that have low water resources per capita. Since water is polluted, less is available for consumption in households, industries and agriculture, which further exacerbates the serious water scarcity situation. The decrease in water consumption below levels needed by households, industries and agriculture, called repressed demand, is one possible impact of low water resource availability. Another impact may be increased groundwater depletion, which may happen if water authorities consider it a priority to maintain water supply. Increased reliance on groundwater is also the decentralized response of farmers, who may dig wells when they are not allowed surface water for irrigation. Anecdotal evidence and the expert opinion of MWR suggest that groundwater depletion is in CHINA ENVIRONMENTAL COST OF POLLUTION 83
6 WATER SCARCITY AND POLLUTION TABLE 5.1 The Quantity of Water Resources in China, Average Shallow Rechargeable Non-Overlapping Water Resource Precipitation Surface Water Groundwater Quantity Total Region (I class) (billion m 3 ) (billion m 3 ) (billion m 3 ) (billion m 3 ) (billion m 3 ) Songhuajiang River Liaohe River Haihe River Yellow River Huaihe River Changjiang River Southeast rivers Pearls River Southwest rivers Northwest rivers Total Source: Ministry of Water Resources. fact a common alternative to polluted surface water. There are no readily available statistics on polluted water that is held back from water supply in China. To estimate the amount of water held back, we rely on the assumption that groundwater depletion and repressed demand are the two responses to holding back water. See Box 5.1 for details about the method. Table 5.2 presents the estimate of nonsupplied polluted water by province. Hebei Province and Shandong Province are estimated to have the largest volume of non-supplied polluted water. Ningxia Autonomous Region and Shanghai both have zero non-supplied polluted water. The reasons are rather different, however. In Ningxia, the situation is so tight that all available water resources, including all available polluted resources, are used in supply. In Shanghai, the supply of water is greater than demand for water, and there is no recorded depletion of groundwater. Shanghai s situation should probably be viewed in the context of neighboring Jiangsu Province, which has the third highest non-supplied polluted water volume in the country. Jiangsu Province is the home of the lower reaches of the Yangtze, mentioned in the introduction as an area where groundwater depletion substitutes for polluted water. IMPACT OF WATER SCARCITY: WATER POLLUTION IN SUPPLY Water scarcity has led China to make use of excessive amounts of polluted water in its water supply. Polluted water is supplied to households, industry and, in particular, agriculture. Water for households and industry is in most cases treated before consumption. Impacts of household consumption of polluted water are discussed in chapter 3. Impacts of wastewater irrigation are discussed in this chapter. Impacts on industries include lower product quality and production stoppages. For instance, a report by Chang, Seip, and Vennemo (2001) from a Chongqing silk production plant found that the raw silk became yellow when polluted water was used, and its quality fell from 5A to 3A or 2A. Another silk production plant and a fertilizer plant were forced to stop production. This chapter provides a comprehensive picture of the extent of polluted water in supply. 84 CHINA ENVIRONMENTAL COST OF POLLUTION
7 WATER SCARCITY AND POLLUTION BOX 5.1 Constructing an Estimate of Polluted Water Held Back from Supply We distinguish between water-scarce water basins on the one hand, and water-abundant water basins on the other. Water-scarce areas not only have little water resources per capita the indicator we emphasized above but also have high consumption rates relative to their water resources. In the literature, a consumption rate of percent is considered medium to high (World Meteorological Organisation 1997; Vörösmarty et al. 2006). We define a water-scarce basin in China as one in which the consumption rate is above 40 percent. We made separate calculations for each of the 73 water basins and provinces distinguished by MWR. In water-scarce basins, we assume that the quantity of polluted water that is held back equals either the quantity of depleted groundwater or a measure of repressed demand, whichever is largest, times the share of polluted water in the water resource. This share is defined as the share of water of quality IV and worse. That is, all water that is unsuitable for bodily contact is considered polluted. To measure the share, we take the weighted sum of river sections in which measured water is polluted divided by the total weighted sum. The weights are the lengths of the river sections. In effect then, the shares give polluted water in the rivers and basins measured by length. In symbols: (1) PW αmax G, RD = ( ) In this equation, PW represents polluted water that is withheld, G is groundwater depletion, RD is repressed demand, and α is the share of polluted water in the resource. The idea here is that the more pollution there is in the resource, the greater is the share of groundwater depletion or repressed demand that can be attributed to non-supplied polluted water. If the share is zero, then none of the (presumably low) amount of water depletion or repressed demand should be attributed to pollution. If the share is one, then all water depletion or repressed demand should be attributed to pollution. Repressed demand is calculated as the difference between notional demand, which is a planning indicator of MWR, and sustainable supply; that is, current supply excluding groundwater depletion and supply of polluted water. For example, in Shanxi Province repressed demand is estimated to 0.76 billion cubic meters. That is larger than the volume of groundwater depletion, estimated at 0.54 billion cubic meters. In Shanxi Province, the share of polluted water is 71 percent. Polluted non-supplied water is estimated to be 71 percent of 0.76 billion cubic meters, or 0.54 billion cubic meters. By coincidence, that number corresponds to the volume of groundwater depletion. That is not the case in all provinces. There is one exception to equation (1). It is possible to estimate how much water is withheld in a water basin in total. If that volume is lower than the estimate coming out of equation (1), there is obviously a problem with the estimate from equation (1). The volume of polluted water that is held back cannot be higher than the volume of all water that is held back. To eliminate this possibility, we assume that when the total volume is lower than the largest of groundwater depletion and repressed demand, then polluted withheld water equals total available water times the polluted share. In symbols ( 2) PW αtw, TW max G, RD = ( ) It is a complicated matter to estimate TW, available total water. First, we calculate the total amount of polluted water in the resource, using estimates of the total surface water resource (the basis for the 40 percent or more consumption rates) and the polluted share. From this volume, we subtract the amount of polluted water that is supplied. In some basins, there is also some residual clean water not supplied, which is added to the total resource. The net result of these operations is the estimate of available total water TW in a water basin. For example, in Tianjin the available total water is estimated to be billion cubic meters. That is slightly lower than either repressed demand or groundwater depletion, which both amount to about billion cubic meters. The estimate of in available total water equals (continued) CHINA ENVIRONMENTAL COST OF POLLUTION 85
8 WATER SCARCITY AND POLLUTION BOX 5.1 Constructing an Estimate of Polluted Water Held Back from Supply (Continued) the total surface water resource of 1.1 billion cubic meters times a polluted share of 86 percent. From this number is subtracted the amount of polluted water that is supplied, which is as high as billion cubic meters (see Table 5.). There is no surplus clean water in Tianjin. With as the estimate of total available water in Tianjin, we use equation (2) and estimate polluted withheld water to be 86 percent of billion cubic meters, which is 0.18 billion cubic meters. Equations (1) and (2) apply to river basins in which consumption is 40 percent or more of the rechargeable resource. When consumption is lower than 40 percent, there is no resource-oriented reason for groundwater depletion. The expert judgment of MWR and SEPA is that in river basins of less than 40 percent consumption, the reason for groundwater depletion is that available resources are too polluted for use. There is normally no repressed demand in these river basins. Accordingly, we assume that in these basins non-supplied polluted water equals water depletion. In symbols ( 3) PW = G, consumption 40% Fifteen southern provinces including Jiangsu, Sichuan, and Guangdong are in a situation where consumption is lower than 40 percent. The procedure to estimate non-supplied polluted water relies on a number of untested assumptions. Yet SEPA and MWR consider that it gives a rough indication of non-supplied polluted water in China. By polluted water in supply, we refer to water that exceeds the water quality standard relevant for the purpose. Polluted water for households refers to water worse than class III supplied (after treatment) to households; polluted water for industrial purposes refers to water worse than class IV supplied (after treatment) to industry; and polluted water for agricultural purposes refers to water worse than class V supplied to agriculture. Figure 5.2 shows the volume of water supply (in millions of cubic meters) that does not meet supply standards for each province. The map was produced using MWR survey data from 2000 to The multiyear coverage allows us to account for annual variations due to rainfall and other factors. The map shows significant correlation with the map of water resources. For instance, Ningxia and Shanghai are the provinces in the country with the lowest per capita water resources in Ningxia, Jiangsu, and Heilongjiang are the provinces with the largest supply of polluted water (9.5 billion cubic meters in Jiangsu, 4.0 in Heilongjiang and Ningxia). Note that the correlation is specified between a per capita measure and an aggregate measure. The amount of pollution in Ningxia is particularly remarkable, since it has a very small population. Jiangsu is situated in the lower reaches of the Yangtze River. On its border is the final destination of the Huai River, which never reaches the sea. Ningxia is in the upper reaches of the Huang (Yellow) River. While the correlation is striking, there are also differences with the map of water resources per capita. Supplies of polluted water in the Hebei-Beijing-Tianjin area are large, but relative to other provinces the situation is better than it is in terms of water resources. Heilongjiang Province, by contrast, has a serious problem with the supply of polluted water compared to its water resources. Altogether, close to 50 billion cubic meters of water that did not meet the pollution standard were supplied annually during the period. This figure is close to 10 percent of average national water consumption in the period, which was 566 billion cubic meters. 86 CHINA ENVIRONMENTAL COST OF POLLUTION
9 WATER SCARCITY AND POLLUTION TABLE 5.2 Non-Supplied Polluted Water by Province Polluted, Non-Supplied Water Province (million m 3 ) Beijing Tianjin Hebei 3,618.7 Shanxi Inner Mongolia 2,498.1 Liaoning Jilin Heilongjiang Shanghai 0.0 Jiangsu 2,165.8 Zhejiang Anhui 1,647.7 Fujian Jiangxi Shandong 2,716.9 Henan 1,991.4 Hubei Hunan Guangdong 1,083.9 Guangxi Hainan Chongqing Sichuan Guizhou Yunnan 1,058.1 Tibet Shaanxi Gansu Qinghai 32.0 Ningxia 0.0 Xinjiang Total 24,762.4 Source: Authors Calculation. Note: Polluted water is water of class IV or worse. A breakdown of polluted water supply by consumption sector shows agriculture receiving two-thirds of the water, and industry receiving 20 percent. The ratios differ by province. In the two high consumption provinces of Jiangsu and Ningxia autonomous region, agricultural consumption constitutes 62 percent and 98 percent (respectively) of all consumption. In Ningxia, it has been reported that a local tradition of applying sediments as fertilizer encourages excessive use of irrigation water (Yang, Zhang, and Zehnder 2003). Pollution of irrigation water is related to about 62 billion cubic meters of sewage in China in 2000 (MWR, 2000), of which only 24 percent was treated up to standard. IMPACT OF WATER SCARCITY: DEPLETION OF GROUNDWATER Water scarcity has forced China to rely increasingly on groundwater, which has led to depletion of groundwater reservoirs. It is useful to distinguish between rechargeable groundwater in the shallow freshwater aquifer (phreatic water), and non-rechargeable groundwater in the deep freshwater aquifer (confined water). Shallow groundwater recharges from, and/or discharges to, precipitation and surface water flows; for example, compare the columns shallow rechargeable groundwater and non-overlapping quantity in Table 5.1. Depletion of shallow groundwater occurs when consumption exceeds sustainable levels. Deep groundwater recharges/discharges extremely slowly. Replenishment rates can be in the order of thousands of years. Depleting deep groundwater is similar to mining a nonrenewable resource. Depletion of groundwater may have serious consequences for the environment. One is salinity intrusion, as declining groundwater resources are substituted by brackish water that often lies between the shallow and deep groundwater tables. Salinity intrusion is also caused by seawater intruding from the outside. Land subsidence following compaction of the geological formation containing groundwater (so-called aquitard) is another unfortunate consequence of groundwater depletion. In China, salinity intrusion is a chronic problem, such as in the Hai River Basin (Zhu 2006). In some locations, intrusion of brackish water has been monitored at a rate of meters per year for the past 20 years (Foster et al. 2004). In turn, salinity intrusion poses problems for the waterworks and for human CHINA ENVIRONMENTAL COST OF POLLUTION 87
10 WATER SCARCITY AND POLLUTION FIGURE 5.2 Polluted Water in Supply in China N W E S water supply not meeting standard > Kilometers Source: Ministry of Water Resources and agricultural use. A recent episode of this kind occurred in the Pearl River delta in the south. MWR (2005) reports that in , following a period of 30 percent lower precipitation than normal, the Pearl River delta suffered a case of severe salinity intrusion. The salinity intrusion restricted operation of the waterworks of Pearl River and Macao for 170 continuous days. More than 5 million people, as well as industries and agriculture, were affected to varying degrees. Both for natural and man-made reasons, the quality of groundwater often is poor. An investigation of drinking water in 118 cities carried out by MWR found that groundwater was polluted to varying degrees in 97 percent of the cities. In 64 percent of cities, groundwater was seriously polluted. Data from MWR indicates that in 30 percent of the area supplied by groundwater, people should not use the water for drinking purposes. 5 This area contains a disproportionate number of cities. In a further 30 percent of the area, groundwater needs to undergo water treatment. 6 Besides the environmental aspects, groundwater depletion carries an economic cost. As the groundwater table falls, the cost of pumping it becomes high, especially for agricultural purposes. Figure 5.3 shows groundwater depletion by province in the period and refers to the survey of MWR mentioned above. The figure refers to depletion of shallow and deep groundwater in total. The figure shows that depletion of groundwater extends from the Huang-Huai-Hai plain to almost every province in the north, including heavy depletion in Inner Mongolia, and substantial depletion in Xinjiang. It reinforces the message that the north and east have the most serious problems of water scarcity and are the main source of water depletion. Particular problems are evident in Hebei Province and surrounding provinces, most of which belong to the Huang-Huai-Haiplain. In Hebei, 6 billion cubic meters of groundwater were depleted annually in Zhu (2006) comments that part of the aquifer in 88 CHINA ENVIRONMENTAL COST OF POLLUTION
11 WATER SCARCITY AND POLLUTION TABLE 5.3 Supply of Surface Water that Does Not Meet Pollution Standards (10 6 m 3 ) Urban Rural Large Other Domestic Domestic Industrial Irrigation Agricultural Surface Province Use Use Use Use Use Total Beijing Tianjin Hebei Shanxi Inner Mongolia Liaoning Jilin Hailongjiang Shanghai Jiangsu Zhejiang Anhui Fujian Jiagxi Shandong Henan Hubei Hunan Guangdong Guangxi Hainan Chongqing Sichuang Guizhou Yunnan Tibet Shaanxi Gansu Qinghai Ningxia Xinjiang Total Source: Authors calculation. Hebei and Beijing are nearly dried up, and in other parts the groundwater table is sinking 3 5 meters annually. In most of the Huang-Huai- Hai plain, the groundwater table has dropped. The drop is 2 3 meters in some areas and as much as meters in others. Foster et al. (2004) state that in rural areas of the Huang-Huai-Hai plain an average value for deep aquifer groundwater-level decline of more than 3 m/year during the period has now reduced to 2 m/year. Compounded over 35 years, this implies a deep-aquifer depletion of more than 50 meters. Table 5.4 indicates amounts of annual groundwater depletion in between provinces, as well as its distribution between urban and rural households, industry, and agriculture. Groundwater depletion totaled 24 billion cubic meters. As can be seen from the table, a common use of groundwater is for irrigation of agriculture. In fact, 74 percent of all groundwater depletion is for agricultural purposes. In many areas irrigated by CHINA ENVIRONMENTAL COST OF POLLUTION 89
12 WATER SCARCITY AND POLLUTION FIGURE 5.3 Groundwater Depletion by Province (million cubic meters) N groundwater depletion (million cubic meters) >3000 Source: Ministry of Water Resources groundwater, each pump serves only a small number of farmers (Yang, Zhang, and Zehnder 2003). It is a sign both of the strain on water resources and of the spread of groundwater depletion that in 1997 alone, 221,000 wells were drilled on the Huang-Huai-Hai plain, while 100,000 wells were deserted. In Beijing and Tianjin, the numbers of newly drilled wells were outstripped by those deserted (Yang and Zehnder 2001). THE ENVIRONMENTAL COST OF WATER SCARCITY We have found that approximately 25 billion cubic meters of polluted water in China is held back from water consumption, contributing to problems of repressed demand and groundwater depletion. As much as 47 billion cubic meters of water that does not meet quality standards is nevertheless supplied to households, industry, and agriculture. A further 24 billion cubic meters of water beyond rechargeable quantities is extracted from wells and creates groundwater depletion. Although there are some overlaps, close to 100 billion cubic meters of water in China is affected by pollution and other environmental stress. By comparison, the total supply of water in China is approximately 550 billion cubic meters (NBS 2006). Most experts agree that water scarcity substantially restricts economic development. According to Zhu (2006), water scarcity becomes an obstacle for the enhancement of people s living standard as well as construction and development of big water-consuming industrial enterprises. Furthermore, water scarcity restricts agricul- 90 CHINA ENVIRONMENTAL COST OF POLLUTION
13 WATER SCARCITY AND POLLUTION TABLE 5.4 Depletion of Groundwater (10 6 m 3 ) Depletion of Groundwater Quantity Urban Rural Province Domestic Domestic Industrial Irrigation Total Beijing Tianjin Hebei Shanxi Inner Mongolia Liaoning Jilin Heilongjiang Shanghai Jiangsu Zhejiang Anhui Fujian Jiangxi Shandong Henan Hubei Hunan Guangdong Guangxi Hainan Chongqing Sichuang Guizhou Yunnan Tibet Shanxi Gansu Qinghai Ningxia Xinjiang Sum Source: Authors Calculation. tural development in North China and threatens food safety. Another impact of water scarcity is to increase the frequency and force of droughts. Droughts lead to economic loss and human strain. In 2004, for example, 218 million mu of cropland were damaged by drought, causing 19.9 million tons of damage to grain production and an economic loss of 24.7 billion yuan. As a result of this drought, 23.4 million people were left temporarily without drinking water supply (MWR, 2004). According to MWR, more severe droughts had preceded the one in Taking arguments like these forward, several authors have tried to systematically assess the value of water in China. Box 5.2 describes some of these efforts. Our conclusion from going through the evidence is that generally 1 5 RMB yuan per cubic meter seems a fair value for water in China. To be more concrete, one should consider what would have happened to the water if the environmental problem was not there. In terms of polluted water held back from supply, the value of marginal water seems a reasonable indicator. To value this water, we use the paper of He and Chen (2005), which besides producing estimates that are a priori reasonable compared with other sources, is a recent and comprehensive attempt. Given the rapid economic growth in China, value added per unit of water increases considerably year by year. Recall, for instance, the increase over time in agricultural output per unit of water. It is, therefore, particularly important to use a recent estimate. 7 To value polluted water that is included in supply, we could in principle also use the estimates of He and Chen (2005). However, polluted water used for irrigation purposes in agriculture, particularly in so-called wastewater irrigation zones, is discussed later in this chapter. To avoid overlap, we focus on polluted supply for households and for industry, which amount together to around 17 billion cubic meters. This water needs treatment before consumption, and the cost of treatment is part of the environmental cost. Other costs related to polluted supply for households, including health costs, are discussed in chapter 4. Costs to industry in addition to treatment, such as halts in production, are not included. Groundwater depletion can ideally be valued by its environmental effects. As noted above, CHINA ENVIRONMENTAL COST OF POLLUTION 91
14 WATER SCARCITY AND POLLUTION BOX 5.2 Efforts to Value Water in China Relevant for Water Scarcity Efforts to estimate the value of water relevant for water scarcity usually follow one of two approaches. One approach is to estimate the value of marginal water. Estimating the value of marginal water means finding the economic value added if a little extra water were available in the economy or the value deducted if a little less water were available. Using this approach and a so-called computable general equilibrium model, He and Chen (2005) find that a cubic meter of water adds between 2.1 and 5.2 RMB yuan of value. The value differs between water basins. The highest values are obtained in the Huang-Huai-Hai basins, which is reasonable, since these are the most water scarce basins. By comparison, an earlier paper by Liu and Chen (2003) uses a linear programming model and 1999 data to find that water for industrial purposes adds between 0.12 and 9.07 RMB yuan per cubic meter between provinces. The highest value is obtained for Ningxia Province. Several authors use the marginal value method in an informal way. Foster et al. (2004) argue that agricultural irrigation is the marginal use of water on the Huang-Huai-Hai plain. It is the sector that accommodates additional water (rainfall) and the sector that suffers during droughts. It is also the sector that would notice the shortfall if groundwater depletion was disallowed. The main crop affected by water scarcity is winter wheat. Liu and He (1996) report that on the Huang-Huai-Hai plain, 1.2 kg of wheat is grown per cubic meter of water (cited in Yang and Zehnder 2001). Jia and Liu (2000) estimate that in Shaanxi Province the figure is 1.3 kg, and increasing. (Their estimate for 1981 is 0.6 kg). Other authors, including Foster et al., use a somewhat lower number. With a national wholesale price of wheat of 1.15 RMB yuan/kg (see chapter 6 on wastewater irrigation), the implied value of water is currently approximately one RMB yuan per cubic meter, but as mentioned earlier, this estimate depends on irrigation of winter wheat being the marginal use of water. The marginal value of water can also be indicated by its price. It is likely that water is purchased to the extent that the value of water to the consumer is at least as high as the price; that is, the marginal value of water equals the price. With repressed demand, however, the marginal value is probably higher than the price. Increasing water prices is, therefore, included in MWR s strategy for a water-saving society. Currently the average price of water in China s 36 major large and medium-sized cities is 2.1 RMB yuan per cubic meter (MWR 2006). This price refers to urban and domestic use. Prices have recently increased 10 percent annually, and will have to increase even more to make a serious impact on water consumption. Still, 2.1 RMB yuan is an estimate of the value of water from the side of the price. Of course, in some circumstances water has a much higher price up to 2 RMB yuan per liter for bottled drinking water. However, in such cases the circumstance and packaging is part of the product. Another main approach to valuation of water is estimating the cost of current mitigation measures. While in some cases estimating environmental cost via the cost of mitigation contains an element of circular reasoning, it is in other cases a useful measure of the political willingness to pay, or valuation of water. Other things being equal, it is the approved mitigation measures with the highest cost that come the closest to expressing a political valuation for water. A main element in China s strategy to end groundwater depletion is the South-North Water Diversion Project, which will transfer water from the Yangtze River to the Huang-Huai-Hai basin. The project will move up to 45 billion cubic meters annually to the basin. That number equals half of current water scarcity as estimated by this chapter. Water demand in China is likely to be significantly higher upon completion of the project (around 2050) than it is now. Still the project indicates a Chinese willingness to reduce and perhaps end pollution-related problems of water scarcity. The investment cost of the South-North Water Diversion Project is tentatively set at RMB yuan 486 billion, but after two years of investment it faced a 20 percent cost overrun (China Daily 2004). Ignoring cost overruns, Berkoff (2003) finds that the implied annual value of water is RMB yuan per cubic meter. Allowing 20 percent higher investment cost increases these numbers to ; adding in RMB yuan annual operation and maintenance cost per cubic meter increases them to RMB yuan per cubic meter. These estimates assume a 12 percent rate of return on the investment, which despite high economic growth in China and associated high return to capital, still could be on the high side. A high rate of return in the investment implies a high value of the future benefit stream, which is a high value of the diverted water. (continued) 92 CHINA ENVIRONMENTAL COST OF POLLUTION
15 WATER SCARCITY AND POLLUTION BOX 5.2 Efforts to Value Water in China Relevant for Water Scarcity (Continued) Other mitigation options that have been discussed in the literature are related to agriculture in particular. They include agricultural crop changes (Yang and Zehnder 2001), efficient water irrigation techniques (Foster et al. 2004) and desalination (Zhou and Tol 2003), and import of agricultural produce. Import of agricultural produce is sometimes referred to as import of virtual water, since it is an indirect way of transporting water to an area (Allen 1993). When polluted water is supplied, it requires treatment. A survey by CAEP (2006) of about 1,000 enterprises in ten provinces has estimated that the treatment cost for domestic purposes is about 2.6 and that for industry is 4.6 RMB yuan per cubic meter. The estimates are preliminary and will need more in-depth analysis. groundwater depletion may lead to salination and to compaction of land. The main cost, however, may relate to groundwater s existence value and the speed of resource exhaustion; that is, water that has been accumulating underground over thousands of years is being spent by only a few generations. This is a cost that is relevant and of concern not only for the Chinese, but the international community as well. The environmental cost of groundwater depletion can be estimated directly, if one focuses on the salinity issue, but ignoring the importance of existence value may lead to significant underestimation of the real cost. Therefore, we consider the marginal economic value of groundwater on the assumption that the environmental cost of groundwater is as least as high as its economic value. To say that the cost of groundwater depletion is higher than its economic value is an untested assumption that relies on water depletion being a rational choice of society. Had it been a rational choice, the implicit value of untapped groundwater would have been lower than the economic value. While untested, there is general agreement among experts that the present depletion of groundwater is the consequence of decentralized decisions without appropriate incentives for conservation. For instance, individual farmers in groundwater irrigated areas usually do not pay for the water itself. Farmers only pay for power and equipment (Yang, Zhang, and Zehnder 2003). When farmers are not informed by the market of any cost of groundwater depletion, it goes without saying that depletion ends up higher than a social planner would have desired. In terms of institutional distortions, MWR has recently emphasised the need to develop a water resources management system on the basis of the theory of water rights and water markets (MWR 2005), and the World Bank has long advocated water management reform in China. There are thus reasons to assume that present groundwater depletion is not the outcome of rational choice. Using the values that we have described, Table 5.5 sets out the environmental cost of water scarcity by province. In the final estimate of environmental cost, we do not include the cost of groundwater depletion. One reason is that groundwater depletion is not wholly a pollution-related item. Another reason is that there is overlap between groundwater depletion and polluted water held back from supply. Including both items in the estimate of environmental cost would imply double-counting. Note also that the cost of wastewater irrigation is discussed in section 5.2, while the health cost of water pollution is discussed in chapter 3. The environmental cost of water scarcity related to pollution amounts to 147 billion RMB. Among the provinces, Hebei and Jiangsu provinces have the largest environmental cost. Hebei is dominated by the Hai River basin. Jiangsu is split almost equally between the Huai and Yangtze. The cost of groundwater depletion amounts to 92 billion RMB. CHINA ENVIRONMENTAL COST OF POLLUTION 93
16 WATER SCARCITY AND POLLUTION TABLE 5.5 The Environmental Cost of Water Scarcity Cost of Polluted Cost of Polluted Environmental Cost of Water Held Back Water in Cost Sum Groundwater Province from Supply (1) Supply (2) of (1) and (2) Depletion (3) Beijing ,360 Tianjin ,122 Hebei 18, ,853 31,744 Shanxi 2, ,112 2,595 Inner Mongolia 9, ,775 10,735 Liaoning 1,881 1,872 3,753 3,925 Jilin 971 1,072 2,044 1,853 Heilongjiang 2,971 6,277 9,248 4,556 Shanghai 0 7,850 7,850 0 Jiangsu 5,745 12,437 18,182 3,217 Zhejiang 1,081 6,806 7, Anhui 4, ,619 1,438 Fujian Jiangxi ,583 0 Shandong 9, ,679 9,060 Henan 7,384 2,489 9,874 8,372 Hubei 1, , Hunan 1,020 3,807 4, Guangdong 2,863 8,921 11,784 1,213 Guangxi 1, , Hainan Chongqing ,319 0 Sichuan 1,478 1,349 2, Guizhou 1, ,257 9 Yunnan 2, , Tibet Shanxi 2, ,207 3,988 Gansu 1,237 1,440 2,677 1,861 Qinghai Ningxia Xinjiang ,360 Sum 85,429 61, ,687 92,356 Note: For polluted water held back from supply the marginal value approach is used, He and Chen (2005). For polluted water in supply the mitigation cost approach is used, that is treatment cost, CAEP (2006). For groundwater depletion He and Chen (2005) is again used. Groundwater depletion is only available by province. Water basin values of He and Chen are aggregated using supply per water basin in a province as weights. UNCERTAINTIES AND SENSITIVITY There are uncertainties both in the quantity and value aspect of the environmental cost of water scarcity. Quantities for polluted water in supply and groundwater depletion come from the MWR survey data from , so there is significant uncertainty associated with these figures. With limited knowledge of the sampling method, we subjectively estimate the uncertainty to about ±20 percent. The quantity of polluted water held back from supply is estimated by the authors and the uncertainty of the calculation is estimated to about ±40% percent. The values used also are uncertain. The average price used to value the cost of polluted water held 94 CHINA ENVIRONMENTAL COST OF POLLUTION
17 WATER SCARCITY AND POLLUTION back from supply is 3.45 yuan RMB per cubic meter (marginal production value). The average price used to value polluted water in supply is 3.93 yuan RMB per cubic meter (treatment cost). The average price used to value groundwater depletion is 3.81 (marginal production value, but different composition between provinces than polluted water held back from supply). While it is reassuring that the prices from different sources are similar, there are several sources of uncertainty. On the side of production value, the price depends on which sector and activity is marginal in the Chinese economy. If the marginal activity is agriculture, in particular winter wheat, the value of water may go as low as one RMB yuan per cubic meter. If the marginal value is industry, the value may go above six RMB yuan per cubic meter. A standard deviation of ±1 on the estimate of 3.45 (3.81) seems reasonable, and (1.45, 5.45) would then give a 95 percent confidence interval. On the side of treatment cost, CAEP is currently reanalyzing the data. Based on preliminary analysis ±0.5 is a reasonable standard deviation, and thus (2.93, 5.93) is a 95 percent confidence interval. The uncertainty is larger on the side of industry treatment cost. Treating the quantities as givens, we obtain a 95 percent confidence interval on the environmental cost of (95, 199) billion RMB yuan. In addition to the quantified uncertainty, there are several omissions that contribute to making our estimate of environmental cost imprecise. For instance, the cost of treating water that is within quality limits but is polluted is omitted from our estimate. CHINA ENVIRONMENTAL COST OF POLLUTION 95
18 Crop Loss Due to Wastewater Irrigation 5.2 A combination of water scarcity, growing demand for agricultural products, and readily available wastewater supply has contributed to continuous increase in wastewater irrigation in China for a number of decades. Wastewater-irrigated areas increased by a factor of 1.6 between 1982 and This report estimated that in 2003, wastewater irrigation areas totaled about 4.05 million hectares. It is estimated that the economic cost of wastewater irrigation on four major crops (wheat, corn, rice, and vegetables) in China is about 7 billion RMB annually. This cost estimate was arrived at by accounting for the impact of polluted water on crop quantity and quality, including fitness for consumption as well as the impact on the crops nutrition quality. Economic losses due to ecosystem degradation and damage to human health were not included in this analysis, which means that the total economic cost associated with wastewater irrigation is most likely larger. The output and quality of agricultural crop production is in many areas in China seriously affected by water pollution from wastewater irrigation. As noted in other chapters of this report, there is a serious shortage of water resources in China, especially in the north. To mitigate the problem, it is quite common to use wastewater or sewage for irrigation. Although water pollution damage to farm crops is recognized as a common problem in China, little research is carried out to document the problem (ECON 2000). Two comprehensive investigations of effects on crops in areas irrigated with water from sewage pipes, industrial plants, and other wastewater sources have been conducted. The wastewater/sewage irrigation zone refers to farmland with an area over 20 hectares irrigated with water that either does not meet the government standards for water quality in farmland irrigation or for any other reason may lead to the death of aquatic species such as fish or shrimp (GB ) [2]. The first survey (MoA 1984) was conducted over 20 years ago and the results are probably not a very good reflection of the present situation. A second survey in 1998 included two parts: (1) a general survey of national wastewater irrigation areas; and (2) some data on irrigation water quality, pollution conditions of the farmland, and crop quality in representative wastewater irrigated areas (MoA 2001). Although the second survey is also not very recent, in the absence of more up-to-date data, we decided to use it in the present evaluation. In the second survey, water samples were collected for short time spans and not regularly throughout the entire growth periods. Growth periods may last several months, during which water quality may change irregularly, hence the representativeness of the measurements is rather uncertain. Furthermore, since the sampling locations usually were not routinely monitored sections, it is hard to derive quantitative relationships between pollutant concentrations and their effects. Due to our inability to relate damage to specific pollutant levels, we base the calculation mainly on the area that is being irrigated with wastewater, applying the results from the second survey and some other Chinese studies to 96 CHINA ENVIRONMENTAL COST OF POLLUTION
19 CROP LOSS DUE TO WASTEWATER IRRIGATION estimate the reduction in quantity and quality associated with wastewater irrigation for given crops (Gu 1984; Yang 1984; Chen 2001; Wang 2002; Gao 1997, Sun 2001; Fu 1999). CAUSAL AGENTS, IMPACT PATHWAY, AND CALCULATION MODEL Causal Agents The comprehensive pollution index or weighted comprehensive pollution index (P c ) is usually used to indicate water quality. However, due to limited data, dose-response functions for effects on crops applying these indices cannot be constructed at present. The second survey of wastewater-irrigated areas distinguished between two kinds of sewage water irrigation: (1) clear water and sewage mixed irrigation (CSMI), and (2) pure sewage irrigation (PSI). Generally speaking, the water used in PSI was of poorer quality and thus more dangerous to crops; water qualities of CSMI, although varying considerably, were less dangerous than PSI to crops. In this project, we calculated damage to farm crops caused by both types of irrigation. Impact Pathway Use of polluted water for irrigation affects agricultural production both by reducing the quantity and the quality of output. The reduction in quality is related to two factors: (1) an excess of pollutants in crops, originating from heavy metals or other toxic substances in wastewater, making the crop unsuitable for human consumption; and (2) substandard nutritional quality, with less protein, amino acids, Vitamin C, and other nutrients. For example, rice of poor quality produced more brown and damaged grains. Wheat of poor quality produced less flour and gluten. Vegetables of poor quality have an unpleasant taste and contain more nitrate and nitrite (Gao 1997; Sun 2001; Zhang 1999; Bai 1988). The damage to farm crops caused by water pollution is expressed as a percentage of crop reduction and percentage of production having reduced quality. Calculation Model PSI and CSMI areas in each province are obtained from the Second National Survey Report of Wastewater-irrigated Area (MoA 2001). As mentioned, economic losses from crop damage caused by water pollution stem from reductions in both quantity (reduced yield) and quality (excess pollutants and substandard nutritional value). Since crops with reduced nutritional quality may or may not have excess pollutants, we calculated the loss due to reduced nutritional quality according to equation. 5.1, i.e. as the mean value of the above two possibilities as presented in equations.5.3 and The effect of introducing equation 5.4 is to avoid a double counting of economic loss otherwise likely to occur when the percentage quantity of a crop that is contaminated (contains pollutant levels above health guidelines) is high. The three equations are described below. PSI and CSMI areas in each province are obtained from the Second National Survey Report of Wastewater-irrigated Area. Losses of farm crops caused by water pollution consist of three parts, which can be calculated with the following formulas. Since crops with excess of pollutants may or may not have reduced nutritional quality, we propose the third loss expressed in equation 5.5 as the mean value of the above two possibilities as presented in equation 5.3 and equation 5.4. (1) Economic loss due to yield reduction L 4 = α tsq i ipi 100 (.) i = 1 (2) Economic loss due to excess pollutants in crops 4 4 L2 = 1 α1 i α2i β 2i Si Qi Pi 10 (.) 5 2 i = 1 ( ) CHINA ENVIRONMENTAL COST OF POLLUTION 97
Changes in Area and Quality of Cultivated Land in China
 1 Changes in Area and Quality of Cultivated Land in China Qinxue WANG* and Kuninori OTSUBO* * National Institute for Environmental Studies, 16-2 Onogawa, Tsukuba, Ibaraki 305-8506, Japan Abstract: In this
Chapter 4. China. 4.1 Overview
 70 Chapter 4. China Chapter 4 presents a detailed CropWatch analysis for China, focusing on the seven most productive agroecological regions of the east and south. After a brief overview including a production
Regional Inequality and CO 2 Emissions in China: a consumption-based MRIO approach
 Regional Inequality and CO 2 Emissions in China: a consumption-based MRIO approach K. Feng a, X. Li b, L. Sun c, K. Hubacek a* a Department of Geographical Sciences, University of Maryland, College Park,
The Development of Smallholder Inclusive Business Models in China. Prepared by Gu Rui AII/CAAS December,2015. Hanoi
 The Development of Smallholder Inclusive Business Models in China Prepared by Gu Rui AII/CAAS December,2015. Hanoi Contents 04 21 24 Page Status Literature Focus 1 2 3 The new term The new term of smallholderinclusive
Regional disparity and Mitigation cost for carbon policy in China Assessment based on multi-regional CGE model
 Prepared for Thirteenth Annual Conference on Global Economic Analysis Regional disparity and Mitigation cost for carbon policy in China Assessment based on multi-regional CGE model Shantong Li Jianwu He
Study on Application of Factor Analysis in Regional Environmental Assessment
 Study on Application of Factor Analysis in Regional Environmental Assessment Ping Xiao Hunan University of Humanities, Science and Technology, China applefly13@126.com Abstract Environmental problems have
Analysis of air quality trends in 2017
 Analysis of air quality trends in 2017 This briefing was edited on 12 Jan 2018 to update province-level PM2.5 numbers in the industrial output chart on page 5. After the launch of China s war on pollution
Research on the Ability of Regional Industrial Sustainable Development
 American Journal of Operations Research, 2012, 2, 442-447 http://dx.doi.org/10.4236/ajor.2012.23052 Published Online September 2012 (http://www.scirp.org/journal/ajor) Research on the Ability of Regional
Analysis on Comparative Advantage in the Production of. Major Grain Varieties in Different Areas of China
 Analysis on Comparative Advantage in the Production of Major Grain Varieties in Different Areas of China Wang Xicheng 1 Qi Xiaoling 2 ( 1 West China Center for Economic Research of Southwestern University
Water Development and Management Strategy of China
 Water Development and Management Strategy of China Li Yuanyuan Deputy Chief Engineer, General Institute of Water Resources and Hydropower Planning and Design General Institute, MWR Abstract: Water is not
IMPACTS OF CLIMATE CHANGE AND GRAIN SECURITY IN CHINA
 IMPACTS OF CLIMATE CHANGE AND GRAIN SECURITY IN CHINA Xiaohe LIU Senior Research Fellow Institute of Agricultural Economics and Development Chinese Academy of Agricultural Sciences 12 Zhongguancun Nandajie
Energy and Pollution Efficiencies of Regions in China
 Energy and Pollution Efficiencies of Regions in China Jin-Li Hu National Chiao Tung University, Taiwan Tzu-Pu Chang Academia Sinica, Taiwan http://jinlihu.tripod.com 2013/11/26 1 Dual Challenges of China
Understanding CCS in China s Mitigation Strategy using GCAM-China
 Understanding CCS in China s Mitigation Strategy using GCAM-China SHA YU, JILL HORING, LEON CLARKE, PRALIT PATEL, JEFF MCLEOD, BO LIU, AND HAEWON MCJEON JOINT GLOBAL CHANGE RESEARCH INSTITUTE 1 GCAM-China
VULNERABILITY ANALYSIS OF CHINESE COUNTIES
 VULNERABILITY ANALYSIS OF CHINESE COUNTIES WFP/IFAD China VAM Unit June 2003 1 Background In 1997, when vulnerability analysis and mapping was first introduced to China, an analysis of all the Chinese
Table 4.1. CropWatch agroclimatic and agronomic indicators for China, October 2016-January 2017, departure from 5YA and 15YA
 65 Chapter 4. China Chapter 4 presents a detailed analysis for China, focusing on the seven most productive agro-ecological regions of the east and south. After a brief overview of the agroclimatic and
THE PERSPECTIVE OF WATER SUPPLY AND DEMAND FOR SUSTAINABLE DEVELOPMENT IN CHINA
 WATER SUPPLY AND DEVELOPMENT ISSUES THE PERSPECTIVE OF WATER SUPPLY AND DEMAND FOR SUSTAINABLE DEVELOPMENT IN CHINA Ke Li Dan Zhang Hai Lun Abstract The total average annual volume of freshwater resources
Supplement of Inventory of anthropogenic methane emissions in mainland China from 1980 to 2010
 Supplement of Atmos. Chem. Phys., 16, 14545 14562, 2016 http://www.atmos-chem-phys.net/16/14545/2016/ doi:10.5194/acp-16-14545-2016-supplement Author(s) 2016. CC Attribution 3.0 License. Supplement of
Workshop Management Office: Fairlink Exhibition Services Ltd.
 State 211 Project State 211 Project is the Chinese government's new endeavor aimed at strengthening about 100 institutions of higher education and key disciplinary areas as a national priority for the
Dynamic Coupling Development of Regional Socio-economy-Energy-Environment in China
 Dynamic Coupling Development of Regional Socio-economy-Energy-Environment in China HONG FANG School of Economics and Management Beihang University June 21, 2017 Research Questions In the 21st century,the
Water Resources CHOIR in China
 Water Resources CHOIR in China Strategic research and innovation priorities for water Liu Dengwei 水利部发展研究中心 Development Research Center of the Ministry of Water Resources of China Water Resources CHOIR
Impacts of emission reduction target and external costs on provincial natural gas distribution in China
 Available online at www.sciencedirect.com ScienceDirect Energy Procedia 105 (2017 ) 3326 3331 The 8 th International Conference on Applied Energy ICAE2016 Impacts of emission reduction target and external
The Basic Situation of Regional Grain Trade in China
 The Basic Situation of Regional Grain Trade in China Wang Zhonghai, Huang Shouxiong, Ding Shengjun, Qu Baoxiang and Li Chenggui The Ministry of Agriculture, China 1 Introduction The huge population and
Assessing blue and green water utilisation in wheat production of China from the perspectives of water footprint and total water use
 Hydrol. Earth Syst. Sci., 18, 3165 3178, 2014 doi:10.5194/hess-18-3165-2014 Author(s) 2014. CC Attribution 3.0 License. Assessing blue and green water utilisation in wheat production of China from the
The Accounting Methods of the Local Government Department Output by Factor Analysis
 Applied Economics and inance Vol., No. ; May 04 ISSN 33-794 E-ISSN 33-7308 Published by Redfame Publishing URL: http://aef.redfame.com The Accounting Methods of the Local Government Department Output by
Promoting Energy Efficiency in China: The Status Quo and Way Forward
 Promoting Energy Efficiency in China: The Status Quo and Way Forward Xianli Zhu Copenhagen Centre on Energy Efficiency Copenhagen, 14 June 2016 C2E2 and DIIS Joint Seminar: Improving EE in Emerging Asia
China Curtain Wall Cladding Materials Review
 China Curtain Wall Cladding Materials Review April 2014 Summary Summary China s Curtain Wall Market Overview Total area of curtain walls was around 118 million sqm in 2013, accounting for only around 5.6%
China Emission Trading Scheme : Policies and Challenges
 NCSC China Emission Trading Scheme : Policies and Challenges ZHENG Shuang Director CDM Management Center (Carbon Market Department) National Center for Climate Change Strategy and International Cooperation
Abuilding and Planning Tunnels in China. China and Latin America
 Prof. Wang Kun Contents Page Chapter Ⅰ Chapter Ⅱ Chapter Ⅲ Chapter IV Abuilding and Planning Tunnels in China Design and Construction of High-speed Rail Tunnel Introduction of China Railway Tunnel Group
Improving Energy Productivity: The Policy Practice of China. Dongmei Chen China Energy Conservation Association Nov.17, 2015
 Improving Energy Productivity: The Policy Practice of China Dongmei Chen China Energy Conservation Association Nov.17, 2015 Main Outline Background Achievements and Key Measures Expectation towards 2020
Method for Calculating CO 2 Emissions from the Power Sector at the Provincial Level in China
 ADVANCES IN CLIMATE CHANGE RESEARCH 5(2): 92-99, 2014 www.climatechange.cn DOI: 10.3724/SP.J.1248.2014.092 GREENHOUSE GAS EMISSIONS Method for Calculating CO 2 Emissions from the Power Sector at the Provincial
SUSTAINABLE WATER RESOURCE USE IN ASIA CLOSING WORKSHOP. China 2012,Bangkok
 SUSTAINABLE WATER RESOURCE USE IN ASIA CLOSING WORKSHOP China 2012,Bangkok Activities and outputs Activities Outputs Inception workshop at Shanxi Province Work plan of Case studies Case studies Dialogues
Open Access Empirical Study on Ecological Niche Evaluation on Regional Construction Industry in China
 Send Orders for Reprints to reprints@benthamscience.net 164 The Open Construction and Building Technology Journal, 2014, 8, 164-170 Open Access Empirical Study on Ecological Niche Evaluation on Regional
Agricultural Science and Technology Innovation Efficiency based on DEA Model: Empirical Analysis of Efficiencies of Regions, Provinces and Anhui
 Agricultural Science and Technology Innovation Efficiency based on DEA Model: Empirical Analysis of Efficiencies of Regions, Provinces and Anhui Abstract Xueyun Chen, Changming Cheng School of Economics
CHINESE AQUACULTURE: A COMPARATIVE ANALYSIS OF THE COMPETITIVENESS OF REGIONAL AQUACULTURE INDUSTRIES
 CHINESE AQUACULTURE: A COMPARATIVE ANALYSIS OF THE COMPETITIVENESS OF REGIONAL AQUACULTURE INDUSTRIES Che bin, College of Economocs & management, Shanghai Ocean University, bche@shou.edu.cn (Sun chen,
China Corn & Corn Seed Industry Report,
 China Corn & Corn Seed Industry Report, 2007-2008 It was estimated by China National Grain and Oils Information Centre in February, 2008 that China's cultivated areas of corn were about 28.05 million hectares
Yonglong Lu. Address Challenges for Green Food. Production in China. Research Center for Eco-Environmental Sciences Chinese Academy of Sciences
 Address Challenges for Green Food Production in China Yonglong Lu Research Center for Eco-Environmental Sciences Chinese Academy of Sciences Green Week, Brussels, Belgium. June 3-5, 2014 Messages about
Rationally Utilizing Water Resources to Control Soil Salinity in Irrigation Districts
 This paper was peer-reviewed for scientific content. Pages 1134-1138. In: D.E. Stott, R.H. Mohtar and G.C. Steinhardt (eds). 2001. Sustaining the Global Farm. Selected papers from the 10th International
TO U R. by CCIFC & MOFCOM-CICPMC. China Cities of the Future
 C HIN A, C I T I E S O F T H E F U T U R E 2 0 12 TO U R by CCIFC & MOFCOM-CICPMC 明日之城 未来市场 China has 272 cities with over 1 million inhabitants. These centers of urbanization in recent years attracted
Innovations In Integrated Water Resources Management
 CHINA Innovations In Integrated Water Resources Management LIPING JIANG WORLD BANK BEIJING OFFICE Outlines 1. Impact of climate change on water scarcity in China; 2. Climate change adaptation strategy
Challenges and Conservation Measures: Water Resources of the North China Plain. Rui Li & Xingmin Mu
 Challenges and Conservation Measures: Water Resources of the North China Plain Rui Li & Xingmin Mu Paper prepared for presentation at the Water For Irrigated Agriculture And The Environment: Finding a
Measurements for Forest Ecological Benefit in China
 Marsland Press World Rural Observations 2009;1(2):25-30 Measurements for Forest Ecological Benefit in China 1 Ming Liang, 2 Changsheng Li 1. Institute of Natural Resource & Ecology of Heilongjiang Provincial
Analysis of Total Factor Efficiency of Water Resource and Energy in China: A Study Based on DEA-SBM Model
 sustainability Article Analysis of Total Factor Efficiency of Water Resource and Energy in China: A Study Based on DEA-SBM Model Weixin Yang 1 ID and Lingguang Li 2, * ID 1 Business School, University
Operation Situation by the Number of Mines (MT=million tonnes)
") Operating Rate Summary According to Custeel survey on 204 domestic ore mining companies whose finished ore capacity accounts for 61.5% of the total, national average operating rate stood at 63.98% in February,
Operating Rate Summary According to Custeel survey on 204 domestic ore mining companies whose finished ore capacity accounts for 61.5% of the total, national average operating rate stood at 63.98% in February,
China's regional water scarcity and implications for grain supply and trade
 Environment and Planning A 2001, volume 33, pages 79 ^ 95 DOI:10.1068/a3352 China's regional water scarcity and implications for grain supply and trade Hong Yang, Alexander Zehnder Swiss Federal Institute
Impacts of China s GPA Accession
 Impacts of China s GPA Accession and the Way Forward Dr. Wang, Ping Deputy Director, Public Procurement Research Group, University of Nottingham GPA Symposium, Geneva 17 Sep. 2015 1 Background The GPA
Estimating Chinese Unified Carbon Market Size
 Estimating Chinese Unified Carbon Market Size Implications of a Giant Four-billion t-co 2 Market Shen Zhongyuan Senior Coordinator Energy Conservation Group Global Environment & Sustainable Development
Energy-saving Potential Study on Telecommunication Base Station Free Cooling With a Thermosyphon Heat Exchanger in China
 Purdue University Purdue e-pubs International High Performance Buildings Conference School of Mechanical Engineering 2012 Energy-saving Potential Study on Telecommunication Base Station Free Cooling With
China s Ecological compensation policy
 China s Ecological compensation policy Contents 1. Background of eco-compensation in China 2. Progress of eco-compensation in China 3. Characteristics of eco-compensation in China 1. Background of China
Overview of Impacts of Climate Change and Adaptation in China s Agriculture
 Journal of Integrative Agriculture 2014, 13(1): 1-17 January 2014 REVIEW Overview of Impacts of Climate Change and Adaptation in China s Agriculture WANG Jin-xia, HUANG Ji-kun and YANG Jun Center for Chinese
CEEP-BIT WORKING PAPER SERIES. China's regional carbon emissions change over
 CEEP-BIT WORKING PAPER SERIES China's regional carbon emissions change over 1997-2007 Lan-Cui Liu Jin-Nan Wang Gang Wu Yi-Ming Wei Working Paper 2 http://www.ceep.net.cn/english/publications/wp/ Center
Climate Change Policy Target Setting and Implementation Process in Japan and China
 Japan-China Policy Research Workshop in 2017 Climate Change Policy Target Setting and Implementation Process in Japan and China Jin Zhen, Ph.D. Institute for Global Environmental Strategies(IGES) Table
IMPLEMENTATION OF THE COAL CAP PLAN: LONG TERM IMPACTS, URGENCY AND EFFECTIVENESS
 IMPLEMENTATION OF THE COAL CAP PLAN: LONG TERM IMPACTS, URGENCY AND EFFECTIVENESS Yang Fuqiang Coal Cap Project Research Steering Committee Member November 1, 2016 CRY FOR A BLUE SKY OUTLINE Adjust Goals
The Efficiency Improvement in Low-carbon Technology Innovation of Chinese Enterprises under CDM: An Empirical Study based on DEA Assessments
 Journal of Finance and Economics, 2017, Vol. 5, No. 6, 310-315 Available online at http://pubs.sciepub.com/jfe/5/6/7 Science and Education Publishing DOI:10.12691/jfe-5-6-7 The Efficiency Improvement in
Human capital and energy in economic growth Evidence from Chinese provincial data
 Human capital and energy in economic growth Evidence from Chinese provincial data Zheng Fang, Singapore University of Social Sciences Yang Chen, Xi an Jiaotong-Liverpool University 40th IAEE International
Land Use Changes and Economic Growth in China
 Land Use Changes and Economic Growth in China Canfei He, Zhiji Huang, and Weikai Wang The conversion of land from agricultural production to urban and industrial development is one of the critical processes
Application of virtual water trade theory in interregional grain allocation and transportation in China
 African Journal of Biotechnology Vol. 10(80), pp. 18463-18471, 14 December, 2011 Available online at http://www.academicjournals.org/ajb DOI: 10.5897/AJB11.231 ISSN 1684 5315 2011 Academic Journals Full
Prof. Harvey Shear Department of Geography University of Toronto Mississauga. February 5, 2013
 Prof. Harvey Shear Department of Geography University of Toronto Mississauga February 5, 2013 Water, water, everywhere, And all the boards did shrink; Water, water, everywhere, Nor any drop to drink. Rime
ADB Economics Working Paper Series. Impacts of Climate Change on the People s Republic of China s Grain Output Regional and Crop Perspective
 ADB Economics Working Paper Series Impacts of Climate Change on the People s Republic of China s Grain Output Regional and Crop Perspective Tun Lin, Xiaoyun Liu, Guanghua Wan, Xian Xin, and Yongsheng Zhang
ENVIROMENT PROTECTION AND NATURAL GAS DEVELOPMENT IN CHINA
 ENVIROMENT PROTECTION AND NATURAL GAS DEVELOPMENT IN CHINA Zhou Fengqi, Professor,Energy Research Institute of State Development Planning Commission, China,Beijing Abstract The paper describes the results
Water retaining in paddy field: in a case of China
 1/36 CNIIR/ZHU Water retaining in paddy field: in a case of China ZHU Defeng China National Rice Research Institute 2/36 CNIIR/ZHU 1 Rice production 2 Rice growth environment 3 Rice water requirement 4
Study on the Minimum Wages Increases in Beijing
 International Business and Management Vol. 13, No. 1, 2016, pp. 16-21 DOI:10.3968/8566 ISSN 1923-841X [Print] ISSN 1923-8428 [Online] www.cscanada.net www.cscanada.org Study on the s Increases in Beijing
Cropland Mapping and area estimation method in CropWatch. Nana Yan, Miao Zhang, Bingfang Wu, Bo Chen RADI, CAS June, 2015
 Cropland Mapping and area estimation method in CropWatch Nana Yan, Miao Zhang, Bingfang Wu, Bo Chen RADI, CAS June, 2015 Outline Background Methodology in CropWatch Recent updates of crop classification
An Empirical Research on Industrial Structure Optimization of Provincial Area Based on Two-oriented Society
 Proceedings of the 8th International Conference on Innovation & Management 241 An Empirical Research on Industrial Structure Optimization of Provincial Area Based on Two-oriented Society He Dan 1,Zhao
China Market Report 2018
 China Market Report 2018 Welcome Welcome to our China Market Report. This report is a brief survey of the renewable energy market in China and focuses on; The Pipeline of Energy Projects, A Brief Overview
WATER RESOURCES AND POLLUTION
 Chapter Five WATER RESOURCES AND POLLUTION Our analysis of China s complex water and pollution problems begins with estimates of the sharply differing water supply and demand conditions within China. The
Strategies and Actions of Biodiversity Conservation in China
 Strategies and Actions of Biodiversity Conservation in China ZHANG Fengchun Policy/Institutional Expert of ECBP FECO, MEP 15 March, 2011 Beijing China National Biodiversity Strategy and Action Plan CHINA
Demonstration Zones of Agricultural Modernization by Mr. Qian (chief agroeconomist
 Disclaimer: This translation by the DCZ is provided as a working tool, and is provided "as is." No warranty of any kind, either expressed or implied, is made as to the accuracy, correctness, or reliability
SECTOR ASSESSMENT (SUMMARY): AGRICULTURE AND NATURAL RESOURCES (ENDANGERED RESERVOIRS) 1
: AGRICULTURE AND NATURAL RESOURCES (ENDANGERED RESERVOIRS) 1") Risk Mitigation and Strengthening of Endangered Reservoirs in Shandong Province Project (RRP PRC 40683) SECTOR ASSESSMENT (SUMMARY): AGRICULTURE AND NATURAL RESOURCES (ENDANGERED RESERVOIRS) 1 A. Reservoir
Risk Mitigation and Strengthening of Endangered Reservoirs in Shandong Province Project (RRP PRC 40683) SECTOR ASSESSMENT (SUMMARY): AGRICULTURE AND NATURAL RESOURCES (ENDANGERED RESERVOIRS) 1 A. Reservoir
PRICING OF IRRIGATION WATER IN CHINA. Zhou Yaozhou and Wei Bingcai
 PRICING OF IRRIGATION WATER IN CHINA Zhou Yaozhou and Wei Bingcai INTRODUCTION Paper Outline This paper gives brief introduction to China s water resources including both quantity and quality of surface
Structural Change and Energy Use: Evidence from China s Provinces
 Public Disclosure Authorized Public Disclosure Authorized Public Disclosure Authorized Public Disclosure Authorized 1 China Working Paper Series No. 6 Structural Change and Energy Use: Evidence from China
Current Status of Chinese Alumina Industry and SAMI s Technical Solution
 Jiang Yuehua, Vice President of Current Status of Chinese Alumina Industry and s Technical Solution Shenyang Aluminum & Magnesium Engineering & Research Institute Company Limited () Outline Reserves and
The Scenario Analysis of Shale Gas Development on the sufficiency of pipeline network in China by applying natural gas pipeline optimization model
 The Scenario Analysis of Shale Gas Development on the sufficiency of pipeline network in China by applying natural gas pipeline optimization model PhD Candidate Meng XU Prof. Alexis K H LAU Prof. William
Strategy for Archival Management in the Digital Age
 Strategy for Archival Management in the Digital Age Cai Xuemei The State Archives Administration of the People s Republic of China The rapid development and widespread application of information technology
Chinese River Basins Yellow River, Huai, Interior Basins. Preliminary results of the GCI II survey
 http://www.unmultimedia.org/photo/guidelines.jsp IISD GWSP Conference on the Water-Energy-Food Security Nexus May 1 5 2012 Chinese River Basins Yellow River, Huai, Interior Basins Preliminary results of
Water resource utilization and the agricultural economy development in rural China
 Int. Statistical Inst.: Proc. 58th World Statistical Congress, 2011, Dublin (Session IPS104) p.1585 Water resource utilization and the agricultural economy development in rural China Abstract:Our paper
How the Coal Industry is Aggravating the Global Water Crisis
 How the Coal Industry is Aggravating the Global Water Crisis In its Global Risks Report 2015, the World Economic Forum stated water security is one of the most tangible and fastest-growing social, political
By Ting-lin HUANG. School of Environmental and Municipal Engineering Xi an University of Architecture and Technology
 By Ting-lin HUANG School of Environmental and Municipal Engineering Xi an University of Architecture and Technology 1 Water resources: surface water Water resources: ground water Mobilization of water
Patterns of Domestic Grain Flows and Regional Comparative Advantage in Grain Production in China
 Patterns of Domestic Grain Flows and Regional Comparative Advantage in Grain Production in China Chen Chunlai (Department of Economics, Adelaide University) Christopher Findlay (Asia Pacific School of
Towngas China (1083.hk) 2016 Final Results Presentation
 2016 Final Results Presentation") Towngas China (1083.hk) 2016 Final Results Presentation Towngas China as a major city-gas platform in China for Hong Kong & China Gas Hong Kong & China Gas (0003.hk) Major utilities and energy company
Towngas China (1083.hk) 2016 Final Results Presentation Towngas China as a major city-gas platform in China for Hong Kong & China Gas Hong Kong & China Gas (0003.hk) Major utilities and energy company
Action Plan toward Effective Flood Hazard Mapping in China
 Action Plan toward Effective Flood Hazard Mapping in China A) The role of flood hazard maps to mitigate flood damages in China A-1) the flood status in China China is endowed with about 50,000 rivers,
麗豐股份有限公司 (4137.TT) Chlitina Holding Limited Chlitina Holding Limited. Group Introduction
 Chlitina Holding Limited Chlitina Holding Limited. Group Introduction") 麗豐股份有限公司 (4137.TT) Chlitina Holding Limited Chlitina Holding Limited Group Introduction Table of Contents 2015Q1~Q3 Performance Planning and Development 2 Table of Contents 2015Q1~Q3 Performance Planning
麗豐股份有限公司 (4137.TT) Chlitina Holding Limited Chlitina Holding Limited Group Introduction Table of Contents 2015Q1~Q3 Performance Planning and Development 2 Table of Contents 2015Q1~Q3 Performance Planning
APERC Report: Understanding Energy in China Geographies of Energy Efficiency
 APERC Report: Understanding Energy in China Geographies of Energy Efficiency Mardrianto Kadri APERC Senior Researcher APERC Workshop at EWG38 Bali, Indonesia, 16 November 2009 Geographies of Energy Efficiency
To: Business Editor April (For immediate release)
") To: Business Editor April 18 (For immediate release) HUANENG POWER INTERNATIONAL, INC. POWER GENERATION WITHIN CHINA INCREASES BY 24.89% FOR THE FIRST QUARTER (Beijing, China, April 18, ) Huaneng Power
To: Business Editor April 18 (For immediate release) HUANENG POWER INTERNATIONAL, INC. POWER GENERATION WITHIN CHINA INCREASES BY 24.89% FOR THE FIRST QUARTER (Beijing, China, April 18, ) Huaneng Power
Long-Term Energy Demand and Supply Outlook for the 31 Provinces in China through 2030
 Long-Term Energy Demand and Supply Outlook for the 31 s in China through 23 -- Development of -Based Statistics and Energy Projection Using Econometric Model -- Komiyama, Ryoichi, Researcher, Energy Data
Environmental Impacts and Benefits of Regional Power. Grid Interconnections for China
 Environmental Impacts and Benefits of Regional Power Grid Interconnections for China Zhu Fahua State Power Environmental Protection Research Institute of China Environmental Monitoring General Station
Lecture 14. Water: A Limited Resource. Lecture 14
 Lecture 14 Water: A Limited Resource Lecture 14 1. Importance of Water 2. Water Use and Resource Problems 3. Water Problems in U.S. and Canada 4. Global Water Problems 5. Water Management 6. Water Conservation
China s Electric Power Industry and Its Trends
 China s Electric Power Industry and Its Trends Chun Chun Ni Electric Power, Nuclear Power & Coal Group Industrial Research Unit The Institute of Energy Economics, Japan Contents 1. Structure of China s
ICIS China Gas Market Webinar
 ICIS China Gas Market Webinar 13 November 2014 Ricki Wang, Senior Industry Analyst ICIS China Ben Wetherall, Head of Gas ICIS Energy Click here to access the recording of the webinar - http://bcove.me/41zphdnz
Nitrogen and Phosphorus Flows in the Food Chain and their Contributions to Non-Point Pollution in China
 GLOBAL ISSUES IN NUTRIENT MANAGEMENT SCIENCE, TECHNOLOGY AND POLICY 4 th International Nutrient Management Symposium Nitrogen and Phosphorus Flows in the Food Chain and their Contributions to Non-Point
OVERCAPACITY, OVER-WITHDRAWAL: HOW TACKLING COAL POWER OVERCAPACITY CAN EASE WATER STRESS
 OVERCAPACITY, OVER-WITHDRAWAL: HOW TACKLING COAL POWER OVERCAPACITY CAN EASE WATER STRESS 1 Overcapacity, Over-withdrawal: How tackling coal power overcapacity can ease water stress Lead author LI Danqing
Analysis of Carbon Emission Efficiency for the Provinces of China YU Dun-yong 1 ZHANG Xue-hua1,*2
 3rd International Conference on Education, Management, Arts, Economics and Social Science (ICEMAESS 05) Analysis of Carbon Emission Efficiency for the Provinces of China YU Dun-yong ZHANG Xue-hua,* School
China between 2000 and China s average electricity transmission and distribution
 Transmission and distribution losses (%) 6 4 2 0 2000 2001 2002 2003 2004 2005 2006 2007 2008 2009 2010 2011 2012 2013 2014 Year Supplementary Figure 1 Average electricity transmission and distribution
Regional efforts to mitigate climate change in China: A multi-criteria assessment approach
 Regional efforts to mitigate climate change in China: A multi-criteria assessment approach Abstract: The task of mitigating climate change is usually allocated through administrative regions in China.
China s Potential of Grain Production Due to Changes in Agricultural Land Utilization in Recent Years
 Chin. Geogra. Sci. 2009 19(2) 097 103 DOI: 10.1007/s11769-009-0103-x www.springerlink.com China s Potential of Grain Production Due to Changes in Agricultural Land Utilization in Recent Years XIN Liangjie,
econstor Make Your Publications Visible.
 econstor Make Your Publications Visible. A Service of Wirtschaft Centre zbwleibniz-informationszentrum Economics Yu, Chaoqing et al. Article Published Version Assessing the impacts of extreme agricultural
Human Development Report 2006
 Human Development Report 2006 Human Development Report Office OCCASIONAL PAPER Access to Water and Sanitation in China: History, Current Situation and Challenges Dajun Shen 2006/47 Water is the source
Bosideng International Holdings Limited. 2010/11 Annual Results Presentation
 Bosideng International Holdings Limited 2010/11 Annual Results Presentation Disclaimer The information contained in this presentation is intended solely for your personal reference. Such information is
Research on Applications of Data Science in Macroeconomics
 208 7th International Conference on Social Science, Education and Humanities Research (SSEHR 208) Research on Applications of Data Science in Macroeconomics Jingru Sun College of Engineering & Applied
Patterns of Innovation in China s Energy Sector: The Case of Advanced Electricity Generation Technologies
 Patterns of Innovation in China s Energy Sector: The Case of Advanced Electricity Generation Technologies Workshop: China, the West, and the Alternative Energy Innovation Challenge Dr. Valerie J. Karplus
13 Water: A Limited Resource
 13 Water: A Limited Resource Overview of Chapter 13 Importance of Water Water Use and Resource Problems Water Problems in U.S. and Canada Global Water Problems Water Management Water Conservation Water