Rainwater Harvesting Domestic, Agricultural and School Applications
|
|
|
- Earl Ward
- 6 years ago
- Views:
Transcription
1 Dublin Institute of Technology Masters Engineering Rainwater Harvesting Domestic, Agricultural and School Applications Anna Reid Dublin Institute of Technology, Follow this and additional works at: Recommended Citation Reid, A. (2014(). Rainwater Harvesting Domestic, Agricultural and School Applications.. Masters dissertation. Dublin Institute of Technology. doi: /d72g8p This Theses, Masters is brought to you for free and open access by the Engineering at It has been accepted for inclusion in Masters by an authorized administrator of For more information, please contact This work is licensed under a Creative Commons Attribution- Noncommercial-Share Alike 3.0 License
2 Rainwater Harvesting Domestic, Agricultural and School Applications Anna Marie Reid Thesis presented to Dublin Institute of Technology for the Degree of Master of Philosophy Supervisors Dr Sean O Hogain Mr Liam McCarton MSc School of Civil and Structural Engineering June 2014 Dublin Institute of Technology Bolton St. Dublin 1
3
4 Abstract In 2005, Dublin Institute of Technology (DIT) School of Civil and Building Services Engineering was commissioned by the National Rural Water Monitoring Committee (NRWMC) to investigate the feasibility of supplementing treated mains water used for non-potable purposes (NFGWS, 2008). This project involved the design, installation, commissioning and monitoring of rainwater harvesting (RWH) facilities in a domestic housing development and in an agricultural setting. A second study commenced in 2008 when DIT was commissioned by the Department of Environment, Heritage and Local Government (DOEHLG) to monitor water use and assess the efficiency of rainwater harvesting facilities installed in a primary national school. Daily / monthly rainfall, water demand, mains top-up were monitored and analysed for the domestic, agricultural and school sites. The Efficiency ratio (E T ), Storage fraction (S f ), Demand fraction (D f ), Overflow fraction (O f ) were calculated for the three rainwater harvesting systems (RWH). An economic model was developed to calculate cost of producing one m³ of water using RWH, compare the Net Present Value (NPV) cost of RWH water supply versus mains water supply and to illustrate the preferred scenarios in Ireland under which RWH is economical viable. These include; Storage designed for no greater than 90% efficiency, capital grant allowance of minimum 30% coupled with a 50% reduction for householders with RWH. The cost of mains water per m 3 is similarly priced as harvested rainwater per m 3. In this study this equates to 8 per m 3 A 20% reduction in free allowances to the householder coupled with a 50% reduction for householders with RWH.
5 Acknowledgements I would like to take this opportunity to express my appreciation and sincere thanks to Dr Sean O Hogain and Mr Liam McCarton MSc for their support, guidance and good humour throughout this research. I would like to thank Mr John Turner, who permitted me the opportunity to carry out this research. To the residents of Milford Park, Ballinabrannagh Co Carlow, Mr Hugh Hayes, Clonalvy, Co. Meath and Mr Peter Carey (Principal) and the staff and students of Carrowholly National School, Westport Co. Mayo without whom this research could not have been undertaken For the support from friends and colleagues, thank you. Finally to Lyn, I give you my heartfelt thanks for your love, encouragement, wit and knowledge; you always know how to find an answer.
6 Abstract Acknowledgements Table of Contents.1 List of Figures... 4 List of Tables INTRODUCTION Background Research Questions Outline of Thesis Dissemination of Study Outputs WATER SERVICES IN IRELAND Introduction Background to Water Sector Reform in Ireland Legislation within the Water Sector in Ireland Water Resources in Ireland Annual Rainfall Climate Change Effects Irelands Surface Water Resources Water services organisation in Ireland Model for Irish Water Roof Water Harvesting Roof Water Harvesting Components Catchment surface Conveyance system Filtration / Separation Storage system Delivery system Uses International Policy Rainwater Harvesting Germany United States Australia Domestic Rainwater Harvesting project Project site: Milford Park, Ballinabrannagh, Co. Carlow Design
7 4.3 Site works Control of the RWH system Metering system Monitoring System AGRICULTURAL RAINWATER HARVESTING PROJECT Project Site: Beshellstown House, Clonalvy Co. Meath Site Works Filtration System Control of System Metering the RWH system School Rainwater harvesting project Project Site Rainwater Harvesting System RWH System Design Parameters RWH System Operation Water Supply monitoring system Rainwater Harvesting Supply Mains Water Supply Data collection Thesis Data Rainfall and Water Use Modelling Rainwater systems Mass Balance Model Pilot Domestic RWH Site: Rainfall at Ballinabrannagh, Co. Carlow Water Monitoring Analysis Water Audit Water Use in Ballinabrannagh, Co. Carlow General Findings Water Use RWH House Toilet Demand and RWH performance House Toilet plus Hot Water Demand and RWH performance House 2 toilet demand and RWH performance House 3 Toilet demand and RWH performance House 4 toilet demand and RWH performance Using BS 8515:2009 to size storage tank for Carlow site Pilot Agricultural RWH Site: Rainfall at Clonalvy Co. Meath Water Monitoring Analysis
8 7.4 Pilot RWH Site, National School Site, Carrowholly, Co. Mayo Rainfall Analysis Water Monitoring Analysis Water Audit Non Potable Water Use Meters Mains fed toilets Using BS8515:2009 to calculate tank sizing for Carrowholly School Viability of Rainwater Harvesting in Ireland Grant availability Reducing mains water charges to households with RWH installed Grant plus discounted mains water charge with RWH installed Free Allowances reduced or abolished Free allowances reduced / abolished plus discount on mains water charges with RWH installed Level of charge per m 3 required to give payback less than 25 years Conclusions References: Appendix
9 List of Figures Figure 2.1 Mean Annual Rainfall (mm) (Met Éireann, 2012) Figure 2.2 Observed annual precipitation changes Figure 2.3 Map of Ireland s Rivers and lakes Figure 2.4 Water Resources for Drinking Water Supply in Ireland Figure 2.5 Local Authorities in Ireland Figure 2.6 Functions of Irish Water (PwC, 2011) Figure 3.1 (a) Debris collecting gutters (b) Gutter filter (c) Leaf filter on downpipe Figure 3.2 Examples of First flush devices Figure 3.3 Calmed Inlet Figure 3.4 Direct system -Rainwater collected and pumped directly to points of use (adapted from Figure 3.5 Gravity system - Rainwater collected in storage tank and fed by gravity to points of use (adapted from BS 8515:2009) Figure 3.6 Indirect RWH - Rainwater collected in tank, pumped to an elevated tank, points of use fed by gravity (adapted from BS 8515:2009) Figure 4.1 Map of Domestic site at Milford Park, Ballinabrannagh Co. Carlow Figure 4.2 Davis Weather Station at Ballinabrannagh Figure 4.3 Davis Weather Console Figure 4.4 Rainwater System installed in Ballinabrannagh, Carlow Figure 4.5 9m 3 Underground tank in the garden Figure 4.6 Inline Rainman Type 1 Filter Figure 4.7 Calming Inlet in underground tank Figure 4.8 Silicone sealed down pipe Figure 4.9 Plastic seal Figure 4.10 Rainwater header tank & Mains header tank in attic of RWH House Figure 4.11 Submersible Pump Figure 4.12 Floating filter inlet for pump Figure 4.13 Underground Tank Schematic Figure 4.14 Type AA air gap Figure 4.15 Metering System installed in Control Houses
10 Figure 4.16 Meters plus transmitters installed in control houses & RWH house Figure 4.17 Meter with transmitter connected installed externally Figure 4.18 Metering system installed in RWH House Figure 4.19 Hydro-Center Data logger, Figure 4.20 Meter Radio Transmitter Figure 4.21 Radio Receiver Figure 4.22 Schematic showing Hydro-Center system data collection, storage & retrieval Figure 5.1 Agricultural site at Clonalvy, Co. Meath Figure 5.2 Farm schematic showing farm buildings used as rainwater catchment area55 Figure 5.3 Pipe trench excavation Figure 5.4 New guttering and down pipe installation Figure 5.5 9m 3 Collection tank Figure m 3 Rainwater Storage tank Figure 5.7 Farm schematic showing collection and storage tanks Figure 5.8 Leaves in gutter Figure 5.9 Custom made filter initially used with RWH system Figure 5.10 Custom made filter used initially with the RWH system Figure 5.11 Damage to submersible pump and floating inlet when no leaf filtering system in place Figure 5.12 Lindab leafbeater and Easy Clean Nest filter installed on down pipe 59 Figure 5.13 Lindab leafbeater and Easy Clean Nest filter removing debris from rainwater on route to collection tank Figure 5.14 Control panel installed on the farm to regulate water flow within system61 Figure 5.15 Ball-cock control in storage tank Figure 5.16 Water level control in storage tank Figure 5.17 Top-up and Rainwater inlets to storage tank Figure 5.18 Farm meter installation plan Figure 5.19 Bonyto Klasse C meter Figure 5.20 Meter connected to MinlogB Data logger Figure 5.21 MinilogB loggers on storage tank Figure 5.22 Downloading data logger data Figure 5.23 Vantage PRO2 Weather Station installed on the farm Figure 6.1 Location of Carrowholly National School
11 Figure 6.2 Front Elevation showing original school building (source: Google Earth)67 Figure 6.3 Right Hand Side Elevation showing new extension to rear (source: Google Earth) Figure 6.4 Rear elevation showing new extension (source: Google Earth) Figure 6.5 Rainwater Harvesting System Layout Figure 6.6 Bonyto Klasse C 1.5m 3 /h type used to monitor toilet use Figure 6.7 Meters 201 & 202 on mains top up to storage tanks Figure 6.8 Schematic showing monitoring system installed on RWH supply Figure 6.9 Metering system for mains supplied student toilets Figure 6.10 Radio transmitters attached to meters Figure 6.11 Hydro-Center 60 storage unit and data SIM card connection Figure 7.1 A rainfall event characterised by its constituent elements ( diagram Campisano A, Modica C, 2012) Figure 7.2 Daily rainfall at Ballinabrannagh, Carlow, January 2006 May Figure 7.3 Monthly rainfall recorded at Ballinabrannagh Carlow over monitoring period Figure 7.4 Average Monthly Harvestable Rainfall at Ballinabrannagh, Co. Carlow. 84 Figure 7.5 Water use at Ballinabrannagh Co. Carlow March 2006 May Figure 7.6 Water use within the study households Figure 7.7 Daily demand, inflow to RWH tank, RWH tank yield, tank balance and mains top-up by month for Figure 7.8 Efficiency ratio for various tank sizes versus demand for toilet use at RWH house Figure 7.9 Daily demand for toilets & hot water, inflow to RWH tank, RWH tank yield, tank balance and mains top-up by month for Figure 7.10 Efficiency ratio for various tank sizes versus demand for toilet and hot water use at RWH house Figure 7.11 Efficiency ratio for various tank sizes versus demand for toilet and hot water use at House Figure 7.12 Efficiency ratio for various tank sizes versus demand for toilet and hot water use at House Figure 7.13 Efficiency ratio for various tank sizes versus demand for toilet and hot water use at House Figure 7.14 BS 8515:2009 tank size 0.5m³ vs demand at RWH house
12 Figure % Demand BS8515:2009 Tank size 0.5m³ Figure 7.16 Monthly rainfall at Clonalvy over monitoring period Figure 7.17 Daily RWH performance by month for Figure 7.18 Efficiency ratio for various tank sizes versus demand measured at RWH fed troughs Figure 7.19 Variation in Total Monthly Rainfall at Westport Figure 7.20 Average monthly rainfall and number of rain-days 1mm over years Figure 7.21 Daily rainfall at Westport Figure 7.22 Daily demand for water for toilet use at RWH system Figure 7.23 Third and Fourth class daily toilet demand Figure 7.24 Fifth and Sixth class toilet demand Figure 7.25 Girls and boys toilet on corridor Figure 7.26 Demand at the disabled toilets Figure 8.1. Cost of RWH compared to mains water supply Figure 8.2 Capital Grant at 50% purchase and installation cost of RWH Figure 8.3 RWH performance when 50% reduction in mains water charge applied with RWH system installed versus mains water only supply Figure 8.4 RWH performance including 30% Grant on RWH purchase and installation costs and 50% discount on mains water costs with RWH installed Figure 8.5 Mains water charges at 2.04 per m 3 and free allowances reduced by 50% Figure 8.6 All fee allowances abolished, mains water charge at Figure 8.7 Cost per m³ produced by RWH sytems Figure 8.8 Mains water charges at 7 per m³ Figure 8.9 Mains water charges at 13 per m³
13 List of Tables Table 2.1 European Legislation in relation to water and wastewater adapted from PwC, Table 2.2 Irish Legislation in relation to water and waste water adapted from PwC, Table 2.3 Predicted seasonal precipitation for 21 st Century Ireland (Reference period ) (C4I, 2008) Table 2.4 Ireland s Water resources (NDP, 2005) Table 2.5 Irish water services comparison to UK and Northern Ireland water services ((DoECLG (a), 2012) Table 3.1 Runoff co-efficient for roofing materials (BS 8515:2009) Table 3.2 Tank materials used in RWH systems Table 7.1 The constituent elements of a rainwater harvesting system Table 7.2 Monthly rainfall totals, maximum daily rainfall and number of rain-days with 1 mm rainfall over the study period Table 7.3 Monthly rainfall recorded over the monitoring period at Ballinabrannagh, Carlow Table 7.4 Harvestable Rainfall available to RWH system installed at Ballinabrannagh, Carlow Table 7.5 Summary of plumbing fixtures and fittings in the RWH house Table 7.6 Water use and demand at Ballinabrannagh, Carlow over March 2006 May Table 7.7 Monthly summary of toilet demand, RWH system performance over monitored period Table 7.8 Monthly summary of demand for toilets and hot water, performance of installed RWH over monitored period Table 7.9 House 2 Monthly summary of demand for toilets, and performance of installed RWH over monitored period Table 7.10 House 3 Monthly summary of demand for toilets, and performance of installed RWH over monitored period
14 Table 7.11 House 4 Monthly summary of demand for toilets, and performance of installed RWH over monitored period Table 7.12 Rainfall recorded on farm at Clonalvy, Co. Meath Table 7.13 Harvestable rainfall available at the installed Clonalvy RWH system Table 7.14 Water use at Clonalvy, Co. Meath Table 7.15 Summary of water use at Clonalvy, Co. Meath over monitoring period 112 Table 7.16 Monthly summary of demand at RWH fed cattle troughs and performance of installed RWH over monitored period at Clonalvy, Meath Table 7.17 Monthly total and average rainfall (mm), maximum daily rainfall (mm) and number of rain-days per month for Westport Station No Table 7.18 Summary of monthly rainfall (mm) recorded at Westport Table 7.19 Summary of Plumbing Fixtures and Fittings in Carrowholly National School Table 7.20 Rainwater Harvesting Metering System Table 7.21 Mains Water Metering System Table 7.22 Summary of RWH 01 performance at Carrowholly National School Table 7.23 Summary of demand for water for non-potable use in Carrowholly National School Table 8.1 Possible political and economic scenarios influencing RWH use in Ireland Table 8.2 Economic model for a standard Irish household of 2.7 persons with annual PCC of 150l/hd/d. PCC toilet use taken as the average from this research Table 8.3 Economic model to calculate NPV of RWH system and Mains only for domestic water supply Table 8.4 RWH cost per 1m 3 of water and mains water charge per m Table 8.5. Summary of Scenarios investigated and modelled results
15 1. INTRODUCTION 1.1 Background The rapid expansion of urban areas in Ireland along with increased demand from both industrial and domestic sectors during the Celtic tiger years placed great demand on water resources. This demand caused problems for water supply infrastructures never intended to service such demand. Water demand is typically met by importing large volumes of water treated to drinking water quality standards, across large distances and at considerable cost, from neighbouring catchments (O Hogain, McCarton 2009). Less than 1% of urban water consumption is used for drinking but all mains water supplied to domestic, agricultural and school properties is treated to potable quality standard (O Sullivan, 2002). 1.2 Research Questions The principle research question is as follows: Under what circumstances would rainwater harvesting be viable in domestic, agricultural and school settings in Ireland? This main research question breaks down into the following subtasks; Assess the optimum design and tank sizing to give the best return on investment Determine what (if any) refinements are recommended for the Irish context to the design and sizing methodologies reported in the literature Define the main risks and barriers to a rainwater harvesting implementation program in Ireland Define the circumstances which rainwater harvesting may be viable in Ireland. 10
16 The technology studied, RWH, has a complex relationship between cost (usually dominated by choice of water storage capacity) and user behaviour (demand). This thesis collected data on three specific RWH installations. In 2005, Dublin Institute of Technology (DIT) School of Civil and Building Services Engineering was commissioned by the National Rural Water Monitoring Committee (NRWMC) to investigate the feasibility of supplementing treated mains water used for non-potable purposes (NFGWS, 2008). This project involved the design, installation, commissioning and monitoring of rainwater harvesting (RWH) facilities in a domestic housing development and in an agricultural setting. This pilot project was managed by a team from the School of Civil and Building Services Engineering at DIT. The project team was led by Liam McCarton and Dr Seán Ó Hogáin and included Anna Reid, Niamh McIntyre and Jenny Pender. The second study commenced in 2008 when DIT was commissioned by the Department of Environment, Heritage and Local Government (DOEHLG) to monitor water use and assess the efficiency of rainwater harvesting facilities installed in a primary national school. 1.3 Outline of Thesis Chapter one introduces the context and scope of the thesis and outlines the aims and objectives of the research. Chapter two comprises of a review of Ireland s water sector pre and post 2012 and change from local authority control of the water sector to a new entity known as Irish Water. How rainwater harvesting is promoted internationally reviewed and Ireland s water resources 11
17 Chapter three discusses rainwater harvesting and includes a description of RWH systems, the types available, existing rainwater quality standards, treatment processes involved in RWH Chapter four describes the site where the domestic RWH system was installed at Ballinabrannagh, Co. Carlow. It provides a description of the operation and monitoring of the RWH system Chapter five describes the site where agricultural RWH system was installed. It provides a description of the operation and monitoring of the RWH system. Chapter six describes the site where the school RWH system was installed. It provides a description of the operation and monitoring of the RWH system Chapter seven presents the results from the monthly monitoring assessment of the RWH systems installed at the domestic, agricultural and school sites. Modelling of how the RWH performed using the Yield after spill (YAS) algorithm. Chapter eight considers circumstances where rainwater harvesting could be viable in Ireland Chapter nine discusses the results presented in chapter seven and provides some conclusions from the project and recommendations for RWH. 1.4 Dissemination of Study Outputs The research study outputs have been disseminated in a number of publications at international conferences and peer reviewed journals. Copies of these publications are included in the appendices. These are listed as follows: 1. O'Hogain, S., Reid, A., McCarton, L., Pender, J., McIntyre, N.: Water Savings and Rainwater Harvesting Pilot Project in Ireland. Proceedings of the European Water and 12
18 Wastewater Management (EWWM) Conference, 12th - 14th Sept, 2007, Newcastle, edited by Horan, N, Aqua Enviro Sept ISBN: McCarton, L., O'Hogain, S., Reid, A., McIntyre, N., Pender, J.: Pilot Rainwater Harvesting Study Ireland. 14th International Rainwater Catchment Systems Conference. Malaysia, McCarton, L., O'Hogain, S., Reid, A., McIntyre, N., Pender, J.: Rainwater Harvesting Pilot Project Report. National Rural Water Monitoring Committee, O'Hogain,S, McCarton,L, McIntyre,N, Pender,J, Reid,A; Physicochemical and microbiological quality of water from a pilot domestic rainwater harvesting facility in Ireland, Water and Environment Journal, Volume 25, Issue 4, Pages , December 2011, Chartered Institute of Water and Environment Management. 5. O'Hogain,S, McCarton,L, McIntyre,N, Pender,J, Reid,A; Physicochemical and microbiological quality of harvested rainwater from an agricultural installation in Ireland, Water and Environment Journal Promoting Sustainable Solutions, Volume 26, Issue 1, Pages 1 6, March 2012, Chartered Institution of Water and Environment Management. 6. McCarton, L., O'Hogain, S., Reid, A., McIntyre, N., Pender, J Thermal Destruction Analysis of Water Related Pathogens In Domestic Hot Water Systems publication pending 7. National Rural Water Monitoring Committee/Department of the Environment, Heritage and Local Government Internal Quarterly Reports, McCarton, L., O Hogain, S., Reid, A., Rainwater Harvesting Monitoring Report, Carrowholly National School, Co. Mayo, Internal Report issued to Department of Environment, Heritage and Local Government, Sept
19 2 WATER SERVICES IN IRELAND 2.1 Introduction This chapter will set out the background to current water sector reform in Ireland. Relevant European Commission (EC) and National legislation is summarised. A summary of the main water resources within the country is presented. A comparison of water sector organisation and financing within Northern Ireland, Scotland, England and Wales is also presented. Finally, the organisation and funding model adopted by Ireland to fund water services is discussed. 2.2 Background to Water Sector Reform in Ireland Following a contraction of the construction sector in Ireland in the period , the economy experienced a consequent profound adjustment downwards. This adjustment led to an erosion of confidence in the banking sector and lead to a loss of deposits and market funding. The Irish banking sector has strong financial linkages to the rest of the world and the contagion threat from Ireland to European banks was considered to be significant. Consequently, under pressure from the European Central Bank, on 21 November 2010, the Irish Government requested external financial support. Discussions were held in Dublin during November 18-30, 2010 with representatives from the International Monetary Fund (IMF), European Commission (EC) and European Central Bank (ECB), (IMF Country Report, No. 10/366, Dec 2010). On 28 November 2010, the Irish Government agreed to the provision of an 85 billion financial support programme for Ireland by the EC / IMF / ECB on the basis of specified conditions. The conditions were set out in a Memorandum of Economic and 14
20 Financial Policies (MEEP). This memorandum set out an agreed National Recovery Plan for the three year period of the financial support. The memorandum had significant implications for the Irish Water Sector. Under the agreed National Recovery Plan the existing thirty four local authorities will be replaced by a single State run body, to oversee provision of water services in Ireland. This new state agency is called Irish Water ((DoECLG (a), 2012).). Funding and powers in relation to water services have been devolved from the local authorities to Irish Water. Irish Water is an independent state owned company within the Bord Gais group (DoECLG (b), 2012). 2.3 Legislation within the Water Sector in Ireland In its capacity as provider of water and wastewater services Irish Water must comply with current and future European and National legislation. A summary of European and National legislation adapted from the Irish Water Phase 1 Report, (Price Waterhouse Coopers, 2011) is shown in Tables 2.1 and 2.2. The newly established Irish Water is discussed later in the chapter. 15
21 16 Current National Legislative Framework The standards, functions, obligations and practices in relation to planning, management and delivery of water services and waste water collection and treatment services are governed by the Water Services Act 2007 (2007 Act). Under the 2007 Act certain persons are entrusted with particular powers and responsibilities. Current European Legislative Framework Wide-ranging series of legislative provisions at European level requiring member states to implement national regulatory frameworks for planning /delivery of water services Legislation Key aspects Objective The Water Framework Directive (2000/60/EC) Eight river basins identified on island of Ireland 4 River basins in Republic, 3 include cross border waters with Northern Ireland, and 1 entirely within Northern Ireland. This establishes a structure for long term sustainable water management by focusing on integrated planning and promotion of sustainable water use. Focusing on river basin management plans rather than on administrative/political boundaries. Applies to all waters-rivers, lakes, groundwater, coastal and estuarine and their dependent wildlife and habitats. Identify appropriate competent authority to oversee river basin management plans. This role is assigned to the constituent councils of each river basin district by the 2003 Water Regulations with one council designated to act as the coordinating authority for that district To deliver long term protection of water. To improve water bodies classified as lesser status so as to gain good status by To maintain and preserve water bodies classified as good or better at present. EU Drinking Water Directive This directive prescribes the quality and monitoring requirements for potable water supplies. The Drinking Water Directive is transposed into Irish law by the European Communities (Drinking Water) (No. 2) Regulations, 2007 (S.I. No 278 of 2007) (known as Drinking Water Regulations ). A water service authority must: ensure any water it provides meets prescribed quality standards; quantify compliance with the parametric values in accordance with an approved sampling and analysis regime monitor compliance of all drinking water supplies in its functional area -take appropriate remedial action or ensure that action is taken to restore the quality of noncompliant supplies. To ensure that water intended for human consumption is wholesome and clean thus ensuring protection of human health. Urban Waste Water Treatment Directive Waste Water Directive was transposed into Irish law by the Urban Waste Water Treatment Regulations 2001 (S.I. No 254 of 2001) The directive requires biennial reporting to the EC on the disposal of waste water and sludge. Other European legislation Sets out the requirements for collection systems and treatment standards for waste water. Based on centre size and sensitivity of the receiving waters of treated water and storm overflow discharge. Secondary treatment of waste water must be provided for population centres above a certain size. Additional nutrient reduction must be provided for discharges to sensitive water bodies/ Groundwater Directive (80/68/EEC), Shellfish Directive (2006/113/EC), Nitrates Directive (91/676/EEC), Bathing Water Directive (2006/7/EC), Sewage Sludge Directive (86/278/EEC), Freshwater Fish Directive (2006/44/EC), Habitats Directive (92/43/EEC), Birds Directive (2009/147/EC), Dangerous Substances Directive (2006/11/EC) Table 2.1 European Legislation in relation to water and wastewater adapted from PwC, 2011 Protection of receiving waters from harm due to discharges from treatment plants and storm overflows. These directives all impact on the planning and delivery of water services in Ireland
22 17 Authority Some Roles /Responsibilities /Powers under Water Services Act 2007 Minister for Environment, Community and Local Government Water Service Authorities 34 City and County Councils (29 County councils and 5 City councils) Environmental Protection Agency (EPA) Supervision and monitoring of water services authorities performance in their functions under the 2007 Act The planning and supervision of water services investment programmes Specification of standards / guidelines / codes of practices with regard to provision of water services Implementing water services strategic plans / land acquisitions / licensing water services providers Produce regulations under which water service authorities are required to provide specified water services to specified classes areas of either sufficient concentrated population or economic activities Provides water services in agreement with prescribed standards/ public policy for domestic / commercial requirements within its functional area. Under 2007 Act and the State Authorities (Public Private Partnership Arrangements) Act 2002 an authority can enter into an agreement with another person to provide water services in part or all of its functional area. Under the 2007 Act two or more water services authorities can enter into an agreement where one or more of them or as a joint effort carry out any or all of their functions under the 2007 Act, in either part or all of their respective areas. Water services authorities must follow policy when exercising powers in areas such as planning /development, sustainable management of water resources, protection of human health. Maintain the environment and National and EU Regulatory requirements including a river basin management plan or programme of measures under the Water Framework Directive. Powers of a water services authority include delivery of water supplies, i.e. to abstract, store and treat water and supply it for drinking or any other purpose, or to purchase it for onward supply. Authorities have the power to carry out metering and monitoring of water services, acquisition of premises and wayleaves and provide water services. Authorities are responsible for the licensing and supervision of group water schemes. Under the Drinking Water Regulations water services authorities supervise all other drinking water supplies within their functional area. Authorities provide, operate and maintain sewers and waste water networks along with waste water treatment plants With regard to water services the role and function of the EPA include; Under the Water Framework Directive and other coordination functions under the 2003 Water Regulations reporting to the European Commission Monitoring potable water for compliance with Drinking Water Regulations is the responsibility of the water service authorities, their monitoring programmes are overseen and approved by the EPA. The EPA has enforcement powers to ensure that water service authorities are compliant with their monitoring obligations. The EPA can directly intervene to carry out necessary remedial works in a situation of non-compliance and recover costs from the supplier. Waste discharge from sewage systems to aquatic systems operated /managed by water services authorities are licensed and certified by the EPA under the Environmental Protection Agency Act 1992 Other applicable national legislation Planning and Development Act 2000, which provides for planning and sustainable development; European Communities (Environmental Assessment of Certain Plans and Programmes) Regulations 2004 and the Planning and Development (Strategic Environmental Assessment) Regulations these require that the environmental consequences of development plans and local area plans are identified and assessed during their preparation and before their adoption Waste Management Acts 1996 and 2001 and related regulations which impose the legal framework for the management of waste, e.g. treatment and disposal of sludge arising from water and waste water treatment plants. Local Government (Water Pollution) Acts, 1977 and 1990 and supporting regulations which set out key requirements for the prevention of water pollution. Table 2.2 Irish Legislation in relation to water and waste water adapted from PwC, 2011
. Generally, December and January show the greatest monthly rainfall.")
23 2.4 Water Resources in Ireland Annual Rainfall In the east of the country average annual rainfall is between mm. Between mm of rain falls in the west per annum while some mountainous regions exceed 2000 mm annually (Met Éireann, 2012). Generally, December and January show the greatest monthly rainfall. April typically has the lowest recorded monthly rainfall although in some southern counties, June is often the driest month. The number of days annually with 1mm or greater rainfall is approximately 150 days in the east and south east coasts and 225 days in parts of the west (Met Éireann, 2012). Average rainfall rates ranges from 1-2 mm per hour, with rates of up to 10 mm per hour recorded over short term events. Short term rates of mm per hour may be expected once every 5 years. Hourly rates exceeding 25 mm per hour are rare and usually associated with thunderstorms (Met Éireann, 2011). Figure 2.1 Mean Annual Rainfall (mm) (Met Éireann, 2012) 18
 than other regions of the country but it has a higher demand for water resources. Figure 2.2 Observed annual precipitation changes 1961-2006.")
.")
24 2.5 Climate Change Effects Much of the Irish population is concentrated on the eastern side of the country. This region is drier ( mm per annum) than other regions of the country but it has a higher demand for water resources. Figure 2.2 Observed annual precipitation changes (Adapted from EEA report Water resources across Europe- confronting water scarcity and drought, 2009). Figure 2.2 indicates that annual precipitation levels in the east and south of the Irish republic have reduced by up to 60 mm over the period (EEA, 2009). During this time the population increased by 72% in the east and by 38% in the south of Ireland (CSO, 2011). Presently water resources are pressured due to decreasing rainfall levels and increased demand in the eastern and south-eastern regions. Future changes to seasonal precipitation patterns as predicted by Community Climate Change Consortium for Ireland Project (C4I) will increase pressures on water resources. 19
25 Potential future changes in Ireland s climate have been compiled by (C4I) (C4I, 2008). This C4I project predicts changes to seasonal precipitation patterns. These are given in Table 2.3 Spring Summer Autumn Winter to 5% 5 to 10% 5 to 10% increase decrease decrease least affected 10 to 18% decrease 15 to 20% increase to 25% increase in northern half of country Table 2.3 Predicted seasonal precipitation for 21 st Century Ireland (Reference period ) (C4I, 2008) 2.6 Irelands Surface Water Resources Irish rivers, lakes and groundwater provide relatively abundant freshwater resources. These are shown in Table 2.4 and Figure 2.3 Ireland s Water Resources Rivers Lakes Groundwater 400 river catchments mostly 18 lakes with surface Source of 25% of Ireland s drinking demand. small catchment areas areas > 10 km 2 9 large catchment areas account for 50% land drainage in Ireland 8 River Basin Districts under EU Water framework Directive 2000/60/EC to protect water resources 6000 lakes with surface areas > 0.01 km 2 (1 hectare). Most of the 6000 lakes are less than 0.5 km 2 Most productive aquifers underlie approximately 25-30% of State s land area. Groundwater in some counties accounts for a large percentage of water demand e.g. Roscommon, groundwater supplies up to 80% of drinking water demand. Table 2.4 Ireland s Water resources (NDP, 2005) 20
 Surface water supplies the greatest portion of drinking water in")
26 Figure 2.3 Map of Ireland s Rivers and lakes (Fallon s Map Explorer 1, Brenda McGee) Surface water supplies the greatest portion of drinking water in Ireland at 81.9% while groundwater and springs supplies 10.3% and 7.8% respectively (EPA, 2011).This is illustrated in Figure
27 Springs, 7.8% Groundwater, 10.3% Surface Water, 81.9% Figure 2.4 Water Resources for Drinking Water Supply in Ireland The Water Framework Directive (WFD) is the guiding principle and standard under which water resources are governed and managed (WFD Ireland, 2011). All water resources, i.e. groundwater, surface waters, coastal and estuarine are covered under the directive. Water resources are managed under river basin management plans. Eight river basin districts (RBD) have been identified on the island of Ireland. 2.7 Water services organisation in Ireland In Ireland, the overall responsibility for water services lies with the Minister and the Department of Environment, Community and Local Government (DoECLG). The provision of potable water supply to households and industry is the responsibility of the 34 Local Authorities. (Figure 2.11) They supply approximately 1.6 million litres of water daily (DoECLG (a), 2012). Additional responsibilities include production, distribution and monitoring of drinking water along with assessing and prioritising water supply requirements, implementing and contracting capital projects and the 22
28 operation, maintenance and management of services and facilities (or the contracting of such). Irish Water will assume these responsibilities when operational Figure 2.5 Local Authorities in Ireland. Financing Irish water services currently costs around 715 million in operational costs and 500 million in capital costs. Approximately 200 million is recouped through nondomestic charges for water supplies. Presently there is no economic regulation of Irish water services. Each Local Authority sets water charges for their non-domestic customers. Water charges vary widely between authorities, in Kildare the charge is 1.75 per m 3 while in Wicklow it is 3.04 per m 3 (DoECLG (a), 2012). 23
29 2.7.1 Model for Irish Water Assessment of the existing Irish water services sector in comparison to similar services internationally highlighted some performance indicators. These are shown in Table 2.8 ((DoECLG (a), 2012). Performance Indicators Operating Costs Leakage levels Employment Kilometre main per 1000 connections Irish Water services in comparison to UK and Northern Ireland % more expensive 200% the average UK value 25% more people employed compared to UK median numbers Slightly lower than UK average Table 2.5 Irish water services comparison to UK and Northern Ireland water services ((DoECLG (a), 2012). The PwC report presented to Government recommended that Irish Water be created as a public utility in a regulated environment (Government White Paper, 2012). This means that Irish Water be given full responsibility under law for all aspects of water services provision at local, regional and national level. This will allow more co-ordinated management and operation of river basin plans by Irish Water. All water sector assets and liabilities of the local authorities will transfer to Irish Water (DoECLG (a), 2012). This transfer from the present structure of 34 local authorities to Irish Water is seen as being a staged process. The functions of Irish Water are outlined in Figure For Irish Water to avail of private finance for investment in capital projects an independent economic regulator is required. The approach to water sector regulation proposed is similar to Northern Ireland. The energy and water sectors are regulated under the Northern Ireland Authority for Utility Regulation (Government White Paper, 2012). In the Republic, the Commission for Energy Regulation (CER) is proposed as the new regulator of the water sector and Irish Water (Government White Paper, 2012). 24
30 In 2010 the Organisation for Economic Co-operation and Development (OECD) report Environmental Performance Review of Ireland noted that the efficient environmental, economic and social development of Irish water services is impeded by the absence of water charges (OECD, 2010). Under the Programme for Government (PfG) a universal metering programme to commence by the end of 2012 is proposed. Water charges and volumetric charges have where introduced contributed to a reduction in water consumption (DoECLG (a), 2012). Studies in the UK have shown where water meters have been installed that reduction in household consumption and distribution input of 11% and 22% respectively have been achieved. This reduction is attributed to leakage control and reduced consumer demand. The introduction of domestic water metering in Ireland has caused debate. How water charges will be levied and what provisions will be available as regards affordability where water charges may cause hardship have yet to be finalised. Irish Water will influence both economic and environmental policy in the management of Irish water resources, which will in turn influence how rainwater harvesting will be viewed and adopted in Ireland. 25
31 26 Assistance to Group Water Schemes (GWS) Assume role from local authorities Financial assistance tackle deficiencies in publicly and privately sourced GWS Customer Services Single point contact Billing New connections etc Abstraction / Treatment/ Distribution Drinking Water to commercial / domestic / industrial customers not served by Group Water Schemes Private Finance Sourcing investment in capital projects Irish Water Collection / Treatment /Disposal Wastewater and Sludge Disposal Management and operation of combined sewers overflow Water metering roll out of water metering programme Maintenance / Upgrade of Infrastructure Conservation of water supplies reduction of leakage Strategic Planning for Sector Water Resources Management Localised Catchment management focus on source protection Figure 2.6 Functions of Irish Water (PwC, 2011)
32 3 Roof Water Harvesting This chapter presents international best practice in rainwater harvesting systems. Rainwater harvesting systems range from simple systems such as a water butt attached to a down pipe at the side of a house or shed, to more complex systems involving storage tanks, pumps and filters. The volume of rainwater collected by a RWH system is dependent on the annual rainfall and the amount of that rainfall captured by the RWH system. Harvested rainwater is used for toilet flushing, clothes and personal washing and as a means of supplementing mains water supply. It is also used as a source of drinking water in regions where water is scarce due to drought (Australia) or regions where there are no mains supplies (India). It is used for garden and crop irrigation and in some areas for aquifer regeneration (UN Habitat, 2005). 3.1 Roof Water Harvesting Components All rainwater harvesting systems can be divided into six components (Texas Water Development Board, 2005). Catchment surface Conveyance system Filtration / separation Storage Delivery Use 27
33 3.1.1 Catchment surface This is the area from which the rain runs off to the collection system. In most instances it is the building s roof. Any roofing material may be used for rainwater harvesting for non-potable use (Kinkade-Levario, 2007). As roofing materials can influence the quality of the rainwater that is collected they must be considered carefully if the RWH system is to be used for potable water supply. For example rainwater collected from a green roof is likely to be coloured (BS 8515:2009). The volume of rainfall captured is determined by the roof s run-off co-efficient. For any catchment this is the ratio of the volume of water that runs off the surface to the volume of rainfall that falls on the surface (UN Habitat, 2005). Roof run-off co-efficient = Rainfall on roof Rainfall flowing from roof Table 3.1 gives values for run-off coefficients for some roofing materials. It also indicates some of the inefficiencies in terms of rainfall capture to the RWH system. As rain falls some of the rainfall is trapped by the roof material or is held in depressions on the roof and does not progress to the conveyance system. Roof Type Run-off Pitched roof with profiled metal 0.9 sheeting Pitched roof with tiles 0.8 Flat roof without gravel 0.8 Flat roof with gravel 0.8 Table 3.1 Runoff co-efficient for roofing materials (BS 8515:2009) A roof with a run-off co-efficient of 0.8 will convey 80% of the rainfall incident on it to the collection system for harvesting, while 20% of the rainfall will be lost to the RWH system. 28
34 3.1.2 Conveyance system Includes gutters and down pipes to convey the rain from the roof to the storage tank. Roof outlets, guttering and pipe work should allow for routine maintenance and cleaning. Collection pipe work should allow the rainwater to flow by gravity or siphonic action to the storage tank(s). To prevent stagnation the pipe work should be free draining and also prevent contaminated water entering the system from outside sources. Ground level gullies should be sealed to prevent debris/pollutants entering the system (BS 8515: 2009). Guttering can be either standard construction material or specially designed to either maximise the amount of harvested rainfall or to enhance the building facade Filtration / Separation Protecting the quality of the harvested rainwater requires that roof debris and dirt be excluded from entering the storage system. Introducing a filtration system before the collected rainwater enters the storage tank prevents debris accumulating in the tank (BS 8515:2009). This helps to protect the quality of the rainwater collected and stored by the RWH system. A filtration system should include a filter that has the following characteristics (BS 8515:2009); i. water and weather resistant ii. removable and readily accessible for maintenance purposes iii. has an efficiency of at least 90% iv. passes a maximum particle size of <1.25 mm. The type of filtration required depends on the ultimate use of the harvested rainwater. The requirements and specifications of filters used where the harvested rainwater is used for potable use drinking / cooking are much more exacting than for non-potable uses such as toilet flushing / garden irrigation. 29
 shows the type of debris that can build up in gutter, by placing a screen along the gutter (Figure 3.")
 on the downpipe allows the rainwater through while leaves are washed off from the sloping mesh.")

35 Figure 3.1 (a) Debris collecting in gutters (b) Gutter filter (c) Leaf filter on downpipe Figure 3.1 (a) shows the type of debris that can build up in gutter, by placing a screen along the gutter (Figure 3.1 (b)) leaves and other large particles of debris are prevented from being washed into the gutter. A leaf filter Figure 3.1 (c) on the downpipe allows the rainwater through while leaves are washed off from the sloping mesh. A second method of protecting the rainwater quality is to wash the roof surface by collecting the first few millimetres of rainfall and discarding it. This is known as first flush. Any accumulated debris or pollution sources present on the roof surface are removed before they can enter the storage tank. The WHO recommends the first litres for the average sized roof be diverted and discarded. Studies by Martinson and Thomas lead them to conclude that For each mm of first flush the contaminate load will halve (Martinson, Thomas, 2005). 30
36 Figure 3.2 Examples of First flush devices Figure 3.2 shows some first flush devices. As rainwater enters the chamber, it fills and the float rises with the water level until the float closes off the entrance to the chamber (Rain Harvesting, 2009). The rainwater then flows to the storage tank. The chamber holds the first rainfall and any debris washed from the roof. This chamber has a small opening that slowly releases the water to waste, resetting the first flush device for the next rainfall event Storage system The storage system consists of a tank or tanks which store the water for immediate and future use. The inlet to the tank from the collection system should be via a calmed inlet (Figure 3.3). The velocity of the water is slowed down so that it enters the tank without disturbing and re-suspending any fine settled material or bio-film at the tank bottom. The calmed inlet facilitates the introduction of oxygen to the bottom layers in the tank by introducing aerated water to the bottom of the tank. This prevents anaerobic conditions forming keeping the stored water fresh (Bio Pure Technologies, 2012). 31
 Many rainwater tanks in Australia are manufactured from galvanised steel.")
37 Figure 3.3 Calmed Inlet (Image available at A variety of materials are used in the construction of storage tanks. Some of these materials are given in Table 3.2 Tank Use material Steel In the UK if steel tanks are used, it is recommended that such tanks conform to BS EN i.e. steel used is coated with non-corrodible materials (BS 8515:2009) Many rainwater tanks in Australia are manufactured from galvanised steel. Galvanised steel is not rust resistant, but can be coated with rust resistant coatings such as Zincalume or Aquaplate. Galvanised steel acquires a thin film after initial corrosion. This protective film coats the surface of the steel and prevents further corrosion. It is important not to disturb this film when cleaning the tank (Cunliffe, 1998) Concrete Concrete and ferro-cement tanks can be installed underground because of their longevity and strength. Lime can be leached from new tanks resulting in the ph of the water increasing. This can impart a taste to the water if the RWH system is to be used for potable water supply. Such tanks may need to be flushed before use (Cunliffe, 1998). Fibreglass Plastic Fibre glass tanks used for rainwater collection and storage are manufactured with a cured food grade lining on their interior surface. These tanks must be manufactured to prevent light entry. The exclusion of light into the tank discourages algal growth in the tank (Cunliffe, 1998). An increasing range of tanks are made from polymers. For rainwater collection and storage the type of plastic tank used depends on the use the rainwater is to be put to. Where the RWH system is used to provide drinking water the tank and plastic liners for tanks must be manufactured from food grade materials. In Australia where RWH systems regularly supply drinking water materials used in manufacture of the tanks must comply with the standard AS Table 3.2 Tank materials used in RWH systems Pipework connections should allow the through flow of water to avoid problems of water stagnation, ventilation points should be screened and tanks should have lids to 32
38 prevent contamination. The stored water must not be capable of reaching temperatures suitable for Legionella reproduction (BS 8515:2009). This factor must be considered when deciding on a site for the storage tanks. Lids must be securely fitted to prevent drowning hazards and to omit light thus preventing algal growth. For tanks positioned above ground risk of leakage must be considered hence additional drainage and bunding may be necessary. Loading of the structure is important when deciding on a location for storage tanks (BS 8515:2009) Delivery system There are three basic types of delivery system used to supply harvested rainwater water to the site of use (BS 8515:2009). They are described as follows; i. Direct system harvested rainwater pumped directly to the points of use; ii. Gravity system rainwater fed by gravity to the points of use; iii. Indirect system rainwater - pumped to an elevated cistern and fed by gravity to the points of use. These systems are illustrated as follows; Direct system harvested rainwater pumped directly to the points of use In a direct RWH supply system or pressurised system (Roebuck, 2008) rainwater is firstly collected from the roof and stored in a storage tank. The harvested rainwater is then pumped directly from the storage tank to the point of use on demand such as toilets or washing machines (BS8515:2009). 33
39 Figure 3.4 Direct system -Rainwater collected and pumped directly to points of use (adapted from BS 8515:2009) Mains top is provided to the storage tank to ensure constant supply of water for use in the event of long periods of dry weather. No header tank is used in this system. When the storage tank is full any incoming harvested rainwater will flow to overflow to either the sewer system or soak away facility. Advantages of directly pumped systems are that they are ideal for garden hoses and washing machines as the water is provided at mains pressure and that they do not require a header tank (Roebuck, 2008). If the pump fails due to mechanical/electrical failure or power loss no water can be supplied to points of use. Thus toilet flushing would require the use buckets of water and washing machines could not be used. Mains top-up controls can also be more complicated than with indirect and gravity fed systems (Roebuck, 2008). 34
40 Gravity system rainwater fed by gravity to the points of use Figure 3.5 Gravity system - Rainwater collected in storage tank and fed by gravity to points of use (adapted from BS 8515:2009) This is the type of system installed at Carrowholly National School, Westport Co. Mayo. In a gravity fed RWH system, the harvested rainwater is collected, filtered and piped directly to the storage header tank in the roof (BS8515:2009). Having the only storage tank in the roof is the main difference between a gravity fed system and the direct RWH and indirect RWH system. The harvested rainwater is delivered to its points of use via gravity. The storage tank should be at least 1m above the points of use (Roebuck, 2008). Mains top-up (not shown) is supplied to the storage header tank to ensure water availability in the event of a dry weather. When the storage tank is full any additional rainwater supplied to the tank will overflow to sewers or soak away system. An advantage of this system is that no pump is required unlike the other systems so 35
41 electricity supply is not required, and risk of pump failure is eliminated. Disadvantage of a gravity system is that volume of harvested rainfall that can be stored with this configuration is potentially less than for the other two systems. Water pressure may be an issue, it may be less than that of mains supply. This can cause poor performance in the RWH fed appliances e.g. slower filling toilets or with some models of washing machine the water pressure may not be sufficient and they stop working (Roebuck, 2008). Indirect system rainwater - pumped to an elevated cistern and fed by gravity to the points of use Figure 3.6 Indirect RWH - Rainwater collected in tank, pumped to an elevated tank, points of use fed by gravity (adapted from BS 8515:2009) 36
42 This is the RWH system used during the study at the domestic site at Ballinabrannagh, Co. Carlow and at the agricultural site at Clonalvy, Co. Meath. In an indirect RWH system, the harvested rainwater is stored in an underground storage tank, and then pumped to an elevated tank and points of use are supplied by gravity. Mains supply acts as a backup in the event that there is insufficient harvested rainwater available (BS8515:2009). Advantages of this type of RWH system include, in the event of pump failure water will still be supplied to the points of use via mains top-up facility. Low cost pumps and simple controls are possible and systems tend to be energy efficient as the pump runs at full flow (Environment Agency, 2007). Disadvantages are similar to the gravity RWH, low pressure feed to appliances may be a problem. The low pressure issue has been solved by some commercial RWH systems by using a hybrid system (Roebuck, 2008). Toilet demand is supplied via gravity from a header tank with a mains top-up facility. While water for the washing machine and garden use is supplied using a pump at equivalent mains pressure. This hybrid system has the advantage that if there is a pump or power failure toilet demand is supplied and toilets can be flushed normally Uses BS 8515:2009 states that using harvested rainwater for toilet flushing and general garden watering is considered to be low risk as the level of human exposure to the water is low. If rainwater is used for pressure washers and garden sprinkler systems, these increase the creation of aerosols which poses an increased risk of exposure. In this case a risk assessment is required to evaluate the potential sources of contamination entering the system (BS 8515:2009). If the RWH system is to supply drinking water or bathing needs then a more rigorous treatment regime is required. Disinfection of the water is required; this can be achieved using UV- lamps and/or chemicals. 37
43 3.2 International Policy Rainwater Harvesting The best rainwater harvesting policies protect water as a human right, protect public health and promote sustainability. Through a combination of incentives, taxes and penalties, meaningful water conservation can be achieved (Meinzen, 2009) Germany Germany is a leading exponent of RWH, since 1970 pro-environmental legislation in the areas of water legislation, building regulations and municipal ordinances have increasingly been modified and up graded to increase sustainable resource conservation and protection and maintenance the natural water cycle (Koenig, 2005). Initially the main thrust of the German Water Resources Act (WHG) legislation was a political imperative to ensure secure and hygienically safe water supply. This has now been overtaken by a more ecological principle added in Section 1a, which states that Everyone is obligated,.. to endeavour to use water economically, in order to protect available water resources. And that sustainable water conservation is needed...in order to maintain an adequate water supply while sustaining the water balance, and prevent increased water runoff (Koenig, 2005). The popularity of rainwater harvesting in Germany may be attributed to two factors, cost of mains water to the consumer and the implementation of a rain tax. As part of this sustainable ethos, rain taxes are collected relative to area of impervious surface cover on a property that generates runoff directed to the local storm sewer (Meinzen, 2009). In Berlin and many other German cities a charge has been levied since 2000 for the diversion of rainwater to the sewer system. Between 2008 and 2012 charges in Berlin for rainwater diverted to the sewer system increased from 1.72 per m 2 drained area to 1.83 per m 2. While over the same period water charges decreased from 2.07 to 2.03 per m 3, and waste water charges decreased from 2.57 to 2.46 per m 3. Producing 38
44 approximately 80,000 RWH systems annually, Germany is leader in development of rainwater harvesting systems (König, Sperfeld, 2003) United States Rainwater harvesting is popular in rural areas in the USA, a 1995 survey showed that there were approximately 250,000 rainwater harvesting systems in the USA (Kinkade- Levario 2007). Rainwater harvesting systems tended to be localised in areas either where centralised water supply systems are non-existent or where groundwater is not readily available or its use is unsustainable USA (Kinkade-Levario 2007). Rainwater harvesting systems are now gaining more wide spread popularity in the USA Changing climate conditions along with increasing populations have increased pressures and emphasis on finding alternatives to supplement water supplies. California and Atlanta, Georgia have introduced water restrictions due to the lack of rainfall (Kerrigan, 2009). The increased demand for water resources has encouraged municipal governments and educational institutes in providing educational courses and research to look at rainwater harvesting as a viable option to mitigating water shortages (Kerrigan, 2009). Some states have local laws and incentives to encourage water saving measures. Tax credits in Arizona are available as a one-off tax credit of 25% of the cost of water conservation system (the maximum limit is $1,000) for its residents. A water conservation system is defined as any system, which can harvest residential rainwater or grey water. (Lancaster, 2013) All commercial developments are required to harvest all roof drainage to cisterns so that the collected rainwater may be reused for landscape irrigation. In the Texan city of San Antonio up to 50% rebates are available for rainwater harvesting projects under the San Antonio Water System (SAWS). In Santa Fe and Bernalillo counties and Albuquerque in New Mexico, residences of 2500 sq. ft. (232m 2 ) or greater are required to install a rainwater harvesting system containing 39
45 cisterns. All commercial developments are required to harvest all roof drainage to cisterns so that the collected rainwater may be reused for landscape irrigation (Lancaster, 2013). Not all states encourage rainwater harvesting; Colorado and Washington have legislation which prevents rainwater collection due to a perceived threat to irrigators. These water rights are defined as first in time, first in line, thus those with oldest water rights control access to the water. Some of these laws have been challenged and changed Australia The Australian government put in place strategic programs called Water for the Future a ten year, $12.9 billion investment to improve management and delivering a range of water policy reforms in both urban and rural areas (DEWHA, 2010). Under its auspices the National Rainwater and Greywater Initiative funding is available to help people use water wisely (Department of Environment, Australia, 2012), Rebates are available for purchase and installation of a new rainwater tank connected for internal reuse of the water for toilet and/or laundry use. From July 2005 both new houses and apartments must be constructed to meet 5 Star standards to meet energy efficiency and water management requirements. This standard requires an energy efficiency rating for the building fabric; water efficient taps and fittings; plus either a rainwater tank for toilet flushing, or a solar hot water system are installed. In New South Wales a 40% reduction in mains water use was targeted under the Buildings and Sustainability Index (BASIX) regulations. Measures introduced included installing water efficient water fittings and use of a rainwater tank or alternative supply for toilet flushing and /or laundry use and for outdoor water use. Analysis of water savings made by customers of Rous Water in 40
46 New South Wales in 2013 showed that over the Rous Water supply system that on average 42% savings were made by households under BASIX (Rous Water, 2013). 41
47 4 Domestic Rainwater Harvesting project 4.1 Project site: Milford Park, Ballinabrannagh, Co. Carlow The site chosen for investigation of the domestic use of rainwater was a new housing estate six km south of Carlow town at Milford Park, Ballinabrannagh, Co. Carlow, at 52 47' 08" N 6 59' 56" W. This location is shown in Figure 4.1. Figure 4.1 Map of Domestic site at Milford Park, Ballinabrannagh Co. Carlow Mains water is supplied by the Ballinabrannagh group water scheme. Initially four houses were selected for study, one, a bungalow fitted with rainwater harvesting (RWH) facilities, and three two-storey houses with standard plumbing. The three standard 42
.")
 for storage via a data logger.")
48 houses acted as controls and were monitored for water use only, so that any water savings made by the RWH system installed could be evaluated. Additionally, monitoring the four households allowed for patterns of water use to be investigated and calculation of per capita consumption (PCC). Local weather conditions were recorded using a Vantage PRO2 Weather Station (Figure 4.2) from Davis Instruments. It was installed on a farm within few hundred metres of the housing estate in Weather data was sent wirelessly to a Davis weather console situated within 100m of the weather station (Figure 4.3) for storage via a data logger. Using the Davis software package Weatherlink the stored weather data was downloaded approximately every 6 weeks between November 2005 and March Figure 4.2 Davis Weather Station at Ballinabrannagh Figure 4.3 Davis Weather Console 4.2 Design The design criteria for the RWH system was to supply 45 litres per head per day (l -1 hd - 1 d -1 ) for toilet use in a four person household with capacity for a thirty day dry storage period. This required that the system have 5.4m 3 storage capacity. The RWH system installed (Figure 4.4) collected the harvested rainwater in a 9m 3 underground storage tank. The rainwater was pumped on demand to a header tank in the attic from which the toilets and garden tap were supplied by gravity. 43
49 Figure 4.4 Rainwater System installed in Ballinabrannagh, Carlow 4.3 Site works During construction of the house with rainwater harvesting a 9m 3 pre-cast concrete collection tank was installed underground on a foundation of gravel in the front garden (Figure 4.5). 44
 to the inlet of the collection tank in the garden.")

50 Figure 4.5 9m 3 Underground tank in the garden Down pipes which normally drain rainwater from the roof to the drainage system were connected via an inline Rainman Type1 filter (Figure 4.6) to the inlet of the collection tank in the garden. A calming or smoothing inlet in the collection tank was installed which calmed the water as it entered the tank preventing any settled material at the tank bottom being disturbed (Figure 4.7). Figure 4.6 Inline Rainman Type 1 Filter Figure 4.7 Calming Inlet in underground tank Extra pipe work was required to connect the collection tank s overflow and the filtered rainwater waste containing roof debris such as leaves to the drainage system. To ensure that the rainwater quality was not compromised by debris and dirt from paths around the house, points where the down pipes connect with the ground pipes were sealed using silicone sealant. This seal prevented dirt inflow to the RWH system and was easily removable if required (Figure 4.8). In the second phase of construction, houses fitted with a rainwater harvesting system had a plastic cover fitted at the point where the 45


51 downpipe connects with ground pipe. This cover was sealed with silicone sealant (Figure 4.9). Figure 4.8 Silicone sealed down pipe Figure 4.9 Plastic seal In addition to the normal mains header tank in the attic, a second header tank was installed. In the three control houses the mains header tank supplied the hot and cold water systems including the toilets. In the RWH house the mains header tank supplied the hot and cold water systems excluding the toilets. The extra header tank provided storage for the rainwater supplying the toilets in RWH house (Figure 4.10) Mains top up Rainwater header tank Mains header tank Meter & Transmitter Figure 4.10 Rainwater header tank & Mains header tank in attic of RWH House 46
 in the garden pumped the collected rainwater to the rainwater header tank in the attic. The pump s floating filter inlet (Figure 4.")

52 A submersible Multigo pump (Figure 4.11) placed in the collection tank (Figure 4.13) in the garden pumped the collected rainwater to the rainwater header tank in the attic. The pump s floating filter inlet (Figure 4.12) lay just below the water level, preventing any floating debris entering the pump. The pump had a safety mechanism which prevented the pump switching on if the water level in the tank was below a certain level. This protected the pump and prevented any settled material being disturbed, thus clogging the pump inlet or entering the rainwater header tank. Figure 4.11 Submersible Pump Figure 4.12 Floating filter inlet for pump 47
53 Figure 4.13 Underground Tank Schematic 4.4 Control of the RWH system To control and ensure the smooth running of the system a control management system was installed. Similar to the system installed on the agricultural site, a ballcock was used to control the water level within the rainwater storage tank (header tank). When the level of the ballcock fell, it signalled to the management system to pump rainwater from the garden collection tank to the rainwater storage tank in the attic. A safety feature of the system was a pump cut-off control. This functioned during periods of dry weather when there was insufficient rainwater available in the collection tank. The pump cut-off would engage to prevent the pump functioning. This would signal the management system to switch to the mains top up ensuring sufficient water at all times for toilet flushing. The mains top up device employed a Type AA air gap and 48

54 tundish (Figure 4.14) and ensured that no cross-contamination between the rainwater and the mains plumbing systems was possible. Figure 4.14 Type AA air gap 4.5 Metering system A metering plan shown in Figure 4.15 was designed for monitoring water use within the control houses. Mains Header Tank Cold Water System Hot Water System M2 M3 M4 Toilets Taps sinks /bath/ shower Taps sinks /bath/shower M1 Kitchen /Washing machine/dishwasher Mains In M = meter Figure 4.15 Metering System installed in Control Houses 49
 monitored the mains demand within the household; it was installed under the kitchen sink. Meters M2 M4 (Figure 4.")


55 The meters used were Bonyto Klasse C 1.5m 3 /h type. Meter 1 (M1) monitored the mains demand within the household; it was installed under the kitchen sink. Meters M2 M4 (Figure 4.16) were installed in the hot press in each house, M2 recorded water used in toilet flushing, M3 and M4 measured cold and hot water use respectively in the household at sink and bath taps and any appliances such as washing machines and dish washers. Figure 4.16 Meters plus transmitters installed in control houses & RWH house In one of the control houses the meter installed in the kitchen was removed to facilitate the installation of a water softening unit. A meter was subsequently installed externally to the house at the mains stopcock to the house (Figure 4.17). Figure 4.17 Meter with transmitter connected installed externally 50
56 M6 Mains Header Tank Rainwater Header Tank Cold Water System Hot Water System M2 M5 M3 M4 Taps sinks /bath/ shower Taps sinks /bath/shower Toilets Collection Tank in Garden M1 Kitchen /Washing machine/dishwasher Mains In M = meter Figure 4.18 Metering system installed in RWH House Figure 4.18 outlines the metering system installed in the RWH house. Meters M1 M4 monitored the same water parameters as for the three control houses. They were located as in the control houses, M1 under the kitchen sink, M2-M4 installed in the hot press. The additional meters, M5 and M6 were installed in the attic (Figure 4.10). Meter, M5 monitored rainwater flow from the collection tank to the rainwater header in the attic. The volume of mains top up entering the rainwater header tank in the attic was recorded by a meter labelled M Monitoring System To minimise disruption to the householders a remote monitoring system, Hydrometer s Hydro-Center was used (Figure 4.19). Meters were fitted with a radio transmitter (Figure 4.20) that allowed meter data to be transmitted to the Hydro-Center data logger 51


57 for storage. Each meter s reading was transmitted to and stored by the Hydro-Center four times per day: at 00:00, 06:00, 12:00 and 18:00. Due to site conditions, one Hydro-Center was incapable of picking up the transmitted meter readings from all four houses (Figure 4.21). Therefore two Hydro-Center units were employed, one was installed in the attic of one of the control houses; the second Hydro-Center in the RWH house attic. Figure 4.19 Hydro-Center Data logger, Figure 4.20 Meter Radio Transmitter Figure 4.21 Radio Receiver The Hydro-Center had mobile phone SIM card technology facilitating the remote downloading of stored data via a telephone and Hydrometer s software package Hydro- Center 2.35 (Figure 4.22). 52
58 Hydro- Center Receiver picks up transmitted signal from meters transponders in the three houses, stores the data in data logger until downloaded via telephone line and Hydro-Center Software Meter at foot path Figure 4.22 Schematic showing Hydro-Center system data collection, storage & retrieval 53
59 5 AGRICULTURAL RAINWATER HARVESTING PROJECT 5.1 Project Site: Beshellstown House, Clonalvy Co. Meath The agricultural site was located at Clonalvy, Co. Meath, approximately 50 km north of Dublin at N 6 o W (Figure 5.1). Figure 5.1 Agricultural site at Clonalvy, Co. Meath Rainwater harvesting facilities were installed over the summer of 2006 on a 250 acre farm which at that time was home to 250 cattle. Originally, a dairy farm, the farmer switched to beef production during the project. In March 2007 there were 114 cattle and 50 calves on the farm. Potable water is supplied to the farm by Meath County Council. The farm buildings are located in the centre of the farm; two of these buildings were 54
60 used giving a total catchment area of 1910m 2 for the installed RWH system (Figure 5.2). Figure 5.2 Farm schematic showing farm buildings used as rainwater catchment area 5.2 Site Works The installation of the RWH facilities required construction/excavation and installation work to be carried out. Pipe trenches were cut and excavated to lay pipes in the farm yard to convey the collected rainwater from the down pipes to a collection tank adjacent to one of the farm buildings (Figure 5.3). The guttering and down pipes on the farm buildings were replaced. Three 100 mm down pipes were used to convey the rainwater under gravity from the buildings roofs to the RWH system (Figure 5.4). Harvested rainwater is conveyed via underground pipe work to a collection tank. 55


 Foundations were laid for the storage tank (Figure 5.")
61 Figure 5.3 Pipe trench excavation installation Figure 5.4 New guttering and down pipe A 9m 3 pre-cast concrete tank (Figure 5.5) to act as an initial collection tank for the rainwater was installed underground. Excavations were carried out for this tank and to lay a 25 mm pipe between it and the storage tank a distance of approximately 100m (Figure 5.7) Foundations were laid for the storage tank (Figure 5.6), this consisted of 2 x 22m 3 pre-cast concrete tanks joined by a 100 mm pipe. Figure 5.5 9m 3 Collection tank 56

62 Figure m 3 Rainwater Storage tank Figure 5.7 Farm schematic showing collection and storage tanks 57
.")

63 5.3 Filtration System As the site had numerous trees near the farm buildings used to harvest rainfall. A filtration system was needed to prevent leaves and other material being washed into the gutters thus entering the RWH system (Figure 5.8). Initially a custom made filter was manufactured to prevent leaves being washed from the building roofs into the RWH system (Figure 5.9). Figure 5.8 Leaves in gutter Figure 5.9 Custom made filter initially used with RWH system This filter was installed in the gutter at the connection between the gutter and down pipe as shown in Figure Figure 5.10 Custom made filter used initially with the RWH system 58


64 While effective in preventing leaves and other debris from entering the collection tank, it caused the gutter to overflow due to a backlog of leaves and debris in the gutters. The farmer removed the filter rather than clean out the gutters on a regular basis. The floating filter intake for the pump became clogged with debris washed into the collection tank. Figure 5.11 Damage to submersible pump and floating inlet when no leaf filtering system in place Commercially available filtration components were sourced and installed. A Lindab leafbeater and a BRAE filter were installed on the three down pipes conveying rainwater to collection tank via the underground pipe work (Figure 5.12) Lindab leafbeater BRAE filter Figure 5.12 Lindab leafbeater and Easy Clean Nest filter installed on down pipe 59

. It is designed for ease of inspection and cleaning.")
65 Debris trapped by BRAE filter Figure 5.13 Lindab leafbeater and Easy Clean Nest filter removing debris from rainwater on route to collection tank The Lindab leafbeater filtered off any large debris from the rainwater flowing in the down pipe. As the rainwater flowed it washed any trapped debris away and out of the water stream flowing downwards towards the collection tank. The BRAE filter removed any particles which passed through the leafbeater (Figure 5.13). It is designed for ease of inspection and cleaning. It was evident when the filter was clogged, to clean; the mesh was removed to wash off any trapped particles and then replaced. 5.4 Control of System A submersible Multigo pump was installed in the collection tank to allow pumping of rainwater up to the storage tank. From the collection tank the rainwater was pumped up to two interconnected 22m 3 concrete storage tanks giving a total storage capacity of 44m 3. The cattle troughs on the farm were fed from the storage tank by gravity feed. The storage tank is approximately 9m above the collection tank and cattle troughs. 60


66 An electronic RWH system controller was installed in the farm building adjacent to the collection tank (Figure 5.14). Figure 5.14 Control panel installed on the farm to regulate water flow within system This controller was connected to ball-cocks installed in the storage tank to control the movement of water within the RWH system. Two ball-cocks were installed in the storage tank; one controlled the infilling of rainwater from the collection tank, the second controlled the flow of mains water to top up the system (Figure 5.15 & 5.16). On the side panel of the control panel a red light was connected and mounted to give a quick visual check that the pump was functioning. Ballcock controlling rainwater level Ballcock controlling mains water top up Figure 5.15 Ballcock control in storage tank 61

67 Figure 5.16 Water level control in storage tank Figure 5.17 Top-up and Rainwater inlets to storage tank 62
68 The ballcock controlling the rainwater flow to the storage tank was set at approximately 3m from the tank floor. It controls the pump in the collection tank, switching it on and off as required. The second ball-cock was installed at approximately 1m above the tank floor providing mains water back up to the storage tank (Figure 5.17). This ensures water supply to the cattle troughs during periods of dry weather if there is insufficient rainwater available or if the pump fails. Gravity is used to distribute water to the farmyard troughs and some of the field troughs. 5.5 Metering the RWH system Figure 5.18 Farm meter installation plan 63

 and on the pipe feeding the cattle troughs from the storage tank (M6).")
69 The aim of this research was to evaluate the feasibility of substituting captured rainwater for mains water to supply drinking water to the livestock on the farm. To measure the water consumption on the farm and the volume of rainwater that could be supplied, a metering system was designed and installed. This metering plan is shown in Figure Meters were installed on the mains supply to and about the farm (M1) (M2), the houses on the site (M3), on the mains water backup to the storage tank (M5). Meters were installed on the rainwater feed from the collection tank to the storage tank (M4) and on the pipe feeding the cattle troughs from the storage tank (M6). The meters used were Bonyto Klasse C 1.5m 3 /h type (Figure 5.19); each meter was connected to an Endress + Hauser MinilogB data logger (Figure 5.20 & Figure 5.21). Minlog B data logger Meter (M2) Figure 5.19 Bonyto Klasse C meter Figure 5.20 Meter connected to MinlogB Data logger 64

.")
.")
70 Figure 5.21 MinilogB loggers on storage tank data Figure 5.22 Downloading data logger Meter readings were recorded and stored by the data logger at 4 hourly intervals. The stored data was downloaded from the MinilogB data-logger using a laptop running the Endress + Hauser software ReadWin 2000 approximately every six weeks (Figure 5.22). To monitor local weather patterns a Vantage PRO2 Weather Station from Davis Instruments was installed on the farm (Figure 5.23). The software package Weatherlink, was used to download the weather data stored by the station s data logger approximately every 6 weeks. Figure 5.23 Vantage PRO2 Weather Station installed on the farm 65
71 6 School Rainwater harvesting project 6.1 Project Site The site was at Carrowholly National School, Westport, Co. Mayo. A rainwater harvesting facility was installed in the school as part of a new extension. The design, installation and commissioning of the Rainwater Harvesting system was carried out by a local architect. The National School in Carrowholly, Westport Co. Mayo was opened in The school is located in the parish of Kilmeena in County Mayo at , Situated on the shores of Clew Bay and at the base of Croagh Patrick, the school is positioned three kilometres north west of the town of Westport (Figure 6.1). It is sited on a high, level plain and the prevailing wind direction is south-westerly. Figure 6.1 Location of Carrowholly National School 66

 Figure 6.")
72 The school has green flag status which signifies the school s efforts to promote environmental awareness. The existing school was extended and totally refurbished in Figure 6.2 shows the front elevation of the school facing the road, showing the original school building dating from 1946 together with an extension designed to blend in with the original style. Figure 6.3 shows a right elevation showing the extension to the rear of the original school building, which was designed to contrast the original style. Figure 6.4 shows the rear elevation showing a close up of the new extension. Figure 6.2 Front Elevation showing original school building (source: Google Earth) Figure 6.3 Right Hand Side Elevation showing new extension to rear (source: Google Earth) 67

73 Figure 6.4 Rear elevation showing new extension (source: Google Earth) 6.2 Rainwater Harvesting System RWH System Design Parameters The RWH system was designed by Robert Kilkelly & Associates, Civil Engineering and Architectural Services, Westport, Co. Mayo. The design parameters and specifications are as follows: Roof Catchment Area = 124 m 2 Rainwater Harvesting Tanks: Two number 682 litre Polyethylene Cold water cistern covered tanks. Supplied by Envirocare Pollution Control, Dunmore Road, Glenamady Co. Galway. Rainwater filters used were Koss Milk Sock Filters, supplied by Chemical Services Ltd., Chapelizod Industrial estate, Dublin 20. A standard ball cock was placed on the mains inlet pipe which shuts off when full and to prevent syphonage. There were no non- return valves placed here. 68
74 A meter was fitted on the inlet from the mains. Meter supplied by T.C.M Controls Ltd. Greenmount Industrial Estate, Dublin 6. The meter on the toilets that was fed from the water harvesting tank was placed on the outlet from the water tank in the plant room, to reduce tampering from kids at WC s The cost to supply and fit the water harvesting units, including the filters, meters etc. was Annual cost of water to school was a flat rate of 325. The 4 WC s fed from the Rainwater harvesting tanks were fed direct by gravity and were the only pipe work from these tanks. There was no pump in the RWH system. Table 6.1 RWH System Design Parameters (Kilkelly & Associates, 2008) 69


75 70 Photo 2: Sarnafil Roof Covering Photo 1: Covered Rainwater Storage Tank 01 Photo 3: Covered Rainwater Storage Tank 02 Overflow to SW system Rainwater Inflow from Roof Rainwater Inflow to storage tank Photo 4: Interior of RWH storage tank showing Koss Milk Filter on inflow from roof. Photo 5: Inflow from gutter to RWH storage tank fitted with Koss Filter and Overflow to surface water (SW) drainage system Photo 6: Overflow pipes from rainwater storage tank to SW drainage system Photo 7: Ball cock controlling mains water top up to rainwater storage tank Figure 6.5 Rainwater Harvesting System Layout
76 6.2.2 RWH System Operation Figure 6.5 shows the principle components of the RWH system which was divided into two separate RWH systems installed on either side of the building. A cross section through the rear extension is shown. The roof catchment area draining to each system was 62m 2, providing a total catchment area of 124m 2. The roof covering comprises a Sarnafil membrane (Photo 2). The roof is pitched at approximately 10 degrees resulting in rainwater draining to the roof edge which comprised a 150mm deep perimeter. Within the roof perimeter gutters channel the rainwater directly to the storage tanks located on each side of the roof space. Each tank has a storage capacity of 682 litres and is fitted with a lid (Photo 1& 3). A first flush device was not fitted to either RWH system. Photo 5 shows a 150mm pipe which directs the rainwater from the external channel to the internal storage tank. Rainwater is directed straight through to the storage tank via a 50mm pipe as shown. A 100mm diameter overflow pipe is also shown which drains to the external roof channel. Photo 4 shows an internal view of the rainwater storage tank showing the filter sleeve fitted to the 50mm inflow pipe. This is a cloth geotextile filter with 4mm aperture to capture any fines from the roof surface. Mains water is piped to the rainwater storage tank. Photo 7 shows the ball cock valve which controls the mains water inflow. The level of the ball cock is set below the level of the intake from the rainwater. During periods of low rainfall intensity, if the level of water stored in the tank falls below this critical level the mains water supply valve will open. Conversely, during period of high rainfall intensity the mains supply valve will close and water will be supplied from rainwater only. This top up system ensures reliability of supply. The rainwater storage tank has a secondary overflow system as 71


77 shown in Photo 6 comprising two 50mm pipes. There are no pumps in this system. Rainwater from the roof drains by gravity to the storage tanks. Supply from the storage tanks to the building is also by gravity system. 6.3 Water Supply monitoring system Rainwater Harvesting Supply To monitor the RWH system, flow meters were installed on the mains top up to each storage tank and on the toilets fed by the RWH system. The flow meters installed were Bonyto Klasse C 1.5m 3 /h type as shown in Figure 6.6. A schematic of the metering system installed is shown in Figure 6.8. Figure 6.6 Bonyto Klasse C 1.5m 3 /h type used to monitor toilet use Meter 201 and 202 recorded the mains top up to the storage tanks at times where there was insufficient rainwater in the storage tanks to meet toilet demand (Figure 6.7). Figure 6.7 Meters 201 & 202 on mains top up to storage tanks 72
78 Figure 6.8 Schematic showing monitoring system installed on RWH supply. Meters 301 and 302 recorded the toilet use by junior and senior infants classes. Meters 304 and 305 recorded toilet use by first and second classes. Student toilets supplied by mains water were fitted with meters as shown in Figure Mains Water Supply Meters were also installed on toilets fed by mains water only. Figure 6.9 shows a schematic of this monitoring system. 73
79 Figure 6.9 Metering system for mains supplied student toilets Meters 401 and 402 recorded toilet use by the students in third and fourth classes. Meters 403 and 404 recorded toilet use by fifth and sixth class students. Meter 405 recorded toilet use in the disabled toilet, while meters 406 and 407 monitored the girls and boys toilets on the corridor. The non-potable mains water used in the school was metered and designated meter reference number Data collection To minimise interruption of the daily school activities a remote monitoring system was installed. A radio transmitter was fitted to each flow meter allowing for readings to be transmitted to a storage device at pre-set time intervals (Figure 6.10). 74


80 Meters with radio transmitter attached Figure 6.10 Radio transmitters attached to meters The storage device used was a Hydro-Center supplied by Hydrometer. Flow meter readings were transmitted to, and stored by, the Hydro-Center four times per day at 00:00, 06:00, 12:00 and 18:00. The Hydro-Center had a mobile phone data SIM card facility (Figure 6.11). Using Hydrometer software (Hydro-Center 2.45), stored data from the flow meters was downloaded via a telephone line. Hydro-Center 60 data storage unit Mobile phone SIM data card connection Figure 6.11 Hydro-Center 60 storage unit and data SIM card connection 75
81 7 Thesis Data Rainfall and Water Use This chapter presents the monitoring results from each of the three pilot rainwater harvesting study areas, Milford Park, Ballinabrannagh, Co. Carlow, Beshellstown farm, Clonalvy Co. Meath and Carrowholly National School, Westport Co. Mayo. The daily tank balance for each of the RWH at each site was modelled. To investigate how the RWH installed in Carlow would cope with the differing domestic demands; the RWH tank was modelled using the daily demand measured at the three control houses. Using the model water efficiency E T of how much mains water could be save was calculated for different size tanks to investigate the effectiveness of the RWH in a domestic setting. 7.1 Modelling Rainwater systems Mass Balance Model The function of a mass balance model is to set up a boundary and quantify any inputs and outputs across that boundary. In the case of a domestic rainwater harvesting system the inputs are rainfall and mains top up, while the outputs are the yield from the storage tank and the overflow. To set up a mass balance of a rainwater harvesting installation, it is necessary to take account of the rainwater harvesting process. This process is described in Fig 7.1. Here the rainfall incident on the roof is given the value R. The quantity of any rainfall incident, i.e. the inflow to the tank during time t, is a function of the effective roof area and the quantity of Rainfall, and is therefore AR. However, this can also be written as Q t, where Q is the rainfall run off/inflow to the tank, in time t. 76
.")
82 Figure 7.1 A rainfall event characterised by its constituent elements ( diagram Campisano A, Modica C, 2012) The rainwater enters the tank, which has a storage capacity S. What happens to the rainfall when it enters the tank is a function of the water in the tank, from previous rainfall incidents. The volume, V from a rainfall incident prior to t, is given by V (t-1). If this volume, and the volume of the Rainfall incident, AR (=Q t ) together exceed the capacity of the tank, the water will overflow from the tank. This is designated as O d. The water available from the tank is referred to as the yield, Y. Description Units R rainfall m Qt = AR effective catchment area m 2 Y RWH tank yield m 3 V (t-1) volume in storage from previous time-step D demand m 3 M mains top up m 3 Od tank overflow m 3 S storage tank size m 3 m 3 Table 7.1 The constituent elements of a rainwater harvesting system 77
83 The demand for water comes from the house, in Fig7.1 represented by the toilet and designated D. If the demand is greater than the yield available, then the demand is met by mains top up, designated M. Hence the volume of water in the storage tank, V, at the end of time t, is V t. This is a function of the volume, V, from a rainfall incident prior to t, V (t-1), the inflow to tank during time t, Q t, and the demand in time t, D t. The volume of water in the storage tank is greater than zero and less than the storage volume of the tank, s. This gives a water mass balance [Ward et al, 2008] of V t = V t-1 + Q t -D t where 0 V t S. However this mass balance does not allow for the overflow and to take this quantity, Qd, into account the yield after spillage (YAS) model is used. This assumes that the current yield Y t, is the minimum value between the volume of stored rainwater at the previous time interval, V (t-1), and the demand in the current time interval, D t. This allows the current stored rainwater V t, to be obtained by adding the current roof top rainwater runoff Q t (or A.R t ), to the volume of rainwater in storage at the previous time interval, V t-1, and subtracting the current yield Y t, with any excess i.e., no storage capacity left in the tank, discharged to the surface water drainage system. This is shown below Y t = min D t, V t-1 V t = min V t-1 + Q t - Y t, S-Y t 78
84 The yield (Y t ) from the storage tank is assigned as the smaller of the two. If the volume stored (V t ) in the current period leads to a volume greater than the storage capacity S, the excess rainwater will spill through the overflow facility and the yield is then subtracted [Fewkes & Warm 2000]. Monitored Parameters Several variables determine the performance of domestic RWH systems. These include the storage capacity of the rainwater tank, household consumption or water demand patterns, effective rooftop area and rainfall data At the domestic site in Carlow the following quantities were monitored. Rainwater entering the tank or inflow, Q t /A.R t, Demand in the house, D, the yield from the rainwater harvesting Y t, and the mains top up M t. From analysis it was possible to attach values to tank overflow Od, and the volume in the tank at the start, V t-1. Dimensionless Parameters In the literature, dimensionless ratios are also taken into account. These fractions, allow the different combinations of demand, storage capacity, roof areas and precipitation to be considered (Campisano and Modica, 2012). In the following sections the demand fraction, the storage fraction, the rain fraction, the overflow fraction and the efficiency fraction will be quantified. The demand fraction, Df, is given by = ((t))/(q(t)), where D(t) is the demand over time t, and Q is the inflow to the tank over time t. The demand fraction is the fraction of inflow that is used to meet demand. 79
85 The storage fraction, S f is given by = ((St))/(Q(t)), where S(t) is the storage capacity over time t, and Q is the inflow to the tank over time t. The storage fraction is the fraction of inflow that can be stored. The rain fraction, S m, is given by S m = (S(t))/(D (nd/nr)), where S(t) is the storage capacity over time t, and D is the demand and nd and nr are the number of dry days and rainy days in the year, respectively and nd/nr is the average dry period (days) in the year per each rainy day. The rain fraction relates the tank storage capacity to the water demand during the average dry period (Campisano and Modica, 2012). The overflow fraction, O f, is given by O f (%)= Od/Qt x100, where Od is the tank overflow and Q is the inflow to the tank over time t, expressed as a percentage. The overflow fraction is the percentage of overflow lost related to tank inflow. The efficiency ratio, E T, is given by E T (%) = Y/D x100, where Y is the RWH tank yield and D is the household demand, expressed as a percentage. The efficiency ratio is the percentage of demand that can be met by tank yield. In order to calculate optimum tank size for given yields and demands, the efficiency ratio will be used later in this section. 80
86 01/01/ /02/ /03/ /04/ /05/ /06/ /07/ /08/ /09/ /10/ /11/ /12/ /01/ /02/ /03/ /04/ /05/ /06/ /07/ /08/ /09/ /10/ /11/ /12/ /01/ /02/ /03/ /04/ /05/2008 Daily Rainfall mm 7.2 Pilot Domestic RWH Site: Rainfall at Ballinabrannagh, Co. Carlow Daily Rainfall (mm) at Ballinabrannagh, Co. Carlow Figure 7.2 Daily rainfall at Ballinabrannagh, Carlow, January 2006 May 2008 Rainfall at Ballinabrannagh was recorded by a Davis Instruments Weather Station installed on a farm approximately 400m from the RWH house. Figure 7.2 shows the daily rainfall pattern over the monitored period. The minimum daily rainfall was 0.0mm; the maximum daily rainfall recorded was 23.2mm on 30/11/06. Due to a problem with the weather station rainfall data was not recorded between 22/07/07 and 13/08/07 giving a monthly rainfall of only 1mm. During this period for calculation purposes a daily rainfall value of 0 mm rain was used for days where no data was recorded. Table 7.2 tabulates the daily rainfall data by year and month. 81
87 Rainfall mm Month Monthly Total Rainfall mm Max daily rainfall mm Raindays 1mm Month Monthly Total Rainfall mm Max daily rainfall mm Raindays 1mm Month Monthly Total Rainfall mm Max daily rainfall mm Jan Jan Jan Feb Feb Feb Mar Mar Mar Apr Apr Apr May May May Jun Jun Jul Jul Aug Aug Sep Sep Oct Oct Nov Nov Dec Dec Raindays 1mm Table 7.2 Monthly rainfall totals, maximum daily rainfall and number of rain-days with 1 mm rainfall over the study period Monthly Rainfall recorded at Ballinbrannagh, Carlow average number of raindays 1mm Mean Monthly Rainfall Jan Feb Mar Apr May Jun Jul Aug Sep Oct Nov Dec Figure 7.3 Monthly rainfall recorded at Ballinabrannagh Carlow over monitoring period 82
88 From Figure 7.3, the 2006 recorded rainfall data show that November and December 2006 had the greatest monthly rainfall at 115 and mm respectively while June (28mm) and July (12.4) had the smallest rainfall monthly totals. Rain-days where rainfall was greater or equal to 1mm ranged from 2 days in July to 16 days in December with the average being 11 rain days per month. In 2007 August and December had the greatest monthly totals with 91.4mm and 84mm rainfall depths respectively. July and April had the lowest monthly totals of 1mm and 10mm rain. Rain-days where rainfall was greater or equal to 1mm ranged from 0 days in July to 17 days in February with the average being 8 rain-days per month. The first five months of 2008 were monitored. Of these, January had the greatest monthly total with 120mm of rain. May had the lowest monthly total with 15.8mm rain. Rain-days where rainfall was greater or equal to 1mm ranged from 2 days in May to 20 days in January with the average being 11 raindays per month. Table 7.3 summarises the monthly rainfall recorded at Ballinabrannagh over the 29 months of the study period. Rainfall mm recorded at Ballinabrannagh, Co. Carlow Year Jan Feb Mar Apr May Jun Jul Aug Sep Oct Nov Dec Total Mean Table 7.3 Monthly rainfall recorded over the monitoring period at Ballinabrannagh, Carlow The harvestable rainfall is calculated using the following equation: Harvestable Rainfall (m 3 /yr) = Rainfall depth (m/yr) x Catchment Effective Area (m 2 ) 83
89 average monthly rainfall mm Table 7.4 and Figure 7.4 show the monthly harvestable rainfall available at Carlow over the monitoring period. Harvestable Rainfall m 3 Jan Feb Mar Apr May Jun Jul Aug Sep Oct Nov Dec Total Table 7.4 Harvestable Rainfall available to RWH system installed at Ballinabrannagh, Carlow Average Monthly Harvestable rainfall Jan Feb Mar Apr May Jun Jul Aug Sep Oct Nov Dec Figure 7.4 Average Monthly Harvestable Rainfall at Ballinabrannagh, Co. Carlow 84
90 7.2.1 Water Monitoring Analysis Water Audit A water audit of the RWH house determined the number and type of plumbing fixtures and fittings. The following water using devices were identified: Toilets: There were two dual flush with 6/4 litre cistern toilets in the house. Taps: There were four wash hand basins in the house with total of eight screw type taps. Showers and Baths: The master bedroom en-suite had an electric shower; the bathroom had a bath with bath/shower mixer facility. Water Devices: Washing machine and dishwasher were installed. Fixture / Fitting Type Number Toilets Dual flush 6/4 litres 2 Taps Screw type 8 Showers / Bath Water Devices Electric Shower 1 Bath with Shower mixer type Washing machine 1 Dishwasher 1 1 Table 7.5 Summary of plumbing fixtures and fittings in the RWH house Water Use in Ballinabrannagh, Co. Carlow General Findings Water Use Table 7.5 and Figure 7.6 show the water use in the four houses over the study period. The kitchen use was calculated by subtracting the use at toilets, hot and cold water from the mains use. 85
91 Mains m 3 Number of inhabitants Water use and demand in Carlow PCC Cold Hot Toilets Kitchen mains Water Water l hd -1 d -1 m 3 m 3 m 3 m 3 Meter M2 M3 M4 House 1 (RWH) House 2 House 3 House 4 M1- (M2+M3+M4) Table 7.6 Water use and demand at Ballinabrannagh, Carlow over March 2006 May Kitchen Hot Water Cold Water Toilets 400 m House 1 (RWH) House 2 House 3 House 4 Figure 7.5 Water use at Ballinabrannagh Co. Carlow March 2006 May 2008 The RWH house had occupancy of one adult and one child. The per capita consumption (PCC) over the 26 months was 77lhd -1 d -1. The mains water use was 87m 3, comprising 11m 3 of cold water, 30m 3 of hot water, kitchen use of 46m 3. Toilet use was 20m 3 supplied by the RWH. House 2 had occupancy of five, two adults and three children. The PCC was 125lhd -1 d -1 resulting in mains water use of 430m 3 over 22 months. This comprised of 62m 3 of cold water, 70m 3 of hot water, kitchen use of 186m 3 and toilet use of 112m 3. House 3 had occupancy of two adults and one child. The PCC was 84lhd -1 d -1 86
92 resulting in mains water use of 173m 3 over 22months. This comprised of 22m 3 of cold water, 29m 3 of hot water, kitchen use of 83m 3 and toilet use of 43m 3. House 4 had occupancy of five, two adults and three children. The PCC was 157 hd -1 d -1 resulting in mains water use of 503m 3 over 22 months. This comprised of 49m 3 of cold water, 74m 3 of hot water, kitchen use of 144m 3 and toilet use of 82.5m 3. The 236m 3 used for toilets in this house includes a period where a faulty valve in one toilet caused the cistern to run continuously. House 1 (RWH) PCC = 77 l/hd/d House 2 PCC = 125 l/hd/d Kitchen m³ 46 43% Toilets m³ 20 19% Hot Water m³ 30 28% Cold Water m³ 11 10% Kitchen m³ % Hot Water m³ 70 16% Toilets m³ % Cold Water m³ 62 15% House 3 PCC = 84 l/hd/d House 4 PCC = 157 l/hd/d Kitchen m³ 83 48% Hot Water m³ 29 17% Toilets m³ 39 22% Cold Water m³ 22 13% Kitchen m³ % Hot Water m³ 74 Cold Water 15% m³ 49 10% Toilets m³ % Figure 7.6 Water use within the study households 87
93 Figure 7.6 compares the four households as to how water was used within the households over the monitored months. Toilet use ranged between 19% - 26% of water use for the RWH house, House 2 and House 3. House 4 had toilet water use of 47%, a faulty valve in one toilet contributed to greater water use measured for toilet use. Water for kitchen use in the four households ranged between 28% - 48%. Cold water use ranged between 10% and 15% and hot water use between 16-28% of water use RWH House Toilet Demand and RWH performance The collection tank installed in the garden was a 9m³ tank, to allow for freeboard the storage a capacity was taken as 8.5m³. The following graphs show the daily demand by month for toilet use, RWH tank yield, inflow of harvested rainfall, and any mains top-up required in Graphs for 2006 and 2008 are in Appendix. Daily demand for toilet use was matched by RWH yield. The daily tank balance was sufficient to meet daily demand even where the daily inflow to the tank was less than the daily demand. The RWH system was installed and commissioned by January 2006; the tank was storing captured rainwater while the purchase of the house was ongoing. The new owners did not move in until March The rainfall between January 1 st and 12 th March was 104.2mm giving an initial stored volume in the RWH tank of 5.27m 3. This was taken into account when modelling the demand measured in Houses 2 and 3, like the RWH house, the owners took possession in March House 4 was not occupied until May 2006, allowing the storage tank to fill to the maximum 8.5m 3. 88


94 89 RWH House Toilet Demand


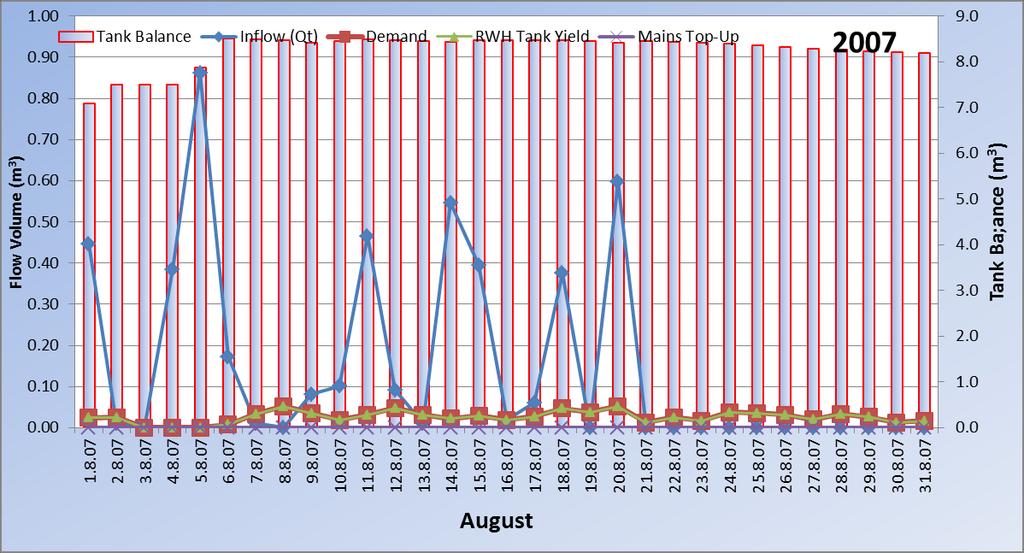
95 90 RWH House Toilet Demand
96 91 RWH House Toilet Demand Figure 7.7 Daily demand, inflow to RWH tank, RWH tank yield, tank balance and mains top-up by month for 2007
97 Tank balance decreased during periods where inflow to the tank either was zero (dry days) or when demand exceeded the harvested rainfall on a given day. Throughout 2007 and indeed throughout the whole monitored period there was sufficient stored rainwater to meet demand. Table 7.7 gives a monthly summary over the total monitoring period of how the RWH installed performed meeting the demand placed upon it by the occupants in the RWH house. Modelling the demand against different tank sizes allows for the efficiency ratio to be plotted. This is the percentage of demand that can be met by the tank yield. Figure 7.8 Efficiency ratio for various tank sizes versus demand for toilet use at RWH house From Figure 7.8 a 1.5m³ tank could provide harvested rainwater to meet 100% demand measured at the RWH house. The installed 9m³ tank is 6 times larger than is required. 92
98 93 Tank (m 3 ) 8.5 Year Month m 3 m 3 m 3 m 3 m 3 m 3 % % % % % Monitoring Analysis Dimensionless Ratios Effective catchment area supply Qt=AR Demand D RWH yield Y Mains top up M Tank Overflow O D Volume from previous time step V(t-1) Demand fraction D f Storage fraction S f Rain fraction S m Tank efficiency E t Overflow fraction O f 2006 Jan Feb Mar % 189% 908% 100% 9% Apr % 549% 1269% 100% 71% May % 171% 822% 100% 83% June % 600% 470% 100% 55% July % 1354% 52% 100% 44% Aug % 408% 250% 100% 16% Sep % 183% 1415% 100% 88% Oct % 208% 788% 100% 82% Nov % 146% 843% 100% 83% Dec % 146% 1128% 100% 86% % 24% 68% 100% 68% 2007 Jan % 1447% 178% 100% 22% Feb % 237% 2189% 100% 77% Mar % 288% 437% 100% 66% Apr % 1679% 135% 100% 0% May % 449% 694% 100% 53% June % 414% 279% 100% 68% July % 16790% 100% 0% Aug % 184% 758% 100% 59% Sep % 437% 208% 100% 31% Oct % 770% 188% 100% 45% Nov % 373% 438% 100% 59% Dec % 200% 742% 100% 82% % 33% 32% 100% 61% 2008 Jan % 139% 2296% 100% 88% Feb % 442% 642% 100% 72% Mar % 256% 804% 100% 82% Apr % 461% 976% 100% 72% Subtotal % 64% 282% 100% 82% Total % 11% 22% 100% 68% Table 7.7 Monthly summary of toilet demand, RWH system performance over monitored period.
99 7.2.4 House Toilet plus Hot Water Demand and RWH performance The RWH system had the potential to supply 74.5m 3 over period monitored. Thus 54m 3 of excess rainwater was potentially available for household use. One possibility would be to use the rainwater harvested to supply the toiles plus supply hot water demand in the RWH house. A research study on the Microbiological quality of the RWH harvested rainwater in Carlow showed that the harvested rainwater met the European Communities Quality of Bathing Water Regulations (S.I. 79 of 2008) (O Hogain, McCarton, et al,(b), 2011). If the RWH was to supply hot water supply demand, a water treatment system such as UV and /or chemical disinfection would be required. Table 7.8 gives a monthly summary over the total monitoring period of how the RWH installed performed. In meeting the demand for toilet and hot water use placed upon it by the occupants in the RWH house. Figure 7.7 shows the daily demand for toilets and hot water use in the RWH house along with the inflow to the RWH tank, mains top-up and tank balance. From Table 7.8 and Figure 7.9 the installed RWH system would have met 100% of the demand for toilet and hot water use in the RWH house. 94


100 95 RWH House Toilet & Hot Water Demand


101 96 RWH House Toilet & Hot Water Demand


102 97 RWH House Toilet & Hot Water Demand Figure 7.9 Daily demand for toilets & hot water, inflow to RWH tank, RWH tank yield, tank balance and mains top-up by month for 2007
103 98 Tank (m 3 ) 8.5 m 3 m 3 m 3 m 3 m 3 m 3 % % % % % Monitoring Analysis Dimensionless Ratios Year Month Effective catchment area supply Qt=AR Demand D RWH yield Y Mains top up M Tank Overflow O D Volume from previous time step V(t-1) Demand fraction D f Storage fraction S f Rain fraction S m Tank efficiency E t Overflow fraction O f 2006 Jan Feb Mar % 189% 303% 100% 0% Apr % 549% 178% 100% 0% May % 171% 260% 100% 0% June % 600% 168% 100% 0% July % 1354% 20% 100% 0% Aug % 408% 83% 100% 0% Sep % 183% 450% 100% 0% Oct % 208% 341% 100% 25% Nov % 146% 843% 100% 83% Dec % 146% 511% 100% 64% % 24% 278% 100% 27% 2007 Jan % 1447% 690% 100% 0% Feb % 237% 7024% 100% 0% Mar % 288% 2308% 100% 47% Apr % 1679% 615% 100% 0% May % 449% 3672% 100% 0% June % 414% 1769% 100% 0% July % 16790% 100% 0% Aug % 184% 3569% 100% 0% Sep % 437% 1125% 100% 0% Oct % 770% 791% 100% 0% Nov % 373% 1922% 100% 0% Dec % 200% 3620% 100% 4% % 33% 150% 100% 6% 2008 Jan % 139% 9645% 100% 68% Feb % 442% 1928% 100% 47% Mar % 256% 2422% 100% 1% Apr % 461% 4525% 100% 28% Subtotal % 64% 1006% 100% 42% Total % 11% 94% 100% 22% Table 7.8 Monthly summary of demand for toilets and hot water, performance of installed RWH over monitored period
104 Figure 7.10 Efficiency ratio for various tank sizes versus demand for toilet and hot water use at RWH house Figure 7.11 shows that a to meet 100% of the demand for toilets and hot water demand in the RWH house a 4.5m³ tank would be required. A 1.5m³ tank would meet 84% of demand House 2 toilet demand and RWH performance The demand for toilet use measured at House 2 is modelled against the RWH installed in the RWH house. The daily performance by year for House 2 is given in Appendix. Figure 7.12 shows the efficiency ratio for various tank sizes and the demand measured at House 2. The installed 9m 3 tank has an efficiency ratio of 54%, while a 1.5m 3 tank has an efficiency ratio of 45%. Table 7.9 provides a monthly summary of toilet demand and RWH performance. Figure 7.11 Efficiency ratio for various tank sizes versus demand for toilet and hot water use at House 2. 99
105 100 Tank (m 3 ) 8.5 Year Month m 3 m 3 m 3 m 3 m 3 m 3 % % % % % Effective catchment area supply Qt=AR Demand D Monitoring Analysis Dimensionless Ratios RWH yield Y Mains top up M Tank Overflow O D Volume from previous time step V(t-1) Demand fraction D f Storage fraction S f Rain fraction S m Tank efficiency E t 2006 Jan Feb Mar % 189% 2170% 100% 0% Apr % 549% 1391% 100% 0% May % 171% 2045% 100% 0% June % 600% 721% 100% 0% July % 1354% 165% 21% 0% Aug % 408% 554% 27% 0% Sep % 183% 1825% 56% 0% Oct % 208% 1460% 74% 0% Nov % 146% 1561% 56% 0% Dec % 146% 2188% 100% 0% % 24% 134% 72% 0% 2007 Jan % 1447% 296% 83% 0% Feb % 237% 3404% 56% 0% Mar % 288% 1061% 47% 0% Apr % 1679% 215% 1% 0% May % 449% 1036% 10% 0% June % 414% 1189% 57% 0% July % 16790% 0% 0% Aug % 184% 1451% 87% 0% Sep % 437% 543% 28% 0% Oct % 770% 365% 7% 0% Nov % 373% 667% 28% 0% Dec % 200% 1236% 48% 0% % 33% 63% 37% 0% 2008 Jan % 139% 3590% 81% 0% Feb % 442% 784% 59% 0% Mar % 256% 1345% 40% 0% Apr % 461% 4137% 92% 0% Subtotal % 64% 487% 63% 0% Total % 11% 42% 54% 0% Overflow fraction O f Table 7.9 House 2 Monthly summary of demand for toilets, and performance of installed RWH over monitored period
106 7.2.6 House 3 Toilet demand and RWH performance The demand for toilet use measured at House 3 is modelled against the RWH installed in the RWH. The installed 9m 3 tank has an efficiency ratio of 100%, a 6m³ tank would give the same efficiency. A 1.5m 3 tank has an efficiency ratio of 85% house. The daily performance by year for House 3 is given in Appendix. Table 7.10 provides a monthly summary of toilet demand and RWH performance. Figure 7.12 Efficiency ratio for various tank sizes versus demand for toilet and hot water use at House 3 101
107 102 Tank (m 3 ) 8.5 Year Month m 3 m 3 m 3 m 3 m 3 m 3 % % % % % Effective catchment area supply Qt=AR Demand D Monitoring Analysis Dimensionless Ratios RWH yield Y Mains top up M Tank Overflow O D Volume from previous time step V(t-1) Demand fraction D f Storage fraction S f Rain fraction S m Tank efficiency E t 2006 Jan Feb Mar % 189% % 100% 27% Apr % 549% % 100% 100% May % 171% 3999% 100% 71% June % 600% 1033% 100% 0% July % 1354% 236% 100% 0% Aug % 408% 1230% 100% 0% Sep % 183% 5209% 100% 0% Oct % 208% 4234% 100% 15% Nov % 146% 3450% 100% 55% Dec % 146% 7244% 100% 76% % 24% 353% 100% 41% 2007 Jan % 1447% 999% 100% 0% Feb % 237% 7892% 100% 20% Mar % 288% 2572% 100% 57% Apr % 1679% 573% 100% 0% May % 449% 3809% 100% 0% June % 414% 3677% 100% 0% July % 16790% 100% 0% Aug % 184% 5203% 100% 38% Sep % 437% 1619% 100% 4% Oct % 770% 1163% 100% 1% Nov % 373% 2387% 100% 11% Dec % 200% 4113% 100% 61% % 33% 196% 100% 27% 2008 Jan % 139% 12162% 100% 75% Feb % 442% 2291% 100% 43% Mar % 256% 4322% 100% 48% Apr % 461% 3033% 100% 0% Subtotal % 64% 1194% 100% 53% Total % 11% 119% 100% 38% Overflow fraction O f Table 7.10 House 3 Monthly summary of demand for toilets, and performance of installed RWH over monitored period
108 7.2.7 House 4 toilet demand and RWH performance Daily performance by month for House 4 is given in Appendix. Figure 7.13 shows the efficiency ratio for various tank sizes against the toilet demand measured at House 4. A 9m³ tank would meet 15% of the demand measured at House 4. If a 1.5m 3 tank was installed it would have an efficiency ratio of 11.6% Table 7.11 provides a monthly summary of toilet demand and RWH performance. Figure 7.13 Efficiency ratio for various tank sizes versus demand for toilet and hot water use at House 4 103
109 104 Tank (m 3 ) 8.5 Year Month m 3 m 3 m 3 m 3 m 3 m 3 % % % % % Effective catchment area supply Qt=AR Demand D Monitoring RWH yield Y Mains top up M Analysis Tank Overflow O D Volume from previous time step V(t-1) Demand fraction D f Storage fraction S f Dimensionless Ratios Rain fraction Tank efficiency E t S m 2006 Jan Feb Mar Apr May % 212% 2363% 100% 102% June % 600% 198% 48% 0% July % 1354% 45% 0% 0% Aug % 408% 191% 1% 0% Sep % 183% 536% 2% 0% Oct % 208% 389% 2% 0% Nov % 146% 410% 3% 0% Dec % 146% 523% 6% 0% % 30% 75% 11% 14% 2007 Jan % 1447% 61% 0% 0% Feb % 237% 903% 1% 0% Mar % 288% 879% 33% 0% Apr % 1679% 192% 0% 0% May % 449% 704% 8% 0% June % 414% 392% 9% 0% July % 16790% 0% 0% Aug % 184% 1285% 78% 0% Sep % 437% 400% 18% 0% Oct % 770% 312% 5% 0% Nov % 373% 657% 29% 0% Dec % 200% 1296% 51% 0% % 33% 36% 13% 0% 2008 Jan % 139% 3374% 77% 0% Feb % 442% 917% 69% 0% Mar % 256% 1242% 44% 0% Apr % 461% 967% 12% 0% Subtotal % 64% 378% 48% 0% Total % 13% 23% 15% 6% Overflow fraction O f Table 7.11 House 4 Monthly summary of demand for toilets, and performance of installed RWH over monitored period
110 7.2.8 Using BS 8515:2009 to size storage tank for Carlow site The British Standard describes an intermediate approach to be considered for nonpotable domestic use. This method recommends estimating the storage required to supply 5% of the annual rainwater yield or 5% of the annual non-potable water demand. The lesser value from these two equations is taken as the optimum tank size. (i) 5% of the annual rainwater yield Y R = (A)(e)(η)(h) x 0.05 /1000 Where: Y R is the annual rainwater yield A is the collection area (m 2 ) e is the catchment yield coefficient (%) h is the depth of the rainfall (mm) η is the hydraulic filter efficiency Y R : 75 x 0.9 x 0.75 x 648 x 0.05 /1000 = 1.6 m 3 A storage volume 1.6m 3 provides 18.25days rainwater storage. (ii) 5% of the annual non-potable water demand D N = P D x n x 365 x 0.05/ 1000 Where: D N P D is the annual non-potable water demand is the daily requirement per person (the annual demand for non-potable water was 9.3m 3, this equated to an annual demand of 4.6m 3 per person in the RWH house) n is the number of persons D N : 4.6 x 2 x 0.05 = 0.46m 3 A storage volume 0.46m 3 provides 18 days rainwater storage. 105
111 Using this analysis the optimum tank size to use for rainfall storage would be 0.46m 3. In practice, the actual tank size installed would be greater than this to provide for sufficient freeboard for fittings, valves, overflow bends and filters. If a 0.5m³ was installed it would meet 88% of the toilet demand measured in the RWH house. Figure 7.14 shows the daily demand, rainwater supply, mains top and RWH yield if a0.5m³ tank had been installed. 106


112 107 Figure 7.14 BS 8515:2009 tank size 0.5m³ vs demand at RWH house.
113 108 Tank (m 3 ) 0.5 Year Month m 3 m 3 m 3 m 3 m 3 m 3 % % % % % Monitoring Analysis Dimensionless Ratios Effective catchment area supply Qt=AR Demand D RWH yield Y Mains top up M Tank Overflow O D Volume from previous time step V(t-1) Demand fraction D f Storage fraction S f Rain fraction S m Tank efficiency E t Overflow fraction O f 2006 Jan Feb Mar % 11% 53% 100% 81% Apr % 32% 75% 100% 71% May % 10% 48% 100% 83% June % 35% 28% 100% 55% July % 80% 3% 74% 44% Aug % 24% 15% 39% 57% Sep % 11% 83% 100% 88% Oct % 12% 46% 100% 82% Nov % 9% 50% 100% 83% Dec % 9% 66% 100% 86% % 1% 10% 89% 80% 2007 Jan % 85% 10% 100% 22% Feb % 14% 129% 100% 77% Mar % 17% 26% 100% 66% Apr % 99% 8% 85% 0% May % 26% 41% 100% 57% June % 24% 16% 98% 68% July % 988% 0% 0% Aug % 11% 45% 97% 79% Sep % 26% 12% 64% 49% Oct % 45% 11% 100% 45% Nov % 22% 26% 100% 59% Dec % 12% 44% 100% 82% % 2% 32 85% 67% 2008 Jan % 8% 135% 100% 88% Feb % 26% 38% 100% 72% Mar % 15% 47% 100% 82% Apr % 27% 57% 100% 72% Subtotal % 4% 17% 100% 82% Total % 1% 69% 88% 76% Figure % Demand BS8515:2009 Tank size 0.5m³
114 Monthly rainfall mm 7.3 Pilot Agricultural RWH Site: Rainfall at Clonalvy Co. Meath Rainfall in mm Year Jan Feb Mar Apr May Jun Jul Aug Sep Oct Nov Dec Total Table 7.12 Rainfall recorded on farm at Clonalvy, Co. Meath Table 7.12 records the rainfall measured by the Davis Instruments Weather Station installed at Clonalvy, approximately 100m from the catchment area used by the installed RWH system Monthly rainfall at Clonalvy, Meath average number of raindays 1mm rain Jan Feb Mar Apr May Jun Jul Aug Sep Oct Nov Dec Figure 7.16 Monthly rainfall at Clonalvy over monitoring period December and May, 2006 had almost identical monthly totals with 72.4mm and 72.2mm of rain depths respectively. August and June had the lowest monthly totals of 0.51mm and 7.2 mm rain. Rain-days where rainfall was greater or equal to 1mm ranged from 0 days in August to 17 days in March with the average being 9 rain-days per 109
115 month. Due to difficulties with the weather station no data was available for July and the beginning of August In 2007, January and July were the wettest months with similar rainfall totals, 62mm and 67mm respectively. April and September were the driest months with rainfall totals of 9.8mm and 19.4mm respectively. Rain-days where rainfall was greater or equal to 1mm ranged from 2 days in April to 24 days in July with the average being 11 rain-days per month. There was no data available for October, 2007 due to problems with weather station batteries. Weather data for the first five months in 2008 were monitored. January was the wettest of these, with 72.8 mm rain. May was the driest with 10.4 mm rain. Rain-days with greater or equal to 1mm per day ranged from 17 in January to 4 in May. On average for the five months there were 8 rain-days per month Jan Feb Mar Apr May Jun Jul Aug Sep Oct Nov Dec Rainfall mm 72.4 Harvestable Rainfall m Demand m Jan Feb Mar Apr May Jun Jul Aug Sep Oct Nov Dec Rainfall mm Harvestable Rainfall m 3 Demand m Jan Feb Mar Apr May Jun Jul Aug Sep Oct Nov Dec Rainfall mm Harvestable Rainfall m 3 Demand m Table 7.13 Harvestable rainfall available at the installed Clonalvy RWH system Table 7.13 shows the monthly rainfall, harvestable rainfall and the monthly demand for water supply to troughs supplied by the RWH system. The harvestable rainfall 110
116 available exceeded monthly demand except for March and April Problems with the pump filter efficiency resulted in pump downtime for June to November A new filter system was researched in this period and installed in November Water Monitoring Analysis Table 7.14 shows the overall water use on the farm over the 18 months (December 2006 to May 2008). Difficulties in commissioning the RWH system and the monitoring system delayed data recording on site until December The mains water used on the farm was supplied by Meath County Council. Mains water on the farm was used for three purposes; Domestic supply to the three houses on site, Agricultural drinking water supply to field troughs not connected to the RWH system installed, Provision of back-up supply to the RWH system in the event of insufficient harvested rainfall to meet demand. Month Mains supply to farm m 3 Mains supply to houses m 3 Rainwater to storage tank m 3 Water to troughs m 3 Meter M1 M3 M4 M December January February March April May June July August September October November December January February March April May Total Table 7.14 Water use at Clonalvy, Co. Meath 111
117 Mains water supplied by Meath Co. Council totalled 1944m 3 over the monitoring period. This consisted of 70m 3 in December 2006, 1530m 3 over the 12 months of 2007 and 344m 3 from January to May m 3 mains water was supplied to the three houses on the farm, from December 2006 to May Approximately 332m 3 of mains water was supplied to the cattle troughs not connected to the RWH facility. The mains top-up supplied water during periods of low rainfall and /or pump downtime. The filter device installed initially proved inefficient and was removed by the farmer. This resulted in difficulties with the pump between May and December 2007 due to the floating filter inlet being damaged by particulate matter entering the collection tank. A consequence of this was greatly reduced volume of rainwater harvested during In the second regime where Lindab leafbeaters and BRAE filters were fitted problems with the pump were eliminated. Over the 18 months monitored, harvested rainwater pumped from the collection tank to the storage tank totalled 261m 3. Water supplied from the storage tank to the troughs totalled 502m 3. The total mains top up to the RWH system was calculated to be 240m 3. Mains supply to farm m 3 Meter 1 Mains supply to mains fed troughs M3 Meter 2-3 Mains supply to houses m 3 Rainwater to storage tank m 3 Water to troughs m 3 Meter 3 Meter 4 Meter 6 Mains top up m 3 Calculated Meter5 (malfunctioned) Total Table 7.15 Summary of water use at Clonalvy, Co. Meath over monitoring period The RWH system provided rainwater to meet 52% of the demand for water at the RWH fed troughs on the farm over the 18 month monitoring period. On December 1 st 2006 the tank had approximately 15m 3 of stored water from personal observation. Figure 7.17 shows the daily performance of the RWH in supplying the RWH connected troughs by 112
118 month for The overall RWH performance is summarised in Table In the period May December 2007 mains top-up to the storage tank supplied the demand at the RWH troughs due to difficulties with the gutter filters and pump. Once the second regime with the commercial filters installed, the RWH system worked well. Mains topup was reduced to zero as the RWH system had sufficient rainwater stored to deal with demand. The maximum capacity of the storage tank was 42m 3 with so much downtime due to the pump; the storage tank never achieved maximum capacity during the monitoring period. Daily demand and rainwater supply, mains top up and tank balance for 2006 and 2008 is given in Appendix. 113


119 Daily performance of RWH at Clonalvy by month


120 Daily performance of RWH at Clonalvy by month
121 Daily performance of RWH at Clonalvy by month Figure 7.17 Daily RWH performance by month for 2007
122 117 Tank (m 3 ) 42 Year Month 2006 m 3 m 3 m 3 m 3 m 3 m 3 % % % % % Monitoring Analysis Dimensionless Ratios Effective catchment area supply Qt=AR Demand D RWH yield Y Mains top up M Tank Overflow O D Volume from previous time step V(t-1) Demand fraction D f Storage fraction S f Rain fraction S m Tank efficiency E t Overflow fraction O f Dec % 98% 221% 78% 0% % 98% 78% 0% 2007 Jan % 101% 172% 73% 0% Feb % 144% 432% 71% 0% Mar % 403% 241% 39% 0% Apr % 643% 21% 7% 0% May % 2696% 153% 13% 0% June % 0% 0% July % 0% 0% Aug % 0% 0% Sep % 0% 0% Oct Nov % % 523% 0% 0% Dec % 241% 312% 23% 0% % 39% 28% 0% 2008 Jan % 133% 532% 100% 0% Feb % 192% 113% 100% 0% Mar % 91% 1180% 100% 0% Apr % 240% 469% 100% 0% May % 264% 260% 100% 0% Subtotal % 32% 46% 100% 0% Total % 15% 10% 52% 0% Table 7.16 Monthly summary of demand at RWH fed cattle troughs and performance of installed RWH over monitored period at Clonalvy, Meath
123 Figure 7.18 Efficiency ratio for various tank sizes versus demand measured at RWH fed troughs. The 44m 3 tank installed at Clonalvy comprised of two 22m 3 tanks and had a monitored actual efficiency ratio of 52%. From Table 7.16, the effective catchment area Qt produced 282.6m 3 of rainwater, however from meter 4 the inflow to the storage tank was 261.4m 3. This means that 21.2m 3 of rainwater falling on the catchment was not pumped to the storage tank. This loss of harvestable rainwater is a result of the periods of downtime for the pump in the collection tank. The rainwater collected from the catchment area and conveyed to the 8m³ collection tank was not pumped to the storage tank. Once the collection tank was at capacity any additional harvested rainwater overflowed and was lost to the RWH. 118
124 7.4 Pilot RWH Site, National School Site, Carrowholly, Co. Mayo Rainfall Analysis Analysis of Rainfall Records for years Daily rainfall records were obtained from Met Éireann for weather station no 1433 located in Westport for the years 2007, 2008, 2009 and This data was analysed to determine total monthly rainfall (mm), average monthly rainfall (mm), maximum daily rainfall (mm) and the number of rain-days (defined as a day with a rainfall event greater than 1.0mm depth). Table 7.17 presents a summary of this month by month analysis of rainfall. 119
125 Month Monthly Rainfall (2007) (mm) Average Daily Rainfall (mm) Max Daily Rainfall (mm) No of Raindays 1.0mm Month Monthly Rainfall (2008) (mm) Average Daily Rainfall (mm) Max Daily Rainfall (mm) No of Raindays 1.0mm Month Monthly Rainfall (2008) (mm) Average Daily Rainfall (mm) Max Daily Rainfall (mm) No of Rain days 1.0mm Month Monthly Rainfall (2010) (mm) Average Daily Rainfall (mm) Max Daily Rainfall (mm) No of Raindays 1.0mm Jan Jan Jan Jan Feb Feb Feb Feb Mar Mar Mar Mar Apr Apr Apr Apr May May May May Jun Jun Jun Jun Jul Jul Jul Jul Aug Aug Aug Aug Sep Sep Sep Sep Oct Oct Oct Oct Nov Nov Nov Nov Dec Dec Dec Dec Table 7.17 Monthly total and average rainfall (mm), maximum daily rainfall (mm) and number of rain-days per month for Westport Station No. 1433
126 Rainfall mm recorded at Westport Year Jan Feb Mar Apr May Jun Jul Aug Sep Oct Nov Dec Annual Mean Table 7.18 Summary of monthly rainfall (mm) recorded at Westport Table 7.18 summarises the four year monthly rainfall totals. There is relatively low variation in annual rainfall with a mean annual rainfall of 1322 mm. April, May and June have average monthly rainfall of less than 85 mm. Of the other nine months only February has an average monthly rainfall of less than 100 mm. Over the four years May 2008 was the driest month with 19.9 mm, while November 2009 was the wettest with 322.6mm of rain. The number of rain-days per month per year was relatively consistent, on average the number of rain-days per month was 17. With a maximum recorded in August 2009 with 27 days, the minimum monthly total was 6 in April This type of evenly distributed rainfall pattern reduces the need to store harvested rainwater for use during extended dry periods. Figures 7.19 and 7.20 show the variation in monthly rainfall and rain-days over the years
127 Rainfall mm Monthly Rainfall patterns at Wesport Co. Mayo Average Monthly Rainfall Jan Feb Mar Apr May Jun Jul Aug Sep Oct Nov Dec Figure 7.19 Variation in Total Monthly Rainfall at Westport Average monthly rainfall mm Average No of Raindays 1.0mm per month Jan Feb Mar Apr May Jun Jul Aug Sep Oct Nov Dec Figure 7.20 Average monthly rainfall and number of rain-days 1mm over years Water Monitoring Analysis The following is the analysis of the water use recorded at Carrowholly National School. 122
128 Water Audit A water audit was carried out in the school to determine the number and type of plumbing fixtures and fittings. The audit identified the following water using devices: Toilets: There are a total of 17 toilets in the school. 9 of these toilets are single flush with a 9 litre cistern, while the remaining 8 toilets are dual flush with a 6/4 litre cistern. Taps: There are 17 wash hand basins throughout the school with the total number of taps in the school at forty four. Twenty of these taps are push operated while the remaining twenty four taps are screw type. Showers and Urinals: There are no showering facilities or urinals in the school. Fixture/Fitting Type Number Toilets Single Flush 9 litre 9 Dual Flush 6/4 litre 8 Taps Push operated 20 Screw operated 24 Table 7.19 Summary of Plumbing Fixtures and Fittings in Carrowholly National School Non Potable Water Use Meters Table 7.20 presents a summary of the metering system for the rainwater harvesting supply. Each RWH system directly supplies two toilets, one for boys the other for girls. The school principal indicated the number of students per class per toilet. The mains water top supply to each system was also metered. RWH system 01 will be focused on in this analysis. It was discovered that on RWH 02 that the mains top and rainwater inflow pipework had been incorrectly installed. In effect, the harvested rainwater was acting as a top up to the mains water. This was highlighted and the problem rectified. There were two instances where a leak was detected, one at the toilet 123
129 monitored by meter 302 in October 2010 and the other at the toilet monitored by meter 304 in November The school principal was informed and the faults fixed. RWH System 01 RWH System 02 Meter Ref Mains Top Boys Mains Top Boys Description Girls Toilet Girls Toilet Up Toilet Up Toilet Number of Students Table 7.20 Rainwater Harvesting Metering System Toilets supplied by mains water only were also metered. Table 7.21 shows the meter reference number, location and number of students using each toilet. Meters 405, 406 and 407 are situated on the corridor so are accessible to students from all classes. There was no way of monitoring the numbers of students using these facilities. 3 rd and 4 th Class 5 th and 6 th Class Disabled Corridor Meter 401 (girls) 402 (boys) 403 (girls) 404 (boys) (girls) 407 (boys) Number. of Students n/a n/a n/a Table 7.21 Mains Water Metering System Meter 101 monitored the mains supply to the school. Monitoring of water use was carried out over the period March 2009 to November Meter 101 showed that in total over the monitoring period 142m 3 of mains water was used 124
130 Measured Demand for water for RWH 01 fed 16/03/ /04/ /05/ /06/ /07/ /08/ /09/ /10/ /11/ /12/ /01/ /02/ /03/ /04/ /05/ /06/ /07/ /08/ /09/ /10/ /01/20 01/02/20 01/03/20 01/04/20 01/05/20 01/06/20 01/07/20 01/08/20 01/09/20 01/10/20 01/11/20 01/12/20 01/01/20 01/02/20 01/03/20 01/04/20 01/05/20 01/06/20 01/07/20 01/08/20 01/09/20 01/10/20 01/11/20 Rainfall mm Figure 7.21 Daily rainfall at Westport RWH 01 fed toilets (meters 304 & 305) toilets m Figure 7.22 Daily demand for water for toilet use at RWH system 01 Figure 7.21 shows the daily rainfall recorded at Westport, it shows that there is rainfall year round with no long periods of dry weather. Figure 7.22 shows the demand 125
131 measured for toilet use at RWH system 01. There were a number of difficulties initially with the Hydro-Center to record all the installed meters. This took some time to resolve. Data was not recorded during this period and at other times throughout the monitoring period. As data transmitted by individual meters was not received and stored by the Hydro-Center. Where data was not recorded over a period of time an average daily usage was calculated using the available meter readings. Table 7.22 summarises the RWH 01 performance over the monitoring period. There is a discrepancy of 2m 3 between the total demand recorded at 44.2 m 3 and the total supply meeting that demand of 46.2m 3 (RWH yield at 24.6m 3 and Mains top up at 21.6m 3 ). This discrepancy is explained by errors in the non- recording of all meter readings. There are occasions where mains top up use (meter 201) was recorded but meters recording toilet (meter 304 & 305) use were not. The installed RWH 01 had an efficiency of 56%. 126
132 127 m 3 m 3 m 3 m 3 m 3 m 3 % % % % % Tank (m 3 ) 0.68 Monitoring Analysis Dimensionless Ratios Year Month Qt=AR D Y M O D V(t-1) D f S f S m E t O f 2009 Jan Feb Mar % 9% 86% 80% Apr % 8% 85% 63% 93% May % 7% 20% 53% 55% June % 15% 15% 49% 12% July % 49% 100% 51% Aug % 30% 4098% 100% 100% Sep % 12% 14% 74% 54% Oct % 8% 20% 71% 61% Nov % 10% 112% 83% 50% Dec % 7% 28% 47% 62% % 1% 5% 62% 62% 2010 Jan % 7% 28% 51% 73% Feb % 11% 17% 49% 55% Mar % 22% 31% 25% 60% Apr % 11% 32% 39% 82% May % 14% 13% 24% 62% June % 16% 12% 16% 45% July % 10% 100% 100% Aug % 21% 741% 100% 99% Sep % 9% 115% 85% 81% Oct % 8% 74% 53% 79% Nov % 11% 68% 100% 92% Dec % 1% 4% 44% 76% Total % 1% 2% 56% 69% Table 7.22 Summary of RWH 01 performance at Carrowholly National School
133 16/03/20 16/04/20 16/05/20 16/06/20 16/07/20 16/08/20 16/09/20 16/10/20 16/11/20 16/12/20 16/01/20 16/02/20 16/03/20 16/04/20 16/05/20 16/06/20 16/07/20 16/08/20 16/09/20 16/10/ Mains fed toilets There were difficulties with the Hydro-Center in receiving and logging the meter readings over the monitoring period. There were intermittent problems where the Hydro-Center receiver did not pick up the transmitted meter readings. Some meters reading transmissions were particularly affected. Meters 402 and 403 were the most affected, the Hydro-Center did not pick up readings for these meters for relatively long periods of time. An average daily reading for these meters was calculated from existing data. While not very satisfactory in terms of daily demand, the total demand at these meters can be calculated for the monitored period. Third and fourth classes toilet use was monitored by meters 401 (girls) and 402 (boys). The total monitored use for meter 401 was 6.22m 3, maximum daily demand for the girls toilet was 0.083m 3 and on average the daily demand was 0.014m 3. For the boys the total monitored use was 4.23 m 3 the maximum daily demand was 0.058m 3 and the average daily demand was 0.011m 3. m rd & 4 th class toilet demand meter 401 Girls toilet meter 402 Boys Figure 7.23 Third and Fourth class daily toilet demand
134 16/03/ /04/ /05/ /06/ /07/ /08/ /09/ /10/ /11/ /12/ /01/ /02/ /03/ /04/ /05/ /06/ /07/ /08/ /09/ /10/2010 Fifth and sixth class were monitored by meters 403 (girls) and 404 (boys). The total monitored us at meter 403 was 4.63m 3, maximum daily demand for the girls was m 3, the average daily demand was 0.017m 3. For meter 404 total monitored use was 5.05m 3, the maximum daily demand was 0.091m 3 and average daily demand was 0.016m 3. 5 th & 6 th class toilet demand m meter 403 Girls toilet meter 404 Boys toilet Figure 7.24 Fifth and Sixth class toilet demand Additional to the boys and girls toilets in each class room there was a girls and boys toilet facility on the school corridor plus a unisex disabled toilet. These toilets were available to the whole school student population. The girls corridor toilet (meter 406) had a monitored use of 6.92m 3, with a maximum daily use of 0.095m 3 and on average a daily use of 0.016m 3. The boys corridor toilet had a monitored use of 6.15m 3, with a maximum daily use of 0.081m 3 and an average daily use of 0.014m 3. Figure 7.25 shows the use at the girls and boys toilets on the 129
135 16/03/2 16/04/2 16/05/2 16/06/2 16/07/2 16/08/2 16/09/2 16/10/2 16/11/2 16/12/2 16/01/2 16/02/2 16/03/2 16/04/2 16/05/2 16/06/2 16/07/2 16/08/2 16/09/2 16/10/2 corridor over monitored period. Unlike the toilets in the classrooms (meters ) there was toilet use at these toilets over the summer period in It is likely that children s summer activities were held at the school and these toilets were available for participants. m Girls & Boys toilets on corridor meter 406 (girls toilet) meter 407 (boys toilet) Figure 7.25 Girls and boys toilet on corridor The final mains fed toilet monitored was the disabled toilet (meter 405), demand measured here totalled 13.3m 3. The maximum daily demand was 0.112m 3 while the average daily demand was 0.03m 3. The demand at this toilet was greater than the combined demand for the girls and boys toilets on the corridor. The reason for this is mostly likely due to its proximity to the door to the school playground. This toilet is next to the door to the playground so it is the most convenient toilet to use for children during class break time. This toilet was in use over the summer holidays again most likely due to a summer activities held at the school. 130
136 16/03/ /04/ /05/ /06/ /07/ /08/ /09/ /10/ /11/ /12/ /01/ /02/ /03/ /04/ /05/ /06/ /07/ /08/ /09/ /10/2010 meter 405 disabled toilet m Figure 7.26 Demand at the disabled toilets RWH 01 fed toilets First & Second Class Meter Meter Girls Boys Third & Fourth Class Meter Meter Girls Boys Mains fed toilets Fifth & Sixth Class Meter Meter Girls Boys Disabled toilet Meter 405 Toilets on corridor Meter 406 Girls Meter 407 Boys Total demand m 3 Annual demand m Table 7.23 Summary of demand for water for non-potable use in Carrowholly National School. Table 7.23 summarises the demand measured for non-potable use at Carrowholly national school. The demand for toilets fed from RWH 01 was measured at 44 m 3 ; the mains fed toilets had a demand of 46m 3. However primary schools are not open at weekends or during holiday periods, the school year is 184 days. Over the monitored period there were 242 school days. This gives a PCC of 4.3 l /pupil /day for non- 131
137 potable water use. The mains water used for non-potable use over the monitored period totalled 91m 3 ; comprised of 46m 3 at mains fed toilets and 21m 3 and 24m 3 mains top at RWH 01 and RWH 02 respectively. The total mains supply to the school was 162m 3. Potable water use in the school totalled 71m 3 over the monitored period. This equates to a PCC for potable water use of 3.4l/student /day. The PCC for water use per pupil per day was 7.7 l/pupil/d or an annual PCC of 2.8m³ /pupil (1.4m 3 /pupil / school year) Using BS8515:2009 to calculate tank sizing for Carrowholly School. (i) 5% of the annual rainwater yield Y R = (A)(e)(η)(h) x 0.05 /1000 For rainfall measured at Westport that average annual rainfall for was 1322mm (h). The collection area was 62m 2 (A), the catchment yield co-efficient was 90% (e) and the hydraulic filter efficiency was 0.9 (ɲ) Y R = (62 x 0.9 x 0.6 x 1322) x 0.05/ m 3 (i) 5% of the annual non-potable water demand D N = P D x n x 365 x 0.05/ 1000 For RWH 01, the annual non-potable demand was 21m 3 D N = 21m 3 x m 3 A 1m 3 storage tank would be recommended under BS8515:2009 for supplying the demand experienced by the RWH 01 at Carrowholly national school. 132
138 If the demand of 10.6m 3 i.e. the demand over a school year of 184 days was used for calculating storage tank sizing. D N = 10.6m 3 x m 3 The tank installed at Carrowholly is a normal mains header tank of capacity 0.68m 3. The RWH system installed at Carrowholly has a design close to that of 5% demand for non-potable demand based on demand over a school year. 133
139 8 Viability of Rainwater Harvesting in Ireland 8.1. Introduction In order to examine the circumstances where rainwater harvesting could be viable in Ireland, various scenarios were examined. These are presented in Table 8.1. Scenario Capital Grant Discounted water charge per m 3 with RWH Grant plus discounted water charge per m 3 Free allowances reduced / abolished Free allowances reduced / abolished plus discount on water charges with RWH installed Increased water charges Parameter 10-50% Capital Grant - free allowances included 10-50% reduction in water charges if RWH installed free allowances included 10 50% Grant plus 10-50% reduction in water charges free allowances included Reduce household allowance by 10-50% Reduce child allowance by 10-50% Remove all allowances Remove household allowance Remove child allowance Reduce household allowance by 50% - water charge discount 10-50% with RWH Abolish allowance water charges discount 10-50% with RWH Increase water charges with free allowances available to see at what water charge level RWH becomes economical. Table 8.1 Possible political and economic scenarios influencing RWH use in Ireland In considering these scenarios the following is taken into account. The Irish Government will provide a subsidy to Irish Water in 2015 and 2016 provided that annual domestic charges will not exceed 240 per year. These charges to remain fixed until the end of 2016 (Irish Government News Service, 2104). Free allowances apply to each household before water charges are applied. These are an annual 30,000 litres household allowance, for households with children under 18 years an additional yearly 134
140 allowance of up to litres per child applies. No standing charge will be levied; a minimum charge may be applied to properties not permanently occupied such as holiday homes (Irish Government News Service, 2014). 135
141 136 Household Costs Mains Water & RWH Household Costs Mains Water Only Standard Rates Item Value Unit Item Value Unit PCC 150 l/hd/d No of Adults >18 2 no No of Adults >18 2 no Annual Consumption l/yr No of Children < 18 1 no No of Children < 18 1 no PCC WC 21 l/hd/d Annual WC Consumptio 22,995 l/yr Annual Mains Water Consumption 145,729 l/yr Annual Consumption 164,250 l/yr Household litres/yr Unit per adults< litres/yr Total Allowance 68,000 Total Allowance 68,000 Avg Household Charge 240 /yr Total Chargeable 77,729 litres/yr Total Chargeable 96,250 litres/yr VAT 0 0 Total 240 /yr Cw 2.04 /m 3 Cw 2.04 /m 3 /person /yr /person /yr Cw 2.04 /m 3 Total Total cent/litre Table 8.2 Economic model for a standard Irish household of 2.7 persons with annual PCC of 150l/hd/d. PCC toilet use taken as the average from this research
142 Therefore an average household bill of 240 per year implies a charge of between 2.04 per m 3 (household allowance applied, taking an average Irish household at 2.7 persons with a PCC of 150l/hd/d, (DoECLG (b), 2014)). From this study the average PCC toilet demand is approximately 21 l/hd/d. The average household is 2.7 persons, for the purposes of this analysis a household of two adults and one child under 18 was taken (Table 8.2).. Storage (m 3 ) 1.5 Cost per m3 storage (total Capital cost / storage Installed) 627 Total capital cost -940 Annual Costs (Cm + Ce) Years 25 Real interest rate 3.5% Factor for Annual to Present (1+r) n-1 /(1+r)^n Annual equivalent of capital cost Total annual equivalent cost (incl o + m cost) -130 NPV -2, Installed Capacity (m 3 ) 1.50 Annual RWH Demand 23.0 Annual RWH Yield 18.5 Annual Mains Water Top-up 4.5 % Demand Met = Efficiency (Y/D) 81% RWH Yield over lifetime 463 RWH Cost - Euro cent per m 3 in present terms 7.03 Mains Water Cost - per m Total Household Mains water cost (without RWH) Total Household Mains Water Cost (RWH) Annual Saving on water charges Annual equivalent savings due to RWH NPV (PV mains water saved) Cost benefit ratio 0.19 Net present value of project -1, Table 8.3 Economic model to calculate NPV of RWH system and Mains only for domestic water supply Table 8.3 shows how RWH plus mains supply and mains supply only systems were compared. 25 years was chosen as the time period as it would be approximately the average 137
143 mortgage in Ireland. RWH capital cost of 940 over 25 years at 3.5% is annualised giving an annual cost of servicing the cost of 57. The annual cost of operating and maintaining the RWH is estimated at 73. The annual cost of operating the RWH is equal to the annual cost of capital repayment and annual operating and maintenance costs, which totals 130. This value is used to calculate the cost per m³ of rainwater supplied to the house. The rainwater yield is taken from modelling the demand at an average household (Table 8.3) and the measured rainfall data from Carlow site. The RWH cost of production per m 3 is calculated by dividing annual cost of production 130 by annual RWH yield of 18.5m 3, giving a RWH cost of 7.03 per m 3. Mains water cost at 2.40 per m 3 is taking from Government figures. This allows the cost of operating mains only supply system to be compared with a RWH + mains system using Net Present Value (NPV). This is similar to the above method. By plotting the cost of RWH + mains and of mains only supply shows when the RWH + mains system becomes cheaper than mains only system to operate. This is the definition of payback used in this thesis. Figure 8.1 shows how, under the current water charge and free allowance proposals, RWH compares with mains water only supply. As there is no initial capital outlay for the use of mains water the initial cost is zero, the cost of installing RWH systems is shown as a negative value indicating the initial cost to the householder. The green dotted line (mains water cost) shows that mains water supply is the cheaper option compared to the RWH systems shown 138
144 Figure 8.1. Cost of RWH compared to mains water supply The cost per m 3 water produced using RWH compared to the proposed mains water charge per m 3 is shown in Table 8.2. The cost per m 3 is calculated by dividing the annual yield of rainwater by the annualised capital cost and the operating and maintenance cost. RWH system RWH Mains water Tank size Cost per m 3 Cost per m m m m m m m m³ m³ m³ Table 8.4 RWH cost per 1m 3 of water and mains water charge per m 3 139
145 8.2. Viability Scenarios Grant availability The free household and child allowance have been included when modelling how RWH would perform economically. Plotting the cost of installing a RWH system with varying storage and capital costs against the cost of mains water supply is shown in Figure 8.2. Payback for installed RWH is indicated where the cost of mains water only supply (green dotted line ) drops below the RWH plot lines indicating costs for different RWH systems. Initially a grant of 30% was considered as VAT is charged at 23%, while VAT on services is charged at 13.5%. Provision of a capital grant of 30% of the cost of the purchase and installation costs would effectively reimburse most of VAT charges. Grants of 10 50% were also looked at. However none of the grants were sufficient to make RWH more economical than mains water only supply. While the grant reduces the initial capital cost of RWH, it does not affect the running costs and maintenance costs such as electricity costs for pump or maintenance expenses each year. The cost of maintaining and operating the RWH is more expensive than the savings made by the use of RWH. 140
146 Figure 8.2 Capital Grant at 50% purchase and installation cost of RWH Reducing mains water charges to households with RWH installed Reducing water demand and costs is not just beneficial to the householder; it provides benefits the water producer too. Reduced demand lessens stress on treatment plants and water supply networks. It reduces the need to seek out new water sources or to over extract supplies from existing ones allowing more sustainable management of water resources. Under these circumstances the water producer Irish Water, may reduce the cost of mains water to the households who install RWH. Discounts of mains water charges of between 10-50% per m 3 were modelled; only a reduction of 50% in mains water charge per m 3 gave a payback within the 25 year time frame taken (Figure 8.3). This is for the 0.25m 3 RWH at a payback of 17 years. 141
147 Figure 8.3 RWH performance when 50% reduction in mains water charge applied with RWH system installed versus mains water only supply Grant plus discounted mains water charge with RWH installed If in addition to a 30% grant a reduction in mains water costs per m 3 is applied, what level of discount per m 3 of mains water is required to provide a reasonable payback period? A 30% reduction in mains water per m 3 in addition to 50% refund on purchase and installation costs would yield payback of approximately 11 years for a 0.25m 3 tank RWH and 17 years for a 0.5m 3 tank (Figure 8.4) 142
148 Figure 8.4 RWH performance including 30% Grant on RWH purchase and installation costs and 50% discount on mains water costs with RWH installed Free Allowances reduced or abolished From the end of 2014 to the end of 2016, a 30m 3 (30,000 litre) annual free allowance will apply to each household. In addition although the exact value has not been finalised at present up to 38m 3 (38000 litres) free allowance annually per child under 18 per household will be applied. For calculation purposes it is assumed that the final child allowance will be 38 m 3 per year. Here five scenarios are analysed; mains water charges are unchanged at 2.04 per m 3 i. Reduce household allowance by 10-50% ii. Reduce child allowance by 10-50% iii. Abolish household allowance 143

149 iv. Abolish child allowance v. Abolish all allowances Figure 8.5 Mains water charges at 2.04 per m 3 and free allowances reduced by 50% Figure 8.6 All fee allowances abolished, mains water charge at 2.04 For all five scenarios above the cost of installing, operating and maintaining the RWH is more expensive than the cost of mains water supply only. Although the RWH is saving money in annual bills for mains water charge the saving is not larger than the cost of 144
150 operating and maintaining the RWH. For a 1m 3 RWH the annual cost of mains water for an average 2 adults and one child household with no free allowances available is , while annual cost of mains water supply with RWH is The total annual equivalent cost is 128. This is the cost of operation and maintenance and the capital cost annualised over the 25years at 3.5 % Free allowances reduced / abolished plus discount on mains water charges with RWH installed In this case the Free Allowances were reduced by 10%, 20%, 30%, 40% and 50%. The mains water charges were discounted by the same percentages each in turn. For percentage reductions in free allowance, main water discounts of 10% - 30% did not yield any payback periods less than 25 years. A water charge discount of 40% was required to give a 20 year payback for the 0.25m³ RWH. Increasing the water charge discount to 50% charges provided payback for all levels of reduced free allowance. Payback for 50% discount in water charges ranged from 16 years for 0.25m³ for a 10% reduction in free allowances to 20 years for 3m³ RWH for a 50% reduction in free allowances. Reduction in the free allowances increases the mains water bill to the householder. The cost of production per m 3 of the RWH systems is greater than the cost of mains supply. The volume of mains water replaced using a RWH is not sufficient to overcome the cost per m 3 differential. So unless an additional incentive is introduced to give RWH an advantage, RWH is not economically attractive. This advantage is in the form of a discount on mains water charges where a RWH is installed. The discount effectively must be of the order of 50% to allow for realistic terms of payback. These are outlined in Table
151 Level of charge per m 3 required to give payback less than 25 years What charge per m 3 would mains water have to reach to make RWH economical? From Table 8.5 the costs of RWH production range from 6.81 to per m 3. With mains water charges set at 2.04 per m 3, RWH is expensive. In this case the cost of mains water was increased between %. Doubling the cost of mains water provided no payback less than 25 years. Increasing the cost by 350%, ( 7 per m³) gave payback for 2m³ and 3m³ RWH of 23 and 25 years respectively. RWH system Tank size RWH Cost per m m m m m m m m³ m³ m³ Table 8.5 Cost per m³ produced by RWH systems Increasing mains water charge by 550% to 13 per m³ allowed paybacks ranging from 9 years for 0.25m³ RWH, 7years for 1.5m³ and 2m³ RWH to 9 years for 5m³. Table 8.7 gives the cost of production per m 3 by RWH. To make RWH economical under present conditions mains water charges would have to be increased at least to 7 and up to 13 to make all but the 7m³ RWH systems considered economical with payback less than 25 years (Figures 8.7 and 8.8). Table 8.6 summarises all the scenarios considered, outlining the various parameters required to produce a payback less than 25 years 146
152 Scenario Capital Grant Discounted water charge per m 3 with RWH Grant plus discounted water charge per m 3 Free allowances reduced / abolished Free allowances reduced / abolished plus discount on water charges with RWH installed Increase water charges - Cost per m 3 - Free allowances included Parameter 10-50% reduction on cost of purchase and installation of RWH Table 8.6. Summary of Scenarios investigated and modelled results. 0.25m³ 0.5m³ 1m³ 1.5m³ 2m³ 3m³ 4m³ 5m³ 7m³ / / / / / / / / / 50% Discount with RWH 16 / / / / / / / / 10% Grant + 50% discount water charges 20% Grant +50% discount water charges 30% Grant + 40% discount water charges 30% Grant + 50% discount water charges 40% Grant + 40% discount water charges 40% Grant + 50% discount water charges 50% Grant + 40% discount water charges 50% Grant + 50% discount water charges Free allowances reduced 10-50% / / / / / / / / / / / / / / 23 / / / / / / / / / / / / / / / / / / / / / / / / / / / / / / / / / / / / / / / / / Free allowances abolished / / / / / / / / / 10% reduction Free Allowance + 50% discount with RWH 20% reduction Free Allowance + 40% discount with RWH 20% reduction Free Allowance + 50% discount with RWH 30% reduction Free Allowance + 40% discount with RWH 30% reduction Free Allowance + 50% discount with RWH 40% reduction Free Allowance + 40% discount with RWH 40% reduction Free Allowance + 50% discount with RWH 50% reduction Free Allowance + 40% discount with RWH 50% reduction Free Allowance + 50% discount with RWH Payback / RWH by tank size (years) / / / / / / / 20 / / / / / / / / / / / / / / / / / / / / / / / / / / / / / / / / / / / / / / / / / / / / / / 7 per m³ / / / / / / / 8 per m³ / / / 9 per m³ / / 10 per m³ / / 11 per m³ / 12 per m³ per m³ / / = No payback within 25 years 147
153 Figure 8.7Mains water charges at 7 per m³ Figure 8.8 Mains water charges at 13 per m³. 148
154 9 Conclusions The principle research question investigated was under what circumstances would rainwater harvesting be viable in domestic, agricultural and school settings in Ireland? The results from the domestic site in Carlow showed that a rainwater harvesting installation was technically feasible and that 100% of the demand for non-potable water for toilet use could be supplied, from the RWH installation. The water quality of the harvested rainwater was of an excellent quality, 100% reached EU Bathing Water Standards while EU Drinking water standards were reached on almost 40% of the samples monitored. Discount variable analysis on the cost of installation compared with the cost of mains supply showed that the installation costs were prohibitively high, resulting in the rainwater harvesting installation in Carlow not being an economically viable investment for the private householder. The reported results from the agricultural installation in County Meath showed great variability. These problems mainly involved the type of filter used in what is referred to as Regime 1. This resulted in poor water quality from the installation. The situation was improved with the installation of a different filter system, but operational difficulties persisted, particularly the day to day workings of an active and well run farm/farmyard. The new filters, referred to as Regime 2, showed an improvement in water quality over Regime 1. The supply/demand situation on the farm showed inconclusive results. As with the cost of the domestic study the cost of the agricultural rainwater harvesting installation proved prohibitive when compared to existing charges for mains water use. The system installed also required continuing maintenance together with the problems with the filtering regime. The school study did not include water quality in its monitoring, due to the distance involved with a school located in County Mayo, in the west of Ireland. Results showed that 56% of non-potable water demand was met, thus the installation could be said to be 56% efficient. 149
155 There was little or no operational maintenance involved with the installation. It was also cost effective. The modelling chapter showed results involving different scenarios, summarised in Table 8.6, outlining the various parameters required to produce a payback in less than 25 years. There were two approaches that served to make RWH attractive to the householder. The first of these involved reducing the capital cost of RWH installation by providing a capital grant and also reducing the cost of mains water by introducing a discount of up to 50%. This approach helps reduce the cost per m 3 of producing water using a RWH. The other scenario that proved of benefit to the RWH installer was to increase the cost per m 3 of mains water to levels similar to cost per m 3 of water produced by RWH. These were the only modelled scenarios that resulted in the viability of RWH installations and showed cost effectiveness. Therefore the answer to the research question is that the preferred scenarios in Ireland in which RWH is economical viable are: (i) Storage to be designed for no greater than 90% efficiency (ii) A capital grant allowance of minimum 30% coupled with a 50% reduction for householders with RWH. (iii) The cost of mains water per m 3 is similarly priced as harvested rainwater per m 3. In this study this equates to 8 per m 3. (iv) A 20% reduction in free allowances to the householder coupled with a 50% reduction for householders with RWH. Innovations required to make RWH viable as a supply/demand strategy in Ireland include the following: Innovations in materials and components to reduce costs 150
156 Investigate RWH at scale, i.e. RWH on a single street, RWH at a housing estate level and also RWH for a village or small town. Investigate the payback accrued to the producer. Non-technical areas of further study would consider the triggers required to increase consumer uptake of RWH. This would involve considerations other than cost. 151
157 10 References: Bio Pure Technologies available online at accessed 11/09/2012 Brundtland G. Report of the World Commission on Environment and Development: Our Common Future available online at assessed 10/05/2010 BSI British Standards Rainwater Harvesting Code of Practice BS8515:2009 Campisano, A, Modica, C. Optimal sizing of storage tanks for domestic rainwater harvesting in Sicily Resources, Conservation and Recycling Vol 63, June 2012, pages 9-16 Central Statistics Office (CSO), 2011 available online at accessed 02/03/2011 Community Climate Change Consortium for Ireland Project (C4I), Ireland in a Warmer World Scientific Predictions of the Irish Climate in the Twenty-first Century available online at accessed 02/03/2011 Cunliffe David A, Guidance on the use of rainwater tanks National Environmental Health Monograph Water Series No. 3 available online at accessed 11/10/2010 DEWHA, 2010 Department of the Environment, Water, Heritage and the Arts Securing our Water Future available online at data/assets/pdf_file/0014/11507/securing_our_water_future_ -_web_version.pdf Department of Education and Science Guide to water efficiency in schools Circular 0046/2008 available online at 152
158 chools/publications,30952,en.pdf accessed 18/10/12 Department of the Environment, Community and Local Government (DoECLG) 2009 Water Services Pricing Policy Implementation Water Charges /Water Conservation for Schools Circular Number: WSP1/08 available online at chools/publications,30952,en.pdf accessed 18/10/12 Department of Environment, Australia, National Rainwater and Greywater Initiative available online at accessed 16/10/12 DoECLG (a), Department of Environment, Community and Local Government Reform of the water sector in Ireland, Position Paper 2012 available online at accessed 02/03/2012 DoECLG (b), Department of Environment, Community and Local Government, 2012 available online at 4,en.htm accessed 04/05/2012 DoECLG (c), Department of Environment, Heritage and Local Government (DoECLG), Guide to the Functions of and Records held by the Department, Section 15 Reference Book December 2007 available online at Department of Finance EU/IMF Programme of Financial Support for Ireland available online at 153
159 Department of Regional Development (DRD) available online at accessed 17/05/12 Department of the Environment, Community and Local Government (DoECLG) 2009 Water Services Pricing Policy Implementation Water Charges /Water Conservation for Schools Circular Number: WSP1/08 available online at chools/publications,30952,en.pdf accessed 18/10/12 Drinking Water Inspectorate (DWI), available online at accessed 17/05/2012 Environment Agency 2010, Harvesting rainwater for domestic uses: an information guide EPA, 2011 The Provision and Quality of Drinking Water in Ireland, A Report for the Year EPA, Ireland s Environment 2008 available online at pdf accessed 30/09/12 Fewkes Alan, 1999 Modelling the performance of rainwater collection systems: towards a generalised approach Urban Water available online at accessed 02/02/12 Fewkes, A. and Warm, P. (2000). A Method of Modelling the Performance of Rainwater Collection Systems in the UK. Building Services Engineering Research and Technology, 2,
160 Fingal County Council Schools Water Conservation Project, 2009 available online at chools/publications,30952,en.pdf accessed 18/10/12 Gleick P. H., Loh Penn, Gomez Santos V, Morrison Jason California Water 2020: A Sustainable Vision available at accessed 25/05/12 IMF Country Report No. 10/366 available online at accessed 17/10/12 Kerrigan Jason American Rainwater Catchment systems Association and the Dynamics of the USA Rainwater Industry International Rainwater Catchment Systems Association Conference, Kuala Lumpur 2009 Kinkade-Levario H. Design for Water: Rainwater Harvesting, Stormwater Catchment, and Alternate Water Reuse New Society Publishers 2007 König, Sperfeld, 2003 Rainwater Harvesting A global issue matures available online at _Global Issue_Matures.pdf accessed Koenig Klaus W. Case study Germany Further resource document I RAINWATER HARVESTING A part of urban water management in Germany available online at Harvesting Urban water management.htm accessed Lancaster Brad, available at accessed 2/10/2013 Martinson D. Brett & Thomas Terry, Quantifying the First Flush Phenomenon 2005 available online at _ircsa_2005b/ 155
161 Meinzen Stacey Rainwater Harvesting Policies Throughout the US available at accessed 11/10/13 Met Éireann 2012, available online at accessed 03/07/2012 NIEA, 2008 North Eastern River Basin Management Plan, Competent Authorities available online at accessed 30/09/12 Northern Ireland Environment Agency (NIEA) available online at accessed 17/05/12 Northern Ireland Water available online at pdf accessed 18/05/12 O Sullivan, G. (2002). Water Supply The Supply/Demand Problem. Institution of Engineers of Ireland, 22 Clyde Rd., Ballsbridge, Dublin4, Ireland OFWAT, The Water Services Regulatory Authority available online at accessed 17/05/2012 O'Hogain, S., McCarton, L., Reid, A., McIntyre, N., Pender, J.: (a) Rainwater Harvesting Pilot Project Report. National Rural Water Monitoring Committee, 2009 O'Hogain,S, McCarton,L, McIntyre,N, Pender,J, Reid,A; (b) Physicochemical and microbiological quality of water from a pilot domestic rainwater harvesting facility in Ireland, Water and Environment Journal, Volume 25, Issue 4, Pages , December 2011, Chartered Institute of Water and Environment Management. 156
162 Organisation for Economic Co-operation and Development (OECD) Environmental Performance Reviews of Ireland Conclusions and Recommendations 2010, available online at accessed 30/09/12 Price Cooper Waterhouse, (PwC) Irish Water: Phase 1 Report Appendices Roebuck Richard, PhD Thesis A Whole Life Costing Approach for Rainwater Harvesting Systems, Bradford University 2008 available online at accessed 19/07/2013 Rous Water BASIX Performance Report, 2013 available online at accessed 25/11/13 Texas Water Development Board, The Texas Manual Rainwater Harvesting 3 rd Ed, 2005 available online at df accessed 28/08/2009 The Consumer Council available online at accessed 17/05/12 UN Habitat, 2005 Rainwater Harvesting and Utilisation Blue Drop Series Book 1, UN Habitat, 2005 Blue Drop Series on Rainwater Harvesting and Utilisation Book 3: Project Managers and Implementation Agency available at 3_-_Implementing_Agencies.pdf accessed 28/08/2009 Water Framework Directive, Ireland Water Matters website available online at assessed 07/12/11 157
163 11 Appendix 158
164 Domestic Site Ballinabrannagh, Co. Carlow Carlow - RWH House Daily RWH performance by Month for 2006 and 2008 Carlow RWH House Daily RWH performance (toilet & hot water) by Month for 2006 and


165 RWH House


166 RWH House


167 162 RWH House Carlow 2006

168 RWH House

169 RWH House Toilets & Hot water demand

170 RWH House Toilets & Hot water demand

171 RWH House Toilets & Hot water demand

172 RWH House Toilets & Hot water demand
173 Carlow - House 2 Daily RWH performance by Month for


174 House 2


175 House 2


176 House 2


177 House 2


178 House 2


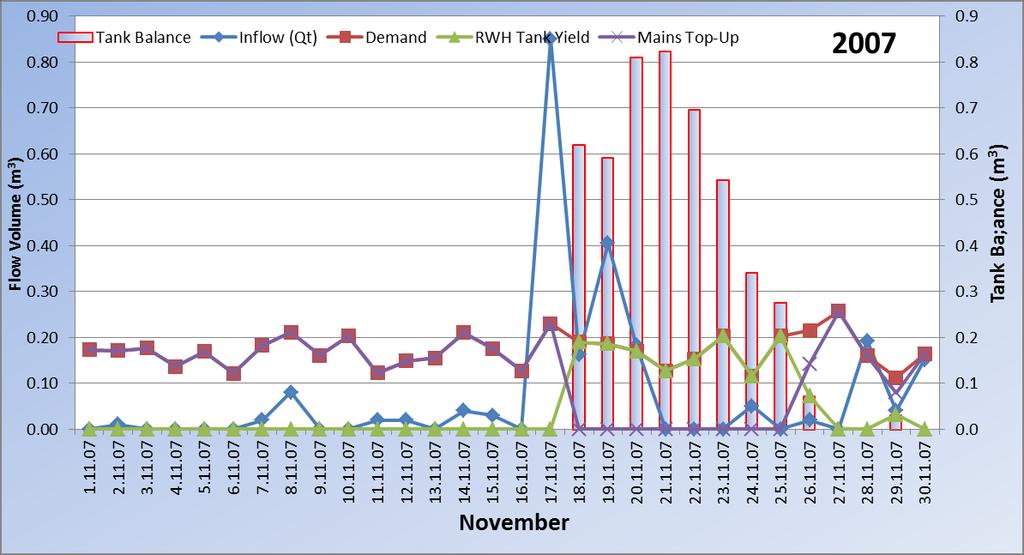

179 House 2


180 House 2
181 Carlow - House 3 Daily RWH performance by Month for


182 House 3


183 House 3

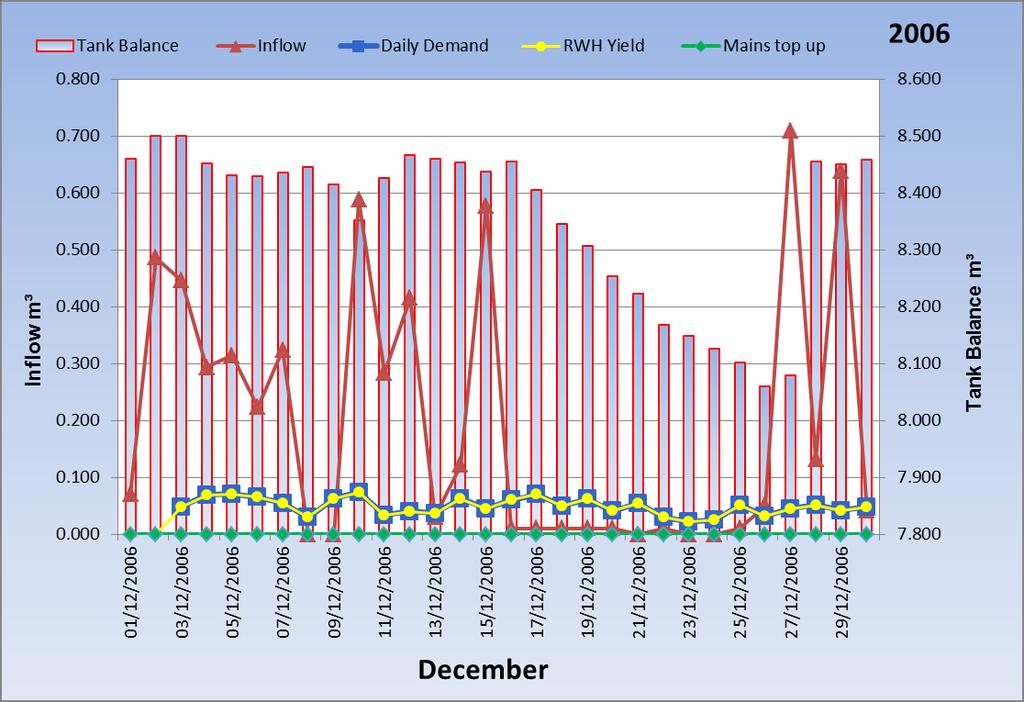
184 House 3

185 House 3

186 House 3

187 House 3

188 House 3
189 Carlow - House 4 Daily RWH performance by Month for

190 House 4

191 House 4

192 House 4

193 House 4

194 House 4

195 House 4
196 Agricultural Site Clonalvy Co. Meath Meath - RWH Daily RWH performance by Month for 2006 and

197 192

198 RWH Meath 2008 RWH Meath
Water Savings and Rainwater Harvesting Pilot Project in Ireland
 Dublin Institute of Technology ARROW@DIT Conference papers School of Civil and Structural Engineering 2007-09-12 Water Savings and Rainwater Harvesting Pilot Project in Ireland Sean O'Hogain Dublin Institute
Physicochemical and microbiological quality of water from a pilot domestic rainwater harvesting facility in Ireland.
 Dublin Institute of Technology ARROW@DIT Articles School of Civil and Structural Engineering 211-12-1 Physicochemical and microbiological quality of water from a pilot domestic rainwater harvesting facility
RAINWATER HARVESTING SYSTEMS
 BALMORAL TANKS RAINWATER HARVESTING SYSTEMS www.balmoralrainwatersystems.co.uk UK Designed and manufactured The Balmoral HydroStore TM With the recognition of water as a valued commodity, Balmoral Tanks
Rainwater Harvesting. Access Irrigation Guide to. Rainwater Harvesting
 Rainwater Harvesting Access Irrigation Guide to Rainwater Harvesting Changing climate conditions are making water saving a big issue. Not only do parts of the UK have relatively little water per capita,
Irish Water Capital Investments
 An Coimisiún um Rialáil Fóntas Commission for Regulation of Utilities Irish Water Capital Investments Monitoring Report January to June 2017 Information Paper Reference: CRU/18/057 Date Published: 04/04/2018
Greater Dublin Drainage Project
 Greater Dublin Drainage Project The Wastewater Treatment Process: How Does it Work? June 2013 The Greater Dublin Drainage initiative aims to provide the drainage infrastructure needed to allow the Greater
AQUATEK rainwater harvesting systems can reduce mains water consumption in the average domestic dwelling by up to 50%."
 RAINWATER HARVESTING SYSTEMS Aquatek rainwater harvesting systems capture and store rainwater from roofs allowing it to be reused around the house or building for supplying water to flush toilets, wash
National Water Demand Management Policy
 National Water Demand Management Policy Introduction In 1997, the Ministry of Water and Irrigation developed Jordan s Water Strategy and the following four policies, which include: Water Utility Policy;
Water Resources on PEI: an overview and brief discussion of challenges
 Water Resources on PEI: an overview and brief discussion of challenges Components: Components and links Atmospheric water Surface water (including glacial water) Groundwater Links: Precipitation (atm(
Integrated Catchment Modelling
 Integrated Catchment Modelling Modelling the whole water cycle in one package Ann Pugh Integrated Water Planning Historically water, wastewater and stormwater modelling occurred in silos with little integration
Urban Rainwater Harvesting Systems: Promises and Challenges
 TheWaterChannel Webinar #5 Urban Rainwater Harvesting Systems: Promises and Challenges By Vishwanath S Zenrainman@gmail.com www.ircsa.org www.rainwaterclub.org Thanks for coming. The webinar will begin
Quality of Rainwater From Rainwater Harvesting Systems in Sanaa. Nagib Ghaleb N. Mohammed, Civil Engineering Department, University of Bahrain
 Quality of Rainwater From Rainwater Harvesting Systems in Sanaa Nagib Ghaleb N. Mohammed, Civil Engineering Department, University of Bahrain Outlines Shortage of Water Rain water harvesting Benefits of
first flush water diverters water quality first downspout, post/wall mounted and in-ground diverters
 water quality first downspout, post/wall mounted and in-ground diverters Available in kit form just add PVC pipe Simple, effective and easy to install Includes Slow Release Control Valve - empties after
Our Eastern Shore Groundwater Part IV Groundwater Quality on the Eastern Shore: How safe is our groundwater and are there ways we can protect it?
 Our Eastern Shore Groundwater Part IV Groundwater Quality on the Eastern Shore: How safe is our groundwater and are there ways we can protect it? Britt McMillan, Malcolm Pirnie, Inc. Mercury Venus Mars
Engineers Without Borders Conceptual Design Assignment
 ENGGEN 115 Introduction to Design Faculty of Engineering University of Auckland Engineers Without Borders Conceptual Design Assignment Rainwater Collection and Storage System For the Supply of Drinking
Rainwater Harvesting for Irrigation
 Rainwater Harvesting for Irrigation Dotty Woodson, Water Resources Specialist Texas A&M AgriLife Extension d-woodson@tamu.edu Abstract. Many are looking for an affordable alternative water source for landscape
OVERVIEW CAPACITY & CONDITION
 OVERVIEW The nation s 14,748 wastewater treatment plants protect public health and the environment. Years of treatment plant upgrades and more stringent federal and state regulations have significantly
The role of domestic rainwater harvesting systems in storm water runoff mitigation
 European Water 58: 497-53, 217. 217 E.W. Publications The role of domestic rainwater harvesting systems in storm water runoff mitigation I. Gnecco *, A. Palla and P. La Barbera Department of Civil, Chemical
WATER CODE TITLE 2. WATER ADMINISTRATION SUBTITLE D. WATER QUALITY CONTROL CHAPTER 26. WATER QUALITY CONTROL SUBCHAPTER A. ADMINISTRATIVE PROVISIONS
 WATER CODE TITLE 2. WATER ADMINISTRATION SUBTITLE D. WATER QUALITY CONTROL CHAPTER 26. WATER QUALITY CONTROL SUBCHAPTER A. ADMINISTRATIVE PROVISIONS Sec. 26.001. DEFINITIONS. As used in this chapter: (1)
The University has numerous athletic fields in its south campus complex. The varsity
 Problem Statement The University has numerous athletic fields in its south campus complex. The varsity field hockey stadium is the largest outdoor sports facility on the University s campus. In 1996, a
Streamlines V2, n2 (May 1997) A Newsletter for North Carolina Water Supply Watershed Administrators
 A Newsletter for North Carolina Water Supply Watershed Administrators") Page 1 of 5 STREAMLINES A Newsletter for North Carolina Water Supply Watershed Administrators Volume 2, Number 2 May 1997 Non-Point Source (NPS) Pollution This issue of Streamlines provides basic information
Page 1 of 5 STREAMLINES A Newsletter for North Carolina Water Supply Watershed Administrators Volume 2, Number 2 May 1997 Non-Point Source (NPS) Pollution This issue of Streamlines provides basic information
1. SOURCES OF NATIONAL LEGISLATION (PRIMARY AND SECONDARY LEGISLATION)
") 1. SOURCES OF NATIONAL LEGISLATION (PRIMARY AND SECONDARY LEGISLATION) The national water legislative framework in the Republic of Macedonia is comprehensive and regulates, from different perspectives,
1. SOURCES OF NATIONAL LEGISLATION (PRIMARY AND SECONDARY LEGISLATION) The national water legislative framework in the Republic of Macedonia is comprehensive and regulates, from different perspectives,
STORMWATER HARVESTING, AN INNOVATIVE WAY OF MEETING THE CATCHMENT WIDE NEEDS OF THE BUILT AND SOCIAL ENVIRONMENTS
 STORMWATER HARVESTING, AN INNOVATIVE WAY OF MEETING THE CATCHMENT WIDE NEEDS OF THE BUILT AND SOCIAL ENVIRONMENTS Bronwyn Rhynd, CPEng, MIPENZ, IntPE ABSTRACT Catchment wide stormwater management objectives
RAINWATER HARVESTING. Ward Ling- Watershed Coordinator
 RAINWATER HARVESTING Ward Ling- Watershed Coordinator WHAT ARE YOU DOING WITH YOUR RAIN WATER? RAINWATER HARVESTING Rainwater harvesting is the capture, diversion, and storage of rainwater for use in landscaping,
City of Fairmont Storm Water Pollution Prevention Plan (SWPPP) January 23, 2017
 January 23, 2017") City of Fairmont Storm Water Pollution Prevention Plan (SWPPP) January 23, 2017 Why is Water Quality Important? Water has always been important to Minnesota and is a key part of our history, culture, economy
City of Fairmont Storm Water Pollution Prevention Plan (SWPPP) January 23, 2017 Why is Water Quality Important? Water has always been important to Minnesota and is a key part of our history, culture, economy
Stormwater Attenuation Systems Sustainable Drainage Solutions for Domestic & Commercial Applications
 Environmental Stormwater Attenuation Systems Sustainable Drainage Solutions for Domestic & Commercial Applications Sustainable, Reliable, Affordable Stormwater Attenuation Systems Sustainable Drainage
Quality Assurance Scheme
 The NFGWS Quality Assurance Scheme 1 2 Introduction The Quality Assurance Scheme is a concept developed by the National Federation of Group Water Schemes in response to the water quality problems on privately-sourced
WATER CODE TITLE 2. WATER ADMINISTRATION SUBTITLE D. WATER QUALITY CONTROL CHAPTER 26. WATER QUALITY CONTROL SUBCHAPTER A. ADMINISTRATIVE PROVISIONS
 WATER CODE TITLE 2. WATER ADMINISTRATION SUBTITLE D. WATER QUALITY CONTROL CHAPTER 26. WATER QUALITY CONTROL SUBCHAPTER A. ADMINISTRATIVE PROVISIONS Sec. 26.001. DEFINITIONS. As used in this chapter: (1)
Chapter 1. Introduction
 Chapter 1 Introduction James P. Heaney, Robert Pitt, and Richard Field Introduction Stormwater has traditionally been considered a nuisance, requiring rapid and complete drainage from areas of habitation.
Rain Barrel Water Harvesting
 A Guide: Rain Barrel Water Harvesting By Terry Sprouse Amy McCoy Joaquin Murrieta Water harvesting system in Nogales, Arizona Thank you to: Altria, Inc. for funding for this project; Home Depot for supplying
Water Issues in Cyprus
 Water Issues in Cyprus Sofoclis Aletraris Minister of Agriculture, Natural Resources and Environment 7 July, 2012 Water scarcity and droughts in Cyprus Severe water scarcity problem in Cyprus for centuries
Charles P. Cavedoni PE Mechanical Engineer PO Box 252 Hakalau, HI (808) ph/fax
 ph/fax") HAKALAU ENGINEERING, LLC. August 6, 2008 Charles P. Cavedoni PE Mechanical Engineer PO Box 252 Hakalau, HI 96710 (808) 961-6202 ph/fax ccavedoni@hakalauengineering.com Steward Yamada, Chief Safe Drinking
HAKALAU ENGINEERING, LLC. August 6, 2008 Charles P. Cavedoni PE Mechanical Engineer PO Box 252 Hakalau, HI 96710 (808) 961-6202 ph/fax ccavedoni@hakalauengineering.com Steward Yamada, Chief Safe Drinking
Surface water is the rainwater that runs off roofs, roads and paved areas into the public sewerage system.
 This standard advice note is intended to provide clear guidance for all developers, and planning authorities regarding surface water design and management. It should also be used to inform development
Vision 2030: The resilience of water supply and sanitation in the face of climate change Chee-Keong CHEW 28 October 2009
 Vision 2030: The resilience of water supply and sanitation in the face of climate change Chee-Keong CHEW 28 October 2009 1 Scope Why climate resilience is important? Overview of Vision 2030 Summary of
The Regulatory Framework
 The Regulatory Framework Water reuse project objectives How Do MN Agencies Currently Manage Water Reuse? Agency Roles Regulation by Source What Have We Heard? Agency roles and responsibilities Department
Water Account, Mauritius 2013
 Republic of Mauritius Water Account, Mauritius 2013 Statistics Mauritius, Ministry of Finance and Economic Development June 15 Contents Foreword... III List of Symbols and Abbreviations... IV 1. Introduction...
Performance Evaluation of Rainwater Harvesting Systems Toronto, Ontario
 Performance Evaluation of Rainwater Harvesting Systems Toronto, Ontario Prepared by: Toronto and Region Conservation 2010 Toronto, Ontario A final report prepared by: Toronto and Region Conservation Authority
What is a stormwater utility fee?
 What is a stormwater utility fee? A stormwater utility fee is similar to a water or sewer utility fee. In essence, customers pay a fee to convey stormwater from their properties. The City of Goodlettsville
RAIN WATER HARVESTING FOR HOUSES
 RAIN WATER HARVESTING FOR HOUSES Lessons learned from a domestic installation Andy Cunninghame October 2017t Water Security Drought Risk Areas Western Cape Government 2012 Climate Change and Water Security
A.B.A. Well and Septic Services Inc. P.O. Box 35 Ivor, VA (757) A Homeowner s Guide to Septic Systems
 A Homeowner s Guide to Septic Systems") A.B.A. Well and Septic Services Inc. P.O. Box 35 Ivor, VA 23866 (757) 859-9494 A Homeowner s Guide to Septic Systems The Main Components of a Septic System Septic Tank The septic tank is a buried, watertight
A.B.A. Well and Septic Services Inc. P.O. Box 35 Ivor, VA 23866 (757) 859-9494 A Homeowner s Guide to Septic Systems The Main Components of a Septic System Septic Tank The septic tank is a buried, watertight
Roof Top Rain Water Harvesting of SVBIT College Vasan, Gandhinagar
 IJIRST International Journal for Innovative Research in Science & Technology Volume 2 Issue 12 May 2016 ISSN (online): 2349-6010 Roof Top Rain Water Harvesting of SVBIT College Vasan, Gandhinagar Abhijitsinh
CHEMICAL MONITORING & MANAGEMENT LESSON 6: WATER QUALITY 1 SAMPLE RESOURCES
 YEAR 2 CHEM ISTRY CHEMICAL MONITORING & MANAGEMENT SAMPLE RESOURCES 300 008 008 www.matrix.edu.auu YEAR 2 CHEMISTRY. Water Quality Students perform first hand investigations to use qualitative and quantitative
A Strategic Research and Innovation Agenda for the Water in the EU
 A Strategic Research and Innovation Agenda for the Water in the EU Antonio Lo Porto Water Research Institute (IRSA-CNR) Italy EU and the Water Framework Directive In the E.U., the Water Framework Directive
SUBSURFACE INFILTRATION SYSTEM DESCRIPTION. Alternative Names: Sump, Drywell, Infiltration Trench, Infiltration Galleries, Leach Fields
 4.1-d SUBSURFACE INFILTRATION SYSTEM Alternative Names: Sump, Drywell, Infiltration Trench, Infiltration Galleries, Leach Fields BMP DESIGN APPROACH Pollutant Source Control Hydrologic Source Control Stormwater
Water Conservation Report
 Water Conservation Report 2016-2017 Table of contents Executive summary... 3 Introduction and regulatory context... 13 1.1 Approval of the ELWC Methodology... 14 Our five-year plan... 15 2.1 The value
1. RIVER BASIN MANAGEMENT
 1. RIVER BASIN MANAGEMENT 1.1 General New arrangements are being put in place to strengthen systems for the management of water quality and the protection of aquatic ecosystems. The new arrangements have
4 Onsite Sewage Systems
 4 Onsite Sewage Systems The term onsite system refers to any system which is used to store, treat and dispose of liquid waste at the premises where the waste is generated. Many households and industries
INSTALLATION MANUAL RD01
 INSTALLATION MANUAL RD0 98 RainDirector Installation Guide AW.indd 9// :5:8 Cat 5 wire to connect junction box on header tank to underside of control panel. This pictorial installation guide. The comprehensive
Improving the condition of Solway Tweed s water environment Tweed area management plan
 Improving the condition of Solway Tweed s water environment Tweed area management plan 2010 2015 Supplementary to the river basin management plan for the Solway Tweed river basin district Page 1 of 20
TEKS Lesson 7.8C: Effects of Human Activity on Surface Water and Groundwater
 Class ----- Date -------- TEKS Lesson 7.SC TEKS 7.8e Model the effects of human activity on groundwater surface water in a watershed. and TEKS Lesson 7.8C: Effects of Human Activity on Surface Water and
UrbanSAT- Urban System Analysis Tool : For delivering urban water balancing and reporting
 19th International Congress on Modelling and Simulation, Perth, Australia, 12 16 December 2011 http://mssanz.org.au/modsim2011 UrbanSAT- Urban System Analysis Tool : For delivering urban water balancing
GRAY WATER SYSTEMS FOR RESIDENTIAL BUILDINGS
 INFORMATION BULLETIN / PUBLIC - PLUMBING CODE REFERENCE NO.: LAMC 94.1502.0 Effective: 01-01-2017 DOCUMENT NO.: P/PC 2017-012 Revised: Previously Issued As: P/PC 20014-012 GRAY WATER SYSTEMS FOR RESIDENTIAL
Rainwater Harvesting:
 Rainwater Harvesting: Using and Reducing the Water that Goes to Waste. By Steve Williams 2012 An Answer to Urban Water Quantity and Quality Problems Urban Ecosystem Analysis The City of Atlanta Tree loss
How to Care for Your Septic System
 How to Care for Your Septic System Did you know as a homeowner it is your responsibility to maintain your septic system? Did you know maintaining your septic system is protecting your investment? Did you
Flood risk management and land use planning in changing climate conditions Mikko Huokuna Finnish Environment Institute, SYKE
 10th International Drainage Workshop of ICID 06.-11. July 2008 Flood risk management and land use planning in changing climate conditions Mikko Huokuna Finnish Environment Institute, SYKE Background hydrological
Handout 5: Stormwater Cost of Service
 Handout 5: Stormwater Cost of Service Introduction The purpose of this handout is to describe the current cost allocation methodology for the stormwater program. The existing Stormwater Management Service
Rainwater Harvesting Systems for Domestic Applications
 Rainwater Harvesting Systems for Domestic Applications Rainwater Harvesting The portfolio of Rainwater Harvesting products offer economical solutions for water conservation in the home and garden. Detailed
Phil Mashoko(Pr Eng) Director: W & S City of Cape Town South Africa
 Director: W & S City of Cape Town South Africa") Phil Mashoko(Pr Eng) Director: W & S City of Cape Town South Africa SECURITY OF WATER SUPPLY It is the ability to continuously produce and supply safe drinking water to the enduser ASSURANCE RISK LEVEL
Phil Mashoko(Pr Eng) Director: W & S City of Cape Town South Africa SECURITY OF WATER SUPPLY It is the ability to continuously produce and supply safe drinking water to the enduser ASSURANCE RISK LEVEL
Two Case Studies of Stormwater Harvesting: The Coburg and Merrifield Projects, Victoria, Australia
 Two Case Studies of Stormwater Harvesting: The Coburg and Merrifield Projects, Victoria, Australia J. McGrath*, G. Wilson**, D. Elliott**, J. Baumann*, H. Wahjudi* * Dalton Consulting Engineers, 255 Whitehorse
Memorandum Neighborhood Development Services Office of the City Engineer City Hall Annex, 610 East Market St., Charlottesville
 Memorandum Neighborhood Development Services Office of the City Engineer City Hall Annex, 610 East Market St., Charlottesville To: WHOM IT MAY CONCERN From: Engineering Division Date: February 9, 2009
c: Don Labossiere, Director, Environmental Compliance and Enforcement Public Registries
 Climate Change and Environmental Protection Division Environmental Approvals Branch 123 Main Street, Suite 160, Winnipeg, Manitoba R3C 1A5 T 204 945-8321 F 204 945-5229 www.gov.mb.ca/conservation/eal CLIENT
HEALTHY TONGA TOURISM A GUIDE TO SAFE RAINWATER HARVESTING FOR TOURIST ACCOMMODATION BUSINESSES IN TONGA
 HEALTHY TONGA TOURISM A GUIDE TO SAFE RAINWATER HARVESTING FOR TOURIST ACCOMMODATION BUSINESSES IN TONGA Contents 1. Purpose of guide 1 2. Safe drinking-water 1 3. Rainwater harvesting 2 4. Safe rainwater
FACTSHEET INTRODUCTION. help rebalance the water cycle, mitigate the effects of climate change and improve human health and livelihoods.
 1 FACTSHEET INTRODUCTION World Water Day, on 22 March every year, is about focusing attention on the importance of water. This year s theme, Nature for Water, explores nature-based solutions (NBS) to the
Tucson Water s Rainwater Harvesting Incentive Workshop Provided as a community service by
 Tucson Water s Rainwater Harvesting Incentive Workshop Provided as a community service by A 501(c)3 Non-profit organization Rainwater Harvesting Systems Capturing rainwater for beneficial use 1. Harvest
Watershed: an area or ridge of land that separates waters flowing to different rivers, basins, or seas. It is the interdependent web of living
 Watershed: an area or ridge of land that separates waters flowing to different rivers, basins, or seas. It is the interdependent web of living organisms that inhabit a geographic area and depend on it
Hazardous Waste Management
 Objectives EC SE TC WE NS WM Erosion Control Sediment Control Tracking Control Wind Erosion Control Non-Stormwater Management Control Waste Management and Materials Pollution Control Legend: Primary Objective
ROOF TOP RAIN WATER HARVESTING. Manohar Patil
 ROOF TOP RAIN WATER HARVESTING Manohar Patil Why harvest rainwater To arrest ground water To beneficiate water quality in aquifers To conserve surface water runoff To reduce soil erosion What is Rainwater
WATER QUALITY MANAGEMENT IN MALAYSIA, POLICY AND ACTION PLANS
 WATER QUALITY MANAGEMENT IN MALAYSIA, POLICY AND ACTION PLANS Department of Environment Ministry of Natural Resources & Environment Level 1-4, Podium Blok 2 & 3, Lot G43, Presint 4, Federal Government
Requires Member States to take actions to mitigate the effects of floods and droughts.
 2.5 THE WATER FRAMEWORK DIRECTIVE Official Title: Council Directive 2000/60/EC of 23 October 2000 establishing a framework for Community action in the field of water policy 2.5.1 INTRODUCTION The Water
STANDARD. Document information. Version: v4.8 Dec Date: Dec (c) 2012 European Water Partnership. All rights reserved.
 2012 European Water Partnership. All rights reserved.") STANDARD Document information Version: v4.8 Dec 2012 Language: English Date: Dec 2012 (c) 2012 European Water Partnership. All rights reserved. PAGE LEFT BLANK ON PURPOSE European Water Stewardship (EWS)
STANDARD Document information Version: v4.8 Dec 2012 Language: English Date: Dec 2012 (c) 2012 European Water Partnership. All rights reserved. PAGE LEFT BLANK ON PURPOSE European Water Stewardship (EWS)
RAINWATER HARVESTING SYSTEMS FOR DOMESTIC APPLICATIONS
 RAINWATER HARVESTING SYSTEMS FOR DOMESTIC APPLICATIONS Rainwater Harvesting The Kingspan Klargester portfolio of Rainwater Harvesting products offer economical solutions for water conservation in the home
40 CFR - Code of Federal Regulations - Title 40: Protection of Environment
 40 CFR - Code of Federal Regulations - Title 40: Protection of Environment TITLE 40 - PROTECTION OF ENVIRONMENT CHAPTER I - ENVIRONMENTAL PROTECTION AGENCY SUBCHAPTER I - SOLID WASTES PART 270 - EPA ADMINISTERED
6.1 Introduction to Wastewater Issues
 Section 6: Water Pollution This Section will help you: Understand if you generate industrial wastewater; Understand where your wastewater goes; Make sure you meet requirements for floor drains; Properly
9-1. Wet-weather high-speed wastewater filtration system
 9-1.Wet-weather high-speed wastewater filtration system N. Horie 1, M.Kabata 2, K.Sano 3, S.Kanamori 4 Director, Chief Researcher,Senior Researcher 3, Researcher 4 First Research Department Japan Institute
Utilities. Services. Infrastructure. Irish Water Business Plan. Transforming Water Services in Ireland to 2021 UTILITIES INFRASTRUCTURE SERVICES
 Utilities Services Infrastructure Irish Water Business Plan Transforming Water Services in Ireland to 2021 UTILITIES INFRASTRUCTURE SERVICES 2 Irish Water Business Plan Contents Executive Summary...4 1
Cisterns SMP One-Sheet - download a summary of this tool, with quick reference facts for clients and. developers.
 4.5 Cisterns Cisterns SMP One-Sheet - download a summary of this tool, with quick reference facts for clients and developers. Chapter 4 - pg. 84 Philadelphia Water Stormwater Management Guidance Manual
water, forestry, fossil fuels, metallic and non-metallic minerals
 water, forestry, fossil fuels, metallic and non-metallic minerals Faith / spirituality (water baptisms, FNMI water stories, etc) Sustains us / necessary for life Sanitation Transportation (canoe, boat,
WATERSHED. Maitland Valley. Report Card 201
 Maitland Valley WATERSHED Report Card 201 The Maitland Valley Conservation Authority has prepared this report card as a summary on the state of our forests, wetlands, surface water, and ground water resources.
Figure 19 Rendering of New Rooftop
 Haack 30 current electric and natural gas rates, which are relatively variable. The advantage of the new system is the diversity of energy sources between electric and natural gas as compared to the existing
Renewable energy at water utilities
 Renewable energy at water utilities WARES Conference June 4 th, 2014, Oulu, Finland Eva Pongrácz University of Oulu, NorTech Oulu WARES is a 2-year strategic Northern Periphery Programme project which
Chapter 2: Description of Treatment Facilities
 2020 Facilities Plan Treatment Report 2.1 Introduction Chapter 2: Description of Treatment Facilities This chapter defines the Milwaukee Metropolitan Sewerage District (MMSD) service area. It also describes
Your Guide to the. Budd Inlet Treatment Plant
 Your Guide to the Budd Inlet Treatment Plant How does LOTT know the plant is working correctly? All activity within the treatment plant is monitored 24 hours a day, 7 days a week. A highly trained team
2018/19 Desalinated Water Order Advice
 2018/19 Desalinated Water Order Advice Summary of Technical Analysis March 2018 Melbourne Water is owned by the Victorian Government. We manage Melbourne s water supply catchments, remove and treat most
National Inspection Plan
 Environmental Protection Agency National Inspection Plan 2018-2021 Domestic Waste Water Treatment Systems Draft for Consultation ENVIRONMENTAL PROTECTION AGENCY The Environmental Protection Agency (EPA)
Domestic grey water treatment and recovery to meet up the standards of characteristics of irrigation water
 The Eighth Jordan International Chemical Engineering Conference (JIChEC 2017) November 7-9, 2017 Domestic grey water treatment and recovery to meet up the standards of characteristics of irrigation water
Water Quality. CE 370 Lecture 1. Global Distribution of Earth s s Water
 Water Quality CE 370 Lecture 1 Global Distribution of Earth s s Water Water Demand and Supply in Saudi Arabia Total Water Consumption = 22 billion m 3 /Year Water Demand Water Supply Industrial Domestic
Aqua-Recycling-Control 80B Plus
 Aqua-Recycling-Control 80B Plus Item No G17200, G17205 Example picture, Aqua-Recycling-Control including Aqua-Control (is not included in scope of supply) Typical applications - Decentralized waste water
NAVFAC EXWC Tests Feasibility of Smart Water Conservation System
 NAVFAC EXWC Tests Feasibility of Smart Water Conservation System System May Significantly Reduce Potable Water Consumption A RECENT DEMONSTRATION project by engineers from the Naval Facilities Engineering
Tackling Non-point Source Water Pollution in British Columbia
 Water Quality Clean Water Tackling Non-point Source Water Pollution in British Columbia Our well-being depends on sustainable supplies of clean water for our physical health and for a healthy environment
INTRODUCTION RIGHTS OF CONSUMERS. Quality, Safety and Wholesomeness
 INTRODUCTION Some services are considered essential in a modern society amongst these a piped water supply. This is best provided on a communal basis, where population and housing density make it economically
EU Membership and Water Quality in Malta. Q&A Fact File
 EU Membership and Water Quality in Malta. Q&A Fact File Why Does the EU Have a Policy on Water? Because water resources are very limited and are often much polluted. Recent statistics show that industry
LEED-2009 Green Building Rating System. New Construction & Major Renovations
 LEED-2009 Green Building Rating System New Construction & Major Renovations 1 The following pages are designed to assist Engineers acquire LEED Credits in the design of Green Sustainable building utilizing
East Maui Watershed Partnership Adapted from Utah State University and University of Wisconsin Ground Water Project Ages 7 th -Adult
 INTRODUCTION What is groundwater? Water contained in saturated soil and rock materials below the surface of the earth. It is not NEW water, but is recycled water through the hydraulic cycle. The source
INTRODUCTION TO HOBBY FARMING AND WATER QUALITY
 SECTION ONE INTRODUCTION TO HOBBY FARMING AND WATER QUALITY This is a handbook for owners of Hobby Farms - small scale farms operated primarily as a residential lifestyle - to provide their owners with
Water sensitive urban design. Developing design objectives for urban development in South East Queensland
 Water sensitive urban design Developing design objectives for urban development in South East Queensland Version 2-8 November 2007 Contents Contents......... ii Executive Summary............1 1 Introduction.........1
URBAN REGENERATION AND OPTIMAL WATER DEMAND MANAGEMENT
 Proceedings of the 14 th International Conference on Environmental Science and Technology Rhodes, Greece, 3-5 September 2015 URBAN REGENERATION AND OPTIMAL WATER DEMAND MANAGEMENT ROZOS E. 1 and MAKROPOULOS
The Islamic University of Gaza- Civil Engineering Department Sanitary Engineering- ECIV 4325 L5. Storm water Management
 The Islamic University of Gaza- Civil Engineering Department Sanitary Engineering- ECIV 4325 L5. Storm water Management Husam Al-Najar Storm water management : Collection System Design principles The Objectives
Spoil and Water. Irish Ports Association Conference Ciaran Callan Dublin Port Company. 26 th September 2008
 Spoil and Water Ciaran Callan Dublin Port Company Irish Ports Association Conference 2008 26 th September 2008 Disposal of Dredge Material: Regulation and Process of Application Requirement for disposal
Residential Sewer Backup Prevention Program
 City of Wheaton Residential Sewer Backup Prevention Program Please Note: The City reserves the right to modify the policies, procedures and rules of this program or discontinue the program in its entirety
Integrated Domestic Water Management. Workshop Date: 5 th June Venue: TARA Gram Orcha
 Integrated Domestic Water Management Workshop Date: 5 th June Venue: TARA Gram Orcha INTRODUCTION Water forms the very basis of life It covers 71% - Earth's surface 3 % - fresh water 69 % - in glaciers