Study of gas fuel jet burning in low oxygen content and high temperature oxidizer
|
|
|
- Joshua Brice Bradford
- 6 years ago
- Views:
Transcription

1 ROYAL INSTITUTE OF TECHNOLOGY Study of gas fuel et burning in low oxygen content and high temperature oxidizer Magnus Mörtberg Doctoral Dissertation Stockholm 2005 Royal Institute of Technology School of Industrial Engineering and Management Department of Materials Science and Engineering Division of Energy and Furnace Technology SE Stockholm Sweden Akademisk avhandling som med tillstånd av Kungliga Tekniska Högskolan i Stockholm framlägges för offentlig granskning för avläggande av teknologie doktorsexamen fredagen den 27 ma 2005, kl i sal D3, Lindstedtsvägen 5, Kungliga Tekniska Högskolan, Stockholm. ISRN KTH/MSE--05/26--SE+ENERGY/AVH ISBN
2 Magnus Mörtberg. Study of gas fuel et burning in low oxygen content and high temperature oxidizer Royal Institute of Technology School of Industrial Engineering and Management Department of Materials Science and Engineering Division of Energy and Furnace Technology SE Stockholm Sweden ISRN KTH/MSE--05/26--SE+ENERGY/AVH ISBN the author ii
3 iii Abstract
4 iv
5 During the past decade, new advanced combustion systems that share the same basic concept of using a substantially diluted and high-temperature oxidizer in the reaction volume have gained a great deal of interest regarding their application in industrial and power systems. These novel combustion technologies have proved to offer significant benefits compared to traditional combustion techniques. These benefits include reductions in pollutant emissions and energy consumption, as well as a higher and more uniformly distributed heat flux. This entails the potential to, for example, reduce the size of equipment in industrial units or increase production rates while fuel consumption and the subsequent CO 2 emissions are decreased or maintained at the same level. Although the development of these new combustion technologies has occurred fairly recently, it has gained worldwide recognition. During the past few years the technique has been used commercially with several different types of burners. Despite its widespread use, the basic understanding of the chemical-physical phenomena involved is limited, and a better understanding of the combustion phenomena is required for more effective utilization of the technology. The obectives of this work have been to obtain fuel-et characteristics in combustion under hightemperature, low-oxygen conditions and to develop some theoretical considerations of the phenomena. The effect of the preheat temperature of the combustion air, combustion stoichiometry and the fuel-et calorific value on flame behavior was investigated. Temperature and heat-flux distribution were also studied using a semi-industrial test furnace to see if similar flame features would be found for the small- and large-scale experiments. Particle Image Velocimetry (PIV) was used for the first time to obtain information on the flow dynamics of a fuel et inected into a crossflow of oxidizer at either a normal temperature or a very high temperature. Light emission spectroscopy was used to collect information on time-averaged radical distributions in the combustion et. Jet turbulence, time-averaged velocity distribution, fuel-et mixing, the distribution of radicals such as CH, OH and C 2, and flame photographs were investigated. The results showed delayed mixing and combustion under high-temperature low-oxygen-concentration conditions. The combustion air preheat temperature and oxygen concentration were found to have a significant effect on the burning fuel-et behavior. The results of the semi-industrial-scale tests also showed the features of even flame temperature and heat flux. v
6 vi
7 vii Acknowledgements
8 viii
9 Many thanks to my supervisor Professor W. Blasiak for providing me with the opportunity to complete significant parts of this thesis abroad and his scientific support and guidance throughout the years as a student in his group. Professor A.K. Gupta is acknowledged for his excellent supervision in the combustion science. Scientific support and guidance, always seeing the possible when I saw the impossible, thus pushing me to strive further for a successful accomplishment of data collection and interpretation. Further also for accepting me as a visiting graduate student in his laboratory at the University of Maryland. Doctor Yang Weihong is great fully acknowledged for many interesting discussion, both in the sciences and in many other topics as well. My colleagues at the energy and furnace division are acknowledged for the scientific and cultural exchange that is taking place all the time. The financial support to the proect from the Swedish Energy Agency, STEM, NFK and Jernkontoret are great fully acknowledged. Mr Göran Andersson and Mrs Birgitta Lindblad at Jernkontoret are acknowledged for providing financial support to the proect and for supervision during my time working for TO51 and Jernkontoret. The colleagues and friends in the combustion lab at University of Maryland with who I drunk countless numbers of beers during the Friday nights at the Cornerstone. All my friends at the department of materials science and engineering are acknowledged, for many great moments of fun. No one mentioned, hopefully no one forgotten. My friends outside the academia brought a lot of fun to me when science was not as exciting. Finally but mostly I would like to express my sincere gratitude to my love and my best friend, my wife Helene who has always been on my side supporting me through happy moments and trough though periods. ix
10 x
11 Papers included in the thesis xi
12 xii
13 Paper 1: Paper 2: Paper 3: Paper 4: Paper 5: Combustion of Low Calorific Fuels in High Temperature Oxygen Deficient Environment Mortberg M., Blasiak W. and Gupta A.K. Published in J. Industrial Heating, November 2004 (In Japanese) ISRN KTH/MSE 05/27 SE+ENERGY/AVH Experimental Investigation of Flow Phenomena of a Single Fuel Jet in Cross- Flow during Highly Preheated Air Combustion Conditions Mortberg M., Blasiak W., Kitagawa K. and Gupta A.K. Submitted to ASME J. Eng. for Gas Turbines and Power for publication December 2004 ISRN KTH/MSE 05/28 SE+ENERGY/AVH Combustion of Low Calorific Fuels in High Temperature Oxygen Deficient Environment Mortberg M., Blasiak W. and Gupta A.K. Accepted for publication, Combustion Science and Technology, March 2005 ISRN KTH/MSE 05/29 SE+ENERGY/AVH Lateral Fuel Jet Inection into High Temperature Oxygen Deficient Conditions Mortberg M., Gupta A.K. and Blasiak W. Presented at Joint International Conference on Sustainable Energy and environment (SEE) December 1-3, 2004, Hua-Hin, Thailand. ISRN KTH/MSE 05/30 SE+ENERGY/AVH Measurements of temperature, heat flux and flue gas composition in HTAC flame Mortberg M., Rafidi N., and Blasiak W. Presented at IOM, challenges in reheating furnaces conference, October, 2002, London, United Kingdom. ISRN KTH/MSE 05/31 SE+ENERGY/AVH xiii
14 xiv
15 Papers not included in the thesis xv
16 xvi
17 Mörtberg, M., Blasiak, W. and Gupta, A.K., Flameless combustion of methane fuel et in transverse air flow, Proceedings of the 3 rd International Energy Conservation Engineering Conference (ICECE), San Francisco, CA, USA, Mörtberg, M., Blasiak, W. and Gupta, A.K., Effect of fuel property on flame characteristics under high temperature air combustion conditions, Proceedings of the 24 th International Conference on Incineration and Thermal Treatment Technologies (IT3), Galveston, TX, USA, Blasiak W., Mörtberg M., Rafidi N., Krishnamurthy N., Yang W., Kalisz S., Szewczyk D., Study and application of high temperature air combustion for gas fuels and wastes, J. Industrial Heating, (in Japanese), Vol 41, No 5, Blasiak W., Szewczyk D., Mortberg M., Rafidi N., Yang W., Combustion tests in a test furnace equipped with high temperature air combustion mode, J. Industrial Heating (in Japanese), Vol. 41 No. 2, Yang W., Mortberg M. and Blasiak W., Influences of flame configurations on flame properties and NO emissions in combustion with high-temperature air, Scandinavian Journal of Metallurgy, vol 33, Mortberg, M., Blasiak, W. and Gupta A. K. Combustion of Low Calorific Fuels in High Temperature Oxygen Deficient Environment, Proceedings of the 23 rd International Conference on Incineration and Thermal Treatment Technologies, Phoenix, AZ, U.S.A., Blasiak W., Mörtberg M., Rafidi N., Krishnamurthy N., Yang W., Kalisz S., Szewczyk D., Study and application of High Temperature Air Combustion for gas fuels and wastes, Proceedings of 14th IFRF Members Conference, May, NH Leeuwenhorst Conference Centre, Noordwikerhout, The Netherlands, Blasiak W., Szewczyk D., Rafidi N., Mörtberg M., Experimental study of High Temperature Air Combustion (HiTAC) in test furnace equipped with radiant tube High-cycle Regenerative System, Topic Oriented Technical Meetings TOTeM 26, Imuiden Netherlands, xvii
18 Mörtberg M., Blasiak W. and Gupta A. K., Experimental Investigation of Physical Properties of a Single Fuel Jet in Cross-Flow During Highly Preheated Air Combustion Conditions, Topic Oriented Technical Meetings TOTeM 25, Stockholm, Sweden, Szewczyk D., Mörtberg M., Rafidi E. N., Dobski T., and Blasiak W., Measurements of temperature and heat flux in HiTAC flame for unsteady state condition, 5th International Symposium on High Temperature Air Combustion and Gasification, Yokohama, Japan, Lille S., Blasiak W., Mörtberg M., Dobski T., Yang W., Heat flux evaluation in a test furnace equipped with high temperature air combustion (HTAC) technology, Proceedings of IJPGC.02, 2002 International Joint Power Generation Conference, Phoenix, AZ, USA, xviii
19 1. INTRODUCTION 1 2. STATE OF THE ART Obectives of Work EXPERIMENTAL STUDY Single et flame experimental facility Semi industrial experimental facility MEASUREMENT & ANALYSIS Particle Image Velocimetry Light Emission Spectroscopy Direct Flame Photographs Suction pyrometer and heat flux probe EXPERIMENTAL CONDITIONS Single fuel et experiments Semi-industrial experiments THEORETICAL ANALYSIS Fuel et traectory Jet entrainment Combustion noise Jet size and shape Flame temperature RESULTS AND DISCUSSION Jet flame traectory and et width Jet flame entrainment Combustion noise Jet flame size and appearance Distribution of combustion radicals Jet flame aerodynamics Superimposition of experimental data Flame temperature Semi-industrial HiTAC et flame study CONCLUSIONS REFERENCES 87 xix
20 xx
21 1 1. INTRODUCTION
22 2
23 The combustion of fossil fuels provides the vast maority of the world's energy requirements, and is thus also a maor source of air-pollutant emissions and greenhouse gases. In 1992 a first initiative was taken by the United Nations to preserve the global environment. This initiative led to the Kyoto Protocol in 1997 which stipulated that developed countries should reduce their total emission of greenhouse gases by at least 5% of 1990 emission levels by the year The increased concern regarding environmentally harmful pollutants has led to greater emphasis on the development of combustion systems marked by low emission of undesirable pollutants and high energy efficiency. For industrial furnaces, fuel consumption represents a maor operational cost and results in large amounts of greenhouse gases being emitted into the atmosphere. Industrial furnaces consume a significant amount of the total energy consumption of fossil fuels and are at the same time characterized by much lower efficiency than, for example, boilers. As a consequence of fossil fuel consumption, the industrial furnace also emits large amounts of CO 2, which is one of the important greenhouse gases. Clearly there is an urgent need to reduce furnace fuel consumption, and with that, CO 2 emissions, if we are to reduce costs for CO 2 -trading systems and the environmental impact of the emissions. Several different combustion technologies have been developed to meet new and more stringent demands on energy consumption, environmental impact and production expenditure. These technologies have been developed by the initiatives of different groups. The underlying concept of all of the technologies is separate inection of the oxidizer and fuel at very high inection velocities which results in a substantial entrainment of reaction products back to the reaction zone, thus leading to a reduced oxygen concentration in the reaction zone and consequently a reduced reaction rate. These novel combustion technologies use combustion with the flame not attached to the burner face, which is opposed to traditional techniques. Moreover, the reaction volume and distribution are controlled by the inection velocity, which is an important factor since it has been proved that it is possible to use pure oxygen as an oxidizer due to the strong entrainment of combustion products back to the reaction zone which renders a very low local oxygen concentration within the reaction volume. One of the most distinctive features of these new technologies is combustion with a high oxidizer temperature and low oxygen concentration inside the reaction volume. Combustion at the low oxygen concentration forms flames which have different properties compared to conventional air-combustion flames. In practical applications such combustion phenomena are achieved by separated inection of combustion air and fuel into the reaction volume. The regenerative burners, partly studied in this work, inect the combustion air and fuel into the 3
24 combustion region at very high velocities, causing strong entrainment and thus lowering the oxygen concentration in the combustion region. This has been denoted oxygen-deficient combustion as it is characterized by a lower excess oxygen ratio. This yields a uniform and a relatively low flame temperature in the combustion region. Utilization of these new combustion technologies offers several environmental and economical benefits/advantages compared to traditional combustion technologies [1]: - reduced fuel consumption and consequently reduced CO 2 emissions - reduced NO X emissions at very low CO levels - reduced combustion noise - enhanced temperature uniformity - enhanced heat transfer - increased production rates or downsizing of production equipment as a consequence of the above-mentioned benefits These benefits offer significant economic and environmental incentives when retrofitting or rebuilding industrial heating facilities, which also has resulted in a large number of the systems being implemented in facilities throughout the world. Energy savings in the area of about 30% coupled with CO 2 -emission reductions have been reported by many industrial organizations that have implemented these new types of combustion systems [2]. These technologies have been adopted mainly in heating furnaces, heat-treatment furnaces, melting furnaces and ladle heaters. With further development, they can also be applied to steam reformers, chemical process heaters, gas turbines, waste incinerators and boilers. 4
25 3. EXPERIMENTAL STUDY 13
26 14
27 In order to obtain information on the phenomena arising from a combusting fuel et when preheating the oxidizer to high temperatures and reducing its oxygen content, two types of experimental apparatuses were employed equipped with various measurement and analysis instruments. The single fuel et was inected into a crossflow of oxidizer composed of air diluted with nitrogen. The oxidizer preheat temperature and oxygen concentration was varied. Several nonintrusive experimental techniques were employed to investigate the phenomena arising under the conditions of high-temperature and low oxygen concentration. Non-intrusive techniques are preferred in experimental investigations because no disturbance is introduced into the investigated system. The oxidizer used in the single-fuel-et experiments was regular air diluted with nitrogen in order to obtain the correct oxygen concentration for the experiments. The aim of the work was to complete experimental investigations of a transverse fuel et under different combustion stoichiometry, oxidizer temperatures and fuel calorific values in order to obtain information on the phenomena which arise when oxidizer temperature and oxygen concentration change. The experimental set-up for the single et flame allowed for well-controlled conditions and convenient optical access to the studied fuel et. Furthermore, semi-industrial-scale et-flame experiments were performed where temperature distribution and heat flux was studied. The purpose of the semi-industrial study was to determine if the found benefits of the et-flame in a high-temperature and oxygen-deficient environment also applied on a larger scale, and if the phenomena were similar to what was seen with the smallscale experiments. In studying the most important aspects of the occurring phenomena, a simple analytical approach was taken in order to obtain more widely applicable results from the empirical investigation Single et flame experimental facility The single-flame experimental apparatus was constructed to permit investigation of the interaction between the fuel et and the high-temperature and low-oxygen-concentration crossflow under steady-state conditions throughout the experiment. This permitted determining the structure and distribution of flames under high-temperature and low-oxygen conditions. The single flame experimental apparatus, shown with a photograph in Figure 1 and schematically in Figure 2, is a high-temperature air combustion test apparatus. It consists of two burners, with 15

28 firing alternating between two different furnace sections (A and B). The furnace sections are equipped with ceramic honeycomb regenerators for thermal storage of the thermal energy before the exhaust gases are released to the environment. Before discharge to the atmosphere, almost all of the thermal energy of the exhaust gas is extracted and used to preheat the oxidizer. The apparatus generates a continuous mass flow of a highly preheated oxidizer (up to 1400 K) in the test section by passing the oxidizer through ceramic honeycomb regenerators where heat is exchanged to the oxidizer. The composition of the oxidizer, especially the oxygen concentration, is controlled by the addition of nitrogen to the oxidizer. By adding different amounts of nitrogen, any oxygen concentration could be maintained in the test section. The air at ambient temperature is preheated during its passage through the thermal-storage honeycomb bed. The ceramic honeycombs are heated by alternate firing of the burners in the A and B furnace sections. The inlet flow was conditioned by a honeycomb element placed immediately below the test section of the apparatus to ensure a laminar flow was entering the test section. Every 20 seconds the flow direction was automatically switched, but during the switching sequence no tests were run, and consequently the experiments were performed in steady state. Throughout the experiment there was a temperature drop of 2 K per second in the experimental section. The flow rates of the oxidizer and fuel were monitored via a flow control panel throughout the experiments. At the panel the oxidizer and the fuel flow through a plug valve into a glass tubular flow meter. The pressure in the flow meter was measured by a pressure gauge. From the panel the flows were directed in to the single et experimental apparatus. Calibration data for all of the gauges is provided by the manufacturer. Figure 1. Photograph of the single et experimental facility 16
29 Test fuel Gas analyzer Test section Heat up fuel TC Fluidized bed TC TC Dilutant (N 2 ) TC TC Pressurized gas Combustion air 4-way switching valve Flue gases Figure 2. Schematic layout of the High Temperature Air Combustion facility Prior to running an experiment, the air was preheated to a specific temperature. The heating process is illustrated in Figure 3. In cycle A when burner A is firing, the fuel valve for burner A is opened and fuel is supplied to the burner. At the same time, combustion air flows in through the 4-way switching valve and regenerator B where the combustion air is heated from the heat stored in regenerator B. The combustion in chamber A creates hot furnace gases that flow directly through regenerator A, which stores the heat, and the gases are then released to the ambient air at lower temperatures. After 20 seconds the system is switched to cycle B. Now burner B is firing and the combustion air flows in through regenerator A. While the air passes through regenerator A, heat is exchanged. Now regenerator A releases heat to the air. Upon exiting regenerator A, the air can have reached temperatures up to 50K below the flame temperature of the fuel gas. The furnace gases flow directly to chamber B and through regenerator B, where heat is exchanged once more. Now the regenerator again stores the heat from the gases and they are released to the ambient air at lower temperatures. 17
30 By repeating this process it is possible to preheat the incoming air to very high temperatures. A fraction of the combustion air flowing through the burner system bypasses and flows through the test section. The dimensions of the test section were 200 x 260 mm (in the X and Y directions, respectively). The dimensions of the flow inlet were 95 x 58 mm (in the X and Z directions, respectively). The test section was equipped with quartz glass windows of 4 mm thickness to allow for optical observation of the flame on three sides. Alumina-oxide insulation was used to minimize heat loss. The oxygen concentration and gas temperature were determined shortly before the flow entered the test section. The flow rate of the oxidizer and the fuel was also monitored. To form a et-in-crossflow arrangement, the fuel et to be examined was introduced into the test section normal to the preheated oxidizer via a nozzle 1 mm in diameter. The fuel et pressure was maintained at 40 kpa throughout the experiment. The different fuel ets used were methane, propane and a simulated low-calorific-value fuel (methane 10 % diluted with nitrogen). The fuel et was at room temperature while the combustion air in the crossflow was either 298 K, 1173 K or 1373 K. Cycle A Cycle B Figure 3. Illustration of test facility cycle 3.2. Semi industrial experimental facility Investigation of a single HiTAC et flame in semi-industrial conditions was carried out. The semiindustrial test apparatus was equipped with a high-cycle regenerative system (HRS). The burner system was equipped with honeycomb regenerators. The burner was able to operate in both 18


31 conventional flame mode and in HiTAC mode, so comparisons could be made between the conventional et flame and the flame in HiTAC mode. The inner dimensions of the furnace body were 3.5x2.2x2.2 m. The test facility was built for a maximum firing rate of 500 kw. The furnace body was insulated with a 0.3 m thick layer of ceramic fiber material. The inner volume of the combustion chamber was 6.7 m 3. There were also a number of openings in the furnace body for observation and obtaining measurements from inside the combustion chamber. The top view of the test equipment with observation and test openings and the experimental burner can be seen in Figure 4. The heat was removed from the furnace with four horizontal cooling tubes made of a special temperature-resistant kanthal alloy. The tubes were air cooled and enabled a large amount of heat to be removed. The test furnace was also equipped with two different flue gas channels: one with a water-cooled heat exchanger for hot flue gases and one for cold flue gases from the heat regenerators. The flue gas channel for hot gases allowed the furnace to be run in conventional mode and was also used when the furnace was operated in one-burner mode, when 20% of the flue gases had to be extracted through the hot flue gas channel. The burner system was a so-called one-flame system, which provided a single HiTAC flame in the combustion chamber. The switching time of the burner was constant and set to 10 seconds. The firing capacity of the one-burner system was 200 kw. The burner system was fired with LPG as fuel. Figure 4. Top view of semi industrial test furnace with traversing system and burner system 19
32 20
33 4. MEASUREMENT & ANALYSIS 21
34 22
35 In order to attain well-controlled conditions during the experiments, all decisive parameters were monitored. The oxidizer temperature was recorded before and after the thermal storage honeycombs throughout the experimental apparatus and directly below the test section. The final measurement of the oxidizer temperature was carried out directly before the preheated oxidizer entered the test section. In the same cross-section of the apparatus, before the flow entered the test section, the composition of the oxidizer was also determined with a Horiba PG-250 gas analyzer. The gas analyzer was a portable stack gas analyzer that can simultaneously measure up to five separate gas components. Composition data was obtained on the concentration of oxygen, carbon oxide, carbon dioxide and nitrous oxides. This facilitated adustment of the flow rates of the oxidizer and nitrogen diluent in order to achieve the desired temperature, flow rate and oxygen concentration of the oxidizer. The mass flow rates of the combustion air, the preheat fuel and the test fuel were monitored with flow meters located before the flow entered the experimental apparatus in order to achieve stable and reproducible conditions for the experiments conducted. Thermocouples were placed on both sides of the regenerators to allow monitoring of oxidizer temperature in the test apparatus. After obtaining stable experimental conditions, several different experimental techniques were employed to investigate the high-temperature air combustion phenomena briefly described below. Measurement and analysis details are presented in appendix A Particle Image Velocimetry Particle Image Velocimetry (PIV) is one of the most important achievements in experimental fluid dynamics as it allows non-intrusive flow analysis. Particle Image Velocimetry (PIV) is a technique providing an instantaneous flow field image in a cross section of a flow. The basic principle of PIV is simple. The fluid motion is traced by the addition of micron-size particles to the flow which is then illuminated by a laser light sheet with two instantaneous pulses. The displacement of the particles is calculated and the velocity field determined. Compared to other techniques for flow-field determination such as pitot tubes, hot wire anemometry, or LDV, PIV offers the benefits outlined below. 23
36 Non-intrusive velocity measurement. No probe is present in the flow, thus the flow remains undisturbed. PIV also enables indirect determination of fluid motion since the velocity of the tracer particles is measured. PIV is a whole-field technique which allows for simultaneous determination of the velocities at a large number of points, while other techniques only permit measurement at a single point. Statistical determination of the velocity at each point as several hundreds of images are collected and gives a statistical correlation of the velocity distribution. These advantages mean more reliable data in comparison to velocity data obtained by intrusive methods Light Emission Spectroscopy Light emission spectroscopy was used to analyze the spontaneous emission of intermediate species generated in the flame from the combustion. With light emission spectroscopy it was possible to determine the spatial distribution of different flame radicals, such as OH, CH and C 2. This was used to provide information on the distribution in the reaction zone and heat release within the flame. The investigated area was * mm (X * Y) for the high-temperature oxygen-deficient conditions (at 1173 K and 1373 K) and * 78.0 mm (X * Y) for the normal-temperature (298 K) combustion air conditions Direct Flame Photographs Direct flame photographs were captured with a digital camera to obtain time-averaged flame characteristics such as flame color, size, and volume. The digital camera was equipped with a CMOS sensor with an active pixel array of 3072 x 2048 pixels. Several different exposure times were used during the experiments in order to obtain flame images of suitable quality. The exposure time under the direct flame photograph experiments was 8 seconds for the LCV fuel et under high-temperature conditions and 1/8 second for the methane and propane fuel ets. The different exposure times were chosen with respect to the different luminosity of the different flames under the changed conditions. The time-averaged photographs provide an estimation of the flame structure over time, although the photographs give no information about the dynamic features of the flame which is why PIV was used in this study Suction pyrometer and heat flux probe Water-cooled measurement probes were inserted at various points inside the furnace through 13 openings in the furnace roof as shown in Error! Reference source not found.. Each probe was mounted at the top of the furnace and moved by a computer-controlled traversing system. For measurement of the flue-gas temperature, a suction pyrometer was used. The suction pyrometer was made of regular stainless steel with a ceramic tip shielding from thermal radiation. Inside the shield, a regular thermocouple of type S was mounted. The thermocouple was placed 150 mm from the tip of the ceramic shield. The flue gases were sucked through the ceramic shield at a velocity of 140 m / s. The high velocity coupled with the radiation shields surrounding 24
37 the thermocouple ensure convective heat transfer from the hot furnace gas to the thermocouple tip and results in highly accurate temperature measurement. [62] The total heat flux was recorded with a water-cooled probe with a steel plug in its tip. The temperature gradient was measured between the surface of the steel plug and the water-cooled surface and the total heat flux was calculated [63]. 25
38 26
39 5. EXPERIMENTAL CONDITIONS 27
40 28
41 5.1. Single fuel et experiments The experiments were carried out under several different conditions in order to investigate the combustion phenomena arising under high-temperature and low-oxygen conditions. Investigations were conducted in order to investigate the influence of the: oxidizer preheat temperature [varying from 298 K to 1373 K] oxidizer oxygen concentration [varying from 21 % O 2 to 2 % O 2 ] fuel-et calorific value [varying from 1023 to kcal/m 3 ] The experiments were performed at ambient temperature, 298 K, under either reacting or nonreacting conditions, which allowed for basic investigation of the influence of the combustion process on a normal fuel et. The elevated temperature levels used in the experiments were 1173 and 1373 K with reacting fuel ets. These temperatures facilitated investigation of combustion phenomena under high-temperature and low-oxygen-concentration conditions. The influence of the oxidizer oxygen concentration was also considered for the elevated temperatures. The oxygen concentration was controlled by mixing a diluent with the combustion air. The diluent utilized throughout the experiments was nitrogen. The investigated cases used oxidizer oxygen concentrations of 21 %, 15 %, 10 %, 5 % and 2 %. Several different gaseous fuels were investigated. These were propane (commercial grade >99 %), methane (commercial grade >99 %) and a low calorific value fuel, which consisted of 11.9% methane diluted with nitrogen, used in order to simulate the calorific value of a low-grade fuel gas from pyrolysis processes of waste, biolfuels etc. A compilation of the different experimental cases can be seen in Table 1. The momentum flux ratio between the gas et and crossflow was maintained constant when examining different gaseous fuel ets and crossflows, thus providing similarity in mixing for different test conditions. When the momentum flux ratio is maintained constant throughout the experiment, the mixing and flow patterns between the et fluid and crossflow fluid should be the same. Differences in velocity, turbulence and other measured quantities can then be related to the phenomena originating from the combustion process itself and the variation in parameters in the different experiments. 29
42 The momentum flux ratio, r, was calculated by: r = ρ U ρ V 2 2 Equation 1 where, U and V represent the inlet fuel-et velocity and crossflow velocity, respectively, and ρ and ρ the density of the gas et and the crossflow, respectively. In addition, the velocity ratio between the gas et and crossflow is also important. The velocity ratio,λ, sometimes also denoted the Patrick number (which is the inverse of momentum flux ratio number), was calculated as: 2 2 ρ V λ = Equation 2 ρ 2 U The equivalence ratio is calculated by dividing the stoichiometric oxygen concentration of the combustion air by its actual oxygen concentration: Equivalence ratio O % O % 2 stoichiometric = Equation 3 2 actual To calculate the stoichiometric oxygen concentration, the reaction between propane and oxygen is used. 30
43 Table 1. Experimental cases Oxidizer temperature [K] Fuel et case Equivalance ratio et Flowrate [l/h] Jet Velocity U 0 [m/s] Oxidier flowrate [m 3 /s] oxygen concentration [%] Cross flow Velocity V 0 [m/s] Momentum flux ratio Patrick number λ C 3 H 8 non-reacting - 42,0 14,9 16,0 21,0 0,92 19,7 0, C 3 H 8 reacting 0,079 42,0 14,9 16,0 21,0 0,92 19,7 0, C 3 H 8 reacting 0,079 25,0 8,8 16,0 21,0 0,92 19,8 0, C 3 H 8 reacting 0,11 25,0 8,8 16,0 15,1 0,92 19,8 0, C 3 H 8 reacting 0,21 25,0 8,8 16,0 9,8 0,92 19,8 0, C 3 H 8 reacting 0,33 25,0 8,8 16,0 5,0 0,92 19,8 0, C 3 H 8 reacting 0,83 25,0 8,8 16,0 2,0 0,92 19,8 0, C 3 H 8 reacting 0,079 20,0 7,1 16,0 21,0 0,92 20,2 0, C 3 H 8 reacting 0,11 20,0 7,1 16,0 15,1 0,92 20,2 0, C 3 H 8 reacting 0,21 20,0 7,1 16,0 9,8 0,92 20,2 0, C 3 H 8 reacting 0,33 20,0 7,1 16,0 5,0 0,92 20,2 0, C 3 H 8 reacting 0,83 20,0 7,1 16,0 2,0 0,92 20,2 0, CH 4 non-reacting - 70,0 24,8 16,0 21,0 0,92 20,1 0, CH 4 reacting 0,03 70,0 24,8 16,0 21,0 0,92 20,1 0, CH 4 reacting 0,03 42,0 14,9 16,0 21,0 0,92 20,4 0, CH 4 reacting 0,04 42,0 14,9 16,0 15,1 0,92 20,4 0, CH 4 reacting 0,07 42,0 14,9 16,0 9,8 0,92 20,4 0, CH 4 reacting 0,13 42,0 14,9 16,0 5,0 0,92 20,4 0, CH 4 reacting 0,3 42,0 14,9 16,0 2,0 0,92 20,4 0, CH 4 reacting 0,03 33,0 11,7 16,0 21,0 0,92 20,4 0, CH 4 reacting 0,04 33,0 11,7 16,0 15,1 0,92 20,4 0, CH 4 reacting 0,07 33,0 11,7 16,0 9,8 0,92 20,4 0, CH 4 reacting 0,13 33,0 11,7 16,0 5,0 0,92 20,4 0, CH 4 reacting 0,3 33,0 11,7 16,0 2,0 0,92 20,4 0, LCV non-reacting 58,0 20,5 16,6 8,1 1,00 22,4 0, LCV reacting 32,5 11,5 16,0 8,1 0,92 22,0 0,
44 5.2. Semi-industrial experiments All semi-industrial-scale measurements were performed under two different furnace operational conditions. The two compared cases were conventional combustion and High-Temperature Air Combustion. A one-flame regenerative burner system was used. When the furnace was operated in one-flame regenerative burner mode, 20 % of the flue gas had to be extracted through the hot-flue-gas channel. In the conventional mode, 100 % of the flue gas exited through this channel. The furnace temperature during the experiments was 1273 K. Table 2 Configuration of semi industrial test stand Fuel flow rate (Nm 3 /h) Fuel type Combustion air flow rate (Nm 3 /h) Furnace Temperature (K) Combustion air temp (K) Conventional 7.7 LPG One-flame HTAC 7.7 LPG
45 6. THEORETICAL ANALYSIS 33
46 34
47 The changed properties of the flame under high-temperature and low-oxygen-concentration combustion conditions indicate that oxidizer temperature, oxygen concentration and fuel type have a significant impact on the fluid dynamics, which affects the fuel and oxidizer mixing. In order to enhance our fundamental understanding of the phenomena, theoretical assessments had to be done. This enabled prediction of experimental results. Some of the most important parameters evaluated are covered below. The theoretical considerations also explain some of the behavior of high-temperature low-oxygen combustion phenomena Fuel et traectory The transverse et has been extensively investigated over the years, due to the well-documented positive effects on et mixing when the et is inected into a transverse air stream. Pratte and Baines [56] reported that ets inected into transverse air streams easily could be normalized with the length scale rd and the traectory for ets with different momentum flux ratios could be described with the following equation: y rd = A x rd B Equation 4 In this equation x is the radial distance from the et nozzle in the et exit direction, and y is the axial distance in the crossflow direction from the fuel-et nozzle and d is the fuel-et diameter. A and B are experimental constants. Several different values for A and B have been reported, generally ranging between for A and for B [57]. In this study, A was found to be 2.1 and B to be The constants are affected by several different factors such as fuel-et and crossflow properties and turbulence. 35
48 6.2. Jet entrainment The noticeable change in the flame appearance, reported by several other researchers, indicates a slower mixing of the reactants and a reduced reaction rate. With this it is obvious that entrainment of the crossflow fluid into the fuel et is of significant importance. Hasselbrink and Mungal [58] derived a correlation of the mass entrained by a transverse et by using the centerline traectory information. Their work was based upon calculation of the momentum of the crossflow required to bend the fuel et inected laterally into the crossflow. The time-averaged conservation principles for the mass and the momentum in the x and y directions are: & + m& = m& Equation 5 m m & u mu & = x Equation 6 m & u = m& u y Equation 7 In using momentum equations, the pressure term is to be neglected when the momentum flux ratio is much greater than one. In this work s experimental cases the momentum flux ratio was twenty. Furthermore, the effect of buoyancy was neglected in the calculation of the momentum flux ratio term, which means that the equation is only valid for large Froude numbers. In these experimental cases the Froude number is much larger than one. At a large distance from the et nozzle, where y>rd one can assume that the et width is proportional to its height from the et exit level, δ = c 1 y, the mass flux can then be expressed by: m& = ρ π u c y 2 Equation 8 By combining the equations, the mass flux problem can be described with: m& m& u u m& m& ρ ρ 2 d 2 c y 1 2 m& m & 2 u = u Equation 9 When the traectory equation is coupled with the mass flux equation it can be written: dy dx = AB x rd B 1 = AB y rda B 1 B u = u y x Equation 10 36
49 which is the ratio of the velocity components. According to Hasselbrink and Mungal [58], the mass flux, thus the mass entrainment, can be written as: m& m& = m& + m& m& e = 1 + r AB ρ ρ x rd 1 B Equation 11 m& is the initial fuel-et mass-flow rate and where crossflow stream. m& e the mass-flow rate entrained from the 6.3. Combustion noise The issue of combustion noise has become of greater importance over the years. The reduced turbulence in the high-temperature flames suggests reduced levels of combustion-generated noise. The noise is associated with pressure pulses generated by fluctuation and movement of the flame front. According to a study by Gaydon and Wolfhard [59], the intensity, I, of sound is expressed as a function of the pressure variation ΔP: I 2 ΔP = Equation 12 ρc where, ρ is the density and c the sound velocity. The pressure difference is generated from expansion of the gas due to heat release from the combustion process. For theoretical consideration of the issue, a simplified approach was chosen and the sound intensity was calculated at distance d from a single point in the flow field. The pressure pulsation originating from the combustion process was then calculated as: ΔP = ρ 4πd d dt dv dt Equation 13 where dv/dt is the rate of change of the volume in the considered volume element. The rate of change of the volume is proportional to the combustion intensity. Assuming spherical expansion, the rate of change of the source volume is defined by: dv dr E V = r 1 2 4π Equation 14 dt dt EV where E V is the volumetric expansion ratio of the combusted gas compared to the volume of the non-combusted reactants. The pressure fluctuation can be calculated by: 37
50 Δ P = ρ = ρ 4π d ( E 1) V de V dr 4π r dt dr 2 r dt 2 2 dr dt + E V 1 E V r 2 d dt 2 r 2 = Equation 15 During steady burning, the flame travels at a uniform speed dr dt = S u EV, were S u is the burning velocity. For a steady-state combustion process, the burning velocity becomes more or 2 2 less constant and the second derivative, d r dt = 0, describing fluctuation of the radius of the expanding volume element approaches and becomes zero. Building on these assumptions, Equation 11 becomes: Δ P = 2 ρ E d V 2 ( E 1) rs V u Equation 16 To estimate the pressure fluctuation, the burning velocity has to be estimated. Chomiak [60] presented a study of the burning velocity. Analysis of the burning velocity was based on the magnitude of the thickness of the combustion region δ l and the characteristic time τ of the reaction. δ l is estimated by dimensional analysis by: δ l = a τ Equation 17 where a is the thermal diffusivity of the mixture, calculated by: a = λ C ρ p Equation 18 where, λ is the thermal conductivity, Cp the specific heat and ρ the density. The characteristic time for a reaction is related to the reaction rate w, i.e., τ = ρ w Equation 19 The reaction rate, w, is based on the changes in concentration of the different species in the combustion reaction by: 38
51 w C C H C O k C C x y 2 = = = CxH y O Equation 20 2 dt dt where C C x H y and C O 2 denote the concentration of propane and oxygen, respectively, and k is the reaction rate constant. The reaction rate constant is calculated using the Arrhenius formula: E k = A a a exp Equation 21 RT where A a is a constant, E a is the activation energy, R the universal gas constant and T the temperature. In evaluating the reaction-rate calculation, the results show the reaction rate to increase significantly with an increase in temperature T. A reduced oxygen concentration reduces the reaction rate. With the calculated information, the burning velocity S u can be calculated assuming that during a short time τ, the combustion will propagate the distance δ l, i.e., S u ~ δ l 1 = τ ρ λ C p w Equation 22 Now the pressure fluctuation and the theoretical sound intensity can be determined. Regarding the burning velocity, it can be seen to be dependent on the combustion air temperature and oxygen concentration. The formulas indicate an increase in burning velocity with an increase in temperature at a maintained oxygen concentration and a decrease in burning velocity with a decrease in oxygen concentration in the oxidizer. Similar results were reported by Gaydon and Wolfhard [59] Jet size and shape The empirical PIV and light emission spectroscopy data, as well as the flame photographs, reveal changed fluid-dynamics properties under the high-temperature and low-oxygen conditions. The et appears to be wider when compared to the normal-temperature cases. In an attempt to theoretically quantify the et width, some properties of the fluid dynamics of a et in crossflow had to be determined. 39
52 Figure 5. Scheme of et in cross flow. The et deflection results from the balance between the et momentum and the crossflow momentum. First it is assumed that the fuel-et momentum is much larger than one. The et centerline is defined as the maximum-velocity line along the et traectory. The et border is the point where the velocity in the et flow direction rises above the surrounding flow velocity. The force balance, for a separate mass element of the et can be expressed as: df df = 0 Equation 23 p + c A centrifugal force which occurs when a mass element, of area A, moves at the velocity U along a curve linear traectory of changing radius R, with the angle α. The centrifugal force is written as: df c 2 U = α A ds Equation 24 R where U = 1 U ds da A Equation 25 A s 40
53 The other force in the force balance, df p, may be expressed as proportional to the dynamic pressure, with C as the drag coefficient, ρ c, the crossflow density, U c the crossflow velocity and b the width of the et, which can be determined by means of the velocity component normal to the et axis. df P CU C = C ρ 2 sin 2 α 2 b ds Equation 26 Incorporating Equations (24), (25) and (26) into (23) renders: C ρ U C 2 2 C sin 2 α b ρ U + R 2 A = 0 Equation 27 Considering the momentum conservation principles, it is reasonable to assume that the et momentum is constant along the y-axis. 41
54 Figure 6. Scheme of et traectory ρ A U U sin α = ρ A U U sin α Equation To comply with the above condition, and incorporating the following dimensionless relationships, ρ ρ U 0 C 2 C 2 0 ( U ) R = 0 ; = R ; d b d = B Equation 29 the equation is transformed into the following: 2C 3 γrb sin α + 1 = 0 0 π sinα Equation 30 42
55 This uses the fact that: dy dx = tanα = y' Equation 31 Some more relationships are introduced 2 ( 1+ y ) 2 3 y R = sinα = Equation 32 y 2 1+ y The incorporation of these into the equation results in a differential equation to be solved: 2C y = γ y 0 π sinα 3 B Equation 33 or, when solving assuming y =t 2C t = γ t 0 π sinα 3 B Equation 34 In order to solve the differential equation it is necessary to define the relationship between the et width and the coordinates of the et axis. To be able to successfully solve the differential equation it should be transformed so it represents changes as a function k which should be inverse in its relation to t ( k = 1 t = tan 1 α k=1/t=tan -1 α ). Furthermore, the k function should not follow the x-y coordinates, but the et axis. Using the trigonometric relationships: dx dy k dk dk dx = cosα = ; = Equation k ds dx ds transforms the differential equation into dk ds 2C = γ π sinα 0 B 1+ k 2 Equation 36 43
56 1 0 With the boundary conditions s=0, k=k 0 = s = 0, k = k0 = tan α, it is the differential equation of the et axis. Changes in et width (b ) N are expressed by adopting an equation of a et flowing into a stationary medium. The equation was corrected for the influence of the crossflow by an empirical correlation. The equation is: B = 1 α 0 cot k αγ Equation 37 ( ) n b + 1 N S + S0 With the following parameters defined as follows: ( ) C( S ) C = tan β 2 b N + = 2 S 0 ; s S = ; d = S ; 0 0 S d 6.5. Flame temperature Estimation of the flame temperature in the experimental et is possible by measuring the C 2 vibrational intensity and using the relationship between the two peaks at 470 nm and 515 nm. The spectral intensity for the electronic transition, or the integrated intensity including all of the related rotational and vibrational transitions, changes depending on the flame temperature T and the number of combustion radicals N. The intensity can be expressed as [33, 34, 35]: E / kt I = hυ NgAexp Equation 38 Q( T ) where h is the Plank s constant, υ the frequency, N the number density, g the statistical weight of the excitation level, A the transition probability for spontaneous emission, E the upper-level energy, k the Boltzmann s constant, and Q(T) the partition function. Flame temperature was determined by taking the ratio of C2 emission intensities obtained at two wavelengths (470 and 515 nm). The profiles for the net emission intensities of C2 species were estimated by subtracting the background intensity level (at 490 nm) from the C2 emission intensity level (at 470 or 515 nm). The intensity ratio I 1 /I 2 of the two vibrational bands was taken from [35]. The instrument constant, p, was determined as an average value. The calibration was based on the temperatures measured at two spatial points in the flame by means of an Rh-Pt thermocouple. I I 1 2 p = i Ei / kt vi Ai exp Q( T) E / kt v A exp Q( T) Equation 39 44
57 Using equations (38) and (39) we can derive a simple expression for the intensity ratio I 1 /I 2 in terms of flame temperature T, i.e.: I I p = K exp( E 470 E 515 ) / kt Equation 40 1 C2 2 C 2 where K is the ratio of the term νga/q(t) (this ratio is almost constant at temperatures below 2500K). 45
58 46
59 7. RESULTS AND DISCUSSION 47
60 48
61 7.1. Jet flame traectory and et width Figure 7 shows information on the traectories. By using the data extracted from the velocity-field plots it can be seen that preheat temperature, oxygen concentration and fuel calorific value have a minor effect on the et traectory. This shows that there is an influence on the et traectory of parameters such as oxidizer temperature, oxygen concentration and the fuel et calorific value and that the traectory is affected by the momentum flux ratio between the fuel et and the crossflow. The traectory is expected to be the same as the momentum flux ratio, thus the force balance between the fuel et and the crossflow fluid is the same. The PIV data shows that with an ambient-temperature oxidizer, combustion of the gaseous fuel et causes the et to penetrate further into the crossflow. This was also reported by Hasselbrink and Mungal [36]. Furthermore, the high-temperature and low-oxygen-concentration conditions that were investigated showed similar tendencies with a stronger penetration of the fuel et into the crossflow when compared to ambient non-burning conditions. The figure shows that the fluid dynamics, thus the mixing, do not change significantly between the fuel et and the crossflow under high-temperature lowoxygen conditions when compared to cases of normal temperature and oxygen concentration. The results were as expected as the traectory of the fuel et is controlled by the momentum flux ratio according to Equation 2. The effect of oxidizer temperature, thus the oxidizer density, can be seen in Figure 8. The plot reveals that the et width increases when the oxidizer temperature is reduced, i.e. the oxidizer density is lowered. 49
62 Figure 7. Fuel et traectories at varying oxidizer preheat temperatures and oxygen concentration Figure 8. Jet width for different fuels and preheat temperatures 50
63 7.2. Jet flame entrainment The entrainment is illustrated in Figure 9, where the effect of oxidizer temperature and oxygen concentration on the entrainment can be seen. The data shows that within the first 40 nozzle diameters from the fuel et orifice, the entrainment is similar in all experimental cases. However, it can be clearly seen that when an oxidizer of 21 % oxygen is maintained and the preheat temperature is increased, the entrained mass is smaller. This clearly shows the effect of the reduced flame volume and reaction zone as the ignition is faster and the reaction more intense at high preheat temperatures with an oxygen concentration of 21 %. The reaction is also more intense under high oxidizer temperatures with 21% oxygen in the oxidizer. The intense combustion reaction causes strong thermal expansion of the reaction volume which hampers entrainment of the surrounding crossflow fluid. When the oxygen concentration is reduced and a high preheat temperature maintained, the mass entrainment is increased. This is due to the increased reaction volume that the high-temperature low-oxygen-concentration conditions render, which is created by the less intense reaction in the flame volume. The increased entrainment of the crossflow fluid is also necessary in order to complete the combustion reaction due to the low oxygen concentration. From the theoretical considerations it can be concluded that the temperature difference between the oxidizer and the fuel-et fluid has a significant influence on the entrainment as the density of the different fluids is affected by the temperature. A higher temperature difference renders stronger entrainment of the crossflow fluid into the fuel et. However, the theory does not explain why the entrainment again increases when the oxidizer oxygen concentration is reduced. It can be concluded from the results that the oxygen concentration has a stronger influence on the entrainment than the temperature does, and that the reduced amount of available oxygen hampers the combustion reaction which in turn leads to the stronger entrainment. 51
64 Figure 9. Entrainment of cross flow oxidizer into a propane fuel et 7.3. Combustion noise The relative sound pressure levels are illustrated in Figure 10. Here the effects of the hightemperature low-oxygen-concentration conditions can easily be seen. When the oxygen concentration is reduced and the preheat temperature is increased, the relative sound pressure level is significantly lowered. The reduced combustion noise is a result of the decreased turbulence in the flame under high-temperature oxygen-deficient conditions. The PIV data plotted in Figure 19 and Figure 20 show reduced turbulence levels under these conditions. The reduced turbulence levels are an effect of the laminarization of the flow that occurs when combustion is taking place. The laminarization is primarily an effect of the heat release from the combustion process. The data in Figure 10 presents the relative sound pressure levels for several different experimental cases. It can be seen that the oxygen concentration and oxidizer temperature have a strong hampering effect on the relative sound pressure levels. The high oxidizer preheat temperatures reduce the relative sound pressure levels by 50 % when the oxygen concentration is maintained at 21 %. Although the more intense combustion reaction which could be seen from the flame photographs in Figure 11 and Figure 12 and in the spatial data of in-flame generated radicals in Figure 13 and Figure 14, the laminarization of the flow has a strong effect on the relative sound pressure levels, which are significantly reduced. Moreover, when the oxygen concentration is reduced to 5 %, the relative sound pressure levels drop further. This is an effect of the lower combustion intensity as the reaction extends over a larger volume. When considering the burning velocity (Equation 22), it can be seen to be dependent on combustion air temperature and oxygen concentration, which explains why the relative sound pressure levels are reduced. The formulas indicate an increase in burning velocity with an increase 52
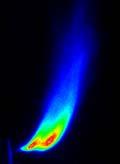
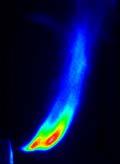
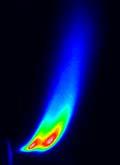
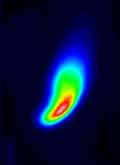
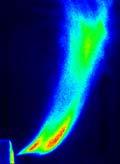
65 in temperature at a maintained oxygen concentration and a decrease in burning velocity with a decrease in the oxygen concentration of the oxidizer. Similar results were reported by Gaydon and Wolfhard [59]. 8 Relative sound pressure levels, SPL (db) a b c d e Experimental case Figure 10. Relative sound pressure levels (in db) from the et flames: (a) 21% oxygen concentration at 298K; (b) 21% oxygen concentration at 1173K; (c) 5% oxygen concentration at 1173K; (d) 21% oxygen concentration at 1373K; and (e) 5% oxygen concentration at 1373K 7.4. Jet flame size and appearance The direct flame photographs can be seen in Figure 11 and Figure 12. The photographs present the flame appearance under different conditions and for different fuel ets. They also illustrate the effect of oxidizer preheat temperature on flame size and color. The flame-color information is of interest when studying the combustion chemistry. Flame color has been reported to be significantly dependent on the combustion chemistry and the formation of radicals, which is much more prevalent under high-temperature low-oxygen conditions. When the oxidizer is preheated, the flame appears to be reduced and more intensive. The photographs indicate that when the preheat temperature is increased from 298 K to a high temperature, the flame shrinks and takes on a yellow-white bright appearance. When the oxygen concentration in the oxidizer is reduced, the flame size increases and the flame color turns to blue. At very low oxygen concentrations, the flame is invisible. The changed flame color shows that a different and less intense combustion reaction takes place under the high-temperature and low-oxygen-concentration conditions. Flame color has been reported to clearly correlate with the generation of radicals during the combustion process in the flame, which in the present case is much less intense. Flame color is highly dependent on the diluent in the oxidizer used to lower the oxygen concentration. Several researchers have reported a green flame under high- 53
66 temperature and low-oxygen conditions. The green flame color was not observed in the experiments conducted in this work. Nitrogen was used as the diluent in this investigation, which explains the blue flame color at low oxygen concentrations. Other researchers have used carbon dioxide or flue gas to lower the oxygen concentration, which affects the combustion chemistry slightly, thus the changed flame color. The images obtained with light emission spectroscopy can be seen in Figure 11, Figure 13 and Figure 14. Further results are also provided in Paper 1 and Paper 3. The intensity plots show the time-averaged spatial distribution of flame-generated radicals. The data presented gives information on the distribution and intensity of light emission from the combustion-generated species. The spatial intensity plots illustrate the relative intensity of the emitted light from the radicals, where red indicates the strongest intensity and black indicates a zero-emission intensity on the current wavelength. The spatial distribution of radicals gives information on time-averaged changes in the radicals light emission in the et flame as the air preheat temperature and oxygen content in the combustion air changes. The selected species included in the determined spatial distributions were OH, CH and C 2 which corresponds to wavelengths of 307 nm, 340 nm and 470 nm, respectively. The OH radical serves as the flame marker and provides an estimation of the flame borders. The CH radical indicates the intensity of the time-averaged heat release and the C 2 radical provides information on the intensity of the combustion process. Strong dependence on combustion air temperature and oxygen concentration of the radical species can be seen in the spatial distributions for the different experimental cases. When the oxygen concentration is reduced and the combustion-air preheat temperature is increased from 298 K to 1173 K and 1373 K, there is a dramatic change in the distribution of the different radicals. The data shows a significantly enlarged reaction zone under the high-temperature lowoxygen conditions. This can be explained by the low oxygen concentration of the oxidizer, which reduces the combustion rate. Due to the limited availability of oxygen molecules in the reaction volume, different flame radicals are generated as the combustion reaction can not be completed immediately. This explains the elevated levels of radicals that can be detected in the hightemperature and low-oxygen-concentration flames. The enlarged reaction volume is also one of the characteristic features of high-temperature and low-oxygen combustion. The ignition delay time is the time that elapses from when an element of the fuel-et fluid emerges from the fuel nozzle to the time the element is ignited. The ignition delay time in this work s experiments was estimated from the distance between the fuel et and the ignition point, which can be seen in the photos. Knowing the fuel-et velocity, the time for the fuel to be ignited can easily be estimated. With an increase in air preheat temperature, the ignition delay is reduced. This is due to the high temperature that the fuel et is heated to immediately after exiting the fuel nozzle. At high temperatures the fuel is ignited faster when less energy is needed from the combustion process itself to heat the fuel to a temperature above the auto-ignition temperature. Evidence of this are the elevated levels of OH closer to the nozzle along the traectory, which render a shorter flame stand-off distance at elevated temperatures. The flame stand-off distance has been determined as the distance between the fuel-et nozzle and the point where the flame is ignited and radicals were detected by light emission spectroscopy. The data clearly indicates a shorter ignition delay time at a higher air preheat temperature. At an oxygen concentration of 21 % in the combustion air, the difference between the different air preheat temperatures was small. At 5% oxygen, the ignition delay was found to be 3 μs at an air preheat temperature of 1173 K. The ignition delay time was found to be significantly greater for the LCV fuel et when compared to the methane and propane fuel ets. This can be explained by the lower calorific value of the LCV fuel et. Having a lower calorific value, the fuel has to be heated to a very high temperature due to the low heating value of the fuel and a high auto-ignition temperature. The LCV fuel et takes longer time to mix with the oxygen in order to be able to ignite and combust. However, the 54
67 LCV fuel et, once ignited, can be considered a well-stirred reactor because of the complete mixing of the reactants which is illustrated in the homogenous reaction zone in the intensity plots Distribution of combustion radicals When studying the C 2 distribution within the flame in Figure 13 and the reaction-zone distribution was found to change with the oxygen concentration and air preheat temperature of the combustion air. The reaction zone is defined as the region in the C 2 plots where the intensity from the emission is larger than for the background radiation at the current wavelength. The C 2 distribution serves as a reaction-zone marker where the combustion intensity is highest, i.e. where oxidation of the fuel takes place. The different plots of the C 2 distribution reveal a significantly larger, but less intense reaction zone in the case of high-temperature air combustion compared to the normal-temperature air case. The maximum reaction intensity location moves further downstream in the et traectory under conditions of high air temperature, revealing the ignition delay. Under high-temperature oxygen-deficient conditions, the reaction zone is significantly enlarged. The strongest intensity of the C 2 species clearly shows that combustion reaction is delayed, i.e. it is found at a position further downstream in the traectory. Furthermore, a more evenly distributed reaction zone can be distinguished as the C 2 distribution was found to be significantly larger at the 5 % and 2 % oxygen contents and at a 1373K air preheat temperature. This is opposite the C 2 distribution at 21 % for which a small and intense distribution can be observed. This was captured with a short exposure time and a long exposure time was used for hightemperature low-oxygen conditions. The wider and extended C 2 distribution is a characteristic of the high-temperature air combustion. The enlarged C 2 distribution indicates a larger reaction zone. This has been noted by several other researchers who have reported spatial distribution data on radicals or direct flame photographs which illustrated significantly enlarged reaction zones. This indicates a reduced reaction rate of the combustion process due to the lowered oxygen content in the oxidizer. This also complies with S u δ l 1 λ w Equation 22 τ ρ C p that indicates an increase in burning velocity with an increase in temperature at a maintained oxygen concentration, and a decrease in burning velocity with a decrease in oxidizer oxygen concentration. The reduced reaction rate is also what some researchers denote mild combustion. The intensity of the spatial emissions of CH and OH in Figure 13 and Figure 14, is higher in the ignition region of the fuel et as compared to the intensity further downstream the fuel-et traectory. An extended combustion zone can be seen downstream along the traectory for the cases with high-temperature preheat air. This also indicates that the reaction rate of the fuel et is reduced because the combustion is occurring over a larger region under high-temperature oxygen-deficient conditions. This is one of the main characteristics of high-temperature air combustion. 55
68 The CH-radical distribution indicates the intensity of the time-averaged heat release from the flame. In comparing the different cases, it can be seen that not only the reaction zone increases, but also the heat release. The novel combustion technology using a low oxygen concentration in a large reaction volume is well known for its even and high heat release. The effect of the evenly distributed heat release is a consequence of a reduced reaction rate which results in a larger reaction zone. Moreover, the even heat release has a positive effect on the entrainment, as a strong and sudden heat release has a hampering effect on the entrainment when the thermal expansion is substantial due to an intense combustion process. A secondary or extended reaction zone can be observed in Figure 13 and Figure 14 in the hightemperature low-oxygen environment. The enlarged reaction zone shows that two-stage burning is taking place when the oxygen concentration is reduced. An enlarged reaction zone can be seen when the oxygen concentration is reduced, and a reduced reaction zone when the oxidizer temperature is increased. The extending of the flame stems from the lower oxygen concentration which results in a reduced reaction rate. The extended flame can also be coupled with the higher axial strain rates in the high-temperature low-oxygen environment (detected in the PIV analyses). This can be observed in Figure 17 and Figure 18. The elevated axial strain rates indicate more entrainment of the crossflow fluid into the fuel et. The stronger entrainment is desirable in the high-temperature and low-oxygen-concentration cases as it facilitates providing the fuel with enough oxygen to complete the combustion process and counterbalances the lower oxygen concentration in the crossflow oxidizer. The propane fuel et in Figure 13 exhibits a stronger tendency towards two-stage burning, or a significantly enlarged reaction zone when compared to the methane fuel et in Figure 14, which can be seen in the C 2 distribution. This indicates slower oxidation of the larger propane molecules which take several steps to be broken down and to completely react. This is a characteristic of the high-temperature oxygen-deficient oxidizer and explains the enlarged flames and the more even heat flux distribution which is a characteristic feature of the high temperature and low oxygen concentration combustion. 56


69 C 3 H 8 CH 4 LCV 1173 K LCV 1273 K Flame photograph OH C 2 CH Figure 11. Flame photographs of C 3 H 8 and CH 4 at 298 K, 21 % O 2 and LCV fuel at 1173 K and 1273 K at 8 % O 2 and intensity plots of radicals generated in the flame 57


70 Combustion air diluted with N 2 CH 4 C 3 H 8 21% O 2 15% O 2 10% O 2 5% O 2 2% O K 1373K 1173K 1373K Figure 12. Flame fotographs under 1173 and 1373 K oxidizer preheat temperature and 21-2 % oxygen concentration 58


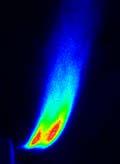


71 C3H8, Combustion air diluted with N 2 C 2 CH OH 21% O 2 15% O 2 10% O 2 5% O 2 2% O K 1373K 1173K 1373K 1173K 1373K Figure 13. Light Emission spectroscopy data showing C2, CH and OH specie at 1173 and 1373 K oxidizer preheat temperature and 21-2% oxygen concentration in C3H8 fuel et flames 59


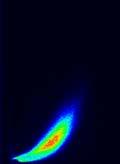


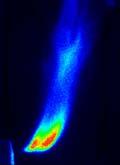
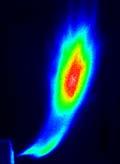


72 CH4, Combustion air diluted with N2 C 2 CH OH 21% O 2 15% O 2 10% O 2 5% O 2 2% O K 1373K 1173K 1373K 1173K 1373K Figure 14. Light Emission spectroscopy data showing C 2, CH and OH specie at 1173 and 1373 K oxidizer preheat temperature and 21-2 % oxygen concentration in CH 4 fuel et flames 60
73 7.6. Jet flame aerodynamics Some examples of the flow-field results for the non-burning and burning cases using propane and methane as fuels are shown in Figure 15 to Figure 22. The color-coded bar above each image gives information on the magnitude of the particular velocity component and the vectors indicate flow direction. The data that the figures are based on was normalized by the et exit velocity in order to normalize the results with respect to the et exit velocity. Also, the same momentum flux ratio was used in order to attain similarity in the mixing and et and crossflow mixing, and thus be able to identify the effects of combustion air preheat temperature and oxygen concentration. The average velocity distribution, turbulence characteristics, axial strain rate and total strain rate were calculated from the obtained data. The axial strain rate in the direction of the crossflow is calculated by: dv S y = Equation 42 dy where Sy is the axial strain rate and v is the axial velocity in the y direction of the flow. The rotation of the fluid is represented by the vorticity, which is defined as the curl of the velocity vector u: dv du Ω z = u = Equation 43 dx dy where v is the velocity in the y direction and u is the velocity in the x direction. The vorticity also provides a measure of where the mixing takes place between the et and the surrounding fluid. The average velocity distribution is defined by the average of the u and v velocities, i.e.: V + AVG 2 2 = V = u v Equation 44 The average velocity distribution normalized by the et exit velocity is presented in Figure 15 and Figure 16. Some results are also presented in Paper 1. The plots give information on the effects of combustion-air preheat temperature and oxygen content on the mean average velocity distribution. The average velocity distribution for a burning et inected into a crossflow of ambient temperature air of 21% oxygen concentration is presented. The effect of the combustion can be directly seen from the results. The distribution of the et is wider for the burning case compared to the non-burning case using a normal air temperature. (This is discussed in greater detail in Papers 1 and 2.) The heat release from the combustion process causes thermal expansion of the et. This can be clearly seen when comparing the burning and the non-burning ets in ambient conditions. When the combustion-air preheat temperature is increased, higher velocities are measured in the et. This is due to the direct effect of combustion-air properties on fuel-et penetration. At higher air preheat temperatures, the fuel et penetrates slightly further into the crossflow. Under high-temperature combustion conditions, the fuel et shows a stronger expansion compared to normal temperature conditions. This indicates a strong entertainment 61
74 during the high-temperature air combustion and a stronger expansion as a function of the more intense heat release. At lower oxygen concentrations, greater amounts of combustion air must be entrained into the fuel et before complete combustion. At high temperatures combined with a combustion-air oxygen concentration of 21%, the ets with a 1373K preheat air are distinctly smaller than those with a preheat air of 1173K. This correlates well with the flame photographs, showing a smaller flame size with an increase in air preheat temperature for normal air. The smaller expansion is also due to the lower flow rate of fuel, as the momentum flux ratio between the fuel and the crossflow was held constant. The mixing pattern of the different cases indicated similar behavior due to the constant momentum flux ratio used. As the oxygen concentration was changed from 21% to 5% at a constant temperature, the averaged flow field indicates dramatic expansion of the flame. This also correlates well with the flame photographs that illustrated a larger flame volume at a lower oxygen concentration in the combustion air. The effect of oxygen concentration on et expansion was also expected to have an influence on the flow since a sudden reaction renders faster mixing of the fuel and the crossflow. When the reaction rate is slower, this et expansion occurs over a larger volume, in both axial and radial directions. The results also imply, on the other hand, a smaller et expansion for the methane fuel ets, which is due to the less complex fuel molecules which react faster. The CH intensity distribution plots in Figure 13 and Figure 14 can be coupled with the larger expansion of the average velocity pattern resulting from the fuel et. This is because of the less intense heat release in the high-temperature and low-oxygen cases which allows a stronger entrainment and thus a more widely distributed et flow field. 62

: 1173K,")
: 1173K, 5% O 2 combustion air, C 3 H 8")

75 (a) (b) (c) (d) (e) Figure 15. Average velocity distribution normalized by et exit velocity at (a): 298K, 21% O 2 combustion air, C 3 H 8 burning; (b): 1173K, 21% O 2 combustion air, C 3 H 8 burning; (c): 1173K, 5% O 2 combustion air, C 3 H 8 burning; (d): 1373K, 21% O 2 combustion air, C 3 H 8 burning; (e): 1373K, 5% O 2 combustion air, C 3 H 8 burning 63
: 298K, 21% O 2")
: 1373K, 21% O 2 combustion air, CH 4")
76 (a) (b) (c) (d) (e) Figure 16. Average velocity distribution normalized by et exit velocity at (a): 298K, 21% O 2 combustion air, CH 4 burning; (b): 1173K, 21% O 2 combustion air, CH 4 burning; (c): 1173K, 5% O 2 combustion air, CH 4 burning; (d): 1373K, 21% O 2 combustion air, CH 4 burning; (e): 1373K, 5% O 2 combustion air, CH 4 burning 64
77 The axial strain rate distributions normalized by the et exit velocity for the different cases are illustrated in Figure 17 and figure 18. The axial strain rate is correlated to the acceleration or deceleration of a finite volume element. The acceleration of the flow in the axial (v or y) direction can also be determined (in the case of crossflow) from the entrainment of crossflow fluid into the fuel et. The deceleration of the flow upstream of the fuel et can be interpreted as a wake immediately upstream of the fuel-et path where a portion of the crossflow is entrained back into the fuel et. The experimental results presented in Figure 17 show that for the ambient temperature cases, the combustion process is strongly dependent on the entrainment. It can be seen that the combustion process increases the entrainment of the crossflow into the et path. The magnitude of the axial strain rate during high-temperature conditions was higher compared to the normaltemperature air cases. This also indicates dependency on the combustion air temperature. For a 21% oxygen combustion air at higher air preheat temperatures, the reaction is more intense from the stronger entrainment and axial strain rate. The extended reaction zone, which is a distinct feature of the low oxygen concentration, can be clearly distinguished from the axial strain rate distribution data when the oxygen content is reduced to 5 %. This trend can be observed for all different fuels examined in this work. The results indicate an extended zone of elevated axial strain rates. This shows the influence of the oxygen content, as larger volumes of the crossflow have to be entrained into the fuel-et region before the fuel can react completely. The axial strain rate distribution shows similar dependency on the temperature of the combustion air. The axial strain rate levels are higher at higher temperatures, although the entrainment is distributed quite similarly when the oxygen content is kept constant and the air preheat temperature is changed. The oxygen content shows a larger influence on the entrainment. At a low oxygen concentration, the reaction zone is enlarged. Thus a stronger entrainment of combustion air into the reaction zone is required in order to combust the fuel et completely. The influence of the fuel et fluid on the axial strain rate can also be seen in Figure 17 and Figure 18. The propane fuel et shows a more widespread axial strain rate distribution, which indicates that more of the crossflow fluid is entrained in order to complete the combustion process. The results provided in Paper 3 are for the LCV and methane fuel ets. For the normal air case, higher strain rates were obtained for the LCV fuel gas et compared to the methane fuel gas et. Also, a more coherent zone of elevated strain rate levels was found when the LCV gas was used. This suggests a slower mixing of the LCV gas fuel et. The zones of elevated strain rates can be identified in the zone below the et traectory where the et and the crossflow interact. The slower mixing might in this particular case depend on the higher density of the LCV gas (1.134 kg/m 3 ) compared to the methane gas (0.669 kg/m 3 ), which results in a higher inertia of the gas et, thus reducing entrainment and mixing in the case of the LCV gas et. The plots for the high-temperature cases indicate better defined zones of both positive and negative axial strain rates below and above the et traectory, respectively. Furthermore the axial strain rate levels were found to be higher for the low-calorific-fuel gas et. In the hightemperature case, the changed fluid-dynamics properties of the combustion air would be expected to have a large impact on the axial strain rate distribution, which also can be seen from the results. This can also be seen in the direct flame photographs, where a flame region can be identified at a longer distance downstream along the et traectory during the LCV fuel-et combustion case compared to the methane fuel-et case, thus indicating an ignition delay as the methane fuel et renders faster ignition of the fuel. 65

: 298K, 21% O 2 combustion air,")

: 1373K, 5% O 2 combustion air,")

78 (a) (b) (c) (d) (e) Figure 17. Axial strain rate distribution normalized by et exit velocity at (a): 298K, 21% O 2 combustion air, C 3 H 8 burning; (b): 1173K, 21% O 2 combustion air, C 3 H 8 burning; (c): 1173K, 5% O 2 combustion air, C 3 H 8 burning; (d): 1373K, 21% O 2 combustion air, C 3 H 8 burning; (e): 1373K, 5% O 2 combustion air, C 3 H 8 burning 66

: 298K, 21% O 2 combustion air,")
:")
: 1373K, 21% O 2")

79 (a) (b) (c) (d) (e) Figure 18. Axial strain rate distribution normalized by et exit velocity at (a): 298K, 21% O 2 combustion air, CH 4 burning; (b): 1173K, 21% O 2 combustion air, CH 4 burning; (c): 1173K, 5% O 2 combustion air, CH 4 burning; (d): 1373K, 21% O 2 combustion air, CH 4 burning; (e): 1373K, 5% O 2 combustion air, CH 4 burning 67
80 The results show that combustion decreases the degree of turbulence in the region where the et begins to deflect into the crossflow, denoted laminarization. Figure 19 and Figure 20 present the distribution of the intensity of radial turbulence levels normalized by et exit velocity resulting from the entrained et. The diagrams show a similar turbulence distribution in the nozzle region. This is as expected since the mixing is primarily governed by the momentum ratio between the ets, which was maintained constant for all the cases presented here. Reduced turbulence levels can be observed for the high-temperature air combustion. The results shown here suggest that radial turbulence intensity is lower under conditions of high air preheat temperature and low oxygen concentration. The areas of elevated turbulence in the reaction region can be seen where the axial strain rates are elevated also. This region provides information on the local mixing of the fuel et with the crossflow. The heat release generated from the combustion process has a hampering effect on the turbulence levels. The results showed that combustion decreases the degree of turbulence in the region where the et begins to deflect into the crossflow. Paper 4 presents results on the LCV and methane fuel ets in normal temperature air. They show that the LCV fuel et produces similar turbulence levels as the methane fuel et in close proximity to the nozzle. This was expected as the mixing is primarily governed by the momentum ratio between the ets and this ratio was held constant for the two cases. The experimental findings suggest that high-temperature cases reduce the radial turbulence intensity significantly. Comparison of the results from the non-burning and combustion cases for LCV and methane shows that the turbulence levels are low for the hightemperature air case compared to the normal-temperature air case. A very small local region of higher turbulence can be seen in the zone of high axial strain rate. This region provides local mixing of the fuel et with the crossflow. Furthermore, it can be seen that the turbulence is even further reduced when using methane as the fuel as compared to the low-calorific-value fuel (methane diluted with nitrogen). This indicates that the combustion process reduces the turbulence in the flow path. Also, the stronger heat release of the methane and propane fuel ets, compared to the LCV fuel et, has a stronger effect on dampening the turbulence along the traectory of the fuel et. Similar results were reported by Eickhoff et al.[38] from studies on stabilization mechanisms of et diffusion flames. This information suggests the clear role played by combustion in the flow dynamics associated with normal- and high-temperature air combustion conditions. 68

: 298K, 21% O 2 combustion")


81 (a) (b) (c) (d) (e) Figure 19. RMS radial velocity distribution normalized by the et exit velocity at at (a): 298K, 21% O 2 combustion air, C 3 H 8 burning; (b): 1173K, 21% O 2 combustion air, C 3 H 8 burning; (c): 1173K, 5% O 2 combustion air, C 3 H 8 burning; (d): 1373K, 21% O 2 combustion air, C 3 H 8 burning; (e): 1373K, 5% O 2 combustion air, C 3 H 8 burning 69

: 1173K, 21% O2 combustion air, CH4 burning;")
: 1373K,")
82 (a) (b) (c) (d) (e) Figure 20. RMS radial velocity distribution normalized by the et exit velocity (a): 298K, 21% O2 combustion air, CH4 burning; (b): 1173K, 21% O2 combustion air, CH4 burning; (c): 1173K, 5% O2 combustion air, CH4 burning; (d): 1373K, 21% O2 combustion air, CH4 burning; (e): 1373K, 5% O2 combustion air, CH4 burning 70
83 Some results of the vorticity normalized by et exit velocity are presented in Figure 21 and Figure 22. The vorticity is generated as soon as the et starts to deflect into the crossflow, leading to rotation of the et. A generally stronger vorticity for the high-temperature air case as compared to the normal-temperature air case can be noted. This indicates that strong rotation is initiated in the fuel et/crossflow interaction area. In examining the different plots, it can be seen that in the regions of strong vorticity there are also elevated levels of axial strain. An explanation for this is that as soon as the main flow begins to entrain into the et, rotation of the flow occurs. The slower mixing under high-temperature conditions for the low-calorific-value case would have the consequence of stronger rotation which would lead to delayed mixing. For the normaltemperature case, the findings indicate that the vorticity is distributed in a similar manner along the et traectory for both cases, giving an indication that similar mixing of the et and crossflow takes place under non-burning conditions. For the high-temperature case, a larger vorticity area can be seen for the combustion of LCV fuel ets compared to the methane fuel-et case. The heat release from chemical reactions affects vorticity negatively, reducing vortex formation and destroying local vortex tubes [31]. This can be observed where the vorticity is concentrated to a smaller area for the methane and propane cases, which entail a more immediate heat release, and is distributed over a larger area for the LCV fuel for which combustion is slower. 71


: 1373K, 5% O 2")

84 (a) (b) (c) (d) (e) Figure 21. Vorticity distribution normalized by the et exit velocity (a): 298K, 21% O 2 combustion air, CH 4 burning; (b): 1173K, 21% O 2 combustion air, CH 4 burning; (c): 1173K, 5% O 2 combustion air, CH 4 burning; (d): 1373K, 21% O 2 combustion air, CH 4 burning; (e): 1373K, 5% O 2 combustion air, CH 4 burning 72


: 1373K, 5% O 2")

85 (a) (b) (c) (d) (e) Figure 22. Vorticity distribution normalized by the et exit velocity (a): 298K, 21% O 2 combustion air, CH 4 burning; (b): 1173K, 21% O 2 combustion air, CH 4 burning; (c): 1173K, 5% O 2 combustion air, CH 4 burning; (d): 1373K, 21% O 2 combustion air, CH 4 burning; (e): 1373K, 5% O 2 combustion air, CH 4 burning 73
86 7.7. Superimposition of experimental data In order to be able to couple the distinctive characteristics of the flames in the high-temperature low-oxygen environment, the flame photographs were superimposed with the PIV plots and intensity plots from the light emission spectroscopy analyses (Figure 23 and Figure 24). In Appendix 3 the results of some other experimental cases are presented. The Appendix shows the results for the LCV fuel et under high-temperature conditions and for methane fuel ets both under high-temperature low-oxygen conditions and ambient conditions and finally, for a propane fuel et under ambient conditions. In Figure 23a, the flow field is superimposed on a flame photograph of a C3H8 fuel et in 1173K and with a crossflow oxygen concentration of 5 %. The figure illustrates the flow-field distribution and correlation of the flow field to the visible flame. The et expansion and ignition of the fuel et can be seen. The flow field follows the flame contour. Figure 23b, with the superimposed radial RMS distribution, clearly shows how the crossflow interacts with the fuel et, and in the interaction zone where the mixing is highest, the turbulence levels are also highest. Figure 23c presents the vorticity distribution superimposed on the flame photograph. Two different crossflow-fluid rotation zones can be identified above and below the fuel et. This is as expected, in line with the fluid dynamics of a fuel et in crossflow. In Figure 23d, the superimposed axial strain distribution can be seen. The axial strain indicates acceleration or deceleration of the crossflow fluid, and it can be seen that the highest strain rates lie below the fuel et. This indicates strong entrainment of the crossflow fluid into the fuel et and explains the extended reaction zones found in Figure 24. The reaction zone clearly shows the extended flame that occurs in the environment. A comparison with the results from the other experimental cases in Appendix 3 shows a significantly larger reaction zone with a secondary burning zone in the high-temperature oxygendeficient cases. 74
 average velocity field, (b) radial RMS values, (c) vorticity distribution and")
87 (a) (b) (c) Figure 23. Superimposed data of flame photographs and; (a) average velocity field, (b) radial RMS values, (c) vorticity distribution and (d) axial strain rate distribution. The fuel et was C 3 H 8 at 1173 K and 5 % oxygen concentration (d) 75
 C2- distribution, (b) CH-distribution,")
88 (a) (b) (c) Figure 24. Superimposed data of flame photographs and light emission spectroscopy data; (a) C2- distribution, (b) CH-distribution, (c) OH-distribution. The fuel et was C 3 H 8 at 1173 K and 5 % oxygen concentration in the oxidizer 76
89 7.8. Flame temperature The results of the flame temperature calculations are illustrated in Figure 25, Figure 26, figure 27, Figure 28 and Figure 29. The influence of the oxidizer oxygen concentration and temperature can be observed, as well as the influence of fuel type. Calculated temperatures for the vibrational temperatures of the C 2 species are shown. The temperature was calculated using Equation 39. The temperature data used for the plots pertain only to within the reaction volume. This is because the temperature was calculated as a function of the C 2 species that is only present within the reaction zone. Thus, there are no C 2 radicals outside the reaction zone and calculated temperatures for that area would be meaningless. In considering the effect of oxidizer oxygen concentration, a significant difference in the temperature field can be seen when the oxygen concentration is changed between 21 % and 5 %. At 21 % oxygen, the temperature plot reveals a small region of high temperatures; when the oxygen concentration drops to 5%, the flame is significantly larger. This is due to the extended reaction zone that results from the slower reaction rate due to insufficient oxygen in the reaction volume. This enlargement of the reaction zone can be seen in both the propane and methane fuel-et cases. Preheat temperature was found to have an effect on the temperature distribution as well. When the oxidizer temperature is increased, the zone of high temperatures tends to shrink. Thus, a more intensive reaction takes place. This is due to faster ignition, and a greater amount of energy being available for more rapid heating of the fuel. The ignition is determined for the position where the temperature in the traectory is first elevated. More rapid ignition of the fuel et can also be noted when the temperature is 1373 K versus 1173 K. However, an enlarged reaction zone can be seen for the higher oxidizer temperature and oxygen content of 5 %. This shows that oxidizer oxygen concentration has a stronger influence on flame volume than does oxidizer temperature. A change in fuel calorific value had a minor impact on the temperature distribution within the flame regarding comparison of the propane and methane fuel ets. The methane fuel-et results indicated faster ignition when considering the point where the first elevated temperatures can be detected along the traectories. The behavior of the LCV fuel et significantly differed from that of the methane and propane fuel ets. The temperature plot of the LCV fuel et shows a delayed ignition and a very evenly distributed temperature within the reaction volume. This implies that the LCV fuel et has a slow ignition, as it has to be heated up to a high temperature and be well mixed with the oxidizer in order to react. This shows that it is possible to combust fuels with low heating values, but the mixing and the oxidizer temperature are of great importance in ignition of the fuel et. 77


")


90 Figure 25. Temperature plots based on the C 2 vibrational temperature calculation for C 3 H 8 gas fuel ets at 1173 K (left) and 1373 K (right) oxidizer preheat and 21 % oxygen concentration Figure 26. Temperature plots based on the C 2 vibrational temperature calculation for C 3 H 8 gas fuel ets at 1173 K (left) and 1373 K (right) oxidizer preheat and 5 % oxygen concentration 78


 and")


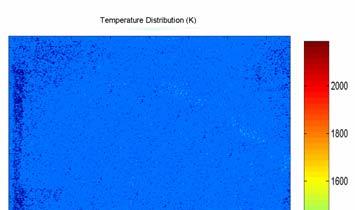

91 Figure 27. Temperature plots based on the C 2 vibrational temperature calculation for CH 4 gas fuel ets at 1173 K (left) and 1373 K (right) oxidizer preheat and 21 % oxygen concentration Figure 28. Temperature plots based on the C 2 vibrational temperature calculation for CH 4 gas fuel ets at 1173 K (left) and 1373 K (right) oxidizer preheat and 5 % oxygen concentration 79

92 [ C Figure 29 Temperature plots based on the C 2 vibrational temperature calculation for LCV gas fuel et at 1173 K oxidizer preheat and 8.1 % oxygen concentration 80
93 7.9 Semi-industrial HiTAC et flame study In order to compare the experimental results from the small-scale test apparatus and to determine if the characteristics found for the single flame were similar to those for a larger flame, experiments where conducted using a semi-industrial experimental apparatus equipped with a burner that could be operated in both regenerative and conventional mode. The experiments were performed with the burner running in conventional combustion mode and with a burner running in regenerative combustion mode. Flame temperature and heat flux were determined using probes that were inserted from the furnace ceiling. The experimental results showed a more compact zone close to the burner face with high temperatures in the conventional mode, and in the regenerative combustion mode the peak temperatures were lower and the temperature more evenly distributed within the entire combustion chamber. The results of the temperature and total-heat-flux measurements are illustrated in Figure 30 and Figure 31, respectively. The results clearly show that the same features of even flame-temperature distribution and even heat-flux distribution were obtained in both the large-scale and small-scale experiments. The temperature plots in Figure 30 show, for conventional mode, a peak flame temperature at the burner face. In regenerative burner mode, the temperature peak is absent. This is due to the high inection velocity which generates a strong entrainment and in turn leads to slower ignition as the flame is not attached to the burner face. Thus, a larger volume to react exists once the fuel is ignited, leading to a more even temperature distribution. The enlarged reaction volume can also be seen in Figure 32which shows the CO distribution for both regenerative burner mode and for conventional mode. A larger reaction zone can be seen in the case of the regenerative burner mode. The enlarged reaction zone is an effect of enhanced mixing due to the higher inection velocities that result in a more diluted and low-oxygen-concentration reaction zone. The results indicated a significantly enlarged reaction zone, which is coherent with the results of the radical determinations in the single-flame test apparatus. This also shows that the reaction zone was found to be enlarged in the semi-industrial-scale results and that the flame features observed were similar to those found for the single-et experiments. 81


 Figure")
 and for")


94 Figure 30. Temperature profiles at the burner face level in the semi-industrial test furnace for HiTAC mode (right) and for conventional mode (left) Figure 31. Heat flux profiles at the burner face level in the semi-industrial test furnace for HiTAC mode (left) and for conventional mode (right) Figure 32. CO concentrations along a vertical cut in the semi-industrial test furnace for HiTAC mode (left) and for conventional mode (right) 82
Evaluation of new combustion technologies for CO 2 and NO x reduction in steel industries
 Evaluation of new combustion technologies for CO 2 and NO x reduction in steel industries W. Blasiak, K. Narayanan & W. Yang Division of Energy and Furnace Technology, Royal Institute of Technology (KTH),
Simulation of Flameless Combustion of Natural Gas in a Laboratory Scale Furnace
 Turkish J. Eng. Env. Sci. 30 (2006), 135 143. c TÜBİTAK Simulation of Flameless Combustion of Natural Gas in a Laboratory Scale Furnace Sébastien MURER, Barbara PESENTI and Paul LYBAERT Thermal Engineering
Heat Storage Performance of a Honeycomb Ceramic Monolith
 Send Orders for Reprints to reprints@benthamscience.ae The Open Fuels & Energy Science Journal, 2014, 7, 113-120 113 Heat Storage Performance of a Honeycomb Ceramic Monolith Xiaoni Qi * and Yongqi Liu
Theory Comparison between Propane and Methane Combustion inside the Furnace
 International Journal of Current Engineering and Technology E-ISSN 2277 4106, P-ISSN 2347 5161 2015 INPRESSCO, All Rights Reserved Available at http://inpressco.com/category/ijcet Research Article Theory
Advanced combustion systems for tube manufacturing
 Advanced combustion systems for tube manufacturing As part of a major energy reduction programme Tenaris has successfully implemented advanced combustion systems for high temperature furnaces in its tube
PAPER-I (Conventional)
") 1. a. PAPER-I (Conventional) 10 kg of pure ice at 10 ºC is separated from 6 kg of pure water at +10 O C in an adiabatic chamber using a thin adiabatic membrane. Upon rupture of the membrane, ice and water
1. a. PAPER-I (Conventional) 10 kg of pure ice at 10 ºC is separated from 6 kg of pure water at +10 O C in an adiabatic chamber using a thin adiabatic membrane. Upon rupture of the membrane, ice and water
Optimization of a Dual-Fuel Low-NOx Combustion System for a Tangentially-Fired Utility Boiler Operating at a High Elevation.
 Optimization of a Dual-Fuel Low-NOx Combustion System for a Tangentially-Fired Utility Boiler Operating at a High Elevation. by F. McKenty, N. Brais, M. Mifuji, L. Gravel, and Y. Sirois STAR Global Energy
INVESTIGATIONS OF POTENTIALITIES OF BIOMASS GASIFICATION AT HTAG SYSTEM
 The Royal Institute of Technology in Stockholm INVESTIGATIONS OF POTENTIALITIES OF BIOMASS GASIFICATION AT HTAG SYSTEM WITH LOW OXYGEN CONCENTRATION SUSPOWER PROJECT Sławomir Kakietek July, 25 Author,
FUEL- OXYDANT FLEXIBLE COMBUSTION
 FUEL- OXYDANT FLEXIBLE COMBUSTION WITH FLAMELESS OXIDATION A. Milani, J.G. Wünning WS GmbH Recent and expected measures for reducing CO 2 released from combustion equipment affect the composition of both
Study of flow through combustion swirler with the effect of diffuser on the recirculation zone
 International Journal of Engineering Research and Development e-issn: 2278-067X, p-issn: 2278-800X, www.ijerd.com Volume 3, Issue 6 (September 2012), PP. 68-73 Study of flow through combustion swirler
Analysis of numerical models for the formation of NOX for combustion of gases in the strong swirl flow
 Analysis of numerical models for the formation of NOX for combustion of gases in the strong swirl flow P. Grzymislawski* 1, R. Slefarski 1, M. Golebiewski 1 1 Poznan University of Technology, Poland Abstract
Optimization of Air Preheater Design for the Enhancement of Heat Transfer Coefficient
 Optimization of Air Preheater Design for the Enhancement of Heat Transfer Coefficient P. N. Sapkal 1, P. R. Baviskar 2, M. J. Sable 3 & P. A. Makasare 4 Department of Mechanical Engineering, Rajarshi Shahu
Packed Bed Combustion: An Overview. William Hallett Dept. of Mechanical Engineering Université d Ottawa - University of Ottawa
 Packed Bed Combustion: An Overview William Hallett Dept. of Mechanical Engineering Université d Ottawa - University of Ottawa Introduction Packed Bed Combustion: fairly large particles of solid fuel on
[4163] T.E. (Mechanical) TURBO MACHINES (2008 Pattern) (Common to Mech. S/W) (Sem. - II)
![[4163] T.E. (Mechanical) TURBO MACHINES (2008 Pattern) (Common to Mech. S/W) (Sem. - II)](/thumbs/77/76045894.jpg "[4163] T.E. (Mechanical) TURBO MACHINES (2008 Pattern) (Common to Mech. S/W) (Sem. - II)") Total No. of Questions : 12] P1061 SEAT No. : [Total No. of Pages : 7 [4163] - 218 T.E. (Mechanical) TURBO MACHINES (2008 Pattern) (Common to Mech. S/W) (Sem. - II) Time : 3 Hours] [Max. Marks :100 Instructions
Total No. of Questions : 12] P1061 SEAT No. : [Total No. of Pages : 7 [4163] - 218 T.E. (Mechanical) TURBO MACHINES (2008 Pattern) (Common to Mech. S/W) (Sem. - II) Time : 3 Hours] [Max. Marks :100 Instructions
Overview of the Gaz de France R&D activities on flameless oxidation applied to high temperature processes
 Overview of the Gaz de France R&D activities on flameless oxidation applied to high temperature processes By Frédéric AGUILE and Alain QUINQUENEAU RESEARCH AND DEVELOPMENT DIVISION Main goals and driving
CFD analysis of double-chambered crematories using biomass producer gas as a fuel source
 CFD analysis of double-chambered crematories using biomass producer gas as a fuel source Yaowateera Achawangkul 1, Naoki Maruyama 1, Chatchawan Chaichana 2 Masafumi Hirota 1, Akira Nishimura 1, Pimpawat
MODELING OF REOXIDATION INCLUSION FORMATION IN STEEL SAND CASTING
 MODELING OF REOXIDATION INCLUSION FORMATION IN STEEL SAND CASTING A.J. Melendez 1, K.D. Carlson 1, C. Beckermann 1, M.C. Schneider 2 1 Dep. Mechanical and Industrial Engineering, University of Iowa, Iowa
Tananop Piemsinlapakunchon, and Manosh C. Paul
 Proceedings of the World Congress on Engineering 2017 Vol II, July 5-7, 2017, London, U.K. Tananop Piemsinlapakunchon, and Manosh C. Paul , July 5-7, 2017, London, U.K. is 0.8 cm above the air inlet. This
Research Update from Blunck Group at Oregon State University 2017
 Research Update from Blunck Group at Oregon State University 2017 Turbulent Flame Speed of Large Hydrocarbon Fuels Objective: Determine turbulent flame speeds and stability limits of various jet and jet-like
Prediction of Pollutant Emissions from Industrial Furnaces Using Large Eddy Simulation
 Paper # B03 Topic: Turbulent Flames 5 th US Combustion Meeting Organized by the Western States Section of the Combustion Institute and Hosted by the University of California at San Diego March 25-28, 2007.
Design and distribution of air nozzles in the biomass boiler assembly
 TRANSACTIONS OF THE INSTITUTE OF FLUID-FLOW MACHINERY No. 125, 2013, 13 28 KAROL RONEWICZ, TOMASZ TURZYŃSKI, DARIUSZ KARDAŚ Design and distribution of air nozzles in the biomass boiler assembly The Szewalski
Discharge Characteristics of DC Arc Water Plasma for Environmental Applications
 Plasma Science and Technology, Vol.14, No.12, Dec. 2012 Discharge Characteristics of DC Arc Water Plasma for Environmental Applications LI Tianming ( ), Sooseok CHOI, Takayuki WATANABE Department of Environmental
Sulfur Tail Gas Thermal Oxidizer Systems By Peter Pickard
 Sulfur Tail Gas Thermal Oxidizer Systems By Peter Pickard Introduction SRU s (Sulfur Recovery Units) are critical pieces of equipment in refineries and gas plants. SRUs remove sulfur compounds from certain
FLAME AERODYNAMICS COMBUSTION AND FUELS
 FLAME AERODYNAMICS IMPORTANCE OF AERODYNAMICS IN COMBUSTION Fuel Heat Combustion chamber, furnace Flue gas Air Heat Flow reactor Oxidizer: Fuel: Flue gas: MEDIA - air: primary, secondary sometimes tetriary
Quenching steels with gas jet arrays
 Quenching steels with gas jet arrays PAUL F STRATTON ANDREW P RICHARDSON BOC Rother Valley Way, Holbrook, Sheffield UNITED KINGDOM Paul.stratton@boc.com http://www.catweb.boc.com Abstract: - Single components
Impact of non-uniform surface flows on fire suppression of an idealized commodity
 Computational Methods in Multiphase Flow VII 207 Impact of non-uniform surface flows on fire suppression of an idealized commodity Y. Xin FM Global, Norwood MA, USA Abstract Sprinkler protection is currently
CO 2 and NO x Emissions Reduction in Combustion Systems
 INTERNATIONAL WORKSHOP Energy Optimization in Industry and the Reduction of CO 2 Emissions CO 2 and NO x Emissions Reduction in Combustion Systems Isabel Cabrita, Pedro Azevedo & Ibrahim Gulyurtlu Contents
Changes in combustion properties of Natural gas when mixed with Hydrogen
 Changes in combustion properties of Natural gas when mixed with Hydrogen PARISA SAYAD, ALESSANDRO SCHÖNBORN AND JENS KLINGMANN DEPARTMENT OF ENERGY SCIENCES, LUND UNIVERSITY PARISA.SAYAD@ENERGY.LTH.SE
EXPERIMENTAL STUDY ON PROPANE/OXYGEN AND NATURAL GAS/OXYGEN LAMINAR DIFFUSION FLAMES IN DILUTING AND PREHEATING CONDITIONS
 THERMAL SCIENCE: Year 2012, Vol. 16, No. 4, pp. 1043-1053 1043 EXPERIMENTAL STUDY ON PROPANE/OXYGEN AND NATURAL GAS/OXYGEN LAMINAR DIFFUSION FLAMES IN DILUTING AND PREHEATING CONDITIONS by Babak KASHIR,
Chapter 10. Applications for Chemiluminescence in Combustion Diagnostics
 Chapter 10 Applications for Chemiluminescence in Combustion Diagnostics 152 10.1 Interpretation of experimental results In Section 1.1, the lack of understanding of chemiluminescence formation was blamed
Performance and NOx Emissions of Refinery Fired Heaters Retrofitted to Hydrogen Combustion
 Available online at www.sciencedirect.com Energy Procedia 37 (2013 ) 7214 7220 GHGT-11 Performance and NOx Emissions of Refinery Fired Heaters Retrofitted to Hydrogen Combustion M. Ditaranto*, R. Anantharaman,
Solar Flat Plate Thermal Collector
 Solar Flat Plate Thermal Collector 1 OBJECTIVE: Performance Study of Solar Flat Plate Thermal Collector Operation with Variation in Mass Flow Rate and Level of Radiation INTRODUCTION: Solar water heater
Power-Cost Alternative De-NOx Solutions for Coal-Fired Power Plants
 Power-Cost Alternative De-NOx Solutions for Coal-Fired Power Plants 12/21/2015 Power Engineering By Bin Xu, David Wilson, and Rob Broglio Traditionally, large coal-fired generating units have complied
Design Optimization of a Non-evacuated CPC Collector
 Design Optimization of a Non-evacuated CPC Collector Dariush Zare a,*, Hossein Ebadi a a Biosystems Engineering Department, College of Agriculture, Shiraz University, Shiraz, Fars, Iran * Corresponding
Effect of air flowrate on particle velocity profile in a circulating fluidized bed
 Korean J. Chem. Eng., 24(5), 851-855 (2007) SHORT COMMUNICATION Effect of air flowrate on particle velocity profile in a circulating fluidized bed Sansanee Kumthanasup and Suchaya Nitivattananon Fuel Research
Supersonic Nozzle Flow in the Two-Phase Ejector as Water Refrigeration System by Using Waste Heat
 HEFAT2012 9 th International Conference on Heat Transfer, Fluid Mechanics and Thermodynamics 16 18 July 2012 Malta Supersonic Nozzle Flow in the Two-Phase Ejector as Water Refrigeration System by Using
The seven possibilities described herein below reveal
 Technical and operational measures to increase energy efficiency of industrial furnaces by Dominik Schröder The measures, which are traditionally taken for energy saving, aim at the selection of the most
A Novel Waste Plastics Firing System Based on the Melting/Gasification Characteristics
 Proceedings of the 2 nd World Congress on Mechanical, Chemical, and Material Engineering (MCM'16) Budapest, Hungary August 22 23, 2016 Paper No. HTFF 120 DOI: 10.11159/htff16.120 A Novel Waste Plastics
Properties of laminar premixed hydrogen- added ammonia/air flames
 5 th Annual Ammonia Fuel Conference Minneapolis, MN, USA, 29-30 September 2008 Properties of laminar premixed hydrogen- added ammonia/air flames J.H. Lee, J.H. Park and O.C. Kwon * School of Mechanical
Characterization of Coal and Biomass. Conversion Behaviors in Advanced Energy Systems
 Characterization of Coal and Biomass Conversion Behaviors in Advanced Energy Systems Reginald Mitchell, Paul Campbell and Liqiang Ma High Temperature Gasdynamics Laboratory Group Mechanical Engineering
Modelling and Simulation of Thermodynamic Processes of Vertical Shaft Kiln in Magnesia Plant Using CFD Code Fluent
 Proceedings of the 5th IASME/WSEAS Int. Conference on Heat Transfer, Thermal Engineering and Environment, Athens, Greece, August 25-27, 2007 85 Modelling and Simulation of Thermodynamic Processes of Vertical
A NEW APPARATUS FOR FLAME SPREAD EXPERIMENTS
 th International Conference on Structural Mechanics in Reactor Technology (SMiRT ) - A NEW APPARATUS FOR FLAME SPREAD EXPERIMENTS Johan Mangs VTT Technical Research Centre of Finland, Espoo, Finland ABSTRACT
The Influence of Chemical Inhibitor Addition on Reverse-Jet Flame Stabilization
 68 -GT-39 The Society shall not be responsible for statements or opinions advanced in papers or in discussion at meetings of the Society or of its Divisions or Sections, or printed in its publications.
POLTTOPROSESSIEN LASKENNALLINEN JA KOKEELLINEN TUTKIMUS:
 1 POLTTOPROSESSIEN LASKENNALLINEN JA KOKEELLINEN TUTKIMUS: Application of HTAC Technique in Combustion of Liquid Fuels Janne Wahlman and Antti Oksanen Energy and Process Engineering Tampere University
A BASIC IMMERSION FIRETUBE FLOWNEX MODEL
 A BASIC IMMERSION FIRETUBE FLOWNEX MODEL This case study demonstrates the implementation of a basic immersion firetube model in Flownex and presents natural draft and forced draft examples. OIL AND GAS
COMPUTATIONAL FLUID DYNAMIC COMBUSTION MODELLING OF A BAGASSE BOILER
 REFEREED PAPER COMPUTATIONAL FLUID DYNAMIC COMBUSTION MODELLING OF A BAGASSE BOILER DU TOIT P AND VAN DER MERWE SW John Thompson, Sacks Circle, Bellville South, 7530, South Africa philipd@johnthompson.co.za
SHRI RAMSWAROOP MEMORIAL COLLEGE OF ENGG. & MANAGEMENT B.Tech. [SEM IV (ME-41, 42,43 & 44)] QUIZ TEST-1 (Session: )
![SHRI RAMSWAROOP MEMORIAL COLLEGE OF ENGG. & MANAGEMENT B.Tech. [SEM IV (ME-41, 42,43 & 44)] QUIZ TEST-1 (Session: )](/thumbs/72/67555697.jpg "SHRI RAMSWAROOP MEMORIAL COLLEGE OF ENGG. & MANAGEMENT B.Tech. [SEM IV (ME-41, 42,43 & 44)] QUIZ TEST-1 (Session: )") QUIZ TEST-1 Q.1. In a stage of an impulse turbine provided with a single row wheel, the mean diameter of the blade ring is 80cm and the speed of the rotation is 3000rpm. The steam issues from the nozzle
QUIZ TEST-1 Q.1. In a stage of an impulse turbine provided with a single row wheel, the mean diameter of the blade ring is 80cm and the speed of the rotation is 3000rpm. The steam issues from the nozzle
Proposed Guidelines for the Reduction of Nitrogen Oxide Emissions from Natural Gas fuelled Stationary Combustion Turbines
 Proposed Guidelines for the Reduction of Nitrogen Oxide Emissions from Natural Gas fuelled Stationary Combustion Turbines Environment and Climate Change Canada May 2016 Table of Contents 1. Foreword...
IFRF Combustion Journal Article Number , June 2000 ISSN X
 IFRF Combustion Journal Article Number 200005, June 2000 ISSN 1562-479X SCALING OF LOW NO X FLAMES OF NATURAL GAS S. Orsino and R. Weber Corresponding Author: Stefano Orsino IFRF Research Station B.V.
DETERMINATION OF CONCENTRATION AND MASS FLOW OF PARTICULATE MATTER IN FLUE GAS FOR STATIONARY SOURCE EMISSIONS
 MS 1596: 2003 DETERMINATION OF CONCENTRATION AND MASS FLOW OF PARTICULATE MATTER IN FLUE GAS FOR STATIONARY SOURCE EMISSIONS Presented BY: UiTM A&A Laboratory Malaysia s 1 st University Affiliated Environmental
flow work, p. 173 energy rate balance, p. 174 nozzle, p. 177 diffuser, p. 177 turbine, p. 180 compressor, p. 184 (4.4b) p. 166
 p. 166") 0 Chapter 4 Control Volume Analysis Using Energy The use of mass and energy balances for control volumes at steady state is illustrated for nozzles and diffusers, turbines, compressors and pumps, heat
0 Chapter 4 Control Volume Analysis Using Energy The use of mass and energy balances for control volumes at steady state is illustrated for nozzles and diffusers, turbines, compressors and pumps, heat
System Identification and Performance Improvement to a Micro Gas Turbine Applying Biogas
 System Identification and Performance Improvement to a Micro Gas Turbine Applying Biogas Chun Hsiang Yang, Cheng Chia Lee and Chiun Hsun Chen Abstract In this study, the effects of biogas s on the performance
North American Combustion Burners
 Combustion North American Combustion Burners 4485 Tempest SE Gas Burner Low NOx - DMC Mode capable to achieve Ultra Low NOx emissions NPT or BSP air/gas inlets, adjustable in 90 increaments Low air pressure
Compact flue gas analyser: testo 300 M-I
 220 Compact flue gas analyser: testo 300 M-I PC analysis Prints Small memory -------------------- testo 300-I -------------------- 16.07.2001 09:36:22 C Quick flue gas checks are of interest for all industrial
Downsizing a Claus Sulfur Recovery Unit
 INFRASTRUCTURE MINING & METALS NUCLEAR, SECURITY & ENVIRONMENTAL Downsizing a Claus Sulfur Recovery Unit OIL, GAS & CHEMICALS By Charles L. Kimtantas and Martin A. Taylor ckimtant@bechtel.com & mataylo1@bechtel.com
BURNER FLAME TEMPERATURE DURING WARM UP AND HOT STANDBY. Alan D. Mosher KPS Technology & Engineering LLC
 BURNER FLAME TEMPERATURE DURING WARM UP AND HOT STANDBY Alan D. Mosher KPS Technology & Engineering LLC Presented at the Brimstone Sulfur Symposium Facilitated by Brimstone STS Limited Vail Colorado September
The effect of hydrogen containing fuel blends upon flashback in swirl burners. Nick Syred Cardiff School of Engineering Wales, U.K.
 The effect of hydrogen containing fuel blends upon flashback in swirl burners. Nick Syred Cardiff School of Engineering Wales, U.K. Objectives Investigate flashback behaviour in swirl combustors representative
Design and Simulation of a Hybrid Entrained-Flow and Fluidized Bed Mild Gasifier Part 2 Case Study and Analysis
 Proceedings of the ASME 2011 International Mechanical Engineering Congress & Exposition IMECE2011 November 11-17, 2011, Denver, Colorado, USA IMECE2011-64485 Design and Simulation of a Hybrid Entrained-Flow
A COMPARISON OF GAS ANALYSIS TECHNOLOGIES AVAILABLE FOR EFFICIENT AND SAFE COMBUSTION IN CONTROL FIRED HEATERS
 EXPERTS IN COMBUSTION CONTROL EXPERT PAPER A COMPARISON OF GAS ANALYSIS TECHNOLOGIES AVAILABLE FOR EFFICIENT AND SAFE COMBUSTION IN CONTROL FIRED HEATERS By Rhys Jenkins, Product Business Manager, Servomex
CHAPTER 6 : GAS SAMPLING SYSTEMS
 CHAPTER 6 : GAS SAMPLING SYSTEMS 1 Scope : 1.1 This Chapter describes two types of gas sampling systems in paragraphs 2.1 and 2.2 meeting the requirements specified in para 4.2 of Chapter 3 of this Part.
Lubricating grease shear flow and boundary layers in a concentric. cylinder configuration
 45 3rd International Tribology Symposium of IFToMM, March in 2013, Luleå Lubricating grease shear flow and boundary layers in a concentric cylinder configuration J. X. LI 1, LARS G. WESTERBERG 2, E. HÖGLUND
Solid Circulation and Gas Bypassing in an Internally Circulating Fluidized Bed with an Orifice-Type Draft Tube
 Korean J. Chem. Eng., 16(5), 618-623 (1999) Solid Circulation and Gas Bypassing in an Internally Circulating Fluidized Bed with an Orifice-Type Draft Tube Hong-Sik Ahn, Woon-Jae Lee, Sang-Done Kim and
ANSYS Combustion Analysis Solutions - Overview and Update
 ANSYS Combustion Analysis Solutions - Overview and Update Gilles Eggenspieler ANSYS, Inc. 1 Agenda Overview of Combustion Analysis Solution Reduced Order Models Finite Rate Models Pollutant Models Examples
North American Combustion Burners
 Combustion North American Combustion Burners 4485 Tempest SE High Velocity Gas Burner Low NOx NPT or BSP air/gas inlets, adjustable in 90 increaments Low air pressure requirement 500,000 to 1,500,000 Btu/h
A MODEL FOR RESIDUAL STRESS AND PART WARPAGE PREDICTION IN MATERIAL EXTRUSION WITH APPLICATION TO POLYPROPYLENE. Atlanta, GA 30332
 Solid Freeform Fabrication 2016: Proceedings of the 26th 27th Annual International Solid Freeform Fabrication Symposium An Additive Manufacturing Conference A MODEL FOR RESIDUAL STRESS AND PART WARPAGE
Following the world economic crisis, the primary goals of
 Tenova FlexyTech regenerative flameless burners With more than 40 years experience in R&D on combustion systems, furnace design and installation of Tenova s Flexy Tech regenerative flameless burners combine
Liquid-Solid Phase Change Modeling Using Fluent. Anirudh and Joseph Lam 2002 Fluent Users Group Meeting
 Liquid-Solid Phase Change Modeling Using Fluent Anirudh and Joseph Lam 2002 Fluent Users Group Meeting Solidification Model FLUENT can be used to solve fluid flow problems involving both solidification
AC : THE ENERGY SYSTEMS LABORATORY AT KETTERING UNIVERSITY
 AC 2007-27: THE ENERGY SYSTEMS LABORATORY AT KETTERING UNIVERSITY Ahmad Pourmovahed, Kettering University Ahmad Pourmovahed is a Professor of Mechanical Engineering at Kettering University. He received
Chapter 2.6: FBC Boilers
 Part-I: Objective type questions and answers Chapter 2.6: FBC Boilers 1. In FBC boilers fluidization depends largely on --------- a) Particle size b) Air velocity c) Both (a) and (b) d) Neither (a) nor
Carbon Monoxide Catalytic Oxidation Model
 International Journal of Chemistry and Chemical Engineering. ISSN 2248-9924 Volume 3, Number 3 (2013), pp. 161-166 Research India Publications http://www.ripublication.com Carbon Monoxide Catalytic Oxidation
Performance Analysis for Natural Draught Cooling Tower & Chimney through Numerical Simulation
 Performance Analysis for Natural Draught Cooling Tower & Chimney through Numerical Simulation Kanteyya A 1, Kiran Kumar Rokhade 2 Assistant Professor, Department of Mechanical Engineering, HKESSLN College
Study on the thermal protection performance of superalloy honeycomb panels in high-speed thermal shock environments
 THEORETICAL & APPLIED MECHANICS LETTERS 4, 021004 (2014) Study on the thermal protection performance of superalloy honeycomb panels in high-speed thermal shock environments Dafang Wu, 1, a) Anfeng Zhou,
Development of a novel reformer for tar-free syngas production
 Available online at www.sciencedirect.com ScienceDirect Energy Procedia 75 (2015 ) 246 251 The 7 th International Conference on Applied Energy ICAE2015 Development of a novel reformer for tar-free syngas
SOFC Modeling Considering Internal Reforming by a Global Kinetics Approach. and My Research in General
 SOFC Modeling Considering Internal Reforming by a Global Kinetics Approach and My Research in General Martin Andersson Division of Heat Transfer, Department of Energy Sciences, Faculty of Engineering (LTH),
Research Activities on Oxyfuel Combustion at IVD, Universität Stuttgart
 1 st Young Researchers Forum Developments in Oxy-Combustion Technology for Power Plants with CCS Hamburg, Germany 8 th December 26 Hosted by: Institute of Energy Systems Technical University of Hamburg-Harburg
Thermal Accumulation in Solar Systems for Hot Water Abstract 1. Introduction
 Thermal Accumulation in Solar Systems for Hot Water Stanko Vl. Shtrakov, Anton Stoilov South - West University Neofit Rilski, Dept of Physics, 66 Ivan Mihailov Str., 2700 - Blagoevgrad, BULGARIA, E-mail:
Experimental investigation of the effect of nitrogen dilution on NO x emission in propane-air non-premixed flame
 MCS 7 Chia Laguna, Cagliari, Sardinia, Italy, September 11-15, 2011 Experimental investigation of the effect of nitrogen dilution on NO x emission in propane-air non-premixed flame Abdolrasoul Rangrazi*
Reforming and burning of ammonia in micro hydrogen and power generation systems
 8 th Annual Ammonia Fuel Conference Portland, OR, USA, 18-21 September 2011 Reforming and burning of ammonia in micro hydrogen and power generation systems O.C. Kwon *, J.M. Joo, S.I. Lee and D.H. Um School
The University of Liège Wind Tunnel Facility
 The University of Liège Wind Tunnel Facility Technical description The University of Liège Wind Tunnel Facility Technical description December 2009-1/27 The University of Liège Wind Tunnel Facility Technical
CEE 452/652. Week 14, Lecture 1 NOx control. Dr. Dave DuBois Division of Atmospheric Sciences, Desert Research Institute
 CEE 45/65 Week 14, Lecture 1 NOx control Dr. Dave DuBois Division of Atmospheric Sciences, Desert Research Institute Today s topics Today s topic: NOx control Read chapter 16 Presentations on Nov 9 and
a. The power required to drive the compressor; b. The inlet and output pipe cross-sectional area. [Ans: kw, m 2 ] [3.34, R. K.
![a. The power required to drive the compressor; b. The inlet and output pipe cross-sectional area. [Ans: kw, m 2 ] [3.34, R. K.](/thumbs/76/73432086.jpg "a. The power required to drive the compressor; b. The inlet and output pipe cross-sectional area. [Ans: kw, m 2 ] [3.34, R. K.") CHAPTER 2 - FIRST LAW OF THERMODYNAMICS 1. At the inlet to a certain nozzle the enthalpy of fluid passing is 2800 kj/kg, and the velocity is 50 m/s. At the discharge end the enthalpy is 2600 kj/kg. The
CHAPTER 2 - FIRST LAW OF THERMODYNAMICS 1. At the inlet to a certain nozzle the enthalpy of fluid passing is 2800 kj/kg, and the velocity is 50 m/s. At the discharge end the enthalpy is 2600 kj/kg. The
Metal vapor micro-jet controls material redistribution in laser powder. bed fusion additive manufacturing
 Metal vapor micro-jet controls material redistribution in laser powder bed fusion additive manufacturing Sonny Ly 1, Alexander M. Rubenchik 2, Saad A. Khairallah 3, Gabe Guss 4 and Manyalibo J. Matthews
Fluidised bed for stripping sand casting process. Guido Belforte, Massimiliana Carello, Vladimir Viktorov
 Fluidised bed for stripping sand casting process Guido Belforte, Massimiliana Carello, Vladimir Viktorov Dipartimento di Meccanica - Politecnico di Torino C.so Duca degli Abruzzi, 24 10129 Torino Italy
Study of Calcination-Carbonation of Calcium Carbonate in Different Fluidizing Mediums for Chemical Looping Gasification in Circulating Fluidized Beds
 Engineering Conferences International ECI Digital Archives 10th International Conference on Circulating Fluidized Beds and Fluidization Technology - CFB-10 Refereed Proceedings Spring 5-2-2011 Study of
COMBUSTION PROCESS ANALYSIS IN BOILER OP-650K BASED ON ACOUSTIC GAS TEMPERATURE MEASURING SYSTEM
 3 rd International Conference on Contemporary Problems of Thermal Engineering CPOTE 2012, 18-20 September 2012, Gliwice, Poland Institute of Thermal Technology COMBUSTION PROCESS ANALYSIS IN BOILER OP-650K
Comparison Between PIV Measurements and CFD Simulation on a Model of GT Annular Burner
 Comparison Between PIV Measurements and CFD Simulation on a Model of GT Annular Burner D. Giordano, S. Giammartini, M. Rufoloni, G. Calchetti, F. Manfredi, E. Giacomazzi ENEA - C. R. Casaccia Sec. ENE-IMP
Performance of a counterflow heat exchanger with heat loss through the wall at the cold end
 Cryogenics 39 (1999) 43 5 Performance of a counterflow heat exchanger with heat loss through the wall at the cold end S. Pradeep Narayanan, G. Venkatarathnam * Department of Mechanical Engineering, Indian
Thermal performance of a closed wet cooling tower for chilled ceilings: measurement and CFD simulation
 INTERNATIONAL JOURNAL OF ENERGY RESEARCH Int. J. Energy Res. 2000; 24:1171}1179 Thermal performance of a closed wet cooling tower for chilled ceilings: measurement and CFD simulation Sa!a Ri!at*, Armando
ASME PTC Flow Measurement
 ASME PTC 19.5-2004 Flow Measurement Performance Test Codes A N A M E R I C A N N A T I O N A L S T A N D A R D ASME PTC 19.5-2004 Flow Measurement Performance Test Codes AN AMERICAN NATIONAL STANDARD Three
CFD ANALYSIS OF CONVECTIVE FLOW IN A SOLAR DOMESTIC HOT WATER STORAGE TANK
 International Journal of Scientific & Engineering Research Volume 4, Issue 1, January-2013 1 CFD ANALYSIS OF CONVECTIVE FLOW IN A SOLAR DOMESTIC HOT WATER STORAGE TANK Mr. Mainak Bhaumik M.E. (Thermal
Fundamental oxy-fuel combustion research carried out within the ENCAP project
 Oxy-fuel workshop, Cottbus, 29-3 th November 25 Fundamental oxy-fuel combustion research carried out within the ENCAP project KLAS ANDERSSON Department of Energy and Environment, Chalmers University of
Smart Integration of Thermal Management Systems for Electronics Cooling
 Smart Integration of Thermal Management Systems for Electronics Cooling Dr. Ir. Wessel W. Wits, University of Twente, Faculty of Engineering Technology, Laboratory of Design, Production and Management,
Environment Protection Engineering. ON CO AND NOx EMISSION IN THE KINETIC COMBUSTION OF PROPANE/NATURAL GAS MIXTURES
 Environment Protection Engineering Vol. 41 2015 No. 3 DOI: 10.5277/epe150307 WOJCIECH JERZAK 1, ZOFIA KALICKA 1, ELŻBIETA KAWECKA-CEBULA 1 ON CO AND NOx EMISSION IN THE KINETIC COMBUSTION OF PROPANE/NATURAL
CH88 In Situ Flue Gas Oxygen Transmitter
 CH88 Combustion Flue Gas Oxygen Analyzer System CMB-PDS-CH88 Product Data Sheet September 2017 CH88 In Situ Flue Gas Oxygen Transmitter World-Class TM performance Outstanding accuracy ±1% full scale 1056
Evaluating the effective diffusion coefficient within the automobile catalysts
 Evaluating the effective diffusion coefficient within the automobile catalysts Hironobu Ozeki, Hiroshi Yamada, Tomohiko Tagawa and aoki Takahashi 2. Chemical Engineering, agoya University, agoya, Japan
Ring Pit Furnaces for Baking of high quality Anodes an Overview
 Ring Pit Furnaces for Baking of high quality Anodes an Overview Motivation Baking represents the most expensive step in the production of anodes for the aluminum industry. The anode quality has the biggest
Impact of Selective Oxygen Injection on NO, LOI, and Flame Luminosity in a Fine Particle, Swirl-Stabilized Wood Flame
 Paper # 7CO-63 Topic: Coal and Biomass Combustion and Gasification 8 th U. S. National Combustion Meeting Organized by the Western States Section of the Combustion Institute and hosted by the University
Lab 6 Measurement of Ozone
 Georgia Institute of Technology School of Earth and Atmospheric Sciences EAS 4641 Spring 2008 Lab 6 Measurement of Ozone Purpose of Lab 6: In this lab you will measure the ambient concentration of ozone
Combustion of Polymers in a Fluidised Bed Reactor
 Archivum Combustionis Vol. 30 (2010) no. 4 Combustion of Polymers in a Fluidised Bed Reactor J. Połomska *, W. Żukowski **, J. Zabagło ** * Faculty of Environmental Engineering, **Faculty of Chemical Engineering
Oxygen-Enriched Combustion Studies with the Low NO x CGRI Burner
 IFRF Combustion Journal Article Number 00404, October 004 ISSN 156-479X Oxygen-Enriched Combustion Studies with the Low NO x CGRI Burner D. Poirier, E.W. Grandmaison*, A.D. Lawrence 1, M.D. Matovic and