Air Quality Monitoring Results 2011
|
|
|
- Oscar Quinn
- 5 years ago
- Views:
Transcription


1 Air Quality Monitoring Results 2011 HIGHLIGHTS Continuing air quality improvement trends Province-wide achievement of Canada-wide standards Lower benzene levels in Saint John Special Project: Mobile air quality reporting from Atholville Department of Environment and Local Government 1

2 Contents Air Quality Monitoring in New Brunswick 2 What We Measure 2 Understanding Air Pollution 3 Table: Overview of Key Pollutants - Sources and Effects 3 Provincial Air Quality Monitoring Networks 4 Provincially Operated Air Quality Monitoring Stations 4 Industry-Operated Air Quality Monitoring Stations 4 Map: The Provincial Air Quality Monitoring Network - DELG Stations 5 Map: The Provincial Air Quality Monitoring Network - Industry Operated Stations 6 Provincial Air Quality Objectives 7 Table: New Brunswick Air Quality Objectives 7 Table: Compliance Statistics for Long Term Air Quality Improvement 8 Canada-wide Standards 8 Map: Ground Level Ozone (O 3 ) 8 Map: Particulate Matter (PM 2.5 ) 8 Volatile Organic Compounds in the Saint John Region 9 Chart: Benzene Levels in the Saint John Region 9 Getting Air Quality Information - When You Need It 10 Map: 2011 IQUA and AQHI Coverage 10 Acid Rain Monitoring 11 Map: 2011 Acid Precipitation Network Map 11 Chart: Network-wide Average Sulphate Concentration in Precipitation 11 Special Study: Mobile Air Quality Monitoring in Atholville 12 Chart: Total Reduced Sulphur - Atholville 12 Conclusion 13 Learn More about Air Quality 13 Feedback 13 1

 agreement.")

. The provincial network is comprised of 16 air quality monitoring stations.")

3 Air Quality Monitoring in New Brunswick This report provides an overview of the air quality monitoring activities currently being undertaken in the province of New Brunswick. Air quality information, in relation to regulated ambient air quality limits, is also provided. Air quality monitoring in New Brunswick is a partnership between the Federal Government (Environment Canada) and the Provincial Department of Environment and Local Government (DELG). This partnership has been formalized under a long-standing National Air Pollution Surveillance (NAPS) agreement. Through the NAPS agreement, Environment Canada provides all of the necessary monitoring equipment and a centralized national database for the air quality information collected. It is the Province s responsibility to deploy and maintain the equipment, operate the stations, perform necessary calibrations, and otherwise ensure that data is accurate. Air quality monitoring equipment. A Volatile Organic Compound (VOC) sampler (left/near-field), and a Particulate Matter monitor (PM 2.5 ) (right/far-field). A typical air quality monitoring station (Moncton). The provincial network is comprised of 16 air quality monitoring stations. There are a total of 61 instruments operating at these stations at all times. The stations and monitors have been established for a number of purposes: to detect and quantify impacts from regulated pollution sources; to assess and track ambient background levels of various pollutants; to monitor transboundary migration of pollution into New Brunswick; and, to provide real-time data to public health reporting systems such as the Air Quality Health Index. The Province also requires the operators of large industrial facilities to participate in air quality monitoring. During the 2011 reporting year there were 34 industry-operated stations dedicated to monitoring the ambient concentrations of industryspecific contaminants in nearby communities. What We Measure Each air quality monitoring station is different, with monitors set up to suit the pollution sources in that particular area. The most common parameters to monitor are: Ground Level Ozone Carbon Monoxide Sulphur Dioxide Nitrogen Dioxide Particulate Matter Total Reduced Sulphur Volatile Organic Compounds Wind Speed Wind Direction Site maps and monitor inventories are provided on pages 5 and 6. 2

4 Understanding Air Pollution Air quality is constantly changing from season to season, and is affected by a wide variety of factors, including the weather, long range movements of air from other parts of the world, natural events, industry cycles, and other human activities. Below, we look at some of the more common air pollutants: what they are, where they come from, and how they can affect our environment and our health. Overview of Key Air Pollutants - Sources and Effects Air Pollutant What is it? What does it do? Sulphur Dioxide (SO 2 ) Total Reduced Sulphur (TRS) and Hydrogen Sulphide (H 2 S) Nitrogen Dioxide (NO 2 ) Particulate Matter (PM 2.5 ) Ground Level Ozone (O 3 ) Carbon Monoxide (CO) A colourless gas with a sharp odour, like that of a struck match. It is produced by the burning of sulphur-bearing fuels such as oil and coal. A variety of gases with a characteristic rotten egg odour. It is produced by natural decomposition (e.g., in marshes and tidal flats), and certain industrial processes (e.g., kraft pulp mills, and oil refineries). A reddish-brown gas with a sharp odour. It is generated through combustion, especially motor vehicle exhaust and fossil fuel burning electrical power generation. Tiny (invisible) airborne specks of solid or liquid material (e.g., dust & soot). It is generated by natural sources (e.g. wind-blown dust and forest fires), and through fuel burning (especially fossil fuels and wood). An invisible and odourless gas. Ozone is formed through chemical reactions between a variety of ozone precursor pollutants, which are released by industrial facilities and motor vehicles. Most of New Brunswick s ozone is carried here by air masses originating in the United States and central Canada. Another invisible and odourless gas. It is created when there is incomplete (inefficient) combustion of fuels. Motor vehicles are a significant source. High concentrations can damage plants, and corrode metals. It can irritate the eyes, throat, and lungs. It also contributes to acid rain, which impacts sensitive lakes and rivers. Causes nuisance odours. At very high concentrations it can cause respiratory irritation and related health concerns. It also contributes to acid rain. Similar effects as listed for SO 2. NO 2 also reacts with other pollutants to cause the formation of ground level ozone. Causes and aggravates a variety of human cardiovascular ailments. It also contributes to haze. Irritates the lungs and makes breathing difficult. Also damages plants, weakens rubber, and attacks metals and painted surfaces. CO interferes with the blood s ability to carry oxygen to vital organs and tissues. Exposure to higher concentrations can be fatal. In addition to the key pollutants described above, there are a variety of other air contaminants that are monitored on a case-by-case basis, depending on local emission sources. 3


5 Provincial Air Quality Monitoring Networks Provincially Operated Air Quality Monitoring Stations New Brunswick s 16 provincially operated air quality monitoring stations collect data continuously, year-round. Most monitors record a measurement every five minutes. Collectively, this generates over five million data points each year. The majority of this data is immediately transmitted to a central data management system. Operation and oversight of the network and data management system requires the constant attention of a team of three dedicated air quality technicians. The stations are also audited by Environment Canada to ensure that monitors are appropriately maintained and data is accurate. Since the beginning of the program in the early 1970s these audits have consistently confirmed the high quality of the Province s reported data. Industry-Operated Air Quality Monitoring Stations As with provincial stations, New Brunswick s industry-operated stations are also operated continuously, year-round. This data is submitted annually to DELG. DELG audits the industry operated sites to ensure accuracy of reported data. 4
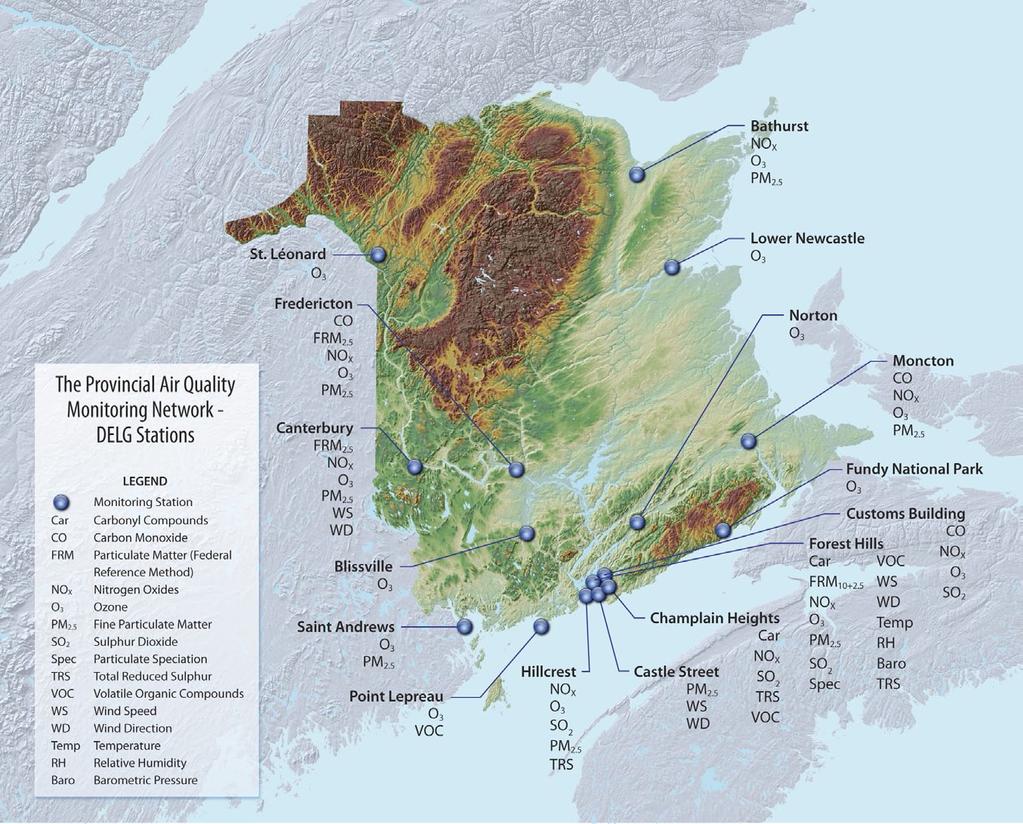
6 N 5
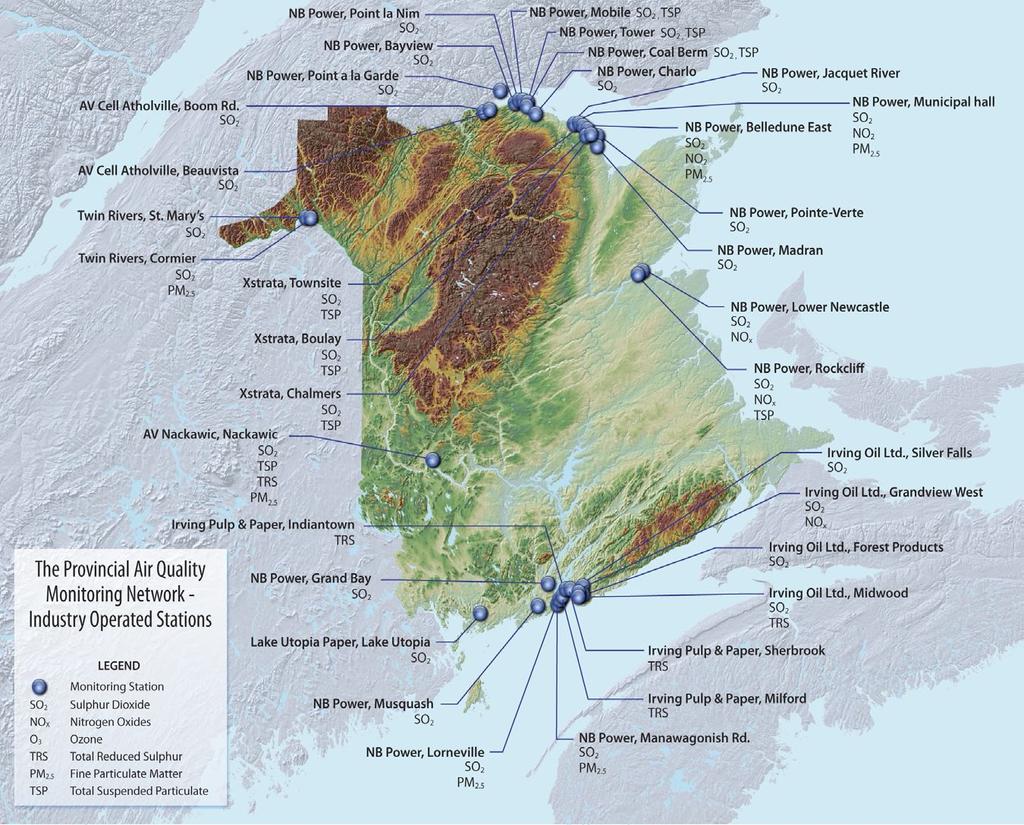
7 N 6

8 Provincial Air Quality Objectives One of the key purposes of this report is to describe the Province s success in achieving the provincial air quality objectives (listed below), which were established under the Clean Air Act in Please note that the parameters listed below, and elsewhere in this report, are described in units of parts per million (ppm), parts per billion (ppb), or micrograms per cubic meter (µg/m 3 ). New Brunswick Air Quality Objectives Pollutant Averaging Period 1 Hour 8 Hour 24 Hour 1 year Carbon Monoxide 30 ppm 13 ppm Hydrogen Sulphide 11 ppb 3.5 ppb Nitrogen Dioxide 210 ppb 105 ppb 120 µg/m 3 Sulphur Dioxide* 339 ppb 113 ppb 23 ppb Total Suspended Particulate 120 µg/m 3 70 µg/m 3 * The standard for sulphur dioxide is 50% lower in Saint John, Charlotte, and Kings counties. As indicated below, there were very few instances of non-compliance with the regulated standards in Please see the analysis provided on page 8 to see how current air quality results compare to historic values. Compliance Statistics for 2011 Parameter Number of Exceedances Location/Notes Carbon Monoxide 0 Hydrogen Sulphide (as Total Reduced Sulphur) 68* Nitrogen Dioxide 0 Sulphur Dioxide* 6 10 exceedances of the one-hour objective were observed in Saint John, primarily at the stations monitoring the Irving Oil Refinery and Irving Pulp and Paper. These 10 events resulted in 58 exceedances of the 24-hour objective, which uses a rolling average calculation. 3 exceedances of the 1-hour objective were detected in Saint John at the Grandview Avenue monitoring station, and 3 exceedances of the 1-hour objective were detected in Belledune. Total Suspended Particulate 1 One exceedance was detected in Belledune. * One additional exceedance was detected during a special mobile monitoring study in Atholville. See page 12. 7
 are positively impacting long-term air quality.")

9 Long Term Air Quality Improvement In addition to examining current air quality, it is also informative to consider how air quality may be changing over the years, and whether emission control measures that have been applied to industrial operations and consumer products (notably vehicles and fuel) are positively impacting long-term air quality. As shown in the table to the right, New Brunswick has been successful in reducing ambient concentrations of many key pollutants in recent years. The pollutants that have not followed the trend are carbon monoxide, which occurs at near background concentrations throughout the province, and ozone, which comes to us mostly from areas outside New Brunswick. Canada-wide Standards In 2000, the Canadian Council of Ministers of Environment (CCME) developed a statistical approach for tracking long-term trends for particulate matter and ground level ozone. These Canada-wide Standards (CWS) do not rely on a simple averaging of data, but rather apply a more sophisticated analysis that focuses on some of the worst air quality days experienced at a Pollutant Percent Change Sulphur Dioxide (SO 2 ) 87% Nitrogen Dioxide (NO 2 ) 43% Particulate Matter (PM 2.5 ) 17% Total Reduced Sulphur (TRS) 4% Ozone (O 3 ) Carbon Monoxide (CO) No Change No Change Ambient concentration trends for key pollutants at urban sites (based on amalgamated annual averages for Saint John, Fredericton, Moncton and Bathurst). given site (specifically, the 98 th percentile day for fine particulate matter, and the fourth worst day for ground level ozone), averaged over a three year period. The CWS came into effect in As illustrated below, New Brunswick is maintaining CWS compliance at all reporting sites. Ground Level Ozone (O 3 ) Canada-wide Standard (ppb) Particulate Matter (PM 2.5 ) Canada-wide Standard (ug/m 3 ) 53 N 18 N 52 Bathurst Edmundston Bathurst St. Léonard Lower Newcastle 53 Canterbury 52 Saint Andrews 51 Fredericton Moncton Norton 53 Fundy National 58 Park Saint John Point Lepreau Canada-wide Standard 65 ppb Canterbury 16 Moncton 16 Fredericton 18 Saint John Saint Andrews Canada-wide Standard 30 µg/m 3 8
, by a variety of industrial processes, and through combustion.")
 hydrocarbon molecule.")
, and combustion.")


10 Volatile Organic Compounds in the Saint John Region Volatile Organic Compounds (VOCs) is the name given to a large group of carbon-containing chemicals. Some VOCs are gases, others are liquids that readily evaporate. They are produced by evaporation of solvents (e.g., paint thinner and gasoline), by a variety of industrial processes, and through combustion. VOCs are important to monitor because they can impact ground level ozone levels and contribute to smog. Also, some VOCs carry potential human health Key Pollutant: Benzene Benzene is one of the key VOCs that is monitored in Saint John. It is an aromatic (i.e., shaped as a ring) hydrocarbon molecule. It is colourless, very flammable, and is described by some as smelling sweet. Exposure to benzene can cause a variety of health problems, and reducing exposure is a national and international concern. Major sources of benzene include evaporation from petroleum products (especially gasoline), and combustion. There is a notable difference in benzene levels between the two VOC monitoring sites in Saint John. However, there has been a marked improvement at Champlain Heights over the past three years. SUMMA Canisters for sampling VOCs. impacts. Some VOCs are useful as indicators of certain kinds of industrial activity, and some are of interest to climatologists. It should also be noted that some VOCs are generated naturally by various plants and animals. VOCs have been monitored in the Saint John region since Within the city, VOC data is being collected in Forest Hills and Champlain Heights. Background reference data is also being collected at Point Lepreau. All samples are analyzed for more than 150 compounds. Unlike the other parameters in the provincial network, VOCs are not monitored continuously. Rather, air samples are periodically collected in stainless steel canisters, which are shipped to a laboratory for analysis. As a consequence, there can be a significant delay between sample collection and availability of data. Note: the black error bars on the graph represent the Standard Error of the average. This is a statistical tool meant to illustrate the variability of the data that contributed to each average value. Wider error bars indicate a larger amount of variability. As New Brunswick does not typically experience high ambient benzene concentrations, no provincial ambient air quality standard has been developed for this pollutant. Similarly, there is no national air quality standard for benzene in Canada. However, in lieu of a local standard, results can be compared against standards that have been adopted elsewhere in the world. Illustrated below, the Saint John results have been compared against Sweden s national standard, which is the most stringent currently available. Levels at both Saint John sites remain low. Average Ambient Benzene Concentration (PPB) ± Standard Error Benzene Levels in the Saint John Region Swedish National Standard (1.5 ppb) Champlain Heights Forest Hills Point Lepreau 9


11 Getting Air Quality Information - When You Need It Although daily fluctuations in ambient pollution levels may pass unnoticed by many, for people with reduced lung function from respiratory disease and other types of environmental sensitivity, such changes can have significant impacts on their daily lives. Recognizing this, tools have been developed to provide timely information to the public about current and forecasted pollution levels in different areas of the province. Air Quality Advisories Using DELG data, Environment Canada prepares and disseminates daily pollution forecasts. When forecast data indicate that air quality objectives will be exceeded or closely approached, air quality and health advisories are issued to the media to provide advance notice to the public. In 2011, only one forecast advisory was issued. It was for the southern half of the province. However, the forecasted levels did not occur and the advisory was cancelled IQUA and AQHI Coverage N Air Quality Indices Index of the Quality of the Air (IQUA) The IQUA (also known as the Air Quality Index - AQI) system has been used in New Brunswick since The purpose of the index is to help make air quality monitoring results easier to communicate and understand. Data for key pollutants are converted into a scale value that ranges from , and classed as good (index 0 to 25), fair (26 to 50), poor (51 to 100) or very poor (over 100). The air quality is then categorized based on the highest value. Current IQUA information is available via the DELG web site: Air Quality Health Index (AQHI) The AQHI, which was first introduced in New Brunswick in 2008, offers an alternative approach to describing air quality conditions. Developed in Canada, this national index focuses on the relationship between air quality conditions and associated health risks. The index is based on the three key health-related pollutants: nitrogen dioxide (NO 2 ), ozone (O 3 ), and fine particulate matter (PM 2.5 ). It uses a scale of 1-10+, with higher values representing greater health risks and the need to take precautions. Additional information about the AQHI is available via the following Department of Health website: St. Léonard LEGEND IQUA AQHI Canterbury Lower Newcastle Moncton Fredericton Blissville Norton Fundy National Park Saint John Saint Andrews Point Lepreau In 2011 the AQHI was available in Fredericton, Moncton, and Saint John. Additional sites are being added over time. Current AQHI information is available via the following national websites: or AQHI information is also made available through The Weather Network, and via a Smartphone App. For the overwhelming majority of 2011 (>97% of the time) air quality was in the good/low IQUA and AQHI categories at all stations. 10

12 Acid Rain Monitoring Some air pollutants (especially SO 2 ) can be transformed in the atmosphere into acidic particles that ultimately fall out as acid rain (or snow, hail, etc). The emissions that cause acid rain typically travel long distances, hundreds or even thousands of kilometers, before returning to the surface as rain or snow. The adverse impacts of acid rain have been recognized since the early 1980s. Acid rain harms sensitive ecosystems by changing the chemistry of lakes, streams, and forest soils. It can also damage trees and agriculturally important plants. Infrastructure is also impacted by acid rain, as it can degrade paints and protective coatings, which accelerates corrosion Acid Precipitation Network Map St. Maure Robertville Nictau Trout Brook Holtville Harcourt Canterbury Coles Island N Measures to reduce emissions that contribute to acid rain have been undertaken in North America since the late 1980s. Most recently, this has included commitments to reduce emissions under the Canadian Council of Ministers of Environment s Post-2000 Canada-wide Acid Rain Strategy. Over the past two decades SO 2 emissions from major sources within New Brunswick have been reduced significantly. South Oromocto Lake Pennfield LEGEND Monitoring Station Saint John Fundy National Park In an effort to track the results of our pollution reduction efforts, DELG has operated an extensive acid precipitation (rain and snow) monitoring network in cooperation with NB Power since the early 1980s. The above map shows the location of the 12 acid precipitation monitoring sites in New Brunswick. Samples are collected at each of these sites by a local site operator every day, and sent to the DELG laboratory for analysis. DELG staff coordinate the monitoring program, perform data quality assurance, and maintain the official data archive. Mean Sulphate Concentration (mg/l) Network-wide Average Sulphate Concentration in Precipitation New Brunswick, Number of Monitoring Sites As reflected in the chart to the left, emission reduction strategies have significantly reduced sulphate concentrations in precipitation over the past 25 years. Although levels have declined, the acid rain issue remains important for New Brunswick because some sensitive areas are still being impacted. As a result, continued efforts to reduce emissions are required to reduce acid deposition further and ensure that our most sensitive lakes and rivers are provided with long-term protection from acid damage. 11

13 Special Study: Mobile Air Quality Monitoring in Atholville In addition to the fixed network of permanent air quality monitoring stations, DELG operates a mobile air quality monitoring unit that can be moved from place to place to carry out special monitoring projects. In 2011 the unit was deployed to Atholville to an area just south of the AV Cell pulp mill. AV Cell is required to operate two permanent air quality monitoring stations nearby. The purpose of the DELG project was to verify that these two stations are suitably located to detect pollution impacts from the mill. The study began in August 2011 and lasted three months. Study Parameters The DELG mobile air quality monitoring unit (pictured right) was used for the study. The unit was equipped with monitors for: Wind speed Wind direction Ground level ozone Carbon monoxide Sulphur dioxide Nitrogen dioxide Fine particulate matter Total Reduced Sulphur Findings DELG s mobile air quality monitoring unit in Atholville, NB. By analyzing the wind patterns measured during the study it was confirmed that the existing monitoring sites for the AV Cell pulp mill are appropriately placed, with prevailing winds tending to carry air contaminant emissions toward the stations. Air quality in Atholville was found to be generally good for all parameters monitored. However, one incident of elevated Total Reduced Sulphur (TRS) was detected on August 19, 2011 (see graph, right). TRS compounds are not a health hazard at these concentrations. They do, however, cause nuisance odours. Investigations carried out immediately following the TRS event revealed the source to be a stockpile of organic waste material (sludge) at the mill. The material had been allowed to sit for too long in the mill yard and had begun to decompose and generate the gases. AV Cell has since committed to ensuring that sludge is transported offsite in a more timely manner. Total Reduced Sulphur One-Hour Average - Parts Per Billion (ppb) Aug Aug-11 Total Reduced Sulphur - Atholville 25-Aug-11 1-Sep-11 8-Sep Sep Sep Sep-11 6-Oct Oct-11 Air Quality Standard (11 ppb) 20-Oct Oct-11 3-Nov Nov Nov Nov-11 1-Dec-11 Additional information can be found in the Atholville Air Quality Report, which is available on the DELG website: 12

14 Conclusion As reflected in this report, air quality in New Brunswick is very good, and the province continues to benefit from air pollution reduction initiatives that have been implemented over the past decade. The New Brunswick Department of Environment and Local Government remains committed to air quality surveillance throughout the province, and comprehensively reporting air quality information to New Brunswickers in a timely manner. Learn More about Air Quality In addition to this overview, complete site-specific monitoring results are available in the Air Quality Monitoring Results - Supplementary Data 2011 companion document, which is available electronically via the DELG website: Feedback... We are interested in your feedback on this report. All suggestions will be considered, and if possible, incorporated in future reports. Please forward any comments to: State of the Environment Branch, Department of Environment and Local Government (DELG) phone: (506) fax: (506) darrell.welles@gnb.ca Department of Environment and Local Government Environmental Reporting Series
New Brunswick Department of Environment and Local Government. Air Quality Monitoring Results
 New Brunswick Department of Environment and Local Government Air Quality Monitoring Results 205 A Contents Air Quality Monitoring in New Brunswick 2 What We Measure 2 Understanding Air Pollution 3 Provincial
Atholville Air Quality Report Mobile Air Quality Monitoring Program
 Atholville Air Quality Report 2011 Mobile Air Quality Monitoring Program Department of Environment and Local Government June 2012 1.0 Executive Summary The AV Cell Pulp Mill operates two air quality monitoring
MacAleese Lane Air Quality Report Monitoring Program
 MacAleese Lane Air Quality Report 2009 Monitoring Program Department of Environment April 2010 MacAleese Lane Air Quality Report 2009 Monitoring Program Introduction In February of 2009, the New Brunswick
New Brunswick Air Quality Monitoring Results
 New Brunswick Air Quality Monitoring Results 21 Environmental Reporting Series Department of Environment and Local Government 212 NEW BRUNSWICK AIR QUALITY MONITORING RESULTS 21 New Brunswick Environmental
REPORT for New Brunswick. Air Quality. Monitoring Results. Environmental Reporting Series
 REPORT for 2009 New Brunswick Air Quality Monitoring Results Environmental Reporting Series NEW BRUNSWICK AIR QUALITY MONITORING RESULTS FOR THE YEAR 2009 New Brunswick Environmental Reporting Series State
2016 Nitrogen Dioxide Summary
 2016 Nitrogen Dioxide Summary New Jersey Department of Environmental Protection SOURCES Nitrogen dioxide (NO2) is a reddish-brown highly reactive gas that is formed in the air through the oxidation of
GE 2211 Environmental Science and Engineering Unit III Air Pollution. M. Subramanian
 GE 2211 Environmental Science and Engineering Unit III Air Pollution M. Subramanian Assistant Professor Department of Chemical Engineering Sri Sivasubramaniya Nadar College of Engineering Kalavakkam 603
Introduction. Facts. Key Words. Sulphur Dioxide (SO 2 ), Air Quality In Lambton County:
, Air Quality In Lambton County:") onitoring Air Quality in Lambton County This monograph, one in a series of single issue documents dealing with Lambton County environment, has been prepared by the Sarnia-Lambton Environmental Association
onitoring Air Quality in Lambton County This monograph, one in a series of single issue documents dealing with Lambton County environment, has been prepared by the Sarnia-Lambton Environmental Association
Nova Scotia Air Zone Report. Nova Scotia Air Quality Unit, 2015
 Nova Scotia Air Zone Report Nova Scotia Air Quality Unit, 2015 Acronyms AQHI Air Quality Health Index AQMS Air Quality Management System AQU Nova Scotia Environment s Air Quality Unit CAAQS Canadian Ambient
Air Quality in New Brunswick
 An Introduction to Air Quality in New Brunswick Environment and Local Government An Introduction to Air Quality in New Brunswick Introduction... 2 The Air We Breathe... 3 What Affects Air Quality?... 3
CANADA-WIDE STANDARDS FOR PM & OZONE STATUS OF JURISDICTIONAL IMPLEMENTATION ACTIVITIES MANITOBA
 CANADA-WIDE STANDARDS FOR PM & OZONE STATUS OF JURISDICTIONAL IMPLEMENTATION ACTIVITIES MANITOBA I. INTRODUCTION Manitoba has only one Census Metropolitan Area (CMA) (i.e., Winnipeg with 6% of Manitoba
Report to the Canadian Council of Ministers of the Environment: An Update in Support of the Canada-wide Standards for Particulate Matter and Ozone
 Report to the Canadian Council of Ministers of the Environment: An Update in Support of the Canada-wide Standards for Particulate Matter and Ozone Prepared by the Joint Action Implementation Coordinating
FACILITY PROFILE. New Brunswick Power Corporation for the Belledune Thermal Generating Station
 FACILITY PROFILE New Brunswick Power Corporation for the Belledune Thermal Generating Station Prepared by: Industrial Processes Section, Impact Management Branch Department of Environment and Local Government
The Threat of Air Pollution
 Chapter 13: Air Pollution The Atmosphere: An Introduction to Meteorology, 12 th Lutgens Tarbuck Lectures by: Heather Gallacher, Cleveland State University The Threat of Air Pollution The Threat of Air
Ambient Air Quality in Nova Scotia
 Ambient Air Quality in Nova Scotia Science Forum on Air Quality March 8, 2006 Fran Di Cesare, Data Manager Air Quality Branch, Nova Scotia Environment and Labour What is the quality of the air in Nova
Clean Air Act of 1970
 Clean Air Act of 1970 Set National Ambient Air Quality Standards (NAAQS), to protect public health and welfare Set New Source Performance Standards (NSPS), that strictly regulated emissions of a new source
Layers of the Atmosphere. Troposphere Stratosphere Mesosphere Thermosphere
 Air Pollution Layers of the Atmosphere Troposphere Stratosphere Mesosphere Thermosphere Troposphere Composition Sea level 17km Composition 78% Nitrogen 20% Oxygen Other 2%... Water vapor Argon gas Carbon
Example Airshed. Sample 2018 Annual Ambient Air Quality Monitoring Report
 Example Airshed Sample 2018 Annual Ambient Air Quality Monitoring Report 29 March 2019 DISCLAIMER: This sample annual report is provided as guidance only. The structure, look and layout of monthly and
Ambient Air Quality Basics. NSEL Air Quality Forum 2006 Johnny McPherson, Air Quality Technologist
 Ambient Air Quality Basics NSEL Air Quality Forum 2006 Johnny McPherson, Air Quality Technologist Chemistry basics; Atmospheric structure and processes; Pollution source, transformation, and fate; Monitoring.
Primary Environmental Indicators
 Primary Environmental Indicators 1 Air Quality Regulations designed to improve air quality target six main pollutants: sulphur dioxide (SO 2 ), nitrogen dioxide (NO 2 ), ground level ozone (O 3 ), carbon
Northeast Air Quality Monitoring Assessment: Analysis of Results
 Northeast Air Quality Monitoring Assessment: Analysis of Results Prepared by Eric Taylor Air Quality Meteorologist BC Ministry of Environment December 21, 2017 1 2 Executive Summary Government and industry
2012 Nitrogen Dioxide Summary
 2012 Nitrogen Dioxide Summary New Jersey Department of Environmental Protection NATURE AND SOURCES Nitrogen Dioxide (NO 2 ) is a reddishbrown, highly reactive gas that is formed in the air through the
1. The layer that contains most of the mass of the atmosphere is the. A. Stratosphere B. Troposphere C. Mesosphere D. Exosphere
 1. The layer that contains most of the mass of the atmosphere is the A. Stratosphere B. Troposphere C. Mesosphere D. Exosphere 2. Which of the following is a secondary pollutant? A. H 2 SO 4 B. O 3 C.
2015 Provincial Summary Report
 2015 Provincial Summary Report Achievement Status on the Canadian Ambient Air Quality Standards (CAAQS) for Fine Particulate Matter (PM 2.5 ) and Ozone January 2016 Page 1 of 16 Overview This is the first
Air Pollution. Introduction. Natural Air Pollution
 Air Pollution Introduction Anything in the atmosphere that decreases quality of life for organisms Can be chemical, particulate, biological Generally restricted to the troposphere Both natural and anthropogenic
Chapter 15 Air Pollution and Stratospheric Ozone Depletion
 Chapter 15 Air Pollution and Stratospheric Ozone Depletion Friedland and Relyea Environmental Science for AP, second edition 2015 W.H. Freeman and Company/BFW AP is a trademark registered and/or owned
Major Air Pollutants
 Major Air Pollutants 1 Particulate Matter Particulate refers to all substances that are not gases. It can be suspended droplets / solid particles / mixture of two. Size: 100 µm to 0.1 µm and less. Particulates
Air pollution is caused by high concentrations of gases and particles emitted form combustion sources (vehicles, power plants, industries)
") AIR POLLUTION Clean Air Act & Criteria Pollutants 7.1-7.5 Motor Vehicle Emissions: 7.8 Indoor Air and Box Models: 7.12 Air Pollution Meteorology: 7.10 Gaussian Plume Modeling: 7.11 1 Air pollution is caused
AIR POLLUTION Clean Air Act & Criteria Pollutants 7.1-7.5 Motor Vehicle Emissions: 7.8 Indoor Air and Box Models: 7.12 Air Pollution Meteorology: 7.10 Gaussian Plume Modeling: 7.11 1 Air pollution is caused
Particulate Matter Air Pollution and Health Risks ( edited for AHS APES)
") Particulate Matter Air Pollution and Health Risks ( edited for AHS APES) What is Particulate Matter? Image from http://www.epa.gov/eogapti1/ module3/distribu/distribu.htm Particulate matter (PM) describes
Particulate Matter Air Pollution and Health Risks ( edited for AHS APES) What is Particulate Matter? Image from http://www.epa.gov/eogapti1/ module3/distribu/distribu.htm Particulate matter (PM) describes
CHAPTER 2 - Air Quality Trends and Comparisons
 CHAPTER 2 - Air Quality Trends and Comparisons Particulate Sampling Total Suspended Particulate Matter With the monitoring for PM 2.5 particulate matter being labor intensive, DEP reduced the number of
Sulfur oxides (SO x ) - particularly sulfur dioxide, a chemical compound with the formula SO 2. SO 2 is produced by volcanoes and in various
 - particularly sulfur dioxide, a chemical compound with the formula SO 2. SO 2 is produced by volcanoes and in various") AIR CANCER Sulfur oxides (SO x ) - particularly sulfur dioxide, a chemical compound with the formula SO 2. SO 2 is produced by volcanoes and in various industrial processes. Coal and petroleum often
AIR CANCER Sulfur oxides (SO x ) - particularly sulfur dioxide, a chemical compound with the formula SO 2. SO 2 is produced by volcanoes and in various industrial processes. Coal and petroleum often
Fraser Valley Regional District Highlights of Air Quality and Emissions Trends ( )
") Fraser Valley Regional District Highlights of Air Quality and Emissions Trends (199-213) May 215 Table of Contents List of Figures... 2 Purpose... 3 Summary... 3 Background... 3 Criteria Air Contaminants...
Fraser Valley Regional District Highlights of Air Quality and Emissions Trends (199-213) May 215 Table of Contents List of Figures... 2 Purpose... 3 Summary... 3 Background... 3 Criteria Air Contaminants...
Frumkin, 2e Part Three: Environmental Health on the Regional Scale. Chapter 12: Air Pollution
 Frumkin, 2e Part Three: Environmental Health on the Regional Scale Chapter 12: Air Pollution History of Air Pollution Since human beings discovered fire, they began to pollute the air. At first, air pollution
Criteria Pollutants. Sulfur Dioxide (SO 2 ) Nitrogen Oxides (NOx)
 Nitrogen Oxides (NOx)") 1) Sulfur dioxide 2) Nitrogen oxides 3) Carbon monoxide 4) Ozone 5) Particulates 6) Lead Criteria Pollutants Sulfur Dioxide (SO 2 ) SO 2 is a colorless gas that is formed from the combustion of sulfur-containing
1) Sulfur dioxide 2) Nitrogen oxides 3) Carbon monoxide 4) Ozone 5) Particulates 6) Lead Criteria Pollutants Sulfur Dioxide (SO 2 ) SO 2 is a colorless gas that is formed from the combustion of sulfur-containing
Introduction. Fluvial Geomorphology Hydrogeology. to minimize the consumption of paper resources.
 Duffins Creek and Carruthers Creek State of the Watershed Reports Air Quality June 2002 Other topics in this series for both the Duffins Creek and the Carruthers Creek include: Introduction Study Area
Air Quality Evaluation Amos Street - Sainte-Anne, New Brunswick. Final Report
 Air Quality Evaluation Amos Street - Sainte-Anne, New Brunswick Final Report Department of Environment and Local Government January 2016 Report prepared by: Darrell Welles, MSc. Kathryn Turner, MSc. Air
Spokane Regional Clean Air Agency Air Quality Report - August 2015
 Spokane Regional Clean Air Agency Air Quality Report - August 2015 Wildfire smoke pushed the Air Quality Index (AQI) for fine particulate matter (PM 2.5 ) well into the unhealthy (red) air quality range.
City of Saskatoon Air Quality Monitoring Survey
 City of Saskatoon Air Quality Monitoring Survey May 10, 2017 Chris Gray Environmental Protection Branch Saskatchewan Ministry of Environment Background Proposal was put forward in May 2014 for Monitoring
2010 Sulfur Dioxide Summary
 2010 Sulfur Dioxide Summary New Jersey Department of Environmental Protection NATURE AND SOURCES Sulfur dioxide (SO 2 ) is a heavy, colorless gas with a suffocating odor that easily dissolves in water
Internal Combustion Engines
 Emissions & Air Pollution Lecture 1 1 Outline In this lecture we will introduce the three major regulated gaseous pollutants produced by I.C. engines: Carbon Monoxide (CO) Unburned Hyrocarbons (HC) Nitrogen
CE 213A Introduction to Environmental Science
 CE 213A Introduction to Environmental Science Module D Air Pollution Dr. Anubha Goel FB 308, anubha@iitk.ac.in, x 7027 Nazaroff, Ch. 7 Air Pollution 2 Key Concepts Structure and composition of the atmosphere
Ambient Air Quality Monitoring Update, Kirby Misperton A Wellsite, KM8 Production Well
 Ambient Air Quality Monitoring Update, Kirby Misperton A Wellsite, KM8 Production Well. Prepared for: Third Energy UK Gas Ltd. Document Control Page Client Third Energy UK Gas Ltd. Document Title Ambient
Air Pollution. GEOL 1350: Introduction To Meteorology
 Air Pollution GEOL 1350: Introduction To Meteorology 1 Overview Types and Sources of Air Pollutants Factors That Affect Air Pollution Air Pollution and the Urban Environment 2 Air pollutants are airborne
Atmospheric Chemistry Air Pollution
 Atmospheric Chemistry Pontus Roldin Div. Nuclear Physics Dep. Physics Lund University Conflict between positive climate cooling effects and negative human health effects Are there good aerosol particles
Spokane Regional Clean Air Agency Air Quality Report - September 2011
 Spokane Regional Clean Air Agency Air Quality Report - September 211 An atmospheric high pressure ridge brought exceptionally warm, sunny and dry weather, light winds and marginal to poor ventilation to
PRINCE EDWARD ISLAND Air Quality Report For the Years
 PRINCE EDWARD ISLAND 2014 Air Quality Report For the Years 2011-2013 September, 2016 1.0 INTRODUCTION The Air Quality Management System (AQMS) was endorsed by the Canadian Council of Ministers of the Environment
Jennings O Donovan & Partners Consulting Engineers Sligo
 8.0 AIR QUALITY 8.1 INTRODUCTION 8.1.1 Background Despite the ongoing deterioration in air quality on a national level due to the reliance on fossil fuel generated energy, Ireland as a whole is relatively
Overview of Chapter 19
 19 Air Pollution Overview of Chapter 19 Atmosphere as a Resource Types and Sources of Air Pollution Effects of Air Pollution Controlling Air Pollution in the US Ozone Depletion in the Stratosphere Acid
Earth s Atmosphere. Air Quality. 7. If no humans lived on Earth, there would be no air pollution.
 CHAPTER 4 LESSON 4 Earth s Atmosphere Air Quality Key Concepts How do humans impact air quality? Why do humans monitor air quality standards? What do you think? Read the two statements below and decide
Spokane Regional Clean Air Agency Air Quality Report - September 2013
 Spokane Regional Clean Air Agency Air Quality Report - September 2013 September began with a high pressure ridge over the region and rising levels of fine particulate matter (PM 2.5 ) in Spokane. An approaching
Air Quality Monitoring
 Air Quality Monitoring in the vicinity of a CNRL well blowout February 25, 2010 to March 9, 2010 Summary report Overview All monitoring sites were downwind of the Canadian Natural Resources Limited (CNRL)
PRODUCTS OF COMBUSTION
 PRODUCTS OF COMBUSTION Some of the fuel (hydrocarbon) may not completely burn during combustion and therefore is released into the atmosphere along with the products. The products that are formed during
AIR MANAGEMENT IN ALBERTA
 AIR MANAGEMENT IN ALBERTA Air Management In Alberta Alberta Environment January 2009 ISBN No. 978-0-7785-8088-1 (Printed) ISBN No. 978-0-7785-8089-8 (On-line) Web Site: http://www.environment.alberta.ca/
Spokane Regional Clean Air Agency Air Quality Report - July 2014
 Spokane Regional Clean Air Agency Air Quality Report - July 2014 July and August are the hottest and driest months in the Pacific Northwest and, in addition to September, are the most active in terms of
Air Quality Program
 M E D I A PA C K A G E Air Quality Program www.broward.org/pollutionprevention/airquality Agency Overview: Table of Contents Agency Overview 2 Did You Know? 3 Criteria Air Pollutants 4 Air Quality Index
Page 2. Q1.Greenhouse gases affect the temperature of the Earth. Which gas is a greenhouse gas? Tick one box. Argon. Methane. Nitrogen.
 Q1.Greenhouse gases affect the temperature of the Earth. (a) Which gas is a greenhouse gas? Tick one box. Argon Methane Nitrogen Oxygen (b) An increase in global temperature will cause climate change.
PARTICULATE MATTER AND OZONE MANAGEMENT FACT SHEET ( )
") PARTICULATE MATTER AND OZONE MANAGEMENT FACT SHEET (2010 2012) April 2014 What is PM 2.5? Particulate matter can be emitted by any combustion source. PM 2.5 is fine particulate matter less than 2.5 micrometres
PARTICULATE MATTER AND OZONE MANAGEMENT FACT SHEET (2010 2012) April 2014 What is PM 2.5? Particulate matter can be emitted by any combustion source. PM 2.5 is fine particulate matter less than 2.5 micrometres
2010 AIR POLLUTION CONTROL
 1 AIR POLLUTION CONTROL Monitoring Report for Lake and Geauga Counties Lake County General Health District 33 Mill Street Painesville, Ohio 4477 Table of Contents INTRODUCTION... 1 STATE AND FEDERAL AIR
Thermodynamics: An Engineering Approach, 6 th Edition Yunus A. Cengel, Michael A. Boles McGraw-Hill, 2008
 Thermodynamics: An Engineering Approach, 6 th Edition Yunus A. Cengel, Michael A. Boles McGraw-Hill, 2008 Chapter 2 ENERGY, ENERGY TRANSFER, AND GENERAL ENERGY ANALYSIS SUMMARY DR. MUNZER EBAID Dr. Munzer
Final Revisions to the Primary National Ambient Air Quality Standard for Nitrogen Dioxide (NO 2 )
") Final Revisions to the Primary National Ambient Air Quality Standard for Nitrogen Dioxide (NO 2 ) General Overview Office of Air and Radiation Office of Air Quality Planning and Standards January 2010
Final Revisions to the Primary National Ambient Air Quality Standard for Nitrogen Dioxide (NO 2 ) General Overview Office of Air and Radiation Office of Air Quality Planning and Standards January 2010
Air Pollution. tutorial by Paul Rich. Brooks/Cole Publishing Company / ITP
 Air Pollution tutorial by Paul Rich Outline 1. The Atmosphere layers, some major processes 2. Urban Air Pollution photochemical & industrial smog 3. Regional Air Pollution from Acid Deposition acid deposition,
MEDIA PACKAGE. Pollution Prevention, Remediation and Air Quality Division
 MEDIA PACKAGE Pollution Prevention, Remediation and Air Quality Division www.broward.org/pollutionprevention Agency Overview: Broward County is located within the United States Environmental Protection
OUR NATION'S AIR STATUS AND TRENDS THROUGH 2015 WELCOME!
 Page 1 of 14 OUR NATION'S AIR STATUS AND TRENDS THROUGH 2015 WELCOME! The U.S. Environmental Protection Agency (EPA) is committed to protecting public health by improving air quality and reducing air pollution.
FACILITY PROFILE J. D. IRVING, LIMITED - LAKE UTOPIA PAPER
 FACILITY PROFILE J. D. IRVING, LIMITED - LAKE UTOPIA PAPER Prepared by: Impact Management Branch Community Planning and Environmental Protection Division Department of Environment and Local Government
New Brunswick Air Quality Monitoring Results
 R E P O R T f o r 2 6 New Brunswick Air Quality Monitoring Results Environmental Reporting Series NEW BRUNSWICK AIR QUALITY MONITORING RESULTS FOR THE YEAR 26 Technical Report T-28-1 Sciences and Reporting
History of significant air pollution events
 Ch17 Air Pollution A thick layer of smoke and haze covers Santiago, Chile. History of significant air pollution events Many of the worst air pollution episodes occurred in the last two centuries in London
Spokane Regional Clean Air Agency Air Quality Report - January 2012
 Spokane Regional Clean Air Agency Air Quality Report - January 2012 Air quality in January varied as weather systems moved through the region at regular intervals. Storms on January 5, 10 and 14 helped
Do Now pg 89. List 3 ways you think air pollution affects human health
 Do Now pg 89 List 3 ways you think air pollution affects human health Lesson 15.2 Pollution of the Atmosphere Types of Air Pollutants Primary air pollutants: Released directly into the atmosphere; example:
Northwest Territories Air Quality Report
 Northwest Territories Air Quality Report 2014 Table of Contents Introduction... 1 Operations (Network)... 2 Developments in 2014... 6 Future Plans... 7 NWT Air Quality Standards... 8 Yellowknife Air Quality...
CE 326 Principles of Environmental Engineering Prof. Tim Ellis
 AIR POLLUTION CE 326 Principles of Environmental Engineering Prof. Tim Ellis January 25, 2008 Seven Major Pollutants of Concern 1. P 2. S Oxides (SO X ) 3. O 4. N Oxides (NO X ) 5. Carbon M (CO and other
PRINCE EDWARD ISLAND Air Quality Report For the Years
 PRINCE EDWARD ISLAND 2014 Air Quality Report For the Years 2011-2013 September, 2016 PRINCE EDWARD ISLAND 2014 Air Quality Report For the Years 2011-2013 September 2016 Department of Communities, Land
Chemistry in the Environment: The Clean Air Game
 LESSON PLAN ~Chemistry, Grade 12, College Preparation~ Chemistry in the Environment: The Clean Air Game -created by Lynn Perreault, Ph.D. (for Idle-Free Windsor) Date: School: Time: Teacher: Special Instructions:
Ambient Air Monitoring. Wexford. 10 th March st March 2006
 Ambient Air Monitoring In Wexford 10 th March 2005 31 st March 2006 Contents Summary....... 3 Introduction........ 4 Time Period........ 5 Siting......... 5 Monitoring Methods....... 6 Results.........
Water and air, the two essential fluids on which all life depends, have become global garbage cans. Jacques-Yves Cousteau
 Water and air, the two essential fluids on which all life depends, have become global garbage cans. Jacques-Yves Cousteau YouTube link: https://www.youtube.com/watch?v=utdkrvwc1yq We could live about a
The Evolution of Air Emissions Inventories in Ontario, Canada
 The Evolution of Air Emissions Inventories in Ontario, Canada John Georgakopoulos, Peter Wong and Nicholas Ting Ontario Ministry of the Environment, Environmental Monitoring and Reporting Branch, 125 Resources
Upper Athabasca Region Air Zone Canadian Ambient Air Quality Standards Response Government of Alberta Action Plan
 Upper Athabasca Region Air Zone Canadian Ambient Air Quality Standards Response Government of Alberta Plan September 2017 Any comments or questions regarding the content of this document may be directed
Delta Air Quality Monitoring Study June 2004 March 2006
 Delta Air Quality Monitoring Study June 2004 March 2006 Air Quality Policy and Management Division Policy and Planning Department Greater Vancouver Regional District: August, 2006 Table of Contents Executive
Lecture 17. Air Pollution. Lecture 17
 Lecture 17 Air Pollution Lecture 17 1. Atmosphere Origin 2. Atmosphere as a Resource 3. Types and Sources of Air Pollution 4. Effects of Air Pollution 5. Controlling Air Pollution 6. Ozone Depletion in
Oregon. 800 NE Oregon St. #640 Portland, OR (971)
") Air Quality Frequently Asked Questions Oregon Environmental Public Health Tracking (EPHT) Oregon ENVIRONMENTAL PUBLIC HEALTH TRACKING 800 NE Oregon St. #640 Portland, OR 97232 www.oregon.gov/dhs/ph/epht
Air Quality Frequently Asked Questions Oregon Environmental Public Health Tracking (EPHT) Oregon ENVIRONMENTAL PUBLIC HEALTH TRACKING 800 NE Oregon St. #640 Portland, OR 97232 www.oregon.gov/dhs/ph/epht
MODULE I. Learning Objectives
 MODULE I Learning Objectives To make the students aware of history of air pollution; definition of air pollution and various types of sources and classification of air pollutants. Lecture 1 Lecture 2 Lecture
Going One Step Beyond in North Denver
 Going One Step Beyond in North Denver A Neighborhood Scale Air Pollution Modeling Assessment Part I : Predicted Mobile Emissions in 2035 Michael Ogletree Denver Environmental Health Purpose To compare
COMMONWEALTH OF PENNSYLVANIA DEPARTMENT OF ENVIRONMENTAL PROTECTION BUREAU OF AIR QUALITY AMBIENT AIR QUALITY MONITORING REPORT
 COMMONWEALTH OF PENNSYLVANIA DEPARTMENT OF ENVIRONMENTAL PROTECTION BUREAU OF AIR QUALITY 1998 AMBIENT AIR QUALITY MONITORING REPORT DIVISION OF AIR QUALITY MONITORING 400 MARKET STREET HARRISBURG, PA
Climate and Atmosphere-- United States
 Climate and Atmosphere-- United States EarthTrends Country Profiles United States North America Carbon Dioxide (CO2) Emissions {a} World (in thousand metric tons of CO2) Total Emissions, 1998 5,447,640
Fuzzy Logic for Design of Air Quality Analyser
 uzzy Logic for Design of Air Quality Analyser uzzy Logic for Design of Air Quality Analyser Manjeet Chemistry Department, BRCM CET, Bahal, M.D University, Rohtak, Haryana, India, E-mail: manjeetvijay@rediffmail.com.
Northwest Territories Air Quality Report 2015
 Northwest Territories Air Quality Report 2015 OF CONTENTS TABLE OF CONTENTS TABLE Introduction...1 Operations (Network...2 Developments in 2015...6 Future Plans...7 NWT Air Quality Standards...8 Yellowknife
EPA s Draft Report on the Environment 2003 Technical Document
 EPA s Draft Report on the Environment 23 Technical Document 1.1 Outdoor Air Quality Among the pollutants affecting outdoor air quality are: Criteria pollutants ozone (O 3 ), particulate matter (PM), sulfur
Lower Athabasca Region Air Zone Canadian Ambient Air Quality Standards Response Government of Alberta Action Plan
 Lower Athabasca Region Air Zone Canadian Ambient Air Quality Standards Response Government of Alberta Plan September 2017 Any comments or questions regarding the content of this document may be directed
2006 Sulfur Dioxide Summary
 2006 Sulfur Dioxide Summary New Jersey Department of Environmental Protection NATURE AND SOURCES Sulfur dioxide (SO 2 ) is a heavy, colorless gas with a suffocating odor that easily dissolves in water
2009 Regional Haze & Visibility Summary
 2009 Regional Haze & Visibility Summary New Jersey Department of Environmental Protection THE BASICS OF HAZE Haze is caused when sunlight encounters tiny pollution particles in the air. Some light is absorbed
2016 Sulfur Dioxide Summary
 2016 Sulfur Dioxide Summary New Jersey Department of Environmental Protection SOURCES Figure 7-1 2017 New Jersey SO 2 Projected Emissions Sulfur dioxide (SO2) is a heavy, colorless gas with a suffocating
Chapter 20 Air Pollution
 Chapter 20 Air Pollution Overview of Chapter 20 Atmosphere as a Resource Types and Sources of Air Pollution Effects of Air Pollution Controlling Air Pollution in the US Ozone Depletion in the Stratosphere
FOSSIL FUEL COMBUSTION:
 Science 30 Unit B Chemistry and the Environment Outcome 1: Students will analyze the sources of acids and bases and their effects on the environment. Specific Outcome 1.8: Outline the chemical reactions
Pollution Prevention, Remediation and Air Quality Division
 M E D I A PA C K A G E Pollution Prevention, Remediation and Air Quality Division www.broward.org/air Agency Overview: Table of Contents Agency Overview 2 Did You Know? 3 Criteria Air Pollutants 4 Air
ENERGY AND THE ENVIRONMENT Environmental Impacts
 ENERGY AND THE ENVIRONMENT Environmental Impacts Presented by Mr S. Mooloo, Ag Deputy Director Department of Environment MRC July 2006 Contents From Dirty to Clean fuel Environmental impacts International
Table 7 : Spatial Distribution of the Modeled PATS Pollutants. concentrations in defined zones
 4. Modeling Results 4.1 Overview of Modeling Results The PATS 2017 model allows DEQ and stakeholders to understand the regional distribution of air toxic concentrations, the significant source categories
Overview of Ambient Air Quality Monitoring in Singapore: Current Status
 Overview of Ambient Air Quality Monitoring in Singapore: Current Status Rajasekhar Balasubramanian Department of Civil & Environmental Engineering National University of Singapore Network of Ambient Air
Wildfires: Smoke Impacts and Public Health Protection
 Wildfires: Smoke Impacts and Public Health Protection Julie Hunter, Senior Air Quality Specialist Washoe County Health District, Air Quality Management Division Great Basin Climate Forum December 6, 2018
The atmosphere. The atmosphere is layered. Inversions affect air quality 3/2/2015. The sun influences weather and climate
 The atmosphere Chapter 13 Atmosphere Absorbs radiation and moderates climate Transports and recycles water and nutrients Human activity is now changing the amount of some gases CO 2, methane (CH 4 ), ozone
Northwest Territories Air Quality Report 2012
 Northwest Territories Air Quality Report 212 TABLE OF CONTENTS Introduction...3 Operations (Network...4 Developments in 212...8 Future Plans...9 NWT Air Quality Standards...1 Yellowknife Air Quality...12