2011 Amendment Cycle 1 Denver Southern Subarea 8-Hour Ozone Conformity Determination
|
|
|
- Sylvia Lawrence
- 5 years ago
- Views:
Transcription
1 2011 Amendment Cycle 1 Denver Southern Subarea 8-Hour Ozone Conformity Determination for the DRCOG Amended Fiscally Constrained 2035 Regional Transportation Plan and the Amended Transportation Improvement Program and the Southern Subarea Portion of the Upper Front Range 2035 Regional Transportation Plan and the State Transportation Improvement Program for the Upper Front Range Transportation Planning Region Denver Regional Council of Governments 1290 Broadway, Suite 700 Denver, CO Preparation of this report has been financed in part through grants from the U.S. Department of Transportation, Federal Transit Administration, and Federal Highway Administration
2 ii
3 ABSTRACT TITLE: 2011 Amendment Cycle 1 Denver Southern Subarea 8-Hour Ozone Conformity Determination for the DRCOG Amended Fiscally Constrained 2035 Regional Transportation Plan and the Amended Transportation Improvement Program and the Southern Subarea Portion of the Upper Front Range 2035 Regional Transportation Plan and the State Transportation Improvement Program for the Upper Front Range Transportation Planning Region AUTHORS: SUBJECT: Denver Regional Council of Governments Air quality conformity of the Denver region s and the Southern Subarea Portion of the Upper Front Range region s respective longrange transportation plans and short-range improvement programs DATE: Adopted August 17, 2011 SOURCE OF COPIES: Public Information and Communications Office DRCOG 1290 Broadway, Suite 700 Denver, CO (303) NUMBER OF PAGES: 79 ABSTRACT: Demonstration of the Southern Subarea of 8-hour ozone nonattainment area s meeting of federally prescribed air pollution emissions tests for the 8-hour ozone standard. iii
4 iv
5 TABLE OF CONTENTS CHAPTER 1. INTRODUCTION... 1 Background 8-Hour Ozone Nonattainment Area... 1 Federal Requirements... 2 Planning Organizations and the Memorandum of Agreement (MOA)... 4 Current Situation for the Denver Southern Subarea... 7 Process... 8 CHAPTER 2. IMPLEMENTATION OF CONTROL MEASURES CHAPTER 3. EMISSIONS TESTS General Description Budgets Analysis Years Technical Process Mobile Source Measures Emission Test Results APPENDIX A DRCOG TRANSPORTATION NETWORK ASSUMPTIONS APPENDIX B DRCOG TRANSPORTATION MODEL CALIBRATION DESCRIPTION APPENDIX C MODELING SUMMARY TABLES APPENDIX D MEMORANDUM OF AGREEMENT APPENDIX E U.S. DEPARTMENT OF TRANSPORTATION CONFORMITY FINDING (TO BE PROVIDED) APPENDIX F LIST OF ACRONYMS v
6 LIST OF TABLES Table 1 Population and Employment Forecasts DRCOG Ozone Modeling Southern Subarea Table and 2035 Population and Employment Estimates by County DRCOG Ozone Modeling Southern Subarea Table 3 Proposed 2011 Cycle 1 Amendments to the 2035 RTP Roadway System and Transit System Table 4 8-Hour Ozone Conformity for Denver Southern Subarea LIST OF FIGURES Figure 1 Denver-North Front Range Nonattainment Area and Subareas... 2 Figure 2 TPRs Involved in 8-Hour Ozone Nonattainment Area... 6 vi
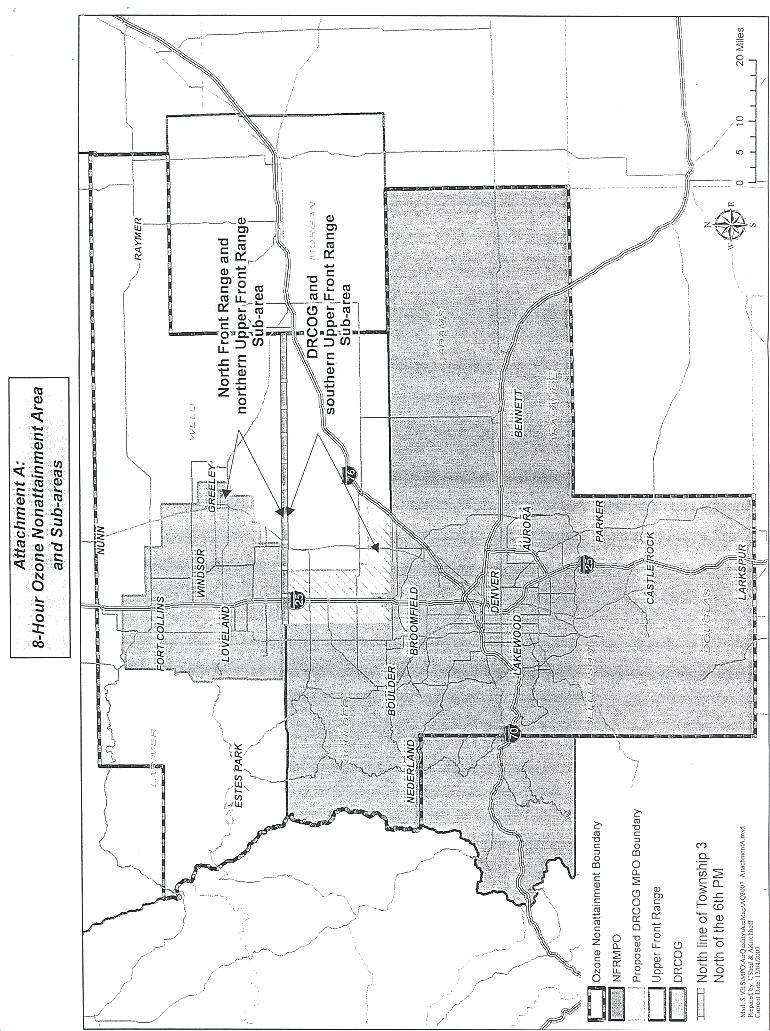
7 CHAPTER 1. INTRODUCTION Background 8-Hour Ozone Nonattainment Area The National Ambient Air Quality Standard (NAAQS) for ozone, promulgated in 1997, was set at a level of.085 parts per million (ppm) averaged over an 8-hour period. A violation of the 8-hour ozone standard occurs when the three-year average of the annual fourth-highest daily maximum 8- hour ozone concentration (i.e. design value) at one monitor is.085 ppm or greater. The Denver- North Front Range Area failed to achieve the standard due to high readings in July 2007, resulting in a three-year ( ) design value of ppm at one monitor (Rocky Flats North) which violated the 8-Hour Ozone NAAQS. Based on this violation, on November 20, 2007, the Environmental Protection Agency (EPA) officially designated the Denver-North Front Range Area to be in nonattainment of the 8-hour ozone standard. The Federal conformity requirements stipulate that conformity to the 8-hour ozone standard take effect one year after the nonattainment designation. As such, conformity of fiscally constrained regional transportation plans (RTP) and transportation improvement programs (TIP) to the 8-hour ozone standard must be demonstrated by the two Metropolitan Planning Organizations (MPOs), the Denver Regional Council of Governments (DRCOG) and the North Front Range Metropolitan Planning Organization (NFRMPO), and one Transportation Planning Region (TPR), the Upper Front Range (UFR) TPR, that comprise the 8-hour nonattainment area by and after November 20, The initial 8-hour ozone conformity determination was made in October The Denver-North Front Range 8-hour Ozone Nonattainment Area covers the counties of: Adams, Arapahoe, Boulder, Broomfield, Denver, Douglas, Jefferson, and parts of Larimer and Weld Counties that have the highest concentration of emissions. Figure 1 shows the entire 8-hour ozone nonattainment area, which composes two subareas (Northern and Southern). The boundary between the two subareas is the Boulder/Larimer County line extended through southern Weld County to the Morgan County line. 1

8 Figure 1 Denver-North Front Range Nonattainment Area and Subareas EPA found that the motor vehicle emissions budgets (MVEB) for nitrogen oxides (NO X ) and volatile organic compounds (VOC) contained in the Denver Metro Area and North Front Range 8-Hour Ozone Attainment Plan are adequate for transportation conformity purposes, effective on March 19 th, As a result of this finding, DRCOG and NFRMPO used these budgets for the subsequent transportation conformity determination. The initial conformity determination under the new SIP MVEBs was a joint conformity which used the total nonattainment area MVEBs for NO X and VOCs. With the completion of the initial joint conformity in January 2011, the two MPOs have decided to separate and conduct future conformities independently for their respective subareas. This conformity determination is for the Denver Southern Subarea. Federal Requirements An MPO is required to show conformity of its fiscally constrained RTP and TIP with the State Implementation Plan (SIP) for air quality before transportation plans and programs are adopted. 2
9 This action is required under Section 176(c) of the Clean Air Act, as amended in Conformity to an air quality implementation plan is defined in the Clean Air Act as conformity to the implementation plan's purpose of eliminating or reducing the severity and number of violations of the NAAQSs and achieving expeditious attainment of such standards. In addition, activities may not cause or contribute to new violations of air quality standards, exacerbate existing violations, or interfere with the timely attainment of required emissions reductions towards attainment. For pollutants for which a region currently meets standards but was formerly in nonattainment, the applicable SIP may also be referred to as a maintenance plan, which demonstrates continued attainment of the standards. The EPA final transportation conformity rule is located at 40 CFR Part 93. To address revised standards and changes in conformity requirements, EPA has promulgated several amendments to the final rule in recent years. Conformity Regulations for the 8-Hour Ozone On January 9, 2008, the EPA administrator signed an amendment to the conformity rule, (the Final Rule ), to implement the provisions of SAFETEA-LU. The Final Rule was promulgated February 25, According to 40 CFR of the Transportation Conformity Rule, Criteria and procedures for determining conformity of transportation plans, programs, and projects, transportation plans and programs must satisfy different criteria depending on whether the state has submitted a SIP revision, and whether the EPA has approved such submittal. In this case, EPA found the submitted NOx and VOC motor vehicle emissions budgets (MVEB) adequate (ref. 75 FR 9893, March 4, 2010) and conformity must be demonstrated for those MVEBs as per 40 CFR as described below: (e) (1) In such 8-hour ozone nonattainment and maintenance areas the budget test must be satisfied as required by for conformity determinations made on or after: (i) the effective date of EPA s finding that a motor vehicle emissions budget in a submitted control strategy implementation plan revision or maintenance plan for the 8-hour ozone NAAQS is adequate for transportation conformity purposes. EPA found the 8-hour ozone NOx and VOC MVEBs adequate on March 4, 2010 and these MVEBs became effective on March 19, 2010 (ref. 75 FR 9893, March 4, 2010). Therefore these MVEBs are used for the 8-hour ozone conformity determination. 3
10 Planning Organizations and the Memorandum of Agreement (MOA) DRCOG is the MPO for the Denver Transportation Management Area (TMA). The DRCOG TMA includes four urbanized areas, and consists of the portions of Adams and Arapahoe counties west of Kiowa Creek; all of Boulder County except Rocky Mountain National Park; all of Broomfield, Denver, Douglas, and Jefferson counties; and parts of southwestern Weld County. The TMA boundary expansion into southwestern Weld County was approved by the Governor on February 21, DRCOG is also the Transportation Planning Region (TPR) for the TMA, plus portions of Adams and Arapahoe counties east of Kiowa Creek and the Rocky Mountain National Park area of Boulder County. DRCOG s 2035 RTP includes the entire DRCOG TPR region. The DRCOG TIP covers the TMA while CDOT and the State Transportation Improvement Program (STIP) covers the remaining portions of the region. The NFRMPO is the MPO for the North Front Range TMA. The NFRMPO includes 15 local governments in the urbanized area of Larimer and Weld counties. The UFR TPR is the transportation planning region covering the remainder of the 8-hour ozone nonattainment area. Located in north-central Colorado, it is comprised of Larimer, Morgan, and Weld Counties, and excludes the urbanized areas in Larimer and Weld Counties which comprise the NFRMPO region and the portion of Southwest Weld County included in the DRCOG TMA. Figure 2 depicts the boundary of all three MPOs/TPRs involved in this 8-hour ozone conformity determination. Federal Transportation Regulations at 23 CFR (b), state that where a metropolitan planning area (MPA) does not include an entire nonattainment area, there shall be written agreement among the State Department of Transportation, state air quality agency, affected local agencies, and the MPO describing the process for cooperative planning and analysis of all projects outside the MPA within the nonattainment area. An MOA was signed in March 2008 by the Colorado Department of Public Health and Environment (CDPHE), Colorado Department of Transportation (CDOT), Regional Air Quality Council (RAQC), UFR TPR, NFRMPO, and DRCOG. A copy of the MOA is in Appendix D. The MOA established the procedure for determining conformity prior to the establishment of mobile source emissions budgets (used prior to this conformity determination). It also calls for the establishment of an overall area motor vehicle emissions budget based on the entire 8-hour 4
11 ozone nonattainment area, and allows for the option for establishing subarea emissions budgets based on subareas, which are delineated in Figure 1. The MOA stipulates that DRCOG will make conformity determinations for the Southern Subarea of the 8-hour ozone nonattainment area, while the NFRMPO will make the conformity determination for the Northern Subarea of the 8-hour ozone nonattainment area. The travel demand model outputs from each of the MPOs are sent to the Air Pollution Control Division (APCD) of CDPHE for generation of emissions estimates in the Mobile 6.2 emissions model. In the Northern Subarea, the 8-hour ozone nonattainment area outside of the NFRMPO model area, also known as the northern donut area, will have the transportation forecasting performed by the APCD. Finally, the MOA states the courses of action to be pursued if one (or both) of the subareas exceeds a conformity test or its (their) emissions budgets. The NFRMPO and DRCOG worked cooperatively with an interagency consultation group (Federal Highway Administration (FHWA), EPA, CDOT and APCD) to review the conformity documentation and planning assumptions. Furthermore, the NFR Technical Advisory Committee (TAC), or their representative, served as the review team for the NFR socioeconomic data and transportation network as per Regulation No. 10 Criteria for Analysis of Conformity. The MOA noted that after the initial MVEB-based conformity determination, DRCOG and the NFRMPO may switch from using the total nonattainment area MVEBs to using the subarea MVEBs for determining conformity. To switch to use of the subarea MVEBs (or to subsequently switch back to use of the total nonattainment area MVEBs), DRCOG and the NFRMPO must use the process as described in the Denver/NFR Ozone Attainment Plan on pages VI 4 through VI 6. 5

12 6
13 Current Situation for the Denver Southern Subarea Transportation Planning DRCOG Region The Metro Vision 2035 Plan is the long-range growth and development strategy for the Denver region. It integrates plans for growth and development, transportation, and environmental quality into a single comprehensive foundation for regional planning. Metro Vision calls for a balanced multimodal surface transportation system, including rapid transit, a regional bus network, a regional beltway, bicycle and pedestrian facilities, and improvements to the existing roadway system. The 2035 Metro Vision Regional Transportation Plan (MVRTP) is the transportation plan that implements the transportation element of Metro Vision. The 2035 MVRTP contains an unconstrained vision plan, outlining the region s transportation needs, as well as the Fiscally Constrained 2035 RTP, which includes those projects that can be implemented given the anticipated level of funding. The 2035 MVRTP and Fiscally Constrained 2035 RTP were adopted on December 19, 2007 and last updated in February The Transportation Improvement Program (TIP) adopted in March 2011, identifies transit, multimodal, and roadway projects to be funded with FY 2012 through FY 2015 federal funds. These projects are described in Chapter 3. The TIP implements the Fiscally Constrained 2035 RTP. UFR TPR The Upper Front Range 2035 Regional Transportation Plan was approved by the Upper Front Range Regional Planning Commission on December 13, The UFR TPR 2035 RTP contains both a Vision Plan as well as a Fiscally Constrained Plan. Short-range transportation projects in the UFR TPR are contained in the STIP. There are no amendments to either of these documents since the last determination in March Air Quality Planning Other Pollutants Currently, the DRCOG region is designated as a maintenance area for carbon monoxide (CO) and particulate matter equal to and less than 10 microns in aerodynamic diameter (PM10). The 7
14 CO and PM10 conformity determination adopted on March 16, 2011 by the DRCOG Board is being updated concurrently with this document. 8-Hour Ozone As a result of the 8-hour ozone nonattainment designation, a SIP covering the Denver-North Front Range Nonattainment Area was developed. The SIP demonstrates how the region will attain the 8-hour ozone standard by Two air quality planning agencies were charged with preparing the SIP. The RAQC is the air quality planning agency for the Denver metropolitan area (Southern Subarea) and the North Front Range Transportation and Air Quality Planning Council (NFRT &AQPC) is the air quality planning agency for the NFRMPO and the Northern Subarea of the 8-hour ozone nonattainment area. The SIP establishes mobile source emissions budgets that will govern future conformities. The proposed SIP was approved by the Air Quality Control Commission (AQCC) in December In June 2009, the SIP was approved by Gov. Ritter and sent to EPA for review and approval. EPA made an adequacy determination of the proposed motor vehicle emissions budgets for conformity and the new budgets became effective on March 19, The 1-hour ozone budgets are no longer used for transportation conformity purposes. Conformity must be demonstrated using the 8-hour ozone budgets. Process Agency Roles The Conformity SIP, also known as the conformity implementation plan, was developed by the AQCC and adopted in It formally defines the process for finding conformity. In November 1998, a MOA was signed by the CDPHE and DRCOG for the purpose of defining the specific roles and responsibilities in conformity evaluations and findings. A similar MOA was also signed by the CDPHE and NFRMPO in November 1998, for the same purpose. The EPA approved the Conformity SIP on September 21, 2001 (66FR48561), making the Conformity SIP federally enforceable. Public Participation Public participation was encouraged throughout the development of DRCOG s 2035 MVRTP and the TIP. Several public hearings were held before the DRCOG Board of Directors. A joint public hearing was held on 2035 MVRTP and its original conformity document on December 5, A public hearing was held on the 2035 MVRTP 2008 Cycle 2 8
15 amendments and its conformity document on December 17, A public hearing was held on the 2035 MVRTP 2009 Cycle 1 amendments and its conformity document on July 15, A public hearing was held on the 2035 MVRTP 2009 Cycle 2 amendments and its conformity document on December 16, A public hearing was held on the 2035 RTP Updates, the TIP amendments, and the associated conformity document on December 15, A public hearing was held on the new TIP and conformity determination documents on February 16, A public hearing was held on the 2035 MVRTP 2011 Cycle 1 amendments and its conformity document on July 20, Consistent with the MOA, no specific public hearing was held in the UFR TPR. However, public notice of the two MPOs public hearings was circulated within the UFR TPR. Summaries of testimony received during the review periods and at the public hearings are available at the DRCOG office. Members of the public were also encouraged to provide input to their local elected officials and government staff who work closely with DRCOG. 9
16 10 (intentionally blank)
17 CHAPTER 2. IMPLEMENTATION OF CONTROL MEASURES For this conformity determination, there are no new transportation control measures (TCMs) identified for timely completion or implementation as part of the applicable implementation plan. The 8-hour Ozone Attainment Plan (SIP) that was adopted by the AQCC in 2008 did not include any TCMs. 11
18 12 (intentionally blank)
19 CHAPTER 3. EMISSIONS TESTS General Description The transportation plan and program must pass a series of 8-hour ozone emissions tests to demonstrate conformity. These emissions tests relate to the two ozone precursors, Nitrogen oxides (NO x ) and Volatile Organic Compounds (VOC). The plan and program must respect the motor vehicle emissions budget in the applicable SIP or SIP submittal. Satisfying these tests involves demonstrating that relevant emissions in future years are less than or equal to the emissions budget established in the SIP. Budgets Analysis Years In accordance with EPA regulations 40 CFR , the interagency consultation group agreed upon the following staging years for this 8-hour ozone conformity determination an intermediate modeling year 2025 an intermediate modeling year 2035 the last year (horizon) of regional transportation plans. Under the terms of the MOA (as described above), DRCOG is responsible for the 8-hour ozone nonattainment area s Southern Subarea (everything within the 8-hour ozone nonattainment area south of the north line of Township 3), while the NFRMPO is responsible for the conformity determination for the 8-hour ozone nonattainment area s Northern Subarea (everything within the 8-hour ozone nonattainment area north of the north line of Township 3). The entire Denver- North Front Range nonattainment area, with both the Northern and Southern Subareas, is shown in Figure 1. Technical Process The technical process used to estimate future pollutant emission levels is based on the latest planning assumptions in effect at the time of this conformity determination. Assumptions behind the analysis were derived from estimates of current and future population, employment, travel, and congestion most recently developed by DRCOG. The MOA stipulates that the emissions estimates are to be performed by the APCD. Information concerning vehicle miles traveled and operating speeds was updated as part of this conformity finding process. These planning assumptions were used with the EPA emission model (MOBILE 6.2) to estimate emissions. The DRCOG travel demand model covers the whole Southern Subarea. Appendix B describes 13
20 the modeling structure and recent enhancements for DRCOG travel demand model in more detail. DRCOG Demographic Assumptions The population forecast for the Southern Subarea of the Denver-North Front Range 8-Hour Ozone Nonattainment Area in 2035 is 4,368,600. This is an increase of 51 percent over the year 2010 estimated population of 2,889,700. Employment is forecast to be 2,577,200 in 2035 compared to the year 2010 estimate of 1,560,000, an increase of approximately 65 percent. Growth in population and employment will be the principal factor for the increased demand for travel on the region s transportation facilities and services. Table 1 shows the latest forecasts of population and employment for 2010, 2015, 2025, and 2035 for the Southern Subarea of the Denver-North Front Range Nonattainment Area, as depicted in Figure 1. Table 2 lists 2010 and 2035 population and employment estimates by each of the counties that comprise the DRCOG ozone modeling Southern Subarea. 14
21 Table 1 Population and Employment Forecasts DRCOG Ozone Modeling Southern Subarea Population 2,889,700 3,139,400 3,719,200 4,368,600 Employment 1,560,000 1,724,600 2,108,500 2,577,200 Table and 2035 Population and Employment Estimates by County DRCOG Ozone Modeling Southern Subarea County Population Employment Adams County 459, , , ,100 Arapahoe County 566, , , ,300 Boulder County 306, , , ,100 Broomfield County 51, ,900 33,200 95,500 Denver County 601, , , ,400 Douglas County 281, , , ,600 Jefferson County 555, , , ,400 Weld County* 67, ,900 18,400 49,800 Total DRCOG Ozone Modeling Southern Subarea 2,889,700 4,368,600 1,560,000 2,577,200 * Includes entire extent of Weld County that lies within the DRCOG 8-hour ozone modeling domain (i.e. Southern Subarea of 8-hour Ozone Nonattainment Area). 15
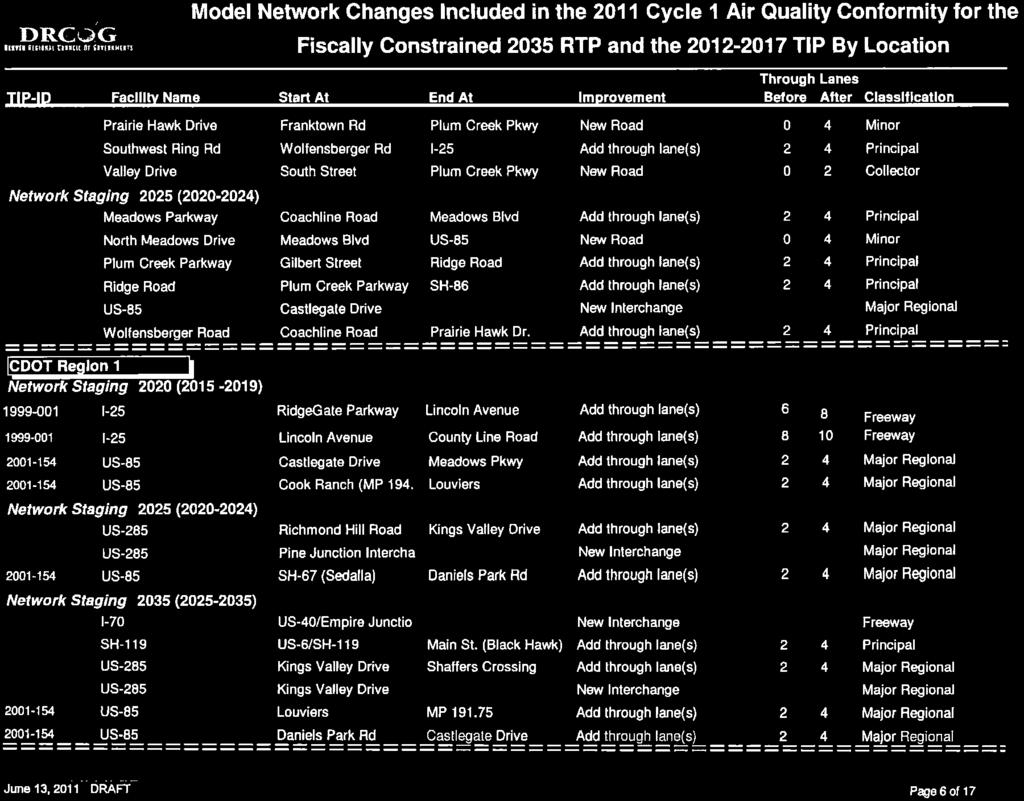
22 Transportation Assumptions In order to complete the emissions tests, the 2010, 2015, 2025, and 2035 transportation networks must first be defined. DRCOG DRCOG s Fiscally Constrained 2035 RTP specifies financially constrained highway and transit system improvements and resulting networks to be completed by the year The detailed list of improvement projects by completion year is displayed in Appendix A. The most significant highway projects on the designated regional roadway system are listed below. The TIP includes funding for a number of regionally significant projects that are also contained in the Fiscally Constrained 2035 RTP. They include: US-85 from Cook Ranch Road to Louviers: widen roadway to four lanes. West Corridor, Denver Union Station to Jefferson County Government Center: new light rail, stations, park-n-rides. Gold Line, Denver Union Station to Ward Road: new light rail, stations, park-n-rides. I-225 Corridor, Parker Road to Smith Road: new light rail, stations, parking. North Metro Corridor, Denver Union Station to 160 th Avenue: new rail, stations, parking. Southeast Corridor, Lincoln Avenue to RidgeGate Parkway Extension: extend light rail with stations, park-n-ride. Southwest Corridor, Mineral Station to C-470 Extension: extend light rail, new park-n-ride. Northwest Rail, Denver Union Station to Longmont: new rail, stations, parking. Central Corridor, 30 th and Downing to 38 th and Blake: new light rail and stations. East Corridor, Denver Union Station to Denver International Airport: new rail, stations, and park-n-rides. Denver Union Station: intermodal center. 120 th Avenue Connection over US-36: build new six lane road. I-25 from Santa Fe to Alameda: interchange reconstruction. US-36 from Interlocken Loop to the I-25 Express Lanes: add two HOT lanes. 16
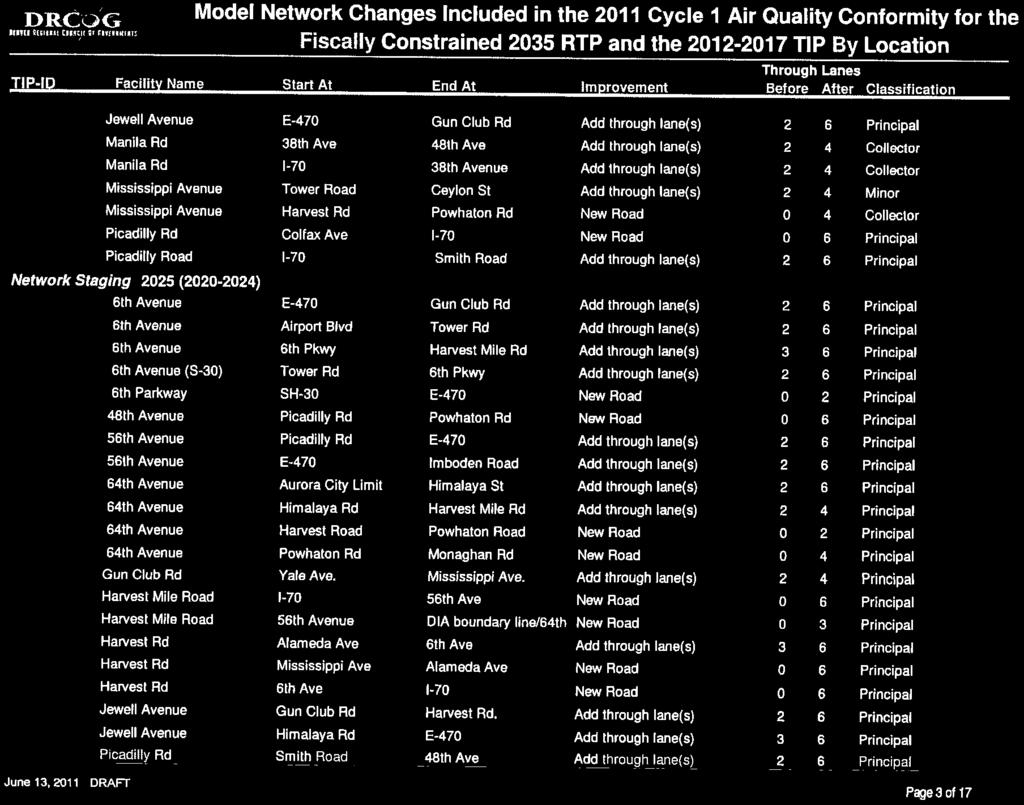
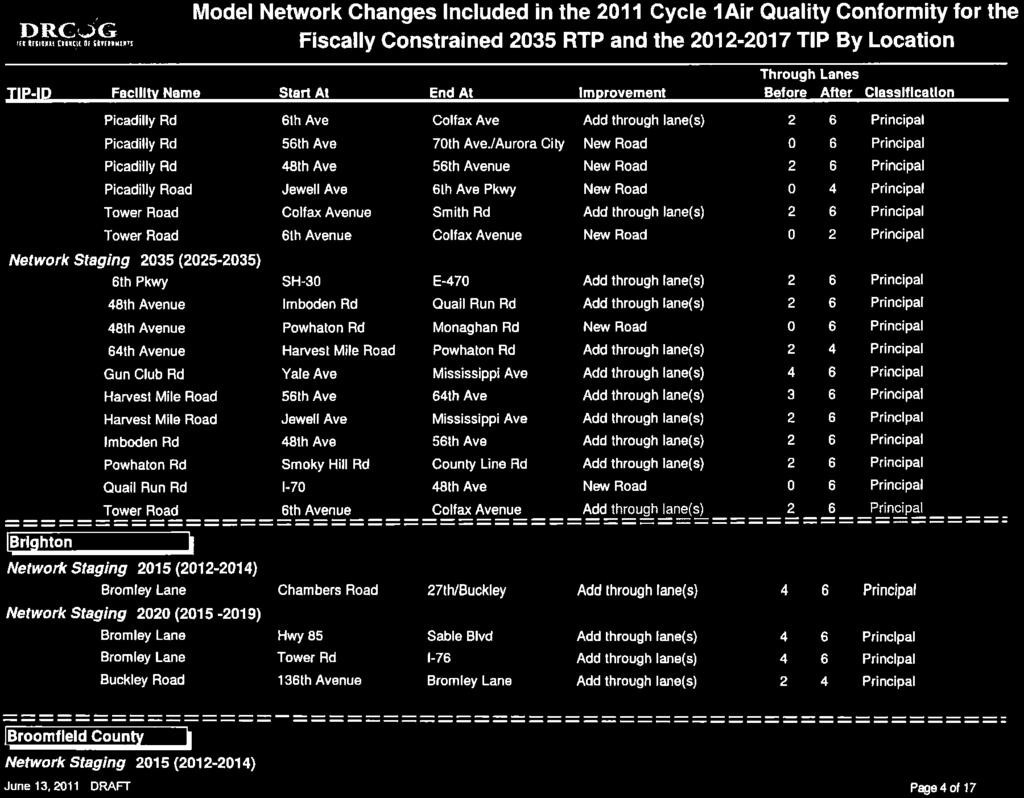
23 The TIP also includes many other projects that will help to reduce emissions associated with ozone: Transit operating funds and bus purchases Bicycle and pedestrian facilities Travel demand management programs Intelligent Transportation System (ITS) infrastructure Traffic signal systems and coordination Master plans for areas around transit stations and urban centers Regional highway projects in the Fiscally Constrained 2035 RTP using federal and state resources, in addition to those listed above include: SH-121/Wadsworth Boulevard from 36 th Avenue to 46 th Avenue: widen roadway to six lanes. SH-121/Wadsworth Parkway from 92 nd Avenue to SH-128/120 th Avenue: widen roadway to six lanes. 104 th Avenue from Grand View Ponds to US-85: widen roadway to four lanes. I-25 from RidgeGate Pkwy to C-470 South Ramps: widen roadway to 10 lanes. I-70 from Brighton Boulevard to York Street: roadway reconstruction and interchanges. I-70 from I-270 to Havana Street: widen roadway to ten lanes. SH-7 Arapahoe Road from Cherryvale Road to VoTech Drive: widen roadway to four lanes. US-285 Hampden Avenue from Colorado to I-25: widen roadway to six lanes. SH-30 Hampden Avenue from Dayton Street to Havana Street: widen roadway to six lanes. I-25 from US-36 to 120 th Avenue: add two HOV/HOT lanes. I-270 from Vasquez to Quebec Street: widen roadway to six lanes. US-36 at Wadsworth Boulevard: interchange reconstruction. US-36 from SH-157 (Foothills Pkwy) to Interlocken Loop: add two HOV/HOT lanes. I-225 from Parker Road to Mississippi Avenue: widen roadway to six lanes. I-25 from SH-66 to WCR 38: add two HOV/HOT lanes. US-85 from Louviers to MP and from Sedalia (SH-67) to Meadows Pkwy: widen to 4 lanes. Regional highway projects in the Fiscally Constrained RTP using locally-derived funds include: 17
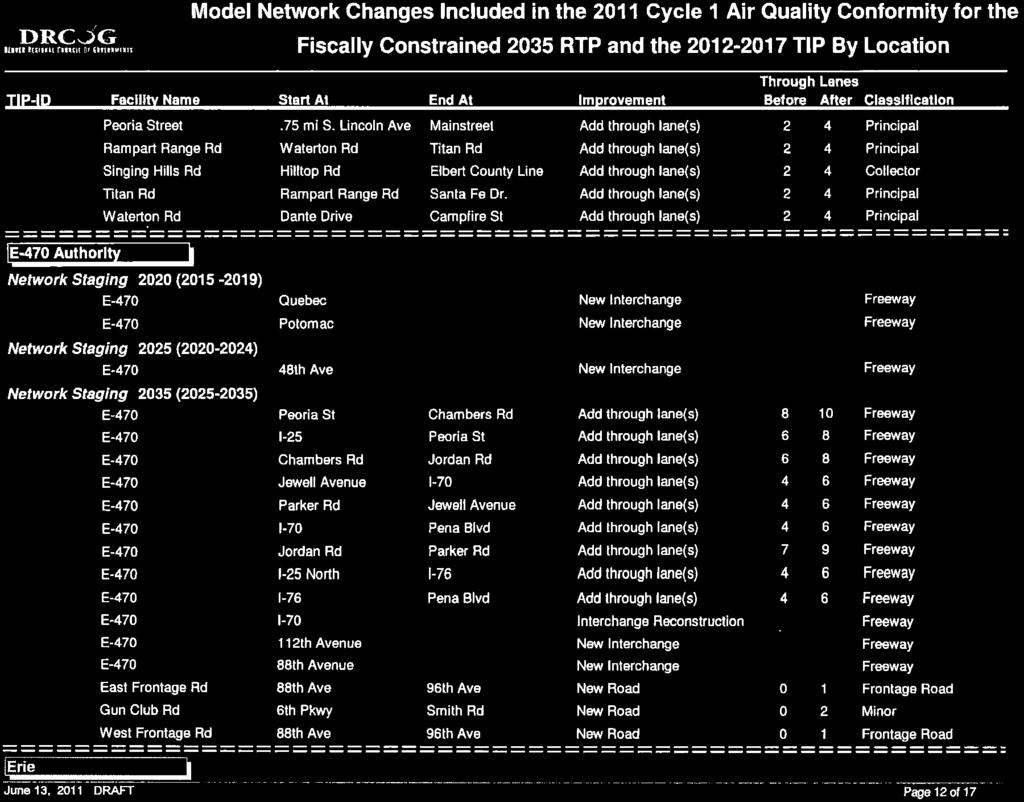
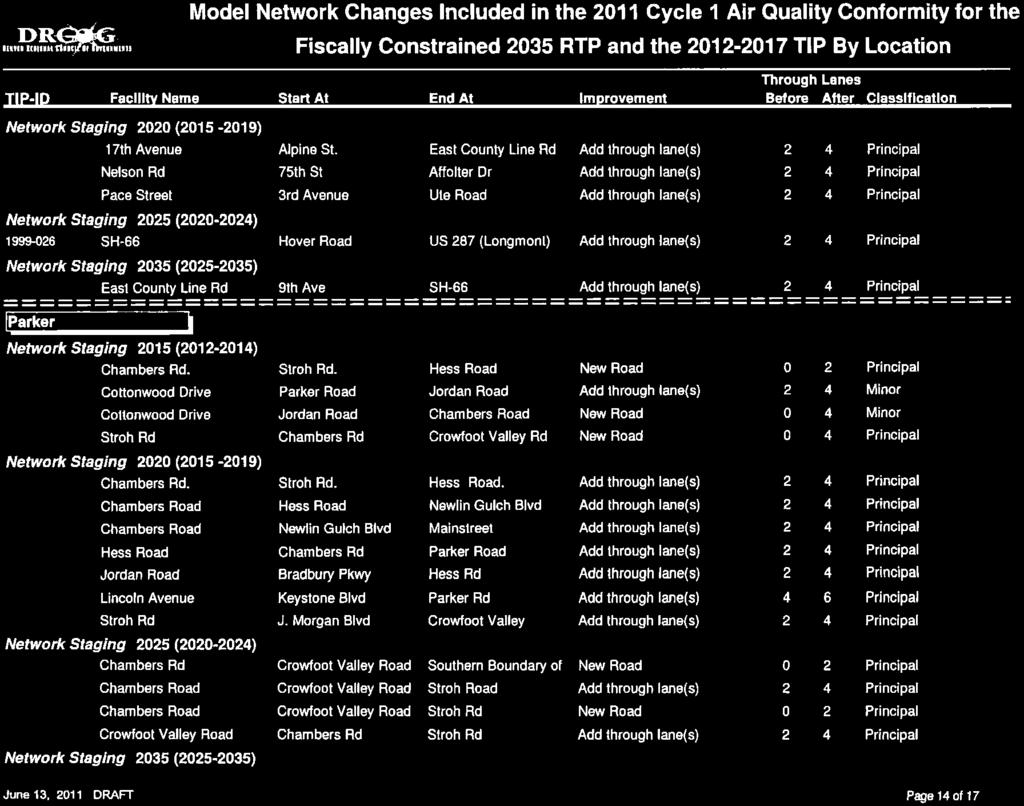
24 New interchange at I-25/North Meadows Drive in Castle Rock. E-470 from I-25/C-470 to I-25/Northwest Parkway: widen to eight/six lanes, build five new interchanges. New interchange at I-70/Harvest Mile Road. Peña Boulevard from I-70 to DIA: widen roadway to six lanes. Jefferson Parkway from SH-93 to SH-128: new four-lane tollroad, plus 3 partial interchanges. The major proposed 2011 Cycle 1 project amendments to the Fiscally Constrained 2035 RTP roadway network are described in Table 3. These amendments are on I-25 and I-76. All changes (e.g. staging year updates) are depicted in Appendix A. The base 2010 rail rapid transit network includes the existing Central, Southwest, and Central Platte Valley rail lines, and the Southeast light rail line which opened in It also includes the I-25 HOV/Tolled Express Lanes, which also opened in 2006, as well as the existing Broadway/Lincoln bus lanes and the existing Santa Fe high occupancy vehicle lanes. The 2015 rapid transit network includes the West rapid transit corridor and the extension of US-36 HOT lanes to just east of East Flatiron Circle. All the remaining corridor lines that were approved by voters in RTD s FasTracks plan on November 2, 2004 are assumed to be completed by 2020 except for the US-36 HOT lanes from Interlocken Loop to Boulder. Other than the staging year adjustments there are no other changes to the rapid transit system. The proposed 2011 Cycle 1 project amendment to the Fiscally Constrained 2035 RTP transit network is described in Table 3. The amendment is associated with the North Metro FasTracks station change. DRCOG s regional travel model was used to perform the travel forecasting. A summary description of DRCOG s travel demand model is included in Appendix B. A more detailed description is documented in the DRCOG Focus Transportation Model Documentation and in a metadata report. Additional documentation is available on the assumptions and operation of the socio-economic model. These reports and papers are available for inspection at the DRCOG offices. This model includes a number of assumptions, which are supported by current regional experience. 18
25 One set of modeling assumptions concerns transit operating policies. The model assumes that RTD will keep transit fares constant in current dollars. This is a logical assumption as RTD has an adopted policy of increasing fares in line with increases in the Consumer Price Index. Modeled fares for proposed new services are based on the most similar existing services. The model assumes that RTD would continue with its current approach in setting service levels for various areas of the region. RTD last increased its fares in January The model assumes that the Northwest Parkway Authority and the E-470 Authority will continue to charge tolls on their facilities on a per-mile cost basis in constant dollars similar to current charges (16 cents per mile in 1996 dollars). The proposed Jefferson Parkway is assumed to have comparable tolls. Parking costs in downtown Denver were varied using the Denver parking cost model, which uses employment density and estimates of parking supply as variables. Parking costs were established outside the Denver Central Business District by surveying current parking costs for work and non-work trips, and assuming that these would remain constant over time. Appendix A contains the complete list of modeled transportation improvement projects within the DRCOG regional travel model. 19
26 Table 3 Proposed 2011 Cycle 1 Amendments to the 2035 RTP Roadway System and Transit System Sponsor Project Location Current RTP Project Description Type of Change to the FC-2035-RTP 2009 Existing Lanes Proposed 2035 Lanes Model Network Staging Colorado High Performance Transportation Enterprise I-25: US-36 to Thornton Parkway I-25: Thornton Parkway to 120th Avenue Add two general purpose lanes n/a Change description: Add two HOT lanes - Interim tolled express lanes (TELs) - Other general purpose, safety and operational improvements identified in the PEL study - Full EIS TEL buildout after Colorado High Performance Transportation Enterprise I-25: SH-66 to WCR 38 Add two general purpose lanes Change description: Add two HOT lanes - Interchange reconstruction at WCR Brighton I-76: Bridge Street Interchange New Interchange Delete project (1601 system study not complete) n/a n/a n/a Sponsor Project Location Current RTP Project Description Type of Change to the FC-2035-RTP Model Network Staging Total 2035 Spaces RTD FasTracks North Metro Corridor: Station in Commerce City Existing park-n-ride located at US-85/72nd Avenue (83 parking spaces) Change station location to 72nd Avenue at North Metro rail line; close existing park-n-ride
27 UFR TPR There were no regionally significant transportation improvement projects in the UFR TPR portion of the Southern Subarea, and no amendments are proposed for this cycle. The STIP does include construction of a park-and-ride lot in Fort Lupton on US-85. Air Quality Modeling Assumptions The APCD estimates air pollution emissions using Mobile 6.2. The conformity analysis for this 8-hour ozone conformity finding began in April 2011 after identification by RTD, CDOT, and local governments of projects they would be submitting for inclusion. Mobile Source Measures The regional emissions analysis does not reflect the air quality benefits of such travel demand management programs as DRCOG s RideArrangers Program, Teleworking, Eco Pass, and other transportation demand management actions. In addition, other programs whose benefits are more difficult to ascertain are not fully incorporated into the model. Examples of such programs include compressed workweeks and programs initiated after The DRCOG model does reflect emissions reduction benefits created by DRCOG s Traffic Signal System Improvement Program (TSSIP), which is funded through the TIP. The goal of this program is to ensure that the region s traffic signals operate in a coordinated manner that makes the most efficient use of arterial street capacity. The efficiency objectives include: Minimizing vehicle stops. Minimizing travel delay. Minimizing disruption caused by malfunctioning equipment. 21
28 Emission Test Results The results of the Denver Southern Subarea emissions tests by year are reported in Table 4. The emissions estimates were generated by APCD using the transportation inputs from the DRCOG s travel demand models and the Mobile 6.2 emissions model. The 8-hour ozone conformity analysis was performed for the years 2015, 2025, and 2035, which meet the requirements for the staging years specified in 40 CFR The test results do not indicate any failures in the horizon years of the program or plan that would lead to a finding of nonconformity. Therefore, conformity is demonstrated for the Denver Southern Subarea. Table 4 8-Hour Ozone Conformity for Denver Southern Subarea (Emission Tons per Day) SIP budgets 2015 Emissions Volatile Organic Compounds (VOC) 2025 Emissions 2035 Emissions Pass/Fail Pass all tests Oxides of Nitrogen (NOx) Pass all tests 22
29 Summary of 8-hour Ozone Conformity Findings for the Denver Southern Subarea Based on the quantitative conformity analysis, the DRCOG staff have determined that the DRCOG Fiscally Constrained 2035 RTP and TIP and the Southern Subarea portion of the UFR 2035 RTP and STIP demonstrate conformity for the 8-hour ozone standard using the 8-hour ozone emissions budgets for the Denver Southern Subarea. Appendix C of this conformity determination includes more information on the transportation and demographic assumptions used in this emissions analysis. 23
30 (intentionally blank) 24
31 APPENDIX A DRCOG TRANSPORTATION NETWORK ASSUMPTIONS 25
32 (intentionally blank) 26

33

34
35
36

37
38

39

40

41

42

43
44

45
46

47

48

49

50 44

51 45
52 (intentionally blank) 46
53 APPENDIX B DRCOG TRANSPORTATION MODEL CALIBRATION DESCRIPTION 47
54 (intentionally blank) 48
55 Introduction In support of the conformity determination for the 2035 Regional Transportation Plan (RTP), the Denver Regional Council of Governments (DRCOG) Metro Vision Resource Center employed the Regional Socio-economic Model together with Focus, the updated regional travel modeling system. Travel modeling uses mathematical formulations in computer software programs to show how regional development impacts road and transit usage. The Focus model simulates the travel of millions of individual people in the region throughout a typical weekday. The previous model, Compass, was an aggregate model that did not include this level of detail. The Focus model sums the individual travel to forecast how many vehicles will be driven on major roads, how much congestion there will be and how many people will walk, bike or use transit. To realistically simulate each person s daily travel, Focus models the many choices each person makes each day including: (1) where to work (2) where to go to school (3) how many automobiles are owned by the person s household (4) how many trips each person makes in a day (5) the address where each trip starts from and goes to (6) the mode for each trip, with choices including walk and biking (7) which major streets or bus routes were chosen to reach each destination The model takes into account many characteristics of people, such as their age and income, and how the region will change demographically over time. It also takes into account characteristics of the built environment such as congestion, density, and walkability. The Focus travel model was estimated based on detailed data from a survey called the Travel Behavior Inventory (TBI). The TBI project involved multiple surveys of travel in the Denver metropolitan area, including: The Household Survey a travel diary survey that gathered complete travel information for an assigned day for approximately 5,000 households; The Front Range Travel Survey - a survey of vehicles entering and leaving the metropolitan area; 49
56 The Commercial Vehicle Survey a survey that gathered complete travel information from more than 800 commercial vehicles on an assigned day; and The Non-Respondent Populations Project - an effort to evaluate whether those who did not respond to the survey exhibited different travel behavior than people who did respond to the survey. The bulk of this survey work was conducted in , with data cleaning and summary conducted through Focus was calibrated using 2005 data sources including roadway counts, transit boardings, American Community Survey data, and Census data. Demographic Development Estimation DRCOG works with a panel of economists and planners from both private and public sectors to review current growth trends and evaluate the output of a regional forecast model. This model relates the regional economy to national forecasts by industrial sector. Once employment levels are predicted, a demographic model is used to determine the migration levels needed to generate the labor force to fill the expected jobs. The forecasts are reviewed annually with major revisions expected every five years. Small Area Development Estimates To provide development data at a level of detail necessary for the travel model, the regional urban activity forecasts are disaggregated into 2,800 transportation analysis zones (TAZs), as shown in Figure 1. The allocation to TAZs is carried out based on an attractiveness index for each TAZ, which in effect develops a desirability score for each TAZ. This score is based on roughly 20 variables such as miles of arterial roadway in the TAZ, rapid transit service, vacant land, local land use plans, growth over the last decade, environmental constraints, and income characteristics. Separate attractiveness indices and allocations are developed for commercial and retail employment, and for households. The zones are filled with new development in the given category starting with the TAZ with the highest attractiveness index. The amount of development allocated to a TAZ is controlled by the amount of vacant land in the zone available for residential or employment uses, the expected density in the zone, and other factors. The 50
57 model works its way through the list of zones until all of the growth is allocated. The effects of several regional planning policies also are taken into account in the model: open space plans affect the amount of developable land in the relevant TAZs; the regional urban growth boundary affects expected densities, and the development totals in TAZs outside that boundary; and planned urban centers affect the development capacity in the TAZs in which they are planned. Figure 2 shows a flowchart for the process of socioeconomic forecasting in the Denver region. The forecasting results were refreshed in

58 Figure 1 DRCOG Travel Analysis Zones 52
59 Figure 2 Socioeconomic Model Elements and Flow Regional Employment and Population forecast control totals Panel Review of Model Variables Socioeconomic Model DRCOG Draft Forecasts by TAZ Panel Review of Variable Weights for TAZ scoring Utility Functions Maximum allowable jobs and house-holds (capacity) Community Review of Draft Forecasts Allocate development to TAZs Final 2035 Forecasts of employment and households 53
60 Figure 3 Travel Model Elements and Flow Factors Considered Regional Growth Totals National Economic Forecasts Industrial Base Births/Deaths In-Migration Highway & Transit System Small Area Development Estimates Number of Trips Vacant Land Past Growth Water Supply Roadways & Transit Local Land Use Plans Household Size Income Employment Type Special Generators Trip Destination Travel Time Opportunities Travel Mode Type of Trip Income Travel Time Cost Travel Path Travel Time Congestion Cost 54
61 Focus Model Process Overview Figure 3 shows a simplified diagram of how the Focus model components flow after the socioeconomic forecast has been completed. The model begins with a population synthesizer that creates millions of records for individual households and persons. Then the travel skims that give travel times from each origin zone to each destination zone are created. Tours are the first travel elements to be created. Figure 4 shows a diagram to explain how tours work. This diagram has one tour with three trips and one intermediate stop. The model runs through a set of activity generation, location choice, mode choice, and time of day choice model components for tours. Then the model runs through a parallel set of model components for trips within a tour. Figure 4. Tour Diagram Intermediate Stop Tour Origin Tour Destination Highway and Transit System One of the most significant inputs to all travel model components is the transportation network representations. The highway network is represented by over 25,000 directional road segments, described according to location, length, number of lanes, functional classification, and area type. High-occupancy vehicle (HOV) lanes also are represented as special links. Tollway links are assessed an additional impedance to reflect toll charges. The model also includes a fully detailed representation of transit facilities, including all bus and rapid transit lines, park-n-ride lots, bus stops, and walk access/egress routes. Bus routes follow the same highway network as automobiles trips, and bus speeds are based on auto speeds. Rail speeds are developed based on transit schedule information. Capture areas for park-n-ride lots are quite broad, permitting 55
62 trip-makers in the model to select the lot that produces the shortest overall transit path to their destination. As part of the process of estimating highway and transit use, minimum impedance paths are calculated using time, distance and toll cost over the highway and HOV system, and time and cost over the transit system. Model Components The most important model components are briefly described below. Table 1 enumerates all model components. Most model components are multinomial logit or nested logit models, which are regression models that have more than two discrete choice outcomes. Table 1. Focus Model Components 1. Population Synthesizer 14. Tour Time of Day Simulation 2. TransCAD Initialization 15. Tour Primary Destination Choice 3. TransCAD Trip Generation 16. Tour Priority Assignment 4. TransCAD Skimming 17. Tour Main Mode Choice 5. Size Sum Variable Calculator 18. Tour Time of Day Choice 6. Regular Workplace Location 19. Intermediate Stop Generation Choice 7. Regular School Location 20. Trip Time of Day Simulation 8. Auto Availability 21. Intermediate Stop Location Choice 9. Aggregate Destination Choice Logsum 22. Trip Mode Choice Generation 10. Daily Activity Pattern 23. Trip Time of Day 11. Exact Number of Tours 24. Write Trips To TransCAD 12. Work Tour Destination Type 25. TransCAD Highway and Transit Assignment 13. Work-Based Subtour Generation Population Synthesizer The model begins with a population synthesizer called PopSyn. PopSyn creates a forecast of individual households and persons with detailed demographic characteristics for chosen year. It operates by drawing household and person records from the 2000 Public Use Microsample (PUMS) with the goal of matching forecasted demographic controls, including land use model households by zone. 56
63 Highway and Transit Skims The highway and transit skims are made by finding shortest time paths for origin-destination zone pairs by time-of-day. The skims are used extensively in later model components location choice, mode choice, and time of day choice. Denver International Airport/Internal-External/ External-External Trips After skimming is run, the Compass 2.0 model components must be run for airport trips, internal-external trips, and external-external trips. The entire Compass model must be run to generate and assign these trips. Regular Workplace and School Location The work location choice model takes all regional workers and assigns them a regular work location zone and point. Characteristics of the worker and their home zone are used in combination with zonal characteristics to determine the desirability of any zone. The work location choice model is a nested logit model with the highest nest for a regular workplace at home or outside the home. The second level nest is given the workplace is outside the home, in which zone it is located. Similarly to the regular work location choice model, the regular school location choice model assigns each student a regular school location zone and school. It uses information about the student like income and age, and information on school enrollment and distance from home to school to determine which schools will be attractive for which students. There are four school location choice models by student grade level: pre-school, kindergarden-8 th grade, 9 th -12 th grade, and university. Four separate models are used to reflect that the decision-making of school location for different grade ranges have significantly different characteristics. The models are all multinomial logit with the choice being the location of the school zone. Auto Availability Choice The auto availability choice model is a multinomial logit model that selects number of automobiles available for each household in the region. The choices range from no cars to 4+ cars. The model uses information about households and their accessibility to work and school to determine how many autos are available to households. 57
64 Tour Models After Focus has projected the long-term decisions about work and school location and auto ownership, it forecasts daily activities on a tour-level. The exact number of tours model determines exactly how many tours of each type each person will make in his or her day. The tour types predicted for each person include: work, school, escort, personal business, shop, meal, and social recreation. The model outputs this number of tours by purpose into the tours table in the database. The tour primary destination choice model selects to which zone each tour is destined based the development (e.g. jobs and households) located within the zone. Then it assigns a point within each zone as the final destination. After the tour destination is known, the tour main mode choice model predicts the main travel mode used on the tour. The mode chosen is based on the impedances associated with each mode from the tour origin to the tour destination, zonal characteristics, and demographic person characteristics. Given the known tour origin, destination and mode from previous models, the tour arrival and departure time model predicts the time arriving at the primary destination of the tour and the time leaving the primary destination, both to within 1 hour periods. Trip Models After the tour-level models are run, a series of trip-level models are run. The first trip level model is the intermediate stop generation model which generates intermediate stops on each tour. The intermediate stop location choice model selects the zone for each intermediate stop. The locations of all intermediate stops on tours are modeled one at a time, first for stops from home to the primary activity and then for stops from the primary activity to home. 58
65 The trip mode choice model determines the trip mode on all trips. The tour mode has already been found by the tour mode choice model, and this knowledge is used in combination with skim data, zonal data, and person data to find the trip modes on these tours. Given the origin, destination and mode of each trip, the trip time of day choice model predicts the time each intermediate stop will occur. The trip time of day choice model has 24 alternatives corresponding to each hour period. After the trip models have been run, the following information is known for every trip internal to the region for every person: Origin and Destination Zone and Point Location Trip Purpose (work, school, escort, personal business, shop, social recreation) Trip Mode ( drive alone, shared ride 2, shared ride 3+, walk to transit, drive to transit, walk, bike, school bus) Trip Time of Day ( one of 24 hours) Network Assignment Automobile trips are assigned to the highway network via a user equilibrium algorithm, after commercial trips have been loaded first using an all-or-nothing process. The all or nothing process simply assigns trips to the shortest path between origin and destination, ignoring possible congestion effects that might cause trips to take different paths. The user equilibrium process assigns the trips between each origin and each destination TAZ in such a way that, at the end of the process, no trip can reduce its travel time by changing its path. In other words, taking into account the congestion produced by all other trips in the region, each trip is following its minimum path. Highoccupancy vehicles (HOV) are loaded simultaneously with single-occupant vehicles (SOV). Transit assignment is performed separately, using an all-or-nothing algorithm that does not take into account the possibility that high demand on some transit routes may motivate some riders to shift routes. Finally, the model is run several times, 59
66 feeding back the output speeds to the input stages that require them as input (among them, the trip distribution stage) until the output speeds and the input speeds match. The model also takes into account the effect of toll costs in roadway route choice by converting toll costs into equivalent time cost using an estimated value of time for automobile trip-makers. Model Calibration Each Focus model component was calibrated using 2005 inputs to 2005 external data sources individually and then the entire model was calibrated aggregately against roadway counts and RTD transit boardings. External data from 2005 was used wherever possible to ensure that the model was correctly capturing observed 2005 Denver travel behavior when 2005 inputs were used in the model. The following 2005 datasets were used to calibrate against: 2005 American Community Survey (ACS) 2005 Colorado state demographer data 2005 Colorado Department of Transportation (CDOT) highway counts 2005 HPMS estimated regional VMT 2005 Regional Transportation District (RTD) transit boardings and 2005 Compass trip-based model results. Once comparisons were made of model results against the observed datasets, each model component was calibrated. The calibration involved changing utility function constants, coefficients, and adding variables. Then the model was re-run, results compared again, and modifications made again. This process was iterated as time allowed until satisfactory results were achieved. The major regional level model results of the calibration are shown in Table 2 and Table 3. These tables demonstrate that the aggregate model results match the observed counts and transit boardings well. 60
67 Table 2. Observed and Modeled Vehicle Miles Traveled on Links with Counts Observed VMT Modeled VMT 20,506,768 20,906,583 Table 3. Observed and Modeled Transit Boardings Observed Transit Modeled Boardings Transit Boardings 269, ,508 Air Quality Modeling Formal air pollutant emissions modeling is conducted by the APCD. However, DRCOG, the APCD, and other agencies work closely together in this effort, both in developing the modeling techniques, assumptions, and parameters, and in executing the model runs. Travel model results are, of course, one of the principal inputs to the air pollutant emissions model. The model produces estimates of the amount of emissions of carbon monoxide (CO), volatile organic compounds (VOCs), oxides of nitrogen (NOx), and particulate matter (PM10) generated by motor vehicles. The results are then combined with numerous assumptions concerning meteorology and atmospheric chemical reactions to produce air pollutant concentration estimates. 61
68 (intentionally blank) 62
69 63 APPENDIX C MODELING SUMMARY TABLES
70 (intentionally blank) 64
71 Table 1 Denver Regional Council of Governments Assumptions for the Entire Modeling Area and Data for Base and Future Years Base Year (2010) Interim Year (2015) Future Year (2035) Total Population 2,932,277 3,190,145 4,451,769 Employment 1,578,419 1,746,534 2,613,377 Annual Growth Rate (Pop.) - 1.7% 1.6% Dwelling Units (Households) 1,163,602 1,286,349 1,824,495 Persons/Dwelling Unit (Household) VMT by Roadway Type -Freeway 27,371,113 29,096,513 39,690,337 -Expressway 4,143,948 6,070,873 8,348,377 -Principal 23,411,715 26,256,796 37,665,332 -Minor 8,125,521 7,450,889 10,619,409 -Other (Collectors, Centroid Connectors, Ramps) 10,827,536 11,339,541 17,064,104 Total 73,879,832 80,214, ,387,559 Speed by Roadway Type (miles per hour) -Freeway Expressway Principal Minor Other (Collectors, Centroid Connectors, Ramps) Total (Average Speed) Lane Miles by Roadway Type -Freeway 2,084 2,143 2,327 -Expressway Principal 3,403 4,052 4,864 -Minor 2,783 2,629 2,677 -Other (Collectors, Centroid Connectors, Ramps) 3,910 3,853 3,793 Total 12,631 13,271 14,292 65
72 Table 2 8-Hour Ozone Emission Rates (Gram/Mile) For the DRCOG Modeling Area Intermediate Year Intermediate Year Future Year (2015) (2025) (2035) VOC NOx
73 APPENDIX D MEMORANDUM OF AGREEMENT TRANSPORTATION CONFORMITY EVALUATIONS CONDUCTED UNDER THE 8-HOUR OZONE STANDARD 67
74 (intentionally blank) 68
75 MEMORANDUM OF AGREEMENT FOR TRANSPORTATION CONFORMITY EVALUATIONS CONDUCTED UNDER THE 8-HOUR OZONE STANDARD BY AND BETWEEN THE COLORADO DEPARTMENT OF PUBLIC HEALTH AND ENVIRONMENT, THE DENVER REGIONAL AIR QUALITY COUNCIL, THE COLORADO DEPARTMENT OF TRANSPORTATION, THE UPPER FRONT RANGE TRANSPORTATION PLANNING REGION, THE NORTH FRONT RANGE TRANSPORTATION AND AIR QUALITY PLANNING COUNCIL (a.k.a. the North Front Range MPO), AND THE DENVER REGIONAL COUNCIL OF GOVERNMENTS March 14, 2008 Abbreviations Guide APCD Air Pollution Control Division AQCC Air Quality Control Commission, ( the Commission ) CDPHE Colorado Department of Public Health and Environment CDOT - Colorado Department of Transportation DRCOG Denver Regional Council of Governments MOA Memorandum of Agreement MPA Metropolitan Planning Area MPO Metropolitan Planning Organization NFR North Front Range NFRT& AQPC North Front Range Transportation & Air Quality Planning Council (the NFR MPO) NOx Nitrogen Oxides RAQC (Denver) Regional Air Quality Council SIP State Implementation Plan UFR Upper Front Range TIP Transportation Improvement Program TPR Transportation Planning Region USDOT United States Department of Transportation USEPA United States Environmental Protection Agency VOC Volatile Organic Compounds Terminology Consulting parties Those agency parties involved in data and document review for the purposes making or commenting on a Conformity Determination. Includes the Air Quality Control Commission, USDOT and USEPA, who are not signatory parties to this MOA. Signatories/Signatory parties The parties signatory to this document. This group of six agencies does not include USDOT or USEPA. Page 1 of 7
76 On-road motor vehicle Refers to cars, trucks, buses, motorcycles, vans and other motorized vehicles that use public highways, streets and roadways; to be distinguished from motor vehicles that may be designed for off-road use, e.g., all-terrain vehicles, and from agricultural and construction equipment. A. Background and Purpose The U.S. Environmental Protection Agency (USEPA) has designated an area (See map, Attachment A) inclusive of the Denver Metro Area and portions of both the North Front Range Metropolitan Planning area and the Upper Front Range Transportation Planning Region as nonattainment under the 8-hour ozone standard. The nonattainment designation became effective November 20, The Upper Front Range TPR is not represented by a Metropolitan Planning Organization as it comprises a largely rural area. Furthermore, the TPR lacks the expertise and wherewithal to provide or purchase transportation and modeling forecasts as part of the Conformity Determination process for the 8-hour ozone area. Federal Transportation Regulations at 23CFR (b) state that where a metropolitan planning area does not include an entire nonattainment area or maintenance area, there shall be written agreement among the State Department of Transportation, State air quality agency, affected local agencies, and the MPO describing the process for cooperative planning and analysis of all projects outside the MPA within the nonattainment or maintenance area. The agreement must also indicated how the total transportation-related emissions for the nonattainment or maintenance area, including areas outside the MPA, will be treated for the purposes of determining conformity in accordance with EPA s transportation conformity rule (40 CFR Part 93). The agreement shall address policy mechanisms for resolving conflicts concerning transportation-related emissions (and) (c): In nonattainment or maintenance areas, if the MPO is not the designated agency for air quality planning there shall be a written agreement between the MPO and the designated air quality planning agency describing their respective roles and responsibilities for air quality related transportation planning. (d) If more than one MPO has been designated to serve an urbanized area, there shall be written agreement among the MPOs, the State(s), and the public transportation operator(s) describing how the metropolitan transportation planning processes will be coordinated to assure the development of consistent metropolitan transportation plans and TIPs across the MPA boundaries. Similarly, EPA regulations at 40 CFR (e) and require states to create consultation procedures in the SIP whereby MPO representatives, state and local air quality planning agencies, state and local transportation agencies and other organizations must consult with each other and with U.S. Environmental Protection Agency (USEPA) and U.S. Department of Transportation (USDOT) regarding development of State Implementation Plans (SIPs), transportation plans, transportation improvement programs (TIPs), and Conformity Determinations. This Memorandum of Agreement (MOA) is designed to allow for and to guide cooperative transportation planning in conformance with State air quality plans, and related review and analysis in the pursuit of transportation Conformity Determinations associated with the 8-hour ozone State Implementation Plan (SIP). B. Conformity Determinations Prior to/in Lieu of the Establishment of On-Road Motor Vehicle Emission Budgets The first Conformity Determination for the area of concern is due November 20, 2008, as required by the federal Conformity Rule at 40 CFR (d). Since adequate or Page 2 of 7
77 approved motor vehicle emission budgets will not be available until late 2009, one or more Conformity Determinations for the nonattainment or maintenance area of concern must follow the procedures at 40 CFR (e)(2)(iii). The Denver Regional Council of Governments and the North Front Range MPO shall perform transportation emissions forecasting for the respective areas described in Section C.1 and C.2 for Conformity Determinations, regardless of whether emission budgets have been established, and regardless of whether overall nonattainment-or maintenance area emission budgets or sub-area emission budgets are used. C. Motor Vehicle Emission Budgets for the 8-Hour Ozone Nonattainment (or Maintenance) Area and Sub-Areas In the SIP development process, the Air Pollution Control Division (APCD), the North Front Range Metropolitan Planning Organization (NFRMPO), and the Regional Air Quality Council (RAQC) shall work together to propose overall area motor vehicle emission budgets for volatile organic compounds (VOC) and nitrogen oxides (NOx) for the 8-hour ozone nonattainment or maintenance area. Said budgets must be adopted by the Commission and affirmed via USEPA adequacy determinations in order to become viable for use in Conformity Determinations. Sub-area emission budgets for ozone precursors under the 8-hour ozone standard may also be proposed to the AQCC for the following two sub-areas: 1. The combined areas of the Denver Metro Region and the southern portion of the Upper Front Range Transportation Planning Region (TPR) as designated nonattainment by USEPA, i.e., the area south of the north line of Township 3 north of the 6 th Principal Meridian; said line is the southern boundary of the North Front Range MPO extended to the east line of Weld County. For this sub-area, the budgets for NOx and VOC shall be proposed during SIP development for the federal 8-hour ozone standard by the RAQC with input from the APCD, CDOT, DRCOG, and UFR to be considered for adoption by the Commission. 2. The combined areas of the North Front Range MPO area and the northern portion of the Upper Front Range TPR, as designated nonattainment by USEPA, i.e., the area north of the north line of Township 3 north of the 6th Principal Meridian; said line is the southern boundary of the North Front Range MPO extended to the east line of Weld County. For this sub-area, the budgets for NOx and VOC shall be proposed determined during SIP development for under the federal 8-hour ozone standard by the NFR MPO in consultation with the APCD and the RAQC, with input from CDOT and UFR, to be considered for adoption by the Commission. Page 3 of 7
78 Sub-area budgets, agreed to by the signatories and approved by the Commission, may be used to measure the conformity of plans and programs for the respective areas, once determined adequate by the USEPA. Sub-areas as described above and Conformity procedures described in this document shall remain the same when and if the 8-Hour Nonattainment Area is re-designated an Attainment/Maintenance Area. D. Granting of Authority, Responsibilities The Upper Front Range TPR lacks the expertise and wherewithal to provide or purchase transportation and modeling forecasts as part of the Conformity Determination process for the 8-hour ozone area. By this agreement: 1. The DRCOG agrees to provide transportation forecasts and make Conformity Determinations for the area described in Section C.1 above. The area includes the DRCOG MPO area and other 8-hour ozone nonattainment areas within the DRCOG TPR, as well as a portion of the nonattainment area of the Upper Front Range TPR. 2. The North Front Range MPO agrees to provide transportation forecasts and make Conformity Determinations for an area described in Section C.2 above. The area includes North Front Range MPO 8-hour ozone nonattainment areas as well as portions of the Upper Front Range TPR nonattainment area. 3. The Upper Front Range TPR authorizes the DRCOG and the NFR MPO to prepare transportation forecasts and make Conformity Determinations for the relevant nonattainment areas of the Upper Front Range as described in Section C of this document. 4. The agreed-upon transportation forecasting authorities shall continue for the 8-Hour Ozone Area after it is re-designated Attainment/Maintenance status by USEPA. Page 4 of 7
79 E. Compensation to MPOs for Additional Responsibilities It is anticipated that over the next one-to-four years, funding will be needed for enhanced transportation forecasting and to perform Conformity Determinations for the Upper Front Range areas of concern. The CDOT has the responsibility to fund required Conformity Determinations and associated transportation modeling efforts for areas outside of the MPOs. As forecasting and modeling work for the UFR will extend beyond the MPO boundaries, the CDOT will provide necessary funding to DRCOG and NFR based upon a mutually agreeable course of action delineating tasks, schedule, and costs among the signatory agencies. The signatory agencies will look to the USEPA and USDOT to assure consistency with federal requirements regarding tasks. The CDOT will execute separate intergovernmental agreements with the NFRMPO and DRCOG detailing the specific work that will be done for the agreed-to compensation. F. Conformity Review Procedural The agencies shall follow the interagency consultation process and procedures identified in Colorado Air Quality Control Commission Regulation No. 10 for sharing information and conducting review of transportation data, projections, and determining Transportation Conformity to the State Implementation Plan under the 8-hour ozone standard, and generally the process outlined in memoranda of agreement for Transportation Conformity evaluations by and between the CDPHE and the Denver Regional Council of Governments (1998) and with the North Front Range Transportation and Air Quality Planning Council (2003). The DRCOG and NFR MPO shall provide forecasts for their respective areas as described in Section C. 1 and C.2. In cases where one Conformity finding is to be made for the overall 8-Hour Ozone Nonattainment (or Attainment/Maintenance) Area, and no sub-area emission budgets are to be used, the MPOs, in consultation with the other signatory parties and with USEPA and USDOT, shall sum the ozone precursor emissions from their respective areas for overall-area totals of VOC and NOx, to determine whether forecasted emissions meet the appropriate Conformity test(s). In such cases, the MPOs jointly shall produce one Conformity Determination document for the overall 8- Hour Ozone Nonattainment (or Attainment/Maintenance) Area. The APCD will perform independent emission budget tests and other applicable analyses for the overall Nonattainment (or Attainment/Maintenance) region and, as well as for the sub-areas described in C.1 and C.2 if sub-area budgets are to be used, within 30 days of receiving the final submittal of transportation data, although such data will be submitted to the APCD as early in the process as possible. The APCD may also assist with enhanced emissions forecasting for the Upper Front Range area, or provide other in-kind assistance to emissions forecasting efforts. Page 5 of 7
80 Assuming the APCD agrees with a Conformity Determination, it will recommend that the Air Commission comment formally via letter to the relevant MPO and to CDOT regarding its concurrence. In the event that future sub-area emissions exceed a Conformity test or emission budget, the sub-area MPO shall immediately and diligently pursue actions, e.g., transportation plan and/or TIP amendment, that would bring projected emissions under budget (or in line with the Conformity test being used) and thus to conform to the SIP (and/or not threaten to increase the severity of the 8-Hour Area s nonattainment status). Such endeavor would be pursued as part of standard interagency process. If the sub-area were to fail to meet a Conformity test/make a positive Conformity Determination, all parties to this MOA shall confer on an emergency basis to review emission budgets and to consider the merits of the following actions, which may be needed to achieve or to re-establish Conformity: Potential revisions to transportation plans and/or transportation programs Potential modeling (by both MPO s) of the entire nonattainment (or Attainment/Maintenance) Area for a Conformity Determination, if allowed by the SIP Potential appeal (via the SIP process) for emission budget revisions Potential additional SIP revisions. A course of action employing one or more of the above-listed actions shall be determined by the parties to this agreement. Parties may appeal to the USDOT and USEPA for guidance in establishing Conformity. G. Dispute Resolution Any protracted disagreements between consulting parties reviewing a Conformity Determination shall be elevated to the Commission, per the provisions in AQCC Regulation No. 10. Any continuing dispute that devolves or threatens to devolve into a situation of official non-conformance of transportation plans with the State Implementation Plan may be elevated to the Governor, just as a disputed Conformity Determination may be elevated to the Governor, as provided in AQCC Regulation No. 10 and at 40 CFR Section (d). H. Termination of Agreement This agreement shall be binding upon the signatory parties until the 8-hour ozone area has achieved attainment status and maintains said status for a period of at least 20 years, unless the undersigned agencies revise or replace this MOA via unanimous, written agreement. Page 6 of 7
81
82
2013 AMENDMENT CYCLE 2 DENVER SOUTHERN SUBAREA 8-HOUR OZONE CONFORMITY DETERMINATION
 2013 AMENDMENT CYCLE 2 DENVER SOUTHERN SUBAREA 8-HOUR OZONE CONFORMITY DETERMINATION for the DRCOG Amended Fiscally Constrained 2035 Regional Transportation Plan and the Amended 2012-2017 Transportation
DRCOG 2040 METRO VISION REGIONAL TRANSPORATION PLAN DENVER SOUTHERN SUBAREA 8-HOUR OZONE CONFORMITY DETERMINATION
 DRCOG 2040 METRO VISION REGIONAL TRANSPORATION PLAN DENVER SOUTHERN SUBAREA 8-HOUR OZONE CONFORMITY DETERMINATION for the DRCOG 2040 Fiscally Constrained Regional Transportation Plan and the 2018-2021
2009 Amendment Cycle 2 Denver-North Front Range Joint Interim 8-Hour Ozone Conformity Determination
 2009 Amendment Cycle 2 Denver-North Front Range Joint Interim 8-Hour Ozone Conformity Determination for the DRCOG Amended Fiscally Constrained 2035 Regional Transportation Plan and the Amended 2008-2013
2011 Amendment Cycle 1 DRCOG CO and PM 10 Conformity Determination
 2011 Amendment Cycle 1 DRCOG CO and PM 10 Conformity Determination for the Amended Fiscally Constrained 2035 Regional Transportation Plan and the Amended 2012-2017 Transportation Improvement Program Denver
DRAFT Denver-North Front Range (Northern Subarea) 8-Hour Ozone Nonattainment Area Conformity Determination
 8-Hour Ozone Nonattainment Area Conformity Determination") DRAFT Denver-North Front Range (Northern Subarea) 8-Hour Ozone Nonattainment Area Conformity Determination for the North Front Range Metropolitan Planning Area FY2019-2022 Transportation Improvement Program
DRAFT Denver-North Front Range (Northern Subarea) 8-Hour Ozone Nonattainment Area Conformity Determination for the North Front Range Metropolitan Planning Area FY2019-2022 Transportation Improvement Program
Fort Collins and Greeley Carbon Monoxide Maintenance Areas Conformity Determination
 Updated March 3, 2017 Fort Collins and Greeley Carbon Monoxide Maintenance Areas Conformity Determination for the North Front Range Metropolitan Planning Area 2040 Fiscally Constrained Regional Transportation
I-70 East ROD 1: Phase 1 (Central 70 Project) Air Quality Conformity Technical Report
 Air Quality Conformity Technical Report") I-70 East ROD 1: Air Quality Conformity Technical Report January 2017 I-70 East ROD 1: Air Quality Conformity Technical Report TABLE OF CONTENTS Chapter Page 1 PURPOSE OF THIS REPORT... 1 2 PROJECT DESCRIPTION...
I-70 East ROD 1: Air Quality Conformity Technical Report January 2017 I-70 East ROD 1: Air Quality Conformity Technical Report TABLE OF CONTENTS Chapter Page 1 PURPOSE OF THIS REPORT... 1 2 PROJECT DESCRIPTION...
Denver-North Front Range (Northern Subarea) 8-Hour Ozone Nonattainment Area Conformity Determination
 8-Hour Ozone Nonattainment Area Conformity Determination") Denver-North Front Range (Northern Subarea) 8-Hour Ozone Nonattainment Area Conformity Determination for the North Front Range Metropolitan Planning Area 2040 Fiscally Constrained Regional Transportation
Denver-North Front Range (Northern Subarea) 8-Hour Ozone Nonattainment Area Conformity Determination for the North Front Range Metropolitan Planning Area 2040 Fiscally Constrained Regional Transportation
AIR QUALITY CONFORMITY ANALYSIS: VISUALIZE 2045 SCOPE OF WORK
 December 14, 2017 AIR QUALITY CONFORMITY ANALYSIS: VISUALIZE 2045 SCOPE OF WORK I. INTRODUCTION Projects solicited for the quadrennial update of the region s transportation plan, Visualize 2045, and the
Wood-Washington-Wirt Interstate Planning Commission (WWW-IPC) PM 2.5 Air Quality Conformity Determination Report [2005]
![Wood-Washington-Wirt Interstate Planning Commission (WWW-IPC) PM 2.5 Air Quality Conformity Determination Report [2005]](/thumbs/94/120791542.jpg "Wood-Washington-Wirt Interstate Planning Commission (WWW-IPC) PM 2.5 Air Quality Conformity Determination Report [2005]") Wood-Washington-Wirt Interstate Planning Commission (WWW-IPC) PM 2.5 Air Quality Conformity Determination Report [2005] [Technical Report-Summary] Prepared by Sreevatsa Nippani, Transportation Specialist,
Wood-Washington-Wirt Interstate Planning Commission (WWW-IPC) PM 2.5 Air Quality Conformity Determination Report [2005] [Technical Report-Summary] Prepared by Sreevatsa Nippani, Transportation Specialist,
Chapter #9 TRAVEL DEMAND MODEL
 Chapter #9 TRAVEL DEMAND MODEL TABLE OF CONTENTS 9.0 Travel Demand Model...9-1 9.1 Introduction...9-1 9.2 Overview...9-1 9.2.1 Study Area...9-1 9.2.2 Travel Demand Modeling Process...9-3 9.3 The Memphis
Appendix E. Air Quality Conformity Analysis
 Appendix E Air Quality Conformity Analysis AIR QUALITY CONFORMITY ANALYSIS FOR THE DRAFT 2019-2022 REGIONAL TRANSPORTATION IMPROVEMENT PROGRAM INTRODUCTION This paper documents the positive air quality
DRAFT 2015 OZONE CONFORMITY ANALYSIS FOR THE 2019 FEDERAL TRANSPORTATION IMPROVEMENT PROGRAM AND THE 2018 REGIONAL TRANSPORTATION PLAN
 DRAFT 2015 OZONE CONFORMITY ANALYSIS FOR THE 2019 FEDERAL TRANSPORTATION IMPROVEMENT PROGRAM AND THE 2018 REGIONAL TRANSPORTATION PLAN JANUARY 9, 2019 KINGS COUNTY ASSOCIATION OF GOVERNMENTS This report
Database and Travel Demand Model
 Database and Travel Demand Model 7 The CMP legislation requires every CMA, in consultation with the regional transportation planning agency (the Metropolitan Transportation Commission (MTC) in the Bay
Denver Regional Council of Governments. FY 2018 and FY 2019 UNIFIED PLANNING WORK PROGRAM FOR THE DENVER REGION
 Denver Regional Council of Governments FY 2018 and FY 2019 UNIFIED PLANNING WORK PROGRAM FOR THE DENVER REGION Adopted July 19, 2017 ii ABSTRACT TITLE: AUTHOR: SUBJECT: FY 2018 and FY 2019 Unified Planning
Conformity Analysis and Determination Report
 Conformity Analysis and Determination Report 2035 Long Range Transportation Plans: Burlington-Graham Metropolitan Planning Organization (Guilford County) Greensboro Urban Area Metropolitan Planning Organization
The Regional Transportation Plan Appendix D. Regional Air Quality Conformity Analysis. Puget Sound Regional Council.
 The 2018 Appendix D Regional Air Quality Conformity Analysis May 2018 Puget Sound Regional Council May 2018 Funding for this document provided in part by member jurisdictions, grants from U.S. Department
Denver Regional Council of Governments. FY 2016 and FY 2017 UNIFIED PLANNING WORK PROGRAM FOR THE DENVER REGION
 Denver Regional Council of Governments FY 2016 and FY 2017 UNIFIED PLANNING WORK PROGRAM FOR THE DENVER REGION Adopted July 15, 2015 Amended July 20, 2016 Administratively Amended February 8, 2017 ii ABSTRACT
Appendix E. Air Quality Conformity Analysis
 Appendix E Air Quality Conformity Analysis AIR QUALITY CONFORMITY ANALYSIS FOR THE 2017-2020 REGIONAL TRANSPORTATION IMPROVEMENT PROGRAM Table of Contents INTRODUCTION... 1 AIR QUALITY STATUS... 1 Figure
AIR QUALITY CONFORMITY ANALYSIS
 AIR QUALITY CONFORMITY ANALYSIS For the 2011 Regional Transportation Plan and 2013 Federal Transportation Improvement Program Adopted on July 25, 2012 Stanislaus Council of Governments 1111 I Street, Suite
2040 Fiscally Constrained Regional Transportation Plan
 Denver Regional Council of Governments 2040 Fiscally Constrained Regional Transportation Plan Public Hearing Draft December 18, 2014 1290 Broadway, Suite 700 Denver, CO 80203 www.drcog.org Preparation
2040 Fiscally Constrained Regional Transportation Plan
 Denver Regional Council of Governments 2040 Fiscally Constrained Regional Transportation Plan TAC Review Draft: December 1, 2014 DRCOG Board Adoption: 1290 Broadway, Suite 700 Denver, CO 80203 www.drcog.org
Executive Summary. Milestones and Background
 Executive Summary Milestones and Background On January 25 and February 1, 2011 respectively, the Federal Highway Administration certified that the Houston- Galveston area s 2035 Regional Transportation
DENVER REGIONAL COUNCIL OF GOVERNMENTS 1290 BROADWAY, SUITE 100 DENVER, CO
 DENVER REGIONAL COUNCIL OF GOVERNMENTS 1290 BROADWAY, SUITE 100 DENVER, CO 80203 WWW.DRCOG.ORG Preparation of this report has been financed in part through grants from the U.S. Department of Transportation,
APPENDIX VIII AIR QUALITY CONFORMITY ANALYSIS
 2018 Kings County Regional Transportation Plan APPENDIX VIII AIR QUALITY CONFORMITY ANALYSIS H:\RTPA\2018 RTP Update\Final RTP\APPENDIX VIII - Air Quality Conformity Title Page.docx Appendix VIII CONFORMITY
Amendment 4 - OKI 2040 REGIONAL TRANSPORTATION PLAN
 Amendment 4 - OKI 2040 REGIONAL TRANSPORTATION PLAN October, 2018 Prepared by the Ohio-Kentucky-Indiana Regional Council of Governments Acknowledgments Title Amendment 4 - OKI 2040 Regional Transportation
APPENDIX H: TRAVEL DEMAND MODEL VALIDATION AND ANALYSIS
 APPENDIX H: TRAVEL DEMAND MODEL VALIDATION AND ANALYSIS Travel demand models (TDM) simulate current travel conditions and forecast future travel patterns and conditions based on planned system improvements
ATTACHMENT 3. Background:
 Colorado Tolling Enterprise (CTE) or High Performance Transportation Enterprise Additional Information Requirements for Amendment Submittals for the DRCOG Fiscally Constrained RTP Adopted by DRCOG Board
Chapter 9: Vision Plan. Chapter 9. Vision Plan. Lake Loveland. Image 179 Credit: City of Loveland
 Chapter 9 Vision Plan Lake Loveland. Image 179 Credit: City of Loveland Chapter 9: Vision Plan A. Regionally Significant Corridor and Regional Bike Corridor Visions Corridor visioning seeks to develop
CTA Blue Line Forest Park Branch Feasibility/Vision Study: Transit Ridership Forecasting Analysis Technical Memorandum Submitted By
 Feasibility/Vision Study: Technical Memorandum Submitted By WSP Parsons Brinckerhoff 30 N. LaSalle Street, Suite 4200 Chicago, IL 60602 December 2016 TABLE OF CONTENTS 1.0 INTRODUCTION... 1 1.1 Organization
TRAVEL DEMAND MODEL METHODOLOGY AND AIR QUALITY CONFORMITY ANALYSIS
 Contents APPENDIX 4 TRAVEL DEMAND MODEL METHODOLOGY AND AIR QUALITY CONFORMITY ANALYSIS Section 1 - Travel Demand Forecast Model Procedures and Assumptions Section 2 - Population and Employment Forecasts
IMPLICATIONS OF BEING DESIGNATED NONATTAINMENT
 IMPLICATIONS OF BEING DESIGNATED NONATTAINMENT WTS San Antonio/SWITE Professional Development Seminar Jenny Narvaez, Principal Air Quality Planner North Central Texas Council of Governments August 4, 2017
ITEM 9 Action October 18, 2017
 ITEM 9 Action October 18, 2017 Approval of the Air Quality Conformity Analysis of the VDOT and MDOT Off-Cycle Amendment to the 2016 CLRP and Approval of the 2016 Off-Cycle Amendment Staff Recommendation:
Transportation and Utilities
 4 Section 4 Transportation and Utilities 4.0 Introduction Transportation and utility systems are essential to accommodate and support development proposed in the Future Land Use Map. The following pages
APPENDIX TRAVEL DEMAND MODELING OVERVIEW MAJOR FEATURES OF THE MODEL
 APPENDIX A TRAVEL DEMAND MODELING OVERVIEW The model set that the Central Transportation Planning Staff (CTPS), the Boston Region Metropolitan Planning Organization s (MPO) technical staff, uses for forecasting
Pinal County Nonattainment Areas Regional Emissions Analysis
 CONSULTATION ON A CONFORMITY ASSESSMENT FOR AN AMENDMENT TO THE FY 2016-2025 SUN CORRIDOR MPO TRANSPORTATION IMPROVEMENT PROGRAM AND REGIONAL TRANSPORTATION PLAN 2040 The Sun Corridor Metropolitan Planning
Triad Air Quality Conformity Determination Report 2040 Metropolitan Transportation Plan; and Transportation Improvement Plan (TIP)
") Triad Air Quality Conformity Determination Report 2040 Metropolitan Transportation Plan; and 2016-2020 Transportation Improvement Plan (TIP) Burlington-Graham Metropolitan Planning Organization (Guilford
Triad Air Quality Conformity Determination Report 2040 Metropolitan Transportation Plan; and 2016-2020 Transportation Improvement Plan (TIP) Burlington-Graham Metropolitan Planning Organization (Guilford
Air Quality Conformity Determination
 14 Air Quality Conformity Determination 2016 Regional Transportation Plan 14 Air Quality Conformity Determination Amended 8/28/18 Introduction This report documents the air quality conformity determination
9. TRAVEL FORECAST MODEL DEVELOPMENT
 9. TRAVEL FORECAST MODEL DEVELOPMENT To examine the existing transportation system and accurately predict impacts of future growth, a travel demand model is necessary. A travel demand model is a computer
AIR QUALITY CONFORMITY DETERMINATION
 AIR QUALITY CONFORMITY DETERMINATION Massachusetts Department of Transportation (MassDOT) and the Metropolitan Planning Organizations (MPOs) Introduction July 2018 This report documents the air quality
AIR QUALITY CONFORMITY DETERMINATION
 Massachusetts Department of Transportation (MassDOT) and the Metropolitan Planning Organizations (MPOs) July 2018 Introduction This report documents the air quality conformity determination for the Massachusetts
AIR QUALITY CONFORMITY DETERMINATION
 Massachusetts Department of Transportation (MassDOT) and the Metropolitan Planning Organizations (MPOs) July 2018 Introduction This report documents the air quality conformity determination for the Massachusetts
AMENDMENT TWO TO CHARTING PROGRESS TO 2040
 A2 AMENDMENT TWO TO CHARTING PROGRESS TO 2040 AIR QUALITY CONFORMITY DETERMINATION MASSACHUSETTS DEPARTMENT OF TRANSPORTATION AND THE METROPOLITAN PLANNING ORGANIZATIONS JULY 2018 INTRODUCTION This report
OKI S CONFORMITY PROCESS
 AIR QUALITY CONFORMITY DETERMINATION FOR THE OKI 2040 METROPOLITAN TRANSPORTATION PLAN AND THE AMENDED OKI FY 2018 FY2021 TRANSPORTATION IMPROVEMENT PROGRAM (AMENDMENT 9C) FOR THE KENTUCKY PORTION OF THE
Transit Element of the 2035 Metro Vision Regional Transportation Plan
 Transit Element of the 2035 Metro Vision Regional Transportation Plan Denver Regional Council of Governments 1290 Broadway, Ste. 700 Denver, Colorado 80203 Preparation of this report has been financed
MOBILITY AND ALTERNATIVES ANALYSIS
 6 MOBILITY AND ALTERNATIVES ANALYSIS BACK OF SECTION DIVIDER 6.0 Mobility and Alternatives Analysis Travel demand analysis provides a framework for the identification of transportation facilities and services
CHAPTER 7. TRAVEL PATTERNS AND TRAVEL FORECASTING
 CHAPTER 7. TRAVEL PATTERNS AND TRAVEL FORECASTING TRAVEL PATTERNS Northwest Arkansas has experienced unprecedented growth in population and employment in the past 25 years. The economic vitality and diversity
CHAPTER 6: CUMULATIVE IMPACTS
 CHAPTER 6: CUMULATIVE IMPACTS A cumulative impacts analysis considers all aspects of the environment affected by project alternatives in the context of other past, present, and reasonably foreseeable future
REDESIGNATION REQUEST AND MAINTENANCE PLAN FOR THE CINCINNATI-HAMILTON, OH-KY-IN 8- HOUR OZONE NONATTAINMENT AREA
 REDESIGNATION REQUEST AND MAINTENANCE PLAN FOR THE CINCINNATI-HAMILTON, OH-KY-IN 8- HOUR OZONE NONATTAINMENT AREA Butler, Clermont, Clinton, Hamilton, and Warren Counties, Ohio Prepared by: Ohio Environmental
6.0 CONGESTION HOT SPOT PROBLEM AND IMPROVEMENT TRAVEL DEMAND MODEL ANALYSIS
 6.0 CONGESTION HOT SPOT PROBLEM AND IMPROVEMENT TRAVEL DEMAND MODEL ANALYSIS 6.1 MODEL RUN SUMMARY NOTEBOOK The Model Run Summary Notebook (under separate cover) provides documentation of the multiple
Base Information. 1. Project Title SH52 Planning & Environmental Linkages (PEL) Study
 Study") Part 1 Base Information 1. Project Title SH52 Planning & Environmental Linkages (PEL) Study 2. Project Start/End points or Geographic Area Provide a map with submittal, as appropriate 3. Project Sponsor
Part 1 Base Information 1. Project Title SH52 Planning & Environmental Linkages (PEL) Study 2. Project Start/End points or Geographic Area Provide a map with submittal, as appropriate 3. Project Sponsor
Air Quality Technical Memorandum
 Southeast Extension Project Lincoln Station to RidgeGate Parkway Prepared for: Federal Transit Administration Prepared by: Denver Regional Transportation District May 2014 Table of Contents Page No. Chapter
Chapter 3 - Goals, Objectives, & Strategies
 Chapter 3 - This chapter presents goals, objectives, and strategies that have been developed as part of the Richmond Area MPO 2026 Long-Range Transportation Plan (LRTP) update. Strategies have been developed
Highest Priority Performance Measures for the TPP
 Highest Priority Performance Measures for the TPP The following list of measures are the highest priority performance measures as identified by modal working groups. These groups consist of staff from
Travel Demand Forecasting User Guide
 Travel Demand Forecasting User Guide A Supplement to the Regional Transitway Guidelines Metropolitan Council February 2012 This document supplements the Project Development, Leadership, and Oversight discussion
AGENDA REGIONAL TRANSPORTATION COMMITTEE Tuesday, July 18, :30 a.m Broadway Independence Pass Board Room
 AGENDA REGIONAL TRANSPORTATION COMMITTEE Tuesday, July 18, 2017 8:30 a.m. 1290 Broadway Independence Pass Board Room 1. Call to Order 2. Public Comment 3. April 18, 2017 RTC Meeting Summary (Attachment
Base Information. 1. Project Title Hokestra Trail Realignment and Bridge Safety Improvements
 Part 1 Base Information 1. Project Title Hokestra Trail Realignment and Bridge Safety Improvements 2. Project Start/End points or Geographic Area Provide a map with submittal, as appropriate 3. Project
INVITATION TO BID TRAVEL DEMAND MODEL UPDATE #P PROPOSAL DUE DATE: 5:00 PM Mountain Daylight Time (MDT), Friday, September 22, 2017
, Friday, September 22, 2017") Purchasing 419 Canyon Avenue, Suite 300 Fort Collins, CO 80521 Phone: (970) 221-6243 Fax: (970) 416-2406 Website: nfrmpo.org INVITATION TO BID TRAVEL DEMAND MODEL UPDATE #P2017-001 PROPOSAL DUE DATE: 5:00
Purchasing 419 Canyon Avenue, Suite 300 Fort Collins, CO 80521 Phone: (970) 221-6243 Fax: (970) 416-2406 Website: nfrmpo.org INVITATION TO BID TRAVEL DEMAND MODEL UPDATE #P2017-001 PROPOSAL DUE DATE: 5:00
CHAPTER 9 TRAVEL DEMAND MODEL SUMMARY
 CHAPTER 9 TRAVEL DEMAND MODEL SUMMARY This chapter describes the OKI / MVRPC regional travel demand model, used to support traffic and transit forecasts for the NSTI study. This model is based on version
Section 7 Environmental Constraints
 Section 7 Environmental Constraints i Yakima Valley Metropolitan and Regional Transportation Plan Public Comment DRAFT 1/27/2016 Environmental Constraints Analysis A programmatic-level review of potential
Travel Demand Modeling At NCTCOG
 Travel Demand Modeling At NCTCOG Arash Mirzaei North Central Texas Council Of Governments For University of Texas at Arlington ITE Student Chapter March 9, 2005 Agenda Background DFW Regional Model Structure
AIR QUALITY AND CLIMATE CHANGE EVALUATION GUIDANCE
 AIR QUALITY AND CLIMATE CHANGE EVALUATION GUIDANCE The following guidance provides additional details regarding the process followed by PSRC to evaluate projects for potential air quality benefits. As
report final Decennial Model Update Executive Summary Contra Costa Transportation Authority Cambridge Systematics, Inc.
 final report prepared for Contra Costa Transportation Authority prepared by with Dowling Associates Caliper Corporation June 2003 Table of Contents 1.0 Introduction... ES-1 2.0 Data Development... ES-5
Appendix B Southeast Extension Technical Framework Report (RTD, December 15, 2011) Southeast Corridor Extension Scoping Report
 Southeast Corridor Extension Scoping Report") Appendix B Southeast Extension (RTD, December 15, 2011) Southeast Corridor Extension Scoping Report I~fib FASYRACKS lliiiifl/ 1560 Broadway, Suite 700, Denver, CO 80202 phone 303.299.6990 December 15,
Appendix B Southeast Extension (RTD, December 15, 2011) Southeast Corridor Extension Scoping Report I~fib FASYRACKS lliiiifl/ 1560 Broadway, Suite 700, Denver, CO 80202 phone 303.299.6990 December 15,
2030 Transportation Policy Plan SUMMARY PRESENTATION. Land Use Advisory Committee November 15, 2012
 2030 Transportation Policy Plan SUMMARY PRESENTATION Land Use Advisory Committee November 15, 2012 Today s Topics Transportation Policy Plan (TPP) Requirements and Background Current TPP Policies, Issues
2035 LRTP Transportation Options Introduction
 2035 LRTP Transportation Options Introduction What is the 2035 LRTP? The 2035 Long-Range Transportation Plan (LRTP) is the guide for major transportation investments in the Durham-Chapel Hill-Carrboro
Congestion Management Process 2013 Update
 OVERVIEW OF THE DALLAS-FORT WORTH CONGESTION MANAGEMENT PROCESS Traffic Congestion In The Dallas-Fort Worth Region With the Dallas-Fort Worth (DFW) urban area as its center, the North Central Texas region
Quality of Life Study Baseline Report
 February 2008 Quality of Life Study Baseline Report - 2006 Table of Contents Executive Summary...i I. Introduction...1 Purpose of the Study...1 Measuring FasTracks Effects...1 Data Collection and Reporting...1
CHAPTER 2 - TRAVEL DEMAND MODEL DEVELOPMENT
 CHAPTER 2 - TRAVEL DEMAND MODEL DEVELOPMENT 2.1 EXISTING TRAVEL DEMAND MODEL In order to accurately project future year traffic volumes within this regional study area, it was first necessary to construct
Congestion Management Process (CMP)
") Congestion Management Process (CMP) Introduction The Congestion Management Process (CMP) is a systematic, data-driven, and regionally accepted approach that aims to improve the performance of the transportation
Congestion Management Process (CMP) Introduction The Congestion Management Process (CMP) is a systematic, data-driven, and regionally accepted approach that aims to improve the performance of the transportation
The Metropolitan Transportation Plan for North Central Texas. Regional Transportation Council Chad McKeown, AICP January 14, 2016
 The Metropolitan Transportation Plan for North Central Texas Regional Transportation Council Chad McKeown, AICP January 14, 2016 Mobility 2040 Guiding Principles Conduct comprehensive corridor evaluations
Traffic Data Collection Programs for PM 2.5 Non-Attainment Areas
 Traffic Data Collection Programs for PM 2.5 Non-Attainment Areas Jack Stickel Alaska Department of Transportation and Public Facilities NATMEC 23 June, 2010 Traffic Data to Address Air Quality and Climate
Recommended Roadway Plan Section 3 Existing Facilities & System Performance
 Recommended Roadway Plan Section 3 Existing Facilities & System Performance RECOMMENDED ROADWAY PLAN SECTION 3 Existing Facilities and System Performance 3.1 Introduction An important prerequisite to transportation
APPENDIX A - PLANS AND POLICY REVIEW FEBRUARY 2017
 APPENDIX A - PLANS AND POLICY REVIEW FEBRUARY 2017 DENVERMOVES Transit Denver Moves: Transit APPENDIX A PLANS AND POLICY REVIEW 2035 Metro Vision Regional Transportation Plan (MVRTP) (2011) 2040 Fiscally
2040 Transportation Policy Plan Amendment #1
 2040 Transportation Policy Plan Amendment #1 Overview Amendment Purpose This 2040 Transportation Policy Plan amendment adds the Riverview Modern Streetcar transitway project to the Current Revenue Scenario.
PURPOSE OF THE TRANSPORTATION IMPROVEMENT PROGRAM (TIP)
") INTRODUCTION PURPOSE OF THE TRANSPORTATION IMPROVEMENT PROGRAM (TIP) The Transportation Improvement program (TIP) is a staged, four-year program of projects proposed for funding by federal, State, and
INTRODUCTION PURPOSE OF THE TRANSPORTATION IMPROVEMENT PROGRAM (TIP) The Transportation Improvement program (TIP) is a staged, four-year program of projects proposed for funding by federal, State, and
TRANSPORTATION IMPACT ANALYSISGUIDELINES
 TRANSPORTATION IMPACT ANALYSISGUIDELINES ADOPTED OCTOBER2014 SANTACLARAVALLEYTRANSPORTATION AUTHORITY CONGESTION MANAGEMENTPROGRAM CONGESTION MANAGEMENT PROGRAM TRANSPORTATION IMPACT ANALYSIS GUIDELINES
Final Report APRIL 21, 2004
 REVIEW OF THE RTD FASTRACKS PLAN Final Report APRIL 21, 2004 This page intentionally left blank REVIEW OF THE RTD FASTRACKS PLAN Final Report Denver Regional Council of Governments 4500 Cherry Creek South
MONITORING IMPLEMENTATION AND PERFORMANCE
 12 MONITORING IMPLEMENTATION AND PERFORMANCE The FAST Act continues the legislation authorized under MAP-21, which created a data-driven, performance-based multimodal program to address the many challenges
AIR QUALITY CONFORMITY ANALYSIS of the 2015 CLRP Amendment and the FY TIP
 TPB Item #8 AIR QUALITY CONFORMITY ANALYSIS of the 2015 CLRP Amendment and the FY2015-2020 TIP Presentation to the Transportation Planning Board September 16, 2015 Pollutants Volatile Organic Compounds
The Metropolitan Transportation Plan. Public Meetings January 2016
 The Metropolitan Transportation Plan for North Central Texas Public Meetings January 2016 Presentation Agenda Mobility 2040 Draft Recommendations 2016 Transportation Conformity RTC Policy Bundle Concept
Chapter 8 Travel Demand Forecasting & Modeling
 Chapter 8 Travel Demand Forecasting & Modeling The Travel Demand Forecasting and Modeling process for the Jackson MPO was developed in cooperation between the Region 2 Planning Commission (R2PC) and the
Transportation Conformity 101. Session I: Course Overview
 Transportation Conformity 101 Session I: Course Overview Welcome! This course is designed to provide transportation and air quality planners and other stakeholders with an introduction to Transportation
Air Quality Memorandum
 Air Quality Memorandum REPORT NO. 33 DATE October 22, 2015 SUBJECT **DRAFT** CONFORMITY ANALYSIS FOR THE AMENDED WFRC 2015-2040 REGIONAL TRANSPORTATION PLAN. ABSTRACT The Moving Ahead for Progress in the
Transportation Conformity Guidance for Qualitative Hot-spot Analyses in PM 2.5 and PM 10 Nonattainment and Maintenance Areas
 Transportation Conformity Guidance for Qualitative Hot-spot Analyses in PM 2.5 and PM 10 Nonattainment and Maintenance Areas United States Environmental Protection Agency Federal Highway Administration
Air Quality Conformity Determination Statement for the Poughkeepsie Ozone Non attainment Area
 Air Quality Conformity Determination Statement for the Poughkeepsie Ozone Non attainment Area Fall 2011 New York Metropolitan Transportation Council (NYMTC) 199 Water Street, 22 nd Floor New York, NY 10038
Air Quality Memorandum - DRAFT
 Air Quality Memorandum - DRAFT REPORT NO. 39 DATE February 15, 2019 SUBJECT CONFORMITY ANALYSIS FOR THE WFRC 2019-2050 REGIONAL TRANSPORTATION PLAN. ABSTRACT The FAST Act and the Clean Air Act Amendments
18 June 2017 PRACTITIONER S HANDBOOK AASHTO ADDRESSING AIR QUALITY ISSUES IN THE NEPA PROCESS FOR HIGHWAY PROJECTS
 AASHTO PRACTITIONER S HANDBOOK 18 June 2017 ADDRESSING AIR QUALITY ISSUES IN THE NEPA PROCESS FOR HIGHWAY PROJECTS This handbook is intended to assist practitioners in addressing air quality issues, including
2017 ANNUAL REPORT ON ROADWAY TRAFFIC CONGESTION IN THE DENVER REGION
 2017 ANNUAL REPORT ON ROADWAY TRAFFIC CONGESTION IN THE DENVER REGION October 2018 1. Introduction On an average weekday in the Denver region in 2017, people made 15 million total trips, traveling 110
Air Quality Memorandum
 Air Quality Memorandum REPORT NO. 34 DATE May 7, 2016 SUBJECT **DRAFT** CONFORMITY ANALYSIS FOR THE AMENDED WFRC 2015-2040 REGIONAL TRANSPORTATION PLAN. ABSTRACT The Moving Ahead for Progress in the 21
Congestion Management Process Update
 report Congestion Management Process Update prepared for Houston-Galveston Area Council prepared by Cambridge Systematics, Inc. 10415 Morado Circle, Building II, Suite 340 Austin, TX 78759 with Alliance
MEMORANDUM. To: Andrew Brennan, MBTA April 29, 2005
 2 MEMORANDUM To: Andrew Brennan, MBTA April 29, 2005 From: Re: Scott Peterson, CTPS Silver Line Phase III Modeling Methodology I. INTRODUCTION The Silver Line is a bus rapid transit (BRT) project that
TRANSPORTATION RELATIONSHIP TO OTHER ELEMENTS OF THE PLAN AND COUNTY REGULATIONS VISION FOR TRANSPORTATION PLANNING ROAD NETWORK SECTION 7
 TRANSPORTATION Like many growing western counties, Douglas County focuses on one of the most integral elements in land-use planning: transportation. The primary purpose of a transportation network is to
Introduction to the Proposed Statewide Transportation Improvement Program (STIP) Transportation Planning and Programming
 Transportation Planning and Programming") Introduction to the Proposed 2015-2018 Statewide Transportation Improvement Program (STIP) Transportation Planning and Programming Public Hearing August 19 th, 2014 TABLE OF CONTENTS Introduction... 1
Introduction to the Proposed 2015-2018 Statewide Transportation Improvement Program (STIP) Transportation Planning and Programming Public Hearing August 19 th, 2014 TABLE OF CONTENTS Introduction... 1
Development and content of the transportation improvement program (TIP).
.") Code of Federal Regulations e-cfr data is current as of August 5, 2016 Title 23 Chapter I Subchapter E Part 450 Subpart C 450.326 Title 23: Highways PART 450 PLANNING ASSISTANCE AND STANDARDS Subpart C
Code of Federal Regulations e-cfr data is current as of August 5, 2016 Title 23 Chapter I Subchapter E Part 450 Subpart C 450.326 Title 23: Highways PART 450 PLANNING ASSISTANCE AND STANDARDS Subpart C
Corpus Christi Metropolitan Transportation Plan Fiscal Year Introduction:
 Introduction: Traffic congestion in the Corpus Christi Metropolitan area is not as much a function of population growth as the function of the increase in single occupant trips. Using census data, the
CHAPTER 1. A New Transportation Plan
 Chapter 1. A New Transportation Plan 1 CHAPTER 1. A New Transportation Plan Why develop a new plan? The year 2005 marks 90 years since Anchorage emerged as a community serving as headquarters for railroad
FHWA COST EFFECTIVENESS TABLES SUMMARY
 FHWA COST EFFECTIVENESS TABLES SUMMARY FHWA COST EFFECTIVENESS TABLES Summary... 1 Background And Summary Finding... 1 Introduction... 1 MAP-21... 2 Key Analytical Assumptions and Limitations... 2 Development
Transportation Model Report
 1. Introduction The traffic impacts of the future developments in the IL130/High Cross Road corridor for different scenarios were analyzed using a Travel Demand Model (TDM). A four step modeling process
Hazardous Materials Technical Memorandum
 Hazardous Materials Technical Memorandum Southeast Extension Project Lincoln Station to RidgeGate Parkway Prepared for: Federal Transit Administration Prepared by: Denver Regional Transportation District