Florida Nutrient Criteria Update
|
|
|
- Bartholomew Daniels
- 5 years ago
- Views:
Transcription

1 Standards and Assessment Florida Nutrient Criteria Update Russ Frydenborg
2 Path Forward March 15, 2013: FDEP and EPA announced agreement to continue the protection of Florida s waterways from excess nitrogen and phosphorus pollution Agreement builds off of momentum from EPA s November 30, 2012 approval of the state s numeric nutrient criteria for lakes, rivers, streams and springs, as well as estuaries from Clearwater Harbor to Biscayne Bay. FDEP will move forward with rulemaking and legislation in 2013 to finish the job of setting numeric nutrient criteria for Florida s waterways.
3 Path Forward The plan includes proposing state legislation and adopting additional state rules that will eliminate the need for dual rulemaking FDEP will establish numeric nutrient criteria for 22 estuary and coastal segments by July 1, 2013, or as soon as possible FDEP will complete its rulemaking to establish numeric nutrient criteria by December 1, 2014 FDEP will adopt NNC Implementation Document into rule
4 Proposed Legislation Authorizes FDEP to implement the adopted nutrient standards consistent with the document entitled Implementation of Florida s Numeric Nutrient Standards, Directs FDEP to adopt criteria for the remaining estuaries and coastal waters by December 1, 2014 TP, TN, chl-a in estuaries Chl-a in coastal waters Establishes nutrient standards for all remaining estuaries and coastal at the current condition until specific numeric interpretations are adopted Requires FDEP to a report on the status of NNC to the Governor, the Speaker of the House of Representatives, and the President of the Senate by August 1, 2013
5 Implementation Document To assist EPA s understanding of Florida s rules during the EPA approval process, DEP produced a document entitled, Implementation of Florida s Numeric Nutrient Standards The implementation document basically describes how the adopted provisions for nutrients in Chapters , , and the SCI Primer work in conjunction FDEP is now incorporating the Implementation Document into rule s/docs/nnc_implementation.pdf

6 State Adopted NNC

7 Goal by December 1, 2014

8 Estuary Schedule South Florida estuaries adopted by the State and approved by EPA TMDLs approved by the state (December 8, 2011) and under review by EPA Panhandle estuaries adopted by the state on November 13, 2012, although not yet submitted to EPA. Additional estuaries in June 2013 Remaining estuaries and Coastal Waters by December 1, 2014
9 Numeric Interpretation Paragraph (47)(b), F.A.C., states that in no case shall nutrient concentrations of a body of water be altered so as to cause an imbalance in natural populations of aquatic flora or fauna. Method for numerically interpreting this narrative nutrient criterion, on a site-specific basis, is provided in Rule , F.A.C (Hierarchical Approach)
10 Hierarchical Approach Nutrient Total Maximum Daily Loads, Site Specific Alternative Criteria, Estuary-specific Criteria, and Water Quality-Based Effluent Limitations Stressor-Response Relationships (lakes & springs) Reference stream-based thresholds combined with biological data (flora and fauna) Narrative (wetlands, intermittent streams, South Florida flowing waters)

11 Lakes Based on cause-effect relationship between nutrients (TN and TP) and phytoplankton response (chlorophyll a Derived using multiple lines of evidence Maintain naturally low nutrient lakes in an oligotrophic state Maintain lakes with naturally moderate nutrient levels in a mesotrophic state Eutrophic lakes handled on site-specific basis 5/6/2016
12 NNC for Lakes Long Term Geometric Mean Lake Color and Alkalinity Annual Geometric Mean Chlorophyll a Minimum calculated numeric interpretation Annual Geometric Mean Total Phosphorus Minimum calculated numeric interpretation Annual Geometric Mean Total Nitrogen Maximum calculated numeric interpretation Annual Geometric Mean Total Phosphorus Maximum calculated numeric interpretation Annual Geometric Mean Total Nitrogen > 40 Platinum Cobalt Units 20 µg/l 0.05 mg/l 1.27 mg/l 0.16 mg/l mg/l 40 Platinum Cobalt Units and > 20 mg/l 20 µg/l 0.03 mg/l 1.05 mg/l 0.09 mg/l 1.91 mg/l CaCO 3 40 Platinum Cobalt Units and 20 mg/l CaCO 3 6 µg/l 0.01 mg/l 0.51 mg/l 0.03 mg/l 0.93 mg/l 1 For lakes with color > 40 PCU in the West Central Region, the maximum TP limit is 0.49 mg/l
13 Performance Based Criteria If annual geometric mean chlorophyll a does not exceed the chlorophyll a value for the lake type, then the TN and TP for that year are the annual geometric means of ambient TN and TP samples for that lake For lakes with color > 40 PCU in the West Central Nutrient Watershed Region, the maximum TP limit is 0.49 mg/l (streams criteria) TN, TP, and chlorophyll a cannot be exceeded more than once in any consecutive calendar three year period


14 Springs Weeki Wachee, 1950s; Nitrate < 0.1 mg/l, Eel grass Weeki Wachee, 2001: Nitrate ~ 0.7 mg/l, Lyngbya mats Nuisance Algal Mats in Springs
15 Nitrate in Spring Vents Applicable numeric interpretation of the narrative nutrient criterion is 0.35 mg/l of nitrate-nitrite as an annual geometric mean Not to be exceeded more than once in any three consecutive calendar year period
 Therefore, a weight of evidence evaluation of: floral end")
 are used to determine if a stream s nutrient concentrations are")
16 NNC in Streams Stressor-response relationships between nutrients and biological effects were insufficient to develop criteria (for both flora and fauna) Therefore, a weight of evidence evaluation of: floral end points, which were derived from the same minimally disturbed stream data used for the TP and TN thresholds, and the Stream Condition Index (SCI) are used to determine if a stream s nutrient concentrations are protective
17 NNC in Streams Achieved IF: Information on chlorophyll a levels, algal mats or blooms, nuisance macrophyte growth, and changes in algal species composition do not indicate an imbalance in flora or fauna; AND EITHER The average score of at least two temporally independent SCIs is 40 or higher, with neither of the two most recent SCI scores less than 35, OR The Nutrient Thresholds (expressed as annual geometric means) are not exceeded more than once in a three year period
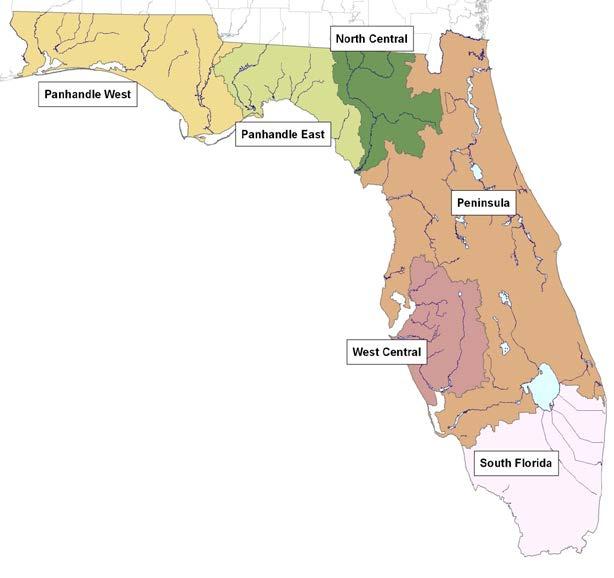
18 Streams Thresholds and Regions
19 Floral Tools in Streams Linear Vegetation Survey (LVS) Coefficient of Conservatism, invasive exotics Rapid Periphyton Survey (RPS) Thickness and extent, autecology (interpreting species information) Phytoplankton chlorophyll a Habitat Assessment as ancillary data Substrate type, availability, mapping, etc.
20 Floral Metric Summary Floral Metric Evidentiary Threshold of No Imbalances LVS C of C Site average > 2.5 LVS FLEPPC Site average < 25% RPS Chlorophyll Algal Community Composition (Autecology) < 25% rank 4-6 coverage 20 to 25 % rank 4-6 coverage, evaluate algal autoecological data < 20 ug/l; 3.2 to 20 ug/l = site specific No adverse shifts in dominant taxa

21 Example Rapid of >50% Periphyton rank 4-6 RPS Survey Transect Flags

22 Example of a Site that Would Fail the LVS Dominated by Commellina And Colocassia
23 Adverse Trends Test Mann s one-sided trend test DEP assesses whether there is a statistically significant adverse trend in nutrients (nitrate-nitrite, TN or TP) or a nutrient response variable (chlorophyll a) and if the waterbody is expected to become impaired Confounding variables controlled for Residual COLLECTION.DATE
24 Estuaries Primary approach is a reference period Each estuary that is documented to be healthy is used to describe its own reference condition Document biological health Evaluating EPA targets Chl-a not exceed 20 µg/l in more than 10% of samples DO not less than 4 mg/l in more than 10% of samples Achievement of light targets (secchi depth) for the protection of SAV within each segment Nutrient distribution of a baseline period, (when the waterbody achieved its designated use) is determined and criteria are established to maintain that distribution into the future
25 Recent Training SAS conducted 3 trainings in Tallahassee, Orlando, and Tampa ~150 attendees Focused on NNC Implementation and Floral Tools Next training: FLMS, Daytona, June 17
26 Next Steps for Nutrients Complete Triennial Review including adopt of Implementation Document Complete Estuary criteria Revised proposal and workshops mid-april 2013 Additional adoptions in June 2013 Characterize current conditions for remaining estuaries Collect additional data in remaining estuaries Adopt criteria for remaining estuaries by December 1, 2014
27 This Year s Monitoring WMS will conduct LVS and RPS twice per year at Trend sites where SCI is currently conducted Floral sampling not planned at Status Sites or where SCI not appropriate
Numeric Nutrient Criteria (NNC) Regulations
 Regulations") Numeric Nutrient Criteria (NNC) Regulations Ken Weaver Florida Department of Environmental Protection Background Aug 2008 EarthJustice sued EPA over NNC Jan 2009 EPA determines NNC necessary Aug 2009 Settlement
Numeric Nutrient Criteria (NNC) Regulations Ken Weaver Florida Department of Environmental Protection Background Aug 2008 EarthJustice sued EPA over NNC Jan 2009 EPA determines NNC necessary Aug 2009 Settlement
Florida Department of Environmental Protection Numeric Nutrient Criteria: Current Status
 Florida Department of Environmental Protection Numeric Nutrient Criteria: Current Status Russ Frydenborg, Drew Bartlett, Daryll Joyner, Ken Weaver Division of Assessment and Restoration Support Nutrient
Developing Numeric Nutrient Criteria: The Florida Story
 Water Quality Standards Program Developing Numeric Nutrient Criteria: The Florida Story August 15, 2013 Division of Environmental Assessment and Restoration Summary of Presentation Numeric Nutrient Criteria
Standards and Assessment
 Standards and Assessment Use of Biological Assessments in Permitting and Establishment of Site Specific Alternative Criteria (SSACs) and Water Quality Based Effluent Limits (WQBELs) Presentation Overview
EPA Numeric Criteria Where do we stand now? Mark W. Clark
 EPA Numeric Criteria Where do we stand now? Mark W. Clark Soil and Water Science Department University of Florida, Gainesville June 4, 2013 Clean Water Act 1972 As part of the Federal Clean Water Act 1972,
It has been over two years since numeric nutrient
 FWRJ How to Comply With Numeric Nutrient Criteria and Facilitate Permit Renewal Russel Frydenborg and Beck Frydenborg It has been over two years since numeric nutrient criteria (NNC) were adopted, and
Summary of Presentation
 Water Quality Standards Program Florida s Numeric Nutrient Criteria Presentation for Wastewater Breakout Session of the 2015 Focus on Change Division of Environmental Assessment and Restoration Summary
LAKEWATCH Report for Weeki Wachee-1 in Hernando County Using Data Downloaded 10/17/2016 Introduction Streams
 LAKEWATCH Report for Weeki Wachee-1 in Hernando County Introduction Streams For many decades Florida has had a narrative nutrient water quality criterion in place to protect Florida s waters against nutrient
Numeric Nutrient Criteria Update
 Numeric Nutrient Criteria Update Kevin Carter South Florida Water Management District Office Of Everglades Policy and Coordination 561-682-6949, kecarter@sfwmd.gov Palm Beach County Water Resources Task
EPA s Proposed Water Quality Standards for Florida s Lakes and Flowing Waters Establishing Numeric Nutrient Criteria January 14, 2010
 EPA s Proposed Water Quality Standards for Florida s Lakes and Flowing Waters Establishing Numeric Nutrient Criteria January 14, 2010 Erik Silldorff, DRBC NJ Water Monitoring Council Meeting Feb 3, 2010
Shifting Tides: Florida's Changing Water Quality Regulations
 Shifting Tides: Florida's Changing Water Quality Regulations Statewide Stormwater Rule & EPA Numeric Nutrient Criteria Chris Martinez Assistant Professor University of Florida Outline - Statewide Stormwater
Development of Numeric Nutrient Criteria for Florida
 Florida Department of Environmental Protection Development of Numeric Nutrient Criteria for Florida Ken Weaver Standards and Assessment Section Division of Environmental Assessment and Restoration Nutrient
Numeric Nutrient Criteria Development
 Florida Department of Environmental Protection Numeric Nutrient Criteria Development Bureau of Assessment and Restoration Support Daryll Joyner, Bureau Chief Summary of Presentation Background info on
Numeric Nutrient Criteria
 Numeric Nutrient Criteria Kevin Carter South Florida Water Management District Office Of Everglades Policy and Coordination 561-682-6949, kecarter@sfwmd.gov Lake Worth Lagoon Initiative Symposium Palm
Data Usability Considerations for Biological Assessment Data. Aquatic Ecology and Quality Assurance March 30, 2016
 Data Usability Considerations for Biological Assessment Data Aquatic Ecology and Quality Assurance March 30, 2016 Presentation Overview Why is it necessary to evaluate biological data before using it?
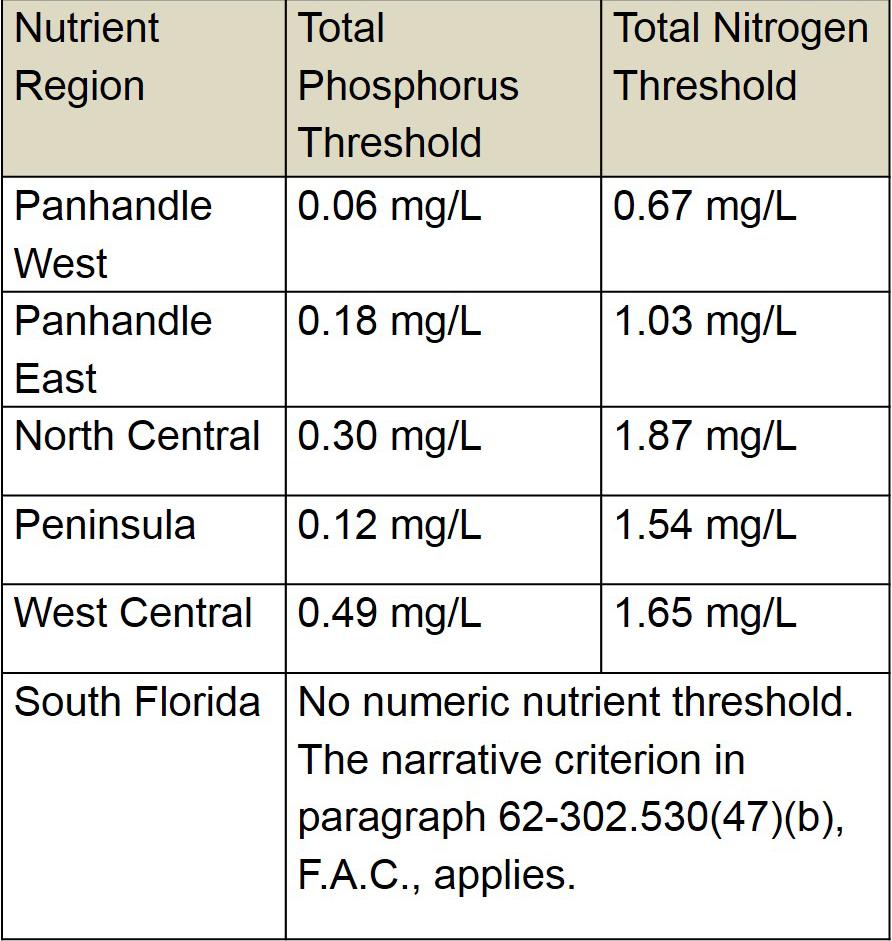
calendar year periods. The nutrient thresholds for streams set forth by FDEP are listed in table below along with the map showing zones.
 LAKEWATCH Report for Huckleberry Creek-1 in Franklin County Introduction Streams For many decades Florida has had a narrative nutrient water quality criterion in place to protect Florida s waters against
calendar year periods. The nutrient thresholds for streams set forth by FDEP are listed in table below along with the map showing zones.
 LAKEWATCH Report for Wacissa-1 in Jefferson County Introduction Streams For many decades Florida has had a narrative nutrient water quality criterion in place to protect Florida s waters against nutrient
White Trout Lake Lake Vegetation Index Survey Summary 2012
 White Trout Lake Lake Vegetation Index Survey Summary 2012 David Eilers- University of South Florida, Florida Center for Community Design and Research Background The Lake Vegetation Index (LVI) is a rapid
ARKANSAS NUTRIENT CRITERIA DEVELOPMENT. EPA Region 6 Nutrient RTAG Dallas, Texas April 14, 2015
 ARKANSAS NUTRIENT CRITERIA DEVELOPMENT EPA Region 6 Nutrient RTAG Dallas, Texas April 14, 2015 CRITERIA DEVELOPMENT MILESTONES Assessment Methodology Beaver Lake Wadeable Streams Nutrient Trading-Act 335
Nitrogen Management through Land Use. Holly Greening, Tampa Bay Estuary Program July 2010
 Nitrogen Management through Land Use Holly Greening, Tampa Bay Estuary Program July 2010 Importance of Water Quality Management Eutrophication (excess nutrients) common to many estuaries, streams and lakes
Update on Numeric Nutrient Criteria Development
 Update on Numeric Nutrient Criteria Development Russ Frydenborg, Ken Weaver, and Denise Miller FDEP Presented by Nia Wellendorf What are we doing and why? Due to adverse impacts of excessive nutrients
The Economic Analysis of the FDEP Proposed Numeric Nutrient Criteria in Florida
 Center for Economic Forecasting and Analysis Florida State University 3200 Commonwealth Blvd. Suite 153 Tallahassee, Florida 32306-2770 The Economic Analysis of the FDEP Proposed Numeric Nutrient Criteria
Lake Bathymetry and Morphological Characteristics Assessment
 Sand Pond Methods Study Area Analysis The watershed containing Sand Pond was analyzed using ESRI ArcGIS 10.2. Using this software with 2011 Hillsborough County aerial, Land Use/ Land Cover (LULC), Landscape
Numeric Nutrient Criteria for the Panhandle Estuaries: ERC Adoption
 Standards and Assessment Numeric Nutrient Criteria for the Panhandle Estuaries: ERC Adoption Russ Frydenborg Division of Environmental Assessment and Restoration November 13, 2012 Panhandle Estuary Locations
A Guide to EPA's Proposed Numeric Nutrient Water Quality Criteria for Florida 1
 SL316 A Guide to EPA's Proposed Numeric Nutrient Water Quality Criteria for Florida 1 Thomas Obreza, Mark Clark, Brian Boman, Tatiana Borisova, Matt Cohen, Michael Dukes, Tom Frazer, Ed Hanlon, Karl Havens,
LAKE TARPON WATER QUALITY MANAGEMENT PLAN SCOPE OF WORK
 LAKE TARPON WATER QUALITY MANAGEMENT PLAN SCOPE OF WORK Project Background Lake Tarpon With a surface area of approximately four square miles and a watershed of approximately 52 square miles, Lake Tarpon,
NUMERIC NUTRIENT CRITERIA IN FLORIDA AN OVERVIEW
 NUMERIC NUTRIENT CRITERIA IN FLORIDA AN OVERVIEW John J. Fumero, Esq. and Thomas F. Mullin, Esq. I. Introduction Most environmental professionals should now be familiar with the U.S. Environmental Protection
Nutrient Limits: What to Expect. Water Division Arkansas Department of Environmental Quality
 Nutrient Limits: What to Expect Water Division Arkansas Department of Environmental Quality wentz@adeq.state.ar.us bailey@adeq.state.ar.us Timeline of Nutrient Criteria Development 1998 EPA published the
Nutrients. Water Quality Planning Branch Water Division Arkansas Department of Environmental Quality
 Nutrients Water Quality Planning Branch Water Division Arkansas Department of Environmental Quality Water Quality & Biological Data Water Quality Standards & Criteria Assessment Permit Limitations Impairment
Turning water quality data into lake-specific nutrient standards
 Turning water quality data into lake-specific nutrient standards 2015 Tribal Lands and Environment Forum Nancy Schuldt, Water Projects Coordinator Fond du Lac Reservation Current Narrative Standard:
Water Quality Criteria Update
 Water Quality Standards Program Water Quality Criteria Update Presentation for December 10, 2014 FSA DEP Day Division of Environmental Assessment and Restoration Summary of Presentation DEP s Numeric Nutrient
Some Context behind the Implementation of Numeric Nutrient Criteria or Why do we have these Water Quality Regulations?
 Some Context behind the Implementation of Numeric Nutrient Criteria or Why do we have these Water Quality Regulations? Mark W. Clark and Thomas Obreza Soil and Water Science Department University of Florida,
FLORIDA DEPARTMENT OF ENVIRONMENTAL PROTECTION SOUTHWEST DISTRICT PEACE RIVER BASIN UPPER PEACE RIVER PLANNING UNIT.
 FLORIDA DEPARTMENT OF ENVIRONMENTAL PROTECTION Division of Environmental Assessment and Restoration Water Quality Evaluation and TMDL Program SOUTHWEST DISTRICT PEACE RIVER BASIN UPPER PEACE RIVER PLANNING
TOTAL MAXIMUM DAILY LOAD (TMDL)
") TOTAL MAXIMUM DAILY LOAD (TMDL) For Nutrients In Black Point Channel (WBID 1637) Prepared by: US EPA Region 4 61 Forsyth Street SW Atlanta, Georgia 30303 September 2009 TABLE OF CONTENTS 1.0 INTRODUCTION...
TOTAL MAXIMUM DAILY LOAD (TMDL) For Nutrients In Black Point Channel (WBID 1637) Prepared by: US EPA Region 4 61 Forsyth Street SW Atlanta, Georgia 30303 September 2009 TABLE OF CONTENTS 1.0 INTRODUCTION...
2012 Nutrient Regulations Update
 2012 Nutrient Regulations Update OWEA Government Affairs Workshop March 1, 2012 Guy Jamesson, PE, BCEE Malcolm Pirnie, The Water Division of ARCADIS Imagine the result Agenda Nutrient impacts Nutrient
y Project - Navigating NNC
 Paynes Prairie Sheetflow Restoration y Project - Navigating NNC g Stranded Up p the Creek Without Getting Rick Hutton, P.E., Gainesville Regional Utilities FWEA Utility Council July 11, 2014 1 Project
Lake Tohopekaliga Nutrient Reduction Plan and Best Management Practice Pollutant Load Analysis
 Lake Tohopekaliga Nutrient Reduction Plan and Best Management Practice Pollutant Load Analysis Danielle Honour, P.E., D.WRE Principal Water Resources Engineer UF Water Institute Symposium February 15,
North Dakota s Nutrient Reduction Strategy. Presented to the 2016 ND Water Quality Monitoring Conference March 4, 2016
 North Dakota s Nutrient Reduction Strategy Presented to the 2016 ND Water Quality Monitoring Conference March 4, 2016 Nutrients Nutrients, in appropriate amounts, are essential to the growth and health
Tina Laidlaw US EPA 1
 Tina Laidlaw US EPA 1 Many states have developed approaches for listing waterbodies for nutrient-related impairments based on the narrative standard Existing state approaches are similar to CO s proposal
Nutrient Criteria Update
 Nutrient Criteria Update Jim Davenport Monitoring & Assessment Section Water Quality Planning Division Office of Water Texas Commission on Environmental Quality jdavenpo@tceq.state.tx.us tel. 512/239-4585
Numeric Nutrient Criteria for Stormwater: Emerging Issues
 Numeric Nutrient Criteria for Stormwater: Emerging Issues 1. NNC Compliance Op0ons Russ Frydenborg 2. Stormwater Treatment Op0ons Gary Serviss 4. Grandfathered Roadways Patrick Shearer 5. Class III-Limited
Preamble: Proposed Stream Nutrient Assessment Procedure
 Preamble: Proposed Stream Nutrient Assessment Procedure Ohio EPA Nutrients Technical Advisory Group Assessment Procedure Subgroup Members: Guy Jamesson, Larry Antosch, Mike Brom, Bill Hall, Dale Kocarek,
Evaluation of Impairment in Silver Springs. Robert A. Mattson, CEP, CSE Environmental Scientist V St. Johns River Water Management District
 Evaluation of Impairment in Silver Springs Robert A. Mattson, CEP, CSE Environmental Scientist V St. Johns River Water Management District Values of Silver Springs/River Fish and wildlife habitat Baseflow
AMENDED DECISION DOCUMENT REGARDING FLORIDA DEPARTMENT OF ENVIRONMENTAL PROTECTION S SECTION 303(d) LIST AMENDMENTS FOR BASIN GROUPS 1, 2, AND 5
 LIST AMENDMENTS FOR BASIN GROUPS 1, 2, AND 5") AMENDED DECISION DOCUMENT REGARDING FLORIDA DEPARTMENT OF ENVONMENTAL PROTECTION S SECTION 303(d) LIST AMENDMENTS FOR BASIN GROUPS 1, 2, AND 5 Prepared by the Environmental Protection Agency, Region 4
AMENDED DECISION DOCUMENT REGARDING FLORIDA DEPARTMENT OF ENVONMENTAL PROTECTION S SECTION 303(d) LIST AMENDMENTS FOR BASIN GROUPS 1, 2, AND 5 Prepared by the Environmental Protection Agency, Region 4
Development of Nutrient Criteria for Wyoming Streams and Lakes
 Development of Nutrient Criteria for Wyoming Streams and Lakes Eric Hargett Wyoming Department of Environmental Quality Water Quality Division Watershed Protection Program Monitoring Program Wyoming Nutrient
Nutrients and Ecosystems
 Nutrients and Ecosystems Fertilizer Application Rates Lawns: Athletic Fields: Pastures (Dairy): Vegetables: Corn: Citrus: Forests: 80-240 kg N/ha/yr 200-280 kg N/ha/yr 240-360 kg N/ha/yr 180-200 kg N/ha/yr
Surface Water Update Nutrients. OWEA Government Affairs Specialty Workshop Brian Hall, Assistant Chief, P.E. March 13, 2014
 Surface Water Update Nutrients OWEA Government Affairs Specialty Workshop Brian Hall, Assistant Chief, P.E. March 13, 2014 Overview Program updates Audience Q&A on current practices in regards to nutrients
Lake Tohopekaliga Nutrient Reduction Plan Two Years Later
 Lake Tohopekaliga Nutrient Reduction Plan Two Years Later Danielle Honour, P.E., D.WRE Kimberly Lawrence Florida Stormwater Association Annual Conference June 12, 2014 Nutrient Reduction Plan Timeline
Hadlock Pond, Washington Co., Lake Hadlock Association, Inc.
 Hadlock Pond, Washington Co., Lake Hadlock Association, Inc. Lake Characteristics Watershed Characteristics Surface Area (ac/ha) Max Depth (ft/m) Mean Depth (ft/m) Retention Time (years) Water Class Dam
Annual Report on Clam Bay Numeric Nutrient Concentration (NNC) Criteria
 Criteria") March 7, 2018 Tim Hall, Turrell, Hall and Associates, Inc. David Tomasko, Ph.D. Emily Keenan, M.S. Annual Report on Clam Bay Numeric Nutrient Concentration (NNC) Criteria Executive Summary Water quality
March 7, 2018 Tim Hall, Turrell, Hall and Associates, Inc. David Tomasko, Ph.D. Emily Keenan, M.S. Annual Report on Clam Bay Numeric Nutrient Concentration (NNC) Criteria Executive Summary Water quality
@ Printed on Recycled Paper AUG
 UNITED STATES DEPARTMENT OF COMMERCE National Oceanic and Atmospheric Administration NATIONAL MARIN):: FISHERIES SERVICE Silver Spring, MO T081'0 Ms. Joanne Benante Water Quality Planning Branch U.S. Environmental
South Venice Water Quality
 SARASOTA COUNTY South Venice Water Quality Summary of Data Collected in Support of the South Venice Civic Association Water Quality Task Force Sarasota County Water Resources 8//24 Introduction The South
CLMP+ Report on Grass Lake (Anoka County) Lake ID# CLMP+ Data Summary
 Lake ID# CLMP+ Data Summary") CLMP+ Report on Grass Lake (Anoka County) Lake ID# 02-0113-00 2012-2013 CLMP+ Data Summary October 2014 Authors Shannon Martin, MPCA Editing and graphic design Public Information Office Staff The (MPCA)
CLMP+ Report on Grass Lake (Anoka County) Lake ID# 02-0113-00 2012-2013 CLMP+ Data Summary October 2014 Authors Shannon Martin, MPCA Editing and graphic design Public Information Office Staff The (MPCA)
GROUNDWATER DISCHARGE: A SOURCE OF NUTRIENTS TO LAKE LOCHLOOSA?
 GROUNDWATER DISCHARGE: A SOURCE OF NUTRIENTS TO LAKE LOCHLOOSA? Presented by Margaret Murray April 18, FSU Participants: Natasha Dimova, Ben Mwashote, Bill Burnett, Jeff Chanton DEP Participants: Rick
Water Quality Standards Program. FDEP Biocriteria Meeting May 16, 2017
 Water Quality Standards Program FDEP Biocriteria Meeting May 16, 2017 Built as part of the Central and Southern Florida Flood control project by the USACOE Designed and constructed from 1940s to 1970s
Sanibel Golf Course Fertilizer and Lake Management Recommendations Annual Report Card. September This report was specifically prepared for:
 Sanibel Golf Course Fertilizer and Lake Management Recommendations Annual Report Card September 2015 This report was specifically prepared for: Sanibel Island Golf Club Introduction Stormwater runoff from
Phosphorus Goal Setting Process Questions and Answers 2010
 Lake Winnipesaukee Watershed Management Plan Phase I: Meredith, Paugus, Saunders Bays 1. What is phosphorus? Phosphorus (P) is a naturally occurring element and a major nutrient required for biological
Florida s Triennial Review of Water Quality Standards
 Florida s Triennial Review of Water Quality Standards Agenda Review Background on Triennial Review Revisions to Chapter 62-4, FAC Revisions to Chapter 62-302, FAC Revisions to Chapter 62-303, FAC Triennial
Restoration of the Harris Chain of Lakes: Return to Neverland
 Restoration of the Harris Chain of Lakes: Return to Neverland How Shifting Baselines Impact Eutrophication Restoration Targets Dr. Daniel E. Canfield Jr. Professor of Limnology Fisheries and Aquatic Sciences
Overview of PADEP 2014 Integrated List of All Waters (from Draft 2014 Pennsylvania Integrated Water Quality Monitoring and Assessment Report )
") Overview of PADEP 2014 Integrated List of All Waters (from Draft 2014 Pennsylvania Integrated Water Quality Monitoring and Assessment Report ) Background PADEP uses an integrated format for Clean Water
Overview of PADEP 2014 Integrated List of All Waters (from Draft 2014 Pennsylvania Integrated Water Quality Monitoring and Assessment Report ) Background PADEP uses an integrated format for Clean Water
January 27, Status Report of NC s Nutrient Criteria Implementation Plan and Supporting Documentation
 Beverly Eaves Perdue, Governor Dee Freeman, Secretary North Carolina Department of Environment and Natural Resources Coleen H. Sullins, Director Division of Water Quality Ms. Joanne Benante Ms. Annie Godfrey
Status and Trends of Water Quality in Wisconsin s Lakes, Streams, and Rivers
 Status and Trends of Water Quality in Wisconsin s Lakes, Streams, and Rivers Tim Asplund, Matt Diebel, Katie Hein, and Mike Shupryt Water Resources Program, WDNR AWRA Wisconsin Section Annual Meeting March
Sanibel Golf Course Fertilizer and Lake Management Recommendations Annual Report Card. July This report was specifically prepared for:
 Sanibel Golf Course Fertilizer and Lake Management Recommendations Annual Report Card July 2012 This report was specifically prepared for: The Dunes Golf and Tennis Club Introduction Stormwater runoff
FINAL TMDL Report. Nutrient TMDL for Lake Holden (WBID 3168H)
") CENTRAL DISTRICT KISSIMMEE RIVER BASIN UPPER KISSIMMEE PLANNING UNIT FINAL TMDL Report Nutrient TMDL for Lake Holden (WBID 3168H) Douglas Gilbert Water Quality Evaluation and TMDL Program Division of Environmental
CENTRAL DISTRICT KISSIMMEE RIVER BASIN UPPER KISSIMMEE PLANNING UNIT FINAL TMDL Report Nutrient TMDL for Lake Holden (WBID 3168H) Douglas Gilbert Water Quality Evaluation and TMDL Program Division of Environmental
Medicine Lake Excess Nutrients TMDL project: Water Quality Standards
 Medicine Lake Excess Nutrients TMDL project: Water Quality Standards Steering Committee Meeting #1 November 18 th, 2008 Water Quality Standards Water quality standards the fundamental benchmarks by which
Potential Effects of Reclaimed Water options on Nitrogen Loading to Tampa Bay. Tampa Bay in the 1970s
 Potential Effects of Reclaimed Water options on Nitrogen Loading to Tampa Bay Holly Greening, Tampa Bay Estuary Program February 15, 2010 1 Tampa Bay in the 1970s Phytoplankton and macroalgae dominated
Beaver Lake Nutrient Criteria
 Beaver Lake Nutrient Criteria Tate Wentz Aquatic Ecologist Coordinator-Research and Field Programs Office of Water Quality-Planning Branch Arkansas Department of Environmental Quality 501-682-0661 Beaver
City of Delray Beach MS4 Assessment Program: Part V. Monitoring Requirements MS4 Permit No. FLS
 City of Delray Beach MS4 Assessment Program: Part V. Monitoring Requirements MS4 Permit No. FLS 000018 004 The purpose of this document is to outline the assessment program for the City of Delray Beach
Minnesota Center for Environmental Advocacy 26 East Exchange Street Suite 206 Saint Paul, MN
 Minnesota Center for Environmental Advocacy 26 East Exchange Street Suite 206 Saint Paul, MN 55101-1667 651.223.5969 September 30, 2016 Miranda Nichols Minnesota Pollution Control Agency 520 Lafayette
Upper Mississippi River Lake Pepin Water Quality Model July INTRODUCTION
 1. INTRODUCTION This report describes the development, calibration/confirmation, and application of a linked hydrodynamic-sediment transport-water quality model for the Upper Mississippi River from Lock
Impacts to Aquatic Habitats from Land-Use or Is It Polluted?
 Impacts to Aquatic Habitats from Land-Use or Is It Polluted? Water Pollution is: The addition of excessive carbon to a system The addition of large amounts of materials to water that causes adverse changes
Florida s Small Lakes Cycle One Jan 2000 Dec 2003
 Florida s Small Lakes Cycle One Jan 2000 Dec 2003 Florida Department of Environmental Protection Watershed Monitoring and Data Management Presented by Margaret Murray March 2005 Florida s Small Lakes Cycle
South Carolina Water Quality Standards. Heather Preston DHEC Bureau of Water October 14, 2008
 South Carolina Water Quality Standards Heather Preston DHEC Bureau of Water October 14, 2008 The Water Quality Standards 303 (c) of the Clean Water Act requires all states to have water quality standards
MS4 Assessment Program to Satisfy Part V. Monitoring Requirements
 MS4 Assessment Program to Satisfy Part V. Monitoring Requirements Submitted by City of Boynton Beach MS4 Permit No. FLS000018-004 The purpose of this document is to outline the City of Boynton Beach Stormwater
Phosphorus Rules NR , NR 151 and NR 217 Subchapter III
 Phosphorus Rules NR 102.06, NR 151 and NR 217 Subchapter III Jim Baumann Wisconsin Department of Natural Resources james.baumann@wisconsin.gov 608/266-9277 Phosphorus 3 Rule Changes S. NR 102.06 phosphorus
Dissolved Oxygen and Nutrient TMDLs for Little Gully Creek (WBID 1039)
") FLORIDA DEPARTMENT OF ENVIRONMENTAL PROTECTION Division of Environmental Assessment and Restoration, Bureau of Watershed Restoration NORTHWEST DISTRICT APALACHICOLA BASIN Final TMDL Report Dissolved Oxygen
FLORIDA DEPARTMENT OF ENVIRONMENTAL PROTECTION Division of Environmental Assessment and Restoration, Bureau of Watershed Restoration NORTHWEST DISTRICT APALACHICOLA BASIN Final TMDL Report Dissolved Oxygen
PROPOSED TOTAL MAXIMUM DAILY LOAD (TMDL) For Dissolved Oxygen and Nutrients In The Tampa Bypass Canal Tributary (WBID 1536C)
 For Dissolved Oxygen and Nutrients In The Tampa Bypass Canal Tributary (WBID 1536C)") PROPOSED TOTAL MAXIMUM DAILY LOAD (TMDL) For Dissolved Oxygen and Nutrients In The Tampa Bypass Canal Tributary (WBID 1536C) Prepared by: US EPA Region 4 61 Forsyth Street SW Atlanta, Georgia 30303 September
PROPOSED TOTAL MAXIMUM DAILY LOAD (TMDL) For Dissolved Oxygen and Nutrients In The Tampa Bypass Canal Tributary (WBID 1536C) Prepared by: US EPA Region 4 61 Forsyth Street SW Atlanta, Georgia 30303 September
James River Alternatives Analysis June 23, 2005
 James River Alternatives Analysis June 23, 2005 Prepared by: Virginia Department of Environmental Quality in cooperation with the U.S. EPA Chesapeake Bay Program Office [ THIS PAGE INTENTIONALLY LEFT BLANK
CLMP+ Report on Fleming Lake (Aitkin County)
") CLMP+ Report on Fleming Lake (Aitkin County) Lake ID# -5-5-6 CLMP+ Data Summary July 7 Authors Shannon Martin Contributors/acknowledgements Terry Dahlberg Sandy Dahlberg Pam Anderson For questions regarding
CLMP+ Report on Fleming Lake (Aitkin County) Lake ID# -5-5-6 CLMP+ Data Summary July 7 Authors Shannon Martin Contributors/acknowledgements Terry Dahlberg Sandy Dahlberg Pam Anderson For questions regarding
5.0 NUTRIENT TMDL COMPONENTS
 5.0 NUTRIENT TMDL COMPONENTS This section of the document focuses on nutrients as a cause of water quality impairment in the Bitterroot project area. It describes: (1) how excess nutrients impair beneficial
CEDAR LAKE AQUATIC ECOSYSTEM FEASIBILITY STUDY CEDAR LAKE, INDIANA APPENDIX L MONITORING PLAN
 CEDAR LAKE AQUATIC ECOSYSTEM FEASIBILITY STUDY CEDAR LAKE, INDIANA APPENDIX L MONITORING PLAN U.S. Army Corps of Engineers July 2016 CEDAR LAKE AQUATIC ECOSYSTEM FEASIBILITY STUDY CEDAR LAKE, INDIANA APPENDIX
Portage Lake Hubbard County
 Prepared in cooperation with the Minnesota Department of Natural Resources Minnesota Lake ID: 9- Area: acres Watershed Area: 6,7 acres Ecoregion: Northern Lakes and Forests (NLF) Portage Lake Hubbard County
TOTAL MAXIMUM DAILY LOAD (TMDL) For Nutrients
 For Nutrients") TOTAL MAXIMUM DAILY LOAD (TMDL) For Nutrients In Fenholloway River, (WBIDs 3473A and 3473B) Taylor and LaFayette Counties, Florida Prepared by: US EPA Region 4 61 Forsyth Street SW Atlanta, Georgia 30303
TOTAL MAXIMUM DAILY LOAD (TMDL) For Nutrients In Fenholloway River, (WBIDs 3473A and 3473B) Taylor and LaFayette Counties, Florida Prepared by: US EPA Region 4 61 Forsyth Street SW Atlanta, Georgia 30303
Maine Biological and Nutrient Criteria. Tom Danielson and Dave Courtemanch Maine DEP
 Maine Biological and Nutrient Criteria Tom Danielson and Dave Courtemanch Maine DEP Overview Introduce the Biological Monitoring Program How we evaluate the health of streams and rivers with aquatic life.
Decision Rationale. Total Maximum Daily Load for Phosphorus for the Sassafras River, Cecil and Kent Counties, Maryland 4/1/2002
 Decision Rationale I. Introduction Total Maximum Daily Load for Phosphorus for the Sassafras River, Cecil and Kent Counties, Maryland 4/1/2002 The Clean Water Act (CWA) requires a Total Maximum Daily Load
Status of Nutrient Standards in Texas
 Status of Nutrient Standards in Texas May 28, 2010 Presented by: Ana J. Pena-Tijerina, Ph.D., P.E. David Harkins, Ph.D., P.E. In collaboration with: Raj Bhattarai, P.E., DEE Austin Water Utility This Presentation
Nutrient TMDLs and NPDES Permits
 Nutrient TMDLs and NPDES Permits Mississippi Department of Environmental Quality Adrien Carroll-Perkins, P.E. Bradley Crain, P. E. Nutrient TMDLs in Mississippi Mississippi was a Consent Decree State History
Barnegat Bay Water Quality and Quantity Monitoring Program
 Barnegat Bay Water Quality and Quantity Monitoring Program Helen Pang, Trish Ingelido, Ariane Giudicelli, Barbara Hirst, Amanda Lotto and Jill Lipoti Water Monitoring and Standards NJDEP 2013 Delaware
Technical Support Document:
 Technical Support Document: Development of Numeric Nutrient Criteria for Florida Lakes, Spring Vents and Streams Prepared by: Florida Department of Environmental Protection Standards and Assessment Section
NC Ambient Lake Assessment Program Overview including Coastal Lakes
 NC Ambient Lake Assessment Program Overview including Coastal Lakes Danielle Mir NC Division of Water Quality Environmental Sciences Section, Intensive Survey Unit Intensive Survey Unit Within the Environmental
2016, 2017 Estuarine Water Quality and Modeling in the Royal and Cousins Rivers
 2016, 2017 Estuarine Water Quality and Modeling in the Royal and Cousins Rivers Angela Brewer and Robert Mohlar Division of Environmental Assessment Bureau of Water Quality Protecting Maine s Air, Land
CITY OF BONITA SPRINGS OCTOBER SEPTEMBER 2017 SURFACE WATER QUALITY MONITORING REPORT
 CITY OF BONITA SPRINGS OCTOBER 2016 - SEPTEMBER 2017 SURFACE WATER QUALITY MONITORING REPORT FEBRUARY 26, 2018 Prepared for: 9101 Bonita Beach Road Bonita Springs, Florida 34135 Prepared by: 2122 Johnson
KENTUCKY S NUTRIENT STRATEGY Identification and Discussion of Potential Impacts
 Click to edit Master title style KENTUCKY S NUTRIENT STRATEGY Identification and Discussion of Potential Impacts SPEAKERS Kyle Hagen, PE William Shane, PE DATE August 20, 2014 Click INTRODUCTION to edit
(including Slides from Dick Schwer & Michelle Thompson)
") Updated: 17 April 2013 Print version Lecture #38 TMDLs (including Slides from Dick Schwer & Michelle Thompson) David Reckhow CEE 577 #38 1 David Reckhow CEE 577 #38 2 What is a TMDL? Total Maximum Daily
Updated: 17 April 2013 Print version Lecture #38 TMDLs (including Slides from Dick Schwer & Michelle Thompson) David Reckhow CEE 577 #38 1 David Reckhow CEE 577 #38 2 What is a TMDL? Total Maximum Daily
National Lakes Assessment: Reporting on the Condition of the Nation s Lakes. Guide to Our Webcasts For Technical Support click the Help button
 National Lakes Assessment: Reporting on the Condition of the Nation s Lakes A Watershed Academy Webcast Sarah Lehmann, Team Leader, National Aquatic Resource Surveys, U.S. EPA Office of Water Neil Kamman,
Florida LAKEWATCH, Fisheries and Aquatic Sciences, SFRC, IFAS, University of Florida
 Submersed Aquatic Vegetation in Lake Apopka Mark V. Hoyer Florida LAKEWATCH, Fisheries and Aquatic Sciences, SFRC, IFAS, University of Florida January 2017 Historically, the primary use of Lake Apopka
Eutrophication Cause Determination Protocol
 Eutrophication Cause Determination Protocol Water Resources Advisory Committee October 25, 2017 Tom Wolf, Governor Charlie McGarrell Patrick McDonnell, Secretary Intended Use of the Protocol Follow-up
Water Quality Monitoring Report. Tom Ash Assistant Director Water Management Division October 16, 2014
 Water Quality Monitoring Report Tom Ash Assistant Director Water Management Division October 16, 2014 basic to any approach toward protections of the aquatic environment in the Tampa Bay area would be
Florida Watershed Monitoring Status and Trend Program Design Document
 Florida Watershed Monitoring Status and Trend Program Design Document Division of Environmental Assessment and Restoration Florida Department of Environmental Protection 2016 2600 Blair Stone Rd, MS 3525
8 LITTLE CROSBY LAKE RESULTS
 8 LITTLE CROSBY LAKE RESULTS 8.1 LITTLE CROSBY LAKE BACKGROUND Figure 8-1: View of the south shoreline of. is 8 acres with an average depth of 7 ft and a maximum depth of 34 ft. Little Crosby Lake is a