Bald Eagle Lake Nutrient TMDL
|
|
|
- Barnaby Blankenship
- 5 years ago
- Views:
Transcription

1 Bald Eagle Lake Nutrient TMDL Prepared for The Rice Creek Watershed District January 2011
2 Bald Eagle Lake Nutrient TMDL Report Wenck File # Prepared for: RICE CREEK WATERSHED DISTRICT Prepared by: January 2011 WENCK ASSOCIATES, INC Pioneer Creek Center P. O. Box 249 Maple Plain, Minnesota (763)
3 Table of Contents 1.0 INTRODUCTION Purpose Problem Identification Impaired Waters and Minnesota Water Quality Standards State of Minnesota Water Quality Standards and Designated Uses WATERSHED AND LAKE CHARACTERIZATION Lake and Watershed Description Drainage Patterns Land Use Recreational Uses Water Quality Monitoring in Bald Eagle Lake Temperature and Dissolved Oxygen Total Phosphorus Chlorophyll-a Secchi Depth Conclusions Fish Populations and Fish Health Fish Populations Carp Aquatic Plants Introduction Littoral Zone Aquatic Plants in Bald Eagle Lake Curly-leaf Pondweed Shoreline Habitat and Conditions NUTRIENT SOURCES AND LAKE RESPONSE Introduction Modeling Approach P8 Model Internal Loading Atmospheric Load BATHTUB Model (Lake Response) Estimation of Source Loads Atmospheric Load i
4 Table of Contents Watershed Nutrient Loading Judicial Ditch 1 Nutrient Loading Shuneman Marsh Upstream Lakes Direct Drainage and Judicial Ditch Septic systems Internal Phosphorus Loading Source Summary and Current Phosphorus Budget Linking Water Quality Targets and Sources Fit of the Model TMDL ALLOCATION Total Maximum Daily Load Calculations Total Loading Capacity Load Allocations Wasteload Allocations Margin of Safety Reserve Capacity and Future Development Summary of TMDL Allocations Lake Response Variables Total Phosphorus Chlorophyll-a Secchi Depth Seasonal and Annual Variation PUBLIC PARTICIPATION Introduction Technical Advisory Committee And Stakeholder Meetings Public Meetings IMPLEMENTATION Introduction Reduction Strategies Implementation Framework Watershed and Local Plans Adaptive Management Nutrient Reduction Strategies External Nutrient Load Reductions Internal Nutrient Load Reductions ii
5 Table of Contents Studies and Biological Management Plans Education REASONABLE ASSURANCE Introduction Rice Creek Watershed District NPDES MS4 Stormwater Permits Bald Eagle Lake Improvement District Monitoring Monitoring Implementation of Policies and BMPs Follow-up Monitoring LITERATURE CITED iii
6 Table of Contents TABLES Table 1-1. Numeric targets for deep lakes in the Central Hardwood Forest ecoregion Table 2-1. Bald Eagle Lake morphometric and watershed characteristics Table 2-2. Land use in the Bald Eagle Lake watershed Table 2-3 Bald Eagle Surface Use Comparison (Non-Angling) Table 3-1. Average total phosphorus concentration and loading at the outlet of Judicial Ditch 1 (JD1 and JD1.1) and entering Shuneman marsh (JD 1.5) Table 3-2. Estimates of loading from upstream lakes in the JD1 subwatershed Table 3-3. Watershed volume, concentration, and phosphorus load estimated for County Ditch 11 and the Bald Eagle Lake direct drainage Table 4-1. TMDL total phosphorus daily loads partitioned among the major sources for Bald Eagle Lake assuming the lake standard of 40 g/l Table 4-2. Wasteload Allocations for Bald Eagle Lake FIGURES Figure 2.1. Location Map Figure 2.2. Drainage Patterns Figure Metropolitan Council Land Use Figure 2.4. Summer (June 1 September 30) mean total phosphorus concentrations for Bald Eagle Lake Figure 2.5. Summer (June 1 September 30) mean chlorophyll-a concentrations for Bald Eagle Lake Figure 2.6. Summer (June 1 September 30) mean Secchi depth (meters) for Bald Eagle Lake Figure 2.7. Historical fish survey results for trophic group abundance in Bald Eagle Lake Figure 2.8. Historical fish survey results for trophic group biomass in Bald Eagle Lake Figure 2.9. Historical vegetation survey data for Bald Eagle Lake Figure Judicial Ditch monitoring sites Figure 3.2. Depiction of change in anoxia over the summer period for Bald Eagle Lake Figure 3.3. Average hypolimnetic total phosphorus concentrations for Bald Eagle Lake Figure 3.4. Average (2002 through 2008) total phosphorus budget for Bald Eagle Lake Figure 3.5. Model predicted and observed total phosphorus concentrations in Bald Eagle Lake Figure 3.6. Model predicted and observed chlorophyll-a concentrations in Bald Eagle Lake Figure 3.7. Model predicted and observed Secchi disk transparency in Bald Eagle Lake Figure 4.1. Sediment phosphorus release rates by eutrophic condition. (Nürnberg 1997) Figure 4.2 In-lake total phosphorus concentrations predicted for total phosphorus load reductions applied to all sources iv
7 Table of Contents Figure 4.3. In-lake chlorophyll-a concentrations predicted for total phosphorus load reductions applied to all sources Figure 4.4. Secchi depth predicted for total phosphorus load reductions applied to all sources. 4-7 Figure 6.1. Adaptive management APPENDICES A B C D E F G Temperature and Dissolved Oxygen Vegetation Surveys P8 Model Sediment Release Rates Shuneman Marsh Studies Annual Phosphorus Budgets Lake Response Models v
8 TMDL Summary EPA/MPCA Required Elements Location 303(d) Listing Information Applicable Water Quality Standards/ Numeric Targets Loading Capacity (expressed as daily load) TMDL Summary Table Summary White Bear Township in Ramsey County, City of Hugo in Washington County, and City of Lino Lakes in Anoka County, Minnesota, in the Upper Mississippi River Basin. Bald Eagle HUC Bald Eagle Lake was added to the 303(d) list in 2002 because of excess nutrient concentrations impairing aquatic recreation, as set forth in Minnesota Rules This TMDL is prioritized to start in 2008 and be completed by Criteria set forth in Minn. R (3) and (5). For Bald Eagle Lake, the numeric target is total phosphorus concentration of 40 µg/l or less. The loading capacity is the total maximum daily load for each of these conditions. The critical condition for these lakes is the summer growing season. The loading capacity is set forth in Total maximum daily total phosphorus load (lbs/day) Bald Eagle Lake 5.2 TMDL Page # Wasteload Allocation Portion of the loading capacity allocated to existing and future permitted sources. Source Permit # Gross WLA (lbs/day) Construction Stormwater MNR Lino Lakes MS White Bear Lake MS White Bear Township MS Hugo MS Grant MS Dellwood MS RCWD 3.6 Washington County MS Anoka County MS Ramsey County MS Mn/DOT Metro District MS Industrial Stormwater MS Construction Stormwater 4-5 i
9 TMDL Summary EPA/MPCA Required Elements Load Allocation Margin of Safety Seasonal Variation Reasonable Assurance Monitoring Implementation Public Participation TMDL Summary Table Summary The portion of the loading capacity allocated to existing and future non-permitted sources. Source Load Allocation (lbs/day) Upstream Lakes 0.4 Atmospheric Load 0.7 Internal Load 0.5 The margin of safety is implicit in each TMDL due to the conservative assumptions of the model and the proposed iterative nutrient reduction strategy with monitoring. Seasonal variation is accounted for by developing targets for the summer critical period where the frequency and severity of nuisance algal growth is greatest. Although the critical period is the summer, lakes are not sensitive to short-term changes but rather respond to long-term changes in annual load. Reasonable assurance is provided by implementing the TMDL through the Rice Creek Watershed District s watershed management plan, local water management plans adopted by White Bear Township and the cities of Hugo, Lino Lakes, Dellwood, Grant, and White Bear Lake, and activities conducted by the Bald Eagle Lake Association. The Rice Creek Watershed District and Minnesota DNR periodically monitor these lakes and will continue to do so through the implementation period. This TMDL sets forth an implementation framework and general load reduction strategies that will be expanded and refined through the development of an Implementation Plan. Implementation costs will range between $500,000 and $5 Million. Stakeholder and Public participation was accomplished through a series of technical and public meetings. Feedback garnered from these meetings was incorporated into the TMDL Report. TMDL Page # ii
10 Executive Summary This Total Maximum Daily Load (TMDL) study addresses a nutrient impairment in Bald Eagle Lake ( ). The goal of this TMDL is to quantify the pollutant reductions needed to meet State water quality standards for nutrients. Bald Eagle Lake is located primarily in White Bear Township in Ramsey County, Minnesota but also extends into the City of Hugo in Washington County and the City of Lino Lakes in Anoka County in the Upper Mississippi River watershed. It is a highly used recreational water body with an active fishery and provides other aesthetic values as well. The drainage area to the lake is 10,835 acres of land that is predominantly single family residential and undeveloped land cover with a large proportion of wetlands. The drainage area contains portions of White Bear Township within which most of the lake is located, but also includes portions of the cities of Hugo, Grant, Dellwood, White Bear Lake, and Lino Lakes. The outlet for Bald Eagle Lake is (a channel at the north end of the lake where it flows into Clearwater Creek. Water quality is considered moderately degraded, with the lake still viewed as a popular resource for recreational activities by riparian land owners as well as the general public. A P8 model and BATHTUB lake response model were developed for Bald Eagle Lake to develop current phosphorus budget for Bald Eagle Lake. Internal loading was estimated by quantifying anoxia over the sediments and measuring the anoxic release rate from profundal sediments. The calibrated lake response model was then used to determine the assimilative capacity for Bald Eagle Lake. The TMDL for Bald Eagle Lake is 5.2 pounds/day phosphorus. Wasteload and Load Allocations to meet state standards indicate that average nutrient load reductions of 58% would be required to consistently meet standards. Internal load management (91% reduction) and reduction of phosphorus from watershed runoff (38% reduction) will be required for Bald Eagle Lake to meet state standards. All three response variables (total phosphorus, chlorophyll-a, and Secchi depth) will be met with the allocated loads. iii
11 1.0 Introduction 1.1 PURPOSE This Total Maximum Daily Load (TMDL) study addresses a nutrient impairment in Bald Eagle Lake. The goal of this TMDL is to quantify the pollutant reductions needed to meet state water quality standards for nutrients in Bald Eagle Lake. The Bald Eagle Lake nutrient TMDL is being established in accordance with section 303(d) of the Clean Water Act, because the state of Minnesota has determined waters in Bald Eagle Lake exceed the state-established standards for nutrients. This TMDL provides wasteload allocations (WLAs) and load allocations (LAs) for Bald Eagle Lake. Based on the current state standard for nutrients, the TMDL establishes a numeric target of 40 µg/l total phosphorus concentration for deep lakes in the Central Hardwood Forest ecoregion. 1.2 PROBLEM IDENTIFICATION Bald Eagle Lake (DNR Lake # ), located primarily in White Bear Township, Ramsey County, Minnesota, was placed on the 2002 State of Minnesota s 303(d) list of impaired waters. Bald Eagle Lake was identified for impairment of aquatic recreation. Water quality does not meet state standards for nutrient concentration for deep lakes in the North Central Hardwood Forest ecoregion. The primary recreation activities supported by the lake include boating and fishing. The lake is well known recreational water body within Ramsey County, one of the counties comprising the Twin Cities Metropolitan Area and has a public access. It has a very active Lake Association comprised of lake shore property owners who are active in the management of the lake. Water quality in Bald Eagle Lake has been periodically monitored over the past 30 years with the most intensive monitoring occurring between 1999 and 2007 as a part of various lake management planning efforts. During this monitoring period, the average summer mean values (June 1 through September 30) for total phosphorus ranged from 69 to 123 µg/l and averaged 90 µg/l. Chlorophyll-a concentrations ranged from 16.4 to 51.8 µg/l and averaged 34.2 µg/l. Finally, Secchi depth transparencies averaged about 1.2 m with a range over the monitoring years of 1.0 to 1.7 m. Values for all three parameters exceeded the state standards for lakes in the North Central Hardwood Forest ecoregion. 1-1
12 1.3 IMPAIRED WATERS AND MINNESOTA WATER QUALITY STANDARDS State of Minnesota Water Quality Standards and Designated Uses Bald Eagle Lake is located in the Central Hardwood Forests ecoregion and is designated as a class 2B water. The Class 2B designation specifies aquatic life and recreation as the protected beneficial use of the water body. Minnesota s standards for nutrients limit the quantity of nutrients which may enter surface waters. Minnesota s standards at the time of listing (Minnesota Rules (3)) stated that in all Class 2 waters of the State there shall be no material increase in undesirable slime growths or aquatic plants including algae. In accordance with Minnesota Rules (5), to evaluate whether a water body is in an impaired condition the MPCA developed numeric translators for the narrative standard for purposes of determining which lakes should be included in the section 303(d) list as being impaired for nutrients. The numeric translators established numeric thresholds for phosphorus, chlorophyll-a, and clarity as measured by Secchi depth. The numeric target used to list this lake was the phosphorus standard for Class 2B waters in the Central Hardwood Forest ecoregion (40 g/l); this TMDL presents load and wasteload allocations and estimated load reductions for the 40 g/l target. Although the TMDL is set for the total phosphorus standard, one of the two other lake eutrophication standards (chlorophyll-a and Secchi depth) must also be met (Table 1-1). All three of these parameters were assessed in this TMDL to assure that the TMDL will result in compliance with state standards. Numeric standards applicable to Bald Eagle Lake for chlorophyll-a and Secchi depth are 14 g/l and 1.4 meters, respectively, as a growing season mean. All values are growing season means. Table 1-1. Numeric targets for deep lakes in the Central Hardwood Forest ecoregion. North Central Hardwood Parameters Forest (Deep Lakes) 1 Phosphorus Concentration ( g/l) 40 Chlorophyll-a Concentration ( g/l) 14 Secchi disk transparency (meters) >1.4 1 Deep lakes are defined as lakes with a maximum depth of more than 15 feet, and with less than 80% of the lake area shallow enough to support emergent and submerged rooted aquatic plants (littoral zone). 1-2
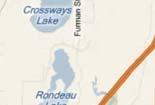
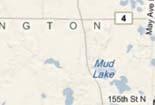
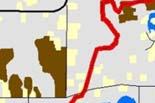
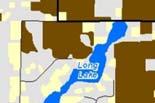
13 2.0 Watershed and Lake Characterization 2.1 LAKE AND WATERSHED DESCRIPTION Bald Eagle Lake is a 1,071 acre lake located in the northeast portion of the Twin Cities Metropolitan Area in Ramsey County and about 10 miles north of the City of St. Paul (Figure 2.1). Public access is via a county-owned park along State Highway 61 on the east shore of the lake. The lake s maximum depth is 39 feet and about 61% of the lake is less than 15 feet deep or littoral (Table 2.1). Typically, the greater the percentage of the lake that is littoral, the greater the influences of biological processes (fish, zooplankton, and plants) on water quality. Bald Eagle Lake likely will respond to both watershed inputs as well as changes in the lake s biological system. Bald Eagle Lake is a moderately hardwater lake with somewhat high phosphorous fertility. Bald Eagle Lake has a moderate residence time, averaging approximately 1.3 years. The watershed-to-lake area ratio is just over 10:1, which indicates that the lake will be somewhat sensitive to watershed nutrient inputs. The Bald Eagle Lake watershed and the general flow patterns of the contributing tributaries are present in Figure 2.2. Table 2-1. Bald Eagle Lake morphometric and watershed characteristics. Parameter Surface Area (acres) 1,071 Average Depth (ft) 12 Maximum Depth (ft) 39 Volume (ac-ft) 13,174 Residence Time (years) 1.3 Littoral Area (acres) 652 Littoral Area (%) 61% Watershed (acres) 10,835 Watershed:Lake Area ratio 10:1 2.2 DRAINAGE PATTERNS Bald Eagle Lake has a fairly complex drainage area that includes three primary subwatersheds and connections to both White Bear and Otter Lakes (Figure 2.2). The largest subwatershed is Judicial Ditch 1 (JD1) which drains the eastern part on the watershed and includes Shuneman marsh, Fish and Pine Tree Lakes, and a golf course. JD1 represents approximately 75% of the land area draining to Bald Eagle Lake. Bald Eagle Lake is also connected by a channel to Otter Lake. To evaluate the potential for Otter Lake to discharge to Bald Eagle Lake, DNR-measured elevations in each lake were compared over the past 50 years. In all cases where lake elevations were measured simultaneously, Bald Eagle Lake elevations were higher than Otter Lake. Consequently, it was 2-1
14 determined that Bald Eagle Lake only discharges to Otter Lake and Otter Lake is not a source of nutrients to Bald Eagle Lake. White Bear Lake also has an overflow channel that can discharge to Bald Eagle Lake. To determine the importance of flow from White Bear Lake, an existing HydroCAD model was used to determine outflow volumes for the 2, 10, and 100 year recurrence intervals. The 100 year flow event was estimated to only discharge 70 acre-feet of water to Bald Eagle Lake. Therefore it was concluded that outflow from White Bear Lake is not an important source of water or nutrients to Bald Eagle Lake. 2.3 LAND USE Land use data for the Bald Eagle Lake watershed are presented in Table 2.2 and Figure 2.3. Land use is primarily undeveloped and single family residential land (35% and 26% respectively); however, much of the undeveloped land is in the upper portion of the JD1 subwatershed that drains to Pine Tree Lake. There is also a fairly large agricultural area (13%) mostly in the JD1 subwatershed. Table 2-2. Land use in the Bald Eagle Lake watershed. Land Use* Acres Percent Agricultural 1,361 13% Industrial % Institutional % Major Highway 81 1% Multi-Family Residential 66 1% Open Water 1,778 16% Park and Recreation 727 7% Single Family Residential 2,811 26% Undeveloped 3,817 35% Commercial 71 1% Mixed Use % Airport % TOTAL 10, % *Source: Metropolitan Council 2.4 RECREATIONAL USES Bald Eagle Lake supports a variety of recreational uses, including open water and ice fishing, swimming, and boating. The most recent MN Department of Natural Resources (MnDNR) lake management plan available for the lake was compiled based on 1996 data and indicated a fishing use of 72 angler-hours per lake surface acre in 1994 compared to 37 angler-hours/acre in The latter figure is toward the upper end of the range for Twin Cities Metropolitan Area (TCMA) lakes. MnDNR also assessed other surface uses and compiled a comparison between 1974 and 1994 use rates (Table 2.3). 2-2
15 Table 2-3. Bald Eagle Surface Use Comparison (Non-Angling) Use (hours per acre) 1974 Survey 1994 Survey Runabouts Waterskiing Sailboats Canoes/rowboats House/pontoon boats Paddle boats Other uses In July and August of 2000, the Bald Eagle Area Association also conducted a boat inventory for the lake. The surveys were made on weekdays when boat usage on the lake was light and boats operating on the lake were excluded from inventory in order to avoid potential double counting. The survey showed that about 600 boats are stored at private docks, on shore, or at mooring facilities, with almost 90% of these associated with individual riparian single family residences. There is no information available on the number of boaters using the lakes on high use weekends. DNR safety guidelines suggest 20 acres per boat suggesting that Bald Eagle Lake can sustain approximately 50 boats safely. The number of boats owned by shoreline residents, together with usage by the general public suggests that crowding could be an issue. Further, high boat traffic in shallow areas, even at low or no wake speeds can increase sediment disturbance and direct vegetation impacts through cutting (Asplund and Cook 1997). Maintaining high quality habitats such as these is essential in maintaining the appropriate fish assemblage to protect water quality. Healthy shallow lake systems often depend on piscivorous fish such as bass to keep the panfish population in balance. Because Bald Eagle Lake is relatively shallow (61% less than 15 feet in depth) and is highly used by recreational boaters, it may be susceptible to water quality degradation caused by boating impacts. 2-3


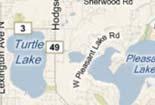


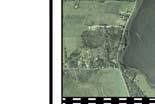
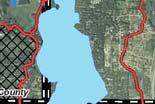
16 Figure 2.1. Location Map 2-4


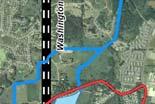


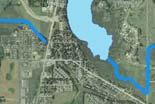


17 Figure 2.2. Drainage Patterns 2-5

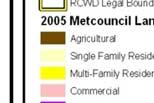


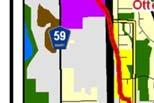


18 Figure Metropolitan Council Land Use 2-6
19 2.5 WATER QUALITY Water quality in Minnesota lakes is often evaluated using three associated parameters: total phosphorus, chlorophyll-a, and Secchi depth. Total phosphorus is typically the limiting nutrient in Minnesota s lakes meaning that algal growth will increase with increases in phosphorus. However, there are cases where phosphorus is widely abundant and the lake becomes limited by nitrogen or light availability. Chlorophyll-a is the primary pigment in aquatic algae and has been shown to have a direct correlation with algal biomass. Since chlorophyll-a is a simple measurement, it is often used to evaluate algal abundance rather than expensive cell counts. Secchi depth is a physical measurement of water clarity by lowering a black and white disk until it can no longer be seen from the surface. Higher Secchi depths indicate less light refracting particulates in the water column and better water quality. Conversely, high total phosphorus and chlorophyll-a concentrations point to poorer water quality and thus lower water clarity. Measurements of these three parameters are interrelated and can be combined into an index that describes water quality Monitoring in Bald Eagle Lake Water quality monitoring has been conducted at several locations on Bald Eagle Lake under a variety of efforts. The main sampling station (#5401) on Bald Eagle Lake is the deep hole near the middle of the south basin just east of the island. Samples have been taken almost yearly at this location since 1980, though there is some in-lake phosphorus data from other sites as far back as Two other sites 5402 and 5403 have been sampled starting in Collection efforts have been conducted by the Ramsey County, the MN Department of Natural Resources, the MN Pollution Control Agency, the Metropolitan Council, and the Rice Creek Watershed District. There were also monitoring efforts conducted on Judicial Ditch 1-one of the main watershed inputs discharging to the lake from 1998 through 2002 and again in Temperature and Dissolved Oxygen Temperature and dissolved oxygen profile data have been collected consistently over the last 30 years. Temperature profiles suggest reasonably stable stratification in areas of the lake deeper than 7 m during the summer (Appendix A). Dissolved oxygen (DO) concentration in Bald Eagle Lake also demonstrates stratification with hypoxia (DO 2 mg/l) measured as shallow as 5 meters. Temperature and dissolved oxygen conditions in Bald Eagle Lake demonstrate the potential for internal loading of phosphorus Total Phosphorus Summer average total phosphorus concentrations at the mid-lake monitoring site (#5401) in Bald Eagle Lake exceeded the State standard of 40 µg/l in all monitoring years (Figure 2.4). The highest summer average concentration was measured in 2000 and reached over 120 µg/l. Excluding 2000, summer average total phosphorus concentrations have ranged from 48 µg/l to 101 µg/l between the early 1980s and 2007, suggesting that the lake has been consistently above the state eutrophication standard of 40 µg/l for almost 30 years. 2-7
20 Summer Mean Total Phosphorus Total Phosphorus (ug/l) Figure 2.4. Summer (June 1 September 30) mean total phosphorus concentrations for Bald Eagle Lake. The red line indicates the current State standard for the Northern Central Hardwood Forest ecoregion Chlorophyll-a Between the mid-1980 s and 2007, chlorophyll-a concentrations in Bald Eagle Lake ranged from just over 16 to as high as 51.8 µg/l for years with four samples or more during the summer season (Figure 2.5). Recent chlorophyll-a concentrations range from 24 to 45 µg/l, which are still about 2-3 times the State standard. Chlorophyll-a concentrations in this range indicate a high incidence of nuisance algae blooms. Summer Mean Chlorophyll-a Chlorophyll-a (ug/l) Figure 2.5. Summer (June 1 September 30) mean chlorophyll-a concentrations for Bald Eagle Lake. The red line indicates the current State standard for the Northern Central Hardwood Forest ecoregion. 2-8
21 2.5.5 Secchi Depth Water clarity (Secchi depth) followed the same trend as TP and chlorophyll-a and has not met the state standard over the past 30 years (Figure 2.6). There is no apparent trend in the Secchi depth data suggesting that the lake has demonstrated similar water quality over the past 30 years. Summer Mean Secchi Depth Secchi Depth (m) Figure 2.6. Summer (June 1 September 30) mean Secchi depth (meters) for Bald Eagle Lake. The red line indicates the current State standard for the Northern Central Hardwood Forest ecoregion Conclusions Overall, Bald Eagle Lake has not met current state standards since the early 1980s when data collection began. While there is some variability in the monitoring data from year to year, trends over that time show that the water quality is relatively stable in its current state. There has not been a significant decline or improvement in the water quality of Bald Eagle Lake over this time period. However, it is important to note that a rigorous trend analysis has not been conducted on the data set. 2.6 FISH POPULATIONS AND FISH HEALTH Fish Populations The fisheries lake management plan and fish survey reports for Bald Eagle Lake were provided by the DNR East Metro Area Fisheries Office. The initial DNR fish survey for Bald Eagle Lake was conducted in There have been seven additional surveys since that time, with a survey being conducted about every five years since Standard survey methods used by the DNR include gill net and trap nets. These sampling methods do have some sampling bias, including focusing on game management species (i.e., northern pike and walleye), under representing 2-9
22 small minnow and darter species presence/abundance, and under representing certain management species such as largemouth bass. The current methods also likely under represent carp populations in the lakes. However, in our experience, when carp are present in the lakes, the sampling methods do capture some of the population. So, although carp density is likely under represented, the methods do provide a reasonable year to year comparison. The lake management plan developed by the East Metro Fisheries Office for Bald Eagle Lake indicates the lake is primarily managed for walleye and muskellunge, with secondary management emphasis on largemouth bass, bluegills, and black crappie. There have been 17 species collected during DNR surveys: Black Bullhead Black Crappie Bluegill Bowfin Common Carp Golden shiner Green Sunfish Hybrid Sunfish Largemouth Bass Muskellunge Northern Pike Pumpkinseed Shortnose gar Walleye White Crappie Yellow Bullhead Yellow Perch Fish community data was summarized by trophic groups (Figures 2.7 and 2.8). Species within a trophic group serve the same ecological process in the lake (i.e., panfish species feed on zooplankton and invertebrates; may serve as prey for predators). Analyzing all the species as a group is often a more accurate summary of the fish community then analyzing individual species trends. The following conclusions can be drawn from the fish data: Panfish species, including Black Crappie and Bluegill, are the most abundant group during the most recent DNR surveys. Between 1957 and 1982, the surveys showed rough fish (primarily black bullhead) as both most abundant and having the highest biomass in the lake. Top predators now comprise the largest percentage of the total biomass catch during each of the DNR surveys, with largemouth bass, walleye, northern pike, and muskellunge all well represented. However, their abundance is relatively low suggesting a few large individuals. The low abundance may not be able to adequately control the panfish population. The large panfish population may be able to produce significant grazing pressure on the zooplankton community in the lake. However, since no zooplankton data have been collected on the lake, it is difficult to determine the impact on the zooplankton community. Rough fish abundance and biomass is low and is comprised mainly of yellow and black bullheads and some carp. It should be noted that common carp abundance may not be accurately assessed using DNR surveys. However, the current methods allow reasonable year-to-year comparisons. A carp specific survey would ultimately assess the actual carp abundance in the lake. 2-10
23 Bald Eagle Lake Trophic Group Total Abundance Historical Catch Summary for DNR Surveys Forage Species Rough Fish Top Predators Common Carp Pan Fish Fish Abundance (per effort) Survey Year Figure 2.7. Historical fish survey results for trophic group abundance in Bald Eagle Lake. Bald Eagle Lake Trophic Group Total Biomass Historical Catch Summary for DNR Surveys Forage Species Common Carp Top Predators Rough Fish Pan Fish Fish Biomass (lbs/effort) Survey Year Figure 2.8. Historical fish survey results for trophic group biomass in Bald Eagle Lake. 2-11
24 2.6.2 Carp Common carp have both direct and indirect effects on aquatic environments. Carp uproot aquatic macrophytes during feeding and spawning and re-suspend bottom sediments and nutrients. These activities can lead to increased nutrients in the water column ultimately resulting in increased nuisance algal blooms. There may be carp and other rough fish present in Bald Eagle Lake, but the size and composition is currently unclear. Standard DNR methods are not particularly effective at capturing carp. However, when carp populations are quite large, the DNR methods often do catch some. At least some common carp have been captured in seven out of the eight DNR surveys conducted since the 1950s. Further analysis may be needed to better characterize the carp population in Bald Eagle Lake. However, based on year to year comparisons from DNR surveys, current carp populations appear to be relatively small and likely are having little impact on lake water quality. Due to sampling bias in current DNR survey methods, only a targeted assessment of the carp density would verify this assumption. 2.7 AQUATIC PLANTS Introduction Aquatic plants are beneficial to lake ecosystems, providing spawning and cover for fish, habitat for macroinvertebrates, refuge for prey, and stabilization of sediments. However, in high abundance and density they limit recreation activities, such as boating and swimming, and may reduce aesthetic value. Excess nutrients in lakes can lead to non-native, invasive aquatic plants taking over a lake. Some exotics can lead to special problems in lakes. For example, under the right conditions, Eurasian watermilfoil can reduce plant biodiversity in a lake because it grows in great densities and out-competes all the other plants. Ultimately, this can lead to a shift in the fish community because these high densities favor panfish over larger game fish. Species such as curly-leaf pondweed can cause very specific problems by changing the dynamics of internal phosphorus loading. All in all, there is a delicate balance within the aquatic plant community in any lake ecosystem Littoral Zone The littoral zone is defined as that portion of the lake that is less than 15 feet in depth and is where the majority of the aquatic plants are found. The littoral zone of the lake also provides the essential spawning habitat for most warm water fishes (e.g. bass, walleye, and panfish). Bald Eagle Lake is approximately 61% littoral and should support a healthy rooted aquatic plant community. The key is fostering a diverse population of rooted aquatic plants that is dominated by native (non-invasive) species Aquatic Plants in Bald Eagle Lake Plant surveys have been conducted on Bald Eagle Lake dating back to 1989 by the DNR, the Bald Eagle Area Association, and the Rice Creek Watershed District. A thorough summary of vegetation in Bald Eagle Lake can be found in Appendix B. Additional vegetation information is available with many of the fish surveys dating back to the 1950 s. However, this section focuses on the most recent data in Bald Eagle Lake which reflects current conditions. 2-12
25 Bald Eagle Lake possesses a moderately diverse aquatic plant community with 21 different species observed across the various surveys, with a mix of emergent, floating leaf and submerged plant species. The 2003 DNR lake management plan underlines the importance of protecting the remaining shoreline marshes for habitat purposes. In addition, emergent species like water lily, spatterdock, bulrush and even cattails are very important to the ecology of the lake by providing shoreline protection, maintaining water quality, and providing critical spawning, rearing, and feeding habitat for a number of the predatory gamefish species in the lake. There have been 17 different submerged species observed across the recent aquatic plant surveys (Figure 2.9). Two of these species are invasive. Eurasian water milfoil was first noted in the lake during a 1989 survey by DNR, while curly leaf pond weed was recorded in the lake in Several species showed increases in coverage between the 1997 and 2002 surveys, with several milfoil species two native, one invasive as well as water celery, coontail, and Illinois pondweed (the latter all natives species) showing the greatest increase in abundance. The two most common native submergent plant species observed across all plant surveys were water celery, coontail, water stargrass, and Chara. Other important native submerged plant species such as large leaf pondweed, sago pondweed, and clasping leaf pondweed have been observed at varying densities over the years. Bald Eagle Lake Summer Vegetation Surveys Late Summer Early Summer Late Summer Late Summer Late Summer Late Summer Late Summer Survey Year Early Summer Late Summer Late Summer Late Summer Late Summer Late Summer Duckweed Spatterdock Waterlily Watermeal Coontail Chara Star duckweed Northern watermilfoil Watermilfoil hybrid Curlyleaf pondweed Illinois pondweed Claspingleaf pondweed Flatstem pondweed Sago pondweed Water celery Water stargrass Stringy Pondweed Figure 2.9. Historical vegetation survey data for Bald Eagle Lake. 2-13
26 2.7.4 Curly-leaf Pondweed Curly-leaf pondweed is an invasive, like Eurasian watermilfoil, that can easily take over a lake s aquatic macrophyte community. Curly-leaf pondweed presents a unique problem in that it is believed to significantly affect the in-lake availability of phosphorus, contributing to the eutrophication problem. Curly-leaf pondweed begins growing in late-fall, continues growing under the ice, and dies back relatively early in summer, releasing nutrients into the water column as it decomposes, possibly contributing to algal blooms. Curly-leaf pondweed can also outcompete more desirable native plant species. Curly-leaf pondweed was first observed during a 1992 DNR survey and was found to be common in the lake during that time even though the survey was conducted in August, well after the typical seasonal peak in biomass for the plant had passed. Recent surveys (1998 and 2003) demonstrate that curly-leaf pondweed covered approximately 30% of the lake area representing 300 acres (Appendix B) and was at nuisance levels in 180 acres of lake area. The Bald Eagle Area Association began an aggressive curly-leaf pondweed management program in 2000 that included mechanical harvesting from and herbicide applications in These efforts were meant to reduce the biomass of curly-leaf pondweed before summer die-back and decomposition, thus limiting phosphorus contributions. A summary of the program can be found in Appendix B. Data from the monitoring suggest that the herbicide treatments are effectively reducing the abundance of curly-leaf pondweed in Bald Eagle Lake within each treatment year. Long-term control remains elusive. 2.8 SHORELINE HABITAT AND CONDITIONS The shoreline areas are defined as the areas adjacent to the lake s edge, with hydrophytic vegetation and water up to 1.5 feet deep or a water table within 1.5 feet from the surface. Natural shorelines provide water quality treatment, wildlife habitat, and increased biodiversity of plants and aquatic organisms. Natural shoreline areas also provide important habitat to fisheries including spawning areas and refugia as well as aesthetic values. In addition to the ecological benefits, natural shorelines can stabilize sediments, and protect lake edges from wave-induced erosion. Natural shoreland exists around Bald Eagle Lake; however, no quantitative data have been collected to date. Much of the shoreline area has been impacted by development. Naturalization of the shorelines could have a positive effect on Bald Eagle Lake and water quality. 2-14
27 3.0 Nutrient Sources and Lake Response 3.1 INTRODUCTION Understanding the sources of nutrients to a lake is a key component in developing an excess nutrient TMDL for lakes. To that end, a phosphorus budget that sets forth the current phosphorus load contributions from each potential source was developed using the modeling and collected data described below. Additionally, lake response models can be developed to understand how different lake variables respond to changes in nutrient loads. 3.2 MODELING APPROACH Several models were used to develop the nutrient budget necessary to establish load and wasteload allocations P8 Model The first step in understanding nutrient loading to Bald Eagle Lake is to develop an estimate of watershed water and nutrient loads. To estimate watershed loading a P8 model was developed for the JD1 subwatershed where the 2001 monitoring season represents a reasonable calibration data set. Runoff from the P8 model is then combined with water quality data where available to estimate nutrient loading. Where no water quality data are available, the P8 model was used with default (NURP50) inputs to estimate watershed loading. Ultimately, three P8 models were constructed including one each for JD1, CD11, and Direct subwatersheds. P8 (Program for Predicting Polluting Particle Passage thru Pits, Puddles, & Ponds; Walker 1990) is a public domain ( industry standard model developed to assess pollutant loading in urban watersheds. P8 was developed using National Urban Runoff Program (NURP) data and provides loading estimates based on data collected as a part of the NURP program. The model estimates the build-up and wash-off of particulates from impervious surfaces in the watershed. The NURP 50 th percentile particle file was used to estimate watershed pollutant loading. To estimate a long term nutrient load record for JD1, a P8 model was hydrologically calibrated to the 2001 intensive monitoring data set (Figure 3.1). Details of the model construction and calibration can be found in Appendix C. The model was constructed by first identifying major water quality treatment devices (ponds, swales, etc.) in the watershed and delineating drainage areas to those devices. Watershed characteristics were developed using Minnesota Land Cover Classification System (MLCCS) data for the Bald Eagle Lake watershed. These data were used to estimate the impervious and pervious fractions of the watershed. The pervious areas were assigned a composite curve number based on land cover and soil type. 3-1


28 Figure Judicial Ditch monitoring sites. Once the model was constructed, the default parameter model was compared to measured annual runoff in 2001 wheree the most complete dataa set was available. The model under-predicted runoff with default values, so the precipitation factor wass increased (from 1 to 1..35) until annual volumes matched between the model and measured values at each off the monitoring sites. It is important to note that the precipitation factor applies to the whole JD1 subwatershed and is not adjusted individually by subwatershed within the JD1 drainage. Because no monitoring dataa were available for either the CD11 or Direct subwatersheds, no adjustment was made to the precipitation factor. Rather, the model was used with default values. No water quality calibration was applied to the models. For JD1, the confounding effects of Shuneman marsh prevented water quality calibration of the P8 model. So, nutrient loads from JD1 weree estimated by multiplying the average total phosphorus concentration and annual flow volume estimated from the P8 model. For CD11 and thee Direct subwatersheds, P8 with default values (NURP50) was used to estimate nutrient loading on an annual basis Internal Loading The next step in developing an understanding of nutrientt loading to Bald Eagle Lake is to estimate internal nutrient loads. Internal phosphorus loading from lake sediments has been demonstrated to be an important aspect of the phosphorus budgets off lakes. However, measuring 3-2
29 or estimating internal loads can be difficult, especially in shallow lakes that may mix many times throughout the year. To estimate internal loading, an anoxic factor (Nürnberg 2004), which estimates the period where anoxic conditions exist over the sediments, is estimated from the dissolved oxygen profile data. The anoxic factor is expressed in days but is normalized over the area of the lake. The anoxic factor is then used along with a sediment release rate to estimate the total phosphorus load from the sediments. Phosphorus release rates were estimated by collecting cores from Bald Eagle Lake and incubating them in the lab under anoxic conditions (ACOE-ERD 2008; Appendix D) Atmospheric Load The atmospheric load refers to the load applied directly to the surface of the lake through atmospheric deposition. Atmospheric inputs of phosphorus from wet and dry deposition are estimated using rates set forth in the MPCA report Detailed Assessment of Phosphorus Sources to Minnesota Watersheds (Barr Engineering, 2004), and are based on annual precipitation. The values used for dry (< 25 inches), average, and wet precipitation years (>38 inches) for atmospheric deposition are 24.9, 26.8, and 29.0 kg/km 2 -year, respectively. These values are equivalent to 0.22, 0.24, and 0.26 pounds/acre-year for dry, average, and wet years in English units, respectively BATHTUB Model (Lake Response) Once the nutrient budget for a lake has been developed, the response of the lake to those nutrient loads must be established. The focus of the lake response modeling is on total phosphorus, chlorophyll-a and Secchi depth. A BATHTUB lake response model was constructed using the nutrient budget developed using the methods previously described in this section. Ten years were modeled to validate the assumptions of the model. Several models (subroutines) are available for use within the BATHTUB model. The selection of the subroutines is based on past experience in modeling lakes in Minnesota and is focused on subroutines that were developed based on data from natural lakes. The Canfield-Bachmann natural lake model was chosen for the phosphorus model. The chlorophyll-a response model used was model 1 from the BATHTUB package, which accounts for nitrogen, phosphorus, light, and flushing rate. Secchi depth was predicted using the VS. CHLA & TURBIDITY equation. For more information on these model equations, see the BATHTUB model documentation (Walker 1999). Model coefficients are also available in the model for calibration or adjustment based on known cycling characteristics. The coefficients were left at the default values. No calibration factors were applied to the response models. 3.3 ESTIMATION OF SOURCE LOADS Atmospheric Load The atmospheric load (pounds/year) for Bald Eagle Lake was calculated by multiplying the lake area (acres) by the atmospheric deposition rate (pounds/acre-year). For example, in an average 3-3
30 precipitation year the atmospheric load to Bald Eagle Lake would be pounds/acre-year times the lake surface area (1,071 acres), which is pounds/year. The watershed is small enough that it is unlikely that there are significant geographic differences in rainfall intensity and amounts across the watershed Watershed Nutrient Loading There are three primary drainage areas for Bald Eagle Lake including Judicial Ditch 1 (JD1), County Ditch 11 (CD11), and the direct Bald Eagle Lake watershed. Long term water quality data are available for JD1 including a more detailed monitoring data set collected in 2001 that includes estimates of flow. These data were used to estimate loading in Next, a P8 model was calibrated to flow from the 2001 data set. The calibrated model was then used to estimate annual flow volumes for the past eleven years. The P8 estimated flow volumes were multiplied by the annual average total phosphorus concentrations to estimate the annual load from the JD1 subwatershed. The P8 model was also applied to the unmonitored portions of the Bald Eagle Lake watershed (CD11 and Direct Watershed) to estimate nutrient loads from these portions of the watershed. Following is a detailed description of the results of the estimation of watershed nutrient loads Judicial Ditch 1 Nutrient Loading Annual discharge estimated by the P8 model was used with monitoring data collected at the outlet of JD1 to estimate annual nutrient loads to Bald Eagle Lake from the JD1 subwatershed (Table 3.1). The outflow monitoring site was moved a short distance in 2003 (from JD1 to JD1.1) so estimates after 2003 are based on average total phosphorus data from the new site (Figure 3.1). Loads were calculated by multiplying the average TP concentration at the outflow by the total volume to get annual load in pounds per year. Table 3-1. Average total phosphorus concentration and loading at the outlet of Judicial Ditch 1 (JD1 and JD1.1) and entering Shuneman marsh (JD 1.5). P8 Estimated Volume Average Total Phosphorus (µg/l) Estimated Load (pounds/year) Year (acre-feet) JD1 JD1.1 JD , , , , , , , , , , , , , , , , , , ,
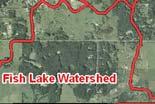
31 Shuneman Marsh One of the primary features of the JD1 drainage is a wetland complex at the bottom of the watershed known as Shuneman marsh. The marsh has historically been thought to add phosphorus to runoff from the watershed. Consequently, several studies were conducted by the RCWD focused on identifying the source of phosphorus from the JD1 watershed and to develop potential solutions for reducing the phosphorus load (Appendix E). However these studies found that over 50% of the phosphorus loading from the JD1 subwatershed was from above the marsh in the Fish lake area of the watershed. For the purposes of this TMDL, nutrient loading from JD1 is calculated as a single load and is not allocated from the various sources within the watershed. However, the previously collected data provide a wealth of information regarding sources of nutrients within the JD1 subwatershed. These data are used to develop more specific actions in the Bald Eagle Lake Implementation Plan Upstream Lakes There are two upstream lakes in the JD1 subwatershed including Fish Lake and Pine Tree Lake. Although loading from these two lakes are included in the JD1 loading estimates, it is important to understand their role in nutrient loading from the JD1 subwatershed to Bald Eagle Lake which allows for a better source assessment and the ability to allocate loads to these water bodies. Long term water quality data sets were not available for the lakes, so the average of the few monitored years of data were applied to each year to estimate loading. It is important to note that these estimates only represent a subset of the JD1 nutrient load to evaluate the importance of upstream lakes on the JD1 watershed loading. Drainage coming from Pine Tree Lake and its subwatershed comprises approximately 40% of the water balance for the JD1 subwatershed (Table 3.2). Consequently, outflow from Pine Tree Lake has a significant influence on nutrient loading from the JD1 subwatershed. Pine Tree Lake has relatively good water quality (31 µg/l total phosphorus as a growing season mean) resulting in a positive influence on loading from the JD1 subwatershed. Pine Tree Lake and its subwatershed warrant protection from degradation to reduce or maintain loadings to Bald Eagle Lake. Fish Lake represents a much smaller portion of the water balance for JD1 representing 10% of the water balance for the JD1 subwatershed (Table 3.2). Although only two good years of data are available for Fish Lake, water quality degradation is likely occurring in the lake. Fish Lake had a summer average TP concentration of 171 µg/l in 2002 and 42 µg/l in Both of these summer averages exceed the current state eutrophication standards for deep lakes. Consequently, part of the required load reductions for JD1 will need to be addressed through restoration of Fish Lake. 3-5
32 Table 3-2. Estimates of loading from upstream lakes in the JD1 subwatershed. P8 Estimated Volume (acre-feet) Average Total Phosphorus (µg/l) Estimated Load (pounds/year) Pine Tree Year Fish Lake Lake Fish Lake 1 Pine Tree Lake Fish Lake Pine Tree Lake , , , , , , , , , Note that 42 µg/l was used because the most recent data from Fish Lake was a summer average of 42 µg/l total phosphorus. However, limited data from previous years suggests that water quality may be poorer than represented here Direct Drainage and Judicial Ditch 11 Monitoring data was not available for JD11 and the Direct Bald Eagle Lake subwatershed, so the P8 model was used to estimate nutrient loads from these subwatersheds (Table 3.3). P8 was applied using the default values for estimating runoff (see Section 3.2.1) and the 50th percentile particle data set from the National Urban Runoff Program studies. Table 3-3. Watershed volume, concentration, and phosphorus load estimated for County Ditch 11 and the Bald Eagle Lake direct drainage. P8 Estimated Volume (acre-feet) Average Total Phosphorus (µg/l) Estimated Load (pounds/year) Bald Eagle Bald Eagle Lake Bald Eagle Lake Year CD11 Lake Direct CD11 Direct CD11 Direct , CD11 and the direct watershed drainage represent approximately 30% of the total water budget for Bald Eagle Lake (10% and 20% respectively). These watersheds are relatively developed and have limited water quality treatment prior to discharging to Bald Eagle Lake. 3-6
33 3.3.3 Septic systems Septic systems in the Bald Eagle Lake watershed have received attention historically as a possible source of nutrients to the lake. However, a 2003 lake management plan for Bald Eagle Lake concluded that from a water quality perspective, septic systems do not appear to be a significant nutrient source to the lake (Blue Water Science 2003). The conclusion is based on some rudimentary modeling of the known septic systems around Bald Eagle Lake. If all the systems were failing, phosphorus loading from septic systems would represent less that 10% of the phosphorus budget. However, it is unlikely that all of the systems are failing. The most likely scenario where less than 15% of the systems are failing resulted in a phosphorus load less than 1% of the overall load to Bald Eagle Lake. For this TMDL, septic systems were assumed to be a minimal contributor of phosphorus and were assigned an allowable load of 0 pounds per year. Current loading is assumed to be a part of the total watershed load and no effort was made to separate the septic system load from the watershed load Internal Phosphorus Loading Bald Eagle Lake demonstrates significant anoxia over the bottom sediments throughout the summer with peak anoxic areas typically occurring in mid to late summer (Figure 3.2). Anoxic conditions in lakes are often expressed as the number of days anoxia occurs over the area equal to the entire lake; this term is referred to as the anoxic factor. The anoxic factor ranged from 11 to 29 days for Bald Eagle Lake. 3-7


.")


34 Figure 3.2. Depiction of change in anoxia over the summer period for Bald Eagle Lake. The figure is for demonstration purposes only annual changes in anoxia were analyzed using field data, and is represented as the Anoxic Factor in Table 3.4. Once anoxia is quantified, the next step is to identify the rate at which sedimentss release phosphorus under anoxic conditions. The measured rate of phosphorus release from anoxic sediments in Bald Eagle Lake is 10.8 mg/m 2 /day (ACOE-ERDC 2007). This rate can then be used to estimate the gross internal loading based on the anoxic factorr for the lake (Nürnburg 2004). The estimated gross loads for Bald Eagle Lake are presented in Table 3.4. Gross internal loading for Bald Eagle Lake ranges from 1,157 to 2,945 pounds per year. The estimates are then inserted in the lake response model to estimate the role of internal loading on current lake water quality. Table 3.4. Estimated gross internal loading from anoxic phosphorous release in Bald Eagle Lake. Year Anoxic Factor Release Rate (days) (mg/m 2 /day) Gross Load (kg) , , , Based on a shallow lake equation developed to estimate anoxic factors in polymictic lakes. Gross Load (lbs) 2,945 1,426 1,227 2,165 2,320 1,975 1,377 1,975 2,835 1,618 1,
35 Another line of evidence evaluated to assess the importance of internal nutrient loading to Bald Eagle Lake is nutrient concentration in the hypolimnion, the cool bottom water that is too dense to mix to the surface. Bald Eagle Lake demonstrates significant build-up of phosphorus in the hypolimnion with bottom total phosphorus concentrations typically reaching as high as 200 µg/l and even approaching 1 mg/l (Figure 3.3). Site 5401 Total Phosphorus Below 7 meters TP (ug/l) /24/ /6/1999 4/19/2001 9/1/2002 1/14/2004 5/28/ /10/2006 2/22/2008 Figure 3.3. Average hypolimnetic total phosphorus concentrations for Bald Eagle Lake. Sediment cores were collected to analyze sediment chemistry in Bald Eagle Lake. The redoxsensitive loosely-bound and iron-bound P fractions accounted for a considerable proportion of the sediment total P for Bald Eagle (ACOE-ERDC 2008). Redox-sensitive P versus anoxic P release rates for sediments in the present study were comparable to published regression relationships developed by Nürnberg (1988), suggesting that anoxia, reduction of iron, and desorption of P were drivers in internal P loading. 3.4 SOURCE SUMMARY AND CURRENT PHOSPHORUS BUDGET Phosphorus and water budgets were developed for 1998 through 2008 to summarize the sources of nutrients to Bald Eagle Lake (Appendix F). The 2002 through 2008 average is presented here because the lake response model performed well in these years (Figure 3.4; see Section 3.5). The 1998 through 2001 period appears to be missing a nutrient source. The change in model performance changes at the same time active curly-leaf pondweed control was implemented in Bald Eagle Lake. Since loading attributed to curly-leaf pondweed decomposition is not explicitly accounted for in the BATHTUB model, it is likely that curly-leaf pondweed was an active phosphorus source that was eliminated when control measures were undertaken. 3-9
36 Nutrient loading to Bald Eagle Lake is fairly evenly split between internal and external loading. The primary external load is from JD1 because this represents a fairly large proportion of the watershed. However, it is important to note that reductions in nutrient loadings from JD1 may be more difficult to achieve because inflow concentrations are fairly low, typically between 100 and 200 µg/l. Conversely, both CD11 and the direct drainage are estimated to have higher concentrations, typically between 300 and 400 µg/l. The focus on nutrient reductions from the watershed needs to focus on all of the subwatersheds. Internal Load 44% Bald Eagle Lake Total Phosphorus Load ( Average) Judicial Ditch 1 25% County Ditch 11 8% Atm os phere 6% Upstream Lakes 3% Bald Eagle Direct 14% Figure 3.4. Average (2002 through 2008) total phosphorus budget for Bald Eagle Lake. 3.5 LINKING WATER QUALITY TARGETS AND SOURCES The final step in understanding lake response to nutrient loads is to link the previously described nutrient budgets to lake water quality. This step is accomplished through the use of lake response models previously described in Section The lake response model was applied using default model values and the water and nutrient budgets previously described in this section. Physical lake attributes such as volume, average depth, and surface area were derived from GIS and LakeMaster contour maps. All model inputs are detailed in Appendix G. 3.6 FIT OF THE MODEL Eleven years were modeled for Bald Eagle Lake to evaluate the performance of the lake response model (Figure 3.5). The model performed reasonably well from the 2002 through 2008 time period (typically within 15% of measured values) but under predicted in-lake phosphorus concentrations for the 1998 through 2001 period. There are a few possible explanations for the sudden change in model performance. The most likely explanation is that the 1998 through
37 nutrient budgets were affected by the presence of curly-leaf pondweed. Curly-leaf pondweed control in Bald Eagle Lake started in 2002, and curly-leaf pondweed has been effectively managed since. Curly-leaf pondweed, which senesces in mid-summer, was unaccounted for as a modeled phosphorus source during the 1998 through 2001 time period. The model accounts for annual variability in precipitation, runoff and loading so it is unlikely that these differences can account for the change in model performance. Carp could be a possible explanation for the difference, however, DNR trap net data suggests that the carp and rough fish populations were likely not large enough to have this kind of impact. There is no conclusive evidence to explain the difference in the model periods, however, the changes in curly-leaf pondweed management seems to be the most plausible explanation. Since there is an unexplained phosphorus source during the 1998 through 2001 time period, the 2002 through 2008 time period was used to develop the TMDL. In Lake Total Phosphorus Concentration [ug/l] Bald Eagle Lake Average Model Predicted TP [ug/l] Observed TP [ug/l] Figure 3.5. Model predicted and observed total phosphorus concentrations in Bald Eagle Lake. To set the TMDL, the average of 2002 through 2008 was used. The chlorophyll-a response model performed reasonably well, predicting chlorophyll-a concentrations typically within 20% of the measured values (Figure 3.6). 3-11
38 In Lake Chlorophyll-a Concentration [ug/l] Bald Eagle Lake Average Model Predicted Chla [ug/l] Observed Chla [ug/l] Figure 3.6. Model predicted and observed chlorophyll-a concentrations in Bald Eagle Lake. The Secchi disk transparency response model also performed reasonably well, predicting values typically within 20% of the measured values with nine of the eleven years within 10% of the predicted values (Figure 3.7). In Lake Secchi Depth (m) Bald Eagle Lake Average Model Predicted Secchi (m) Observed Secchi (m) Figure 3.7. Model predicted and observed Secchi disk transparency in Bald Eagle Lake. Each of the previous three figures also includes an average response for Bald Eagle Lake. The average is for the 2002 through 2008 time period and is simply the average of the nutrient and water budgets over that period of time. This average period and associated lake response was used to develop the TMDL allocations described in the next section. 3-12
39 4.0 TMDL Allocation 4.1 TOTAL MAXIMUM DAILY LOAD CALCULATIONS The numerical TMDL for Bald Eagle Lake was calculated as the sum of the Wasteload Allocation, Load Allocation and the Margin of Safety (MOS) expressed as phosphorus mass per unit time. Nutrient loads in this TMDL are set for phosphorus, since this is typically the limiting nutrient for nuisance aquatic algae. However, both the chlorophyll-a and Secchi response were predicted to determine if nutrient reductions would result in meeting all three state standards. This TMDL is written to solve the TMDL equation for a numeric target of 40 g/l of total phosphorus as a summer growing season average Total Loading Capacity The first step in developing an excess nutrient TMDL for lakes is to determine the total nutrient loading capacity for the lake. To determine the total loading capacity, the current nutrient budget and the lake response modeling (average of ) presented in Section 3 were used as the starting point. The nutrient inputs were then systematically reduced until the model predicted that Bald Eagle Lake met the current total phosphorus standard of 40 µg/l as a growing season mean. The reductions were applied first to the internal load and then the watershed sources. Once the total phosphorus goal is met, both the chlorophyll-a and Secchi response models are reviewed to ensure at least one of the two response variables are predicted to meet the state standards as well. Further details of how this was applied are included in the following sections Load Allocations The Load Allocation includes all nonpermitted sources including stormwater runoff not covered by a state or federal permit, atmospheric deposition and internal loading. No changes were expected for atmospheric deposition because this source is impossible to control. Both the upstream lakes were held at current conditions assuming Fish Lake will be restored to meet state eutrophication standards and Pine Tree Lake will be protected under nondegradation. One of the first steps in determining the allowable phosphorus loads to Bald Eagle Lake is setting the appropriate internal load release rate. There are two methods for determining the appropriate allowable internal load including looking at similar reference lakes and determining the achievable release rates based on available technology. Measured release rates in Bald Eagle Lake (anoxic release of 10.1 mg/m 2 /day) were compared to expected release rates for mesotrophic lakes (Figure 4.1; Nurnberg 1997). Mesotrophic lakes demonstrate internal phosphorus release rates ranging from 0 to 12 mg/m 2 /day with a median release rate around 4 mg/m 2 /day. Although the median is 4 mg/m 2 /day, there is a broad range of internal loads in 4-1
40 mesotrophic lakes which makes selecting an appropriate number difficult. Furthermore, 60% of Bald Eagle Lake is littoral and can be expected to release little or no phosphorus when maintained in a healthy state. Anoxic release rates in nearby Oneka Lake, a shallow submerged aquatic vegetation dominated lake, were below detection. The internal load was also assessed using the potential effectiveness of internal load control technologies such as hypolimnetic aeration, hypolimnetic withdrawal, and alum treatment. These control methods have been demonstrated to show an 80 to 90% reduction in internal loading when applied to lakes similar to Baled Eagle Lake. This would result in an expected internal release rate between 1 and 2 mg/m 2 /day. An internal release rate of 1 mg/m 2 /day was determined to be reasonable for Bald Eagle Lake based on the release rates demonstrated in nearby lakes and the expected results from internal load controls. It is also important to note that the selected Canfield-Bachmann lake response model implicitly accounts for some internal loading because the response is predicted from external loads from a lake database that includes lakes with internal loading. Therefore, the assigned internal load in these models is included above and beyond the implicitly included internal load Therefore, the lake can likely demonstrate an internal load greater than what is explicitly identified in the TMDL and still meet state water quality standards. Figure 4.1. Sediment phosphorus release rates by eutrophic condition. (Nürnberg 1997) Wasteload Allocations The Wasteload Allocation includes permitted discharges such as industrial point source and regulated stormwater discharges. Stormwater discharges are regulated under NPDES, and allocations of nutrient reductions are considered wasteloads that must be divided among permit holders. Wasteload allocations were combined in this TMDL into a Categorical Wasteload allocation. Using categorical wasteload allocations was justified for several reasons. First, there is considerable uncertainty regarding current loading based on municipal boundaries, as monitoring data based on municipal boundaries are not available. Additionally, the Rice Creek Watershed District plans to act as the aggregator regarding implementation. The categorical 4-2
41 approach will allow the Watershed District to focus on watershed-based water quality improvement projects that span municipal boundaries. The approach will also allow the Watershed District to utilize its funding sources and grant programs for water quality improvement projects. With the exception of the Minnesota Department of Transportation, MS4 permit representatives attending technical stakeholder meetings (see Section 5.2) were unanimous in support of the categorical approach. Based on their request, Mn/DOT will be provided with an individual Wasteload Allocation. The individual wasteload allocation was calculated by determining the percent of total watershed area maintained as right of way by Mn/DOT (58 acres), then applying that percentage to the watershed load. Although industrial stormwater is included in the Categorical Wasteload Allocation, there are currently no industrial permits in the watershed. There are also no wastewater treatment plants and no NPDES-permitted CAFOs in the watershed. Following are the MS4 permit holders in the Bald Eagle Lake watershed: Lino Lakes MS White Bear Lake MS White Bear Township MS Hugo MS Grant MS Dellwood MS RCWD MS Washington County- MS Anoka County MS Ramsey County MS Mn/DOT Metro District MS Industrial Stormwater Various Construction Stormwater - Various To determine the allowable watershed phosphorus load, the lake response model was updated with the selected allowable internal load as determined in the previous section. Next, current estimated watershed loading in the lake response models was reduced until the models predicted an in-lake phosphorus concentration of 40 µg/l. This method resulted in a required 38% reduction of watershed nutrient loads to Bald Eagle Lake. To put this target in perspective, the average inflow concentration from the Bald Eagle Lake watershed would need to be 177 µg/l total phosphorus. Ecoregion reference streams has an interquartile range (25 th to 75 th ) of 70 to 170 µg/l total phosphorus, suggesting that the target load is an aggressive goal for a watershed impacted by agriculture and urban development Margin of Safety An implicit margin of safety has been included in this TMDL. Following is the rationale for an implicit margin of safety. 1. Modeling was performed for seven years without any adjustment to model coefficients. Because the model performed well without any adjustments over several years, there is a high level of confidence in the model. 4-3
42 2. An extensive database is available and utilized in the development of this TMDL reducing the uncertainty in the estimates of the various components of the phosphorus budget 3. The TMDL will be implemented iteratively using adaptive management to achieve the designated beneficial use. 4. The lake response model predicts that all three variables in the state standard will be met with the designated allocations. The current standard only requires two of the standard variables be met to be considered unimpaired. Due to good model performance over seven years, a strong database for the lake and its watershed, and a long history of assessment, confidence in the allocations is relatively high. Therefore an implicit margin of safety is reasonable for this TMDL Reserve Capacity and Future Development Future loading capacity was not explicitly included in TMDL. The Rice Creek Watershed District, under Minnesota Watershed Law, maintains a set of rules meant to govern land development and re-development. These rules require developers and municipalities to provide water quality treatment for any new impervious surface, and in some cases, for altercations to existing impervious surface. Currently, the RCWD requires the 2.1 inches of rainfall over new impervious surface to be infiltrated or ponded. This is an aggressive set volume control (and by proxy, water quality control) requirement. Additionally, erosion control measures must be taken during construction phase of development and re-development. The RCWD maintains the legal authority to issue stop work orders, and employs two inspectors and a permit coordinator to enforce rules. Because of these aggressive rules, development in the watershed will improve water quality loads from the developed land beyond the requirements of this TMDL. For this reason, the RCWD expects watershed phosphorus loads to diminish as development and redevelopment occurs Summary of TMDL Allocations Tables 4.1 summarizes the TMDL allocations for Bald Eagle Lake. A margin of safety is implicit in the TMDL equation and therefore not presented in the tables. An overall 58% nutrient reduction is required for Bald Eagle Lake to meet state standards. Table 4-1. TMDL total phosphorus daily loads partitioned among the major sources for Bald Eagle Lake assuming the lake standard of 40 g/l. Allocation Source Existing TP Load 1 TP Allocations (WLA & LA) Load Reduction (lbs/year) (lbs/day) 2 (lbs/year) (lbs/day) 2 (lbs/year) Wasteload Watershed Runoff 2, , (38%) Upstream Lakes (<1%) Load Atmosphere Internal Load 1, ,809 (91%) MOS Implicit Implicit -- TOTAL LOAD 4, , ,620 (58%) 1 Existing load is the average for the years Annual loads converted to daily by dividing by days per year accounting for leap years 4-4
43 Table 4.2 summarizes the Wasteload Allocations for Bald Eagle Lake. Per their request, Mn/DOT was assigned an individual Wasteload Allocation. The categorical allocation includes Construction and Industrial Stormwater permits. Table 4-2. Wasteload Allocations for Bald Eagle Lake Permit Type Permit Name Permit Existing TP Number Load (lbs/year) MS4 Stormwater Lino Lakes MS MS4 Stormwater White Bear Lake MS MS4 Stormwater White Bear Twp. MS MS4 Stormwater Hugo MS MS4 Stormwater Grant MS MS4 Stormwater Dellwood MS MS4 Stormwater RCWD MS MS4 Stormwater Washington Co. MS MS4 Stormwater Anoka Co. MS MS4 Stormwater Ramsey Co. MS Industrial Stormwater No current permitted sources n/a WLA (lbs/year) Percent Reduction 2,108 1, Construction Stormwater Various Various MS4 Stormwater Mn/DOT MS LAKE RESPONSE VARIABLES The TMDL presented here is developed to be protective of the aquatic recreation beneficial use in lakes. However there is no loading capacity per se for nuisance algae. Consequently, to understand the impacts of the phosphorus loads to the lake, a water quality response model was used to predict the water quality after load reductions are implemented. Utilization of this approach allows for a better understanding of potential lake conditions under numerous load scenarios. The following sections describe the results from the water quality response modeling. Using the previously described BATHTUB water quality response model, Secchi depth and chlorophyll-a concentrations were predicted for load reductions in 5% increments for the lake response model of the seven-year average. These predicted responses can be used to develop goals for load reductions with an understanding of the overall water quality benefits Total Phosphorus Modeled total phosphorus concentrations expected at various phosphorus loads are presented in Figure 4.2. The lake response model predicts that Bald Eagle Lake would meet the state standard of 40 µg/l total phosphorus as a growing season mean at the TMDL designated load (1,890 pounds/year). 4-5
44 Average Lake Response Modeling for Bald Eagle Lake Total Phosphorus Concentration [ug/l] ,000 4,500 4,000 3,500 3,000 2,500 2,000 Phosphorus Load [pounds] 1,500 1, Figure 4.2 In-lake total phosphorus concentrations predicted for total phosphorus load reductions applied to all sources Chlorophyll-a Modeled chlorophyll-a concentrations expected at various phosphorus loads are presented in Figure 4.3. The lake response model predicts that the chlorophyll-a target of 14 µg/l as a summer growing season mean would be met at the TMDL designated load (1,890 pounds/year). 35 Average Lake Response Modeling for Bald Eagle Lake Chlorophyll a [ug/l] ,000 4,500 4,000 3,500 3,000 2,500 2,000 Phosphorus Load [pounds] 1,500 1, Figure 4.3. In-lake chlorophyll-a concentrations predicted for total phosphorus load reductions applied to all sources Secchi Depth Model-predicted water clarity with incremental load reductions is presented in Figure 4.4. The lake response model predicts that the Secchi depth target of greater than 1.4 meters Secchi depth 4-6
45 as a summer growing season mean would be exceeded at the TMDL designated load (1,890 pounds/year). Average Lake Response Modeling for Bald Eagle Lake Phosphorus Load [pounds] 0 5,000 4,500 4,000 3,500 3,000 2,500 2,000 1,500 1, Secchi Depth [m] Figure 4.4. Secchi depth predicted for total phosphorus load reductions applied to all sources. 4.3 SEASONAL AND ANNUAL VARIATION The daily load reduction targets in this TMDL are calculated from the current phosphorus budget for Bald Eagle Lake. The budget is an average of several years of monitoring data, and includes both wet and dry years. BMPs designed to address excess loads to the lakes will be designed for these average conditions; however, the performance will be protective of all conditions. For example, a stormwater pond designed for average conditions may not perform at design standards for wet years; however the assimilative capacity of the lake will increase due to increased flushing. Additionally, in dry years the watershed load will be naturally down allowing for a larger proportion of the load to come from internal loading. Consequently, averaging across several modeled years addresses annual variability in-lake loading. Seasonal variation is accounted for through the use of annual loads and developing targets for the summer period where the frequency and severity nuisance algal growth will be the greatest. Although the critical period is the summer, lakes are not sensitive to short term changes in water quality, rather lakes respond to long-term changes such as changes in the annual load. Therefore, seasonal variation is accounted for in the annual loads. Additionally, by setting the TMDL to meet targets established for the most critical period (summer), the TMDL will inherently be protective of water quality during all the other seasons. 4-7
46 5.0 Public Participation 5.1 INTRODUCTION TMDL development should be a stakeholder-driven process that develops an understanding of the issues and the processes driving the impairments. To that end, a detailed stakeholder process was employed that included working with a Technical Advisory Committee comprised of local stakeholders. These groups represent the stakeholders ultimately responsible for implementation of the TMDLs who need to be fully engaged in the applied science. It is our goal for this TMDL to result in a science based, implementable TMDL with a full understanding of the scientific tools developed to make informed, science based decisions. 5.2 TECHNICAL ADVISORY COMMITTEE AND STAKEHOLDER MEETINGS A technical advisory committee was established so that interested stakeholders could be involved in key decisions involved in developing the TMDL. Representatives invited to participate in the Technical Advisory process included: City Staff and Engineers County Conservation Districts MN Dept. of Natural Resources MN Center for Environmental Advocacy Bald Eagle Area Association County Park Departments County Public Works MN Board of Water and Soil Resources MN Dept. of Transportation MN Pollution Control Agency Blue Water Science, Inc. Rice Creek Watershed District All meetings were open to interested individuals and organizations. Technical Advisory Committee meetings were held on July 9, 2009 and September 24, Stakeholders interested in greater participation in the process were encouraged to contact the Rice Creek Watershed District. 5.3 PUBLIC MEETINGS Public meetings were held to present information to lakeshore owners and interested individuals. Presentations were used to introduce topics such as lake ecology, pollution sources, and the TMDL process. Findings of the TMDL study, and associated management options were also presented. Meetings were held on January 28, 2009 and March 11,
47 6.0 Implementation 6.1 INTRODUCTION The purpose of the implementation section of the TMDL is to develop an implementation strategy for meeting the load and wasteload allocations set forth in this TMDL. This section is not meant to be a comprehensive implementation plan; rather it is the identification of a strategy that will be further developed in an implementation plan separate from this document. 6.2 REDUCTION STRATEGIES Restoration options for lakes are numerous with varying rates of success. Consequently, each technology must be evaluated in light of our current understanding of physical and biological processes in that lake. Following is a description of potential actions for controlling nutrients in the Bald Eagle Lake watershed that will be further developed in the Bald Eagle Lake Implementation Plan. The estimated cost of implementing these and other potential BMPs ranges from $1,500,000 to $5,000, IMPLEMENTATION FRAMEWORK Watershed and Local Plans Numerous governing units have water quality responsibilities in the watershed, including all MS4 permit holders and the Rice Creek Watershed District. These agencies are focused on protecting water quality through implementation of their watershed and local plans as well as MS4 Stormwater Pollution Prevention Programs (SWPPPs). These plans and permits will outline the activities to be undertaken by each governing unit, including best management practices and capital improvements. A TMDL implementation plan will be developed separate from this TMDL document and the plan can help guide the governing units in the implementation of BMPs focused on achieving the TMDL Adaptive Management The load allocations in the TMDL represent aggressive goals for nutrient reductions. Consequently, implementation will be conducted using adaptive management principles (Figure 6.1). Adaptive management is appropriate because it is difficult to predict the lake response that will occur from implementing strategies with the paucity of information available to demonstrate expected reductions. Future technological advances may alter the course of actions detailed here. Continued monitoring and course corrections responding to monitoring results are the most appropriate strategy for attaining the water quality goals established in this TMDL. 6-1
48 Assess Progress Design Strategy Adaptive Management Evaluate Implement Monitor Figure 6.1. Adaptive management. 6.4 NUTRIENT REDUCTION STRATEGIES Following is a description of potential actions for controlling nutrients in the Bald Eagle Lake watershed that will be further developed in the Implementation Plan External Nutrient Load Reductions This TMDL for Bald Eagle Lake requires a 38% reduction from watershed sources. To meet the required load reduction, various watershed management activities will be implemented on an opportunistic basis, including the following: Amend rules regulating development and redevelopment. The Rice Creek Watershed District recently revised its rules and standards to adopt more stringent stormwater management rules. The rules revision requires new development to incorporate Better Site Design principles into site plans, and to retain on site through infiltration or other volume management the runoff from a 2-year (2.8 inch in 24 hours) rain event. Small events convey the majority of the annual phosphorus and sediment load (Pitt 1998) to downstream receiving waters. Redevelopment is also required to provide volume management. Adoption of this volume management rule limits new phosphorus and sediment loading to the lakes. Maximize load reduction through development and redevelopment. As redevelopment occurs, areas with little or no treatment will be required to meet current water quality standards. It may be possible to upsize water quality treatment BMPs for both development and redevelopment projects to increase treatment efficiency beyond the minimum required by the rules. Protect high-value wetlands to prevent phosphorus export. Numerous high-value wetlands are present in the watershed. As development or redevelopment occurs, there is the potential to discharge to them stormwater and additional nutrients and sediment, altering the hydroperiod and 6-2
49 natural assimilative characteristics and converting the wetlands from nutrient sinks to nutrient sources. The proposed RCWD rules revision includes standards limiting impacts to wetland hydroperiod based on wetland classification as well as requiring pretreatment of discharges to wetlands. Increase infiltration and filtration in the watershed. As described above, the new RCWD rules require Better Site Design minimizing new impervious surface and management of new runoff volumes on new development and redevelopment. On existing development, the use of rain gardens, native plantings, and reforestation should be encouraged as a means to increase infiltration, evapotranspiration, and filtration of runoff conveying pollutant loads to the lakes. Residents will be encouraged to apply to the RCWD s Water Quality Cost-Share program. Target street sweeping. Cities will be asked to identify key areas and target those areas for more frequent street sweeping. Retrofit BMPs. Street or highway reconstruction projects, park improvements, and other projects may provide opportunities to incorporate BMPs to add or increase treatment in the watershed. The RCWD will utilize its Urban Stormwater Remediation Cost-Share program to subsidize projects. Encourage shoreline restoration. Most property owners maintain a turfed edge to the shoreline. Property owners should be encouraged to restore their shoreline with native plants to reduce erosion and capture direct runoff. Shoreline restoration can cost $30-50 per linear foot, depending on the width of the buffer installed. The RCWD will develop some demonstration projects as well as work with all willing landowners to naturalize their shorelines. Residents will be encouraged to apply to the RCWD s Water Quality Cost-Share program. Implement construction and industrial stormwater regulation. Construction stormwater activities are considered in compliance with provisions of the TMDL if they obtain a Construction General Permit under the NPDES program and properly select, install, and maintain all BMPs required under the permit, including any applicable additional BMPs required in Appendix A of the Construction General Permit for discharges to impaired waters, or meet local construction stormwater requirements if they are more restrictive than requirements of the State General Permit. Industrial stormwater activities are also considered in compliance with provisions of the TMDL if they obtain an Industrial Stormwater General Permit or General Sand and Gravel general permit (MNG49) under the NPDES program and properly select, install, and maintain all BMPs required under the permit, or meet local industrial stormwater requirements if they are more restrictive than requirements of the State General Permit. 6-3
50 6.4.2 Internal Nutrient Load Reductions Internal nutrient loads will need to be reduced to meet the TMDL allocations presented in this document. There are numerous options for reducing internal nutrient loads ranging from simple chemical inactivation of sediment phosphorus to complex infrastructure techniques including hypolimnetic aeration. Internal load reduction technical review. Prior to implementation of any strategy to reduce internal loading in Bald Eagle Lake, a technical review needs to be completed to evaluate the cost and feasibility of the lake management techniques available to reduce or eliminate internal loading. Several options could be considered to manage internal sources of nutrients including hypolimnetic withdrawal, alum treatment, vegetation management and hypolimnetic aeration. A technical review will be completed to provide recommendations for controlling internal loading in Bald Eagle Lake. Following is a brief description of some of the techniques that could be considered for controlling internal loading in Bald Eagle Lake. 1. Alum Addition. One of the most common methods for controlling internal nutrient loading in lakes is the addition of aluminum sulfate to permanently bind phosphorus in the sediments. When aluminum sulfate reacts with sediment phosphorus, the aluminum permanently binds phosphorus eliminating anoxic phosphorus release. Although alum can be quite effective and is relatively inexpensive, the floc blanket must remain relatively undisturbed it ensure long term effectiveness. 2. Hypolimnetic Withdrawal. Another option that may be considered is the removal of phosphorus rich water from the bottom, or hypolimnion, of a lake and discharging or treating that water. Hypolimnetic withdrawal can be fairly expensive and often has a long lag period before positive results are realized in the lake. However, hypolimnetic withdrawal does eliminate the need to add chemicals the lake. 3. Hypolimnetic Aeration. Sediment phosphorus release from sediments is primarily controlled by anoxia over the sediments. Consequently, one solution is to aerate the hypolimnion to prevent anoxic conditions from occurring over the sediments. To maintain oxygenated conditions in the hypolimnion, or bottom water, aerators are placed at the bottom of the lake, but are covered so that artificial mixing of the lake does not occur. Hypolimnetic aeration is a relatively costly approach and is dependent of relatively large amount of infrastructure that must be maintained. 4. Other Options. There are also other sources of internal loading to consider. One area that may need to be addressed is the resuspension of sediments in shallow areas of the lake as a result of recreational boating activities. Curlyleaf pondweed and carp can both add to internal loading and should be considered. The presence of invasive species and recreational activities will need to be considered when selecting the appropriate approach for controlling internal nutrient loads. 6-4
51 6.4.3 Studies and Biological Management Plans Following are recommended studies needed to further refine management actions in the Lino Lakes chain of lakes: Vegetation management. Curly-leaf pondweed is present in all lakes, and is at nuisance levels in some. Senescence of the curly-leaf pondweed in summer can be a significant source of internal phosphorus load that often results in a late summer nuisance algal bloom. Vegetation management, such as several successive years of chemical treatment, will be required to keep this exotic invasive species at non-nuisance levels. Conduct periodic aquatic plant surveys and prepare and implement vegetation management plans. As BMPs are implemented and water clarity improves, the aquatic vegetation community will change. Surveys should be updated periodically and vegetation management plans amended to take into account appropriate management activities for that changing community. Manage fish populations. One activity should be to partner with the DNR to monitor and manage the fish population to maintain a beneficial community. As the aquatic vegetation changes to a more desirable mix of species, it may be possible to restore a more balanced fish community that includes both panfish and top predators. Options to reduce rough fish populations should be evaluated, and the possibility of fish barriers explored to reduce rough fish access to spawning areas and to minimize rough fish migration between lakes Education Conduct education and outreach awareness programs. Educate property owners in the subwatershed about proper fertilizer use, low-impact lawn care practices, and other topics to increase awareness of sources of pollutant loadings to the lakes and encourage the adoption of good individual property management practices. Lakeshore property owners should be educated about aquatic vegetation management practices and how they relate to beneficial biological communities and water quality. Because Bald Eagle Lake is a highly used recreational lake, there is a potential for the recreation activities to have an impact on the water quality in the lake. To address these potential impacts, educational materials will be developed for lake users to make them aware of the potential impacts to the lake. The educational materials will also identify sensitive areas of the lake. 6-5
52 7.0 Reasonable Assurance 7.1 INTRODUCTION When establishing a TMDL, reasonable assurances must be provided demonstrating the ability to reach and maintain water quality endpoints. Several factors control reasonable assurance, including a thorough knowledge of the ability to implement BMPs as well as the overall effectiveness of the BMPs. This TMDL establishes aggressive goals for the reduction of phosphorus loads to Bald Eagle Lake. In fact, there are few if any examples where these levels of reductions have been achieved where the sources were primarily nonpoint source in nature. TMDL implementation will be implemented on an iterative basis so that implementation course corrections based on periodic monitoring and reevaluation can adjust the strategy to meet the standard. After the first phase of nutrient reduction efforts, reevaluation will identify those activities that need to be strengthened or other activities that need to be implemented to reach the standards. This type of iterative approach is more cost effective than over engineering to conservatively inflated margins of safety (Walker 2003). Implementation will also address other lake problems not directly linked to phosphorus loading such as invasive plant species (curly-leaf pondweed) and invasive fish (carp and rough fish). These practices go beyond the traditional nutrient controls and provide additional protection for lake water quality. 7.2 RICE CREEK WATERSHED DISTRICT The Rice Creek Watershed District was formed in 1972 under Minnesota Watershed Law. The District is over 200 square miles in size, and contains parts of 29 municipalities and townships in four counties. The District s mission is To conserve and restore the water resources of the District for the beneficial use of current and future generations. The District is also a watershed management organization as defined by the Metropolitan Surface Water Management Act (Chapter 509, Laws of 1982, Minnesota Statute Section to as amended). That law establishes requirements for watershed management plans within the Twin Cities Metropolitan Area. The law requires the plan to focus on preserving and using natural water storage and retention systems to: Improve water quality. Prevent flooding and erosion from surface flows. Promote groundwater recharge. Protect and enhance fish and wildlife habitat and water recreation facilities. Reduce, to the greatest practical extent, the public capital expenditures necessary to control excessive volumes and rate of runoff and to improve water quality. 7-1
53 Secure other benefits associated with proper management of surface water. Minnesota Rules Chapter 8410 requires watershed management plans to address eight management areas and to include specific goals and policies for each to serve as a management framework. To implement its approved watershed management plan, the RCWD has undertaken a number of activities, including administering rules and standards regulating stormwater runoff quantity and quality from development and redevelopment in the district; developing Resource Management Plans for resources in the district; and constructing improvements in the District such as a project to remeander Rice Creek. 7.3 NPDES MS4 STORMWATER PERMITS NPDES Phase II stormwater permits are in place for all of the cities draining to the Bald Eagle Lake watershed as well as the Rice Creek Watershed District, Anoka and Ramsey Counties and Mn/DOT. Under the stormwater program, permit holders are required to develop and implement a Stormwater Pollution Prevention Program (SWPPP; MPCA, 2004). The SWPPP must cover six minimum control measures: Public education and outreach; Public participation/involvement; Illicit discharge, detection and elimination; Construction site runoff control; Post-construction site runoff control; and Pollution prevention/good housekeeping. The permit holder must identify BMPs and measurable goals associated with each minimum control measure. According to federal regulations, NPDES permit requirements must be consistent with the assumptions and requirements of an approved TMDL and associated Wasteload Allocations. See (d)(1)(vii)(B). To meet this regulation, Minnesota s MS4 general permit requires the following: If a USEPA-approved TMDL(s) has been developed, you must review the adequacy of your Storm Water Pollution Prevention Program to meet the TMDL's Waste Load Allocation set for storm water sources. If the Storm Water Pollution Prevention Program is not meeting the applicable requirements, schedules and objectives of the TMDL, you must modify your Storm Water Pollution Prevention Program, as appropriate, within 18 months after the TMDL is approved. MS4s contributing stormwater to the lakes will comply with this requirement during the implementation planning period of the TMDL. The implementation plan will identify specific BMP opportunities sufficient to achieve their load reduction. Individual SWPPPs will be modified as necessary to meet the WLA. BMP opportunities described in the implementation plan can guide MS4s in modifying their SWPPPs. 7-2
54 MS4s contributing stormwater to Bald Eagle Lake are covered under the Phase II General NPDES Stormwater Permit MNR The unique NPDES Phase II permit numbers assigned to the small municipal separate storm sewer systems (MS4) that contribute drainage to the Bald Eagle Lake are as follows: Lino Lakes MS White Bear Lake MS White Bear Township MS Hugo MS Grant MS Dellwood MS RCWD MS Washington County- MS Anoka County MS Ramsey County MS Mn/DOT Metro District MS Industrial Stormwater Various Construction Stormwater - Various Stormwater discharges are regulated under NPDES, and allocations of nutrient reductions are considered wasteloads that must be divided among permit holders.mn/dot was provided with an individual Waterload Allocation, per their request during the technical advisory process. The remaining MS4 permit holders share a Categorical Wasteload Allocation. The Load Allocation is also allocated in the same manner. This collective approach allows for greater reductions for some permit holders with greater opportunity and less for those with greater constraints. The collective approach is to be outlined in an implementation plan developed by the Rice Creek Watershed District. 7.4 BALD EAGLE LAKE IMPROVEMENT DISTRICT In 2008, the Bald Eagle Area Association, after demonstrating nearly unanimous support from lakeshore owners, asked the Rice Creek Watershed District to begin the process of creating a Water Management District around Bald Eagle Lake. A Water Management District established a special tax district around a given waterbody. The Bald Eagle Lake Water Management District (BEL-WMD) was created by the Rice Creek Watershed District in September of The BEL-WMD will provides annual funds to be used on many different water quality improvement and protection projects, including invasive species control, shoreline stabilization, and emergent plant protection. 7-3
55 7.5 MONITORING Monitoring Implementation of Policies and BMPs A key piece in understanding progress toward meeting a TMDL is monitoring implementation activities and the effectiveness of those activities. A semi-annual annual report will be developed that outlines all of the activities completed that relate to the TMDL Follow-up Monitoring The Rice Creek Watershed District maintains a monitoring program that includes flow and water quality monitoring for key subwatersheds. The RCWD currently monitors continuous flow and water quality at the outlet of Judicial Ditch 1, and will continue to do so as the Bald Eagle TMDL is implemented. Whenever possible, stormwater water quality samples will also be collected from the County Ditch 11 and direct watershed outfall locations. This monitoring would be done in conjunction with implementation activities (i.e. effectiveness monitoring ). Currently, in-lake water quality samples, along with measures of physical lake characteristics (temp, DO, etc), are collected by Ramsey County Public Works. Samples are collected from two locations in the lake, and at varying depths, on a bi-monthly basis. Ramsey County plans to continue sampling throughout and after the TMDL implementation process. 7-4
56 8.0 Literature Cited Asplund T. R. and C. M. Cook Effects of motor boats on submerged aquatic macrophytes. Lake and Reservoir Management. 13(1):1-12. Army Corps of Engineers Engineer Research and Development Center Internal Phosphorus Loading and Mobile and Refractory Phosphorus Fractions in Sediments of Bald Eagle, Fish, and Oneka Lakes, Minnesota. Prepared for RCWD. Barr Engineering Detailed Assessment of Phosphorus Sources to Minnesota Watersheds. Prepared for the Minnesota Pollution Control Agency, St. Paul, MN. Nürnberg, G Coping with water quality problems due to hypolimnetic anoxia in central Ontario lakes. Water Quality Research Journal of Canada. 32 (2) pp Nürnberg, G. K "Quantified Hypoxia and Anoxia in Lakes and Reservoirs." The Scientific World Journal 4: Walker, William W Program for Predicting Polluting Particle Passage thru Pits, Puddles, & Ponds. Prepared for USEPA, Minnesota PCA & Wisconsin DNR. Walker, William W Simplified Procedures for Eutrophication Assessment and Prediction: User Manual. USACE Report w Walker, William W Consideration of Variability and Uncertainty in Phosphorus Total Maximum Daily Loads for Lakes. J. Water Resour. Plng. and Mgmt., Volume 129, Issue 4, pp (July/August 2003). 8-1
57 Appendix A Temperature and Dissolved Oxygen
58 2008 Dissolved Oxygen Profiles 2008 Temperature Profiles DO (mg/l) Temp (Celcius) Depth (m) 6 5/13/2008 6/4/2008 6/24/2008 7/15/2008 8/5/2008 8/26/2008 9/16/2008 Depth (m) 6 5/13/2008 6/4/2008 6/24/2008 7/15/2008 8/5/2008 8/26/2008 9/16/ Dissolved Oxygen Profiles 2007 Temperature Profiles DO (mg/l) Temp (Celcius) /17/2007 5/17/2007 6/11/2007 6/11/2007 Depth (m) 6 6/27/2007 7/19/2007 8/2/2007 Depth (m) 6 6/27/2007 7/19/2007 8/2/2007 8/22/2007 8/22/2007 9/17/2007 9/17/ Dissolved Oxygen Profiles 2006 Temperature Profiles DO (mg/l) Temp (Celcius) /8/2006 5/8/2006 Depth (m) 6 6/1/2006 6/21/2006 7/13/2006 8/24/2006 Depth (m) 6 6/1/2006 6/21/2006 7/13/2006 8/24/2006 9/13/2006 9/13/
59 2005 Dissolved Oxygen Profiles 2005 Temperature Profiles DO (mg/l) Temp (Celcius) Depth (m) 6 June July August September October Depth (m) 6 June July August September October Dissolved Oxygen Profiles 2004 Temperature Profiles DO (mg/l) Temp (Celcius) Depth (m) 6 April May June July August September October Depth (m) 6 April May June July August September October Dissolved Oxygen Profiles 2003 Temperature Profiles DO (mg/l) Temperature (Celcius) May May Depth (m) 6 June July August September Depth (m) 6 June July August September
60 2002 Dissolved Oxygen Profiles 2002 Temperature Profiles DO (mg/l) Temp (Celcius) May May Depth (m) 6 June July August Depth (m) 6 June July August September September Dissolved Oxygen Profiles 2001 Temperature Profiles DO (mg/l) Temp (Celcius) Depth (m) 6 May June July August September Depth (m) 6 May June July August September Dissolved Oxygen Profiles 2000 Temperature Profiles DO (mg/l) Temp (Celcius) Depth (m) 6 May June July August September Depth (m) 6 May June July August September
61 1999 Dissolved Oxygen Profiles 1999 Temperature Profiles DO (mg/l) Temp (Celcius) Depth (m) 6 May June July August September Depth (m) 6 May June July August September Dissolved Oxygen Profiles 1998 Temperature Profiles DO (mg/l) Temp (Celcius) Depth (m) 6 May June July August September Depth (m) 6 May June July August September
62 Appendix B Vegetation Surveys
![Zvonimar Mihanovic: At Rest Aquatic Plant Evaluations for Bald Eagle Lake, Ramsey County, 2007 [Early Summer Curlyleaf Stem Densities: April 23, 2007] [Late Summer Survey: August](/docs-images/83/88538048/images/63-0.jpg "17, 2007] Prepared for: Bald Eagle Area Association and Rice Creek Watershed District Prepared by: Steve McComas and Jo Stuckert Blue Water Science (651) 690.")
63 Zvonimar Mihanovic: At Rest Aquatic Plant Evaluations for Bald Eagle Lake, Ramsey County, 2007 [Early Summer Curlyleaf Stem Densities: April 23, 2007] [Late Summer Survey: August 17, 2007] Prepared for: Bald Eagle Area Association and Rice Creek Watershed District Prepared by: Steve McComas and Jo Stuckert Blue Water Science (651) Prepared January 2008
64 Aquatic Plant Evaluations for Bald Eagle Lake, Ramsey County, 2007 Summary Early Summer Aquatic Plant Status Although a quantitative early summer aquatic plant survey was not conducted in 2007 curlyleaf pondweed stem densities were evaluated. The stem density evaluation was conducted on April 23, 2007 and represented pre-herbicide conditions. In June, the entire curlyleaf community had died back from the effects of an herbicide application applied in April. Native plants were just beginning to sprout. Curlyleaf stem density results are shown in Table S-1. Aggressive herbicide treatments have been applied to Bald Eagle Lake to achieve long-term control of curlyleaf pondweed. Herbicides were applied in 2005 (98 ac), 2006 (138 ac), and 2007 (138 ac). The herbicide treatment, using Aquathol K, has reduced the density of curlyleaf pondweed in Bald Eagle Lake in 2007 compared to the pre-project stem densities taken in 2003, prior to the first treatment (Table 1). These data indicate the herbicide treatments appear to be accomplishing one of the primary objectives of reducing the abundance of the invasive curlyleaf pondweed. Curlyleaf stem densities on April 23, 2007 were above nuisance densities (arbitrarily set at stems/m ) at two sites. However, the effects of the herbicide application from April 11 and 14 prevented nuisance growth. The curlyleaf was controlled by the herbicide application. 150 stems/m 2 Table S-1. Curlyleaf pondweed stem density for 2003 and 2007 at six transects around the Bald Eagle Lake. -i-


65 Curlyleaf Pondweed Growth Characteristics Light Growth Conditions Plants rarely reach the surface. Navigation and recreational activities are not generally hindered. Stem density: stems/m 2 Biomass: 0-50 g-dry wt/m 2 Estimated TP loading: <1.7 lbs/ac MnDNR rake sample density equivalent for non-nuisance conditions: 1, 2, or 3. Moderate Growth Conditions Broken surface canopy conditions. Navigation and recreational activities may be hindered. Lake users may opt for control. Stem density: stems/m 2 Biomass: g-dry wt/m 2 Estimated TP loading: lbs/ac MnDNR rake sample density equivalent for light nuisance conditions: 3 or 4. Heavy Growth Conditions Solid or near solid surface canopy conditions. Navigation and recreational activities are severely limited. Control is necessary for navigation and/or recreation. Stem density: 400+ stems/m 2 Biomass: >300 g-dry wt/m 2 Estimated TP loading: >6.7 lbs/ac MnDNR rake sample density has a scale from 1 to 4. For heavy nuisance conditions where plants top out at the surface, the scale has been extended: 4.5 is equivalent to a near solid surface canopy and a 5 is equivalent to a solid surface canopy. -ii-
66 Late Summer Aquatic Plant Status Results from the aquatic plant survey conducted on August 17, 2007 found plant coverage extended to a depth of 7 feet. The native plant coverage after the curlyleaf pondweed die back in Bald Eagle Lake is approximately 30% of the bottom or about 300 acres. This has remained the same for the last few surveys. In 2007, the hybrid milfoil was identified at 22 out of the 72 stations (31%). The hybrid milfoil species had attributes of Eurasian watermilfoil in the lower portion of the stem in terms of up to 15 leaflet pairs on a bract. In the upper part of the stem, there were leaflet pairs. Fourteen species of submerged aquatic plants were identified. The most common plant in Bald Eagle Lake was water celery. Coontail was the next most common plant found. -iii-
67 Comparing Late Summer Survey Results from Several minor positive changes in the aquatic plant community have been observed from 1997 through 2007 (Table S-2). Several species have increased in coverage and include chara, milfoil, and coontail. Two milfoil species are present, including an Eurasian watermilfoil hybrid. This hybrid grew to the surface in areas along the western shoreline in 2004, but did not appear as a nuisance in 2005, 2006, or Table S-2. Comparison of percent occurrence of plants for the late summer plant surveys from 1997 through 2007 out to a depth of 7 feet. A curlyleaf pondweed control program has consisted of mechanical harvesting from (yellow shading) and herbicide applications in (pink shading). Bulrush (Scirpus sp) Cattails (Tyhpa sp) Duckweed (Lemna sp) Spatterdock (Nuphar variegatum) W ater waterlily (Nymphaea sp) W atermeal (Wolffia columbiana) Coontail (Ceratophyllum demersum) Chara (Chara sp) Elodea (Elodea canadensis) Star duckweed (Lemna trisulca) Northern watermilfoil (Myriophyllum sibiricum) W atermilfoil hybrid (Myriophyllum sp) Eurasian watermilfoil (M. spicatum) Naiads (Najas sp) Nitella (Nitella sp) Cabbage (Potamogeton. amplifolius) Curlyleaf pondweed (P. crispus) Illinois pondweed (P. illinoensis) Floatingleaf pondweed (P. natans) W hitestem pondweed (P. praelongus) Claspingleaf pondweed (P. richardsonii) Robbins pondweed (P. robbinsii) Stringy pondweed (P. sp) Flatstem pondweed (P. zosteriformis) Sago pondweed (Stuckenia pectinata) W ater celery (Vallisneria americana) W ater stargrass (Zosterella dubia) 1997 (72 stat on 36 trans) 1998 (72 stat on 36 trans) 1999 (72 stat on 36 trans) 2000 (72 stat on 36 trans) 2001 (72 stat on 36 trans Percent Occurrence 2002 (72 stat on 36 trans 2003 (72 stat on 36 trans) 2004 (72 stat on 36 trans) 2005 (72 stat on 36 trans) 2006 (72 stat on 36 trans) 2007 (72 stat on 36 trans) P P 6 3 P P P P P P P P P P P Number of submerged species iv-
68 Aquatic Plant Evaluations for Bald Eagle Lake for 2007 Introduction Curlyleaf pondweed stem densities were evaluated on April 23, 2007 in Bald Eagle Lake as part of the curlyleaf management program. Later in the summer a full aquatic plant survey was conducted on August 17, The objective of the aquatic plant survey was to evaluate the distribution of curlyleaf pondweed and Eurasian watermilfoil as well as the native plant species in Bald Eagle Lake. Methods Several techniques were used to conduct the aquatic plant surveys in Bald Eagle Lake, a 1,269 acre, eutrophic lake located in Ramsey County. Curlyleaf pondweed stem density was evaluated at five sampling locations on April 23, Sampling locations were at Transects 11, 17, 19, 25, and 31. At each of the five sites, ten stem density samples were randomly collected along a 50 meter transect line that ran parallel to shore in 4 to 7 feet of 2 water. Stem densities were determined using a 0.10 meter quadrat. The quadrat, which is a square frame measuring 33 cm x 33 cm is placed on the sediments and all stems within the square frame are counted. For the full survey on August 17, 2007, we used 36 line transects (Figure 1) and a recording sonar (Lowrance X-16) to delineate the depths of plant colonization. Two depths (0-3 feet and 4-7 feet) on a transect were sampled with a rake to characterize plant species presence and density. A total of 72 stations were checked. Figure 1. Transect map for the aquatic plant surveys conducted on Bald Eagle Lake in Bald Eagle Lake,

69 Methods - continued Aquatic plant density was estimated based on a scale from 1-5 with 1 being the less dense and 5 representing plants matting at the surface. Plant density ratings were based on the amount of plants collected on a rake head. A single stem or a trace of an identifiable plant was rated at a density of 1". If plants were collected up to at least one half of the rake head (7 out of 14 tines) it was rated at a density of 2". If plants covered all of the rake tines, the density was a 3". If plants covered all 14 tines and was dense on all tines (even obscuring them) the density was a 4". A density of 5" was only assigned to plants matting at the surface. Examples of plant density ratings are shown in Figure 2. Two to four rake samples were collected at each depth interval. A density for each plant species was determined for each rake sample and the species density was averaged based on the number of rake samples for a depth interval. For plant surveys of this type, depth intervals are determined based on the maximum depth of plants found in the lake. Two depth intervals are used if plant growth is 10 feet or less and three depth intervals are used if plant growth is 12 feet or greater. Aquatic plants colonized out to 7 feet in Bald Eagle Lake, so two depth zones were used and they were: 0-3 feet and 4-7 feet. Figure 2. Aquatic plant density was estimated based on the amount of plants collected on a rakehead. In the example above, chara has an assigned density of a 3" and water celery has a density of a 2". Bald Eagle Lake,
, 2006 (138 ac), and 2007 (138 ac).")
70 Results of the April 2007 Aquatic Plant Stem Density Evaluation Aggressive herbicide treatments have been applied to Bald Eagle Lake to achieve longterm control of curlyleaf pondweed. Herbicides were applied in 2005 (98 ac), 2006 (138 ac), and 2007 (138 ac). The herbicide treatment, using Aquathol K, has reduced the density of curlyleaf pondweed in Bald Eagle Lake in 2007 compared to the pre-project stem densities taken in 2003, prior to the first treatment (Table 1). These data indicate the herbicide treatments appear to be accomplishing one of the primary objectives of reducing the abundance of the invasive curlyleaf pondweed. Curlyleaf stem densities on April 23, 2007 were above nuisance densities (arbitrarily set 2 at 150 stems/m ) at two sites. However, the effects of the herbicide application from April 11 and 14 prevented nuisance growth. The curlyleaf was controlled by the herbicide application. Table 1. Summary of curlyleaf pondweed stem densities for 2003 and Pre-Project (June 8) 2007 On-Going Project (April 23) * estimated 2 Stem Density (#/m ) T11 T17 T19 T25 T31 2 (5 ft) 0* (5 ft) 590 (6-7 ft) 306 (6 ft) 0 (5 ft) 0* (5 ft) 685 (6-7 ft) 37 (6 ft) 4 (4-5 ft) (6 ft) 150 stems/m 2 Figure 3. Stem density results for Bald Eagle Lake in 2003 (red) and 2007 (yellow). Bald Eagle Lake,
71 Table 2. Representative curlyleaf pondweed stem densities prior to herbicide applications. Bald Eagle Lake curlyleaf stem counts for June 8, 2003 for four sites (locations are shown in Figure 1). Plant data collected by Steve McComas and Jo Stuckert, Blue Water Science. JUNE 8, 2003 Site T11 T17 T19 T25 Quadrat 2 Stem/m 2 Stem/m 2 Stem/m 2 Stem/m 5 ft 6-7 ft 5 ft 6-7 ft , , Average Curlyleaf Stem Density (stems/m ) Table 3. Bald Eagle Lake curlyleaf stem counts for April 23, 2007 for three sites (locations are shown in Figure 1). Plant data collected by Steve McComas and Jo Stuckert, Blue Water Science. APRIL 23, 2007 SD= 6.5 ft Site T17 T25 T31 Quadrat 2 Stem/m 2 Stem/m 2 Stem/m 6 ft 6 ft 4-5 ft 6 ft Average Curlyleaf Stem Density (stems/m ) Bald Eagle Lake,


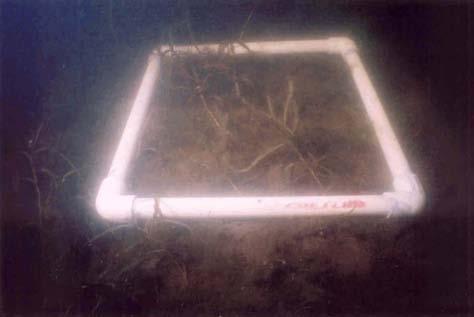
72 Transect 17: April 24, 2007 Transect 17: April 24, 2007 Transect 25: April 24, 2007 Transect 25: April 24, 2007 Transect 31: April 24, 2007 Transect 31: April 24, 2007 Figure 4. Underwater curlyleaf pondweed conditions in Bald Eagle Lake at three transect locations on April 24, Bald Eagle Lake,
73 Comparison of Early Season Plant Surveys for Bald Eagle Lake Two early season plant surveys have been conducted in Bald Eagle Lake in 1998 and in Results are shown in Table 4. The early summer aquatic plant community was similar in 1998 and An early summer survey is recommended in the near future to evaluate aquatic plant changes from Table 4. Bald Eagle Lake aquatic plant occurrences and densities for the 1998 survey based on 96 stations and for the 2003 survey based on 108 stations. Density ratings are 1-5 with 1 being low and 5 being most dense. Water lily/spatterdock (Nymphaea sp/nuphar variegatum) Chara (Chara sp) Coontail (Ceratophyllum demersum) Star duckweed (Lemna trisulca) Northern watermilfoil (Myriophyllum sibiricum) Watermilfoil (Myriophyllum sp) Curlyleaf pondweed (Potamogeton crispus) Illinois pondweed (P. Illinoensis) Flatstem pondweed (Potamogeton zosteriformis) Broadleaf pondweed (P. sp Stringy pondweed (P. sp Sago pondweed (Potamogeton pectinatus) Water celery (Vallisneria americana) Water stargrass (Zosterella dubia) Number of Aquatic Plant Species Early Summer Surveys 1998 (n=96) 2003 (n=108) Bald Eagle Lake,

74 Results of the August 2007 Aquatic Plant Survey Results from the aquatic plant survey on August 17, 2007 found plant coverage extended to a depth of 7 feet (Figure 5). The native plant coverage after the curlyleaf pondweed die back in Bald Eagle Lake is approximately 30% of the bottom or about 300 acres. This has remained the same for the last few surveys. Northern watermilfoil was found at 12 out of the 72 stations and the hybrid milfoil was found at 22 out of 72 stations. The hybrid milfoil species has attributes of Eurasian watermilfoil in the lower portion of the stem in terms of up to 15 leaflet pairs on a bract. In the upper part of the stem, there were leaflet pairs. Fourteen species of submerged aquatic plants were identified. The most common plant in Bald Eagle Lake was water celery. Coontail and milfoil were the next most common plants found (Table 5). Figure 5. Submerged aquatic plant coverage for Bald Eagle Lake on August 17, Plants grow out to about 7 feet of water depth. Bald Eagle Lake,
75 Table 3. Bald Eagle Lake aquatic plant occurrences and densities for the August 17, 2007 survey based on 36 transects and 2 depths, for a total of 72 stations. Density ratings are 1-5 with 1 being low and 5 being most dense. Duckweed (Lemna sp) Spatterdock (Nuphar variegatum) Water lily (Nymphaea sp) Watermeal (Wolffia columbiana) Coontail (Ceratophyllum demersum) Chara (Chara sp) Star duckweed (Lemna trisulca) Northern watermilfoil (Myriophyllum sibiricum) Watermilfoil (Myriophyllum spp) Eurasian watermilfoil (Myriophyllum spicatum) Naiads (Najas flexilis) Nitella (Nitella spp.) Cabbage (Potamogeton amplifolius) Illinois pondweed (P. Illinoensis) Claspingleaf pondweed (P. Richardsonii) Sago pondweed (Stuckenia pectinata) Water celery (Vallisneria americana) Water stargrass (Zosterella dubia) Filamentous algae Depth 0-3 feet (n=36) Depth 4-7 feet (n=36) All Stations (n=72) Occur % Occur Density Occur % Occur Density Occur % Occur Density Bald Eagle Lake,
76 Table 6. Aquatic plant occurrence and density for individual transects in Bald Eagle Lake, August 17, T1 T2 T3 T4 T5 T6 T7 T8 T9 T10 Depth (ft) Duckweed Spatterdock Water lily Watermeal Coontail Chara Star duckweed Northern watermilfoil Watermilfoil Eurasian watermilfoil 0.5 Naiads Nitella Cabbage Illinois pondweed Claspingleaf pondweed Sago pondweed Water celery Water stargrass Filamentous algae 1 T11 T12 T13 T14 T15 T16 T17 T18 T19 T20 Depth (ft) Duckweed 0.5 Spatterdock Water lily Watermeal Coontail Chara Star duckweed Northern watermilfoil Watermilfoil Eurasian watermilfoil Naiads Nitella Cabbage 3 Illinois pondweed Claspingleaf pondweed Sago pondweed 1 Water celery Water stargrass 2 Filamentous algae 1 1 Bald Eagle Lake,
77 Table 6. Concluded. T21 T22 T23 T24 T25 T26 T27 T28 T29 T30 Depth (ft) Duckweed Spatterdock 1 Water lily Watermeal Coontail Chara Star duckweed Northern watermilfoil Watermilfoil Eurasian watermilfoil Naiads 1 1 Nitella 0.5 Cabbage Illinois pondweed 1 1 Claspingleaf pondweed 1 Sago pondweed Water celery Water stargrass Filamentous algae T31 T32 T33 T34 T35 T36 Depth (ft) Duckweed Spatterdock Water lily Watermeal Coontail Chara 2 3 Star duckweed Northern watermilfoil Watermilfoil Eurasian watermilfoil Naiads Nitella Cabbage Illinois pondweed Claspingleaf pondweed Sago pondweed 0.5 Water celery Water stargrass 1 Filamentous algae Bald Eagle Lake,
78 Comparing Late Summer Survey Results from Several minor positive changes in the aquatic plant community have been observed from 1997 through 2007 (Table 7). Several species have increased in coverage and include chara, milfoil, and coontail. Two milfoil species are present, including an Eurasian watermilfoil hybrid. This hybrid grew to the surface in areas along the western shoreline in 2004, but did not appear as a nuisance in Table 7. Comparison of percent occurrence of plants for the late summer plant surveys from 1997 through 2007 out to a depth of 7 feet. A curlyleaf pondweed control program has consisted of mechanical harvesting from (yellow shading) and herbicide applications in (pink shading). Bulrush (Scirpus sp) Cattails (Tyhpa sp) Duckweed (Lemna sp) Spatterdock (Nuphar variegatum) W ater waterlily (Nymphaea sp) W atermeal (Wolffia columbiana) Coontail (Ceratophyllum demersum) Chara (Chara sp) Elodea (Elodea canadensis) Star duckweed (Lemna trisulca) Northern watermilfoil (Myriophyllum sibiricum) W atermilfoil hybrid (Myriophyllum sp) Eurasian watermilfoil (M. spicatum) Naiads (Najas sp) Nitella (Nitella sp) Cabbage (Potamogeton. amplifolius) Curlyleaf pondweed (P. crispus) Illinois pondweed (P. illinoensis) Floatingleaf pondweed (P. natans) W hitestem pondweed (P. praelongus) Claspingleaf pondweed (P. richardsonii) Robbins pondweed (P. robbinsii) Stringy pondweed (P. sp) Flatstem pondweed (P. zosteriformis) Sago pondweed (Stuckenia pectinata) W ater celery (Vallisneria americana) W ater stargrass (Zosterella dubia) 1997 (72 stat on 36 trans) 1998 (72 stat on 36 trans) 1999 (72 stat on 36 trans) 2000 (72 stat on 36 trans) 2001 (72 stat on 36 trans Percent Occurrence 2002 (72 stat on 36 trans 2003 (72 stat on 36 trans) 2004 (72 stat on 36 trans) 2005 (72 stat on 36 trans) 2006 (72 stat on 36 trans) 2007 (72 stat on 36 trans) P P P P Number of submerged species Bald Eagle Lake,
79 The average number of submerged plant species per transect may have increased slightly since the 1997 plant survey from 3.25 species per transect in 1997 to 4.06 species per transect in 2007 (Table 8). Maybe the curlyleaf control program which started in 2000 has created openings allowing an increase in native plant distribution. Table 8. Number of plant species per transect based on surveys conducted by Blue Water Science from Transect Range of species Average Number per Transect Number of Submerged Plant Species Bald Eagle Lake,


80 Curlyleaf Pondweed Status: Curlyleaf pondweed is a non-native plant that grows to nuisance conditions in early summer in Bald Eagle Lake. It is the dominant plant in early summer covering about 29% of the lake representing about 293 acres based on survey data from 1998 and It grows out to 12 feet of water depth but grows to the surface in water depths out to 8 feet. It s distribution had stabilized around 300 acres of lake bottom coverage with approximately 180 acres of nuisance growth that reached the surface in Since the curlyleaf control program began in 2000, nuisance levels of curlyleaf pondweed have been estimated to decline to around 160 acres prior to treatment measures. The Bald Eagle Area Association has sponsored a curlyleaf management program from emphasizing mechanical harvesting from and herbicide applications in A summary of the program from is found in Table 9. Figure 6. [top] Transect 16 still exhibited nuisance curlyleaf growth in 2002 after two years of harvesting. [bottom] Transect 15, at the north end of the lake, had moderate growth in 2004 after five years of harvesting. In the past this area had thick plant growth. Bald Eagle Lake,
81 Curlyleaf Management Summary for : Mechanical harvesting has been employed on Bald Eagle Lake from , with the first five years of harvesting representing the primary curlyleaf control option. In the sixth year, 2005, herbicide treatments were the primary control option and harvesting was done on an as-needed basis. In 2006 and 2007, only herbicides were used. Curlyleaf management results are shown in Table 9. Table 9. Annual summary of harvesting and herbicide results from 2000 through 2007 for Bald Eagle Lake Totals Start date Apr 27 May 14 May 17 May 2 May 10 Jun 5 Apr 28 Apr 27 Apr 11, End date Jun 17 Jun 21 Jun 20 Jun 13 Jun 2 Jun Harvesting season 52 days 37 days 35 days 43 days 24 days 6 days Harvesting Days Harvester loads of plant removed Area harvested (acres) or Treated (acres) Pounds of curlyleaf removed from lake (lbs-wet wt) Pounds of phosphorus removed from lake (lbs) Cubic yards of plants removed (cu yds) Actual hours of harvesting plants on the lake (hrs) , harvested 98 harvested 124 harvested 162 harvested 155 harvested 30 (est) harvested 98 treated 138 treated 138 treated 420, , , , ,840 54, ,171, , ,261 1, , Total hours billed (hrs) Harvesting efficiency 28% 47% 77% 70% 51% 60% Costs $43,387 $33,800 $35,492 $45,309 $37,128 $8,000 $30,000 $28,000 $28,000 $289,116 Cost per acre $571 $345 $286 $280 $258 $267 $306 $286 $ Hours per harvested acre (hrs/ac) Bald Eagle Lake,

82 Eurasian Watermilfoil Status: Eurasian watermilfoil was first discovered in Bald Eagle Lake in 1989 and its distribution may have peaked in It was not detected in 1996 but was detected in a June 30, 1997 survey conducted by Ramsey County. A milfoil species with northern milfoil and Eurasian watermilfoil characteristics has been found in the lake since 1999 and was verified as a true milfoil hybrid in 2004 (pers. comm. MnDNR). From 1999 through 2007 milfoil plants with characteristics of Eurasian watermilfoil were found and have been characterized as either an unidentified milfoil species or a milfoil hybrid. Maps of milfoil distribution in Bald Eagle Lake are shown in Figures 7 and 8. Curlyleaf pondweed has been the primary plant managed in Bald Eagle Lake, but on occasion the milfoil hybrid has grown to the surface. In mid summer of 2004, about 2 acres of the milfoil hybrid were harvested with a mechanical harvester on the west side of the lake (Transect 29 area). There was no Association-sponsored milfoil treatment in 2005, 2006, or Figure 7. Typical form of the Bald Eagle Lake milfoil in September Milfoil typically grew in shallow water in bunches out to about 4 feet of water depth. The same type of milfoil was found in Bald Eagle Lake,
83 Figure 8. Eurasian watermilfoil distribution in Bald Eagle Lake from is shown with black shading. For northern milfoil shown with a G, and milfoil species with Eurasian watermilfoil characteristics shown with a M. Sources: MnDNR surveys in 1989, 1991, 1993, 1994; Midwest Aquacare in 1990; Ramsey County, 1997; and Blue Water Science, Eurasian watermilfoil was not identified in Bald Eagle Lake in 1992, 1995, 1996, and Bald Eagle Lake,


84 Figure 8. Concluded. Bald Eagle Lake,

85 Bald Eagle Water Quality Summary from Bald Eagle is a eutrophic lake based on phosphorus, clarity, and chlorophyll criteria. Seasonal average clarity measurements from 1957 through 2007 are shown in Figure 9. There was a water clarity improvement trend from 1981 through 1993 and then a water clarity decline from 1993 through Water clarity started to improve in 2002 and has continued through 2007 (using 2001 as a starting point). Maybe the curlyleaf control program has had an influence in improving water clarity in the last few years. A summary of water quality data for Secchi disc, chlorophyll a, and phosphorus is shown in Table 10. Figure 9. Water clarity seasonal averages. Bald Eagle Lake,
 Total Nitrogen (TKN) n ug/l SD n ug/l SD n ug/l SD n ug/l SD n 1957 0.53 1.7 0.88 1 100 114 1 1971 2370 390 2 1972 1.1 3.")
86 Table 10. Summary of yearly means of STORET ( ) and Ramsey County data (1998-present for May - September) for the given water quality parameters for Bald Eagle Lake. SD = stand deviation. Year Secchi Depth Chlorophyll a Total Phosphorus Dissolved Ortho-P m ft SD (m) Total Nitrogen (TKN) n ug/l SD n ug/l SD n ug/l SD n ug/l SD n Figure 9. The dominant algae in Bald Eagle Lake in August are blue-green algae. The algae shown above are from Bald Eagle Lake on August 12, 2004 and are magnified 600 times. Bald Eagle Lake,
87 APPENDIX Appendix A. Transect Map and Location Description Appendix B. Data from Previous Aquatic Plant Surveys
88 Appendix A. Transect Map and Location Description Transect markers. Transect Number GPS Coordinates East North Public access. Marker 2 Fish house next to a cement seating area Point Small brown cabin with tan brick on the lower half On the point south of the bar Sorenson s bay Left of the yellow house Blue house in the cove Yard with a cyclone fence on the shoreline Boat marina/landing area Last home before the outlet. 13/ Into cattail beds. 14 Head toward outlet. 15 To the left of Bobbers Right of a large 3-story house with a large wood retaining wall Left of the marina Gray shed Right of the bulrush beds Left of the bulrush beds, by a gazebo Left of a big boulder wall House with a rock wall below a wood retaining wall with a flag pole Came in on a point To the left of a cyclone fence To the right of the harvester landing On the side of the island On the side of the island Brick house to the left of a 3-story house In between 3 shoreline structures Left of a summer gazebo built on a keystone wall Left of a landing off the street Left of a yellow road sign Seating area on shore with a gray house in back. Boulder with rock riprap Left of a rock pile coming in on a jumble of big rocks In between two wood retaining walls that are off the shore a bit Last house before the park. A - 1
89 Appendix B. Data from Previous Aquatic Plant Surveys 2006: Bald Eagle Lake aquatic plant occurrences and densities for the September 4, 2006 survey based on 36 transects and 2 depths, for a total of 72 stations. Density ratings are 1-5 with 1 being low and 5 being most dense. Star duckweed (Lemna trisulca) Spatterdock (Nuphar variegatum) Water lily (Nymphaea sp) Watermeal (Wolffia columbiana) Coontail (Ceratophyllum demersum) Chara (Chara sp) Northern watermilfoil (Myriophyllum sibiricum) Watermilfoil (Myriophyllum spp) Cabbage (Potamogeton amplifolius) Curlyleaf pondweed (P. crispus) Illinois pondweed (P. Illinoensis) Floatingleaf pondweed (P. natans) Whitestem pondweed (P. praelongus) Claspingleaf pondweed (P. Richardsonii) Sago pondweed (Stuckenia pectinata) Water celery (Vallisneria americana) Water stargrass (Zosterella dubia) Filamentous algae Depth 0-3 feet (n=36) Depth 4-7 feet (n=36) All Stations (n=72) Occur % Occur Density Occur % Occur Density Occur % Occur Density B - 1
90 2005: Bald Eagle Lake aquatic plant occurrences and densities for the September 5, 2005 survey based on 36 transects and 2 depths, for a total of 72 stations. Density ratings are 1-5 with 1 being low and 5 being most dense. Star duckweed (Lemna trisulca) Duckweed (Lemna sp) Spatterdock (Nuphar variegatum) W ater lily (Nymphaea sp) Coontail (Ceratophyllum demersum) Chara (Chara sp) Northern watermilfoil (Myriophyllum sibiricum) W atermilfoil (Myriophyllum spp) Curlyleaf pondweed (Potamogeton crispus) Illinois pondweed (P. Illinoensis) Whitestem pondweed (P. praelongus) Water celery (Vallisneria americana) Water stargrass (Zosterella dubia) Filamentous algae Depth 0-3 feet (n=36) Occur % Occur Depth 4-7 feet (n=36) Density Occur % Occur All Stations (n=72) Density Occur % Occur Density B - 2
91 2004: Bald Eagle Lake aquatic plant occurrences and densities for the August 12, 2004 survey based on 36 transects and 2 depths, for a total of 72 stations. Density ratings are 1-5 with 1 being low and 5 being most dense. Bulrush - hardstem (Scirpus acutus) Star duckweed (Lemna trisulca) Duckweed (Lemna sp) Spatterdock (Nuphar variegatum) Water lily (Nymphaea sp) Coontail (Ceratophyllum demersum) Chara (Chara sp) Elodea (Elodea canadensis) Northern watermilfoil (Myriophyllum sibiricum) Watermilfoil (Myriophyllum spp) Naiads (Najas sp) Nitella (Nitella sp) Curlyleaf pondweed (Potamogeton crispus) Illinois pondweed (P. illinoensis) Claspingleaf pondweed (P. richardsonii) Flatstem pondweed (P. zosteriformis) Water celery (Vallisneria americana) Water stargrass (Zosterella dubia) Filamentous algae Depth 0-3 feet (n=36) Depth 4-7 feet (n=36) All Stations (n=72) Occur % Density Occur % Density Occur % Density Occur Occur Occur B - 3
92 2003: Bald Eagle Lake aquatic plant occurrences and densities for the May 2003 survey based on 36 transects and 2 depths, for a total of 72 stations. Density ratings are 1-5 with 1 being low and 5 being most dense. Bulrush (Scirpus sp) Star duckweed (Lemna trisulca) Water lily ( sp) Coontail (Ceratophyllum demersum) Chara (Chara sp) Northern watermilfoil (Myriophyllum sibiricum) Watermilfoil (Myriophyllum spp) Curlyleaf pondweed (Potamogeton crispus) Illinois pondweed (Potamogeton illinoensis) Flatstem pondweed (P. zosteriformis) Sago pondweed (Stuckenia pectinata) Water stargrass (Zosterella dubia) Filamentous algae Depth 0-3 feet (n=36) Occur % Occur Depth 4-7 feet (n=36) Density Occur % Occur Depth 8-11 feet (n=36) Density Occur % Occur All Stations (n=108) Density Occur % Occur Density B - 4
93 2003: Bald Eagle Lake aquatic plant occurrences and densities for the September 17, 2003 survey based on 36 transects and 2 depths, for a total of 72 stations. Density ratings are 1-5 with 1 being low and 5 being most dense. Bulrush (Scirpus sp) Star duckweed (Lemna trisulca) Duckweed (Lemna sp) Spatterdock (Nuphar variegatum) Water lily (Nymphaea sp) Coontail (Ceratophyllum demersum) Chara (Chara sp) Northern watermilfoil (Myriophyllum sibiricum) Watermilfoil (Myriophyllum spp) Naiads (Najas sp) Cabbage (Potamogeton amplifolius) Curlyleaf pondweed (P. crispus) Illinois pondweed (P. illinoensis) Claspingleaf pondweed (P. richardsonii) Flatstem pondweed (P. zosteriformis) Stringy pondweed (P. sp) Sago pondweed (Stuckenia pectinata) Water celery (Vallisneria americana) Water stargrass (Zosterella dubia) Filamentous algae Depth 0-3 feet (n=36) Occur % Occur Depth 4-7 feet (n=36) Density Occur % Occur All Stations (n=72) Density Occur % Occur Density B - 5
94 2002: Bald Eagle Lake aquatic plant occurrences and densities for the September 9, 2002 survey based on 36 transects and 2 depths, for a total of 72 stations. Density ratings are 1-5 with 1 being low and 5 being most dense. Bulrush (Scirpus sp) Cattails (Typha sp) Star duckweed (Lemna trisulca) Duckweed (Lemna sp) Spatterdock (Nuphar variegatum) Water lily (Nymphaea sp) Cabbage (Potamogeton amplifolius) Chara (Chara sp) Claspingleaf pondweed (Potamogeton richardsonii) Coontail (Ceratophyllum demersum) Curlyleaf pondweed (P. crispus) Eurasian watermilfoil (Myriophyllum spicatum) Flatstem pondweed (Potamogeton zosteriformis) Illinois pondweed (Potamogeton illinoensis) Naiads (Najas sp) Northern watermilfoil (Myriophyllum sibiricum) Watermilfoil (Myriophyllum spp) Sago pondweed (Potamogeton pectinatus) Water celery (Vallisneria americana) Water stargrass (Zosterella dubia) Filamentous algae Depth 0-3 feet (n=36) Occur % Occur Depth 4-7 feet (n=36) Density Occur % Occur All Stations (n=72) Density Occur % Occur Density B - 6
95 2001: Bald Eagle Lake aquatic plant occurrences and densities for the September 2, 2001 survey based on 36 transects and 2 depths, for a total of 72 stations. Density ratings are 1-5 with 1 being low and 5 being most dense. Purple loosestrife (Lythrum salicaria) Cattails (Typha sp) Star duckweed (Lemna trisulca) Spatterdock (Nuphar variegatum) Water lily (Nymphaea sp) Chara (Chara sp) Claspingleaf pondweed (Potamogeton richardsonii) Coontail (Ceratophyllum demersum) Curlyleaf pondweed (P. crispus) Elodea (Elodea canadensis) Flatstem pondweed (Potamogeton zosteriformis) Illinois pondweed (Potamogeton illinoensis) Naiads (Najas sp) Northern watermilfoil (Myriophyllum sibiricum) Watermilfoil (Myriophyllum spp) Sago pondweed (Potamogeton pectinatus) Water celery (Vallisneria americana) Water stargrass (Zosterella dubia) Filamentous algae Depth 0-3 feet (n=36) Occur % Occur Depth 4-7 feet (n=36) Density Occur % Occur All Stations (n=72) Density Occur % Occur Density B - 7
96 2000: Bald Eagle Lake aquatic plant occurrences and densities for the September 23, 2000 survey based on 36 transects and 2 depths, for a total of 72 stations. Density ratings are 1-5 with 1 being low and 5 being most dense. Bulrush (Scirpus sp) Cattails (Typha sp) Duckweed (Lemna sp) Star duckweed (Lemna trisulca) Spatterdock (Nuphar variegatum) Water lily (Nymphaea sp) Chara (Chara sp) Claspingleaf pondweed (Potamogeton richardsonii) Coontail (Ceratophyllum demersum) Illinois pondweed (Potamogeton illinoensis) Northern watermilfoil (Myriophyllum sibiricum) Watermilfoil (Myriophyllum spp) Sago pondweed (Potamogeton pectinatus) Stringy pondweed (Potamogeton spp) Water celery (Vallisneria americana) Water stargrass (Zosterella dubia) Depth 0-3 feet (n=36) Depth 4-7 feet (n=36) Occur % Occur Density Occur % Occur All Stations (n=72) Density Occur % Occur Density B - 8
97 1999: Bald Eagle Lake aquatic plant occurrences and densities for the September 13 & 14, 1999 survey based on 36 transects and 3 depths, for a total of 108 stations. Density ratings are 1-5 with 1 being low and 5 being most dense. Bulrush (Scirpus sp) Cattails (Typha sp) Duckweed (Lemna sp) Star duckweed (Lemna trisulca) Spatterdock (Nuphar variegatum) Water lily (Nymphaea sp) Cabbage (P. amplifolius) Chara (Chara sp) Claspingleaf pondweed (Potamogeton richardsonii) Coontail (Ceratophyllum demersum) Curlyleaf pondweed (Potamogeton crispus) Elodea (Elodea canadensis) Flatstem pondweed (Potamogeton zosteriformis) Illinois pondweed (Potamogeton illinoensis) Naiads (Najas sp) Northern watermilfoil (Myriophyllum sibiricum) Sago pondweed (Potamogeton pectinatus) Water celery (Vallisneria americana) Water stargrass (Zosterella dubia) Depth 0-3 feet (n=36) Occur % Occur Depth 4-7 feet (n=36) Density Occur % Occur Depth 8-11 feet (n=36) Density Occur % Occur All Stations (n=108) Density Occur % Occur Density B - 9
98 1998: Bald Eagle Lake aquatic plant occurrences and densities for the June 1 and 5, 1998 survey based on 36 transects and 3 depths, for a total of 108 stations. Density ratings are 1-5 with 1 being low and 5 being most dense. Star duckweed (Lemna trisulca) Water lily/spatterdock (Nymphaea sp/nuphar variegatum) Chara (Chara sp) Coontail (Ceratophyllum demersum) Curlyleaf pondweed (Potamogeton crispus) Flatstem pondweed (Potamogeton zosteriformis) Broadleaf pondweed (P. sp Stringy pondweed (P. sp Sago pondweed (Potamogeton pectinatus) Water celery (Vallisneria americana) Water stargrass (Zosterella dubia) Depth 0-3 feet (n=36) Occur % Occur Depth 4-7 feet (n=36) Density Occur % Occur Depth 8-11 feet (n=24) Density Occur % Occur All Stations (n=96) Density Occur % Occur Density B - 10
99 1998: Bald Eagle Lake aquatic plant occurrences and densities for the September 4, 1998 survey based on 36 transects and 2 depths, for a total of 72 stations. Density ratings are 1-5 with 1 being low and 5 being most dense. Star duckweed (Lemna trisulca) Spatterdock (Nuphar variegatum) Water lily (Nymphaea sp) Cabbage (Potamogeton amplifolius) Chara (Chara sp) Claspingleaf pondweed (P. richardsonii) Coontail (Ceratophyllum demersum) Flatstem pondweed (P. zosteriformis) Northern watermilfoil (Myriophyllum sibiricum) Robbins pondweed (P. robbinsii) Stringy pondweed (P. sp) Water celery (Vallisneria americana) Water stargrass (Zosterella dubia) Depth 0-3 feet (n=36) Occur % Occur Depth 4-7 feet (n=36) Density Occur % Occur All Stations (n=72) Density Occur % Occur Density B - 11
100 1997: Bald Eagle Lake aquatic plant occurrences and densities for the September 24, 1997 survey based on 36 transects and 2 depths, for a total of 72 stations. Density ratings are 1-5 with 1 being low and 5 being most dense. Bulrush (Scirpus sp) Cattails (Typha sp) Duckweed (Lemna sp) Star duckweed (Lemna trisulca) Spatterdock (Nuphar variegatum) Water lily (Nymphaea sp) Cabbage (P. amplifolius) Chara (Chara sp) Claspingleaf pondweed (Potamogeton richardsonii) Coontail (Ceratophyllum demersum) Curlyleaf pondweed (Potamogeton crispus) Flatstem pondweed (Potamogeton zosteriformis) Naiads (Najas sp) Northern watermilfoil (Myriophyllum sibiricum) Sago pondweed (Potamogeton pectinatus) Water celery (Vallisneria americana) Water stargrass (Zosterella dubia) Depth 0-3 feet (n=36) Occur % Occur Depth 4-7 feet (n=36) Density Occur % Occur All Stations (n=72) Density Occur % Occur Density B - 12
101 Summary of Milfoil Occurrences from Legend " 1997! 1998 Q 1999 O Figure 7. Distribution of all watermilfoil species in Bald Eagle Lake from 1997 through B - 13
102 Appendix C P8 Model
103 Wenck Associates, Inc Pioneer Creek Ctr. P.O. Box 249 Maple Plain, MN (763) Fax (763) TECHNICAL MEMORANDUM TO: FROM: RCWD Jeremy Schultz Joe Bischoff DATE: January 15, 2010 SUBJECT: Bald Eagle Lake TMDL P8 Model Construction CC: Pollutant Loading Phosphorous loading due to direct runoff from the lake watersheds was estimated using P8, the Program for Predicting Polluting Particle Passage through Pits, Puddles and Ponds (Walker 2007, Version 3.2). P8 models simulate the build up and wash off of stormwater pollutants using mass and water balance calculations through a user defined drainage system. The key components of P8 models are watersheds, devices, particles and water quality components. The rainfall and snowmelt causing runoff is generated by hourly precipitation and daily air temperature files. The P8 model tracks pollutant loading by building up particles on a watershed, then washing off the particles through the precipitation and temperature files and routing them to devices (ponds, infiltration basins, pipes, etc). The pollutant removal efficiency of the device is then evaluated and the pollutants not removed are routed downstream in the watershed until finally depositing in Bald Eagle Lake. Watershed Delineation The P8 model created for the Bald Eagle Lake TMDL separated the Bald Eagle Lake watershed in to 28 subwatersheds. 18 of the 28 sub-watersheds directed runoff to key stormwater ponds identified through aerial inspection. Sub watershed boundaries to the ponds were delineated using 2 contours and stormsewer pipe networks. The remaining watersheds were also delineated using 2 contours and were based on geographical features such county ditches and monitoring station locations for calibration. The P8 model built for the Bald Eagle TMDL essentially has 3 branches flowing in to the lake. Those branches are for direct runoff to the lake, the County Ditch 11 (CD 11) system and the Judicial Ditch 1 (JD 1) system. Ponds 1.1A and 1.1B on the JD 1 system were constructed in 2002 and were only included in the models in the years See Figure 1 for sub-watershed boundaries and pond locations.

104
105 P8 Model Development P8 input parameters not discussed within this memo remain as the P8 model default values. Watersheds Key watershed input parameters are: Area Total area impervious fraction Pervious area SCS curve number The area considered in the P8 model watershed is only the upland area and does not include open water. The impervious fraction of each P8 watershed was determined using the Minnesota Land Cover Classification System (MLCCS) land uses with each land use having an assigned impervious percent. The MLCCS was provided by the Rice Creek Watershed District and the area of each land use within the watershed was determined in GIS. The final impervious fraction was calculated by the area weighted method. Land uses and their assigned impervious percentages are provided in Table 1. The pervious area curve number was determined by overlaying the MLCCS land uses with the hydrologic soil type. All MLCCS land uses were assigned a ground cover type such as lawn, woods, wetland, ect. Curve numbers are then based on ground cover type and hydrologic soil type. The area of each land with its assigned cover type and soil classification within each watershed was determined in GIS and the pervious area curve number was calculated by the area weighted method. (See Tables 1 and 2) Table 1 - MLCCS Land Use Categories, Pervious Ground Cover and Impervious Percentages MLCCS Land Use Pervious Cover Type Impervious % 11% to 25% impervious cover with coniferous and/or deciduous shrubs Open Space/Lawn 17 26% to 50% impervious cover with coniferous trees Woods-Good 38 26% to 50% impervious cover with perennial grasses and sparse trees Compacted Lawn 38 4% to 10% impervious cover with perennial grasses and sparse trees Open Space/Lawn 7 51% to 75% impervious cover with perennial grasses and sparse trees Compacted Lawn 63 91% to 100% impervious cover Compacted Lawn 95 Close Seeded Legumes - All other close grown cropland on upland soils G 0 Altered/non-native deciduous forest Woods-Fair 0 Altered/non-native deciduous woodland Woods-Fair 0 Altered/non-native dominated seasonally flooded shrubland Brush-Good 0 Altered/non-native dominated upland shrubland Brush-Good 0 Altered/non-native grassland with sparse deciduous trees - saturated soils Wetland 0 Altered/non-native mixed woodland Woods-Fair 0 Artificial surfaces with coniferous trees Woods/Grass-Fair 0 Artificial surfaces with coniferous trees Woods/Grass-Fair 0 Aspen (forest, woodland) with 11-25% impervious cover Woods-Good 17 Aspen (forest, woodland) with 4-10% impervious cover Woods-Good 7 Aspen forest Woods-Good 0
106 MLCCS Land Use Pervious Cover Type Impervious % Aspen forest - saturated soils Wetland 0 Aspen forest - temporaily flooded Woods-Good 0 Aspen woodland Woods-Good 0 Black ash swamp - seasonally flooded Wetland 0 Boxelder-green ash (forest) with 26-50% impervious cover Woods-Fair 38 Buildings and pavement with 76-90% impervious cover Compacted Lawn 83 Buildings and pavement with % impervious cover Compacted Lawn 95 Buildings and/or pavement Compacted Lawn 50 Cattail marsh - intermittently exposed Wetland 0 Cattail marsh - saturated soils Wetland 0 Cattail marsh - seasonally flooded Wetland 0 Coniferous trees on upland soils Woods-Good 0 Corn Row Crop-Good 0 Deciduous trees on upland soils Woods-Good 0 Dry prairie with 11-25% impervious cover Meadow-Good 17 Dry prairie with 26-50% impervious cover Meadow-Good 38 Dry prairie with 4-10% impervious cover Meadow-Good 7 Eastern Red Cedar woodland Woods-Good 0 Floodplain forest Woods-Good 0 Floodplain forest swamp white oak subtype Woods-Good 0 Grassland with sparse conifer or mixed deciduous/coniferous trees Meadow-Good 0 Grassland with sparse conifer or mixed deciduous/coniferous trees altered/non-native dominated Meadow-Good 0 Grassland with sparse deciduous trees - altered/non-native dominated vegetation Meadow-Good 0 Hayfield Meadow-Good 0 Hayfield on hydric soils Meadow-Good 0 Close Seeded Legumes - Hydric soils - close grown cropland G 0 Hydric soils with planted or maintained grasses Small Grain-SR Good 0 Hydric soils with planted or maintained grasses and sparse tree cover Woods/Grass Combo- Good 0 Hydric soils with planted, maintained or cultivated mixed coniferous/deciduous trees Woods/Grass Combo- Good 0 Intermittently exposed altered/non-native dominated vegetation Woods/Grass-Fair 0 Woods/Grass Combo- Long grasses and mixed trees with 4-10% impervious cover Good 7 Long grasses on upland soils Meadow-Good 0 Long grasses with sparse tree cover on upland soils Meadow-Good 0 Lowland hardwood forest Woods-Good 0 Maple-basswood forest Woods-Good 0 Medium-tall grass altered/non-native dominated grassland Meadow-Good 0 Mesic brush-prairie Brush-Good 0 Mixed emergent marsh Wetland 0 Mixed emergent marsh - seasonally flooded Wetland 0 Mixed hardwood swamp Wetland 0 Mixed hardwood swamp seepage subtype Wetland 0 Mixed pine-hardwood (forest) with 11-25% impervious cover Woods-Good 17 Native dominated disturbed upland shrubland Brush-Good 0 Native dominated temporarily flooded shrubland Brush-Good 0 Non-native dominated long grasses with 11-25% impervious cover Meadow-Good 17 Northern hardwood (forest) with 11-25% impervious cover Woods-Good 17
107 MLCCS Land Use Pervious Cover Type Impervious % Northern hardwood (forest) with 26-50% impervious cover Woods-Fair 38 Northern hardwood forest Woods-Good 0 Oak (forest or woodland) with 11-25% impervious cover Woods-Fair 18 Oak (forest or woodland) with 26-50% impervious cover Woods-Fair 38 Oak (forest or woodland) with 4-10% impervious cover Woods-Good 7 Oak forest Woods-Good 0 Oak forest dry subtype Woods-Good 0 Oak forest mesic subtype Woods-Good 0 Oak woodland-brushland Woods-Good 0 Oats Small Grain-SR Good 0 Other deciduous trees with 11-25% impervious cover Woods-Fair 18 Other deciduous trees with 26-50% impervious cover Woods-Fair 38 Other deciduous trees with 4-10% impervious cover Woods-Good 7 Other exposed/transitional land with 0-10% impervious cover Fallow-Good 5 Other planted conifers with 11-25% impervious cover Woods-Fair 18 Pavement with 76-90% impervious cover Compacted Lawn 83 Pavement with % impervious cover Compacted Lawn 95 Planted mixed coniferous/deciduous trees with 11-25% impervious cover Woods-Fair 18 Planted mixed coniferous/deciduous trees with 26-50% impervious cover Woods-Fair 38 Poor fen Wetland 0 Poor fen sedge subtype Wetland 0 Red pine forest Woods-Good 0 Red pine trees on upland soils Woods-Good 0 Rich fen sedge subtype Wetland 0 Saturated altered/non-native dominated graminoid vegetation Wetland 0 Saturated deciduous shrubland Wetland 0 Saturated graminoid vegetation Wetland 0 Seasonally flooded altered/non-native dominated emergent vegetation Wetland 0 Seasonally flooded deciduous shrubland Woods/Grass-Fair 0 Short grasses and mixed trees with 11-25% impervious cover Woods/Grass-Fair 18 Short grasses and mixed trees with 26-50% impervious cover Woods/Grass-Fair 38 Woods/Grass Combo- Short grasses and mixed trees with 4-10% impervious cover Good 7 Short grasses and mixed trees with 51-75% impervious cover Woods/Grass-Fair 63 Short grasses on hydric soils Open Space/Lawn 0 Short grasses with 11-25% impervious cover Open Space/Lawn 18 Short grasses with 26-50% impervious cover Compacted Lawn 38 Short grasses with 4-10% impervious cover Open Space/Lawn 7 Short grasses with 51-75% impervious cover Compacted Lawn 63 Short grasses with sparse tree cover on hydric soils Open Space/Lawn 0 Spruce/fir trees on upland soils Woods-Good 0 Tamarack swamp sphagnum subtype Wetland 0 Temporarily flooded altered/non-native dominated grassland Meadow-Good 0 Upland deciduous forest Woods-Good 0 Upland deciduous woodland Woods-Good 0 Close Seeded Legumes - Upland soils - close grown cropland G 0 Upland soils with planted or maintained grasses Open Space/Lawn 0 Upland soils with planted or maintained grasses and sparse tree cover Open Space/Lawn 0
108 MLCCS Land Use Upland soils with planted, maintained or cultivated mixed coniferous/deciduous trees Upland soils with planted, maintained, or cultivated coniferous trees Pervious Cover Type Impervious % Woods/Grass Combo- Good 0 Woods/Grass Combo- Good 0 Wet meadow Wetland 0 Wet meadow - temporarily flooded soils Wetland 0 Wet meadow shrub subtype Wetland 0 Wet meadow shrub subtype - saturated soils Wetland 0 Table 2 - Curve Numbers by Ground Cover and Hydrologic Soil Type SOIL HYDROLOGIC GROUP GROUND COVER A B C D A/D B/D C/D W Open Space / Lawn Wetland Small Grain - SR Good Woods - Fair Woods - Good Brush - Good Woods/Grass Combo - Good Open Water Row Crop - Good Fallow - Good Meadow - Good Woods / grass - Fair Close Seeded Legumes - Good Compacted Lawn Devices The table and diagram below describe the type of devices used to evaluate phosphorus removal and are taken directly from the P8 help website at Device Type Input Values Description Removes Particles Infil - tration Outlet Normal Outlet Spillway/ Overflow Detention Pond Permanent & flood pool areas & volumes infiltration rates outlet type & size configured as wet, dry, or extended detention X X X X Infiltration Basin General Device storage pool area & volume, infiltration rate; void fraction area & discharge vs. elevation,3 outflow streams (normal, overflow, infiltration) storage area with infiltration X X X user-defined hydraulics from independent model/ analysis X X X X Pipe / Manhole time of concentration (linear reservoir) collects watershed and/or device outflows and directs them to downstream device X

109 The deadpool and livepool storage volumes used in this model were estimated based on the pond surface area assuming typical NURP pond requirements. Ponds were assumed to have a 10 bench with a 10:1 slope centered on the normal water level. The deadpool was assumed to be 4 feet in depth with 3:1 side slopes. The livepool was assumed to have 3 feet of storage above the normal water level with 4:1 side slopes. Pond outlets were provided by the Cities and Townships. The water quality devices built in to the model are listed in Table 3. Table 3 Water Quality Devices P8 Device Name Device Type Contributing Watershed Pond 1 Pond Watershed 1 Pond 2 Pond Watershed 2 Pond 3 Pond Watershed 3 Pond 4 Pond Watershed 4 Pond 5 Pond Watershed 5 Pond 6 Pond Watershed 6 Pond 7 Pond Watershed 7 Pond 8 Pond Watershed 8 Pond 9 Pond Watershed 9 Pond 10 Pond Watershed 10 Pond 11 Pond Watershed 11 Pond 12 Pond Watershed 12 Pond 13 Pond Watershed 13 Pond 14 Pond Watershed 14 Pond 15 Pond Watershed 15 Pond 16 Pond Watershed 16 Pond 1.1 A Pond Watershed JD 1.1A Pond 1.1 B Pond Watershed JD 1.1B Particles Particle values are provided with the P8 model that are based on "typical urban runoff" concentrations and settling velocities measured under NURP (Athayede et al.,1983,1986; Driscoll, 1983). The NURP 50 th % particle values were determined to be reasonable and therefore used to predict phosphorus runoff. The particle calibration as stated by the P8 website is as follows:
110 Washoff parameters for particle fractions P10% - P80% are contained in particle files NURP50.P8P, NURP90.P8C, & SIMPLE.P8C have been calibrated as follows: Accumulation Rate = 1.75 lbs/ac-day (P10%,P30%,P50%), = 3.5 lbs/ac-day (P80%) calibrated to provide median EMC = 100 ppm Total Susp. Solids ; using Providence Airport weather data. Accum. Decay Rate =.25 1/day; assumes buildup on impervious surfaces reaches 90% of steady-state after 10 days of dry weather without sweeping Washoff Exponent = 2; provides intensity-dependent washoff, as in SWMM (Huber et al., 1988) Washoff Coefficient = 20 calibrated so that load/volume relationship for impervious watersheds saturates at ~1 inch of rainfall; provides 92% washoff for a 1-inch, 8-hour storm. Impervious Runoff Conc = 0; buildup/washoff dynamics are used to predict impervious runoff conc. Pervious runoff concentration parameters contained in particle files NURP50.P8C, NURP90.P8C, & SIMPLE.P8C have been calibrated as follows: Model: CONC = a RUNOFF b Variables: CONC = concentration in pervious runoff (ppm) RUNOFF = runoff intensity from pervious areas (inches/hr) Parameters: a = intercept = runoff intensity of 1 in/hr = 100 ppm; calibrated so that flow-weighted mean TSS EMC from pervious watersheds = 100 ppm; calibration period = ; Curve Number = 74; Providence Rhode Island Rainfall. b = exponent = 1; linear log(c) vs. log(q) relationship; typical of stream sediment rating curves (Huber & Dikinson,1988) Water Quality Components The default NURP 50 th % values were also used for water quality components. As stated by the P8 website : Particle Compositions (mg/kg) have been calibrated so that median, event-mean runoff concentrations correspond to values reported by the Nationwide Urban Runoff Program: Component NURP50.P8P Particle File % Dissolved Total Suspended Solids Total Phosphorus Precipitation Runoff is a direct result from rainfall and snowmelt. P8 combines rainfall and snowmelt in to one precipitation file. The precipitation file used for the Bald Eagle Lake TMDL followed the same derivation process that was used in the Lino Lakes TMDL. The derived rainfall for the years as follows:

111 Precipitation data was obtained from the Climatology Working Group ( database. With this database, the target location is set using section, township, and range, and the allowable maximum number of missing data points per month. The various sites are then searched so that the closest data set with less than the allowable number of missing data points can be identified. For the precipitation data, two separate data sets were obtained (see Figure 3), using the following search criteria: Set 1: Target T31 R22 S28 (located in Upper Rice Creek Watershed); 3 missing days allowed per month Set 2: Target T38 R22 S21 (located near Peltier Lake); 3 missing days allowed per month Figure 3. Rain Gauge Sites from U of M Climatology Web-Site To compile the precipitation data set for the model, the following guidelines were followed: On days for which precipitation data were recorded in both data sets, the two values were averaged. On days for which there were data for only one of the sites, that value was used.
112 If data were missing from both data sets, a value of zero was used. The daily totals were then distributed based on a SCS 24-hour distribution at hourly intervals. Temperature The temperature data was also obtained from the Climatology Working Group ( database Centerville station, using average daily temperature values. Model Calibration The JD 1 branch of the P8 model was calibrated to the annual runoff volume for the year of 2001, the best known year of monitored data. Four monitoring sites were considered in calibrating the model. Those were sites JD 1, JD 1.1, JD 1.4 and JD 1.5. At all monitored locations the P8 model under predicted the annual runoff volumes. To calibrate the annual flow through these 4 sites the precipitation scale factor was adjusted until volumes predicted by P8 matched the monitored data as close as possible. The monitored volumes versus P8 calibrated volumes are shown in Figure 2 below. After calibrating the model to the JD 1 ditch system annual runoff volumes were combine with monitored water quality data to estimate nutrient loading. No monitored data existed for either the direct runoff to Bald Eagle Lake or the County Ditch 11 system. For this reason the P8 model was run with default values (no adjustment to the precipitation scale factor) to estimate watershed loading. Figure 2 Volume (acre-feet) Annual Runoff Volume Calibration for JD1 in ,000 4,500 4,000 3,500 3,000 2,500 2,000 1,500 1, JD1.1 vol (af) JD1 vol (af) JD1.4 vol (af) JD1.5 vol (af) Moitored Yearly Annual Site Volum P8 Annual Volume
113 Appendix D Sediment Release Rates


114 Internal Phosphorus Loading and Mobile and Refractory Phosphorus Fractions in Sediments of Bald Eagle, Fish, and Oneka Lakes, Minnesota 7 December, 2007 William F. James ERDC Eau Galle Aquatic Ecology Laboratory W. 500 Eau Galle Dam Road Spring Valley, Wisconsin
115 OBJECTIVES The objectives of this investigation were to determine rates of phosphorus release from sediments under laboratory-controlled anoxic conditions and measure fractions of mobile and refractory phosphorus fractions from profundal sediments collected in Bald Eagle, Fish, and Oneka Lakes, Minnesota. APPROACH Laboratory-derived rates of phosphorus release from sediment under anoxic conditions: Triplicate sediment cores were collected by Wenck Associates from Bald Eagle, Fish, and Oneda Lake for determination of rates of iron and phosphorus release from sediment under anoxic conditions. The cores were drained of overlying water and the upper 10 cm of sediment was transferred intact to a smaller acrylic core liner (6.5-cm dia and 20-cm ht) using a core remover tool. Surface water from each lake was filtered through a glass fiber filter (Gelman A-E), with 300 ml then siphoned onto the sediment contained in the small acrylic core liner without causing sediment resuspension. Sediment incubation systems consisted of the upper 10-cm of sediment and filtered overlying water contained in acrylic core liners that were sealed with rubber stoppers. The sediment incubation systems were placed in a darkened environmental chamber and incubated at a constant temperature (20 o C) for a three week period. The oxidation-reduction environment in each system was controlled by gently bubbling nitrogen (anoxic) through an air stone placed just above the sediment surface. Water samples for soluble reactive phosphorus and dissolved iron were collected from the center of each sediment incubation system using an acid-washed syringe and filtered through a 0.45 µm membrane syringe filter (Nalge). Sampling was conducted at daily intervals for 5 days, then every other day for an additional 14 days. The water volume removed from each system during sampling was replaced by addition of filtered lake water preadjusted to the proper oxidation-reduction condition. These volumes were 2
116 accurately measured for determination of dilution effects. Soluble reactive phosphorus was measured colorimetrically using the ascorbic acid method (APHA 1998). Dissolved iron was determined using atomic absorption spectrophotometry. Rates of phosphorus and iron release from the sediment (mg m -2 d -1 ) were calculated as the linear change in concentration in the overlying water divided by time and the area of the incubation core liner. Regression analysis was used to estimate rates over the linear portion of the data. Profundal sediment chemistry: One additional core taken at the same location in each lake was used for sediment phosphorus fractionation. The upper 10 cm was removed from each core for analysis of moisture content (%), sediment density g/ml), loss on ignition (i.e., organic matter content, %), loosely-bound phosphorus, iron-bound phosphorus, aluminum-bound phosphorus, calcium-bound phosphorus, labile and refractory organic phosphorus, total phosphorus, total iron, and total calcium (all expressed at mg/g). A known volume of sediment was dried at 105 o C for determination of moisture content and sediment density and ashed at 550 o C for determination of losson-ignition organic matter. Additional sediment was dried to a constant weight, ground, and digested for analysis of total phosphorus, iron, and calcium using standard colorimetric and spectrophotometric methods (APHA 1998). Phosphorus fractionation was conducted according to Hieltjes and Lijklema (1980), Psenner and Puckso (1988), and Nürnberg (1988) for the determination of ammonium-chloride-extractable phosphorus (loosely-bound P), bicarbonate-dithionite-extractable phosphorus (i.e., ironbound P), sodium hydroxide-extractable phosphorus (i.e., aluminum-bound P), and hydrochloric acid-extractable phosphorus (i.e., calcium-bound P). A subsample of the sodium hydroxide extract was digested with potassium persulfate to determine nonreactive sodium hydroxide-extractable P (Psenner and Puckso 1988). Labile organic P was calculated as the difference between reactive and nonreactive sodium hydroxideextractable P. Residual organic phosphorus was estimated as the difference between total phosphorus and the sum of the other fractions. 3
117 RESULTS AND INTERPRETATION Fish Lake sediments exhibited the greatest rate of P release under anoxic conditions followed by Bald Eagle Lake sediments (Fig. 1; Table 1). P mass accumulation was linear and most rapid during the first 5 days of incubation for these lakes. In contrast, anoxic sediment P flux was very low for Oneka Lake sediments. DFe accumulation exhibited a different pattern (Fig. 2). For Bald Lake sediment, DFe mass increased slightly during the first 2-3 days, then declined to near zero on day 4. Linear rates of DFe accumulation in the overlying water occurred between day 4 and 11, then DFe mass remained approximately constant until the end of the study. DFe mass increased in the Oneka sediment incubation systems over the first 11 days while linear increases in mass occurred between day 4 and 14 for Fish Lake systems. Overall, rates of DFe release were greatest for Oneka Lake sediments and ~ 2-3 times lower for Bald Eagle and Fish Lake sediments (Table 1). The Fe:P rate ratio for Bald Eagle and Fish Lake sediments was < 1 in conjunction with high rates of P release. It was 37 for Oneka Lake sediments, coincident with a very low rate of P release. Sediment collected in each lake exhibited very high moisture content and low density, suggesting very fine-grained flocculent material (Table 2). The loss-on-ignition organic matter content was very high at ~68% for Oneka Lake sediments and it represented 37.3% and 18.7% of the sediment dry mass for Bald Eagle and Fish Lake, respectively. Total P, Fe, and Ca concentrations were moderate relative to literature values reported in Barko and Smart (1986), Ostrofsky (1987), and Nürnberg (1988). Higher sediment total P concentrations for Bald Eagle and Fish Lake coincided with higher rates of P release versus a lower sediment total P concentration and a lower anoxic P release rate for Oneka Lake sediment. The Fe:P ratio for sediment varied between ~8 and 13 (Table 2). This pattern contrasted with the very low Fe:P rate ratios observed for Bald Eagle and Fish Lake (Table 1). Differences between the ratios indicated that even though total Fe was high relative to total P in sediment, only a minor portion diffused into the water column 4
118 as dissolved Fe. Fe reaction with S under anoxic conditions could have reduced DFe flux out of the sediment for these lakes (Caraco et al. 1993; Gächter and Müller 2003). The redox-sensitive loosely-bound and iron-bound P fractions accounted for a considerable proportion of the sediment total P for Bald Eagle and Fish Lake (Table 2 and 3). In contrast, redox-sensitive P represented a much lower percentage of the total P in Oneka Lake sediments. Redox-sensitive P versus anoxic P release rates for sediments in the present study (Fig. 3) were comparable to published regression relationships developed by Nürnberg (1988), suggesting that anoxia, reduction of iron, and desorption of P were drivers in internal P loading. The labile and refractory organic P fractions accounted for nearly 70% of Oneda Lake sediment total P, which coincided with much higher sediment organic matter content (Table 3). Refractory P forms represented 60 and 67% of the sediment total P for Bald Eagle and Oneda Lake, respectively. In particular, refractory organic P represented 58% of the sediment total P for Bald Eagle Lake. Biologically labile P species dominated the P composition of Fish Lake sediments. REFERENCES APHA (American Public Health Association). (1998). Standard Methods for the Examination of Water and Wastewater. 20th ed. American Public Health Association, American Water Works Association, Water Environment Federation. Barko J.W., and Smart R.M. (1986). Sediment-related mechanisms of growth limitation in submersed freshwater macrophytes. Ecology 67: Caraco, N.F., Cole, J.J., and Likens, G.E. (1993). Sulfate control of phosphorus availability in lakes. Hydrobiologia 253: Gächter, R., and Müller, B. (2003) Why the phosphorus retention of lakes does not necessarily depend on the oxygen supply to their sediment surface. Limnol. Oceanogr. 48,
119 Hjieltjes, A.H., and Lijklema, L. (1980). Fractionation of inorganic phosphorus in calcareous sediments. J. Environ. Qual. 8, Nürnberg, G.K. (1988). Prediction of phosphorus release rates from total and reductantsoluble phosphorus in anoxic lake sediments. Can. J. Fish. Aquat. Sci. 45: Ostrofsky, M.L. (1987). Phosphorus species in the surficial sediments of lakes in eastern North Americ. Can. J. Fish. Aquat. Sci. 44: Psenner, R., and Puckso, R. (1988). Phosphorus fractionation: Advantages and limits of the method for the study of sediment P origins and interactions. Arch. Hydrobiol. Biel. Erg. Limnol. 30:
120 Table 1. Means (n=3) and standard errors (STDERR) for rates of soluble reactive phosphorus (SRP) and dissolved iron (DFe) release from sediment under anoxic conditions. Lake SRP STDERR DFe STDERR Fe:P (mg m -2 d -1 ) (mg m -2 d -1 ) Bald Eagle Oneka Fish
121 Table 2. Sediment physical-chemical characteristics. P = phosphorus, redox P = the sum of the loosely-bound and iron-bound P fractions (see Table 3), Fe = iron, Ca = calcium, Fe:P = sediment iron to phosphorus ratio (mass:mass). Lake Moisture Content Density Loss-on-ignition Total P Redox P Redox P Total Fe Total Ca Fe:P (%) (g/ml) (%) (mg/g) (mg/g) (%) (mg/g) (mg/g) Bald Eagle % Oneka % Fish % Table 3. Sediment phosphorus (P) fraction concentrations. Redox-sensitive and biologically labile P Refractory P Lake Loosely-bound P Iron-bound P Iron-bound P Labile organic P Aluminum-bound P Calcium-bound P Refractory organic P (mg/g) (mg/g DW) (mg/g FW) (mg/g) (mg/g) (mg/g) (mg/g) Bald Eagle Oneka Fish
122 P Mass, mg Bald Eagle P Mass, mg Oneka Rep 1 Rep 2 Rep P Mass, mg Fish Days Figure 1. Changes in phosphorus (P) mass in overlying water as a function of time for sediment incubation systems maintained under anoxic conditions. Black horizontal bars represent data used to calculate rates of P release. 9
123 Fe Mass, mg Bald Eagle Fe Mass, mg Oneka Fe Mass, mg Fish Rep 1 Rep 2 Rep Days Figure 2. Changes in dissolved iron (Fe) mass in overlying water as a function of time for sediment incubation systems maintained under anoxic conditions. Black horizontal bars represent data used to calculate rates of Fe release. 10
124 20 Fish P Release Rate (mg m -2 d -1 ) Nürnberg (1988) Oneka Bald Eagle Redox-sensitive P (mg/g FW) Figure 3. A comparison redox-sensitive phosphorus (P) versus the anoxic P release rate for this study versus research published by Nürnburg (1988). 11
125 Appendix E Shuneman Marsh Studies
126 Ramsey Washington Judicial Ditch 1 Nutrient and Aeration Study INTRODUCTION The purpose of the Ramsey-Washington Judicial Ditch 1 (RWJD1) Study was to determine the source of both soluble and total phosphorus being transported through the ditch system. The RWJD1 drainage area is 7626 acres and collects drainage from Fish, Sunset, Pine Tree, Mann, and Long Lakes (Figure 1). This study included collection of water quality data and flow data from six distinct drainage areas within the ditch system in 2001 (Figure 1). The estimated nutrient load from each subwatershed was evaluated by monitoring continuous flow and sampling by periodic grab samples throughout the open water season. In 2000 a shorter monitoring program took place, however the results were inconclusive so the project was expanded during the 2001 season. An aeration system was installed in the ditch above the Portland Avenue crossing. The nutrient transport estimates and potential nutrient reduction estimates from the aeration process are the focal point of this report and will be discussed in detail later in this report. WATERSHED CHARACTERISTICS The RWJD1 system was originally a natural waterway. This system was constructed as a fishhook-shaped drainage way that lies immediately north of White Bear Lake. It originates in the wetlands north of Fish Lake in Washington County and flows south for 1 mile before bending west and northwest in Ramsey County. The channel length is approximately 2.4 miles from Fish Lake to the east shore of Bald Eagle Lake. The official judicial ditch length is 1.5 miles. There are also numerous private ditches and drainage ways that enter in and drain into the RWJD1 ditch system. Land use in this area is primarily large lot single family homes with a golf course located just upstream of sampling location JD1.6. There are also a considerable number of wetlands and lakes that this system drains through. T:\1137 RCWD\13 Bald Eagle TMDL\JD 1 Info\RWJD1 special projects\aeration report\rwjd po4 report for aeration study.doc 1/18/2010 1
127 Ramsey Washington Judicial Ditch 1 Nutrient and Aeration Study Figure RWJD1 Monitoring Locations #0 Short Street JD1.5 JD1.1 #0 Portland Avenue #0 aeration site Ramsey/Wash JD1 #0 JD1 #0 #0 JD1.3 JD1.6 #0 Hwy 61 JD2 The RWJD1 system lies in the North Central Hardwoods Forest Ecoregion (CHF) (MPCA 1990), however comparison of nutrient outputs from a ditched system should not be compared to a natural system. SAMPLING METHODOLOGY Flow Monitoring Continuous flow monitoring was conducted at six sites in order to establish an accurate hydrologic record of tributary inputs to the RWJD1 system. Flow records were recorded from April 10, 2001 to October 28, 2001 using ISCO flowmeters. These meters record water level (stage) and will convert recorded data into discharge measurements in cubic feet per second (cfs). Stream stage is converted at each site using a site specific stage- T:\1137 RCWD\13 Bald Eagle TMDL\JD 1 Info\RWJD1 special projects\aeration report\rwjd po4 report for aeration study.doc 1/18/2010 2
128 Ramsey Washington Judicial Ditch 1 Nutrient and Aeration Study discharge rating curve that was developed over the course of the summer. Continuous level measurements were taken automatically by the meters at 15-minute increments for the entire monitoring period. Figure 2 shows the flow data graphically for all monitoring locations. Water Quality Sampling Water quality samples were collected by 15 grab sample events between March 22 and October 8, Samples were collected at all six locations within a four hour sampling timeframe. The samples were collected using the same methodology and would be comparable when estimating pollutant loads using the FLUX model. Each sample was collected in a 500 ml sterile whirlpak and a 1000 ml plastic bottle for analysis at the Ramsey County Environmental Laboratory and Braun Intertec. The laboratory was responsible for supplying bottles prepared for sampling. Sample bottles were labeled in the field to include location, unique sample ID number, date, time, crew, and type of preservative. All samples were handled in accordance with EPA-approved methods. Samples were analyzed for total phosphorus (TP), soluble reactive phosphorus (SRP), total kjeldahl nitrogen (TKN), ammonia (NH3), nitrate-nitrite (Nox), total (TSS) and volatile suspended solids (VSS), total iron (TFE) and dissolved iron (DFE). Aeration Study A ditch aeration system was installed in RWJD1 above the Portland Avenue crossing. This system involved the installation of a 300 foot linear aeration system just downstream of Shuneman Marsh. The system ran for about 60 days from late July through late September. The study used two ¾ hp air pumps and four ½ inch by 300 foot long air lines along the ditch bottom. The air lines had 5/16 inch holes drilled in each line at approximately a one foot interval. The purpose of the study was to see if by saturating the T:\1137 RCWD\13 Bald Eagle TMDL\JD 1 Info\RWJD1 special projects\aeration report\rwjd po4 report for aeration study.doc 1/18/2010 3
129 Ramsey Washington Judicial Ditch 1 Nutrient and Aeration Study Dissolved Oxygen (DO) concentration of ditch, phosphorus concentrations would decrease by binding it to iron salts. Previous literature review suggested that this method showed some promise in slow moving ditched wetland systems where the wetland pore water was high in ortho phosphate. FIGURE WRJD1 flows JD JD1.6 JD1.4 JD1 JD1.4 JD1.5 JD JD date 05/09/01 06/08/01 07/08/01 08/07/01 09/06/01 10/06/01 PHOSPHORUS TRANSPORT MODELING The overall goal of the project was to better understand the dynamics of nutrient transport within the RWJD1 drainage system. Stream transport pollutant loading was calculated using the FLUX model. FLUX uses daily average flows to calculate the estimated pollutant loads by monitoring site. FLUX modeling also estimates the volume of water passing a monitoring station for the monitored time period. T:\1137 RCWD\13 Bald Eagle TMDL\JD 1 Info\RWJD1 special projects\aeration report\rwjd po4 report for aeration study.doc 1/18/2010 4
130 Ramsey Washington Judicial Ditch 1 Nutrient and Aeration Study RESULTS Table 1 lists estimated volumes of water along with the major nutrient loads that passed each monitoring station during the monitoring period. Table 1 Estimated Water Volume and Nutrient Loads By Monitoring Station (March 01-October 01) Site Flow Volume (ac-ft) TP (lb) SRP (lb) TSS (lb) TKN (lb) JD JD JD JD JD JD JD Review of the estimated loading data suggest that a high percentage of the phosphorus loading is coming from upstream of the Schuneman Marsh area in the Fish Lake subwatershed (site JD1.5). It is estimated that over 50 percent of the phosphorus load passing the Taylor Avenue site (JD1) is coming from this drainage area. In addition, a very high percentage of the SRP and TKN load is coming from the Fish Lake subwatershed as well. Land use in this subwatershed is wetland, low density residential, and Oneka Ridge Golf course. JD1.6 is another source of significant phosphorus loading to the ditch system. The JD1.6 drainage area collects runoff from two golf courses, Dellwood and the White Bear Yacht Club. The estimated pollutant (phosphorus and nitrogen) load at JD1.6 is more than double that of JD1.4, located upstream. The only parameter that is significantly lower at T:\1137 RCWD\13 Bald Eagle TMDL\JD 1 Info\RWJD1 special projects\aeration report\rwjd po4 report for aeration study.doc 1/18/2010 5
131 Ramsey Washington Judicial Ditch 1 Nutrient and Aeration Study JD1.6 is TSS. This is understandable as the Dellwood golf course has a series of ponds that the drainage system goes through before discharging into RWJD1. Monitoring data suggests that the majority of the pollutant load is coming from the JD1.5 and JD1.6 subwatersheds. When looking at the JD1 pollutant load, a direct comparison can be made to the loads coming from the JD1.5 and JD1.6 subwatersheds. This is directly relevant when looking at TP and SRP. There does not appear to be a large contribution of nutrient loading coming from the Shuneman Marsh drainage. Figure 3 shows the graphical presentation of the RWJD1 TP load sources. This pie graph shows that over 77 % of the TP loading is coming from the JD1.5 and JD1.6 subwatersheds. Figure 3 RWJD1 Phosphorus Load Source Graph RWJD1 TP Load Sources JD1.6 33% JD1.5 44% JD1.1 20% JD1 2% JD1.2 1% This may be due to the drainage coming from the Oneka Ridge golf course. An estimated export rate of 0.36 lb of phosphorus per acre of drainage area is high when compared to other monitored streams in the RCWD. The monitoring data from throughout the District reveals that a typical range for TP export rates is 0.10 to 0.40 lbs/acre/year. This range was gathered by review of historical small creek monitoring data. A substantial amount T:\1137 RCWD\13 Bald Eagle TMDL\JD 1 Info\RWJD1 special projects\aeration report\rwjd po4 report for aeration study.doc 1/18/2010 6
132 Ramsey Washington Judicial Ditch 1 Nutrient and Aeration Study of the TP and SRP load is coming from the JD1.5 subwatershed. Also subwatershed JD1.6 is contributing a significant amount of phosphorus to the overall nutrient load of the stream. The lack of substantial nutrient increases from the Shuneman Marsh area suggests that pore water from the drained wetland may not be a major contributing source of phosphorus to the ditch. Figure 4 shows the phosphorus levels at monitoring site JD1.3 and JD1.2, which are immediately above and below the aeration system. Figure 4 Total Phosphorus Concentrations Total Phosphorus Concentrations Above and Below the Aeration system in RWJD mg/l 0.8 JD1.2 JD Date 6/22/2000 6/29/2000 7/5/2000 7/18/2000 8/4/2000 8/17/2000 9/6/ /22/01 04/10/01 04/25/01 05/08/01 05/21/01 06/15/01 06/28/01 07/12/01 07/24/01 07/31/01 08/09/01 08/14/01 08/30/01 09/12/01 09/28/01 Figure 5 shows the soluble phosphorus or bioavailable phosphorus levels at the aeration site. Review of the data in these two graphs shows virtually identical concentrations for the paired sample events. Review of the D.O. data collected during field visits revealed that oxygen levels during low flow periods were often below 2 mg/l at the JD1.3 sampling point. At the downstream sampling point (JD1.2) D.O. levels were generally 1 to 1.5 mg/l higher. This suggests that possibly the aeration system was not supplying enough oxygen to the system to create the anticipated chemical affect or that the T:\1137 RCWD\13 Bald Eagle TMDL\JD 1 Info\RWJD1 special projects\aeration report\rwjd po4 report for aeration study.doc 1/18/2010 7
133 Ramsey Washington Judicial Ditch 1 Nutrient and Aeration Study anticipated chemical affect is only theoretical and not practical. The data from the 2 years of study was inconclusive. Figure 5 Soluble Phosphorus Concentrations Soluble Phosporus Concentrations Above and Below the aeration system in RWJD JD1.2 SRP JD1.3 SRP /15/2000 6/23/ /1/2000 1/9/2001 4/19/2001 7/28/ /5/2001 During both study years, stream flows exhibited flashy flow rates based on storm events, and very low flows during baseflow periods. Flux modeling of the phosphorus transport suggests that storm flows are responsible for the majority of the phosphorus load through the ditch. CONCLUSIONS AND RECOMMENDATIONS Review of the data shows that the phosphorus levels above and below the aeration system was not significantly changed. The aeration system did boost the D.O. concentration at the downstream location. The anticipated chemical reaction of iron binding with T:\1137 RCWD\13 Bald Eagle TMDL\JD 1 Info\RWJD1 special projects\aeration report\rwjd po4 report for aeration study.doc 1/18/2010 8
134 Ramsey Washington Judicial Ditch 1 Nutrient and Aeration Study phosphorus to precipitate out FePO2 did not appear to occur. The stream velocities may have been to fast to adequately oxygenate the water to a point where the chemical reaction could occur. Stream flows were flashy based on storm events. Baseflow conditions were near 0.5 cfs, however the stream velocities were still relatively fast (>0.3 ft/sec). With a 300 foot air line the contact time for stream water would have been around 17 minutes at low flow, and much less at higher flows. The project was based on the theory that the Shuneman Marsh pore water was exporting high concentrations of SRP. This was believed o be caused from the constant wet and dry cycles that the wetland goes through during a typical rain season. This study found that the majority of the SRP load was coming from above the Shuneman Marsh or from the JD1.6 subwatershed. Land management practices and possible BMP s should be investigated throughout this watershed. Reduction of nutrient transport through this system could be accomplished through BMP s and public education. Enclosed are photos of the aeration system installed in the creek. T:\1137 RCWD\13 Bald Eagle TMDL\JD 1 Info\RWJD1 special projects\aeration report\rwjd po4 report for aeration study.doc 1/18/2010 9


135 Ramsey Washington Judicial Ditch 1 Nutrient and Aeration Study Photo of Aerator Lines at site Aeration lines looking downstream toward Portland Avenue T:\1137 RCWD\13 Bald Eagle TMDL\JD 1 Info\RWJD1 special projects\aeration report\rwjd po4 report for aeration study.doc 1/18/
Lake Magda Nutrient TMDL FINAL
 Lake Magda Nutrient TMDL FINAL Prepared for Shingle Creek Watershed Management Commission Minnesota Pollution Control Agency September 2010 Lake Magda Nutrient TMDL FINAL Wenck File #1240-22 Prepared for:
Lino Lakes Chain of Lakes Nutrient TMDL
 Lino Lakes Chain of Lakes Nutrient TMDL Prepared for Rice Creek Watershed District Minnesota Pollution Control Agency July 213 Lino Lakes Chain of Lakes Nutrient TMDL Wenck File #1137-5 Prepared for: RICE
Clear Lake Diagnostic Study and Management Plan
 Wenck File #1137-15 Sponsored By: Rice Creek Watershed District Blaine, MN www.ricecreek.org Clear Lake Diagnostic Study and Management Plan And A Clean Water Partnership Grant provided by the Minnesota
Spring Lake Upper Prior Lake Nutrient TMDL
 Spring Lake Upper Prior Lake Nutrient TMDL Prepared for Prior Lake-Spring Lake Watershed District Minnesota Pollution Control Agency May 2011 Spring Lake Upper Prior Lake Nutrient TMDL Wenck File #1242-53
Rice Lake Excess Nutrient TMDL
 Rice Lake Excess Nutrient TMDL Prepared for North Fork Crow River Watershed District April 2012 Rice Lake Nutrient TMDL Report Wenck File #1878-03 Prepared for: NORTH FORK CROW RIVER WATERSHED DISTRICT
City of Stillwater Lake Management Plans. Lily Lake McKusick Lake. Wenck File # Prepared for:
 City of Stillwater Lake Management Plans Lily Lake McKusick Lake Wenck File #1848-01 Prepared for: City of Stillwater Brown s Creek Watershed District Prepared by: WENCK ASSOCIATES, INC. 1800 Pioneer Creek
Welcome. Thank you for joining us! Lower Mississippi River Watershed Management Organization
 Welcome. Thank you for joining us! Lower Mississippi River Watershed Management Organization Lower Mississippi River Watershed Management Organization Watershed Restoration and Protection (WRAP) Study
Portage Lake Hubbard County
 Prepared in cooperation with the Minnesota Department of Natural Resources Minnesota Lake ID: 9- Area: acres Watershed Area: 6,7 acres Ecoregion: Northern Lakes and Forests (NLF) Portage Lake Hubbard County
8 LITTLE CROSBY LAKE RESULTS
 8 LITTLE CROSBY LAKE RESULTS 8.1 LITTLE CROSBY LAKE BACKGROUND Figure 8-1: View of the south shoreline of. is 8 acres with an average depth of 7 ft and a maximum depth of 34 ft. Little Crosby Lake is a
Wakefield Lake TMDL Public Meeting 3/17/2014. Jen Koehler, PE Barr Engineering
 Wakefield Lake TMDL Public Meeting 3/17/2014 Jen Koehler, PE Barr Engineering Outline Project Contacts Introduction to Wakefield Lake Thoughts/Questions/Concerns About TMDL Studies Lake Water Quality and
Prepared by: Capitol Region Watershed District and Emmons & Olivier Resources, Inc. DRAFT Como Lake TMDL. February 22, water ecology community
 Prepared by: Capitol Region Watershed District and Emmons & Olivier Resources, Inc. DRAFT February 22, 2010 water ecology community Cover Image Como Lake Document Component Specs Text: Corporate Express
Schmidt, Pomerleau and Bass Lakes Nutrient TMDL Five Year Review
 WENCK File #B1240-0186 July 2017 Schmidt, Pomerleau and Bass Lakes Nutrient TMDL Five Year Review Prepared for: Shingle Creek Watershed Management Commission 3235 Fernbrook Lane Plymouth, MN 55447 shinglecreek.org
Clearwater River Watershed District
 Clearwater River Watershed District Five Lakes Nutrient TMDL for: Lake Caroline Lake Augusta Albion Lake Henshaw Lake Swartout Lake Prepared for Clearwater River Watershed District August 2010 Clearwater
Twin and Ryan Lakes Nutrient TMDL
 Twin and Ryan Lakes Nutrient TMDL Prepared for Shingle Creek Watershed Management Commission Minnesota Pollution Control Agency August 2007 Wq-iw8-05b Twin and Ryan Lakes Nutrient TMDL Wenck File #1240
CLMP+ Report on Grass Lake (Anoka County) Lake ID# CLMP+ Data Summary
 Lake ID# CLMP+ Data Summary") CLMP+ Report on Grass Lake (Anoka County) Lake ID# 02-0113-00 2012-2013 CLMP+ Data Summary October 2014 Authors Shannon Martin, MPCA Editing and graphic design Public Information Office Staff The (MPCA)
CLMP+ Report on Grass Lake (Anoka County) Lake ID# 02-0113-00 2012-2013 CLMP+ Data Summary October 2014 Authors Shannon Martin, MPCA Editing and graphic design Public Information Office Staff The (MPCA)
2016 Monitoring Report; Mississippi River Tributaries
 2016 Monitoring Report; Mississippi River Tributaries SWWD s East Mississippi watershed (Map 1) is named after the former East Mississippi Watershed Management Organization which managed the area prior
Final TMDL Implementation Plan. Prepared for Minnesota Pollution Control Agency
 Wirth Lake Final TMDL Implementation Plan Prepared for Minnesota Pollution Control Agency September 2010 4700 West 77 th Street Minneapolis, MN 55435-4803 Phone: (952) 832-2600 Fax: (952) 832-2601 wq-iw11-03c
Red Rock Lake: A Path Forward
 University of Minnesota Morris Digital Well University of Minnesota Morris Digital Well Center for Small Towns 6-2016 Red Rock Lake: A Path Forward Colette Millard Student - University of Minnesota, Morris
Twin Lake. Lake Status Report. Prepared for Ramsey-Washington Metro Watershed District. April 2007
 Twin Status Report Prepared for Ramsey-Washington Metro Watershed District April 2007 4700 West 77 th Street Minneapolis, MN 55435-4803 Phone: (952) 832-2600 Fax: (952) 832-2601 Twin Status Report Table
Northern Chain of Lakes
 Northern Chain of Lakes Presented by Pat Conrad and Joe Pallardy on behalf of the Brown s Creek Watershed District Board of Managers w a t e r I e c o l o g y I c o m m u n i t y Lake by Lake Analysis
Carver County Burandt Lake Excess Nutrients TMDL Report Final
 Carver County Burandt Lake Excess Nutrients TMDL Report Final Prepared by: Carver County Land and Water Services Government Center, Administration Building 600 East Fourth Street (952) 361-1820 In cooperation
Portage Lake CASS COUNTY
 Portage Lake 11-0204-00 CASS COUNTY Summary Portage Lake is located near Bena, MN in Cass County. It covers 1,539 acres, which places it in the upper 10% of lakes in Minnesota in terms of size. Portage
Platte Lake CROW WING & MORRISON COUNTIES
 Platte Lake 18-088-00 CROW WING & MORRISON COUNTIES Summary Platte Lake is located in Crow Wing and Morrison Counties of north-central Minnesota, six miles northeast of the town of Harding at the north
Itasca Soil and Water Conservation District
 Itasca Soil and Water Conservation District Lake Nutrient TMDL for Jessie Lake Prepared by: WENCK ASSOCIATES, INC. 1800 Pioneer Creek Center P.O. Box 249 Maple Plain, Minnesota 55359-0249 (763) 479-4200
CLMP+ Report on Fleming Lake (Aitkin County)
") CLMP+ Report on Fleming Lake (Aitkin County) Lake ID# -5-5-6 CLMP+ Data Summary July 7 Authors Shannon Martin Contributors/acknowledgements Terry Dahlberg Sandy Dahlberg Pam Anderson For questions regarding
CLMP+ Report on Fleming Lake (Aitkin County) Lake ID# -5-5-6 CLMP+ Data Summary July 7 Authors Shannon Martin Contributors/acknowledgements Terry Dahlberg Sandy Dahlberg Pam Anderson For questions regarding
Boy Lake CASS COUNTY
 Boy Lake 11-143- CASS COUNTY Summary Boy Lake is located near Remer, MN in Cass County. It covers 3,452 acres, which places it in the upper 1% of lakes in Minnesota in terms of size. Boy Lake has two main
Cedar Island, Pike, and Eagle Lakes Nutrient TMDL Implementation Plan
 Cedar Island, Pike, and Eagle Lakes Nutrient TMDL Implementation Plan Wenck File #1240-76 Prepared for: SHINGLE CREEK WATERSHED MANAGEMENT COMMISSION MINNESOTA POLLUTION CONTROL AGENCY Prepared by: May
Pine Lake ( ) Aquatic Vegetation Survey
 Aquatic Vegetation Survey") Pine Lake (15-0149-00) Aquatic Vegetation Survey 22796 County Highway 6 Detroit Lakes, MN 56501 (218) 846-1465 www.rmbel.info Lake: Pine Lake DOW Number: 15-0149-00 Date of inspection: 6/30, 7/2/ 2015
Pine Lake (15-0149-00) Aquatic Vegetation Survey 22796 County Highway 6 Detroit Lakes, MN 56501 (218) 846-1465 www.rmbel.info Lake: Pine Lake DOW Number: 15-0149-00 Date of inspection: 6/30, 7/2/ 2015
Lake Susan Use Attainability Assessment (UAA) Update
 Update") Wenck File #3057-01 JULY 2013 Lake Susan Use Attainability Assessment (UAA) Update Prepared for: RILEY PURGATORY BLUFF CREEK WATERSHED DISTRICT Prepared by: WENCK ASSOCIATES, INC. 1800 Pioneer Creek Center
Wenck File #3057-01 JULY 2013 Lake Susan Use Attainability Assessment (UAA) Update Prepared for: RILEY PURGATORY BLUFF CREEK WATERSHED DISTRICT Prepared by: WENCK ASSOCIATES, INC. 1800 Pioneer Creek Center
Gull Lake CASS & CROW WING COUNTIES
 Gull Lake 11-0305-00 CASS & CROW WING COUNTIES Summary Gull Lake is located just northwest of Brainerd, Minnesota, on the border of Cass and Crow Wing Counties. It covers 9,947 acres, which places it in
Draft: Peltier Lake and Centerville Lake TMDL
 Prepared by: Emmons & Olivier Resources, Inc. for the Minnesota Pollution Control Agency Draft: Peltier Lake and Centerville Lake TMDL November 2011 water ecology community TMDL Summary Table EPA/MPCA
Lomond Lake ( ) Aquatic Vegetation Survey
 Aquatic Vegetation Survey") Lomond Lake (15-0081-00) Aquatic Vegetation Survey 22796 County Highway 6 Detroit Lakes, MN 56501 (218) 846-1465 www.rmbel.info Lake: Lomond Lake DOW Number: 15-0081-00 Date of inspection: 7/13/ 2015 County:
Lomond Lake (15-0081-00) Aquatic Vegetation Survey 22796 County Highway 6 Detroit Lakes, MN 56501 (218) 846-1465 www.rmbel.info Lake: Lomond Lake DOW Number: 15-0081-00 Date of inspection: 7/13/ 2015 County:
VADNAIS LAKE AREA WATER MANAGEMENT ORGANIZATION Sustainable Lake Management Plan Charley Lake, Ramsey County, MN
 VADNAIS LAKE AREA WATER MANAGEMENT ORGANIZATION Sustainable Lake Management Plan Charley Lake, Ramsey County, MN Prepared by Kristine Jenson, Tyler Thompson, and Dawn Tanner December 2018 VADNAIS LAKE
Long and Farquar Lakes Nutrient TMDL. Prepared for City of Apple Valley and MPCA by Bonestroo
 Vermillion River Watershed Joint Powers Organization Long and Farquar Lakes Nutrient TMDL Prepared for City of Apple Valley and MPCA by Bonestroo Bonestroo 2335 Highway 36 W St. Paul, MN 55113 in partnership
Christmas Lake Milfoil Weevil Stocking Program: Aquatic Plant Evaluation for 2012
 Eurasian Watermilfoil in an Area Stocked with Weevils in Christmas Lake, 2012 Christmas Lake Milfoil Weevil Stocking Program: Aquatic Plant Evaluation for 2012 Survey Dates: Pre-Weevil Survey: May 23,
Movil Lake BELTRAMI COUNTY
 Movil Lake 04-0152-00 -BELTRAMI COUNTY Lake Water Quality Summary Movil Lake is located 8 miles north of Bemidji, MN in Beltrami County. It is an irregular shaped lake covering 853 acres with a maximum
Comparative Analysis of Minnesota Lakes Treated with Alum to Inform Spring Lake Treatment
 Comparative Analysis of Minnesota Lakes Treated with Alum to Inform Spring Lake Treatment Prepared for the Prior Lake Spring Lake Watershed District (PLSLWD) April 23, 2013 Comparative Analysis of Minnesota
Hadlock Pond, Washington Co., Lake Hadlock Association, Inc.
 Hadlock Pond, Washington Co., Lake Hadlock Association, Inc. Lake Characteristics Watershed Characteristics Surface Area (ac/ha) Max Depth (ft/m) Mean Depth (ft/m) Retention Time (years) Water Class Dam
Long Lake ( ) Aquatic Vegetation Survey
 Aquatic Vegetation Survey") Long Lake (15-0057-00) Aquatic Vegetation Survey 22796 County Highway 6 Detroit Lakes, MN 56501 (218) 846-1465 www.rmbel.info Lake: Long Lake DOW Number: 15-0057-00 Date of inspection: 7/14/ 2015 County:
Long Lake (15-0057-00) Aquatic Vegetation Survey 22796 County Highway 6 Detroit Lakes, MN 56501 (218) 846-1465 www.rmbel.info Lake: Long Lake DOW Number: 15-0057-00 Date of inspection: 7/14/ 2015 County:
BIG ROCHE A CRI LAKE CHARACTERISTICS
 BIG ROCHE A CRI LAKE CHARACTERISTICS Lake Description Big Roche Cri Lake is located in north central Adams County and has a surface area of 205 acres, a shoreline length of 6.1 mile, a volume of 6,993
Clearwater Lake CLEARWATER / BELTRAMI COUNTY
 Clearwater Lake 04-0343-00 CLEARWATER / BELTRAMI COUNTY Lake Water Quality Summary Clearwater Lake is located on the border of Clearwater and Beltrami Counties, 16.5 miles northeast of the city of Bagley.
Lower Hay Lake CROW WING COUNTY
 Lower Hay Lake 18-378- CROW WING COUNTY Lake Water Quality Summary Lower Hay Lake is located 2 miles northeast of Jenkins, MN in Crow Wing County. It has a rounded shape and covers 693 acres. Lower Hay
Upper Cullen CROW WING COUNTY
 Upper Cullen 18-0376-00 CROW WING COUNTY Lake Water Quality Summary Upper Cullen Lake is located 3 miles southeast of Pequot Lakes, MN in Crow Wing County. It is an irregular shaped lake covering 435 acres
Appendix A. General Concepts in Lake Water Quality. Black Dog WMO Watershed Management Plan P:\23\19\513\plan\Black Dog WMO adopted plan.
 Appendix A General Concepts in Lake Water Quality Black Dog WMO Watershed Management Plan P:\23\19\513\plan\Black Dog WMO adopted plan.doc General Concepts in Lake Water Quality There are a number of concepts
Please join us to learn the results of the project!!
 Wirth Lake Excess Nutrients TMDL Public Notice Meeting When: June 24 th, 5:30 p.m. 7:00 p.m. Where: Theodore Wirth Park, Wirth Golf Chalet, 1339 Theodore Wirth Pkwy. Minneapolis, MN 55411 Why: The Minnesota
Big Trout Lake CROW WING COUNTY
 Big Trout Lake 18-0315-00 CROW WING COUNTY Lake Water Quality Summary Big Trout Lake is located just east of Pine River, Minnesota. It covers 1,363 acres, which places it in the upper 10% of lakes in Minnesota
Lida Lakes & OTTER TAIL COUNTY
 Lida Lakes 56-747-1 & 56-747-2 OTTER TAIL COUNTY Lake Water Quality Summary Lake Lida is located 5 miles east of Pelican Rapids, MN in Otter Tail County. It is a long lake with a large northern bay and
Benton Lake Excess Nutrients TMDL Report
 Benton Lake Excess Nutrients TMDL Report April 2013 Prepared by: Carver County Land and Water Services Government Center, Administration Building 600 East Fourth Street Chaska, Minnesota 55318 (952) 361-1820
Lake Emily CROW WING COUNTY
 Lake Emily 18-0203-00 CROW WING COUNTY Lake Water Quality Summary Lake Emily is located on the eastern edge of the City of Emily, MN in Crow Wing County. It is a shallow lake that covers 720 acres and
Comfort Lake-Forest Lake Watershed District Six Lakes Total Maximum Daily Load Implementation Plan
 Prepared by: for the Comfort Lake-Forest Lake Watershed District and the Minnesota Pollution Control Agency Comfort Lake-Forest Lake Watershed District Six Lakes Total Maximum Daily Load February 16, 2010
Resource Conservation Opportunities and Management Guidelines
 Resource Conservation Opportunities and Management Guidelines The general ecosystem integrity of lakes is dependent on preserving natural habitat components and the processes that sustain them. These include
West Leaf Lake DNR ID:
 East Otter Tail County Water Quality Factsheet West Leaf Lake DNR ID: 56-0114-00 Vitals Physical Characteristics MN Lake ID: 56-0114-00 Surface area (acres): 700 Zoning Authority: Ottertail Littoral area
Fish Lake; Echo Bay ( ) Aquatic Vegetation Survey
 Aquatic Vegetation Survey") Fish Lake; Echo Bay (56-0768-00) Aquatic Vegetation Survey 22796 County Highway 6 Detroit Lakes, MN 56501 (218) 846-1465 www.rmbel.info Lake: Fish Lake; Echo Bay DOW Number: 56-0768-00 Date of inspection:
Fish Lake; Echo Bay (56-0768-00) Aquatic Vegetation Survey 22796 County Highway 6 Detroit Lakes, MN 56501 (218) 846-1465 www.rmbel.info Lake: Fish Lake; Echo Bay DOW Number: 56-0768-00 Date of inspection:
Dead Lake DNR ID:
 East Otter Tail County Water Quality Factsheet Dead Lake DNR ID: 56-0383-00 Vitals Physical Characteristics MN Lake ID: 56-0383-00 Surface area (acres): 7,567 Zoning Authority: The City of Perham Littoral
Franklin Lake OTTER TAIL COUNTY
 Franklin Lake 56-759- OTTER TAIL COUNTY Lake Water Quality Summary Franklin Lake is located about 1 miles northeast of Pelican Rapids, MN in Otter Tail County. It is a long and narrow lake covering 1,88
Lower Cullen Lake CROW WING COUNTY
 Lower Cullen Lake 18-0403-00 CROW WING COUNTY Lake Water Quality Summary Lower Cullen Lake is located on the north side of Nisswa, MN in Crow Wing County. It is a relatively round lake with smooth shorelines.
Little Turtle Lake BELTRAMI COUNTY
 Little Turtle Lake 04-0155-00-BELTRAMI COUNTY Lake Water Quality Summary Little Turtle Lake is located 10 miles north of Bemidji, MN in Beltrami County. It is an irregular-shaped shallow lake covering
Upper Hay Lake CROW WING COUNTY
 Upper Hay Lake 18-0412-00 CROW WING COUNTY Lake Water Quality Summary Upper Hay Lake is located 1 mile east of Jenkins, MN in Crow Wing County. It is a round lake with a total surface area of 596 acres.
Wirth Lake Excess Nutrients Total Maximum Daily Load Report
 Wirth Lake Excess Nutrients Total Maximum Daily Load Report Prepared for Minnesota Pollution Control Agency September 2010 wq-iw11-03e Wirth Lake Total Maximum Daily Load Report Prepared for Minnesota
Powers Lake Management Plan Washington County, MN
 Guy Rose: (River Epte, Giverny), 1904-12 Powers Lake Management Plan Washington County, MN March 2000 Prepared for: South Washington Watershed District Prepared by: Bonestroo, Rosene, Anderlik and Associates
Welcome. Thank you for joining us!
 Welcome. Thank you for joining us! Watershed Restoration and Protection Strategy (WRAPS) Study Implementation Workshop June 24, 2014 Lower Mississippi River Watershed Management Organization Tonight s
Daggett Lake CROW WING COUNTY
 Daggett Lake 18-271- CROW WING COUNTY Lake Water Quality Summary Daggett Lake is located 2 miles north of Cross Lake, MN in Crow Wing County. It is a long lake covering 231 acres (Table 1). Daggett Lake
Round Lake CROW WING COUNTY
 Round Lake 18-0373-00 CROW WING COUNTY Lake Water Quality Summary Round Lake is located 5 miles north of Brainerd, MN in Crow Wing County. It has a rounded shape, as the name implies, and covers 1,650
Clam Lakes (Lower & Upper), Burnett County Four-Phased Lake Management Planning Project Description
, Burnett County Four-Phased Lake Management Planning Project Description") 1 Clam Lakes (Lower & Upper), Burnett County Four-Phased Lake Management Planning Project Description Lake and Watershed Characteristics The Clam Lakes are a combined 1544 acres with Upper Clam Lake essentially
1 Clam Lakes (Lower & Upper), Burnett County Four-Phased Lake Management Planning Project Description Lake and Watershed Characteristics The Clam Lakes are a combined 1544 acres with Upper Clam Lake essentially
Lake Hubert CROW WING COUNTY
 Lake Hubert 18-0375-00 CROW WING COUNTY Lake Water Quality Summary Lake Hubert is located two miles southeast of Nisswa, Minnesota, in Crow Wing County. It is oval-shaped and covers 1,287 acres. According
Lake restoration can be a frustrating
 Success Stories Restoring Water Quality in Bald Eagle Lake, Minnesota Joe Bischoff, Matt Kocian, Brian Beck, and William F. James Using adaptive watershed and lake management Introduction Lake restoration
Mayflower Lake Management Planning Committee UWSP Center for Watershed Science and Education Marathon County Wisconsin Department of Natural
 Mayflower Lake Management Planning Committee UWSP Center for Watershed Science and Education Marathon County Wisconsin Department of Natural Resources Reduces conflicts Addresses problems Allows for proactive
Little Pine Lake DNR ID:
 East Otter Tail County Water Quality Factsheet Little Pine Lake DNR ID: 56-0142-00 Vitals Physical Characteristics MN Lake ID: 56-0142-00 Surface area (acres): 2,080 Zoning Authority: The City of Perham
Chapter 2. Watershed Characteristics
 Chapter 2. Watershed Characteristics The Pelican Lakes are glacial lakes formed during the last retreat of the Red River Lobe starting about 13,000 years ago. The soils deposited by the glacier are primarily
ÆÕ 65. Sullivan Lake Monitoring Report Æÿ Monitoring Sites. MWMO Watershed Bulletin: Lake Levels Lake Water Quality
 Sullivan Lake Monitoring Report 2013 "S Mississippi River æº 2013 Monitoring Sites æº Lake Levels Lake Water Quality ÆÕ 65 Sullivan Lake æº Æÿ65 MWMO Watershed Bulletin: 2014-4 ÆÕ 65 Sullivan Lake Monitoring
4. What is Item A called? a. Eckman dredge b. Secchi disk c. Van Dorn sampler d. Ponar sampler
 Envirothon Questions for AQUATICS station April 24, 2013 1. Eutrophication often results in large fish kills. What is the major cause of these fish kills? a. Oxygen has been depleted due to the decay of
Big Chetac Lake Getting Rid of the Green Phase 3. Nutrient Budget and Management Data Analysis Report
 Big Chetac Lake Getting Rid of the Green Phase 3 Nutrient Budget and Management Data Analysis Report Prepared for: Big Chetac Chain Lake Association and Wisconsin Department of Natural Resources Prepared
Lake Ossawinnamakee CROW WING COUNTY
 Lake Ossawinnamakee 18-0352-00 CROW WING COUNTY Lake Water Quality Summary Lake Ossawinnamakee is located by Breezy Point, MN in Crow Wing County. It is an elongated L shape basin that covers 689 acres
Chapter 3. Lake Assessments
 Chapter 3. Lake Assessments Introduction The Pelican Group of Lakes encompasses 4 lakes: Pelican, Little Pelican, Bass, and Fish. Although these lakes have somewhat different characteristics, they are
Gull Lake CASS & CROW WING COUNTIES
 Gull Lake 11-0305-00 CASS & CROW WING COUNTIES Lake Water Quality Summary Gull Lake is located just northwest of Brainerd, Minnesota, on the border of Cass and Crow Wing Counties. It covers 9,947 acres,
Loon Lake ITASCA COUNTY
 Loon Lake 31-571- ITASCA COUNTY Lake Water Quality Summary Loon Lake is located 5 miles west of Grand Rapids, MN in Itasca County. It is a long lake covering 231 acres (Table 1). Loon Lake has one inlet
Prairie Lake OTTER TAIL COUNTY
 Prairie Lake 56-0915-00 OTTER TAIL COUNTY Lake Water Quality Summary Prairie Lake is located less than one mile north of Pelican Rapids, MN in northwestern Otter Tail County. It covers 1,004 acres and
Whitefish Lake CROW WING COUNTY
 Lake 18-0310-00 CROW WING COUNTY Lake Water Quality Summary Lake is located just east of Pine River, Minnesota. It covers 7,715 acres, which places it in the upper 5% of lakes in Minnesota in terms of
Big McDonald Lake OTTER TAIL COUNTY
 Big McDonald Lake 56-0386-01 OTTER TAIL COUNTY Lake Water Quality Summary Big McDonald Lake is located 6 miles northwest of Dent, MN in Otter Tail County. It is a long and narrow lake covering 992 acres
Blackduck Lake BELTRAMI COUNTY
 Blackduck Lake 04-0069-00-BELTRAMI COUNTY Lake Water Quality Summary Blackduck Lake is located 2 miles west of Blackduck, MN in Beltrami County. It covers 2,685 acres, which places it in the upper 10%
Aquatic Plant Point-Intercept Survey for Forest Lake, Washington County, 2013
 Example of Aquatic Plants sampled in July 2013 on Forest Lake Aquatic Plant Point-Intercept Survey for Forest Lake, Washington County, 2013 Point-Intercept Aquatic Plant Survey: July 11 and 12, 2013 Prepared
Lake Blanche OTTER TAIL COUNTY
 Lake Blanche 56-24- OTTER TAIL COUNTY Lake Water Quality Summary Lake Blanche is located 7 miles south of Otter tail, MN in Otter tail County. It is a round lake covering 1,314 acres (Table 1). Lake Blanche
Upper South Long Lake CROW WING COUNTY
 Upper South Long Lake 18-0096-00 CROW WING COUNTY Lake Water Quality Summary Upper South Long Lake is located 6 miles southeast of Brainerd, MN in Crow Wing County. It has an oblong shape, orientated southwest
Rose Lake OTTER TAIL COUNTY
 Rose Lake 56-36- OTTER TAIL COUNTY Lake Water Quality Summary Rose Lake is located 2 miles northeast of Vergas, MN in OtterTail County. It is an L-shaped lake covering 1,2 acres (Table 1). Rose Lake has
West Battle Lake. Aquatic Vegetation Survey County Highway 6 Detroit Lakes, MN (218)
") West Battle Lake Aquatic Vegetation Survey 2017 22796 County Highway 6 Detroit Lakes, MN 56501 (218) 846-1465 www.rmbel.info Lake: West Battle DOW Number: 56-0239-00 Date of inspection: June 26-29, 2017
West Battle Lake Aquatic Vegetation Survey 2017 22796 County Highway 6 Detroit Lakes, MN 56501 (218) 846-1465 www.rmbel.info Lake: West Battle DOW Number: 56-0239-00 Date of inspection: June 26-29, 2017
North Long Lake CROW WING COUNTY
 North Long Lake 18-0372-00 CROW WING COUNTY Lake Water Quality Summary North Long Lake is located about eight miles north of Brainerd in Crow Wing County. It covers 6,143 acres, which places it in the
Crow Wing Lake. Lake Water Quality Summary CROW WING COUNTY. Location Data. Physical Characteristics. Data Availability
 Crow Wing Lake 18-155- CROW WING COUNTY Lake Water Quality Summary Crow Wing Lake is located 1 miles south of Baxter, MN in Crow Wing County. It covers 373 acres (Table 1). Crow Wing Lake has two inlets
Serpent Lake CROW WING COUNTY
 Serpent Lake 18-9- CROW WING COUNTY Lake Water Quality Summary Serpent Lake is located at Crosby and Deerwood, Minnesota, in Crow Wing County. It covers 1,13 acres, which places it in the upper 1% of lakes
Lake Washington. Water Quality Assessment Report. Copyright 2012 PLM Lake & Land Management Corp.
 Lake Washington 2012 Water Quality Assessment Report Copyright 2012 PLM Lake & Land Management Corp. Water Quality Report On May 22nd, June 18th, July 30th, August 29th, and September 27 th, 2012, PLM
Powers Lake, Woodbury February 16, 2011
 1.0 INTRODUCTION Powers Lake is an approximately 50-acre lake located in the City of Woodbury within southern Washington County. Washington County is located within the Minneapolis-St. Paul metropolitan
Big Sand Lake HUBBARD COUNTY
 Big Sand Lake 29-0185-00 HUBBARD COUNTY Lake Water Quality Summary Big Sand Lake is located eight miles northeast of Park Rapids, Minnesota. It covers 1,659 acres and has a mostly round shape. Big Sand
Minnesota Department of Natural Resources. Aquatic Plant Management Program
 Minnesota epartment of Natural Resources Aquatic Plant Management Program The Goal of the MN NR s Aquatic Plant Management Program-APM Protect & enhance Minnesota s aquatic resources, while allowing lakeshore
Burnt Shanty Lake ITASCA COUNTY
 Burnt Shanty Lake 31-424- ITASCA COUNTY Lake Water Quality Summary Burnt Shanty Lake is located 23 miles north of Grand Rapids, MN in Itasca County. It is a small lake covering 198 acres (Table 1). Burnt
Pelican Lake CROW WING COUNTY
 Pelican Lake 18-0308-00 CROW WING COUNTY Lake Water Quality Summary Pelican Lake is located six miles east of Pequot Lakes, Minnesota, in Crow Wing County. It covers 8,367 acres, which places it in the
DECISION DOCUMENT FOR THE WIRTH LAKE PHOSPHORUS TMDL, HENNEPIN COUNTY, MN
 TMDL: Wirth Lake, Hennepin County, MN Date: October 25, 2010 DECISION DOCUMENT FOR THE WIRTH LAKE PHOSPHORUS TMDL, HENNEPIN COUNTY, MN Section 303(d) of the Clean Water Act (CWA) and EPA s implementing
2012 Lake Vegetation Summary Lake Sarah (Hennepin County)
") 2012 Lake Vegetation Summary Lake Sarah (Hennepin County) Introduction Lake Sarah is a 561 acre lake located near the town of Rockford in Hennepin County. It has a littoral area of 373 acres, and is dominated
2012 Lake Vegetation Summary Lake Sarah (Hennepin County) Introduction Lake Sarah is a 561 acre lake located near the town of Rockford in Hennepin County. It has a littoral area of 373 acres, and is dominated
Clitherall Lake DNR ID:
 East Otter Tail County Water Quality Factsheet Clitherall Lake DNR ID: 56-0238-00 Vitals Physical Characteristics MN Lake ID: 56-0238-00 Surface area (acres): 4,540 Zoning Authority: Fergus Falls Littoral
Julia Lake BELTRAMI COUNTY
 Julia Lake 04-0166-00 BELTRAMI COUNTY Lake Water Quality Summary Julia Lake is located 12.8 miles north of Bemidji, MN in Beltrami County. It is an irregularly-shaped lake covering 511 acres (Table 1).
Typo Lake and Martin Lake TMDL
 February 2012 Prepared by: Jamie Schurbon, Water Resource Specialist Anoka Conservation District Minnesota Pollution Control Agency Emmons & Olivier Resources Inc. wq-iw6-08e Project dollars provided by
U.S. Geological Survey s Update on the Water Quality of Delavan Lake
 Memo to: Town of Delavan Lake Committee Date: February 2, 2013 From: Ryan Simons, Town of Delavan Lake Committee Chairman Subject: U.S. Geological Survey s Update on the Water Quality of Delavan Lake On