Identifying Energy Savings in Industrial Plants using DOE s QuickPEP
|
|
|
- Buck Stewart
- 5 years ago
- Views:
Transcription

1 Identifying Energy Savings in Industrial Plants using DOE s QuickPEP Riyaz Papar, PE, CEM Director, Energy Assets & Optimization Hudson Technologies Company August 09, 2007

2 Introduction to Texas Industries of the Future Initiated in 2001 with Advisory Board representing Industry and Academia Located at the University of Texas, Center for Energy and Environmental Resources Funded by Department of Energy and SECO-extensive leveraging of federal resources Focus on industrial energy efficiency, providing training, tools, Active Chemical and Refining Sector Advisory Committee
3 Training, Conferences and Forums Waste Heat Recovery Workshop. Aug. 15, 2-4 pm. Baytown. Motors End User Training. Sept. 12, DFW Waste Heat to Power Conference, Sept 25, Houston Pump Systems End User Training, Late October, Houston Process Heating Systems End User Training, Oct. 31, Baytown. Texas Industrial Energy Management Forum, Nov. 1, Houston.
4 Agenda How to get the big picture in an industrial plant Basic functionality & use of the QuickPEP tool QuickPEP software demonstration Q & A Summary & Conclusions

5 Corporate Report
6 How to get the Big Picture in an Industrial Plant? Looking at the forest first Understanding the plant from an energy supply & demand perspective Different supply streams Different energy consumption (conversion) systems Puts everything down on one piece of paper Limited resources Time major constraint Available information Do you believe it?
7 US Department of Energy s QuickPEP Tool Quick Plant Energy Profiler Tool Website
8 Introduction & Background US Department of Energy (DOE) & Industry Partnerships Identifying key customer needs & how DOE can help One of the conclusions Ability to profile a plant s energy An independent, easy-to-use tool to identify energy savings opportunities in plants Led to meetings to sketch the framework of the model Specifications Software platform Significant industry participation at different levels in beta testing Originally, developed for the Chemical industry (ChemPEP) Completed development for several industries
9 Industrial Sectors in QuickPEP NAICS No. Industry 325 Chemicals 321,322 Forest Products Petroleum Refining Integrated Steel 311,312 Food and Beverage 212 Coal, Metal Ore etc Aluminum and Alumina 336 Transportation Equipment 332 Fabricated Metals 334,335 Comp. Electronics and Appl. 326 Plastics and Rubber Products EAF Steel 313,314,315,316 Textiles Cement 333 Heavy Machinery 3272 Glass and Glass Products 3315 Foundries


10

11 INPUTS Plant description Utility supply data electricity, fuel & steam Energy consuming system information Scorecard responses QuickPEP Tool OUTPUTS Overall picture of plant energy use Summary of energy cost distributions Preliminary assessment & comparison Areas for energy efficiency improvement Energy cost reduction potential
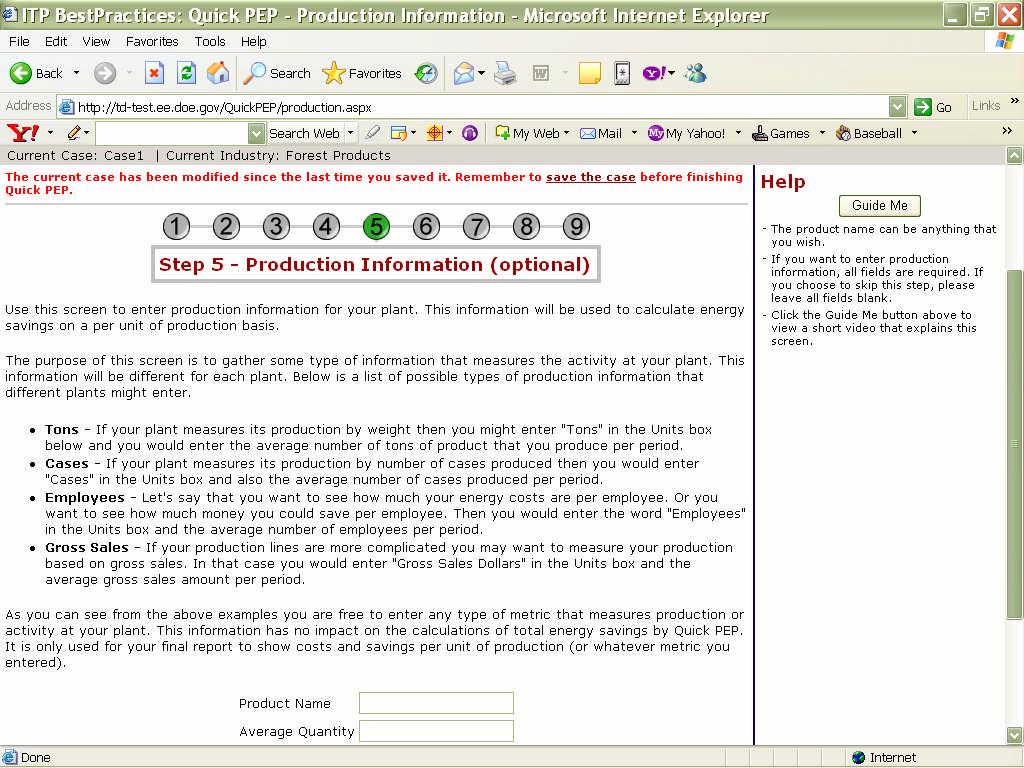
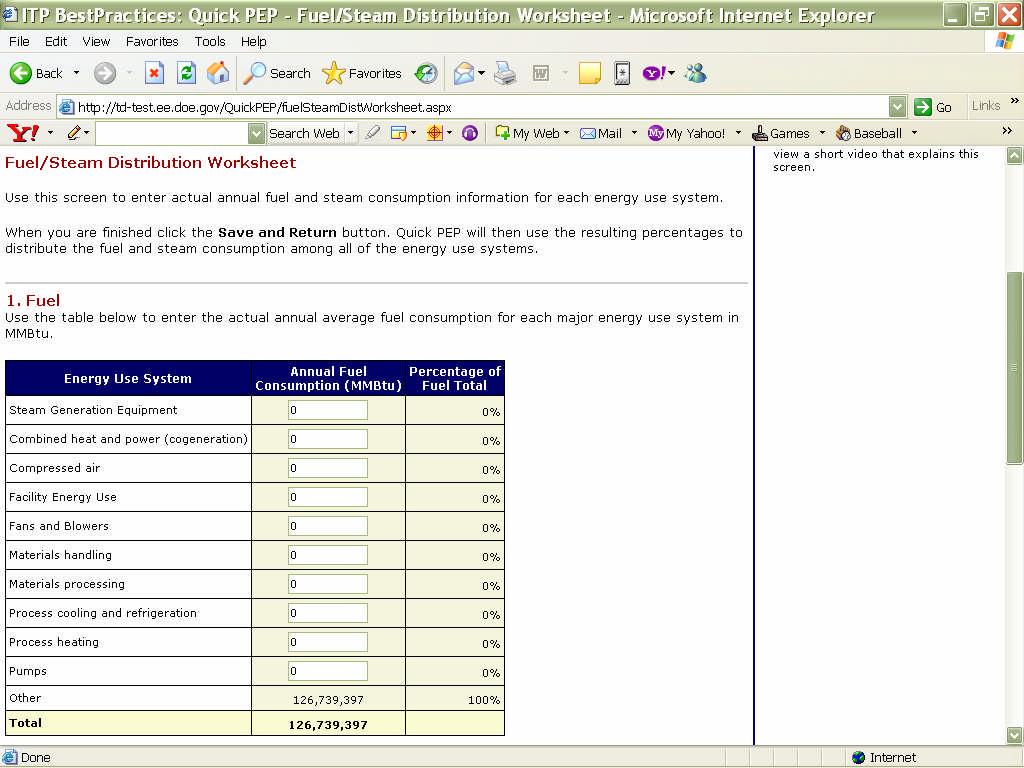
12 Input Data Options Supply information Average utility information Actual utility bill information (worksheet) Energy consuming systems Typical systems for that industry selected User checked only Energy consumption (Demand) information Average distributions for that industry selected User can change the distributions User can input actual energy consumption information, if available
13 Input Data Options Energy consuming system assessment for potential energy savings opportunities Radio-button selection User can complete a detailed score-card for a system
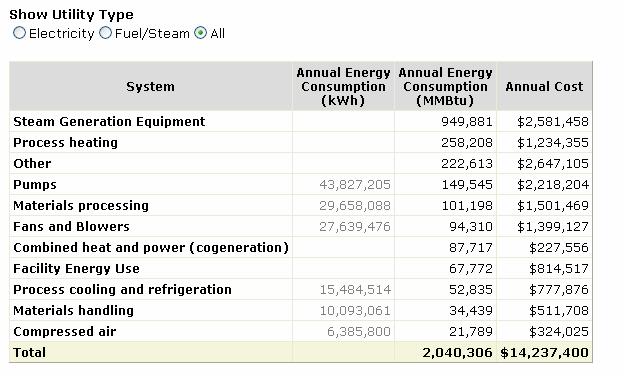
14 Output Data Case information Annual energy purchases: Graphical & Tabulated Annual energy consumption: Graphical & Tabulated Annual potential energy savings: Graphical & Tabulated Suggested next steps w/hyperlinks for each energy system
15 Formats On screen display pdf file qpep file Output Data Options Tabulated results in energy (MMBtu) and cost ($) Graphical results can be displayed in either energy or cost units
16 QuickPEP Software Demonstration Base case Very simple average values Use default distributions Single answer scorecards Actual utility and system information Multiple fuel streams, monthly information On-site cogeneration Complete worksheets Complete scorecards

17

18

19

20

21

22
23

24

25

26
27

28

29

30

31


32

33
34 QuickPEP Tool Results Establish Baselines SSST/SSAT SSST/SSAT 3E+ 3E+ QuickPEP QuickPEPTool Tool NXEAT NXEAT Identify Energy Savings PHAST PHAST PSAT PSAT Opportunities By System FSAT FSAT CHP Tool CHP Tool AirMaster+ AirMaster+ Help/References MotorMaster+ MotorMaster+ CWSAT CWSAT
35 Summary & Conclusions Use a top-down approach at an industrial plant with QuickPEP as a starting point to: Understand energy flow Identify cost impacts Identify potential energy cost reduction project areas Baseline plants at a corporate level Baseline individual systems at the plant level Monitor performance over a period of time
36 Summary & Conclusions Prioritize different energy systems based on energy savings potential and undertake an ESA on each of those systems Continue further due diligence to implement energy savings and performance improvement projects
37 Questions & Answers
Save Energy Now Tools and Resources
 Save Energy Now Tools and Resources SPEAKER: BILL ORTHWEIN, CEM Technology Manager Industrial Technologies Program Office of Energy Efficiency and Renewable Energy U.S. Department of Energy U.S. Energy
Energy Optimization & Rural Customers
 Energy Optimization & Rural Customers Programs to support rural communities and customers Jay Wrobel, Advanced Manufacturing Office 1 Maximize what you can Manage! 1. Energy Management and Planning 2.
FEDERAL RESERVE statistical release
 FEDERAL RESERVE statistical release G.17 (419) For release at 9:15 a.m. (EDT) August 17, 2017 INDUSTRIAL PRODUCTION AND CAPACITY UTILIZATION Industrial production rose 0.2 percent in July following an
Self-Help Energy Analysis for Your Plant
 Self-Help Energy Analysis for Your Plant Warren M. Heffington, PE, CEM Industrial Assessment Center and Energy Systems Laboratory, Mechanical Engineering Department Texas A&M University College Station,
FEDERAL RESERVE statistical release
 FEDERAL RESERVE statistical release G.17 (419) For release at 9:15 a.m. (EST) January 18, 2019 INDUSTRIAL PRODUCTION AND CAPACITY UTILIZATION Industrial production increased 0.3 percent in December after
Save Energy Now Energy Savings Assessments
 Save Energy Now Energy Savings Assessments Texas Technology Showcase Galveston, Texas December 7, 2006 Bob Gemmer, U.S. Department of Energy Industrial Technologies Program (ITP) Outline Outline of Save
U.S. Manufacturing and Mining
 Use and Loss Analysis U.S. Manufacturing and Mining DRAFT April 2004 Prepared by Energetics, Incorporated For the U.S. Department of Efficiency and Renewable Industrial Technology Programs Table of Contents
Energy Use, Loss and Opportunities Analysis for U.S Manufacturing and Mining
 Use, Loss and Opportunities Analysis for U.S Manufacturing and Mining Joan Pellegrino, Energetics, Incorporated James Quinn, U.S. Department of Arvind Thekdi, E3M, Incorporated Mauricio Justiniano, Energetics,
Business-Facts Summary - Construction and Manufacturing NAICS Summary
 - Construction and NAICS Summary Title Page Title Page Data Version: 2018 Feb (Internal) Report Generation Method: Single Analysis Area: 1789 STATE ST, SAN DIEGO, CA, 92101-2530 Reporting Detail: As Selected
INDUSTRIAL PRODUCTION INDICES IN JULY Figure 1. Industrial Production Indices (2010 = 100)
") INDUSTRIAL PRODUCTION INDICES IN JULY 2017 1 According to the preliminary data the Industrial Production Index 2, seasonally adjusted 3, increased by 0.2% in July 2017 as compared to June 2017. In July
INDUSTRIAL PRODUCTION INDICES IN JULY 2017 1 According to the preliminary data the Industrial Production Index 2, seasonally adjusted 3, increased by 0.2% in July 2017 as compared to June 2017. In July
INDUSTRIAL PRODUCTION INDICES IN OCTOBER
 INDUSTRIAL PRODUCTION INDICES IN OCTOBER 2017 1 According to the preliminary data the Industrial Production Index 2, seasonally adjusted 3, decreased by 0.6% in October 2017 as compared to September 2017.
Industrial Waste Heat Recovery
 Industrial Waste Heat Recovery Industrial Energy RoundTable Kathey Ferland Project Manager Texas Industries of the Future kferland@mail.utexas.edu Riyaz Papar, PE, CEM Director, Energy Assets & Optimization
INDUSTRIAL PRODUCTION INDICES IN FEBRUARY
 INDUSTRIAL PRODUCTION INDICES IN FEBRUARY 2018 1 In compliance with Regulation (EC) 1165/98 and amendment Regulation (EC) 1158/2005 since January 2018 the base year for Short-term business statistics has
INDUSTRIAL PRODUCTION INDICES IN JANUARY
 INDUSTRIAL PRODUCTION INDICES IN JANUARY 2018 1 In compliance with Regulation (EC) 1165/98 and amendment Regulation (EC) 1158/2005 since January 2018 the base year for Short-term business statistics has
Industrial Technologies Program Update
 Industrial Technologies Program Update James Quinn Industrial Technologies Program Energy Efficiency & Renewable Energy U.S. Department of Energy ASERTTI Clean Energy Outlook Meeting Washington, DC February
Energy Outlook: Federal Perspective. Jacques Beaudry-Losique Office of Energy Efficiency and Renewable Energy December 6, 2006
 Energy Outlook: Federal Perspective Jacques Beaudry-Losique Office of Energy Efficiency and Renewable Energy December 6, 2006 Global Energy Challenges National energy security: Global oil and gas reserves
PRESS RELEASE. Industrial Production Price Index
 ROMANIA Press Office 16 Libertăţii Avenue, Sector 5, Bucharest Tel/Fax: 318 18 69; Fax: 312 48 75 e-mail: romstat@insse.ro; biroupresa@insse.ro PRESS RELEASE No. 48 of March 4, 2013 Industrial Production
I. MAIN ECONOMIC INDICATORS OF INDUSTRY
 I. MAIN ECONOMIC INDICATORS OF INDUSTRY MAIN INDICATORS OF INDUSTRY * 1995 Number of establishments 773 1050 1177 1234 1713 1816 2053 Output volume (at current prices), mln. drams 172048.2 261167.6 283484.8
PRESS RELEASE. INDUSTRIAL PRODUCTION INDEX: November 2017, y-o-y increase of 0.8%
 HELLENIC REPUBLIC HELLENIC STATISTICAL AUTHORITY Piraeus, 09 January 2018 PRESS RELEASE INDUSTRIAL PRODUCTION INDEX: November 2017, y-o-y increase of 0.8% The evolution of the Industrial Production (IPI)
INDUSTRIAL PRODUCTION INDICES IN OCTOBER
 INDUSTRIAL PRODUCTION INDICES IN OCTOBER 2015 1 According to the preliminary data the Industrial Production Index 2, seasonally adjusted 3, increased by 0.1% in October 2015 as compared to September 2015.
MONTHLY FULL REPORT ON MANUFACTURERS SHIPMENTS, INVENTORIES AND ORDERS SEPTEMBER 2018
 FOR RELEASE AT 10:00 AM EDT, FRIDAY, NOVEMBER 2, 2018 MONTHLY FULL REPORT ON MANUFACTURERS SHIPMENTS, INVENTORIES AND ORDERS SEPTEMBER 2018 Release Number: CB 18 166 M3 2 (18) 09 November 2, 2018 The U.S.
GOVERNMENT OF INDIA MINISTRY OF STATISTICS AND PROGRAMME IMPLEMENTATION CENTRAL STATISTICS OFFICE New Delhi Dated: September 12, 2018 PRESS RELEASE
 This Press Release is embargoed against publication, telecast or circulation on internet till 5.30 PM 12 th September, 2018. GOVERNMENT OF INDIA MINISTRY OF STATISTICS AND PROGRAMME IMPLEMENTATION CENTRAL
GOVERNMENT OF INDIA MINISTRY OF STATISTICS AND PROGRAMME IMPLEMENTATION CENTRAL STATISTICS OFFICE New Delhi Dated: January 12, 2017 PRESS RELEASE
 GOVERNMENT OF INDIA MINISTRY OF STATISTICS AND PROGRAMME IMPLEMENTATION CENTRAL STATISTICS OFFICE New Delhi Dated: January 12, 2017 PRESS RELEASE QUICK ESTIMATES OF INDEX OF INDUSTRIAL PRODUCTION AND USE-
EMBARGO ADVISORY This Press Release is embargoed against publication, telecast or circulation on internet till 5.30 PM 9 th December, 2016.
 This Press Release is embargoed against publication, telecast or circulation on internet till 5.30 PM 9 th December, 2016. GOVERNMENT OF INDIA MINISTRY OF STATISTICS AND PROGRAMME IMPLEMENTATION CENTRAL
INDUSTRIAL PRODUCTION INDICES IN AUGUST Figure 1. Industrial Production Indices (2010=100)
") INDUSTRIAL PRODUCTION INDICES IN AUGUST 2013 1 The preliminary data showed that the Industrial Production Index 2, seasonally adjusted 3, has increased by 0.9% in August 2013 as compared to July 2013.
INDUSTRIAL PRODUCTION INDICES IN AUGUST 2013 1 The preliminary data showed that the Industrial Production Index 2, seasonally adjusted 3, has increased by 0.9% in August 2013 as compared to July 2013.
GOVERNMENT OF INDIA MINISTRY OF STATISTICS AND PROGRAMME IMPLEMENTATION CENTRAL STATISTICS OFFICE New Delhi Dated: August 10, 2018 PRESS RELEASE
 This Press Release is embargoed against publication, telecast or circulation on internet till 5.30 PM 10 th August, 2018. GOVERNMENT OF INDIA MINISTRY OF STATISTICS AND PROGRAMME IMPLEMENTATION CENTRAL
Industrial Energy Efficiency as a Resource by Region
 Industrial Energy Efficiency as a Resource by Region Garrett Shields and Robert D. Naranjo, BCS Incorporated Sandy Glatt, U.S. Department of Energy ABSTRACT The energy intensity of specific manufacturing
GOVERNMENT OF INDIA MINISTRY OF STATISTICS AND PROGRAMME IMPLEMENTATION CENTRAL STATISTICS OFFICE New Delhi Dated: November 12, 2014 PRESS RELEASE
 GOVERNMENT OF INDIA MINISTRY OF STATISTICS AND PROGRAMME IMPLEMENTATION CENTRAL STATISTICS OFFICE New Delhi Dated: November 12, 2014 PRESS RELEASE QUICK ESTIMATES OF INDEX OF INDUSTRIAL PRODUCTION AND
WHR to Power Market Potential and Target Market Opportunities
 WHR to Power Market Potential and Target Market Opportunities Presented by: Ken Darrow September 29-30, 2010 icfi.com 2006 ICF International. All rights reserved. Topics WHR Markets Industrial Markets
Monthly Report on the Corporate Goods Price Index ( Preliminary Figures for January 2017 )
") Research and Statistics Department Bank of Japan Report on the Corporate Goods Price Index The Producer Price Index rose 0.6 percent from the previous. The Export Price Index (contract currency ) rose
Research and Statistics Department Bank of Japan Report on the Corporate Goods Price Index The Producer Price Index rose 0.6 percent from the previous. The Export Price Index (contract currency ) rose
Chapter 23: Classifications
 Chapter 23: Classifications Regrouping and coding of industries (A) and products (P) The classifications of activities and products to be used are NACE Rev. 2 and CPA 2008. The corresponding aggregations
INDONESIA. Manufacturing: Food & Beverages. Sectoral Activities Department
 INDONESIA Manufacturing: Food & Beverages Key Labour Market Indicators (2009) Economically Active Population Total: 113,740,000 13,000 12,500 12,000 11,500 11,000 10,500 10,000 Fig.1: Employment in Manufacturing
Green Remediation: Footprint Assessment Tools
 Green Remediation: Footprint Assessment Tools The s Office of Superfund and Remediation Technology Innovation (OSRTI) provides this summary of tools to help decision makers evaluate the environmental footprints
Auditing Your Facility
 Auditing Your Facility Presented By Michael Kostrzewa, Assistant Director Colorado State University Industrial Assessment Center Department of Mechanical Engineering Fort Collins, CO 80523-1374 (970) 491-7709
QUICK ESTIMATES OF INDEX OF INDUSTRIAL PRODUCTION AND USE-BASED INDEX FOR THE MONTH OF NOVEMBER, 2017 (BASE =100)
") This Press Release is embargoed against publication, telecast or circulation on internet till 5.30 PM on 12 th January, 2018. GOVERNMENT OF INDIA MINISTRY OF STATISTICS AND PROGRAMME IMPLEMENTATION CENTRAL
This Press Release is embargoed against publication, telecast or circulation on internet till 5.30 PM on 12 th January, 2018. GOVERNMENT OF INDIA MINISTRY OF STATISTICS AND PROGRAMME IMPLEMENTATION CENTRAL
GOVERNMENT OF INDIA MINISTRY OF STATISTICS AND PROGRAMME IMPLEMENTATION CENTRAL STATISTICS OFFICE New Delhi Dated: August 11, 2017 PRESS RELEASE
 GOVERNMENT OF INDIA MINISTRY OF STATISTICS AND PROGRAMME IMPLEMENTATION CENTRAL STATISTICS OFFICE New Delhi Dated: August 11, 2017 PRESS RELEASE QUICK ESTIMATES OF INDEX OF INDUSTRIAL PRODUCTION AND USE-
The monthly variation of the Industrial Production Index is 1.2% after adjusting for seasonal and calendar effects
 05 December 2018 Industrial Production Indices (IPI). Base 2015 October 2018. Provisional data The monthly variation of the Industrial Production Index is 1.2% after adjusting for seasonal and calendar
Central Bank of Nigeria Purchasing Managers Index (PMI) Survey Report
 Survey Report") Central Bank of Nigeria Purchasing Managers Index (PMI) Survey Report Statistics Department June 2017 1.0 Introduction PURCHASING MANAGERS INDEX (PMI) JUNE 2017 REPORT The June 2017 PMI was conducted by
Central Bank of Nigeria Purchasing Managers Index (PMI) Survey Report Statistics Department June 2017 1.0 Introduction PURCHASING MANAGERS INDEX (PMI) JUNE 2017 REPORT The June 2017 PMI was conducted by
WORLD KLEMS AND ASIA KLEMS
 WORLD KLEMS AND ASIA KLEMS By Dale W. Jorgenson Harvard University First Asia KLEMS Conference Asian Development Bank Institute Tokyo, Japan July 27, 2011 http://economics.harvard.edu/faculty/jorgenson/
Save Energy Now Energy Savings Assessments
 Save Energy Now Energy Savings Assessments New Energy Expert Training December 12, 2006 Bob Gemmer, Technology Manager Industrial Technologies Program 1 Global Energy Challenges Growth in demand for limited
The monthly variation of the Industrial Production Index stands at - 1.5%, after adjusting for seasonal and calendar effects
 11 January 2019 Industrial Production Indices (IPI). Base 2015 November 2018. Provisional data The monthly variation of the Industrial Production Index stands at - 1.5%, after adjusting for seasonal and
Industries for PI+ v2.2
 1 Forestry, fishing and hunting 113-115 1 Forestry and Logging; Fishing, hunting and trapping 113, 114 1 Forestry and Logging 113 2 Fishing, hunting and trapping 114 2 Support activities for agriculture
This table has been produced by. The State & Regional Fiscal Studies Unit, University of Missouri-Columbia
 Table B-39 NAICS Component 1963 1964 1965 1966 1967 1968 1969 1970 1971 All industry total 607,008 650,513 704,697 767,075 811,782 887,569 962,902 1,012,299 1,097,173 Private industries 534,043 572,138
Assessment of Houston Commodity Flows for Supply Chain Analyses
 This document provides an assessment of 29 commodity flows to assist with the identification of 10 supply chains for more detailed investigation as part of the Ports Area Mobility Study. The intent is
This table has been produced by. The State & Regional Fiscal Studies Unit, University of Missouri-Columbia
 Table B-39 NAICS Component *1987 1988 1989 1990 1991 1992 All industry total 6,076,695 6,398,624 6,540,047 6,638,210 6,627,809 6,828,525 Private industries 5,195,468 5,492,391 5,612,260 5,690,087 5,677,736
Irish Company Expenditure on Carbon Abatement Technologies: An Overview of Project Findings
 Irish Company Expenditure on Carbon Abatement Technologies: An Overview of Project Findings Dr. Bernadette Power, School of Economics, Cork University Business School. Dr Ellen O Connor, School of Accounting
Monthly Report on the Corporate Goods Price Index ( Preliminary Figures for July 2013 )
") Research and Statistics Department Bank of Japan Report on the Corporate Goods Price Index The Domestic Corporate Goods Price Index rose 0.5 percent from the previous. The index excluding extra charges
Research and Statistics Department Bank of Japan Report on the Corporate Goods Price Index The Domestic Corporate Goods Price Index rose 0.5 percent from the previous. The index excluding extra charges
The monthly variation of the Total Industrial Turnover Index 1 stands at 1.0%, after seasonal and calendar adjustment
 2 November 208 Industrial Turnover Indices (ITI). Base 205 September 208. Provisional data The monthly variation of the Total Industrial Turnover Index stands at.0%, after seasonal and calendar adjustment
EMBARGO ADVISORY This Press Release is embargoed against publication, telecast or circulation on internet till 5.30 PM on 11 th May, 2018.
 This Press Release is embargoed against publication, telecast or circulation on internet till 5.30 PM on 11 th May, 2018. GOVERNMENT OF INDIA MINISTRY OF STATISTICS AND PROGRAMME IMPLEMENTATION CENTRAL
EBRD & EGPC : Oil Refineries Modernisation and Efficiency Improvement Study
 EBRD & EGPC : Oil Refineries Modernisation and Efficiency Improvement Study Introduction to the EBRD The EBRD is a triple-a rated* bank with a capital base of 30 billion. Operating in 35 countries from
GOVERNMENT OF INDIA MINISTRY OF STATISTICS AND PROGRAMME IMPLEMENTATION CENTRAL STATISTICS OFFICE New Delhi Dated: July 12, 2018 PRESS RELEASE
 This Press Release is embargoed against publication, telecast or circulation on internet till 5.30 PM 12 th July, 2018. GOVERNMENT OF INDIA MINISTRY OF STATISTICS AND PROGRAMME IMPLEMENTATION CENTRAL STATISTICS
Manufacturing 2016 SECTOR SPOTLIGHT NAICS Report Contents. What is this industry sector? STATISTICS CANADA DEFINITION SECTOR STRUCTURE
 2016 SECTOR SPOTLIGHT NAICS 31-33 Manufacturing Report Contents What is this industry sector? STATISTICS CANADA DEFINITION SECTOR STRUCTURE How does this sector stack up in Ottawa? OTTAWA DASHBOARD HIGHLIGHTS
NACE: Statistical Classification of Economic Activities
 NACE: Statistical Classification of Economic Activities NACE Rev.1 : To use until the 2008 operation included Section A Agriculture, hunting and forestry 01 Agriculture, hunting and related service activities
Evaluation of Water Curtailment on Energy Use and Plant Net Profitability
 Evaluation of Water Curtailment on Energy Use and Plant Net Profitability Kathey Ferland Nov. 5, 2015 Texas Industrial Water Management Forum Texas Industries of the Future The University of Texas at Austin
Institute for Industrial Productivity Addressing Energy Efficiency in the U.S.
 Institute for Industrial Productivity Addressing Energy Efficiency in the U.S. Technology Forum: Sustaining Industrial Energy Efficiency in a Potentially Water-Short Future June 19, 2013 Brady s Landing,
Industry Innovations with SAP Leonardo: Mill Products Industry
 Industry Innovations with SAP Leonardo: Mill Products Industry Stefan Soeller, Industry Business Unit Mill Products & Mining, SAP PUBLIC Agenda Digitalization in Mill Products Mill Products Use Cases for
Energy use in manufacturing 2015
 Energy 2016 Energy use in manufacturing 2015 Energy use in manufacturing diminished by 3 per cent in 2015 According to Statistics Finland, energy use in manufacturing decreased by three per cent from the
April 2015 Manufacturing ISM Report On Business
 FOR RELEASE: May 1, 2015 Contact: Kristina Cahill Report On Business Analyst ISM, ROB/Research Tempe, Arizona 800/888-6276, Ext. 3015 E-mail: kcahill@instituteforsupplymanagement.org April 2015 Manufacturing
March 2014 Manufacturing ISM Report On Business
 FOR RELEASE: April 1, 2014 Contact: Kristina Cahill Report On Business Analyst ISM, ROB Media Relations Tempe, Arizona 800/888-6276, Ext. 3015 E-mail: kcahill@ism.ws March 2014 Manufacturing ISM Report
MANUFACTURING PROCESSES
 1 MANUFACTURING PROCESSES - AMEM 201 Lecture 1: DR. SOTIRIS L. OMIROU The Manufacturing is a DRIVING FORCE for any economy We are living in an environment that is created and reshaped by manufacturing
PRESS RELEASE. PRODUCTION INDEX IN INDUSTRY: December 2016 y-o-y increase by 2.2%
 HELLENIC REPUBLIC HELLENIC STATISTICAL AUTHORITY Piraeus, 9 February 2017 PRESS RELEASE PRODUCTION INDEX IN INDUSTRY: December 2016 y-o-y increase by 2.2% The evolution of the Production in Industry (IPI)
March 2015 Manufacturing ISM Report On Business
 FOR RELEASE: April 1, 2015 Contact: Kristina Cahill Report On Business Analyst ISM, ROB/Research Tempe, Arizona 800/888-6276, Ext. 3015 E-mail: kcahill@ism.ws March 2015 Manufacturing ISM Report On Business
Greening Buildings at the Dallas/Fort Worth International Airport. Sustainable Communities Conference Dallas, TX. March 10, 2009
 Greening Buildings at the Dallas/Fort Worth International Airport Sustainable Communities Conference Dallas, TX March 10, 2009 Agenda Energy Efficiency in New Construction Energy Efficiency in Retrofits
City of St. Joseph, MO, Water Protection Division Industrial Wastewater Survey Questionnaire - Long Form (page 1 of 6)
") (page 1 of 6) Please complete this form in its entirety and return it, signed and dated, to the following address: St. Joseph Water Protection, 3500 State Route 759, St. Joseph, MO 64504 If your business
(page 1 of 6) Please complete this form in its entirety and return it, signed and dated, to the following address: St. Joseph Water Protection, 3500 State Route 759, St. Joseph, MO 64504 If your business
STAFF REPORT. California s Food Processing Industry Energy Efficiency Initiative: Adoption of Industrial Best Practices CALIFORNIA ENERGY COMMISSION
 CALIFORNIA ENERGY COMMISSION California s Food Processing Industry Energy Efficiency Initiative: Adoption of Industrial Best Practices STAFF REPORT MARCH 2008 CEC 400-2008-006-REV Arnold Schwarzenegger,
Ameren Illinois Energy Efficiency Program. Practical Energy Management PEM Overview Workshop DATE 2/25/16
 Ameren Illinois Energy Efficiency Program Practical Energy Management PEM Overview Workshop DATE 2/25/16 Today s Agenda Energy Efficiency in Perspective Ameren Illinois Energy Efficiency Program Practical
ENERGY MANAGEMENT PRACTICES BY SME
 ENERGY MANAGEMENT PRACTICES BY SME Bhaskaran Gopalakrishnan, Ph.D., P.E., C.E.M Professor and Director of the Industrial Assessment Center West Virginia University Morgantown, West Virginia, USA Email:
Business-Facts Summary Dublin city, CA ( )
") 3 Digit NAICS Top Ten Summary Healthcare and Social Assistance Ambulatory Health Care Retail Trade Professional, Scientific, and Technical Other (except Public Administration) Retail Trade Retail Trade
3 Digit NAICS Top Ten Summary Healthcare and Social Assistance Ambulatory Health Care Retail Trade Professional, Scientific, and Technical Other (except Public Administration) Retail Trade Retail Trade
IAF Informative Document for QMS Scopes of Accreditation
 IAF ID 1:2010 International Accreditation Forum, Inc. IAF Informative Document IAF Informative Document for QMS Scopes of Accreditation (IAF ID 1:2010) IAF ID 1:2010 International Accreditation Forum,
UN List of Industrial Products
 UN List of Industrial Products United Nations Statistics Division Workshop on Classifications, Montevideo, Uruguay, 14-18 March 2005 25/04/2005 1 History UN list of industrial products was developed in
Capital project planning, design, delivery and operation process review City of Nanaimo November 20, 2017
 Capital project planning, design, delivery and operation process review City of Nanaimo November 20, 2017 Background Deloitte s Scope Conduct a review of the City s project planning, design, delivery and
Creating a Market Pull for Cleaner Production
 MARCH 2010 ABOUT THE AUTHOR JIGAR SHAH is a global product leader for Cleaner Production. His duties related to CP include formulating a global strategy, quality assurance, knowledge management, and regional
Manufacturing sees slow but positive start to 2019
 January 2019 Media Contact: Tony Melville, Australian Industry Group. 0419 190 347 Manufacturing sees slow but positive start to 2019 The Australian Industry Group Australian Performance of Manufacturing
Energy End-Use: Industry
 Share of Industrial Final Energy Use Chapter 8, #1 Global Production of Key Materials Chapter 8, #2 Apparent Steel Consumption as a Function of Income Chapter 8, #3 Apparent Cement Consumption as a Function
Overview of cogeneration technology and application
 Overview of cogeneration technology and application Cogeneration Week Hanoi, 6 April 2004 Melia Hotel, Hanoi Leif Mortensen, Coal Expert Cogeneration or Combined Heat and Power (CHP) Sequential generation
Five Simple Steps to Immediately Determine Industrial CHP Viability
 Five Simple Steps to Immediately Determine Industrial CHP Viability David C. Oehl, P.E., President Maven Power, LLC, Houston, TX 77070 Overview: With issues related to the sustainable development of the
TISA Digital ID Pilot High Level Approach September
 TISA Digital ID Pilot High Level Approach September 2018 Background: Identity key delivery layers There is a need for a system will enable effective action against each layer of the stack Vision for the
State of Washington Clean Energy Opportunity: Technical Market Potential for CHP
 State of Washington Clean Energy Opportunity: Technical Market Potential for CHP August 010 (Rev. October 013) Introduction The state of Washington has significant clean energy technical market potential
Energy audits, upgrades can boost profits at industrial facilities
 Energy audits, upgrades can boost profits at industrial facilities White Paper Summary A compelling case is made that significant savings and profits can be realized by performing energy audits and executing
PNM Integrated Resource Plan MARCH 11, 2014 PUBLIC ADVISORY WORKING GROUP MEETING
 PNM 2014-2033 Integrated Resource Plan MARCH 11, 2014 PUBLIC ADVISORY WORKING GROUP MEETING M ARCH 11, 2014 WIRELESS ACCESS FOR MAR 11 TH ATTENDEES Network: Orbit-GA Username: guest Password: Pate@Rue
THE ECONOMIC IMPACT OF INFORMATION TECHNOLOGIES AFTER THE FINANCIAL CRISIS
 THE ECONOMIC IMPACT OF INFORMATION TECHNOLOGIES AFTER THE FINANCIAL CRISIS Dale W. Jorgenson, Harvard University http://economics.harvard.edu/faculty/jorgenson/ Keynote Lecture to the Annual Conference
Business-Facts Summary - 3 Digit NAICS Summary
 - 3 Digit NAICS Summary Title Page Title Page Data Version: 2018 Feb (Internal) Report Generation Method: Single Analysis Area: 1789 STATE ST, SAN DIEGO, CA, 92101-2530 Reporting Detail: As Selected Include
The monthly variation of the Total Industrial Turnover Index 1 stands at 0.9%, after seasonal and calendar adjustment
 21 September 2018 Industrial Turnover Indices (ITI). Base 2015 July 2018. Provisional data The monthly variation of the Total Industrial Turnover Index 1 stands at 0.9%, after seasonal and calendar adjustment
Raffles Place, , Singapore. ISO 9001: 2015 Quality Management System Certification
 ISO 9001: 2015 Quality Management System Certification EA Code 1 3 5 7 8 9 10 12 14 15 16 17 18 19 20 22 23 24 25 27 28 29 30 31 32 33 34 35 36 37 38 39 Agriculture, forestry and fishing Food products,
The Protein Challenge 2040: Aquaculture s Role
 The Protein Challenge 2040! The Protein Challenge 2040: Aquaculture s Role Global Outlook on Aquaculture Leadership 2015 Global Aquaculture Alliance 29 October 2015 Vancouver, BC The future of protein
SEIFSA s submission to NERSA
 PRESENTED BY: Marique Kruger & Dr. Michael Ade EC DIVISION - SEIFSA marique@seifsa.co.za SEIFSA s submission to NERSA Eskom s third MYPD3 RCA for Year 2 (2014/15), Year 3 (2015/16) and Year 4 (2016/17)
GOVERNMENT OF INDIA MINISTRY OF STATISTICS AND PROGRAMME IMPLEMENTATION CENTRAL STATISTICS OFFICE New Delhi Dated: September 12, 2017 PRESS RELEASE
 GOVERNMENT OF INDIA MINISTRY OF STATISTICS AND PROGRAMME IMPLEMENTATION CENTRAL STATISTICS OFFICE New Delhi Dated: September 12, 2017 PRESS RELEASE QUICK ESTIMATES OF INDEX OF INDUSTRIAL PRODUCTION AND
III. INDUSTRY 8,4 0,8 11,4 6,7 1,0 16,4 75,9 79,4
 III. INDUSTRY According to preliminary data, in January- 2018, enterprises of the republic produced industrial output by 151.2 trillion soums, growth rates compared to the same period last year amounted
Energy Management plus Superior Energy Performance
 Energy Management plus Superior Energy Performance Cook Composites and Polymers Return on Experience 15th Texas Industrial Energy Management Forum Achieving Superior Energy Performance Thursday, April
Emissions Trading in China Progress on the Path towards a Unified National System
 Emissions Trading in China PRESENTED BY Chen Zhibin SinoCarbon Feb. 2016 Bottom - Up ETS in China 1 Led by NDRC (National Reform and Development commission) One registry system ETS Development in China
Heat recovery from industrial installations
 Environmentally friendly For high temperature applications, AQYLON s organic working fluids have a very low Global Warming Potential (320). Rugged AQYLON s ORC modules are designed for durability and fit
2008 Census of Industrial Production (NACE Rev 2)
") 30 November 2009 Census of Industrial Production (NACE Rev 2) Early Estimates Other 33% Chemicals 7% Computers 18% Food Products 19% Basic Pharmaceutical 23% Industrial Gross value Wages & Year added salaries
30 November 2009 Census of Industrial Production (NACE Rev 2) Early Estimates Other 33% Chemicals 7% Computers 18% Food Products 19% Basic Pharmaceutical 23% Industrial Gross value Wages & Year added salaries
Data Sources and Methods for the Emission of Toxic Substances to Air Indicators
 Data Sources and Methods for the Emission of Toxic Substances to Air Indicators December 2011 Cat.#: En4-144/27-2011E-PDF ISBN: 978-1-100-19729-6 1 Introduction The emission of toxic substances to air
Industrial Pretreatment Program Industrial User Guide
 Industrial Pretreatment Program Industrial User Guide Industrial Pretreatment Program Industrial User Guide Contents Introduction... 1 Federal and Local Regulations... 1 Industrial Waste Discharge Permitting...
CENSUS OF INDUSTRIAL PRODUCTION
 CENSUS OF INDUSTRIAL PRODUCTION TANZANIA MAINLAND 2013 SUMMARY REPORT Vision To become a one stop centre for official statistics in Tanzania Mission To produce quality official statistics and service that
The monthly variation of the Total Industrial New Orders Receives Index 11 stands at 0.8%, after seasonal and calendar adjustment
 21 September 2018 Industrial New Orders Received Indices (INORI). Base 2015 July 2018. Provisional data The monthly variation of the Total Industrial New Orders Receives Index 11 stands at 0.8%, after
Developing the waste economy by exploring opportunities outside traditional waste management
 Developing the waste economy by exploring opportunities outside traditional waste management Toward the End of Waste: Wise Resource use in Waste Management University of Stellenbosch Business School, Cape
Introductory text and technical notes 335. Table 16.1 Average weekly earnings for each industrial sector 337
 Earnings 16 Introductory text and technical notes 335 Table 16.1 Average weekly earnings for each industrial sector 337 Table 16.2 Average hourly earnings for each industrial sector 338 Table 16.3 Table
Utilizing resources that otherwise would have been lost- Industrial surplus heat
 Utilizing resources that otherwise would have been lost- Industrial surplus heat Charlotta Abrahamsson Swedish District Heating Association 1 District Heating as we see it Heat market Industrial Waste
Summary. Figure 1: Changes in Major Items (Year-on-Year Basis) (Establishments with 10 or more employees) Number of employees (-2.
 (Establishments with 10 or more employees) Number of employees (-2.") Summary 1. Trends in establishments with 10 or more employees The number of establishments decreased for the second consecutive year, and the number of employees decreased for the first time in three years.
Summary 1. Trends in establishments with 10 or more employees The number of establishments decreased for the second consecutive year, and the number of employees decreased for the first time in three years.