Process Mapping sometimes called Flowcharting or IS Maps
|
|
|
- Emil Pearson
- 6 years ago
- Views:
Transcription
1 Process Mapping sometimes called Flowcharting or IS Maps 1
2 Quality Improvement Works on Existing Processes A process is a series of steps or actions performed to achieve a specific purpose. A process can describe the way things get done. Your work involves many processes. 2
3 What is a Process Map? A pictorial representation of the sequence of actions that comprise a process. 3
4 Why is Process Mapping Important? It provides an opportunity to learn about work that is being performed. Dr. Myron Tribus said, You don t learn to process map, You process map to learn. Most processes today are undocumented or are evolving. 4
5 What Dr. Deming said You cannot improve a process until you understand it! If you can't describe what you are doing as a process, you don't know what you're doing. 5
6 Process Maps are Used to: Document the way we do our work. Provide a reference to discuss how things get done. Describe and understand the work we do. Analyze and improve on processes. Identify of areas of complexity and re-work. To generate ideas for improvement. Illustrate process improvements. 6
7 Preparing to Process Map Assemble the Team. Agree on which process you wish to document. Agree on the purpose of the process. Agree on beginning and ending points. Agree on level of detail to be displayed. Start by preparing an outline of steps. Identify other people who should be involved in the process map creation, or asked for input, or to review drafts as they are prepared. 7
8 Symbols used to Process Map Start & End: An oval is used to show the materials, information or action (inputs) to start the process or to show the results at the end (output) of the process. Activity: A box or rectangle is used to show a task or activity performed in the process. Although multiple arrows may come into each box, usually only one arrow leaves each box. Decision: A diamond shows those points in the process where a yes/no question is being asked or a decision is required. Break: A circle with either a letter or a number identifies a break in the Flowchart and is continued elsewhere on the same page or another page. 8
9 Hints and Tips Process Map what is, not what you would like the process to be. Process Mapping is dynamic. Use Postit notes, dry erase markers, pencil, etc. All Process Maps must have start and stop points. 9
10 Process Map of Conference Approvals Sample Do a Process Map that documents the process used to obtain approval to attend conferences. 10

11 Sample One 11

12 Sample Two 12
13 Sample Three 13
14 Hints and Tips Brainstorming and Affinity Diagrams can be used to identify processes you wish to do a process map on. There is no single right way to do a process map. It is a tool to learn about your organization and work. Process Maps can be used in a variety of settings outside Quality Improvement, such as: Orienting new employees In-service presentations Brainstorming possible process changes Creating or revising policies and procedures that support the process Creating measures Identifying logical outcomes of a process 14
15 Summing UP Process Map to learn. Process Map to document a baseline to measure improvement vs. change. Process Map to point to where data may be that describes the current process. 15
16 QI Tool Exercises Scenario Highlighting Excellence Health Department Improvement sought-improved Customer Satisfaction with health department services Area of Concentration-Customer Satisfaction Survey Please take a moment to read the Scenario write-up that is in your binder 16
17 17
18 Check Sheets observing a process 18
19 Check Sheets: Purpose To turn observational data into numerical data From records Newly collected To find patterns using a systematic approach that reduces bias Use check sheets when data can be observed or collected from your records 19
20 Check Sheets: Step by Step Step 1 Decide what to observe Define key elements Established shared understanding Step 2 Identify where, when, & how long Think about confounding factors That you want to eliminate That you want to study 20
21 Check Sheets: Step by Step Step 3 Design your check sheet Develop a protocol Problem/Project Name: Name of Observer: Other: Location of Data Collection: Event A B C Total Dates of Observation: Dates of Data Collection Total Grand Total 21
22 Check Sheets: Step by Step Step 4 Identify and train your observers Practice & adjust Step 5 Collect data Review & adjust Step 6 Summarize data across observations & observers Study the results 22
23 Hints and Tips Make sure you re getting clean data Define, train, check, adjust, & repeat! Consider and address potential sources of bias Use other categories sparingly Strike a balance Fine vs. inclusive categories Few vs. many categories 23
24 Exercise When customers report dissatisfaction with LHD services, staff track the primary reason for customer dissatisfaction They believe dissatisfaction may be caused by several conditions that they can document: LHD does not offer service client needs Needed service was difficult to access Wait times were too long Interaction with LHD staff was poor LHD provided inaccurate information Use your handout to set up the check sheet for this situation 24
25 Pareto Charts 80% of the problem 25
26 Pareto Charts: Purpose To identify the causes that are likely to have the greatest impact on the problem if addressed 80% of the effects come from 20% of the causes To bring focus to a small number of potential causes To guide the process of selecting improvements to test Use when you have, or can collect, quantitative or numeric data on several potential causes 26
27 Pareto Charts: Step by Step Step 1 Identify potential causes of the problem you wish to study Step 2 Develop a method for gathering your data Historical data Collection of new data Check Sheets Surveys 27
28 Pareto Charts: Step by Step Step 3 Collect your data Each time the problem occurs, make note of the primary cause Step 4 Order your results & calculate the percentage of incidents that fall into each category 28
29 Pareto Charts: Step by Step Step 5 Display your data on a graph The most commonly occurring cause should appear first, and the causes should appear in order Word or Excel can be used, but paper and pencil work too Label the x-axis (horizontal) with the causes, the left y-axis (vertical) with the percentage of occurrences with each cause, and the right y- axis with the cumulative percent. Graph your data 29

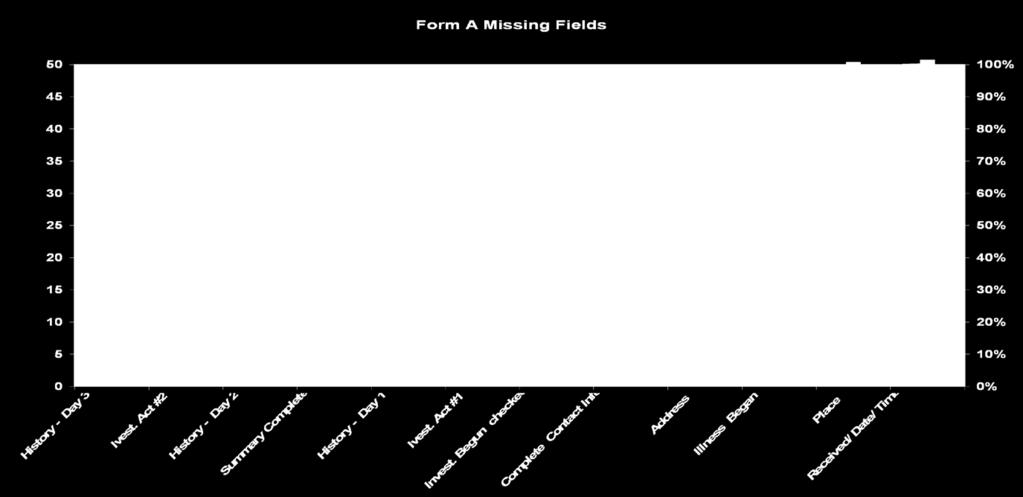
30 Genesee County Pareto 30
31 Pareto Charts: Step by Step Step 6 Make sense of your results by examining your data Are a few causes driving the problem? Can this information help you make decisions about the solution you want to try? Does this information impact how you want to structure your aim statement or theory of change (if-then)? Can you use this information to measure your results? 31
32 Pareto Charts: Hints and Tips You ll only learn about causes that you investigate - be inclusive! Check and double check your data Little errors can make a big difference Results can be used in more than one way and they can be used differently at different points in time Revisit your Pareto throughout your project the meaning may change for you as you go 32
33 Pareto Charts: Exercise Problem: Client Dissatisfaction Name: J. Heany Time: 9-5 Location: Excellence Health Department s Customer Service Department Dates: Week of 9/6, 9/13, 9/20, 9/27, 10/4, 10/11, 10/18 Date Reason 9/6 9/13 9/20 9/27 10/4 10/11 10/18 Service not offered Total Service was difficult to access Long wait times Poor staff interaction Inaccurate information Total
34 BREAKTIME 34
35 Cause and Effect Diagrams Moving from Treating Symptoms To Treating Causes 35

36 Problem Solving What we usually see is the tip of iceberg The Symptom The Symptom The Root Causes Invisible Hidden 36
37 Problem Solving When confronted with a problem most people like to tackle the obvious symptom and fix it This often results in more problems Using a systematic approach to analyze the problem and find the root cause is more efficient and effective Tools can help to identify problems that aren t apparent on the surface (root cause) 37
38 Fishbone Diagrams and 5 Whys 38
39 Fishbone Diagrams: Purpose To identify underlying or root causes of a problem To identify a target for your improvement that is likely to lead to change 39
40 Fishbone Diagrams: Construction Construction Draw an arrow leading to a box that contains a statement of the problem Draw smaller arrows (bones) leading to the center line, and label these arrows with either major causal categories or process categories For each cause, identify deeper, root causes Cause 1 Cause 3 Effect/Problem Cause 2 Cause 4 40
41 Berrien County Fishbone Root causes for lack of BCHD general PH articles Causes Process Topics Confusion/duplication Articles for events only No time to develop Minimal articles Effect One writer, poor health People/Staff Secluded media team Sporadic writing No long-term arrangements Media Relations 41
42 Cause and Effect Diagram Pre Natal Practices Early Feeding Practices Life Style Excess Maternal Weight Gain Over Weight Newborn Genes Syndromes TV Pacifier Decreased Breast Feeding Less Fruits and Veg. Less Income Built Environment For Strollers Not Toddling Less Indoor Mobility Maternal Choices Bottle Pacifier Juices Over Weight Pre School No Time For Food Prep No Outdoor Play Unsafe Unhealthy Food Choices Few Community Recreational Areas or Programs TV Viewing Sodas/Snacks Curriculum No Sidewalks Less School Obese Children Genetics Environment Polices 42
43 Fishbone Diagrams: Hints & Tricks Find the right problem or effect statement The problem statement should reflect an outcome of a process that you control or influence Be specific Reach consensus Find causes that make sense and that you can impact Generate categories through: Brainstorming Looking at your data Ask why? to achieve a deeper understanding Know when to stop Stick to what you and your managers can control or directly influence Make use of your results Decide if you need more data Consider causes that come up again and again, and causes that group members feel are particularly important Memory Jogger, page 32 43
44 By Table Exercise Fishbone Diagram Customer Satisfaction Draft a Fishbone Diagram listing effect(s), major causes, and data related causes (root) It is OK if data related causes show up in more than one major cause area HINT: The pareto chart makes a good starting point 44
45 Five Whys The 5 Whys is a question-asking method used to explore the cause/effect relationships underlying a particular problem. Ultimately, the goal of applying the 5 Whys method is to determine a root cause of a problem. Wikipedia 45
46 Five Whys (cont.) Example My car will not start. (the problem) Why? - The battery is dead. (first why) Why? - The alternator is not functioning. (second why) Why? - The alternator belt has broken. (third why) Why? - The alternator belt was well beyond its useful service life and has never been replaced. (fourth why) Why? - I have not been maintaining my car according to the recommended service schedule. (fifth why, root cause) Wikipedia 46
47 5 Why s and How s A major advantage to the 5 Whys technique is that it is relatively easy to use and apply In many organizations, problem solving is a deductive exercise conducted in a meeting room where those doing the problem solving are separated from the actual process where the problem occurred. Go and See The 5 Whys requires skill to use well and most important, should be grounded in observation, data, and not deduction. 47
48 5 Whys Limitations Using 5 Whys does not always lead to root cause identification because: Listing causes in the absence of data. Assumes each symptom has only one sufficient cause. Varying skill with which the method is applied. The method is not necessarily repeatable. Linear approach that does not pick up interactions. Inability to distinguish between causal factors and root causes. If it is used with no data it can lead to bad judgment calls which pick the wrong root cause(s). Solutions are then implemented that address the wrong root cause. These wrong solutions may cause more problems and make the situation worst. 48

49 How To Overcome The Limitations: Use Data 49
50 Exercise 5 Whys Customer Satisfaction By Table Perform 5 whys on the two causes that received the greatest number of responses as shown in the Pareto Chart (Service was difficult to assess and Service not offered). 50
51 Summing UP Use Fishbone and 5 Whys to explore and graphically display in increasing detail all of the possible causes related to the problem. Use Fishbone and 5 Whys to find dominant causes rather than symptoms. Use Fishbone and 5 Whys to identify the root cause of the problem we seek to improve. 51
52 Run Charts tracking process performance 52
53 Run Charts: Purpose To study data measured over time Run charts help to: Study the performance of a process Identify trends Measure change in performance following a change in process Use when you have, or can collect: Quantitative data On a measure of the performance of a process Over time 53
54 Run Charts: Step by Step Step 1 Decide what data you need Are the data you need already tracked? Do the data need to be collected? Determine the timeframe & number of data collection points Should you make your count annually, quarterly, monthly, weekly, daily, hourly? Try to gather data from 20+ time points in order to establish a trend Step 2 Gather your data 54
55 Run Charts: Step by Step Step 3 Graph your data On the Y-axis, set up a scale that corresponds with your measure On the X-axis, set up a scale that corresponds with your measurement timeframe Plot your data on the chart, placing one dot at each measurement point Draw a line through your dots Calculate the mean score and draw a line at the mean Mark the timing of your change Excel, Word, and other programs can help! 55
56 Sample Run Chart Number of New BCCCP Clients by Month in 2007 and 2008 Number of New Clients January February March April May June July August September` October November December Month
57 Run Charts: Step by Step Step 4 Make sense of your results by examining your data Does the mean reflect an appropriate level of service or outcome of your process? Is there a trend that should be investigated? Do you see a shift in your data? Are there 8 or more consecutive points on one side of the center line? Do you see a trend in your data? Are there six consecutive jumps in the same direction (up or down)? Do you see a pattern in your data? Does a pattern recur eight or more times in a row? 57
58 Run Charts: Hints and Tips Every process will have some variation Be cautious about assuming that variation from the average has meaning Be sure to track data over a long enough period of time This will help you identify the true mean and the true level of variability within the process 58
59 Run Charts: Exercise Month Response rate in 08 January February March April May June July Response rate in 09 Each month the health department tracks customer satisfaction survey data to measure the impact of implementing an integrated service model starting in April Client satisfaction measured by mean score on survey item: The health department makes it easy to get the services I need. August September October November December
60 60
1. What is a key difference between an Affinity Diagram and other tools?
 1) AFFINITY DIAGRAM 1. What is a key difference between an Affinity Diagram and other tools? Affinity Diagram builds the hierarchy 'bottom-up', starting from the basic elements and working up, as opposed
Process Mapping. Acknowledgements 7/21/2014. Disclosures
 Process Mapping Jatinder R Palta, PhD, FAAPM, FASTRO Professor and Chair Medical Physics, VCU Chief Physicist, VHA Radiation Oncology Richmond, Virginia Acknowledgements Derek Brown, PhD University of
Compliance Issue Analysis
 Identifying and Analyzing Compliance Issues John Falcetano, CHC-F, CCEP, CHRC, CIA University Health Systems of Eastern Carolina (252) 347-3919 jfalceta@pcmh.com Health Care Compliance Association 6500
Using the AQIP Quality Tools. Wednesday, January 20, :00-1:00 p.m. CTL (CM-1120) Presenter: Steve Robinson
 Presenter: Steve Robinson") Using the AQIP Quality Tools Wednesday, January 20, 2010 12:00-1:00 p.m. CTL (CM-1120) Presenter: Steve Robinson CTL Session Description AQIP isn't just for accreditation! In this brief session, Steve
Using the AQIP Quality Tools Wednesday, January 20, 2010 12:00-1:00 p.m. CTL (CM-1120) Presenter: Steve Robinson CTL Session Description AQIP isn't just for accreditation! In this brief session, Steve
Developing System Outcomes for Improved Effectiveness. C.J. Johnson L.M.H.P. and L.C.S.W.
 Developing System Outcomes for Improved Effectiveness C.J. Johnson L.M.H.P. and L.C.S.W. If people do not participate in decisions, there is little to prevent them from assuming that things would have
LEAN PRODUCTION SYSTEM
 LEAN PRODUCTION SYSTEM Introduction Lean Overview Process Control Tools 1. Flow Chart / Diagram 2. Check Sheet 3. Histogram 4. Pareto Chart / Diagram 5. Cause-and-Effect Diagram 6. Why-Why Diagram 7. Scatter
Root Cause Analysis: The Essential Ingredient. Las Vegas IIA Chapter February 22, 2018
 Root Cause Analysis: The Essential Ingredient Las Vegas IIA Chapter February 22, 2018 Agenda Overview Concept Guidance Required Skills Level of Effort RCA Process Benefits Considerations Planning Information
Quality Management in Construction Projects. Dr. Nabil El Sawalhi
 Quality Management in Construction Projects Dr. Nabil El Sawalhi 1 Quality Definition The American Society for Quality (ASQ) glossary defines quality as A subjective term for which, each person has his
Ishikawa Diagrams METHOD MANPOWER MOTHER NATURE MEASUREMENT
 Ishikawa Diagrams a.k.a Fishbone Diagrams, Cause-and-Effect Diagrams What is it? Ishikawa diagrams are a visual way to conduct root cause analysis (while leveraging 5 Whys ) on multiple potential causes
Embracing Quality, Improving Efficiency, & Increasing Effectiveness
 Embracing Quality, Improving Efficiency, & Increasing Effectiveness Performance Management & Quality Improvement in Public Health: A Training for Public Health Practitioners Julia Heany, MPHI Debra Tews,
PART 5 Managing Growth in the Small Business
 Managing Operations PART 5 Managing Growth in the Small Business PowerPoint Presentation by Charlie Cook, The University of West Alabama 2010 Cengage Learning. All Rights Reserved. May not be scanned,
Root Cause Analysis for Learning Professionals
 Root Cause Analysis for Learning Professionals Steve Hodgson, CPP, CPLP Director of Payroll Training American Payroll Association shodgson@americanpayroll.org Root Cause Analysis for Learning Professionals
Process Analysis. Process Analysis. Process Analysis. Process Analysis. A Systematic Approach to. Define Scope. Identify Opportunities.
 Chapter 4 A process is how a company makes a product or service. Design considerations are: Process Structure Customer Involvement Vertical Integration Resource Flexibility Capital Intensity A Systematic
An ordered array is an arrangement of data in either ascending or descending order.
 2.1 Ordered Array An ordered array is an arrangement of data in either ascending or descending order. Example 1 People across Hong Kong participate in various walks to raise funds for charity. Recently,
ROOT CAUSE ANALYSIS AND THE AUDIT LIFE CYCLE
 1 ROOT CAUSE ANALYSIS AND THE AUDIT LIFE CYCLE DEREK BUTLER SENIOR MANAGER GRANT THORNTON LLP +1 443.414.3257 DEREK.BUTLER@US.GT.COM AHIA 35th Annual Conference September 11-14, 2016 www.ahia.org Agenda
QI ESSENTIALS TOOLKIT
 QI ESSENTIALS TOOLKIT Cause and Effect Diagram Driver Diagram Failure Modes and Effects Analysis (FMEA) Flowchart Histogram Pareto Diagram PDSA Worksheet Project Planning Form Run Chart & Control Chart
introduction by Stacey Barr
 Are you underestimating the performance measurement most people only see the tip of the performance measurement iceberg - and that's why their measures fail by Stacey Barr introduction Models like the
Overview This tutorial presents an overview of the ADKAR model for change management.
 Overview This tutorial presents an overview of the ADKAR model for change management. ADKAR is a goal-oriented change management model that allows change management teams to focus their activities on specific
Overview of MBSAQIP Standard 7.2. Quality Improvement Process
 Overview of MBSAQIP Standard 7.2 Quality Improvement Process 1. Review Data 6. Present Study Results 5. Implement Intervention & Monitor Data 2. Identify the Problem Standard 7.2 Quality Improvement Process
ISHIKAWA S 7 TOOL OF QUALITY PARETO DIAGRAMS AND CONTROL CHARTS NEFİSE M. NABİ
 ISHIKAWA S 7 TOOL OF QUALITY PARETO DIAGRAMS AND CONTROL CHARTS NEFİSE M. NABİ 2015800325 WHO İS VİLFREDO PARETO Vilfredo Federico Damaso Pareto ; born Wilfried Fritz Pareto, 15 July 1848 19 August 1923)
Understanding Process Variation Lean Six Sigma Green Belt Session #3 Handout
 Understanding Process Variation Lean Six Sigma Green Belt Session #3 Handout Purpose-Agenda-Limit (P-A-L) Page 1 Purpose Learning Objectives Understand why cycle time is a driver of customer satisfaction
Data Visualization. Prof.Sushila Aghav-Palwe
 Data Visualization By Prof.Sushila Aghav-Palwe Importance of Graphs in BI Business intelligence or BI is a technology-driven process that aims at collecting data and analyze it to extract actionable insights
CERTIFIED QUALITY IMPROVEMENT ASSOCIATE
 CQIA CERTIFIED QUALITY IMPROVEMENT ASSOCIATE Quality excellence to enhance your career and boost your organization s bottom line asq.org/cert Certification from ASQ is considered a mark of quality excellence
PROJECT MANAGEMENT. Quality Management (QM) Course 7 Project Management Knowledge Areas (5) Risk Management (RM)
 Course 7 Project Management Knowledge Areas (5) Risk Management (RM)") PROJECT MANAGEMENT Course 7 Project Management Knowledge Areas (5) Quality Management (QM) Risk Management (RM) Cătălina Mancaș QM + RM Processes: Inputs Tools & Techniques Outputs Project Quality Management
PROJECT MANAGEMENT Course 7 Project Management Knowledge Areas (5) Quality Management (QM) Risk Management (RM) Cătălina Mancaș QM + RM Processes: Inputs Tools & Techniques Outputs Project Quality Management
Quality Improvement Tools. There are number of tools and methods available for quality improvement activity. Here is 10 examples.
 Quality Improvement Tools There are number of tools and methods available for quality improvement activity. Here is 10 examples. Quality Tools List of tools commonly used are: 1. Pareto Analysis 2. Brainstorming
Basic Tools for Process Improvement CAUSE-AND-EFFECT DIAGRAM CAUSE-AND-EFFECT DIAGRAM 1
 CAUSE-AND-EFFECT DIAGRAM CAUSE-AND-EFFECT DIAGRAM 1 What is a Cause-and-Effect Diagram? A Cause-and-Effect Diagram is a tool that helps identify, sort, and display possible causes of a specific problem
The materials required over the next two modules include:
 Meet with the Math Instructor and verify that the statistics modules have been completed and that students will be again reviewing these kinds of data over the next two quality modules. The Math Instructor
The Model for Improvement
 The Model for Improvement Women s Cancer Screening Collaborative Prepared by Improvement Foundation (Australia) Ltd PO Box 3645 Rundle Mall SA 5000 Date/Time Last Saved 7/03/2017 11:49:00 AM 1 P a g e
Statistics and data analysis procedures can be divided into two general categories: quantitative techniques and graphical techniques.
 http://en.wikipedia.org/wiki/seven_tools_of_quality http://deming.eng.clemson.edu/pub/tutorials/qctools/qct.htm http://en.wikipedia.org/wiki/5_whys http://en.wikipedia.org/wiki/brainstorming http://syque.com/quality_tools/toolbook/brainstorm/example.htm
Measure Twice, Cut Once
 Measure Twice, Cut Once IMPROVING YOUR IMPROVEMENT THROUGH BETTER METRICS Michael Cardinal ITSM Academy ITIL Expert, CPDE, Educator, Amateur Woodworker 2 1 A chance to WIN! Measure Twice, Cut Once Always
Project Management CTC-ITC 310 Spring 2018 Howard Rosenthal
 Project Management CTC-ITC 310 Spring 2018 Howard Rosenthal 1 Notice This course is based on and includes material from the text: A User s Manual To the PMBOK Guide Authors: Cynthia Stackpole Snyder Publisher:
erhaps you ve heard this quote by 18th century author Oliver Goldsmith: Our greatest glory is not in never failing, but in rising up every time we
 70 / J U N E 2 0 1 5 / W W W. N I A D A. C O M P erhaps you ve heard this quote by 18th century author Oliver Goldsmith: Our greatest glory is not in never failing, but in rising up every time we fail.
Introduction to Control Charts
 Introduction to Control Charts Highlights Control charts can help you prevent defects before they happen. The control chart tells you how the process is behaving over time. It's the process talking to
Prioritisation Matrices
 Prioritisation matrices are useful for applying a systematic approach to weighting/prioritising criteria towards evaluating solutions against the criteria. The use of these matrices helps teams focus and
Department of Industrial Engieering
 Department of Industrial Engieering Operations Analysis Assistant Prof. Abed Schokry Analysis techniques Between operations Multi Activity charts Project scheduling Flow diagrams and process charts Location
Overview of Continuous Process Improvement
 Overview of Continuous Process Improvement Breakout Session # E01 Henry F. Garcia, Adjunct Professor, Webster University Date Tuesday, 5 December 2017 Time 1400 1515 1 Definition Continuous Improvement
Seven Quality Control Tools
 Seven Quality Control Tools Workbook 7QC Overview Learn what Quality Control is as well as what the 7QC Tools are. A workbook intended to accompany the Facilitator s Guides for this course. This guide
International Association of Certified Practicing Engineers
 www.iacpe.com Knowledge, Certification, Networking Page: 1 71 IACPE No 19, Jalan Bilal Mahmood 80100 Johor Bahru Malaysia The International is providing the introduction to the Training Module for your
Thomson Learning DOCUMENTING ACCOUNTING SYSTEMS LEARNING OBJECTIVES
 3 DOCUMENTING ACCOUNTING SYSTEMS LEARNING OBJECTIVES After completing this chapter, you should understand: U1. Information represented on UML activity diagrams. U2. Differences between an overview activity
PROJECT QUALITY MANAGEMENT. 1 Powered by POeT Solvers LImited
 PROJECT QUALITY MANAGEMENT 1 www.pmtutor.org Powered by POeT Solvers LImited WHAT S PROJECT QUALITY MANAGEMENT? WHAT S PROJECT QUALITY MANAGEMENT? Project Quality Management processes include all the activities
Seminar on Internal Audit by WIRC. Technical Session - 5 Report Writing. CA S. Swaminathan 19/August/2017
 Seminar on Internal Audit by WIRC Technical Session - 5 Report Writing CA S. Swaminathan 19/August/2017 Re-cap of Previous Sessions Session 1 : Internal Audit Methodology Session 2 : Risk based IA Plan
MAKING SENSE OF DATA
 MAKING SENSE OF DATA Donald J. Wheeler SPC Press Knoxville, Tennessee Contents About the Author Introduction ix xi Chapter One Why Continual Improvement? 1 1.1 What is Quality? 3 1.2 The Three Questions
Continuous Improvement Toolkit. Relationship Mapping. Continuous Improvement Toolkit.
 Continuous Improvement Toolkit Relationship Mapping The Continuous Improvement Map Managing Risk FMEA Understanding Performance Check Sheets Data Collection PDPC RAID Log* Risk Assessment* Fault Tree Analysis
SAMPLE REPORT. Desktop Support Benchmark. Outsourced Desktop Support DATA IS NOT ACCURATE!
 SAMPLE REPORT DATA IS NOT ACCURATE! Desktop Support Benchmark Outsourced Desktop Support Report Number: DS-SAMPLE-OUT-0116 Updated: January 2016 MetricNet s instantly downloadable Desktop Support benchmarks
SAMPLE REPORT. Desktop Support Benchmark DATA IS NOT ACCURATE! Outsourced Desktop Support
 SAMPLE REPORT DATA IS NOT ACCURATE! Desktop Support Benchmark Outsourced Desktop Support Report Number: DS-SAMPLE-OUT-0617 Updated: June 2017 MetricNet s instantly downloadable Desktop Support benchmarks
Paste six flip chart sheets on the wall to form a large rectangle. In the center of the sheets draw/write the following:
 TRENDS EXERCISE for Child Care Providers Objectives: After completing this workshop, students will be better able to: Identify internal and external trends, both positive and negative, that affect child
Online Student Guide Types of Control Charts
 Online Student Guide Types of Control Charts OpusWorks 2016, All Rights Reserved 1 Table of Contents LEARNING OBJECTIVES... 4 INTRODUCTION... 4 DETECTION VS. PREVENTION... 5 CONTROL CHART UTILIZATION...
Seven Basic Quality Tools. SE 450 Software Processes & Product Metrics 1
 Seven Basic Quality Tools SE 450 Software Processes & Product Metrics 1 The Seven Basic Tools Checklists (Checksheets) Pareto Diagrams Histograms Run Charts Scatter Diagrams (Scatter Plots) Control Charts
Displaying Bivariate Numerical Data
 Price ($ 000's) OPIM 303, Managerial Statistics H Guy Williams, 2006 Displaying Bivariate Numerical Data 250.000 Price / Square Footage 200.000 150.000 100.000 50.000 - - 500 1,000 1,500 2,000 2,500 3,000
Module 3. Quality Tools. Copyright 2014 J. Ross Publishing Inc Module 3: Quality Tools
 Module 3 Quality Tools Copyright 2014 J. Ross Publishing Inc. 3-1 The material presented in this module is based on: Project Quality Management Why, What and How Second Edition By Kenneth H. Rose, PMP
Modeling with Expressions
 Locker LESSON.1 Modeling with Expressions Common Core Math Standards The student is expected to: A-SSE.1a Interpret parts of an expression, such as terms, factors, and coefficients. Also A-SSE.1b, N-Q.
 Title : Analytics in Agile Project Management Theme: Project Management Leadership > In a Rapidly Changing World Keywords: Agile, Metrics, Analytics, Regression Model Abstract: In the Information revolution
Lecture Notes on Statistical Quality Control
 STATISTICAL QUALITY CONTROL: The field of statistical quality control can be broadly defined as those statistical and engineering methods that are used in measuring, monitoring, controlling, and improving
Project Quality Management. For the PMP Exam using PMBOK
 Project Quality Management For the PMP Exam using PMBOK Guide 5 th Edition PMI, PMP, PMBOK Guide are registered trade marks of Project Management Institute, Inc. Contacts Name: Khaled El-Nakib, PMP, PMI-RMP
6. Which tool is most useful in Pareto analysis, a scatter plot or a histogram?
 1. Which is the older concept, the idea of quality as conformance or quality as improvement? 2. Do control charts assist in monitoring quality as conformance or quality as improvement? 3. Which typically
Why Learn Statistics?
 Why Learn Statistics? So you are able to make better sense of the ubiquitous use of numbers: Business memos Business research Technical reports Technical journals Newspaper articles Magazine articles Basic
Root Cause Analysis. Presented by: Priya Sarjoo Director, Business Advisory Services. February 2, 2012
 Root Cause Analysis Presented by: Priya Sarjoo Director, Business Advisory Services February 2, 2012 Agenda Definition Methodologies Problem identification Process understanding Cause identification Data
The Amazing World of Process Improvement. Introduction
 The Amazing World of Process Improvement Introduction Ice Breaker Zoomed In! Warning: Objects in the mirror are closer than they appear 1 Instructions There will be an image displayed on the screen that
Chapter 2 Ch2.1 Organizing Qualitative Data
 Chapter 2 Ch2.1 Organizing Qualitative Data Example 1 : Identity Theft Identity fraud occurs someone else s personal information is used to open credit card accounts, apply for a job, receive benefits,
introduction by Stacey Barr
 The business questions your performance measures should you can't make informed decisions if the information you're using can't your questions by Stacey Barr introduction The report design working group
Software Engineering Fall 2015 (CSC 4350/6350) TR. 5:30 pm 7:15 pm. Rao Casturi 09/08/2015
 TR. 5:30 pm 7:15 pm. Rao Casturi 09/08/2015") Software Engineering Fall 2015 (CSC 4350/6350) TR. 5:30 pm 7:15 pm Rao Casturi 09/08/2015 http://cs.gsu.edu/~ncasturi1 Functional and Non Functional Requirement Functional Specification a system should
Software Engineering Fall 2015 (CSC 4350/6350) TR. 5:30 pm 7:15 pm Rao Casturi 09/08/2015 http://cs.gsu.edu/~ncasturi1 Functional and Non Functional Requirement Functional Specification a system should
Charting and Diagramming Techniques for Operations Analysis. How to Analyze the Chart or Diagram. Checklist of Questions - Example
 Chapter 9 Charting and Diagramming Techniques for Operations Analysis Sections: 1. Overview of Charting and Diagramming Techniques 2. Network Diagrams 3. Traditional Engineering Charting and Diagramming
The 4 W's are an important guide to a full exploration of the possible root causes to a problem.
 Tools for Analysis Fishbone Diagram (CE Diagram) Introduction: The use of this particular tool, so named because it looks like a fishbone, is an effective way to organize and display the various theories
Before You Start Modelling
 Chapter 2 Before You Start Modelling This chapter looks at the issues you need to consider before starting to model with ARIS. Of particular importance is the need to define your objectives and viewpoint.
Addressing the Challenges of Medical Content Authoring
 Addressing the Challenges of Medical Content Authoring Five Recommendations for Combining English Content Development with Localization A Publication of Lionbridge Life Sciences INTRODUCTION RECOMMENDATION
Spreadsheet Modeling of Spatial Problems for the Classroom
 Decision Sciences Journal of Innovative Education Volume 1 Number 1 Spring 2003 Printed in the U.S.A. TEACHING BRIEF Spreadsheet Modeling of Spatial Problems for the Classroom Michael M. Pearson and Lee
Chapter 4. Phase Four: Evaluating Jobs. Key points made in this chapter
 C H A P T E R F O U R Chapter 4 Phase Four: Evaluating Jobs Key points made in this chapter The evaluation process: should be done on a factor-by-factor basis rather than job-by-job should include a sore-thumbing
Urban Transportation Planning Prof Dr. V. Thamizh Arasan Department of Civil Engineering Indian Institute Of Technology, Madras
 Urban Transportation Planning Prof Dr. V. Thamizh Arasan Department of Civil Engineering Indian Institute Of Technology, Madras Lecture No. # 14 Modal Split Analysis Contd. This is lecture 14 on urban
Continuous Improvement Toolkit. Risk Analysis. Continuous Improvement Toolkit.
 Continuous Improvement Toolkit Risk Analysis The Continuous Improvement Map Managing Risk FMEA Understanding Performance Check Sheets Data Collection PDPC RAID Log* Risk Analysis* Fault Tree Analysis Traffic
Methods for conducting an effective incident analysis (on-site) Become familiar with the 5 Why analysis process
 Become familiar with the 5 Why analysis process") Discuss: Methods for conducting an effective incident analysis (on-site) Become familiar with the 5 Why analysis process Become familiar with the Fishbone Diagram analysis process All Rights Reserved 2
Discuss: Methods for conducting an effective incident analysis (on-site) Become familiar with the 5 Why analysis process Become familiar with the Fishbone Diagram analysis process All Rights Reserved 2
Planning Your Success With Jimmy Petruzzi
 Planning Your Success With Jimmy Petruzzi www.nlp-trainingcourses.com Good time management, as we have already hinted at, is largely about good planning and knowing how to set effective priorities. Understanding
Training: RCA Root Cause Analysis
 Training: RCA Root Cause Analysis The purpose of using the Ishikawa Diagram? What is an Ishikawa Diagram? A Visual Tool to identify, explore and graphically display, all the Possible Causes related to
WOMBAT-CS. Candidate's Manual Electronic Edition. Version 6. Aero Innovation inc.
 WOMBAT-CS Version 6 Candidate's Manual Electronic Edition Aero Innovation inc. www.aero.ca Familiarization with WOMBAT-CS Candidate's Manual This manual should be read attentively by the candidate before
Agile TesTing MeTrics Quality Before Velocity
 Agile TesTing MeTrics Quality Before Velocity Some people never weigh themselves. They may say, i just look at my clothes. if they don t fit, then i know i should lose weight. On the other hand, some people
Scheduling for Success with Critical Chain. Abstract
 by Rob Newbold, September 2010 Abstract The Critical Chain scheduling approach described in this paper can be used to create good schedules that have provided substantial benefits in speed, predictability,
Quality Improvement Plan Grand Forks Public Health Department
 Quality Improvement Plan Grand Forks Public Health Department Adopted on 05/25/2017 Quality Improvement Plan Grand Forks Public Health Department Table of Contents Grand Forks Public Health Department
Introduction to STATISTICAL PROCESS CONTROL TECHNIQUES. for Healthcare Process Improvement
 Introduction to STATISTICAL PROCESS CONTROL TECHNIQUES for Healthcare Process Improvement Preface 1 Quality Control and Healthcare Today 1 New Demands On Healthcare Systems Require Action 1 SPC In Healthcare
Systems Analysis for Business Analysts (3 Day)
") www.peaklearningllc.com Systems Analysis for Business Analysts (3 Day) This is a basic course to help business analysts understand the basics of systems analysis. This course is ideal for people who are
www.peaklearningllc.com Systems Analysis for Business Analysts (3 Day) This is a basic course to help business analysts understand the basics of systems analysis. This course is ideal for people who are
Steam Valve Locked Out in Wrong Position
 Purpose To share lessons learned gained from incident investigations through a small group discussion method format. To understand lessons learned through a Systems of Safety viewpoint. This material was
COACHING TRAINING Participant Workbook
 COACHING TRAINING Participant Workbook Presented by Michael Neill Michael Neill & Associates, Inc. 1613 Mercer Ave. College Park, GA 30337 404. 669.9348 www.michaelneill.com Objectives During this session,
Continuous Improvement Toolkit. Pareto Analysis. Continuous Improvement Toolkit.
 Continuous Improvement Toolkit Pareto Analysis The Continuous Improvement Map Managing Risk FMEA Understanding Performance Check Sheets Data Collection PDPC RAID Log* Risk Assessment* Fault Tree Analysis
SAMPLE REPORT. Desktop Support Benchmark DATA IS NOT ACCURATE! In-house/Insourced Desktop Support
 SAMPLE REPORT DATA IS NOT ACCURATE! Desktop Support Benchmark In-house/Insourced Desktop Support Report Number: DS-SAMPLE-IN-0617 Updated: June 2017 MetricNet s instantly downloadable Desktop Support benchmarks
Six Sigma Black Belt Week 3. Six Sigma Black Belt Week 3. Six Sigma Black Belt Week 3. Project Management. Chapter 3-4
 Chapter 3-4 Project Management 3-4-1 Project Management Six Sigma involves a process of improvement projects. In order for these to be successful they must be managed. 3-4-2 Administrative Support Steering
MODULE 3 Introduction to Quality and Quality Improvement in Health) Unit 3.3 The Theoretical Framework for Modern Quality Improvement
 Unit 3.3 The Theoretical Framework for Modern Quality Improvement") MODULE 3 Introduction to Quality and Quality Improvement in Health) Unit 3.3 The Theoretical Framework for Modern Quality Improvement Unit 3.3: Objectives Discuss Deming s theory of profound knowledge
MODULE 3 Introduction to Quality and Quality Improvement in Health) Unit 3.3 The Theoretical Framework for Modern Quality Improvement Unit 3.3: Objectives Discuss Deming s theory of profound knowledge
Role & Responsibility Charting (RACI)
") Role & Responsibility Charting (RACI) By Michael L Smith and James Erwin See RACI Template too. By Sandra Diaferio OVERVIEW Definition Responsibility Charting is a technique for identifying functional
Role & Responsibility Charting (RACI) By Michael L Smith and James Erwin See RACI Template too. By Sandra Diaferio OVERVIEW Definition Responsibility Charting is a technique for identifying functional
2. List 5 processes of the Executing Process Group. (15)
") CSC 310 Program Management California State University Dominguez Hills Spring 2017 Instructor: Howard Rosenthal Assignment 3b Chapter 3 What Are The Project Management Process Groups The answers to these
CSC 310 Program Management California State University Dominguez Hills Spring 2017 Instructor: Howard Rosenthal Assignment 3b Chapter 3 What Are The Project Management Process Groups The answers to these
Beyond the Basics: Conducting a CNA Training
 Beyond the Basics: Conducting a CNA Training Region VIII ROMA Trainers & Implementers April 23, 2018 Jarle Crocker, PhD, NCRT, CCAP Director of TTA, NCAP Courtney Kohler, MPA, NCRT, CCAP Senior Associate,
1 This document was adapted from information from Center for Public Health Quality, Charlotte Area Health Education Center, NC State University
 1 STEP BY STEP GUIDE TO IMPLEMENT QUALITY IMPROVEMENT SELECT A QI PROJECT Choosing the right project is important. If the project is the first for your organization it is important to choose one that will
Watson-Glaser III Critical Thinking Appraisal (US)
") Watson-Glaser III Critical Thinking Appraisal (US) Development Report Candidate Name: Organization: Pearson Sample Corporation Date of Testing: 21-11-2017 (dd-mm-yyy) 21-11-2017 Page 1 of 15 How to Use
Watson-Glaser III Critical Thinking Appraisal (US) Development Report Candidate Name: Organization: Pearson Sample Corporation Date of Testing: 21-11-2017 (dd-mm-yyy) 21-11-2017 Page 1 of 15 How to Use
CHAPTER 2: ORGANIZING AND VISUALIZING VARIABLES
 2-1 Organizing and Visualizing Variables Organizing and Visualizing Variables 2-1 Statistics for Managers Using Microsoft Excel 8th Edition Levine SOLUTIONS MANUAL Full download at: https://testbankreal.com/download/statistics-for-managers-using-microsoftexcel-8th-edition-levine-solutions-manual/
For the PMP Exam using PMBOK. PMI, PMP, PMBOK Guide are registered trade marks of Project Management Institute, Inc.
 For the PMP Exam using PMBOK Guide 5 th Edition PMI, PMP, PMBOK Guide are registered trade marks of Project Management Institute, Inc. 1 Contacts Name: Khaled El-Nakib, MSc, PMP, PMI-RMP URL: http://www.khaledelnakib.com
Pareto Charts [04-25] Finding and Displaying Critical Categories
![Pareto Charts [04-25] Finding and Displaying Critical Categories](/thumbs/72/68045074.jpg "Pareto Charts [04-25] Finding and Displaying Critical Categories") Introduction Pareto Charts [04-25] Finding and Displaying Critical Categories Introduction Pareto Charts are a very simple way to graphically show a priority breakdown among categories along some dimension/measure
Introduction Pareto Charts [04-25] Finding and Displaying Critical Categories Introduction Pareto Charts are a very simple way to graphically show a priority breakdown among categories along some dimension/measure
WORKGROUP-LEVEL OVERVIEW. What You Will Learn. What You Will Apply To Your Workgroup
 INTRODUCTION TO PERFORMANCE SCORECARDS WORKGROUP-LEVEL OVERVIEW What You Will Learn 1. By implementing Performance Scorecards, you are adopting an organized, proven method of defining key business outcomes
Requirements Analysis: Evaluating KAOS Models
 J. Software Engineering & Applications, 2010, 3, 869-874 doi:10.4236/jsea.2010.39101 Published Online September 2010 (http://www.scirp.org/journal/jsea) 869 Faisal Almisned, Jeroen Keppens King s College,
LEARNING TASKS These tasks match pages 3-13 in Student Guide 1.
 STUDENT LEARNING PLAN Lesson 1-1: Money Habits OVERVIEW Habits can help you soar to success or keep you panting on the treadmill, with success always out of reach. They're sneaky, too. Because habits are
STAT 225 Fall 2009 Exam 1
 STAT 5 Fall 009 Exam 1 Your name: Your Instructor: Your class time (circle one): 7:0 8:0 9:0 10:0 11:0 1:0 1:0 :0 :0 :0 Note: Show your work on all questions. Unsupported work will not receive full credit.
SANTE F, GRANGE. Working document. Pre meeting electronic consultation
 REFERENCE DOCUMENT FOR NAS NETWORK WORKING GROUP ROOT CAUSE ANALYSIS MEETING 15 NOVEMBER 2016 SANTE F, GRANGE Working document Pre meeting electronic consultation (This version is based on comments from
Chapter 2 Analyzing the Business Case
 Chapter 2 Analyzing the Business Case Explain the concept of a business case and how a business case affects an IT project Describe the strategic planning process and why it is important to the IT team
CHAPTER 2: ORGANIZING AND VISUALIZING VARIABLES
 Organizing and Visualizing Variables 2-1 CHAPTER 2: ORGANIZING AND VISUALIZING VARIABLES SCENARIO 2-1 An insurance company evaluates many numerical variables about a person before deciding on an appropriate
BUSS1020 Quantitative Business Analysis
 BUSS1020 Quantitative Business Analysis Week 1 - Introduction and Collecting Data Process of statistical analysis 1. Define the objective, and understand the data we need to collect. 2. Collect the required