SHRM Poll: Drug Testing Efficacy
|
|
|
- Pamela Stephens
- 5 years ago
- Views:
Transcription


1 SHRM Poll: Drug Testing Efficacy In collaboration with and commissioned by the Drug & Alcohol Testing Industry Association (DATIA) September 7, 2011
2 About the Respondents Staff size categories of respondents: The majority of organizations had fewer than 2,500 employees (80%): More than one-third of organizations had 100 to 499 employees (36%). Nearly one-quarter of respondents had 1 to 99 employees (24%). One-fifth of respondents had 500 to 2,499 employees (20%). Sectors of respondents: The majority of organizations were publicly owned for-profits (50%). Almost one-fifth each were from privately owned for-profits (19%) and nonprofit organizations (19%). Industry of respondents: The largest proportion of organizations were from the manufacturing (18%) and health care (14%) industries. 2
3 Key Findings What percentage of organizations conducted pre-employment drug testing in 2011? More than onehalf of organizations (57%) indicated that they conduct drug testing on all job candidates. More than onequarter (29%) of the organizations do not have a pre-employment drug testing program. Is there a tie between drug testing programs and absenteeism? Yes. In organizations with high employee absenteeism rates (more than 15%), the implementation of a drug testing program appears to have an impact. Nine percent of organizations reported high absenteeism rates (>15%) prior to a drug testing program, whereas only 4% of organizations reported high absenteeism rates after the implementation of a drug testing program, a decrease of approximately 50%. Are workers compensation rates affected by drug testing programs? Yes. In organizations with high workers compensation incidence rates (>6%), the implementation of a drug testing program appears to have an impact. Fourteen percent of organizations reported high workers compensation incidence rates prior to a drug testing program, whereas only 6% of organizations reported similar rates of workers comp after the implementation of a drug testing program, a decrease of approximately 50%. Do drug testing programs improve employee productivity rates? Nearly one-fifth (19%) of organizations experienced an increase in productivity after the implementation of a drug testing program. How much of an impact do drug testing programs have on employee turnover rates? Sixteen percent of organizations saw a decrease in employee turnover rates after the implementation of drug testing programs. Do multinational organizations apply similar drug testing protocols/policies in the United States and globally? Nearly three-quarters (72%) of organizations that have multinational operations indicated that all, almost all or some of the same protocols/policies are applied while conducting drug tests outside the United States. 3
4 Organizations with Drug Testing Programs Pre-employment with job candidates Post-employment with employees Pre-and/or post-employment with contract employees 4


5 How are you involved in your organization s drug testing program? Note: n = 636. HR professionals who answered not sure were excluded from this analysis. Percentages do not total 100% due to rounding. 5


6 For approximately how many years has your organization been conducting pre and/or post employment drug testing? Note: n = 626. Percentages do not total 100% due to rounding. HR professionals were asked to round to the highest year. 6


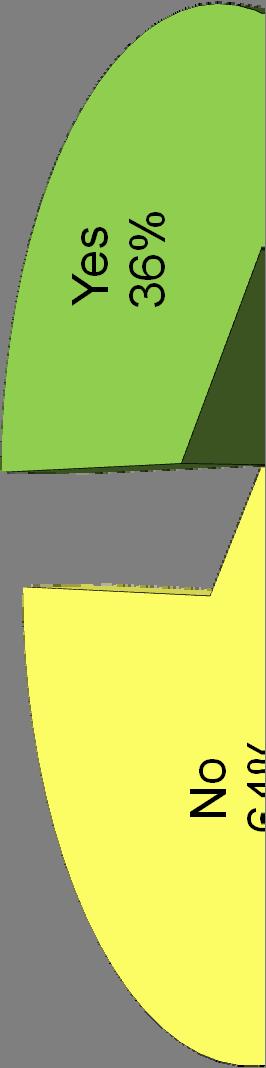
7 Does your organization conduct pre employment drug testing with job candidates? Note: HR professionals who answered not sure were excluded from this analysis. 7
8 Does your organization conduct pre employment drug testing with job candidates? Comparison by Organization Staff Size Larger organizations (2,500 or more employees) are more likely to conduct pre employment drug testing for all job candidates compared with smaller organizations (fewer than 2,500 employees). Smaller Organizations Larger Organizations Differences Based on Organization Staff Size 1 to 99 employees (39%) 100 to 499 employees (56%) 500 to 2,499 employees (62%) 2,500 to 24,999 employees (71%) 25,000 + employees (71%) Larger organizations > smaller organizations Comparison by Organization Sector Publicly owned for profit organizations are more likely to conduct pre employment drug testing for all job candidates compared with privately owned organizations, nonprofit organizations and government agencies. Publicly owned for profit (71%) Organization Sector Privately owned for profit (55%) Nonprofit organizations (49%) Government agencies (51%) Differences Based on Organization Sectors Publicly owned for profit > Privately owned for profit Nonprofit organizations Government agencies Government agencies are more likely to conduct pre employment drug testing for selected job candidates compared with publicly owned for profit organizations, privately owned for profit organizations and nonprofit organizations. Government agencies (23%) Organization Sector Publicly owned for profit (8%) Privately owned for profit (8%) Nonprofit organizations (6%) Differences Based on Organization Sectors Government agencies > Publicly owned for profit Privately owned for profit Nonprofit organizations 8


9 Does your organization conduct post employment drug testing with current employees? 9


10 Does your organization conduct pre and/or post employment drug testing with its contract employees? Note: n = 754. HR professionals who responded not applicable and not sure were excluded from this analysis. Percentages do not total 100% due to rounding. 10
11 Does your organization conduct pre and/or post employment drug testing with its contract employees? Comparison by Organization Staff Size Larger organizations (500 or more employees) are more likely to conduct pre employment drug testing for contract employees compared with smaller organizations (fewer 500 employees). Smaller Organizations Larger Organizations Differences Based on Organization Staff Size 1 to 99 employees (17%) 100 to 499 employees (19%) 500 to 2,499 employees (30%) 2,500 to 24,999 employees (36%) 25,000+ employees (44%) Larger organizations > smaller organizations 11
12 Which of the following post employment drug tests does your organization conduct? Drug Test Used Post-accident testing (administered to all employees who are or may have been involved in a workplace accident) Random testing (conducted on an unannounced basis using a neutral selection process and has the highest deterrence and detection impacts; a certain portion of the employee population is randomly selected periodically throughout the year) Reasonable suspicion testing (occurs when an employer has reason to believe that an employee is under the influence of drugs and/or alcohol) Follow-up testing (conducted during and after an employee has been referred to an employee assistance or other rehabilitation program) For-cause testing is based on indicia that an employee may have a substance-abuse problem (e.g. excessive absenteeism, performance problems, dramatic mood swings, etc.). Site testing (based on suspicion of a significant drug-abuse problem e.g., based on employee complaints at a specific work site and involves testing of all employees at that site on a one-time basis) Baseline testing (conducted to establish the level of drug use at implementation of a program; this method essentially cleans house to establish a drug-free workplace) 2011 (n = 313) 2010 (n = 222) 2006 (n = 222) 51% 69% 58% 47% 46% 39% 35% 80% 73% 20% 30% * 19% * * 8% 13% * 6% 22% 1% Other 4% * * Note: Percentages do not total 100% due to multiple responses. * indicates question was not asked. 12


13 To what degree are the U.S. pre and/or post employment protocols/polices also applied at locations outside the United States? Note: n = 150. Percentages do not total 100% due to rounding. Only organizations with multinational operations were asked this question. 13
14 Impact of Drug Testing Programs Absenteeism Workers compensation Employee productivity Employee turnover 14
15 Absenteeism rates at organizations before and after drug testing program implementation Before implementation of a drug testing program (n = 162) After implementation of a drug testing program (n = 218) 0-15% 91% 96% More than 15% 9% 4% 9% of organizations reported high absenteeism rates, (more than 15%). After implementation of a drug testing program only 4% of organizations reported high absenteeism rates, a decrease of approximately 50%. Note: HR professionals who answered not sure were excluded from this analysis. 15
16 Workers compensation incidence rates at organizations before and after drug testing program implementation Before implementation of a drug testing program (n = 255) After implementation of a drug testing program (n = 312) 0-6% 86% 94% More than 6% 14% 6% 14% of organizations reported high workers compensation incidence rates prior to a drug testing program, whereas only 6% of organizations reported similar rates of workers comp after the implementation of a drug testing program, a decrease of approximately 50%. Note: HR professionals who answered not sure were excluded from this analysis. 16
 of organizations experienced an increase in")

17 Change in employee productivity in organizations after drug testing program implementation Nearly one-fifth (19%) of organizations experienced an increase in productivity after the implementation of a drug testing program. Note: n = 513. HR professionals who answered not sure were excluded from this analysis. Percentages do not total 100% due to rounding. 17


18 Change in employee turnover rates in organizations after drug testing program implementation 16% of organizations saw a decrease in employee turnover rates after the implementation of drug testing programs. Note: n = 520. HR professionals who answered not sure were excluded from this analysis. 18
19 How Drug Tests Are Performed Where? What type? How much? 19
20 Does your organization conduct drug testing in house or at an off site testing facility run by another entity? n =


21 What type of sample is used for your organization s drug testing program? Note: n = 634. Percentages do not total 100% due to multiple responses. 21
22 How much does it cost your organization each time a drug test in conducted (per employee or job candidate)? n =
23 Characteristics of Organizations With Drug Testing Programs 23


24 What is the average entry level full time annual salary at your organization? n =


25 In 2010, how much did your organization spend on recruiting, training and drug testing combined? Note: n = 595. Percentages do not total 100% due to rounding. 25
26 Organizations that Do Not Have Drug Testing Programs 26


27 What are the primary reasons your organization does not conduct pre and/or post employment drug testing? Note: n = 262. Percentages do not total 100% due to rounding. 27
28 What is the primary reason your organization does not conduct pre and/or post employment drug testing? Comparison by Organization Staff Size My organization does not believe in drug testing Not required to do drug testing by state 1-99 employees (n = 104) employees (n = 95) 500-2,499 employees (n = 36) 2,500-24,999 employees (n = 21) 25,000 or more employees (n = 6) 23% 22% 28% 19% 17% 21% 6% 25% 24% 33% No return on investment 11% 19% 25% 5% 0% Too costly 14% 19% 11% 19% 17% Not applicable/not necessary 15% 10% 0% 0% 0% Administratively difficult 4% 9% 3% 19% 0% Plan to conduct drug testing in the future 4% 3% 0% 0% 0% Other 7% 11% 8% 14% 33% Note: n = 262. Some row percentages do not total 100% due to rounding. Caution should be used when generalizing results when the sample size is less than 30 for any category. 28
29 Demographics 29
30 Demographics: Industry Industry Manufacturing 18% Health care and social assistance 14% Professional, scientific and technical services 11% Finance and insurance 9% Educational services 5% Public administration 5% Retail trade 4% Accommodation and food services 3% Construction 3% Utilities 3% Arts, entertainment and recreation 2% Information 2% n = 1,024 30
31 Demographics: Industry (Continued) Industry Real estate and rental and leasing 2% Religious, grant making, civic, professional and similar organizations 2% Transportation and warehousing 2% Wholesale trade 2% Administrative and support and waste management and remediation services 1% Agriculture, forestry, fishing and hunting 1% Management of companies and enterprises 1% Mining 1% Repair and maintenance 1% Personal and laundry services Private households Other services except public administration 8% n = 1,024 31


32 Demographics: Organization Staff Size Note: n = 899. Percentages do not total 100% due to rounding. 32


33 Demographics: Organization Sector 33
34 Demographics: Other Does your organization have U.S.-based operations (business units) only or does it operate multinationally? U.S.-based operations 78% Multinational operations 23% Note: n = 906. Percentages do not total 100% due to rounding. Is your organization a single-unit company or a multi-unit company? Single-unit company: A company in which the location and the company are the same. Multi-unit company: A company that has more than one location. Note: n = % 68% Are HR policies and practices determined by the multi-unit corporate headquarters, by each work location or both? Multi-unit headquarters determines HR policies and practices Each work location determines HR policies and practices 57% 3% Level of HR department/function for which you responded through this survey. Corporate (company wide) 75% Business unit/division 14% Facility/location 11% A combination of both the work location and the multi-unit headquarters determine HR policies and practices 40% Note: n = 621 Note: n =
35 SHRM/DATIA Poll: Drug Testing Efficacy Methodology Response rate = 20% Sample composed of 1,058 randomly selected HR professionals from SHRM s membership Margin of error is +/- 3% Survey fielded March 1-14 th, 2011 For more poll findings, visit Follow us on Twitter: 35
Know the numbers. Take a lead. Understand your employees.
 Introduction Employees who take most or all of their vacation time each year perform better, are more productive and more satisfied in their jobs than those who do not, according to HR professionals. In
SHRM Survey Findings: Paid Leave in the Workplace
 SHRM Survey Findings: Paid Leave in the Workplace November 13, 2013 Definitions Paid time off plans: a paid time off (PTO) plan includes sick, vacation and personal days all in one plan. This excludes
SHRM Survey Findings: Employee Recognition Programs, Spring In collaboration with and commissioned by Globoforce
 SHRM Survey Findings: Employee Recognition Programs, Spring 2013 In collaboration with and commissioned by Globoforce May 29, 2013 Introduction Twice a year, Globoforce conducts a survey with the Society
SHRM Survey Findings: Diversity and Inclusion
 SHRM Survey Findings: Diversity and Inclusion April 8, 2014 Key Findings Who is responsible for implementing and leading diversity initiatives in the workplace? More than three-fifths (64%) of organizations
SHRM Survey Findings: The Aging Workforce Basic and Applied Skills. Funded by the Alfred P. Sloan Foundation
 SHRM Survey Findings: The Aging Workforce Basic and Applied Skills Funded by the Alfred P. Sloan Foundation January 12, 2015 Introduction and Definition Introduction SHRM and the SHRM Foundation have launched
December Talent Acquisition Benchmarking Report
 December 2017 2017 Talent Acquisition Benchmarking Report HR Metrics SHRM s Benchmarking Service To view sample reports or place an order, visit shrm.org/benchmarks or call (703) 535-6366 Are you looking
OUTSOURCING IN BENEFITS AND COMPENSATION SERVICES
 OUTSOURCING IN BENEFITS AND COMPENSATION SERVICES A Survey of WorldatWork members by WorldatWork and Krannert Business School (Purdue University) June 2003 Methodology This report summarizes the results
FLIN FLON AND REGION Economic Profile
 FLIN FLON AND REGION Economic Profile This report contains demographic, job and business data. The data in this report provide basic information about the economy of the region in order to inform the strategic
ST. ANDREWS AND REGION
 ST. ANDREWS AND REGION Economic Profile This report contains demographic, job and business data within the geographic boundaries of the area known as St. Andrews Self-contained Labour Area (SLA). It includes
GRAND RAPIDS AND REGION Economic Profile
 GRAND RAPIDS AND REGION Economic Profile This report contains demographic, job and business data. The data in this report provides basic information about the economy of the region in order to inform the
Consumption Matrices and the Economy. In the early 1970's Wassily Leontief was doing research on how changes in one
 Consumption Matrices and the Economy 1 Benson Haglund Consumption Matrices and the Economy In the early 1970's Wassily Leontief was doing research on how changes in one economic sector may have an effect
City of Barrie "Open for Business" Survey
 City of Barrie "Open for Business" Survey 1. What does Open for Business mean to you? Please check all that apply. One-stop shop (accessing all the City services I require in person, on the phone or through
City of Hamilton Annual. Employment Survey 2016 AND 2017 TABLES AND CHARTS
 City of Hamilton Annual Employment Survey 2016 AND 2017 TABLES AND CHARTS Table of Contents KEY HIGHLIGHTS... 2 CITY-WIDE EMPLOYMENT... 4 EMPLOYMENT BY AREA... 9 HAMILTON URBAN GROWTH AREA... 9 EMPLOYMENT
LEAF RAPIDS AND REGION Economic Profile
 LEAF RAPIDS AND REGION Economic Profile This report contains demographic, job and business data. The data in this report and the analysis provide basic information about the economy of the region in order
Labor and Business Statistics For Fidalgo Island (Zip code 98221)
") Labor and Business Statistics For Fidalgo Island (Zip code 98221) May 27, 2016 Prepared for Anacortes Chamber of Commerce Prepared by Table of Contents Notes About This Report... 3 About the Authors...
Labor and Business Statistics For Fidalgo Island (Zip code 98221) May 27, 2016 Prepared for Anacortes Chamber of Commerce Prepared by Table of Contents Notes About This Report... 3 About the Authors...
Alberta Ministry of Labour 2017 Alberta Wage and Salary Survey (AWSS)
") 1 Alberta Ministry of Labour 2017 Alberta Wage and Salary Survey (AWSS) The Alberta Wage and Salary Survey is undertaken by the Alberta Ministry of Labour to provide current wage rates and skill shortage
1 Alberta Ministry of Labour 2017 Alberta Wage and Salary Survey (AWSS) The Alberta Wage and Salary Survey is undertaken by the Alberta Ministry of Labour to provide current wage rates and skill shortage
THOMPSON AND REGION Economic Profile
 THOMPSON AND REGION Economic Profile This report contains demographic, job and business data. The data in this report provide basics information about the economy of the region in order to inform the strategic
VIRDEN AND REGION. Economic Profile
 VIRDEN AND REGION Economic Profile This report contains demographic, job and business data within the geographic boundaries of the area known as Virden Self-contained Labour Area (SLA). It includes the:
Yukon Bureau of Statistics
 Yukon Bureau of Statistics 2 9 # 1 $ > - 2 + 6 & ± 8 < 3 π 7 5 9 1 ^ Highlights: Survey of Employment, Payroll and Hours 21 There were 19,725 employees in Yukon in 21, and weekly earnings averaged $919.32.
Greater Spokane Talent Alignment Survey: Preliminary Report. Submitted December Dan Ash PhD Megan Church- Nally PhD Matt Bergman PhD 1
 Greater Spokane Talent Alignment Survey: Preliminary Report Submitted December 2016 Dan Ash PhD Megan Church- Nally PhD Matt Bergman PhD 1 GREATER SPOKANE TALENT ALIGNMENT SURVEY The Greater Spokane Talent
GLADSTONE AND REGION. Economic Profile
 GLADSTONE AND REGION Economic Profile This report contains demographic, job and business data within the geographic boundaries of the area known as Gladstone Self-contained Labour Area (SLA). It includes
MELITA AND REGION Economic Profile
 MELITA AND REGION Economic Profile This report contains demographic, job and business data within the geographic boundaries of the area known as Melita Self-contained Labour Area (SLA). It includes the:
Counts and Density of All Jobs in Work Selection Area in All Workers
 OnTheMap Work Area Profile Report All Jobs for All Workers in. Created by the U.S. Census Bureau s OnTheMap http://onthemap.ces.census.gov on 02/18/2014 s and Density of All Jobs in Work Selection Area
Counts and Density of All Jobs in Work Selection Area in All Workers
 OnTheMap Work Area Profile Report All Jobs for All Workers in. Created by the U.S. Census Bureau s OnTheMap http://onthemap.ces.census.gov on 02/18/2014 s and Density of All Jobs in Work Selection Area
A WorldatWork Survey Brief. FMLA Perspectives and Practices
 A WorldatWork Survey Brief FMLA Perspectives and Practices Survey of WorldatWork Members April, 2005 About WorldatWork and WorldatWork Membership Surveys WorldatWork is the worldπs leading not-for-profit
NEEPAWA AND REGION Economic Profile
 NEEPAWA AND REGION Economic Profile This report contains demographic, job and business data. The data in this report and the analysis provide basic information about the economy of the region in order
Who Earns $15 in St Paul?
 The St Paul Minimum Wage Study Committee Supplement 06--08-A Who Earns $ in St Paul? Committee Question Supplement SHORT ANSWER: In the City of St Paul, 3 percent of workers earn $ an hour or less, with
GIMLI AND REGION. Economic Profile
 GIMLI AND REGION Economic Profile This report contains demographic, job and business data within the geographic boundaries of the area known as the Gimli Self-contained Labour Area (SLA). It includes the:
A Comparison of Contributions to the Canadian Economy of Key Bulk Commodity Shippers and Rail Freight Carriers
 Policy and Economic Analysis Program Rotman School of Management University of Toronto 140 St. George St., Ste 325 Toronto, Ontario M5S 3G6 Final Report October 2009 A Comparison of Contributions to the
Human Resources Trends for 2019 Insights on what HR leaders are expecting in the coming year: Summary report. October 2018
 Human Resources Trends for 2019 Insights on what HR leaders are expecting in the coming year: Summary report October 2018 Table of contents 1 Executive Summary 3 HR priorities for 2019 5 Expected changes
BUSINESSES CHOOSE TO BE NEAR TRANSIT
 BUSINESSES CHOOSE TO BE NEAR TRANSIT Data Shows Importance of Proximity to Bus or Rail Stop The business community understands the benefits that accrue from transit-accessible locations, which help explains
See footnotes at end of table. Table 4. Incidence rates 1 and numbers of nonfatal occupational injuries by selected industries, Louisiana, 2016
 All industries including state and local government 4 2.1 34.0 Private industry 4 1.8 24.2 Goods-producing 4 1.3 4.4 Natural resources and mining 4,5 1.0 0.5 Mining, quarrying, and oil and gas extraction
COMMUNITY WORKPLACE POPULATION Cuero, Texas
 COMMUNITY WORKPLACE POPULATION Prepared for Cuero Development Corporation December 2016 LOCATION FortMorganCO_RTA_Map_2016 CUERO CONTACT PATRICK J. KENNEDY, EDFP, EXECUTIVE DIRECTOR 0 mi Cuero Development
Targeted Regional Economic Development. Tom Harris University of Nevada, Reno Department of Economics University Center for Economic Development
 Targeted Regional Economic Development Tom Harris University of Nevada, Reno Department of Economics University Center for Economic Development WHY USE DATA FOR ECONOMIC TARGETING and CLUSTER ANALYSIS?
ALL APPLICATIONS MUST BE SUBMITTED ONLINE this document is only meant to help the applicant prepare for the application process
 APPLICATION FOR FAMILY FRIENDLY BUSINESS AWARD ALL APPLICATIONS MUST BE SUBMITTED ONLINE this document is only meant to help the applicant prepare for the application process Your Information Name * First
Labour Market Information
 Our third annual Building Connections event Labour Market Information 101 FOR EMPLOYERS OttawaEmploymentHub.ca This program is funded in part by the Government of Canada and the Government of Ontario We
5-MILE RADIAL WORKPLACE POPULATION Mansfield, Texas
 5-MILE RADIAL WORKPLACE POPULATION Prepared for Mansfield Economic Development Corporation June 2016 5-MILE RADIAL Grand Prairie, Texas, United States MANSFIELD CONTACT RICHARD NEVINS, ASSISTANT DIRECTOR
RESEARCH REPORT SHRM / GLOBOFORCE. Employee Recognition Survey FALL 2012 REPORT THE BUSINESS IMPACT OF EMPLOYEE RECOGNITION
 SHRM / GLOBOFORCE Employee Recognition Survey FALL 2012 REPORT THE BUSINESS IMPACT OF EMPLOYEE RECOGNITION RESEARCH REPORT EXECUTIVE SUMMARY SHRM/Globoforce Fall 2012 Report // 2 Succession planning, employee
STATE OF HAWAI'I. No. of. Total Average Rep. Units Average Quarterly Quarterly Industry March Employment Wages Wages January February March
 STATE OF HAWAI'I TOTAL, including government 37,439 598,205 6,028,316,620 10,077 596,822 598,744 599,049 TOTAL GOVERNMENT 6 123,628 1,526,182,323 12,345 121,692 123,988 125,205 Federal 1 32,650 483,102,256
STATE OF HAWAI'I. No. of. Total Average Rep. Units Average Quarterly Quarterly Industry September Employment Wages Wages July August September
 STATE OF HAWAI'I TOTAL, including government 37,044 581,957 6,080,565,857 10,448 581,677 578,368 585,826 TOTAL GOVERNMENT 6 118,031 1,532,738,257 12,986 118,907 114,660 120,525 Federal 1 34,864 560,380,978
Business-Facts Summary - 3 Digit NAICS Summary
 - 3 Digit NAICS Summary Title Page Title Page Data Version: 2018 Feb (Internal) Report Generation Method: Single Analysis Area: 1789 STATE ST, SAN DIEGO, CA, 92101-2530 Reporting Detail: As Selected Include
Appendix E: Nonresponse Analysis for Analysis Cycles 9 Through 12
 Appendix E: Nonresponse Analysis for Analysis Cycles 9 Through 12 Appendix E: Nonresponse Analysis Establishments can cause nonresponse in the O*NET Data Collection Program at the verification, screening,
Finding federal government data on the number of workers in your state, by industry, and your state s average weekly wage.
 Finding federal government data on the number of workers in your state, by industry, and your state s average weekly wage. February 2010 This guide provides step-by-step instructions for extracting data
Business-Facts Summary Dublin city, CA ( )
") 3 Digit NAICS Top Ten Summary Healthcare and Social Assistance Ambulatory Health Care Retail Trade Professional, Scientific, and Technical Other (except Public Administration) Retail Trade Retail Trade
3 Digit NAICS Top Ten Summary Healthcare and Social Assistance Ambulatory Health Care Retail Trade Professional, Scientific, and Technical Other (except Public Administration) Retail Trade Retail Trade
GTAC Mine Public Opinion Survey
 GTAC Mine Public Opinion Survey Aleksei Bogdanov and Zamira Simkins, Ph.D. University of Wisconsin-Superior A GTAC company proposed to develop an iron ore mine along the Penokee Range in Ashland and Iron
Region One Workforce Investment Board Partnership. Region One Priority Industry Sectors
 Region One Priority Industry Sectors Executive Summary The four priority target sectors selected by Region one includes: Construction (NAICS 236 238, excluding Residential) Manufacturing (NAICS 324-333),
COMMUNITY WORKPLACE POPULATION Manvel, Texas
 COMMUNITY WORKPLACE POPULATION Prepared for Manvel Economic Development Corporation August 2016 LOCATION MANVEL CONTACT KYLE J. JUNG, CITY MANAGER City of Manvel 20025 Highway 6 77578 281.489.0630 281.489.0634
MASTER PLAN. Public Workshop Overview Presentation
 MASTER PLAN Public Workshop Overview Presentation MURRAY CITY HALL September 27, 2018 Purpose of the Project Assess the built environment and development conditions Understand the physical and environmental
The U.S. is getting new data for a New Economy and it s about time. BUSINESS WEEK. calibrating a new economy. Economic Classification Policy Committee
 The U.S. is getting new data for a New Economy and it s about time. BUSINESS WEEK calibrating a new economy Economic Classification Policy Committee www.census.gov/naics hat is NAICS? NAICS (pronounced
Questionnaire. Section 1. General data
 Questionnaire This questionnaire that can be completed online at www.euricse.eu/en/worldcooperativemonitor. If you prefer to fill the questionnaire out in paper form, please fill this document and return
The State of Performance Management
 A WorldatWork Survey Brief The State of Performance Management Survey of WorldatWork Members August 2004 Conducted by WorldatWork, Sibson and Synygy About WorldatWork and WorldatWork Membership Surveys
Q1 How many employees does your company currently employ? Q2 How many hours worked per week does your organization consider to be full-time?
 Q How many employees does your company currently employ? Answered: Skipped: Average Number Total Number Full-time Part-time Seasonal/Temporary 66 2,85 29 4 4,85 2 46,885 95 Total Respondents: Q2 How many
Reduce, Reuse, Recycle: Green Technologies and Practices at Work
 Cornell University ILR School DigitalCommons@ILR Federal Publications Key Workplace Documents 3-2013 Reduce, Reuse, Recycle: Green Technologies and Practices at Work Audrey Watson Bureau of Labor Statistics
April An Analysis of Newfoundland and Labrador s Productivity, : Mining, and Oil and Gas Extraction Drives Strong Productivity Growth
 April 2011 111 Sparks Street, Suite 500 Ottawa, Ontario K1P 5B5 613-233-8891, Fax 613-233-8250 csls@csls.ca CENTRE FOR THE STUDY OF LIVING STANDARDS An Analysis of Newfoundland and Labrador s Productivity,
Labour Market Information
 Labour Market Information 101 FOR EMPLOYMENT SERVICE PROVIDERS OttawaEmploymentHub.ca This program is funded in part by the Government of Canada and the Government of Ontario We will discuss: What is LMI?
The implementation of tools to support the data quality of the Business Register at Statistics Canada
 The implementation of tools to support the data quality of the Business Register at Statistics Canada Mario Ménard, Canada Abstract Business Registers contains a vast array of information concerning enterprises.
2005 Survey Results for f E-Myth Worldwide s Mastery Program Coaching Clients
 2005 Survey Results for f E-Myth Worldwide s Mastery Program Coaching Clients Table of Contents About E-Myth Worldwide.......................... 1 Survey Background and Objectives................. 3 Survey
Business-Facts: 3 Digit NAICS Summary 2015
 Business-Facts: 3 Digit Summary 215 Lake Anne 215 Polygon 1: LAKE ANNE 2, 11 Agriculture, Forestry, Fishing and Hunting 111 Crop Production 112 Animal Production and Aquaculture 113 Forestry and Logging
Leading Across the Organization. Profile of the Professionals 2013 Executive Summary
 Leading Across the Organization Profile of the Professionals 2013 Executive Summary Introduction The Profile of the Professionals 2013 looks at the job satisfaction, professional development, motivations,
BEFORE THE NEW YORK STATE PUBLIC SERVICE COMMISSION
 BEFORE THE NEW YORK STATE PUBLIC SERVICE COMMISSION In the Matter of the Application of Central Hudson Gas & Electric Corporation For a Certificate of Environmental Compatibility and Public Need Pursuant
COMMUNITY WORKPLACE POPULATION McHenry, Illinois
 COMMUNITY WORKPLACE POPULATION Prepared for City of McHenry September 2018 LOCATION CONTACT DOROTHY M. WOLF, ECONOMIC DEVELOPMENT COORDINATOR City of McHenry 333 S Green Street 60050 815.363.2175 dwolf@ci.mchenry.il.us
Business-Facts: 3 Digit NAICS Summary 2015
 Business-Facts: 3 Digit NAICS Summary 25 McLean CRD 25 Polygon : MCLEAN, NAICS Code Business Description Establishment Employees Sales (in Millions) Agriculture, Forestry, Fishing and Hunting Crop Production
Code Description Definition. The Sector as a Whole. 11 Agriculture, Forestry, Fishing and Hunting
 Code Description 11 Agriculture, Forestry, Fishing and Hunting 21 Mining, Quarrying, and Oil and Gas Extraction 22 Utilities 23 Construction 31-33 Manufacturing 42 Wholesale Trade 44-45 Retail Trade 48-49
Employment Ontario Information System (EOIS) Case Management System
 Case Management System") Employment Ontario Information System (EOIS) Case Management System Service Provider User Guide: Reporting Canada Ontario Job Grant Employers (Client Level) #95 Version 1.2 September 2017 Table of Contents
Employment Ontario Information System (EOIS) Case Management System Service Provider User Guide: Reporting Canada Ontario Job Grant Employers (Client Level) #95 Version 1.2 September 2017 Table of Contents
Global Compensation Practices. A WorldatWork Survey Brief
 A WorldatWork Survey Brief Global Compensation Practices Survey of WorldatWork Members September 2004 Conducted by WorldatWork and Watson Wyatt Worldwide About WorldatWork and WorldatWork Membership Surveys
Business-Facts: 3 Digit NAICS Summary 2015
 Business-Facts: 3 Digit NAICS Summary 215 Polygon 1:, Total NAICS Code Business Description Total Establishment Total Employees Sales (in Millions) 11 Agriculture, Forestry, Fishing and Hunting 111 Crop
Presentation by Rick Engler, Director, New Jersey Work Environment Council (WEC) OSHA Listens, March 4, 2010, Washington, D.C.
 OSHA Listens, March 4, 2010, Washington, D.C.") Presentation by Rick Engler, Director, New Jersey Work Environment Council (WEC) OSHA Listens, March 4, 2010, Washington, D.C. The New Jersey Work Environment Council is an alliance of 70 labor, environmental,
Presentation by Rick Engler, Director, New Jersey Work Environment Council (WEC) OSHA Listens, March 4, 2010, Washington, D.C. The New Jersey Work Environment Council is an alliance of 70 labor, environmental,
EmployerOne Survey 2018 Cross Tabulations
 EmployerOne Survey 2018 Cross Tabulations EMO Workforce Planning and Development Board and Local Employment Planning Council Emilian Siman, Data Analyst emilian@ workforcedevelopment.ca Introduction of
Thank you for an outstanding year and supporting our existing Iowa employers.
 December 2016 Iowa is a leader in business retention and expansion programming. The collaboration and coordination between economic development professionals, utilities, community colleges and many others
The robots are coming! The robots are coming!
 The robots are coming! The robots are coming! 2017 Economic Symposium October 20, 2017 Cynthia Forland, CIO and Assistant Commissioner Workforce Information and Technology Services Oh, wait... they re
Business-Facts: 3 Digit NAICS Summary 2015
 Business-Facts: 3 Digit NAICS Summary 215 Polygon 1:, Total NAICS Code Business Description Total Establishment Total Employees Sales (in Millions) 11 Agriculture, Forestry, Fishing and Hunting 111 Crop
The Cost of Congestion: Breaking Down Societal Benefits and Consumer Costs
 FREIGHT POLICY TRANSPORTATION INSTITUTE The Cost of Congestion: Breaking Down Societal Benefits and Consumer Costs Justin Taylor, Ken Casavant, Jeremy Sage and Barbara Ivanov Congestion on the urban road
MIDDLE-INCOME JOB DECLINE IN PENNSYLVANIA
 MIDDLE-INCOME JOB DECLINE IN PENNSYLVANIA Update 2001-13: Business-Cycle, Great Recession and Recovery Prepared at the Center for Economic and Community Development by: Theodore R. Alter, Regional Economist
Louisiana. NAICS code 1. Total recordable cases
 Table A-1. Percent relative standard errors for incidence rates of nonfatal occupational injuries and illnesses by industry and case types, 2012 recordable away from work, job transfer, or All industries
Eurostat : Fatal and serious accidents at work in 2009
 Eurostat : Fatal and serious accidents at work in 2009 The FIEC-EFBWW H&S Guide Eléments d identité EUROPEAN CONSTRUCTION INDUSTRY FEDERATION 14.04.2014 Construction Manufacturing Transportation and storage
BusinessCounts Methodology 2015A Release June 2015
 Introduction BusinessCounts is a geographic summary database of business establishments and employees for nearly ten million businesses and one hundred and thirty million employees. The database is available
High concern from employers on skills
 High concern from employers on skills The NSW Business Chamber s inaugural Workforce Skills Survey has found that member businesses are highly concerned about the impact of skills shortages on their future
2019 Survey of Salary Structure Policies and Practices
 2019 Survey of Salary Structure Policies and Practices The following report summarizes the results of a survey that was sent out in September 2018 to WorldatWork members and nonmembers to collect information
Employment and Wage Trends 3 rd Quarter 2015 for the Mining Sector by Parish
 Mining Sector Profile for Houma RLMA Parishes The Labor Market information (LMI) division of Research and Statistics helps provide information on various sectors in the regional economy. Reports and tables
Private Sector Employment, New Jersey
 Data for Decision Making Series October 2017 Private Sector Employment, New Jersey Hiring Needs by Sectors The sectors that experienced the most hiring in the 3rd quarter 2016 were professional and business
April An Analysis of New Brunswick s Productivity Performance, : Labour Productivity Driven by Capital Intensity Growth CENTRE FOR
 April 2011 111 Sparks Street, Suite 500 Ottawa, Ontario K1P 5B5 613-233-8891, Fax 613-233-8250 csls@csls.ca CENTRE FOR THE STUDY OF LIVING STANDARDS An Analysis of New Brunswick s Productivity Performance,
Homework 8 (80 Points)
") Homework 8 (80 Points) due: 12/30 Part I (40 Points) 1. Consider total cost and total revenue given in the following table: Is the firm in a competitive industry? (2 Points) Can you tell whether the industry
Homework 8 (80 Points) due: 12/30 Part I (40 Points) 1. Consider total cost and total revenue given in the following table: Is the firm in a competitive industry? (2 Points) Can you tell whether the industry
Ashford Economy Overview. Emsi Q Data Set, Sept 2018
 Ashford Economy Overview Emsi Q1 2018 Data Set, Sept 2018 Economy Overview Ashford Emsi Q1 2018 Data Set September 2018 Emsi Q1 2018 Data Set www.economicmodeling.com 1 Parameters Regions Code 29UB Description
HR Trends Western Canada Report - Fall 2018
 HR Trends Western Canada Report - Fall 2018 p. 1 WESTERN CANADA HR TRENDS REPORT FALL 2018 TABLE OF CONTENTS 1. Labour Market Forecast a. Hiring Confidence Index 2 b. The Six Month Outlook 3 2. Labour
WESTERN CANADA HR TRENDS REPORT FALL 2018
 WESTERN CANADA HR TRENDS REPORT FALL 2018 TABLE OF CONTENTS 1. Labour Market Forecast a. Hiring Confidence Index 2 b. The 6 Month Outlook 3 2. Labour Market Statistics a. Current Trends 6 b. Termination
April An Analysis of Manitoba s Productivity, : Above Average Labour Productivity Growth Lead to Convergence Towards the National Level
 April 2011 111 Sparks Street, Suite 500 Ottawa, Manitoba K1P 5B5 613-233-8891, Fax 613-233-8250 csls@csls.ca CENTRE FOR THE STUDY OF LIVING STANDARDS An Analysis of Manitoba s Productivity, 1997-2007:
Employment & Unemployment
 Employment & Unemployment Estimates for August 2006 Unemployment Rates: Nevada Statewide 4.2% (Seasonally Adjusted) Las Vegas-Paradise MSA 4.1% Reno-Sparks MSA 3.7% Carson City MSA 4.5% Elko Micropolitan
Keeping Pace with Employers
 Keeping Pace with Employers Making sense of future needs & current hiring difficulties Jeff DeBellis NC Department of Commerce, LEAD NC s primary source of economic & labor market data, information, &
การจ ดประเภทมาตรฐานอ ตสาหกรรมประเทศไทย ป 2552
 Thailand Standard Industrial Classification : TSIC-2009 การจ ดประเภทมาตรฐานอ ตสาหกรรมประเทศไทย ป 2552 Employment Promotion Division Department of Employment Ministry of Labour MAY 22, 2014 International
Professional, Scientific, and Technical Services Industry
 Peter Meade, Director John F. Palmieri, Director Professional, Scientific, and The professional, scientific, and technical services industry is one of the larger industries in Boston, making up 11.2% of
Economic Impacts. Refineries in Skagit County
 Economic Impacts of the Refineries in Skagit County February 13, 2015 Center for Economic and Business Research Prepared for the Economic Development Association of Skagit County Table of Contents Executive
Market Services sector turnover in 2009 is 1,013,479 million euros, 13.6% less than the previous year
 1 December 2010 Annual Services Survey 2009 (Results preview) Market Services sector turnover in 2009 is 1,013,479 million euros, 13.6% less than the previous year Employed personnel decreases 5.1% and
The Greening of Louisiana s Economy Summary of Survey Results
 The Greening of Louisiana s Economy Summary of Survey Results Louisiana Workforce Commission www.lmi.laworks.net/green September 2011 In 2009, Louisiana and Mississippi partnered to research economic development
APPLIED GEOGRAPHIC SOLUTIONS
 Version Release 2018 Introduction BusinessCounts is a geographic summary database of business establishments and employees for nearly ten million businesses and one hundred and thirty million employees.
Upper Rio Grande at Work Client Satisfaction Survey 2007
 University of Texas at El Paso DigitalCommons@UTEP IPED Technical Reports 10-1-2007 Upper Rio Grande at Work Client Satisfaction Survey 2007 Daniel J. Quiñones University of Texas at El Paso, djquinones@utep.edu
Professional, Scientific, and Technical Services Sector Profile for the Monroe Region
 Professional, Scientific, and Technical Services Sector Profile for the Monroe Region The Labor Market information (LMI) division of Research and Statistics helps provide information on various sectors
Economic Surveys Results. Release Date : Oct 2015
 Economic Surveys Results 2014 Release Date : Oct 2015 Table of Contents Introduction 4 Key Points 5 Analysis of Results 6 3.1 Value added 6 3.2 Total production 7 3.3 Gross fixed capital formation 8 3.4
TSA current measurement and future directions
 TSA current measurement and future directions UNWTO Capability Building Workshop, Manilla 4 6 July Outline Current Measurement Data Sources, full benchmark and update processes Future directions Establishment
Recruiting Trends th Edition
 Fall, 2018 Recruiting Trends 2018-2019 48 th Edition Part I: Hiring Outlook Gardner, Phil MICHIGAN STATE UNIVERSITY & COLLEGIATE EMPLOYMNET RESEARCH INSTITUTE AT MSU 1 is published by Michigan State University