Table of Contents. Executive Summary
|
|
|
- Ashlee Tucker
- 6 years ago
- Views:
Transcription

1
2 Table of Contents Executive Summary Page 1.0 Introduction Background FIRST Operations FIRST Incident Management Program Coverage FIRST Unit Field Operations Application of FIRST Resources to Incident Management Incident Detection and Management Response Research Secondary Crashes Benefit/Cost Studies of Freeway Service Patrols (FSPs) Categories of Benefits Categories of Costs Assumptions about Program Effectiveness Assumptions about Valuing the Benefits Program Operating Characteristics Prevailing Traffic Conditions Benefit/Cost Evaluation Congestion Reduction Environmental Factors Improved Safety Program Costs Benefit/Cost Findings and Conclusions...25 List of Tables Table 1 Average Blocking Incidents Table 2 Total Economic Benefit Summary (2003) Table 3 Total Cost Summary (2003) Table 4 Benefit/Cost Summary (2003) FIRST Program Evaluation Minnesota Department of Transportation A-MNDOT Page i
3 Table of Contents (Continued) List of Figures Figure 1 Length of Wait by Motorists in Figure 2 Day and Hour Volume Factors from Twin Cities ATR Data Figure 3 Incident Delay vs. Duration Figure 4 Delay from Blocking Incident Figure 5 Delay from Blocking Incident Figure 6 Benefit Cost Ratio Comparison Appendix A Appendix B Appendix C List of Appendices FIRST Daily Log FIRST Policies and Procedures Annotated Bibliography-Secondary Crashes Annotated Bibliography-Benefit/Cost Studies of Freeway Service Patrols FSP Summary Table FIRST Program Evaluation Minnesota Department of Transportation A-MNDOT Page ii
4 Executive Summary The Freeway Incident Response Safety Team (FIRST) is an incident management measure designed to assist disabled vehicles along congested freeway segments and relieve peak period non-recurrent congestion through quick detection, verification, and removal of freeway incidents. The primary purpose of the FIRST Program is to alleviate congestion and to prevent secondary crashes. This report evaluates the activities of Mn/DOT s FIRST Program to determine the cost effectiveness of the program. This was done by researching similar programs and evaluating congestion reduction environmental impacts and improved safety through secondary crash reduction. To evaluate the program, information and data was collected and researched by the following methods: Interviewing FIRST staff and the Minnesota State Patrol Review of operations of other freeway service patrols around the United States Observation of operations at the FIRST Dispatch Center located at the Regional Transportation Management Center (RTMC) Ride Alongs with FIRST personnel throughout the FIRST coverage area Simulation modeling Review of crash data Development of a benefit/cost (B/C) analysis From this data, analysis was done to determine the monetary benefits of the FIRST Program. The previous benefit estimate in 2000 was $2.73 million, which consisted only of delay and fuel consumption. The total program benefit in 2003 is estimated at $16.62 million. This increase is due to several factors, including the addition of emissions measures and the general expansion of the program, but most of the increase is due to the inclusion of the secondary crash reduction benefit. Mn/DOT expenditure and budget data provides an estimate of the annual cost of the FIRST Program. The cost items include staff, vehicles (including annualized depreciation), associated equipment, operating and maintenance costs, facilities, supplies, utilities, computers, communications, and other equipment. The following table shows the total of the benefits and costs for the operation of the FIRST Program in FIRST Program Evaluation Minnesota Department of Transportation A-MNDOT
5 Benefit/Cost Summary (2003) Total Costs $1,052,242 Total Benefits $16,624,875 Net Benefits $15,572,633 Benefit/Cost Ratio 15.8:1 This evaluation found the FIRST Program benefit cost ratio of 15.8:1 to be mid-range of other areas ratios across the nation, which nation from 3.4:1 to 36:1. In addition to determining the monetary benefit of the FIRST Program, the ride alongs provided the opportunity to identify changes for consideration in improving the operation of FIRST. As part of this project, we recommend that the following changes in FIRST operation be discussed and reviewed for incorporation into this program. Improve communications between FIRST and State Patrol units by providing text messaging between vehicles or allowing access to State Patrol station talk groups. Add additional vehicle lighting on FIRST trucks to improve visibility and improve effectiveness of working in traffic. Improvements include adding additional rear facing lights, adding blue lights, and adding flashing lights to the vehicle grill. Develop quick clearance legislation that will allow the FIRST Program, Mn/DOT, and State Patrol to quickly remove incident without being held liable for additional damages caused to vehicles and goods. Develop legislation that would give towing authority to Mn/DOT including the FIRST Program. This would allow for the quicker removal of abandoned vehicles that cause additional congestion and are a potential safety hazard to passing motorists. FIRST Program Evaluation Minnesota Department of Transportation A-MNDOT
6 November 2004 Minnesota Department of Transportation FIRST Program Evaluation Prepared by Short Elliott Hendrickson Inc. 1.0 Introduction The Freeway Incident Response Safety Team (FIRST) is an incident management measure designed to assist disabled vehicles along congested freeway segments and relieve peak period nonrecurrent congestion through quick detection, verification, and removal of freeway incidents. The primary purpose of the FIRST Program is to alleviate congestion and to prevent secondary crashes. This report evaluates the activities of Mn/DOT s FIRST Program to determine the cost effectiveness of the program. This was done by researching similar programs and evaluating congestion reduction environmental impacts and improved safety through secondary crash reduction. 1.1 Background The objectives of the FIRST Program Evaluation are to evaluate the effectiveness of the FIRST on the 160-mile freeway system in the Minneapolis-St. Paul metropolitan area. Specifically, an evaluation methodology has been developed to estimate the effectiveness of reducing congestion and secondary crashes, and to develop a benefit/cost (B/C) analysis based on the findings of the evaluation. Information and data was collected and researched by the following methods: Interviewing FIRST staff and the Minnesota State Patrol Review of operations of other freeway service patrols around the United States A-MNDOT Page 1
7 Observation of operations at the FIRST Dispatch Center located at the Regional Transportation Management Center (RTMC) Ride Alongs with FIRST personnel throughout the FIRST coverage area Simulation modeling Review of crash data Development of a Benefit/Cost (B/C) analysis An evaluation study conducted in 1991 determined the Highway Helper Program should be transferred to the Mn/DOT Metro Division s Freeway Operations section. Prior to 1991, the Highway Helper Program was under the Mn/DOT Metro Division Maintenance System. The Highway Helper Program move to the Freeway Operations has allowed the program to be more fully integrated with other traffic management initiatives. This move was completed in Under the Freeway Operations Section management section, drivers were reclassified to Highway Helper, which allowed the program to hire individuals with skills specifically related to motorist assistance. The name was changed from Highway Helper to FIRST in 2003 to reflect the role FIRST plays in removing incidents on the freeway. The FIRST Program role includes the following: Detect freeway incidents by patrolling metro freeways Quickly respond and remove incidents Provide traffic control and scene security at crashes by activating the large arrow board on top of the FIRST truck Assist State Patrol with first aid at crash sites Open and close the I-394 HOV lane gate arms several times a day 2.0 FIRST Operations 2.1 FIRST Incident Management Program Coverage The FIRST Program covers critical freeway segments utilizing a route structure to optimize response times. In 1987, the Highway Helper Program began operation with three routes in the Twin Cities metro area covering approximately 40 miles. Highway Helpers patrolled the three routes during AM and PM peak FIRST Program Evaluation A-MNDOT Minnesota Department of Transportation Page 2
8 periods. In January 1990, the Highway Helper program was expanded from three to six routes covering approximately 75 miles of freeway. In 1996, an additional route was added using Congestion Mitigation and Air Quality (CMAQ) funding. Currently, there are eight routes that cover approximately 160 miles or 53% of the 300 mile metro area freeway system. The FIRST Program has eight routes that are driven from 5:30 a.m. to 7:30 p.m., Monday through Friday. Specific routes are also covered on weekends as required for events. Each route is driven by one specially marked and equipped pickup truck, occupied only by the driver. The routes driven are in the Minneapolis-St. Paul metropolitan area and include portions of the following roadways: I-35E, I-35W, I- 94, I-394, I-494, I-694, TH 36, TH 62, TH 77, TH 100, and TH 169. A map of the FIRST routes is located on the following page. 2.2 FIRST Unit Field Operations The operation of FIRST vehicles in the field is controlled by the following policies and procedures, which are contained in the Appendix. Mn/DOT Highway Helper Procedures Highway Helper & TMC Dispatcher Joint Operating Policies and Procedures Highway Helper Mobile 2-Line Message Sign Each FIRST truck is equipped with the following equipment: Equipment to change a tire Air compressor Tow strap Gasoline containers Material to soak up spills First aid kit Amber light warning system Changeable message sign Air horn, speaker Cell phone Automatic Vehicle Locating (AVL) system FIRST Program Evaluation A-MNDOT Minnesota Department of Transportation Page 3
9
10 Observations were made of FIRST field operations by accompanying three separate drivers on their routes. This was done on: Route 8105 Wednesday, June 16, :30 p.m. 5:30 p.m. Route 8103 Wednesday, June 16, :30 p.m. 7:00 p.m. Route 8106 Thursday, June 17, :30 a.m. 9:00 a.m. The 8105 ride along came across six incidents during the fourhour observation period and provided assistance for two of the incidents. In both instances where assistance was rendered, the FIRST vehicle, using its large sign board and lights, provided room for the vehicles involved in the incident to merge back into traffic flow or move from the left interior lane to the outside shoulder lane. On the Route 8103 ride along, the driver stopped for six incidents and provided assistance for four of the incidents. Assistance was provided for a crash scene, overheated vehicle, stalled vehicle, and a vehicle with a flat tire. The assistance included providing lane closures, cleaning up crash debris, instructing driver to move vehicle out of the roadway, allowing driver to use cell phone, providing room for driver to merge into traffic, and changing a tire. The Route 8106 ride along encountered six incidents. Assistance was provided for two of these incidents. The assistance included providing room for driver to merge into traffic and changing a tire. These observations found the FIRST drivers to be very observant, safe, and courteous drivers. Also, very evident was the hazardous situations that these drivers are often exposed to, due to the nearness to moving traffic, and the speed of that traffic. The ride alongs provided the opportunity to identify changes for consideration in improving the operation of FIRST. As part of this project, we recommend that the following changes in FIRST operation be discussed and reviewed for incorporation into this program. FIRST Program Evaluation A-MNDOT Minnesota Department of Transportation Page 5
11 Improve communications between FIRST and State Patrol units by providing text messaging between vehicles or allowing access to State Patrol station talk groups. Add additional vehicle lighting on FIRST trucks to improve visibility and improve effectiveness of working in traffic. Improvements include adding additional rear facing lights, adding blue lights, and adding flashing lights to the vehicle grill. Develop quick clearance legislation that will allow the FIRST Program, Mn/DOT, and State Patrol to quickly remove incident without being held liable for additional damages caused to vehicles and goods. Develop legislation that would give towing authority to Mn/DOT including the FIRST Program. This would allow for the quicker removal of abandoned vehicles that cause additional congestion and are a potential safety hazard to passing motorists. 2.3 Application of FIRST Resources to Incident Management The efficiency of the FIRST Program or any freeway service program is reflected in the following critical aspects of its operations. How long it takes a FIRST unit to reach the reported incident site after the being contacted by the RTMC. What is the average travel distance for FIRST units to reach the incident site? How long it takes the FIRST unit to clear various types of accidents. What is the approximate reduction in the incident blockage time due to the operations of FIRST Program? Understanding the above aspects is important for determining the efficiency and B/C from the time the incident report is received to the complete removal of any resulting blockage Incident Detection and Management Incidents on the FIRST Program roadway network can be detected by RTMC surveillance cameras, by the State Patrol, and other emergency responders, by roadway users calling from cell phones, and by FIRST units themselves. The FIRST Program manages freeway traffic flows with the goal of greater efficiency and safety. A key component to achieving this FIRST Program Evaluation A-MNDOT Minnesota Department of Transportation Page 6
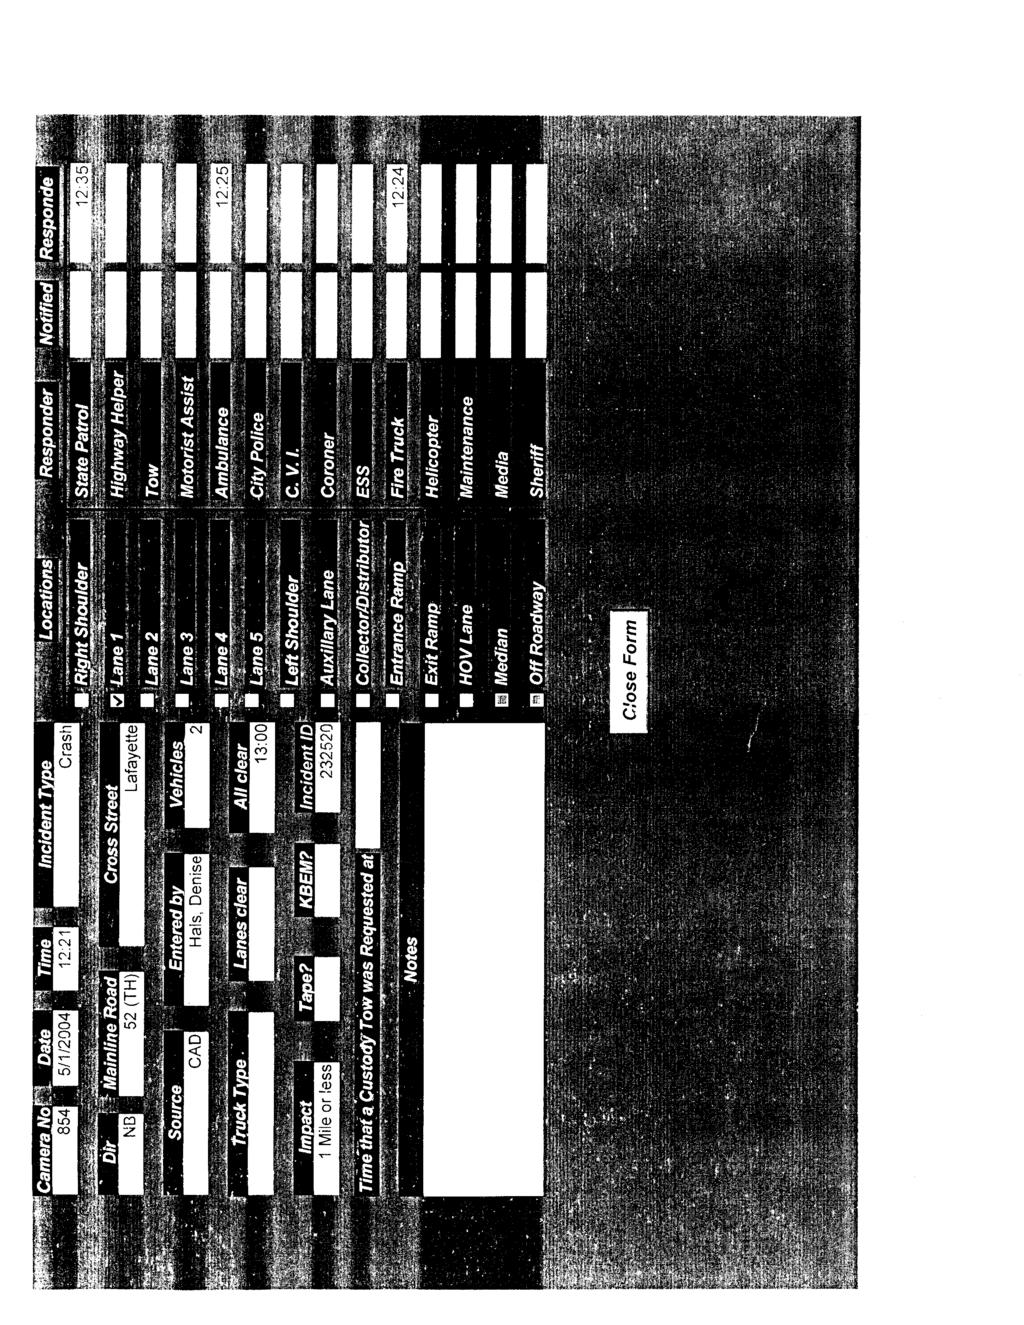
12 goal is the presence of the FIRST Dispatch Center, which operates within Mn/DOT s RTMC. The metropolitan area freeway system is equipped with cameras, which are connected to monitors in the RTMC. The cameras scan the freeway system for problems and incidents, which affect traffic flow on the freeway system. This Center also receives phone calls informing them of incidents. Phone calls and two-way radio contact are also received from Mn/DOT maintenance vehicles and the State Patrol. The Dispatch Center relays information on incidents to the nearest FIRST field unit. Observation of the operations of the FIRST Dispatch Center was conducted on June 7, The operators in the Dispatch Center have many demands. They are required to: Complete a log of incidents. Observe monitors. Communicate with the FIRST drivers. Listen to audio scanners from Mn/DOT Maintenance and State Patrol. Communicate with RTMC, Mn/DOT Maintenance, and State Patrol. A copy of the log and applicable policies and procedures are included in Appendix A. Overall, effective management of the FIRST Program relies on communication, coordination, and cooperation from Mn/DOT law enforcement agencies and roadway users Response The FIRST Program covers critical freeway segments using route structure to optimize response times. The FIRST routes have been selected based on the potential for incident created congestion. Factors Mn/DOT used in this determination included roadway characteristics, extent and severity of daily congestion, number of incidents, and the presence or absence of an on line ramp metering system with video surveillance. The FIRST unit routes are approximately 13 miles in length, and the same routes are used for a.m. and p.m., Monday through Friday. The most recent data obtained from roadway users is displayed in Figure 1. FIRST Program Evaluation A-MNDOT Minnesota Department of Transportation Page 7
13 Minnesota Department of Transportation, Highway Helper 2002 Summary Report The ability of the FIRST unit to respond to an incident is best described as the timeframe from the moment the FIRST dispatcher has received a reported incident to the arrival of the FIRST unit at the incident site. In 2002, approximately 79% of disabled vehicles were responded to in less than 20 minutes. Market research has shown that after 20 minutes have passed, drivers are more likely to leave vehicles in search of assistance. Most drivers realize they are safer in their vehicles; however, they tend to have a patience threshold, which if exceeded, results in drivers making poor choices. When an incident is detected, either surveillance cameras or the FIRST unit verify the incident and determine what assets are required to deal with the situation. This may include calling for the State Patrol, ambulance, fire truck, a tow truck/wrecker, a hazardous materials units, and/or traffic control support. 3.0 Research As part of this evaluation, available data from throughout the United States identifying effective methods for reducing congestion and secondary crashes was gathered. The primary purpose of this endeavor is to determine whether the FIRST Program is as good as it can be. 3.1 Secondary Crashes Freeway service patrols throughout the United States report a wide variation in observed secondary crash rates. Estimates range from 1.5% on Los Angeles freeways to 35% on an expressway near Gary, Indiana. This variation is due to several factors. FIRST Program Evaluation A-MNDOT Minnesota Department of Transportation Page 8
14 First, there is no consensus on the definition of a secondary crash. A recent study reported: [r]eductions in secondary accidents are a very important kind of benefit of urban ITS deployments. Reliable data, however, are virtually nonexistent. Accident records frequently have no place to indicate that an accident was a secondary accident except in a field for general comments. As a result, some records may show no indication that an accident was caused by backup from a previous accident rather than some other cause...consideration is still being given to the identification of secondary accidents, but to date no means of reliably distinguishing secondary accidents from primary accidents has been identified. 1 Clearly, researchers using different definitions of a secondary crash will arrive at different conclusions concerning the incidence of secondary crashes. Researchers use two basic methods to define a secondary crash. The most common method used archived data and simply assumes that any crash occurring in close proximity (i.e., within x miles and within y minutes) to a primary incident must be a secondary crash. Although researchers agree that close proximity comprises closeness in both time and space, they differ in preparing these concepts. How close in time (½ hour, 1 hour, 2 hours)? How close in space (½-mile, 1-mile, 2 miles)? Should crashes in the opposite direction (due to gawkers) be included? The second approach videotapes the crashes and then relies on traffic control operators to watch the film and categorize each observed crash as either primary or secondary. Both approaches have drawbacks. Using an algorithmic definition of proximity will lead to both false alarms and missed targets. On the other hand, filming the crashes is subjective inasmuch as it relies on human judgment to decide whether a given crash is really due, in whole or in part, to a primary incident (i.e., two different operators may classify the same crash differently => repeat validity is questionable). In short, unless researchers develop a universal and operational definition of a secondary crash, we will continue to observe wide variations in reported secondary crash rates. The second reason for the wide variation in observed secondary crash rates is that studies differ with respect to the scope of 1 Meyer, E. and C. Sun, August 2003, Using Reidentification to Evaluate the SCOUT Traffic Management System, Proceedings of the 2003 Mid-Continent Research Symposium, Iowa State University, Ames, Iowa. FIRST Program Evaluation A-MNDOT Minnesota Department of Transportation Page 9
15 primary incidents considered. That is, some studies consider secondary crashes that are caused by crashes only, while other studies consider secondary crashes caused by all types of primary incidents (crashes, vehicle disablements, debris, etc.). Obviously, the latter approach should identify more secondary crashes and result in a higher secondary crash rate, all else being equal. Third, the specific roadways being evaluated vary across the studies with respect to safety-related features. Highways with a freeway management system or a motorist assistance patrol, for example, should have a lower secondary crash rate than highways without such programs. Similarly, highways with fewer horizontal and vertical curves should have a lower secondary crash rate than their curvier counterparts. Appendix B provides an annotated bibliography of secondary crashes, which are grouped into two categories: Internet sources Studies The internet sources appear on the Web without supporting documentation, while studies are more serious endeavors. In some cases, it is likely the internet sources can be traced to formal reports or studies. 3.2 Benefit/Cost Studies of Freeway Service Patrols (FSPs) This section examines nine benefit/cost studies of FSPs in: Boston, Massachusetts; Chicago, Illinois; Denver, Colorado; Gary, Indiana; Houston, Texas (both regular and special programs); Los Angeles, California; San Francisco, California; and the Twin Cities, Minnesota. Key facts and findings from these studies are summarized in the FSP Summary and the annotated bibliography in Appendix C. The literature reports a wide variation in B/C ratios of FSPs. Estimates range from 3.4:1 in San Francisco, California to 36:1 in Houston, Texas. Even within studies, estimates vary considerably. In one of the Houston studies, for example, the B/C ratio ranges from 7:1 to 36:1, depending on the assumed impact of the FSP on incident durations. Although a complete account of all sources of variation in B/C ratios is beyond the scope of this project, it is clear that most of the variation is due to several key factors. Primary sources of variation that are evident from the studies include: Specific categories of benefits and costs included in the analyses FIRST Program Evaluation A-MNDOT Minnesota Department of Transportation Page 10
16 Critical assumptions about the effectiveness of the programs Critical assumptions about the value of the estimated benefits Other sources of variation that are not as easily discerned from the studies include: Program operating characteristics Prevailing traffic conditions in the study areas. Each of these sources of variation is discussed below Categories of Benefits Freeway service patrols provide society with many types of benefits, including travel time savings, fuel savings, emissions reductions, crash avoidance, and increased security to motorists. However, many of these benefits are difficult to quantify and monetize. As a result, B/C studies tend to consider only one or two types of benefits. All nine studies monetize the travel time savings (i.e., reductions in delay) associated with a FSP. Boston, Gary, Los Angeles, San Francisco, and the Twin Cities also monetize fuel savings. Boston, Los Angeles, San Francisco, and the Twin Cities quantify emissions reductions, although only Boston takes the next step and monetizes the emissions reductions. Gary is the only study to include avoided crashes. Finally, one of the Houston studies includes aid to stranded motorists. No study includes all of the benefit types. Travel time savings account for the majority (and in some cases all) of the benefits reported in each of the studies reviewed. Fuel savings, when included, account for 4% to 8% of total benefits. Emissions reductions account for 1% of the total benefits in the Boston study (note that valuing emissions reductions is somewhat controversial, especially in areas that are in full compliance with the Clean Air Act). Avoided crashes account for 27% to 32% of the total benefits in the Gary study; however, the authors used very conservative values of avoided crashes, so it is likely this category should have accounted for a much higher percentage of total benefits. Finally, it seems inappropriate to include aid to stranded motorists as a benefit category simply because most of this is a transfer from one segment of society to another (i.e., there is no efficiency gain or economic benefit to society if a FSP tows a stranded motorist for free as opposed to the motorist calling a private tow truck operator and paying out of pocket; the only FIRST Program Evaluation A-MNDOT Minnesota Department of Transportation Page 11
17 difference is who pays and who benefits society as a whole is not better off either way). In summary, it appears that the most important benefit categories are delay savings and crash avoidance Categories of Costs Although the studies use different terminologies, it appears that they all include personnel salaries and benefits, equipment costs, supplies, operating costs, and maintenance. However, some of the studies do not appear to include administrative overhead (e.g., costs of administrative personnel, leasing/maintaining facilities, utilities, etc.). These omissions are likely due to differences in stakeholder perspectives adopted by the studies. That is, some studies (e.g., Chicago) adopt a societal perspective and include the economic value of all resources used by the program, including resources (e.g., buildings/facilities, equipment) that were donated to the program or paid by other public entities, while other studies adopt a narrower perspective and include only costs that are paid by the program directly Assumptions about Program Effectiveness Perhaps the largest source of variation in B/C ratios is the estimated/assumed impact of the FSPs on incident durations. Because delay is a quadratic function of incident duration, program effectiveness (with respect to delay savings) is primarily dependent to the impact of the FSP on incident duration. As seen in the FSP Summary Table in Appendix C, programs with relatively large B/C ratios tend to estimate/assume that their FSPs have relatively large impacts on incident durations. For example, Boston has a B/C ratio of 19:1 and assumes its Motorist Assistance Program (MAPs) reduce incident durations by 15 minutes to 30 minutes; Chicago has a B/C ratio of 17:1 and assumes its Emergency Traffic Patrols (ETPs) reduce incident durations by 20 minutes to 40 minutes. In contrast, the Twin Cities have a B/C ratio of 4.4:1 and assume the FIRST units reduce incident durations by only 0 minutes to 8 minutes. 2 Similarly, the Houston B/C ratio varies from 7:1 to 36:1 as the assumed impact of the FSPs on incident duration increases from 5 minutes to 20 minutes. Given that the B/C ratio depends strongly on the impact of the program on incident durations, it is natural to question whether these estimated/assumed impacts are accurate. In practice, 2 The B/C ratio of the Twin Cities program is relatively small. This is most likely due to: (1) the assumption that Highway Helper reduces incident duration by a relatively low 0 minutes to 8 minutes, (2) the assumption of a relatively low $10/veh-hr for delay savings, (3) excluding the benefits of assisting crashes, debris incidents, and other incidents, and (4) excluding the benefits of avoided crashes. FIRST Program Evaluation A-MNDOT Minnesota Department of Transportation Page 12
18 estimating the impact on incident duration requires data both before and after implementation of the FSP. While after data are readily available in most cases (e.g., program logs), before data can be difficult to obtain. Therefore, many studies are forced to either: (1) assume the impact on incident durations, or (2) do a sensitivity analysis whereby they calculate the B/C ratio for a range of assumed impacts. Moreover, the impact on incident duration is a function of regional incident management practices both before and after implementation of the FSP. All else being equal, FSPs probably have a smaller impact on incident durations in regions that have a freeway management system (or traffic operations center), a rotational tow truck program, quick-clearance legislation, accident investigation sites, a toll-free number to report incidents, etc. In short, regions with relatively few or undeveloped incident management procedures will probably benefit more from a FSP than their more sophisticated counterparts. This also suggests that B/C studies conducted in the early 1990s should be redone, as the impact of the FSPs on incident duration is probably smaller today than it was 10+ years ago when cell phones and toll-free incident numbers were much less popular Assumptions about Valuing the Benefits The B/C ratios of the FSPs vary also because the studies assume different real values for the same measures of effectiveness. For example, all of the studies monetize the value of delay savings. However, one of the Houston studies assumes $12.20/veh-hr in 1991, while the Twin Cities study assumes $10/veh-hr in These are very different assumptions in real terms. The B/C ratio of the Houston program will be much higher than the B/C ratio of the Twin Cities program (even if there is no real difference in effectiveness between the two programs). Differences in assumptions about fuel costs and the value of emissions reductions are less important, inasmuch as these benefit categories account for a relatively small portion of total benefits. However, assumptions about the value of avoided crashes are very important, inasmuch as this category has the potential to account for a relatively large portion of total benefits Program Operating Characteristics Other factors that affect the B/C ratio of a FSP include the number and type of patrol vehicles, training provided to drivers, hours of operation, and dispatching strategy (e.g., priority versus firstencountered-first-served). Since additional vehicles, better driver training, and extended hours of operation all can be expected to increase both benefits and costs of the program, the impact of these FIRST Program Evaluation A-MNDOT Minnesota Department of Transportation Page 13
19 factors on the B/C ratio is unclear without further analysis. It seems clear, however, that patrols should be dispatched to handle severe incidents before minor incidents (as is done in Chicago), as opposed to being required to stop and assist every stranded motorist in the order in which they are encountered on the freeway, even if more severe incidents exist elsewhere on the route (as is done in Boston). Note that priority-dispatch is more feasible when the program is funded through public revenues (taxes), as opposed to when it is funded by private sponsors who do not want to develop ill-will by ignoring stranded motorists (even if it is to get to a more severe incident downstream) Prevailing Traffic Conditions Although information about prevailing traffic conditions is not typically included in the studies, it makes sense that total benefits would be a function of the number and types of incidents assisted, traffic demand, and roadway characteristics. For example, routes that experience more incidents (or a larger proportion of severe incidents) or that have a higher traffic demand should produce higher B/C ratios. Road characteristics (e.g., lane widths, capacities, presence of shoulders) affect the delay associated with a given incident, which in turn, affects the delay savings attributable to a FSP. For example, roads without shoulders will experience greater delays (and greater delay savings due to a FSP) when incidents occur. Furthermore, if road capacity far exceeds demand at the time of the incident, delay (and delay savings) will be relatively small. 4.0 Benefit/Cost Evaluation The objective of the economic portion of the Mn/DOT FIRST Program Evaluation is to quantify the benefits and costs associated with the program. The January 2000 Mn/DOT Highway Helper Summary Report lists the following benefits of the incident response program: Aid to stranded motorists Decreased delay Fuel and emissions reduction Improved safety for those involved in incidents Safe clearance of blocking incidents Improved resource allocation Improved public perception However, only two measures were quantified and included in the total benefits: delay and fuel consumption. The two critical benefits this evaluation adds are reductions in emissions and FIRST Program Evaluation A-MNDOT Minnesota Department of Transportation Page 14
20 secondary crashes. Many measures are not easily quantifiable (e.g., motorist security) and will not be included in the benefit estimate. For this study, a combination of empirical analysis and microsimulation is used to determine the various benefits. A body of empirical research already exists to aid in estimating the benefits based on current data. Microsimulation is employed to determine the congestion extent, severity, and duration caused by an incident. Changes in congestion are used to estimate the different benefits of the FIRST Program. Modeling incidents is a rare application, and few software programs do it. The program used for this study is Paramics, an advanced microsimulation package developed in the United Kingdom. With this program, hundreds of scenarios are modeled with varying parameters including road geometry, location (lane) of incident, traffic demand, and duration of the incident. Each model results in an area of congestion emanating upstream from the incident, and generally persisting beyond the time the incident is cleared. Many variables affect the extent and duration of congestion caused by an incident. Due to lack of data and scope limitations, most of these are not included (e.g., road grade, ramp and weaving areas, weather, special event traffic, light conditions, severity of an incident, etc.). To further define the range of conditions, the simulation portion focuses on a typical three-lane (each direction) freeway section in the Twin Cities area. A limitation of the microsimulation used for this study is the inability to model incidents on the shoulder of the freeway. Examples of this include a stalled vehicle, a vehicle with a flat tire, substantial debris, or median maintenance. Rather than rely on simulation, an analytical approach is used. The Federal Highway Administration (FHWA) Traffic Incident Management Handbook shows that typical shoulder incidents result in an overall capacity reduction of about 5%. If the current traffic demand is less than the reduced capacity of the road, no queuing is assumed to occur, thus no influence on secondary crashes. If the current traffic demand is greater than the reduced capacity from the shoulder incident, then congestion is assumed to occur in accordance with deterministic queuing theory. The range of results from the simulation models and the shoulder blocking are then applied to actual incidents the FIRST personnel respond to. This in turn provides benefit estimates for reduction of delay, fuel consumption, emissions, and secondary crashes. The following subsections are the key benefits to be quantified. FIRST Program Evaluation A-MNDOT Minnesota Department of Transportation Page 15
21 4.1 Congestion Reduction Debris in the road, disabled vehicles on the shoulder, crashes, and other incidents all increase travel time. This delay depends on the severity and location of the incident, how long the incident persists, and other factors. An objective of the FIRST Program is to expedite the clearance of incidents to reduce delay to motorists. The benefit from reducing delay or congestion is a function of the traffic demand, the capacity of the road, the duration and location of the incident, and other factors. The database used in this analysis contained 2,036 incidents that the FIRST Program responded to in May An average daily traffic (ADT) volume was determined for each of these incidents based on its location. Then for each incident, the traffic demand at the time of the incident was estimated by multiplying the ADT at that location by a factor representing the day of the week and the hour of the day. That factor is calculated from automatic traffic recorder (ATR) data on freeways in Minneapolis (I-35W and I-94). Figure 2 graphically depicts the 168 factors (7 days x 24 hours) for each hour of a typical week in the Twin Cities. Figure 2 Day and Hour Volume Factors from Twin Cities ATR Data Percent of ADT 4.0% 3.5% 3.0% 2.5% 2.0% 1.5% 1.0% 0.5% 0.0% 3-4am 4-5am 5-6am 6-7am 7-8am 8-9am 9-10am 10-11am 11-noon noon-1pm 1-2pm 2-3pm 3-4pm 4-5pm 5-6pm 6-7pm 7-8pm 8-9pm 9-10pm 10-11pm 11-mid mid-1am 1-2am 2-3am Sat Fri Wed Thu Tue Mon Sun Previous FIRST estimates of time reductions for various incident durations were used in this analysis. 3 Table 1 summarizes the 3 Minnesota Department of Transportation Metropolitan Division. Highway Helper Summary Report, January 2000 and Highway Helper 2002 Summary Report, February FIRST Program Evaluation A-MNDOT Minnesota Department of Transportation Page 16
22 typical incident durations and the estimates of time saved with the FIRST Program. Table 1 Average Blocking Incidents Percent of All Incidents Average Blocking Time without FIRST Average Blocking Reduction with FIRST Blocking Duration Less than 27 minutes 88.3% 12 minutes 8 minutes 27 to 57 minutes 8.9% 40 minutes 5 minutes Greater than 57 minutes 2.8% Greater than 57 0 minutes With the aid of customized Excel VBA programming, a database was built from over 100,000 output files comprising data for hundreds of model runs in the Paramics simulation program. These covered a range of incident durations from 0 (no incident) to 40 minutes and locations in the left, center, and right lanes. Figure 3 summarizes the delay results of the simulation analysis. Figure 3 Incident Delay vs. Duration Incident Delay vs. Duration Typical 3-lane Freeway 200 Total Delay (hr) Duration (min) ,500 2,000 2,500 3,000 3,500 4,000 Demand Flow (vph) The X-axis shows the demand flow in vehicles per hour (vph) on a typical three-lane freeway section in the Twin Cities. The Y-axis shows total delay (in hours) and each line on the graph represents a blocking incident of different durations (from 4 minutes to 40 minutes). The delay shown is only the delay due to the blocking incident (non-recurring) and is in addition to delay due to congestion resulting only from higher demand flows (i.e., the recurring congestion is removed from this plot). FIRST Program Evaluation A-MNDOT Minnesota Department of Transportation Page 17
23 So for example, if the FIRST Program reduces a blocking incident duration from 12 minutes to 4 minutes while the demand flow is 4,000 vph, then the total delay savings for all travelers is about 27 hours. Converting to dollars based on values of time, this saves $300 to $400. The details of this conversion are discussed below. Figures 4 and 5 illustrate the simulation results for one of the modeled scenarios, specifically a blocking incident with a 10- minute duration during a demand flow of 4,000 vph on a typical three-lane freeway section. The front axis on the horizontal plane shows elapsed time; the right axis on the horizontal plane shows the distance along the freeway (upstream in front, downstream in back); and the vertical axis is a representation of delay. Each graph is a separate view of the same data the first is a front view, the second is a top view. The blocking incident occurs at the location labeled 25:26 and remains blocking from time equal 5 minutes to 15 minutes. This is a classic representation of a queue propagating upstream and then persisting beyond the time the blocking incident clears. Figure 4 Delay from Blocking Incident Delay per link (seconds) Incident Clears Incident Occurs Analysis Time (minutes) :5 7:8 10:11 13:14 16:17 19:20 22:23 25:26 28:29 Link (0.1 mile each) FIRST Program Evaluation A-MNDOT Minnesota Department of Transportation Page 18
24 Figure 5 Delay from Blocking Incident Incident Clears Delay per link (seconds) 41 Queue Clears Analysis Time (minutes) 11 Incident Occurs 1 28:29 27:28 26:27 25:26 24:25 23:24 22:23 21:22 20:21 19:20 18:19 17:18 16:17 15:16 14:15 Link 13:14 (0.1 mile each) 12:13 11:12 10:11 9:10 8:9 7:8 6:7 5:6 4:5 Applying the changes in resulting delay to the actual incidents provides an estimate of delay reduction. The 2,036 incidents in May 2003 include information on whether each was blocking a lane or if it was on the shoulder. While shoulder incidents are technically not blocking incidents, they do reduce the capacity of the roadway. The FHWA 4 showed that shoulder incidents still cause slightly over half the capacity reduction that a blocking incident has, on average. Earlier estimates showed less than this, so to remain conservative, this analysis assumes incidents on the shoulder to cause one-fifth the delay of an incident in a travel lane. Delay is calculated for both an incident reduction from 12 minutes to 4 minutes and for an incident reduction from 40 minutes to 35 minutes, based on the estimated demand volume at the time of the incident. An average of these two results, weighted by the frequency of occurrence (see Table 2), is then determined for any incident shown to block a lane or occur on the shoulder. Based on this methodology, about 82% of the incidents in May 2003 resulted in some delay savings, from less than a minute to 288 hours, the former for a mid-day stall on the shoulder, the latter from an injury crash on I-94 in downtown Minneapolis that 4 FHWA Freeway Management and Operations Handbook, FIRST Program Evaluation A-MNDOT Minnesota Department of Transportation Page 19
25 occurred at 3:50 p.m. on a Thursday. The total delay savings from the FIRST Program estimated for May 2003 is 24,818 hours. This delay reduction is converted to dollars based on values of time recommended by Mn/DOT. 5 These values are based on USDOT guidance and were published November They are $10.04 per person per hour of auto time and $18.61 per truck. The estimates also incorporate characteristic auto occupancies and truck percentages, 1.2 persons and 5.0%, respectively. For example, the value of 1 hour of delay is: 1 x [($10.04 x 1.2 x 95%) + ($18.61 x 5%)] = $12.40 Applying this to the May 2003 data results in a annual benefit estimate of $3.69 million. A summary of all the benefit figures is shown in Table 4 at the end of this section. This estimate is $1.14 million or 45% greater than the delay estimate in the January 2000 Highway Helper Summary Report. This is expected because the coverage of the FIRST routes is greater, and traffic volumes and congestion continues to increase. The delay benefit estimate is about 43,000 hours or 17% greater. Also, the value of time in the 2000 estimate did not include a factor for vehicle occupancy or for commercial vehicles. The value of time used previously was $10/hour, while the aggregate value of time used in this estimate is $12.38/hour. 4.2 Environmental Factors The 2000 Highway Helper Summary Report includes three environmental measures: fuel consumption, hydrocarbon emissions, and carbon monoxide (CO) emissions. The economic portion, however, only applied a value to fuel consumption. The environmental factors in this analysis also include fuel consumption and emissions, the latter comprising CO, hydrocarbons (HC), and nitrogen oxides (NOx). These measures vary a great deal with vehicle speed and acceleration, which depend heavily on traveling conditions and congestion. The associated benefit estimate, in dollars, is the reduction in these environmental factors due to the Mn/DOT FIRST Program. The environmental model used in this analysis is one maintained by FHWA and embedded into their popular simulation program, CORSIM. The embedded tables base the measures on vehicle speed and acceleration. The same model runs performed in Paramics were duplicated in CORSIM, in part for validation, and in part to provide the necessary environmental measures. 5 Mn/DOT Office of Investment Management, FIRST Program Evaluation A-MNDOT Minnesota Department of Transportation Page 20
26 The resulting savings estimates for May 2003 are as follows: Fuel (gasoline): 55,149 gallons Carbon Monoxide (CO): tons Hydrocarbons (HC): tons Nitrogen Oxides (NOx): tons The monetary conversions for these are those used in the Mn/DOT Ramp Meter Evaluation. 6 The second route is to use the more comprehensive values that were used by Mn/DOT and Cambridge Systematics in the ramp meter evaluation work. The conversions are: Fuel (gasoline): $1.56/gallon 7 Carbon Monoxide (CO): $3,371/ton Hydrocarbons (HC): $1,774/ton Nitrogen Oxides (NOx): $3,625/ton These four items amount to a total of $2.01 million in benefits for Fuel consumption and CO benefits are much greater than the other two. Although the year 2000 estimate did not monetize these items other than fuel, there are some differences to note. The fuel consumption savings is substantially higher chiefly a result of the expanded FIRST Program, increasing traffic, and different methodologies rather than increased fuel prices ($1.15 in 2000 versus $1.56 in 2003). The CO savings shows a slight increase from the 2000 estimate. The HC savings is substantially less than what was estimated in NOx was not previously estimated. Overall, the previous environmental benefit (fuel consumption only) was estimated at $0.18 million versus $2.01 million in this analysis. 4.3 Improved Safety A key component of the benefits estimation is the reduction of secondary crashes. Agencies and other evaluation studies generally agree that incident management reduces secondary crashes, but most also agree that this is a very difficult benefit to quantify. At the least, it had involved a subjective judgment by an emergency responder or a traffic control center operator. Another study defined all crashes occurring within 2 hours after a major incident and within 2 miles as a secondary crash. 6 Prepared by Cambridge Systemmatics, The conversion values therein are based on the ITS Deployment Analysis System (IDAS), FHWA US Average Retail Price, Energy Information Administration, Washington, DC. FIRST Program Evaluation A-MNDOT Minnesota Department of Transportation Page 21
27 Defining the influence area with the 2-hour/2-mile approach underestimates some secondary crashes, but likely overestimates most secondary crashes as the majority of incidents do not cause congestion of that magnitude. And the subjective approach is not amenable to estimating influence areas and secondary crashes within a large database containing thousands of crashes. Traffic simulation is another approach that may yet show promise for determining the influence area of a primary crash. Very few programs model incidents and those that do would require thousands of runs to develop an adequate range of conditions. Many variables affect the extent and duration of congestion caused by an incident, but due to lack of available data, most of these cannot be modeled in an efficient manner (e.g., road grade, ramp and weaving areas, weather, special event traffic, light conditions, incident severity, etc.). The remaining variables that can be easily modeled include certain road geometry, number of lanes, location (lane) of the incident, traffic flow, and duration of the incident. Prior research 8 shows that programs similar to the Mn/DOT FIRST result in an approximately 14% reduction in crashes on the covered road segments, chiefly attributed to the less severe crashes. This research is empirically based, thus more reliable than attempting to comb through a crash database arbitrarily guessing which crashes may be secondary crashes. The FIRST Program reduces the incidence of secondary crashes, not necessarily primary crashes or other incidents. The secondary crash types are generally possible injury crashes and property damage crashes. Therefore, the crash reduction figure will be applied to these two types of crashes, while more severe crashes are assumed to be unaffected. The 2003 crash data used for this analysis is supplied by Mn/DOT for the corridors covered by the FIRST Program. The two types of crashes affected are monetized using the Mn/DOT Office of Investment Management recommend values: Type C possible injury is $29,000 and Type N property damage only is valued at $4,200 per instance. There were 662 crashes on the segments covered by the FIRST Program in May Factoring the Type C and N crashes up by 14% returns 763 crashes that would have occurred without the FIRST Program. Upon monetizing this difference, the total estimated crash reduction benefit for 2003 is $10.93 million. This 8 Olmstead, T. The Effects of Freeway Management Systems and Motorist Assistance Patrols on the Frequency of Reported Motor Vehicle Crashes. Doctoral Thesis. Cambridge, MA FIRST Program Evaluation A-MNDOT Minnesota Department of Transportation Page 22
28 benefit is approximately five times greater than the environmental benefits and three times greater than the delay benefit. The previous benefit estimate in 2000 was $2.73 million, which consisted only of delay and fuel consumption. The total program benefit in 2003 is estimated at $16.62 million. This increase is due to several factors, including the addition of emissions measures and the general expansion of the program, but most of the increase is due to the inclusion of the secondary crash reduction benefit. Table 2 summarizes the economic benefits in this analysis. Table 2 Total Economic Benefit Summary (2003) Delay Benefit Carbon Monoxide (CO) Delay Avoided (Hours, May 2003) 24,818 CO Saved (tons, May 2003) Delay Avoided (Hours, 2003) 297,816 CO Saved (tons, 2003) Value of time per person $10.04 Cost per ton of CO $3,371 Average Vehicle Occupancy 1.2 Annual CO Savings $911,609 Value of time per commercial vehicle $18.61 Heavy Vehicle percent 5.0% Hydrocarbons (HC) Total Delay Savings (2003) $3,685,801 HC Saved (tons, May 2003) HC Saved (tons, 2003) Crash Benefit Cost per ton of HC $1,774 Type K $0 Annual HC Savings $9,238 Type A $0 Type B $0 Nitrogen Oxides (NOx) Type C $571,233 NOx Saved (tons, May 2003) Type N $339,809 NOx Saved (tons, 2003) Total (May 2003) $911,042 Cost per ton of NOx $3,625 Crash Savings (2003) $10,932,502 Annual NOx Savings $53,339 Fuel Fuel Saved (gallons, May 2003) 55,149 Fuel Saved (gallons, 2003) 661,785 Total Economic Benefit User price per gallon $1.56 Annual Fuel Savings $1,032,385 Annual Savings (2003) $16,624, Program Costs Mn/DOT expenditure and budget data provides an estimate of the annual cost of the FIRST Program. The cost items include staff, vehicles (including annualized depreciation), associated equipment, operating and maintenance costs, facilities, supplies, utilities, computers, communications, and other equipment. A summary is shown in Table 3. FIRST Program Evaluation A-MNDOT Minnesota Department of Transportation Page 23
29 Table 3 Total Cost Summary (2003) FY 2003 Staffing Costs Salary and Benefits 825,327 Subtotal Staffing Costs 825,327 Vehicle Costs Maintenance 69,261 Fuel 57,729 Depreciation* 50,000 *10 trucks depreciation cost of $5000 per year per truck Subtotal Vehicle Costs 176,990 Supplies/Equipment/Building Operations AVL and Nextel Equipment 24,512 Uniforms, Supplies, Tools, Etc. 5,798 Building Operating Costs (Garbage, Etc.) 3,945 Employee Training* 300 AVL Systems Maintenance 7,674 *Defensive Driving Course in 2002 Subtotal Other Operating Costs 42,229 Communications Costs Nextel Service 7,696 Subtotal Communications 7,696 Total Annual Program Costs 1,052,242 The cost components are much the same as the data used in the January 2000 analysis. From fiscal year (FY) 1999 to FY 2003, the annual cost of the FIRST Program increased by $428,515 or 69% to $1,052,242. The greatest contributors to this increase were a program expansion and increased coverage area. 4.5 Benefit/Cost This evaluation of the Mn/DOT FIRST Program begins with gathering information from program personnel via meetings, observations, and ride alongs. The economic component builds on previous evaluations by researching new methodologies and reviewing the economic evaluations performed by other jurisdictions. The two key components to be added to the benefit tabulation are safety (secondary crash reduction) and environmental (emissions reduction). Table 4 shows the summary of findings from this analysis. FIRST Program Evaluation A-MNDOT Minnesota Department of Transportation Page 24
30 Table 4 Benefit/Cost Summary (2003) Total Costs $1,052,242 Total Benefits $16,624,875 Net Benefits $15,572,633 Benefit/Cost Ratio 15.8:1 While the total costs increased by 69% compared to the FY 99 estimate, the benefit estimation included additional factors and increased by six times for this FY 03 analysis. The net benefits are, therefore, seven times greater; the benefit cost ratio is revised up from 4:1 to 16: Findings and Conclusions Nationwide, there is a large variation in B/C ratios for FSPs. The analysis done in this study combines analytical and empirical analyses to arrive at the monetary benefits of the FIRST Program. The benefits come from reduced traffic delays, fewer secondary crashes, less fuel consumption, and lower emissions. Comparing the overall benefits to the program costs yields a B/C ratio of 15.8:1. A ratio of this magnitude reflects a significant public benefit for the investment. Figure 6 shows a comparison of the FIRST Program benefit cost ratio to others across the country. Figure 6 Benefit Cost Ratio Comparison B/C Ratio Los Angeles, CA San Francisco, CA Gary, IN Houston, TX Denver, CO Cities FIRST Chicago, IL Boston, MA FIRST Program Evaluation A-MNDOT Minnesota Department of Transportation Page 25
31 While the benefit of the FIRST Program is significant, it may be understated. The assumptions made in this evaluation in the development of the benefit cost ratio were conservative. Specifically, the secondary crashes were not considered to be severe, while there have been cases of severe secondary crashes. Additionally, the FIRST Program provides traffic control and protection at crash scenes for responders and affected motorists. This safety benefit was not quantified. While there is great benefit to the program, the study revealed operational changes that should be considered, which could further enhance the program. The ride alongs provided the opportunity to identify changes for consideration in improving the operation of FIRST. As part of this project, we recommend that the following changes in FIRST operation be discussed and reviewed for incorporation into this program. Improve communications between FIRST and State Patrol units by providing text messaging between vehicles or allowing access to State Patrol station talk groups. Add additional vehicle lighting on FIRST trucks to improve visibility and improve effectiveness of working in traffic. Improvements include adding additional rear facing lights, adding blue lights, and adding flashing lights to the vehicle grill. Develop quick clearance legislation that will allow the FIRST Program, Mn/DOT, and State Patrol to quickly remove incident without being held liable for additional damages caused to vehicles and goods. Develop legislation that would give towing authority to Mn/DOT including the FIRST Program. This would allow for the quicker removal of abandoned vehicles that cause additional congestion and are a potential safety hazard to passing motorists. w:\ko\mndot\045200\reports & specs\r\first program evaluation.doc FIRST Program Evaluation A-MNDOT Minnesota Department of Transportation Page 26
32 Appendix A FIRST Daily Log FIRST Policies and Procedures
33
34
35
36
37
38
39
40
41
42
43
44
45
46

47
48
49
50

51
TRAFFIC INCIDENT MANAGEMENT SYSTEM (TIMS)
") TRAFFIC INCIDENT MANAGEMENT SYSTEM (TIMS) GUIDELINES 1. Purpose A. Ensure that an Ohio Turnpike and Infrastructure Commission (OTIC) Guideline exists to manage traffic backups and travel delays. B. Ensure
TRAFFIC INCIDENT MANAGEMENT SYSTEM (TIMS) GUIDELINES 1. Purpose A. Ensure that an Ohio Turnpike and Infrastructure Commission (OTIC) Guideline exists to manage traffic backups and travel delays. B. Ensure
Current Trends in Traffic Congestion Mitigation
 Current Trends in Traffic Congestion Mitigation April 24, 2009 NCSL Spring Forum Washington, DC Jeff Lindley Associate Administrator, Office of Operations Federal Highway Administration U.S. Department
Operations in the 21st Century DOT Meeting Customers Needs and Expectations
 Operations in the 21st Century DOT Meeting Customers Needs and Expectations 1 Purpose of this Meeting: Share Thoughts & Discuss Challenges brought about by the changing transportation environment and public
Using Reidentification to Evaluate the SCOUT Traffic Management System (TMS)
") Using Reidentification to Evaluate the SCOUT Traffic Management System (TMS) Eric Meyer University of Kansas 2011 Learned Hall Lawrence, KS 66049 emeyer@ku.edu Carlos Sun Department of Civil and Env. Engineering
Using Reidentification to Evaluate the SCOUT Traffic Management System (TMS) Eric Meyer University of Kansas 2011 Learned Hall Lawrence, KS 66049 emeyer@ku.edu Carlos Sun Department of Civil and Env. Engineering
NCHRP 20-7 Guide to Benchmarking Operations Performance Measures Incident Duration - Pilot Test Results
 NCHRP 20-7 Guide to Benchmarking Operations Performance Measures Incident Duration - Pilot Test Results 4.2 Incident Duration As incident management systems are maturing in many metropolitan areas, incident
Use of TMC Data for Performance Measurement and Improving Operations. National Rural ITS Conference August 25, 2014 Ming Shiun Lee URS Corporation
 Use of TMC Data for Performance Measurement and Improving Operations National Rural ITS Conference August 25, 2014 Ming Shiun Lee URS Corporation 1 Presentation Outline Motivations Performance Measures
APPENDIX B. Public Works and Development Engineering Services Division Guidelines for Traffic Impact Studies
 APPENDIX B Public Works and Development Engineering Services Division Guidelines for Traffic Impact Studies Revised December 7, 2010 via Resolution # 100991 Reformatted March 18, 2011 TABLE OF CONTENTS
FREEWAY PERFORMANCE MEASUREMENT SYSTEM (PeMS): AN OPERATIONAL ANALYSIS TOOL
: AN OPERATIONAL ANALYSIS TOOL") FREEWAY PERFORMANCE MEASUREMENT SYSTEM (PeMS): AN OPERATIONAL ANALYSIS TOOL Tom Choe Office of Freeway Operations California Department of Transportation District 7 120 S Spring Street Los Angeles, CA
FREEWAY PERFORMANCE MEASUREMENT SYSTEM (PeMS): AN OPERATIONAL ANALYSIS TOOL Tom Choe Office of Freeway Operations California Department of Transportation District 7 120 S Spring Street Los Angeles, CA
Emergency Incident Management, Benefits and Operational Issues
 Emergency Incident Management, Benefits and Operational Issues -- Performance and Benefits Evaluation of CHART Ying Liu, Peiwei Lin, Nan Zou, Gang-len Chang Department of Civil Engineering University of
National Traffic Incident Management Coalition. Improving Traffic Incident Management Together
 National Traffic Incident Management Coalition Improving Traffic Incident Management Together Promoting a National Agenda for Traffic Incident Management Why is Traffic Incident Management Important? Incidents
Concept of Operations
 Concept of Operations Monitoring Traffic in Work Zones: The icone System September 30, 2009 Prepared for: Minnesota Department of Transportation Prepared by: SRF Consulting Group, Inc. Project No. 6845
ENTERPRISE Transportation Pooled Fund Study TPF-5 (231)
") ENTERPRISE Transportation Pooled Fund Study TPF-5 (231) Use and Impacts of Camera Images and Other Displays of Traveler Information EXECUTIVE SUMMARY Prepared by September 2013 Acknowledgements This document
ENTERPRISE Transportation Pooled Fund Study TPF-5 (231) Use and Impacts of Camera Images and Other Displays of Traveler Information EXECUTIVE SUMMARY Prepared by September 2013 Acknowledgements This document
APPENDIX I. Florida Department of Transportation and Florida Highway Patrol Open Roads Policy RFP-DOT-16/ JR
 APPENDIX I Florida Department of Transportation and Florida Highway Patrol Open Roads Policy State of Florida OPEN ROADS POLICY AGREEMENT (Revised January 2014) Quick Clearance for Safety and Mobility
An Application of ITS for Incident Management in Second-Tier Cities: A Fargo, ND Case Study
 30 MID-CONTINENT TRANSPORTATION SYMPOSIUM 2000 PROCEEDINGS An Application of ITS for Incident Management in Second-Tier Cities: A Fargo, ND Case Study SHAWN BIRST AND AYMAN SMADI Congestion on urban freeways,
RAPID INCIDENT SCENE CLEARANCE (RISC)
") Approved: Effective: September 18, 2008 Traffic Engineering and Operations Topic No. 750-030-020-a RAPID INCIDENT SCENE CLEARANCE (RISC) PURPOSE: Rapid Incident Scene Clearance (RISC) is a highly innovative
Approved: Effective: September 18, 2008 Traffic Engineering and Operations Topic No. 750-030-020-a RAPID INCIDENT SCENE CLEARANCE (RISC) PURPOSE: Rapid Incident Scene Clearance (RISC) is a highly innovative
The Week at a Glance Week Ending February 23, 2007
 The Week at a Glance Week Ending February 23, 27 Traveler Information Calls Calls Taken 4,125 Average Call Length 1:3 Average Answer Time :8 Incidents Managed (not including construction) Incidents Managed
Safety. Introduction. Total System
 Safety Introduction Ohio is the 35 th largest state in the nation based on geographic size, however it carries the 5 th largest total traffic volume and the 4 th largest truck traffic volume. With such
Congestion Management Process 2013 Update
 OVERVIEW OF THE DALLAS-FORT WORTH CONGESTION MANAGEMENT PROCESS Traffic Congestion In The Dallas-Fort Worth Region With the Dallas-Fort Worth (DFW) urban area as its center, the North Central Texas region
North Central Texas Council of Governments 157
 13. Transportation System Safety The goal of the Transportation System Safety Program Area is to improve transportation safety throughout the region by supporting planning efforts to develop safety policies,
Traffic Management System Performance
 Traffic Management System Performance November 11, 2002 David Levinson 1 Wei Chen 2 Department of Civil Engineering University of Minnesota 500 Pillsbury Drive SE Minneapolis, MN 55455 levin031@tc.umn.edu
OPTIMIZING RAMP METERING STRATEGIES
 OPTIMIZING RAMP METERING STRATEGIES Presented by Kouros Mohammadian, Ph.D. Saurav Chakrabarti. ITS Midwest Annual Meeting Chicago, Illinois February 7, 2006 Background Ramp control is the application of
The Secrets to HCM Consistency Using Simulation Models
 The Secrets to HCM Consistency Using Simulation Models Ronald T. Milam, AICP David Stanek, PE Chris Breiland Fehr & Peers 2990 Lava Ridge Court, Suite 200 Roseville, CA 95661 r.milam@fehrandpeers.com (916)
Construction Alternative Screening with Regional Travel Demand Model
 Construction Alternative Screening with Regional Travel Demand Model By: Marty Milkovits (Corresponding Author) Cambridge Systematics, Inc. 100 CambridgePark Drive, Suite 400 Cambridge, MA 02140 Phone:
SMART WORK ZONE SOLUTIONS
 SMART WORK ZONE SOLUTIONS JAMLOGIC WHY USE JAMLOGIC IN SMART WORK ZONES? IN US WORKZONES, THERE WERE: 669 47,758 FATALITIES IN 2014 41% INJURIES IN 2013 OF FATAL CRASHES WERE REAR-END COLLISIONS IN 2014
A MODAL COMPARISON OF DOMESTIC FREIGHT TRANSPORTATION EFFECTS ON THE GENERAL PUBLIC EXECUTIVE SUMMARY. November 2007
 A MODAL COMPARISON OF DOMESTIC FREIGHT TRANSPORTATION EFFECTS ON THE GENERAL PUBLIC EXECUTIVE SUMMARY November 2007 Prepared by CENTER FOR PORTS AND WATERWAYS TEXAS TRANSPORTATION INSTITUTE 701 NORTH POST
Volume to Capacity Estimation of Signalized Road Networks for Metropolitan Transportation Planning. Hiron Fernando, BSCE. A Thesis CIVIL ENGINEERING
 Volume to Capacity Estimation of Signalized Road Networks for Metropolitan Transportation Planning by Hiron Fernando, BSCE A Thesis In CIVIL ENGINEERING Submitted to the Graduate Faculty of Texas Tech
Geometric Design: Past, Present, and Future
 A2A02: Committee on Geometric Design Chairman: Daniel B. Fambro Geometric Design: Past, Present, and Future DANIEL B. FAMBRO, Texas A&M University JOHN C. COLLINGS, Delcan Corporation ROBERT DELLA VEDOVA,
The Cost Savings Potential of Sustainability Practices
 The Cost Savings Potential of Sustainability Practices The Sustainability Triple Bottom Line The Triple Bottom Line (TBL) means addressing Environmental, Economic and Social Equity dimensions of a project
2040 Transportation Policy Plan Conversion to Performance Based Planning Basis. 25 th Annual CTS Transportation Research Conference May 21, 2014
 2040 Transportation Policy Plan Conversion to Performance Based Planning Basis 25 th Annual CTS Transportation Research Conference May 21, 2014 1 About the plan Long-range transportation plan for the Twin
Towing & Recovery. Incentive Program (T.R.I.P.) Pre-KICKOFF MEETING April 4, 2017
 Pre-KICKOFF MEETING April 4, 2017") Towing & Recovery Incentive Program (T.R.I.P.) Pre-KICKOFF MEETING April 4, 2017 Goals of This Meeting Define TRIP Identify stakeholders Establish/ discuss response areas Metro Richmond Establish timeline
Towing & Recovery Incentive Program (T.R.I.P.) Pre-KICKOFF MEETING April 4, 2017 Goals of This Meeting Define TRIP Identify stakeholders Establish/ discuss response areas Metro Richmond Establish timeline
MEASUREMENT OF RECURRING VERSUS NON-RECURRING CONGESTION: TECHNICAL REPORT
 Technical Report Research Project T2695, Task 36 Congestion Measurement MEASUREMENT OF RECURRING VERSUS NON-RECURRING CONGESTION: TECHNICAL REPORT by John M. Ishimaru Senior Research Engineer Mark E. Hallenbeck
A New Algorithm for Vehicle Reidentification and Travel Time Measurement on Freeways
 A New Algorithm for Vehicle Reidentification and Travel Time Measurement on Freeways Benjamin Coifman Institute of Transportation Studies University of California Berkeley, California, 9472 zephyr@eecs.berkeley.edu
Tool for Operations Benefit/Cost (TOPS- BC) for Florida DOT Applications
 for Florida DOT Applications") Task Work Order 20, Sub Task 4 Tool for Operations Benefit/Cost (TOPS- BC) for Florida DOT Applications TOPS-BC Florida Guidebook prepared for Florida Department of Transportation prepared by Cambridge
Task Work Order 20, Sub Task 4 Tool for Operations Benefit/Cost (TOPS- BC) for Florida DOT Applications TOPS-BC Florida Guidebook prepared for Florida Department of Transportation prepared by Cambridge
Use of Operation Data to Evaluate the Benefits and Costs of Advanced Traffic Management Components
 Use of Operation Data to Evaluate the Benefits and Costs of Advanced Traffic Management Components By: Mohammed Hadi, Ph.D., P.E. (Corresponding Author) Assistant Professor Department of Civil and Environmental
GENERAL NOTES FOR WORK ZONE SAFETY SET UP GUIDE
 FORWARD It shall be the responsibility of the person in charge to institute the placing of all appropriate cautionary devices and controls as may be required for the particular job. Traffic protection
Dynamic Lane Merge Systems
 Dynamic Lane Merge Systems Acknowledgements Maryland State Highway Administration University of Maryland, College Park Michigan Department of Transportation Wayne State University Lane Merging Issues Merging
The Transportation dividend
 Prepared by AECOM Technical Appendices report February 2018 The Transportation dividend Transit investments and the Massachusetts economy Technical Appendix A economic Benefits Methodology and Results
PREPRINT TITLE: AUTHORS: Matthew Thornton Post, Buckley, Schuh, and Jernigan 1575 Northside Drive, NW, Suite 350 Atlanta, GA
 Paper No. -1132 PREPRINT Duplication of this preprint for publication or sale is strictly prohibited without prior written permission of the Transportation Research Board TITLE: VEHICLE MODAL ACTIVITY
MONITORING IMPLEMENTATION AND PERFORMANCE
 12 MONITORING IMPLEMENTATION AND PERFORMANCE The FAST Act continues the legislation authorized under MAP-21, which created a data-driven, performance-based multimodal program to address the many challenges
Risk Analysis of Freeway Lane Closure During Peak Period
 Risk Analysis of Freeway Lane Closure During Peak Period Jake Kononov and Zane Znamenacek This paper examines risks associated with peak period lane closure during construction or maintenance work on urban
Performance you can see
 Performance you can see Features and benefits of Siemens SCOOT and ACS Lite Adaptive Signal Coordination software SCOOT Adaptive Traffic Management Why manually update your coordination timings every three
Did you know. Our Mission: Traveler Services; 100% accurate, anywhere, anytime. Operations & Maintenance Summary. Week Ending February 12, 2010
 Week Ending February 1, 1 Our Mission: Traveler Services; 1% accurate, anywhere, anytime HRTOC Motorist Quote of the Week about SSP Hardy Russell: Thank you for all the help you gave to me. Keep up the
Congestion Management Process Update
 report Congestion Management Process Update prepared for Houston-Galveston Area Council prepared by Cambridge Systematics, Inc. 10415 Morado Circle, Building II, Suite 340 Austin, TX 78759 with Alliance
CALIFORNIA HIGHWAY PATROL AGREEMENT
 18 One Gateway Plaza Los Angeles, CA 90012-2952 213.922.2000 Tel metro. net PLANNING AND PROGRAMMING COMMITTEE MAY 15, 2013 SUBJECT: ACTION: CALIFORNIA HIGHWAY PATROL AGREEMENT EXECUTE AN AGREEMENT WITH
Operational Analyses of Freeway Off-Ramp Bottlenecks
 Transportation Research Procedia Volume 15, 2016, Pages 573 582 ISEHP 2016. International Symposium on Enhancing Highway Performance Operational Analyses of Freeway Off-Ramp Bottlenecks Alexander Skabardonis
APPENDIX A: SHORT-TERM PROJECT DEPLOYMENTS
 APPENDIX A: SHORT-TERM PROJECT DEPLOYMENTS Page 1 of 15 ST-01: I-95 ITS DEPLOYMENT (DE STATE LINE TO AIRPORT) PROJECT DESCRIPTION AND SCOPE: Project will address gaps in ITS device coverage on I-95 from
INTELLIGENT TRANSPORTATION SYSTEMS SUMMARY
 Genesee County Shaping our Transportation Future Together 2035 Long Range Transportation Plan INTELLIGENT TRANSPORTATION SYSTEMS SUMMARY What is an Intelligent Transportation System? An Intelligent Transportation
Charlotte Region HOV/HOT/Managed Lanes Analysis. Technical Memorandum Task 1.3 EVALUATION CRITERIA
 Charlotte Region HOV/HOT/Managed Lanes Analysis Technical Memorandum Task 1.3 EVALUATION CRITERIA October 23, 2007 TABLE OF CONTENTS 1.0 EVALUATION PROCESS -------------------------------------------------------------------------------------------
INSIDE THIS ISSUE. mctrans.ce.ufl.edu VOLUME 64 \\ OCTOBER Streets Heat Map Freeways Animation HSM Supplement
 mctrans.ce.ufl.edu INSIDE THIS ISSUE McTrans Center University of Florida Civil & Coastal Engineering PO Box 116585 Gainesville, FL 32611-6585 Streets Heat Map Freeways Animation HSM Supplement Phone:
Scarborough Fire Department Scarborough, Maine Standard Operating Procedures
 Scarborough Fire Department Scarborough, Maine Standard Operating Procedures Book: Emergency Operations Chapter: Alarm & Response Procedures Subject: 3020 - Safe Vehicle Positioning Revision Date: 7/31/2007;
Mileage savings from optimization of coordinated trucking 1
 Mileage savings from optimization of coordinated trucking 1 T.P. McDonald Associate Professor Biosystems Engineering Auburn University, Auburn, AL K. Haridass Former Graduate Research Assistant Industrial
The New Highway Capacity Manual 6 th Edition It s Not Your Father s HCM
 The New Highway Capacity Manual 6 th Edition It s Not Your Father s HCM Tom Creasey, PE, PhD Principal, Stantec Consulting Services Inc. Chair, TRB Highway Capacity and Quality of Service Committee Presented
I 95 EXPRESS LANES SOUTHERN TERMINUS EXTENSION TRAFFIC OPERATIONS AND SAFETY ANALYSIS REPORT
 I 95 EXPRESS LANES SOUTHERN TERMINUS EXTENSION TRAFFIC OPERATIONS AND SAFETY ANALYSIS REPORT February 2016 INTERSTATE 95 EXPRESS LANES SOUTHERN TERMINUS EXTENSION PROJECT Commonwealth of Virginia Virginia
M D 355 [FR E D E R IC K R O A D] OVER
![M D 355 [FR E D E R IC K R O A D] OVER](/thumbs/79/79553721.jpg "M D 355 [FR E D E R IC K R O A D] OVER") M D 355 [FR E D E R IC K R O A D] OVER LITTLE BENNETT CREEK MAINTENANCE OF TRAFFIC ALTERNATIVE ANA LYSIS Prepared by: INTRODUCTION The purpose of this report is to present the results of traffic analyses
M D 355 [FR E D E R IC K R O A D] OVER LITTLE BENNETT CREEK MAINTENANCE OF TRAFFIC ALTERNATIVE ANA LYSIS Prepared by: INTRODUCTION The purpose of this report is to present the results of traffic analyses
SECTION III - REGIONAL ARTERIAL SYSTEM. The Regional Arterial System is a subcomponent of a broader regional thoroughfare system.
 SECTION III - REGIONAL ARTERIAL SYSTEM SYSTEM IDENTIFICATION The Regional Arterial System is a subcomponent of a broader regional thoroughfare system. The NCTCOG Regional Thoroughfare Plan (RTP) recognizes
Successful Incident Management on a Major Reconstruction Project
 Transportation Research Board 81 st Annual Meeting January 13-17, 2002 Washington, DC Successful Incident Management on a Major Reconstruction Project Pacific Motorway Project, Queensland Australia Professor
NORTHWEST CORRIDOR PROJECT. NOISE TECHNICAL REPORT 2015 Addendum Phase IV
 Noise Technical Report 2015 Addendum NOISE TECHNICAL REPORT 2015 Addendum PREPARED FOR: Federal Highway Administration and Georgia Department of Transportation PREPARED BY: Parsons Brinckerhoff Project
Evaluation of Congestion Pricing for Management Highway in Seattle
 Evaluation of Congestion Pricing for Management Highway in Seattle Aman J. Aman, Diana C. Nuñez, Mohammed Hamideddin, Pankaj Laungani, Wail Abbo Abstract Congestion is one of the most important and complex
Metropolitan Council Parsons Brinckerhoff FINAL REPORT. Metropolitan Highway System Investment Study
 September 2010 FINAL REPORT Metropolitan Highway System Investment Study Acknowledgments... 2 Figures... 3 Tables... 3 Executive Summary... 4 Managed Lanes... 4 Active Traffic Management... 5 Study Process...
Nashville Area. Regional ITS Architecture. Regional ITS Deployment Plan. June Prepared by:
 Regional ITS Architecture Regional ITS Deployment Plan Prepared by: 069223006 Copyright 2010 by Kimley-Horn and Associates, Inc. All rights reserved. TABLE OF CONTENTS REGIONAL ITS DEPLOYMENT PLAN 1. INTRODUCTION...
THE COST OF URBAN CONGESTION IN CANADA. Transport Canada Environmental Affairs. March 2006 (revised July 2007)
") THE COST OF URBAN CONGESTION IN CANADA Transport Canada Environmental Affairs March 2006 (revised July 2007) TABLE OF CONTENTS 1. Introduction... 1 2. Introduction to Congestion... 2 3. Past Efforts to
THE COST OF URBAN CONGESTION IN CANADA Transport Canada Environmental Affairs March 2006 (revised July 2007) TABLE OF CONTENTS 1. Introduction... 1 2. Introduction to Congestion... 2 3. Past Efforts to
MULTIMODAL TRANSPORTATION IMPACT STUDY GUIDELINES
 MULTIMODAL TRANSPORTATION IMPACT STUDY GUIDELINES 1 st Edition City of San Luis Obispo 2035 Circulation Element 1 Table of Contents Introduction... 2 Process... 2 When Impact Studies Are Required... 3
National Governors Association
 National Governors Association Roundtable Presentation April 2, 2001 Dr. Christine Johnson Director, ITS Joint Program Office Program Manager, FHWA Operations 1 Congestion is a critical problem Transportation
SR 99 Incident Response After- Action Plan
 SR 99 Incident Response After- Action Plan Background On June 10, 2014 at 1:52 PM, a pickup truck and a passenger car collided on southbound SR 99 (E Marginal Way S), just south of S Spokane St. The SDOT
TABLE OF CONTENTS PAGE NUMBER. Executive Summary Why Variable Pricing? What Was Studied? User Surveys Air Quality Analysis User And Equity Analysis
 TABLE OF CONTENTS PAGE NUMBER Executive Summary Why Variable Pricing? What Was Studied? User Surveys Air Quality Analysis User And Equity Analysis Findings Scenario 1 Base Case Scenario 2 Detoll Scenario
Congestion Mitigation
 Congestion Mitigation Programs and Strategies By Craig Mizera October 12, 2007 Midwest Transportation Consortium Fall Scholars Conference Craig Mizera ii ABSTRACT Highway congestion impacts society, freight,
USING TRAVEL TIME RELIABILITY DATA TO DEVELOP CONGESTION MANAGEMENT STRATEGIES IN THE TRANSPORTATION PLANNING PROCESS.
 USING TRAVEL TIME RELIABILITY DATA TO DEVELOP CONGESTION MANAGEMENT STRATEGIES IN THE TRANSPORTATION PLANNING PROCESS by Shuangshuo Wang B.S. Engineering, Tongji University, 2014 Submitted to the Graduate
YORK TOLL PLAZA MAINE TURNPIKE AUTHORITY AIR QUALITY REPORT. September 28, 2016 NOISE ANALYSIS REPORT MAINETURNPIKE AUTHORI TY
 NOISE ANALYSIS REPORT MAINETURNPIKE AUTHORI TY YORK TOLL PLAZA MAINE TURNPIKE AUTHORITY AIR QUALITY REPORT September 28, 2016 (Cover photograph provided by MTA) TABLE OF CONTENTS 1.0 EXECUTIVE SUMMARY...
Appendix B. Benefit-Cost Technical Memorandum
 Appendix B Benefit-Cost Technical Memorandum This Page Left Blank Intentionally MEMORANDUM TO: FROM: Michael Kalnbach MnDOT District 1 Project Manager Graham Johnson, PE DATE: September 2, 2014 RE: TH
Copyright. Michael DeGaspari
 Copyright by Michael DeGaspari 2012 The Thesis Committee for Michael DeGaspari Certifies that this is the approved version of the following thesis: Evaluation of the Mobility Impacts of Proposed Ramp Metering
AIR QUALITY AND CLIMATE CHANGE EVALUATION GUIDANCE
 AIR QUALITY AND CLIMATE CHANGE EVALUATION GUIDANCE The following guidance provides additional details regarding the process followed by PSRC to evaluate projects for potential air quality benefits. As
Title: Author(s): Transportation Research Board 77 th Annual Meeting January 11-15, 1998 Washington, D.C.
: Transportation Research Board 77 th Annual Meeting January 11-15, 1998 Washington, D.C.") Title: Estimating Benefits of ITS Technology in Incident Management: The Case of Northern Virginia Author(s): Gerard C. Maas, Jr. Research Fellow Transportation Policy Program The Institute of Public Policy
Title: Estimating Benefits of ITS Technology in Incident Management: The Case of Northern Virginia Author(s): Gerard C. Maas, Jr. Research Fellow Transportation Policy Program The Institute of Public Policy
Los Angeles County Congestion Reduction Demonstration Project
 Los Angeles County Congestion Reduction Demonstration Project frequently asked questions update #1 /august 2008 Los Angeles County Metropolitan Transportation Authority (Metro), California Department of
FINAL REPORT. Synthesis of Active Traffic Management Experiences in Europe and the United States
 FINAL REPORT Synthesis of Active Traffic Management Experiences in Europe and the United States Submitted to: FHWA Prepared by: Parsons Brinckerhoff Publication # FHWA-HOP-10-031 Foreword Notice This document
U.S. 101 / San Mateo County Smart Corridor Project
 Department of Transportation District 4 - Traffic Operations October 1, 2013 U.S. 101 / San Mateo County Smart Corridor Project www.dot.ca.gov California Department of Transportation (Caltrans) Overview
Appendix D: Functional Classification Criteria and Characteristics, and MnDOT Access Guidance
 APPENDICES Appendix D: Functional Classification Criteria and Characteristics, and MnDOT Access Guidance D.1 Functional classification identifies the role a highway or street plays in the transportation
FOR INTERSTATE 81 AND ROUTE 37 INTERCHANGE FREDERICK COUNTY, VIRGINIA MILEPOST 310
 INTERCHANGE MODIFICATION REPORT FOR INTERSTATE 81 AND ROUTE 37 INTERCHANGE FREDERICK COUNTY, VIRGINIA MILEPOST 310 PREPARED BY: VIRGINIA DEPARTMENT OF TRANSPORTATION STAUNTON DISTRICT DECEMBER 13, 2006
CLOGGED ARTERIES: AN EMPIRICAL APPROACH FOR IDENTIFYING AND ADDRESSING LOCALIZED HIGHWAY CONGESTION BOTTLENECKS
 CLOGGED ARTERIES: AN EMPIRICAL APPROACH FOR IDENTIFYING AND ADDRESSING LOCALIZED HIGHWAY CONGESTION BOTTLENECKS Vivek Sakhrani, PhD, CPCS Transcom Inc. (USA) Tufayel Chowdhury, CPCS Transcom Limited (Canada)
Identifying, Anticipating, and Mitigating Freight Bottlenecks on Alabama Interstates
 Identifying, Anticipating, and Mitigating Freight Bottlenecks on Alabama Interstates By Mr. Kenneth Anderson, Dr. Steven Jones, and Dr. Jay Lindly Department of Civil, Construction, and Environmental Engineering
Origin-Destination Trips and Skims Matrices
 Origin-Destination Trips and Skims Matrices presented by César A. Segovia, AICP Senior Transportation Planner AECOM September 17, 2015 Today s Webinar Content Matrix Estimation Data sources Florida Application
IFreeway and Arterial
 IFreeway and Arterial Management Effortin Washington State BYLESLIEN JACOBSON T raffic congestion and personal mom bility preservation are the most challenging issues facing transportation professionals.
Evaluating the Potential Economic Efficiency of Project Delivery Options
 1 1 1 1 1 1 1 1 0 1 0 1 Paper No. 1-000 Evaluating the Potential Economic Efficiency of Project Delivery Options Patrick DeCorla-Souza 1 Public-Private Partnerships Program Manager Build America Bureau
Integrated Corridor Management --An Overview --
 Integrated Corridor Management --An Overview -- Neil Spiller FHWA Office of Operations Program Manager: ICM KBPS video 1 Integrated.. combining or coordinating separate agencies so as to provide a harmonious,
RELATIONSHIP BETWEEN TRAFFIC FLOW AND SAFETY OF FREEWAYS IN CHINA: A CASE STUDY OF JINGJINTANG FREEWAY
 RELATIONSHIP BETWEEN TRAFFIC FLOW AND SAFETY OF FREEWAYS IN CHINA: A CASE STUDY OF JINGJINTANG FREEWAY Liande ZHONG, PhD Associate professor, Certified Safety Engineer, Research Institute of Highway, Ministry
NCUTCD Proposal for Changes to the Manual on Uniform Traffic Control Devices
 1 2 3 4 5 6 7 8 9 10 11 12 13 14 15 16 17 18 19 20 21 22 23 24 25 26 27 28 29 30 31 32 33 34 35 TECHNICAL COMMITTEE: ITEM NUMBER: TOPIC: ORIGIN OF REQUEST: AFFECTED SECTIONS OF MUTCD: NCUTCD Proposal for
Dallas Integrated Corridor Management (ICM) Update
 Update") Dallas Integrated Corridor Management (ICM) Update North Central Texas Council of Governments Surface Transportation Technical Committee April 26, 2013 What is ICM? The integrated management of freeway,
Dallas Integrated Corridor Management (ICM) Update North Central Texas Council of Governments Surface Transportation Technical Committee April 26, 2013 What is ICM? The integrated management of freeway,
Tioga. NCFRP14 Truck Drayage Practices Preliminary Findings
 NCFRP14 Truck Drayage Practices Preliminary Findings The Group, Inc. Center for Transportation Research, Univ. of Texas, Austin University of South Carolina Transportation Research Board Summer Meeting
Modeling Traffic Flow under Emergency Evacuation Situations: Current Practice and Future Direction
 Modeling Traffic Flow under Emergency Evacuation Situations: Current Practice and Future Direction Kevin D. Moriarty Research Assistant Transportation Engineering November 16, 2006 Overview Introduction
Safer travel, faster arrival siemens.com/mobility
 Sitraffic Conduct+ Highway Management System Safer travel, faster arrival siemens.com/mobility Less congestion. Fewer accidents. Higher capacity. 2 Wherever overhead gantries display situation-tailored
COMPANY OFFICER SAFE VEHICLE PRACTICES DURING ON-HIGHWAY INCIDENTS. 3 hours TIME FRAME: LEVEL OF INSTRUCTION: AUTHORITY: BEHAVIORAL OBJECTIVE:
 TOPIC: TIME FRAME: LEVEL OF INSTRUCTION: SAFE VEHICLE PRACTICES DURING ON-HIGHWAY INCIDENTS 3 hours II AUTHORITY: BEHAVIORAL OBJECTIVE: Condition: Behavior: Standard: A written quiz The student will confirm
Des Moines Metropolitan Area ITS Strategic Plan
 172 1998 TRANSPORTATION CONFERENCE PROCEEDINGS Des Moines Metropolitan Area ITS Strategic Plan THOMAS KANE, T.H. MAZE, AND VINCENT P. PEARCE The Des Moines Area Metropolitan Organization (MPO) completed
DYNAC. Advanced Traffic Management.
 EN Kapsch TrafficCom DYNAC Advanced Traffic Management. DYNAC s modular design allows for full integration of ATMS and SCADA (Supervisory Control and Data Acquisition), making it an ideal solution for
Establishing International Roughness Indices for a dense urban area case study in Washington, DC
 The Sustainable City VI 275 Establishing International Roughness Indices for a dense urban area case study in Washington, DC S. A. Arhin 1, E. C. Noel 1 & M. Lakew 2 1 Howard University, USA 2 District
Transit Service Guidelines
 G R E AT E R VA N CO U V E R T R A N S P O RTAT I O N A U T H O R I T Y Transit Service Guidelines PUBLIC SUMMARY REPORT JUNE 2004 Greater Vancouver Transportation Authority TRANSIT SERVICE GUIDELINES
KANSAS WORK ZONE SAFETY AND MOBILITY PROCESSES AND PROCEDURES
 KANSAS WORK ZONE SAFETY AND MOBILITY PROCESSES AND PROCEDURES Bureau of Transportation Safety and Technology 700 SW Harrison, Topeka, KS 66603 July 30, 2008 Definitions Significant Project All Federal-aid
APPENDIX H: TRAVEL DEMAND MODEL VALIDATION AND ANALYSIS
 APPENDIX H: TRAVEL DEMAND MODEL VALIDATION AND ANALYSIS Travel demand models (TDM) simulate current travel conditions and forecast future travel patterns and conditions based on planned system improvements
for Law Enforcement KVE Developed by the Kentucky Transportation Center University of Kentucky in cooperation with the
 A Checklist for Law Enforcement Fire & Rescue EMS CRASH SITE Towing KYTC KVE Emergency Management Developed by the Kentucky Transportation Center University of Kentucky in cooperation with the Kentucky
LOCATION AND DESIGN DIVISION
 VIRGINIA DEPARTMENT OF TRANSPORTATION LOCATION AND DESIGN DIVISION INSTRUCTIONAL AND INFORMATIONAL MEMORANDUM GENERAL SUBJECT: Interstate, NHS Non-Interstate and Non-NHS (IJR / IMR Guidance) SPECIFIC SUBJECT: