M D 355 [FR E D E R IC K R O A D] OVER
|
|
|
- Jason Simon
- 6 years ago
- Views:
Transcription


1 M D 355 [FR E D E R IC K R O A D] OVER LITTLE BENNETT CREEK MAINTENANCE OF TRAFFIC ALTERNATIVE ANA LYSIS Prepared by:
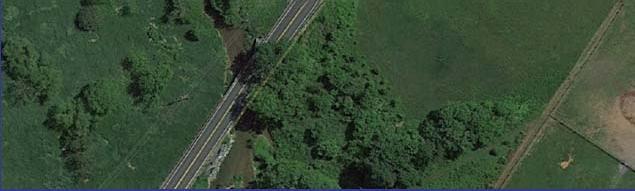
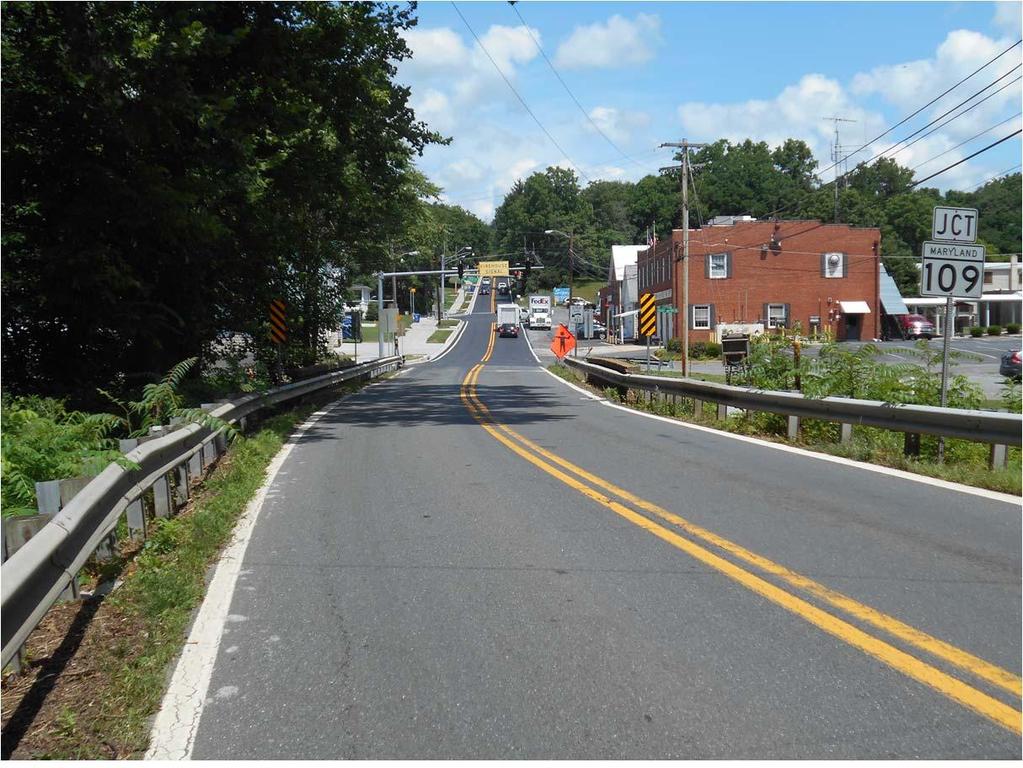
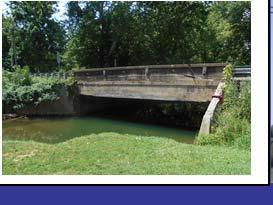
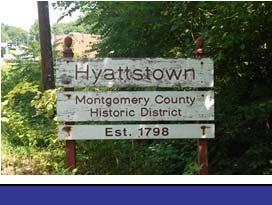
 over Little Bennett Creek in Montgomery County. The bridge is located between Hyattstown and Clarksburg.")

2 INTRODUCTION The purpose of this report is to present the results of traffic analyses performed for the replacement of Bridge No on MD 3 5(Frederick Road) over Little Bennett Creek in Montgomery County. The bridge is located between Hyattstown and Clarksburg. Running parallel to I-270, MD 3 5is a twolane, undivided rural collector with 11 foot lanes (with no shoulder at the bridge) in each direction. For the purposes of this analysis, it was assumed the bridge would be reconstructed in year The bridge location is shown in Figure 1. Under this project, the bridge will be reconstructed and will feature 12 foot travel lanes and 6 foot shoulders. The design speed for the ultimate roadway within the project limits will be 30 mph. SUMMARY OF ALTERNATIVES The Maryland Department of Transportation State Highway Administration (MDOT SHA) requested three major Maintenance of Traffic (MOT) alternatives be evaluated for this study: (1) Full Detour, (2) Maintain One Travel Lane, and (3) Maintain All Travel Lanes. The following is a description of each of the alternatives. Alternative 1 (Full Detour): This alternative would consist of one construction phase. MD 355, in the vicinity of the bridge, would be closed to traffic and a detour would be instituted for all traffic for the duration of the construction project. The detour route would include MD 109 (Old Hundred Road) from MD 3 5to I-270, I-270 from MD 109 to MD 121 (Clarksburg Road), and MD 121 from I-270 to MD 3 5. A map of the detour route can be seen in Figure 2. The existing route along MD 3 5between MD 109 and MD 121 is approximately 3.5 miles long. The proposed detour route is approximately 5.9 miles in length. All roadways along the proposed detour route The Wilson T. Ballard Company Page 1 of 17
3 are governed by MDOT SHA. MD 109 is a two-lane undivided collector, I-270 is a four-lane divided freeway, MD 121 (Clarksburg/Stringtown Road) is a four-lane divided arterial to Gateway Center Drive, which is also a four-lane divided roadway to MD 121 (Clarksburg Road), which is a twolane local road to its intersection with MD 3 5. The speed limit along MD 3 5is 30 mph approaching the study bridge. Within the limits of the detour, speed limits on MD 3 5transition from 40 mph up to 50 mph and then back down to 30 mph just prior to the bridge. Also, the speed limits along I-270, MD 109, and MD 121 are 65 mph, 30 mph, and 40 mph lessening to 30 mph, respectively. Alternative 2 (Maintain One Travel Lane): Under this option, one travel lane will be maintained at all times and the bridge will be constructed in stages while alternating traffic across the bridge through the use of a temporary signal at each end of the work zone. During the first stage of construction, the existing northbound travel lane will be maintained while the western portion of the new bridge and roadway alignment is constructed. During the second stage of construction, the single lane of traffic will be shifted to the newly constructed western portion of the roadway while the remaining portion of the roadway and bridge work is performed. Analysis for this alternative will include signal optimization for the installation of temporary traffic signals to regulate the direction of travel throughout the work zone. Alternative 3 (Maintain All Travel Lanes): Under this alternative, all existing travel lanes will be maintained through the work area. During the first stage of construction, a temporary roadway alignment will be constructed around the majority of the project limits. The temporary roadway will include temporary drainage structures at the location of the existing creek crossing. During the second stage of construction, all travel lanes will be shifted to the temporary roadway alignment, the existing bridge will be removed, and the new bridge will be constructed. During the final stage of construction, all travel lanes will be shifted to the ultimate alignment and the temporary roadway and bridge will be removed. It should be noted that under this alternative, construction of the tie-in areas between the ultimate and temporary alignments must be constructed, which would not be require under either a full detour (such as under Alternative 1) or while maintaining a single travel lane through the project limits (such as under Alternative 2). TRAFFIC VOLUMES Traffic count data obtained from MDOT SHA s Data Services Engineering Division (DSED) was used for this study. The data included the following: 48-hour classification count on MD 3 5over Little Bennett Creek (October 2013) MD 3 5at MD 109 (13-hour turning movement count - September 2016) MD 3 5at Hyattstown Mill Road (13-hour turning movement count - October 2013) MD 3 5at Comus Road (13-hour turning movement count - September 2013) MD 109 at NB I-270 Ramps (13-hour turning movement count - September 2013) MD 109 at SB I-270 Ramps (13-hour turning movement count - September 2013) MD 121 at SB I-270 Ramps (13-hour turning movement count - September 2013) MD 121 at NB I-270 Ramps (13-hour turning movement count - September 2013) The Wilson T. Ballard Company Page 2 of 17
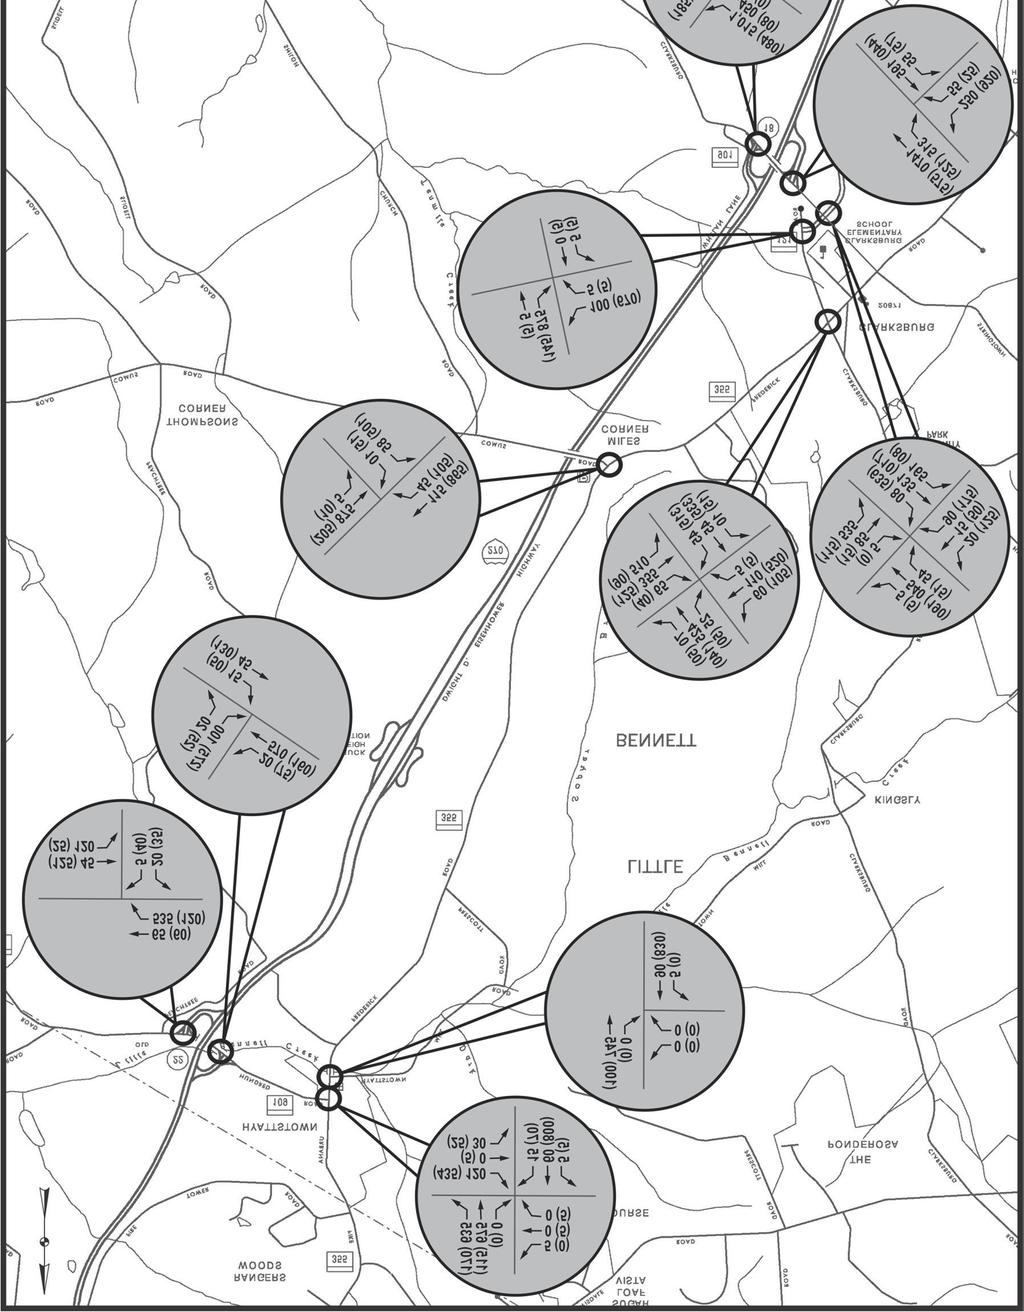
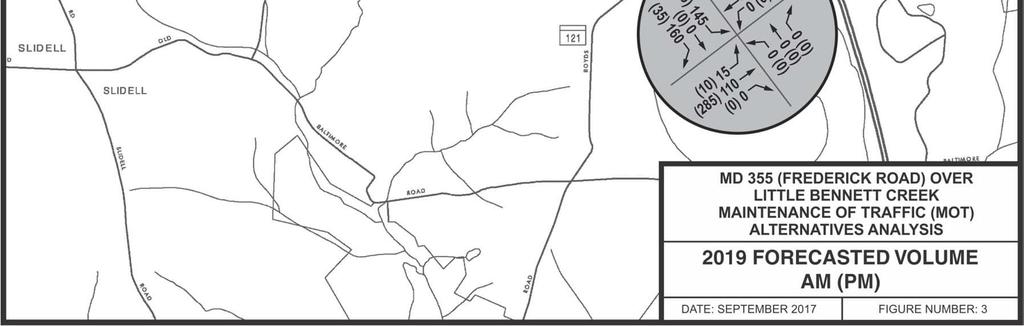
4 MD 121 (Stringtown Road) at Gateway Center Drive (13-hour turning movement count - September 2012) MD 121A (Clarksburg Road) at Gateway Center Drive (13-hour turning movement count - January 2011) MD 121A at MD 3 5(13-hour turning movement count November 2016) It should be noted, except for the count data at the intersection of MD 121A and MD 3 5, no traffic counts from the recently constructed Clarksburg Premium Outlets has been considered in this analysis. The detailed count data is included in Appendix A. According to AADT data on MD 3 5south of MD 109, the average annual growth rate in the vicinity of the study bridge between 2012 and 2016 was 0.84%. Therefore, an annual growth rate factor of 0.9% was applied when developing the construction year (2019) traffic volumes. The traffic volumes were factored to adjust for the highest traffic volume month and day of the week for the year during AM and PM peak periods. The MDOT SHA s Traffic Trends data was used to determine the applicable adjustment factor. The highest 2013 peak AADT flow occurs on Fridays in May (118.16%). Based on these factors, the hourly volumes at each intersection were adjusted to Friday peak hour volumes in May in order to reflect the highest traffic volumes of the year. The Traffic Trends data is included in Appendix B. The adjustment factor for the peak day of the year was applied to the traffic volumes and the 0.9% annual growth rate was used to calculate Year 2019 analysis volumes. Table 1 summarizes the adjusted weekday peak hour volumes by direction on MD 3 5over Little Bennett Creek from 2013 to the proposed construction year of Figure 3 shows the adjusted weekday peak hour volumes for Year 2019 along the detour route. It should be noted that only Year 2019 traffic volumes were used for the analysis in this study. Table 1. Traffic Volumes on MD 3 5over Little Bennett Creek Peak Hour Existing Weekday Peak Hour Volume (Veh/hr) 2019 Adjusted Weekday Peak Hour Volume (Veh/hr) NB SB NB SB AM PM EXISTING CONDITIONS Existing Roadway Profile The 25-year storm overtops the existing MD 355bridge over Little Bennett Creek resulting in erosion of the roadway north of the bridge. Therefore, as part of this project, the roadway profile will be increased by approximately 2.0 feet at the bridge to prevent the 25-year storm from overtopping the structure. In order to tie in the new bridge profile, adjustments to the approach roadway profile will be required over a distance of approximately 700 (400 north of the bridge and 250 south of the bridge). The Wilson T. Ballard Company Page 3 of 17
5
6 Existing Environmental Features A preliminary investigation has been performed to identify environmental and cultural features within the project limits. This investigation indicated the following resources in the area of the bridge 1) floodplain 2) the MD 355bridge (15053) and Hyattstown Historic District, both listed in the Maryland Inventory of Historical Properties (MIHP) 3) wetlands 4) Green Infrastructure elements 5) Little Bennett Regional Park 6) Potential rare, threatened and endangered species, and 7) Forest Interior Dwelling Birds (FIDs) habitat. Therefore, potential impacts to environmental and cultural resources should be considered in the evaluation of the available alternatives. Evaluation of Study Network Geometrics Available sight distances were evaluated at each intersection and road along the detour routes. Based on the field observation, it appears the sight distances at all locations along the detour routes are adequate. The intersections within the roadway network were also evaluated for adequate turning radii. Based on the evaluation of a WB-50 vehicle, turning radii for movements are adequate at all of the intersections along the detour route. Travel Time Study Field travel times were collected during off-peak hours traveling along the proposed detour route. Based on the field study, the detour is expected to add approximately 7-8 minutes in travel time over the full length of the detour in each direction during off-peak hours. School Bus Routes There are four public schools located in the vicinity of the detour route. This includes one high school (Clarksburg High School), one middle school (Rocky Hill Middle School), and two elementary schools (Little Bennett and Clarksburg Elementary schools), located in Clarksburg. School bus routes for all of these schools likely utilize portions of MD 3 5or the detour route under existing conditions and will therefore be impacted by any proposed roadway (full or partial) closure. According to Montgomery County Public Schools (MCPS) Transportation Department, MD 3 5is a heavily traveled school bus route providing access to the schools located in Clarksburg. A closure of MD 3 5in the vicinity of the study bridge would result in an increase in school bus travel times between 10 and 15minutes and if a detour option is selected, MCPS needs to be notified by at least the Spring before the planned closure so that the detour can be incorporated into the planned school bus routes for the school year when construction is to be completed. As this project continues through the planning and design stages, it is recommended that MCPS be involved. Page 5 of 17
7 MDOT SHA MOBILITY THRESHOLDS The MDOT SHA has developed mobility thresholds for work zone operations and they are shown in Table 2. Table 2. MDOT SHA Mobility Thresholds Signalized Intersections Existing Level of Service Mobility Threshold Maximum LOS D A, B or C Control delay < 45seconds D Maximum increase in Control delay of 30% Maximum increase in Control delay of 30%, or E Control delay < 80 seconds F No increase in control delay Unsignalized Intersections Existing Level of Service Mobility Threshold Maximum LOS D A, B or C Control delay < 30 seconds D Maximum increase in Control delay of 30% Maximum increase in Control delay of 30%, or E Control delay < 50 seconds F No increase in control delay Arterials Existing Travel Time T Mobility Threshold Travel time cannot increase more than 15minutes (Maximum of T+15) ALTERNATIVES ANALYSIS Alternative 1: Full Detour Under this alternate, the bridge will be closed to all traffic for the duration of the construction project. Through traffic on MD 3 5will be detoured along MD 109 (between MD 3 5and I-270), I-270 (between MD 109 and MD 121), and MD 121 (between I-270 and MD 3 5). Geometric Analysis Under this alternative, the new bridge will be constructed along roughly the same alignment as the existing bridge, with a slight offset to accommodate the widened bridge section. Volume Redistribution Traffic volumes for movements prohibited by the proposed bridge closure were redistributed throughout the study network based on several assumptions. These assumptions were based on the existing traffic count data in the study network and assumed driver behavior. The following are some assumptions that were used to redistribute network volumes: Motorists are familiar with the area and will utilize the shortest path in order to get to their destination. All volumes were redistributed based on the downstream or upstream intersection s current volume proportions of turns for each turning movement. Page 6 of 17

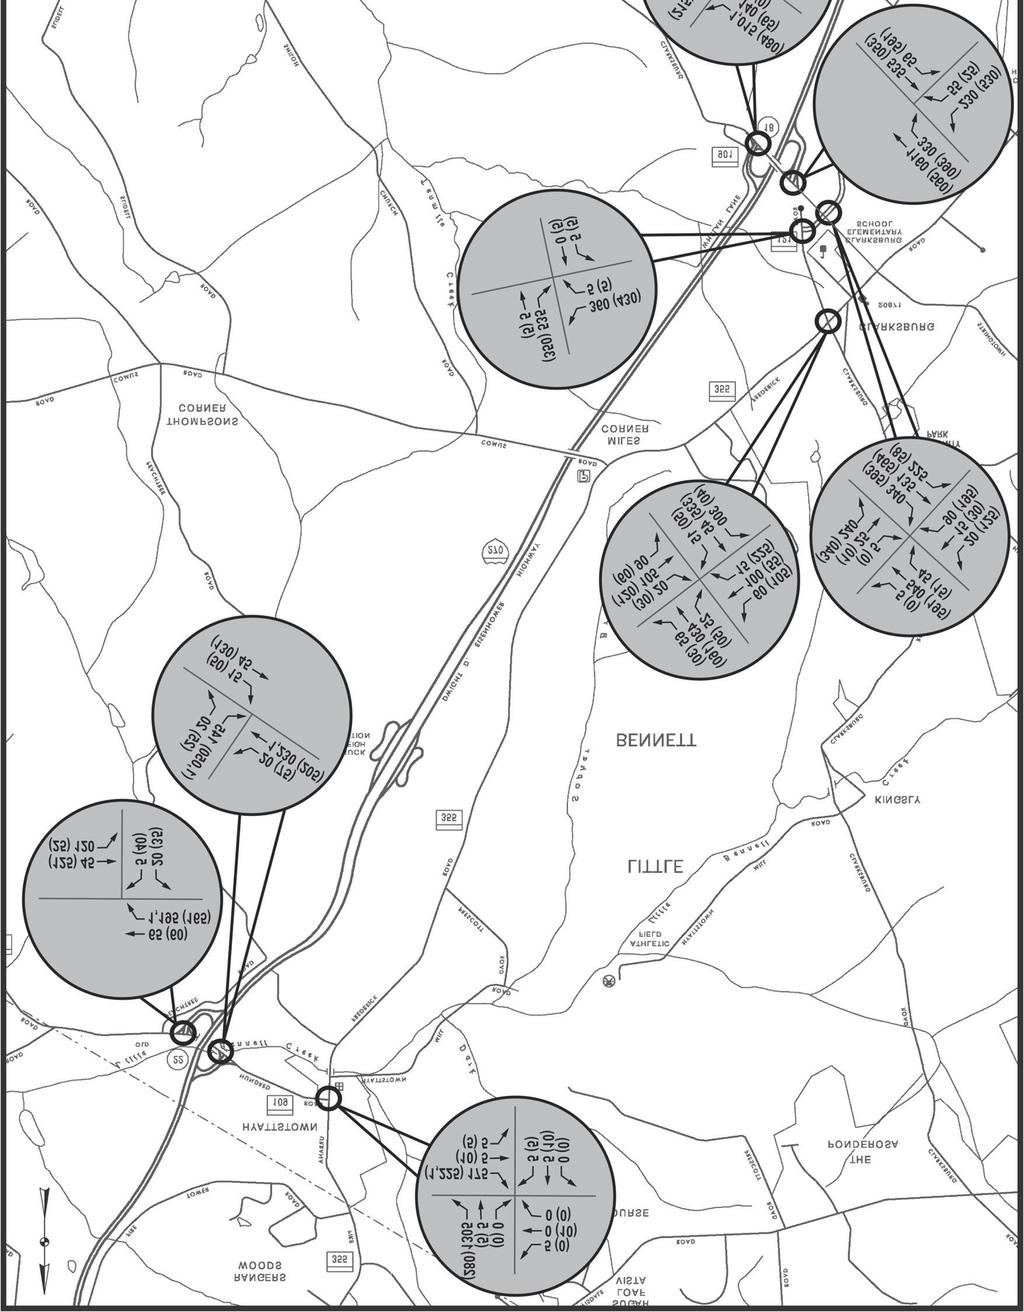
8 Travel demand on MD 3 5north of MD 109 will not be affected by the detour. Based on these assumptions, the Year 2019 factored traffic volumes were redistributed throughout the study network. Figure 4 shows the redistributed traffic volumes that were used for the analysis of this alternative. Analysis Results Synchro and Highway Capacity Software (HCS) analyses were performed on the study network under existing and full detour conditions to determine the impact of the proposed detour. Synchro was used specifically for the evaluation of intersections along the detour route. HCS was utilized to analyze freeway and ramp operations along the detour route, since Synchro does not adequately evaluate freeway operations. Tables 3 and 4 summarize the results of the Synchro and HCS analyses, respectively, under existing conditions. Tables 5and 6 summarize the results of the Synchro and HCS analyses, respectively, under Full Detour conditions. It should be noted that signal timings at signalized intersections were optimized under Full Detour conditions to mitigate the impacts of the volume redistribution. Values shown in bold red italics exceed MDOT SHA s allowable mobility thresholds. The Synchro and HCS worksheets for existing conditions can be found in Appendix C, and worksheets for Full Detour conditions can be found in Appendix D. Table 3. Peak Hour Synchro Analysis Existing Conditions AM (PM) Intersection Approach Delay / Vehicle (sec) V/C Ratio Levelof Service MD 3 5at MD 109 SB MD (13.4) 1.01 (0.29) D (B) NB MD (49.5) 0.10 (0.99) A (D) EB MD (78.6) 0.89 (1.01) F (E) WB Driveway 52.9 (22.1) 0.00 (0.02) D (C) TOTAL INTERSECTION 43.1 (51.4) 1.02 (1.04) D (D) MD 109 at NB I-270 Ramps WB MD (0.0) 0.38 (0.15) N/A (N/A) EB MD (2.4) 0.02 (0.04) N/A (N/A) I-270 NB Ramps 18.1 (20.6) 0.32 (0.59) C (C) MD 109 at SB I-270 Ramps WB MD (5.4) 0.37 (0.09) N/A (N/A) EB MD (0.0) 0.11 (0.10) N/A (N/A) I-270 SB Ramps 15.3 (11.5) 0.07 (0.13) C (B) Page 7 of 17
9
10 Table 3 (cont.). Peak Hour Synchro Analysis Existing Conditions AM (PM) Intersection Approach Delay / Vehicle (sec) V/C Ratio Level of Service MD 121 at SB I-270 Ramps EB MD (5.3) 0.05(0.13) A (A) WB MD (6.0) 0.70 (0.33) A (A) I-270 SB Ramps 24.7 (16.8) 0.70 (0.58) C (B) TOTAL INTERSECTION 11.1 (8.0) 0.70 (0.41) B (A) MD 121 at NB Ramps EB MD (26.7) 0.08 (0.52) A (C) WB MD (35.2) 0.63 (0.78) A (D) I-270 NB Ramps 23.6 (35.5) 0.17 (0.97) C (D) TOTAL INTERSECTION 7.4 (33.3) 0.56 (0.92) A (C) MD 121/Stringtown Road at Gateway Center Drive EB MD (19.9) 0.23 (0.93) B (B) WB Stringtown Rd 15.4 (24.2) 0.52 (0.30) B (C) NB Gateway Center Dr 13.8 (19.4) 0.23 (0.43) B (B) SB Gateway Center Dr 13.8 (6.8) 0.64 (0.07) B (A) TOTAL INTERSECTION 13.6 (19.4) 0.65(0.79) B (B) Gateway Center Drive at MD 121A NB Gateway Center Dr 14.6 (15.0) 0.16 (0.68) B (C) EB MD 121A 0.0 (0.0) 0.0 (0.01) N/A (N/A) WB MD 121A 10.3 (7.3) 0.59 (0.10) N/A (N/A) MD 121A at MD 3 5 EB MD 121A 34.4 (79.0) 0.53 (1.01) C (E) WB Clarksburg Rd 30.5(89.7) 0.82 (0.92) C (F) SB MD (47.4) 0.82 (0.79) C (D) NB MD (59.7) 0.23 (0.93) B (E) TOTAL INTERSECTION 26.4 (69.2) 0.78 (1.00) C (E) Table 4. Peak Hour HCS Analysis Existing Conditions AM (PM) Section Density (pc/mi/ln) Speed (mph) Level of Service Southbound I-270 Merge from MD (30.4) 41.5( 5.2) F (D) Freeway Section Between MD 109 & MD (24.6) 46.5(69.5) F (C) Diverge to MD (21.0) 56.4 (56.5) C (C) Northbound I-270 Merge from MD (27.4) 58.9 (57.2) C (C) Freeway Section Between MD 121 & MD (50.7) 71.0 (49.6) C (F) Diverge to MD (45.5) 51.9 (51.5) D (F) Page 9 of 17
11 Table 5. Peak Hour Synchro Analysis Full Detour Conditions AM (PM) Intersection Approach Delay / Vehicle (sec) V/C Ratio Level of Service MD 3 5at MD 109 SB MD (59.1) 0.97 (0.23) C (E) NB MD (66.7) 0.01 (0.43) A (E) EB MD (92.6) 0.78 (1.16) D (F) WB Driveway 27.4 (1.3) 0.00 (0.01) C (A) TOTAL INTERSECTION 32.9 (85.6) 0.98 (1.15) C (F) MD 109 at NB I-270 Ramps WB MD (0.0) 0.80 (0.18) N/A (N/A) EB MD (2.4) 0.03 (0.04) N/A (N/A) I-270 NB Ramps (616.4) 1.22 (2.32) F (F) MD 109 at SB I-270 Ramps WB MD (6.0) 0.83 (0.12) N/A (N/A) EB MD (0.0) 0.11 (0.10) N/A (N/A) I-270 SB Ramps (12.5) 1.47 (0.14) F (B) MD 121 at SB I-270 Ramps EB MD (5.9) 0.10 (0.13) C (A) WB MD (6.6) 0.71 (0.33) D (A) I-270 SB Ramps 96.8 (17.5) 1.14 (0.65) F (B) TOTAL INTERSECTION 62.5(9.1) 1.00 (0.45) E (A) MD 121 at NB Ramps EB MD (4.4) 0.23 (0.17) A (A) WB MD (6.4) 0.62 (0.67) A (A) I-270 NB Ramps 23.6 (27.2) 0.16 (0.68) C (C) TOTAL INTERSECTION 6.0 (11.5) 0. 5(0.67) A (B) MD 121/Stringtown Road at Gateway Center Drive EB MD (15.8) 0.77 (0.79) B (B) WB Stringtown RD 18.7 (19.3) 0.58 (0.27) B (B) NB Gateway Center Dr 15.9 (13.7) 0.23 (0.39) B (B) SB Gateway Center Dr 9.7 (7.0) 0.25(0.21) A (A) TOTAL INTERSECTION 15.8 (14.2) 0.62 (0.65) B (B) Gateway Center Drive at MD 121A NB Gateway Center Dr 10.5(11.0) 0.04 (0.02) B (B) EB MD 121A 0.0 (0.0) 0.00 (0.01) N/A (N/A) WB MD 121A 8.4 (7.8) 0.36 (0.24) N/A (N/A) MD 121A at MD 3 5 EB MD 121A 22.3 (30.9) 0.24 (0.81) C (C) WB Clarksburg Rd 18.9 (27.5) 0.73 (0.63) B (C) SB MD (26.4) 0.47 (0. 5) C (C) NB MD (22.2) 0.32 (0.72) B (C) TOTAL INTERSECTION 20.2 (26.9) 0.57 (0.78) C (C) Page 10 of 17
12 Table 6. Peak Hour HCS Analysis Full Detour Conditions AM (PM) Section Density (pc/mi/ln) Speed (mph) Level of Service Southbound I-270 Merge from MD (30.7) 23.0 ( 5.1) F (D) Freeway Section Between MD 109 & MD (50.7) 31.5(49.6) F (F) Diverge to MD (21.4) 54.8 (56.4) D (C) Northbound I-270 Merge from MD (32.9) 58.8 ( 5.1) C (D) Freeway Section Between MD 121 & MD (89.9) 70.7 (32.8) C (F) Diverge to MD (53.0) 51.8 (49.7) D (F) As shown in these tables, this alternative is expected to result in increases in delay at the intersections of MD 109 with MD 3 5and the I-270 Ramps at MD 109 and with the SB I-270 Ramps at MD 121 due to the proposed roadway closure and subsequent detour. These increases in delay are expected to result in conditions that will fail MDOT SHA s mobility thresholds. The HCS analyses along I-270 indicated increases in density and reductions in speeds throughout the study network, with increases in density of up to over 100% in the southbound direction during the PM Peak hour. Alternative 2: Maintain One Travel Lane Under this alternative, MD 3 5will be reduced to one travel lane during construction. The bridge will be constructed in stages while alternating traffic across the bridge through the use of a temporary signal. As with Alternative 1, the roadway profile within the project limits will be raised to reduce existing flooding issues. Signal Control This alternative involves regulating the direction of traffic in the one open lane on the bridge through the use of a temporary traffic signal. Due to the presence of an existing driveway and intersection at the northern limits of the project, this alternative will require the installation of signalization for the driveway leg and intersection of Hyattstown Mill Road. Appendix E contains concept plans of this alternative. For the development of traffic signal timings, the length of the clearance interval is a function of the effective width of the intersection. In this instance the effective width of the intersection is the length of the tapers, work zone, and buffer area, and the clearance interval should allow a vehicle to travel the distance from stop-line to stop-line before the opposing direction of traffic receives the green indication. Clearance intervals were developed using MDOT SHA s Policy for Determining Yellow Timings at Intersections, and the Institute of Transportation Engineers (ITE s) Traffic Signal Design Handbook. Based on these guidelines, Table 7 presents the yellow and all-red timings for these signals, where t is the perception-reaction time (assumed to be 1 sec.), V posted is the posted speed limit (30 mph), V operating is the operating speed (assumed to be 25mph), a is the acceleration (10 ft/s 2 ), W is the total effective intersection width (535ft), and L is the average vehicle length (assumed to be 25ft). It should be noted that the operating Page 11 of 17
13 speed was assumed to be 25mph because it is expected that vehicles will be traveling at lower speeds through the work zone. Table 7. Clearance Interval Calculations Interval Equation Duration (sec) Yellow (Y) t *Vposted/(2a) 4 All-Red (AR) (W + L) / 1.47*Voperating 16 Total Clearance (CL) Y + AR 20 Five seconds were added to the AR interval to account for the 10% trucks in the vehicle flow resulting in a computed CL duration of 25seconds. Analysis Results for Signal Control Option Synchro and SimTraffic analyses were performed for the signal control option. Table 8 summarizes the analysis results of existing conditions at the unsignalized intersection of MD 3 5 at Hyattstown Mill Road. Table 9 summarizes the analysis results for Alternative 2. Values shown in bold red italics exceed MDOT SHA s allowable mobility thresholds. The Synchro and SimTraffic worksheets for the One-Lane Signal operations can be found in Appendix F. Table 8. Peak Hour Synchro Analysis MD 3 5at Hyattstown Mill Road Existing Conditions AM (PM) Intersection Approach Delay / Vehicle (sec) V/C Ratio Levelof Service MD 3 5at Hyattstown Mill Road NB MD (0.0) 0.0 (0.0) A (A) SB MD (0.0) 0.0 (0.0) A (A) EB Driveway 17.3 (16.0) 0.03 (0.03) C (C) WB Hyattstown Mill Rd 14.4 (19.8) 0.03 (0.04) B (C) Table 9. Peak Hour Synchro/SimTraffic Analysis One-Lane Signal Option AM(PM) Intersection Approach Delay/ Level of 95 th Percentile V/C Ratio Vehicle (sec) Service Queue Length (ft) NB MD (1147.1) 0.70 (3.39) E (F) 164 (1,874) SB MD (65.6) 2.62 (0.48) F (E) 1,680 (171) EB Driveway 78.0 (81.3) 0.38 (0.40) E (F) 31 (31) WB Hyattstown Mill Rd 69.1(71.3) 0.01 (0.01) E (E) 0 (0) As shown in the table, this alternative is expected to result in queues up to 0.35miles that will extend through the upstream intersections of MD 3 5and Croghan Lane and MD 3 5at the Hyattsville Volunteer Fire Department access and MD 109. It should be noted that this alternative will result in poor traffic operations and the impact to traffic operations will be confined to the vicinity of the bridge (as opposed to being distributed throughout a network of other roadways) and the impact to local businesses as a result of vehicles being detoured away from the area will be reduced when compared with the detour options. Page 12 of 17
14 Alternative 3: Maintain All Travel Lanes Under this alternative, all travel lanes will be maintained throughout construction through the use of a temporary roadway alignment. Pavement reconstruction within the limits of the tie-in between the temporary and ultimate roadway alignments will be performed over a short duration through the use of a full or one-way detour. Geometric Analysis During the first stage of construction under this alternative a temporary roadway (with a temporary bridge structure) will be constructed west of the existing roadway alignment. During the second stage of construction, both travel lanes will be shifted onto the temporary roadway alignment, the existing bridge will be demolished and the new bridge will be constructed, along with new approach roadways within the limits of the temporary alignment. During the final stage of construction, traffic will be shifted to the ultimate roadway alignment and the temporary roadway will be demolished. For the purposes of developing conceptual temporary roadway alignments, it was assumed that the temporary roadway would bypass the construction activities at the existing and proposed bridge and that profile adjustments on the approaches outside of the limits of the bridges would be performed during short term full or one-way detours. Figure 5shows the typical section of the temporary roadway alignment relative to the proposed bridge under this alternative. Appendix G contains the concept plan of the proposed roadway alignment under this alternative. As shown in the concept plan, this alternative is expected to have impacts to existing utility poles located along the west side of MD 3 5and a larger footprint than Alternatives 1 and 2. It should be noted that the impacts due to the proposed alignment are expected to require additional right-of-way and have additional impacts to wetlands and parkland resources. Analysis Results This alternative is not expected to result in any changes to lane configurations or reductions in travel lanes throughout the limit of work, with the exception of the construction of pavement in tie-in areas. It is expected that the primary impact to traffic operations under this alternative would be the potential reduction in capacity as a result of motorists perception of the work zone. The impacts to roadway capacity as a result of work zone activities were estimated using the Lane Closure Analysis Program (LCAP) and the following assumptions: Truck percentage = 10% Work zone grade = 0.5% 12 lateral clearance to channelization devices Work zone length = ¼ mile Work zone intensity = medium Based on those assumptions and the University of Maryland equation that is included within Page 13 of 17
15 LCAP, it was estimated that the work zone capacity will be approximately 1,839 vehicles per hour. This estimated work zone capacity will exceed the peak hour traffic volumes through the work zone during both peak periods. Therefore, it is not anticipated that the work zone activities will result in any additional queuing. EVALUATION OF MOBILITY THRESHOLDS Table 10 summarizes the evaluation of the mobility thresholds for each alternative. Table 10. Evaluation of Applicable Mobility Thresholds Alternative 1 Alternative 2 Alternative 3 Applicable Mobility Thresholds Met? NO NO Yes COST ANALYSIS Cost analyses were performed on the three proposed alternatives using estimated maintenance of traffic quantities, construction cost estimates, and the MDOT SHA s 2066 Highway Construction Cost Estimating Manual. Table 11 summarizes the results of the cost analyses. As shown in the table, the full detour alternative is expected to have the lowest total project cost. Table 11. Cost Analyses Alternative 1 Alternative 2 Alternative 3 MOT Costs $14,000 $247,000 $152,000 Temporary Signs $12,000 $9,000 $5,000 Channelization Devices (Drums, $2,000 $13,000 $12,000 Barrier, etc.) Temporary Traffic Signal N/A $225,000 N/A Temporary Pavement N/A N/A $135,000 Construction Costs $1,544,000 $1,914,000 $1,849,000 Total Cost $1, 58,000 $2,161,000 $2,001,000 SUMMARY OF ALTERNATIVES Appendix H contains the Work Zone Constraints Form, which compares the three alternatives based on cost, safety, constructability, and other attributes. The following is a more detailed description of the work zone constraints. Impact to Traffic Operations The analyses performed for this study indicate that Alternative 1 (Full Detour) will have the greatest impact on traffic operations, as it will result in increases in delay throughout the study network. Alternative 2 (Maintain One Travel Lane) with the One-Lane Signal option is expected to result in queues along MD 3 5; however, impacts to traffic operations will be Page 14 of 17
16 confined to the vicinity of the bridge and will not impact operations along MD 121, MD 109, or I-270. Alternative 3 (Maintain All Travel Lanes) is expected to have minimal impacts on traffic operations since it does not result in the reduction of any travel lanes through the work area. Impacts to Local Businesses Alternative 1 is expected to have some impacts to local businesses along MD 3 5, as it requires that traffic be rerouted onto alternate roadways. It should be noted that all businesses within the detoured portion of MD 3 5are destination businesses where patrons would still travel along the detour route to access the business. Impacts to Emergency Response The Hyattstown Volunteer Fire Department is located just 300 feet north of the subject bridge. It is expected that Alternative 1 will result in significant increases in response times, as emergency vehicles will be required to utilize the detour route to access MD 3 5and the surrounding areas south of the bridge. Alternative 2 (with One-Lane Signal Option) is expected to have substantial impact to emergency services as access will be maintained but emergency vehicles may be required to contend with opposing traffic in the single travel lane and queues that affect access to MD 3 5. Alternative 3 is not expected to have any impact on emergency response. Impacts to School Bus Routes Alternative 3 is expected to have no impact on existing school bus routes. Alternative 2 (with One-Lane Signal Option) is expected to have some impacts to school buses as buses would be subject to delays and queuing at the signals. Alternative 1 is expected to have significant impacts to this very busy school bus corridor; however, consideration should be given to scheduling construction so that most of the detour occurs during the Summer time when school is not in session. Estimated Costs Alternative 2 is expected to have the highest MOT cost, requiring a temporary signal. Alternative 1 is expected to have the lowest MOT and construction cost as it will not require any temporary structure or signal to maintain traffic flow during construction. Safety Alternative 1 is expected to increase congestion at intersections impacted by the detours. As a result of this congestion, there is a possibility of an increase in congestion-related collision types (such as rear ends). Alternative 2 (with One-Lane Signal Option) may result in an increase in rear end collisions due to the introduction of new traffic signals with queuing. Alternative 3 is expected to have minimal impact to motorist safety, compared with the other available alternatives. Construction Duration Alternative 2 is expected to have the longest construction duration, as it requires the construction of the new bridge in two stages. Alternative 1 is expected to have the shortest duration, as it only consists of one construction stage. Page 15 of 17
17 Worker Safety/Constructability Alternative 1 provides a safer environment for workers because there would be no active traffic near the work zone. Alternative 1 would also provide an unconstrained work area, allowing for improved constructability and quality and would provide a staging area for construction access. On the contrary, Alternatives 2 and 3 would have traffic passing within close proximity of the workers and construction traffic coming to and going from the work area, increasing the possibility of conflicts. The constrained buffer between the existing and proposed bridges under Alternatives 2 and 3 will result in more constraints on the work area and construction access and could potentially have an impact on the quality of the final product. RECOMMENDATIONS AND CONCLUSIONS Alternative 1 (Full Detour) has the greatest impact on traffic operations and local businesses, and increases travel times throughout the study network. However, it provides the shortest construction time and safest work zone for workers. Alternative 3 (Maintain All Travel Lanes) has the least impact on traffic operations and local businesses, but requires the most temporary roadway work. Alternative 2 provides improved traffic operations over Alternative 1, has the longest construction duration, yet does not require temporary pavement of Alternative 3. Table 12 summarizes the advantages and disadvantages of each construction alternative that should be considered by the project stakeholders (i.e., road users, affected communities, MDOT SHA). Based upon the anticipated traffic impacts from Alternative 1, and the potential for Alternative 2 queues to block the Hyattstown Volunteer Fire Department access onto MD 3 5, along with neither of these alternatives meeting the MDOT SHA mobility thresholds for work zones, Alternative 3 is recommended for this project. Page 16 of 17
18 Table 12. Summary of Alternatives Advantages and Disadvantages Alternative Advantages Disadvantages Alternative 1 Full Detour Alternative 2 Maintain One Travel Lane (with One-Lane Signal Option) Lowest MOT/construction cost Provides best construction access, constructability, and worker safety Shortest construction duration Fewer impacts to local traffic and school bus routes Greatest impact on traffic operations throughout the network Greatest impact to school bus routes if detour in effect during the school year Greatest impact to emergency services and local businesses Does not meet mobility thresholds at several intersections throughout the study network Expected to result in delays and queues on both sides of the bridge that will impact access to MD 3 5 from the Hyattsville Volunteer Fire Department Highest MOT cost Bridge must be constructed in two stages resulting in longest construction duration Increased safety risk due to traffic flowing through the work zone Highest overall project cost Least impact to traffic operations No impact to school bus routes Alternative 3 Meets mobility thresholds Maintain All Travel Lanes No impact to emergency services No impact to local businesses Requires temporary paving and temporary structures Greatest environmental impacts / limit of disturbance ROW/utility impacts Page 17 of 17
FOR INTERSTATE 81 AND ROUTE 37 INTERCHANGE FREDERICK COUNTY, VIRGINIA MILEPOST 310
 INTERCHANGE MODIFICATION REPORT FOR INTERSTATE 81 AND ROUTE 37 INTERCHANGE FREDERICK COUNTY, VIRGINIA MILEPOST 310 PREPARED BY: VIRGINIA DEPARTMENT OF TRANSPORTATION STAUNTON DISTRICT DECEMBER 13, 2006
The Folded Interchange: An Unconventional Design for the Reconstruction of Cloverleaf Interchanges
 The Folded Interchange: An Unconventional Design for the Reconstruction of Cloverleaf Interchanges I. ABSTRACT Keith A. Riniker, PE, PTOE This paper presents the Folded Interchange design and compares
APPENDIX B. Public Works and Development Engineering Services Division Guidelines for Traffic Impact Studies
 APPENDIX B Public Works and Development Engineering Services Division Guidelines for Traffic Impact Studies Revised December 7, 2010 via Resolution # 100991 Reformatted March 18, 2011 TABLE OF CONTENTS
Woodburn Interchange Project Transportation Technical Report
 Final Report Woodburn Interchange Project Transportation Technical Report Prepared for Oregon Department of Transportation April 212 Prepared by DKS Associates Contents Methodologies... 4 Volume Development...
Transportation and Works Department The Regional Municipality of York Yonge Street Newmarket, Ontario L3Y 6Z1
 TRANSPORTATION IMPACT STUDY (TIS) GUIDELINES FOR DEVELOPMENT APPLICATIONS Transportation and Works Department The Regional Municipality of York 17250 Yonge Street Newmarket, Ontario L3Y 6Z1 August, 2007
DEVELOPMENT, ANALYSIS, AND DESIGN OF A NEW PARKWAY AT GRADE INTERSECTION (PAGI)
") 2013 ITE Western District Annual Meeting COCEPT DEVELOPMET, AALYSIS, AD DESIG OF A EW PARKWAY AT GRADE ITERSECTIO (PAGI) Lead Author: James M. Witkowski, PhD Supporting Author: Darrell Truitt, PE The Pima
2013 ITE Western District Annual Meeting COCEPT DEVELOPMET, AALYSIS, AD DESIG OF A EW PARKWAY AT GRADE ITERSECTIO (PAGI) Lead Author: James M. Witkowski, PhD Supporting Author: Darrell Truitt, PE The Pima
WELCOME IL 47. Community Advisory Group Meeting #5 Waubonsee Community College Wednesday, May 31, 2017
 WELCOME IL 47 Community Advisory Group Meeting #5 Waubonsee Community College Wednesday, May 31, 2017 MEETING PURPOSE MEETING AGENDA 1. Welcome/Introduction 2. Review Previous Public Involvement 3. Process/Schedule
The Secrets to HCM Consistency Using Simulation Models
 The Secrets to HCM Consistency Using Simulation Models Ronald T. Milam, AICP David Stanek, PE Chris Breiland Fehr & Peers 2990 Lava Ridge Court, Suite 200 Roseville, CA 95661 r.milam@fehrandpeers.com (916)
MULTIMODAL TRANSPORTATION IMPACT STUDY GUIDELINES
 MULTIMODAL TRANSPORTATION IMPACT STUDY GUIDELINES 1 st Edition City of San Luis Obispo 2035 Circulation Element 1 Table of Contents Introduction... 2 Process... 2 When Impact Studies Are Required... 3
FLORIDA DEPARTMENT OF TRANSPORTATION Planning and Environmental Management Office INTERCHANGE MODIFICATION REPORT
 FLORIDA DEPARTMENT OF TRANSPORTATION Planning and Environmental Management Office INTERCHANGE MODIFICATION REPORT District 2 1109 South Marion Avenue Lake City, FL 32025-5874 INTERSTATE 10 (SR 8) / SR
CHAPTER 4 GRADE SEPARATIONS AND INTERCHANGES
 CHAPTER 4 GRADE SEPARATIONS AND INTERCHANGES 4.0 INTRODUCTION The ability to accommodate high volumes of intersecting traffic safely and efficiently through the arrangement of one or more interconnecting
TRAFFIC STUDY GUIDELINES
 TRAFFIC STUDY GUIDELINES December 2013 The scope of the traffic impact analysis (TIA) should follow these guidelines and the requirements of VMC 11.80.130 and VMC 11.70, transportation concurrency (attached
Comparison of Queue Lengths Estimations at AWSC Intersections using Highway Capacity Software, Sidra Intersection, and SimTraffic
 Comparison of Queue Lengths Estimations at AWSC Intersections using Highway Capacity Software, Sidra Intersection, and SimTraffic Daniel Lai May 2, 2009 Characteristics of an All-Way Stop Controlled (AWSC)
Traffic Impact Analysis Guidelines. Town of Queen Creek
 Traffic Impact Analysis Guidelines Town of Queen Creek January 2016 1. INTRODUCTION The purpose of this document is to outline the procedures and requirements for preparing a Transportation Impact Analysis
Shannon Noonan, City of Cambridge Don Drackley, IBI Group Scott Johnson, IBI Group PTSL
 100 175 Galaxy Boulevard Toronto ON M9W 0C9 Canada tel 416 679 1930 fax 416 675 4620 ibigroup.com Memorandum To/Attention From cc Shannon Noonan, City of Cambridge Don Drackley, IBI Group Scott Johnson,
CITY OF CLOVIS Traffic Impact Study Guidelines
 CITY OF CLOVIS Traffic Impact Study Guidelines CLOVIS, A WAY OF LIFE Approved August 25, 2014 City Council Resolution 2014-79 Prepared by City of Clovis Engineering Division Steve White, City Engineer
LAS VEGAS STREET RAILROAD CROSSING RR/PUC CONNECTION AND PRELIMINARY DESIGN
 LAS VEGAS STREET RAILROAD CROSSING RR/PUC CONNECTION AND PRELIMINARY DESIGN Prepared for: City of Colorado Springs Prepared by: Felsburg Holt & Ullevig 508 South Tejon Street Colorado Springs, CO 80903
CITY OF LETHBRIDGE TRAFFIC IMPACT STUDY GUIDELINES
 CITY OF LETHBRIDGE TRAFFIC IMPACT STUDY GUIDELINES March 2008 0526 TABLE OF CONTENTS Section Contents Page 1.0 INTRODUCTION 1 1.1 Traffic Impact Study 1 1.2 Need and Justification 2 1.3 Purpose of Guidelines
500 Interchange Design
 500 Interchange Design Table of Contents 501 Interchange Design... 5-1 July 2015 501.1 General... 5-1 501.2 Interchange Type... 5-1 501.2.1 General... 5-1 502 Interchange Design Considerations... 5-2 502.1
State of the Practice, Case Studies and Analysis Tools on Unconventional Intersection & Interchange Designs in Maryland
 State of the Practice, Case Studies and Analysis Tools on Unconventional Intersection & Interchange Designs in Maryland Saed Rahwanji and Minseok Kim Office of Traffic & Safety Maryland State Highway Administration
A Unique Application of Railroad Preemption with Queue Mitigation at a Roundabout Interchange
 A Unique Application of Railroad Preemption with Queue Mitigation at a Roundabout Interchange Jeromy Grenard, PE, PTOE American Structurepoint Hardik Shah, PE, PTOE American Structurepoint Roundabouts
The New Highway Capacity Manual 6 th Edition It s Not Your Father s HCM
 The New Highway Capacity Manual 6 th Edition It s Not Your Father s HCM Tom Creasey, PE, PhD Principal, Stantec Consulting Services Inc. Chair, TRB Highway Capacity and Quality of Service Committee Presented
4. ENVIRONMENTAL IMPACT ANALYSIS 11. TRANSPORTATION AND CIRCULATION 1. TRAFFIC
 4. EVIROMETAL IMPACT AALYSIS 11. TRASPORTATIO AD CIRCULATIO 1. TRAFFIC 1. ITRODUCTIO The following section summarizes the information provided in the Traffic Impact Study, SMC Malibu Satellite Campus Project,
2 Purpose and Need. 2.1 Study Area. I-81 Corridor Improvement Study Tier 1 Draft Environmental Impact Statement
 2 Purpose and Need 2.1 Study Area Interstate 81 (I-81) is relied upon for local and regional travel and interstate travel in the eastern United States. It extends 855 miles from Tennessee to New York at
Jim Alexander Director of Design and Engineering, Southwest Light Rail Transit Project
 Memorandum Date: January 15, 2014 To: CC: From: Subject: Jim Alexander Director of Design and Engineering, Southwest Light Rail Transit Project Paul Danielson, P.E. Project Manager, Southwest Light Rail
Project Initiation Form
 Meeting Date: The Project Initiation Form should be completed in conjunction with the Level 2 Screening Form. Process Leads and/or Planners should complete the Project Initiation Form to document coordination
Interchange Workshop Report (August 2004)
") U.S. Highway 14 Corridor Study New Ulm to North Mankato Table of Contents Section Interchange Workshop Report (August 2004) Page 1. Introduction and Next Steps 1 2. Interchange Workshop Participants &
U.S. Highway 14 Corridor Study New Ulm to North Mankato Table of Contents Section Interchange Workshop Report (August 2004) Page 1. Introduction and Next Steps 1 2. Interchange Workshop Participants &
3.6 GROUND TRANSPORTATION
 3.6.1 Environmental Setting 3.6.1.1 Area of Influence The area of influence for ground transportation consists of the streets and intersections that could be affected by automobile or truck traffic to
Table of Contents. List of Appendices
 Table of Contents Page Executive Summary 3 Description of Project 3 TMP Roles and Responsibilities 3 Area Engineer 3 Communications Office 4 TMP Monitoring 4 Existing and Future Conditions 4 Traffic Counts
Overall project. The $288 million Phase 2 DesignBuild project starts construction. this spring, with completion by December 31, 2016
 Overall project Johnson County Gateway Interchange Project Improvements 87th Street The $288 million Phase 2 DesignBuild project starts construction this spring, with completion by December 31, 2016 Phase
Dynamic Lane Merge Systems
 Dynamic Lane Merge Systems Acknowledgements Maryland State Highway Administration University of Maryland, College Park Michigan Department of Transportation Wayne State University Lane Merging Issues Merging
NORTHWEST CORRIDOR PROJECT. NOISE TECHNICAL REPORT 2015 Addendum Phase IV
 Noise Technical Report 2015 Addendum NOISE TECHNICAL REPORT 2015 Addendum PREPARED FOR: Federal Highway Administration and Georgia Department of Transportation PREPARED BY: Parsons Brinckerhoff Project
Appendix D: Functional Classification Criteria and Characteristics, and MnDOT Access Guidance
 APPENDICES Appendix D: Functional Classification Criteria and Characteristics, and MnDOT Access Guidance D.1 Functional classification identifies the role a highway or street plays in the transportation
Conclusions & Lessons Learned
 What is a DDI Recommended Practices Traffic Operations Analysis Geometric Design FHWA Review Conclusions & Lessons Learned It s not about you, it s about the public Developed by Access Utah County
ITEM 8 Action May 17, 2017
 ITEM 8 Action May 17, 2017 Approval of Maryland Department of Transportation (MDOT) Additional Project Submission for the Out-Of-Cycle Air Quality Conformity Analysis for the Amendment to the 2016 CLRP
TRAFFIC & TRANSPORTATION COMMISSION AGENDA REPORT
 TRAFFIC & TRANSPORTATION COMMISSION AGENDA REPORT AGENDA ITEM #4 T/T MTG: 092616 DATE: SEPTEMBER 26, 2016 TO: TRAFFIC & TRANSPORTATION COMMISSION FROM: BENJAMIN CHAN, P.E, T.E., DEPUTY PUBLIC WORKS DIRECTOR
Section 3-01 General Concepts, Design Standards and Design Exceptions TABLE OF CONTENTS
 Section 3-01 General Concepts, Design Standards and Design Exceptions TABLE OF CONTENTS GENERAL CONCEPTS...2 General...2 Design Vehicle...2 Driver Expectancy...2 Design Speed...2 Sight Distances...3 Exhibit
COMPARISON OF SPUI & TUDI INTERCHANGE ALTERNATIVES WITH COMPUTER SIMULATION MODELING
 COMPARISO OF SPUI & TUDI ITERCHAGE ALTERATIVES WITH COMPUTER SIMULATIO MODELIG Matthew J. Selinger, PTOE William H. Sharp, PTOE ABSTRACT There are numerous technical papers and reports discussing the operations
Field Guide on. Safe Maintenance and. Work Zone Operations
 Field Guide on Installation and Removal of Temporary Traffic Control for Safe Maintenance and Work Zone Operations August 2008 Introduction This field guide provides field personnel with introductory guidance
State Highway 10A Improvements (from the SH-10 junction extending 6.18 miles east to the SH-100 junction, Muskogee and Sequoyah Counties, Oklahoma)
") (from the SH-10 junction extending 6.18 miles east to the SH-100 junction, Muskogee and Sequoyah Counties, Oklahoma) Open House January 31, 2017 Open House Purpose Explain purpose and need for SH-10A improvements
(from the SH-10 junction extending 6.18 miles east to the SH-100 junction, Muskogee and Sequoyah Counties, Oklahoma) Open House January 31, 2017 Open House Purpose Explain purpose and need for SH-10A improvements
Volume to Capacity Estimation of Signalized Road Networks for Metropolitan Transportation Planning. Hiron Fernando, BSCE. A Thesis CIVIL ENGINEERING
 Volume to Capacity Estimation of Signalized Road Networks for Metropolitan Transportation Planning by Hiron Fernando, BSCE A Thesis In CIVIL ENGINEERING Submitted to the Graduate Faculty of Texas Tech
I-10 CONNECT. Public Meeting #1
 I-10 CONNECT Public Meeting #1 The environmental review, consultation, and other actions required by applicable Federal environmental laws for this project are being, or have been, carried-out by TxDOT
CITY OF VALLEJO PUBLIC WORKS DEPARTMENT TRAFFIC IMPACT Analysis/Study GUIDELINES
 The City Engineer, under the authority of the Public Works Director and recommendations from the Traffic Engineer, will make the final decision on the need for a traffic study. The purpose of the traffic
NW La Center Road/I-5 Interchange Improvement Project (MP 16.80)
") FINAL DRAFT - NW La Center Road/I-5 Interchange Improvement Project (MP 16.80) La Center, Washington February 2015 FINAL DRAFT - NW La Center Road/I-5 Interchange Improvement Project (MP 16.80) La Center,
FINAL DRAFT - NW La Center Road/I-5 Interchange Improvement Project (MP 16.80) La Center, Washington February 2015 FINAL DRAFT - NW La Center Road/I-5 Interchange Improvement Project (MP 16.80) La Center,
Appendix B. Benefit-Cost Technical Memorandum
 Appendix B Benefit-Cost Technical Memorandum This Page Left Blank Intentionally MEMORANDUM TO: FROM: Michael Kalnbach MnDOT District 1 Project Manager Graham Johnson, PE DATE: September 2, 2014 RE: TH
LOCATION AND DESIGN DIVISION
 VIRGINIA DEPARTMENT OF TRANSPORTATION LOCATION AND DESIGN DIVISION INSTRUCTIONAL AND INFORMATIONAL MEMORANDUM GENERAL SUBJECT: Interstate, NHS Non-Interstate and Non-NHS (IJR / IMR Guidance) SPECIFIC SUBJECT:
I-10 CORRIDOR IMPROVEMENTS STAGE 0 FEASIBILITY STUDY STATE PROJECT NUMBER H FEDERAL AID PROJECT NUMBER H004100
 JULY 2016 I-10 CORRIDOR IMPROVEMENTS STAGE 0 FEASIBILITY STUDY STATE PROJECT NUMBER H.004100 FEDERAL AID PROJECT NUMBER H004100 EAST BATON ROUGE AND WEST BATON ROUGE PARISHES, LOUISIANA Section TABLE OF
Standard Performance Attributes for Transportation Projects
 Standard s for Transportation Projects Mainline Operations Local Operations Maintainability Construction Impacts Environmental Impacts Project Schedule An assessment of traffic operations and safety on
Comparing Roundabout Capacity Analysis Methods, or How the Selection of Analysis Method Can Affect the Design
 Comparing Roundabout Capacity Analysis Methods, or How the Selection of Analysis Method Can Affect the Design ABSTRACT Several analysis methods have been proposed to analyze the vehicular capacity of roundabouts.
Air Report. Project Information PPTA/LAP. Traffic Data I-495 NORTHERN SECTION SHOULDER USE. Project Number: , C501, P101 UPC:
 Air Report Project Information Project Name: I-495 NORTHERN SECTION SHOULDER USE Project Number: 0495-029-123, C501, P101 UPC: 105130 Route Number: 495 Project Limit - From: South of Old Dominion Drive
Public Meeting. US Highways 18 & 281 and SD Highway 50 From Douglas County Line to SD46 Charles Mix County
 Public Meeting US Highways 18 & 281 and SD Highway 50 From Douglas County Line to SD46 Charles Mix County Cary Cleland Road Design Engineering Supervisor January 17, 2017 Project Limits US18/US281 US281
Location Drainage Study
 Location Drainage Study PROJECT ROUTE: LIMITS: MUNICIPALITY/COUNTY: JOB NUMBER: IL 47 at Burlington Road 750ft NW to 750ft SE of IL 47(Burlington), & 1000ft S to 1000ft N of Burlington (IL47) Kane County
TRANSPORTATION IMPACT STUDIES
 January 28, 2009 POLICIES AND PROCEDURES FOR TRANSPORTATION IMPACT STUDIES Related to Highway Occupancy Permits Pennsylvania Department of Transportation Bureau of Highway Safety and Traffic Engineering
TRAFFIC INCIDENT MANAGEMENT SYSTEM (TIMS)
") TRAFFIC INCIDENT MANAGEMENT SYSTEM (TIMS) GUIDELINES 1. Purpose A. Ensure that an Ohio Turnpike and Infrastructure Commission (OTIC) Guideline exists to manage traffic backups and travel delays. B. Ensure
TRAFFIC INCIDENT MANAGEMENT SYSTEM (TIMS) GUIDELINES 1. Purpose A. Ensure that an Ohio Turnpike and Infrastructure Commission (OTIC) Guideline exists to manage traffic backups and travel delays. B. Ensure
FY STATEWIDE TRANSPORTATION IMPROVEMENT PROGRAM New Jersey Department of Transportation Project Descriptions ($ millions)
") FY 2018-2027 WIDE TRANSPORTATION IMPROVEMENT PROGRAM NY Susquehanna and Western Rail Line Bicycle/Pedestrian Path DBNUM: NS9803 / UPC: 058018 The 4.8 mile New York, Susquehanna, and Western Railway (NYS&W)
FY 2018-2027 WIDE TRANSPORTATION IMPROVEMENT PROGRAM NY Susquehanna and Western Rail Line Bicycle/Pedestrian Path DBNUM: NS9803 / UPC: 058018 The 4.8 mile New York, Susquehanna, and Western Railway (NYS&W)
Executive Summary. Overview
 Executive Summary Overview The Genesee-Finger Lakes Diversion Route Initiative identifies the most suitable diversion routes for Principal Arterial roads in the nine-county Genesee-Finger Lakes Region.
Maine Turnpike Needs Assessment
 Maine Turnpike Needs Assessment Safety and Capacity Study Prepared for: Maine Turnpike Authority Prepared by: May 2016 ii P age TABLE OF CONTENTS EXECUTIVE SUMMARY... 1 1.1 Purpose and Scope... 1 1.2 Turnpike
THE PROJECT. Executive Summary. City of Industry. City of Diamond Bar. 57/60 Confluence.
 THE PROJECT A freeway segment ranked 6th worst in the Nation, with levels of congestion, pollution and accidents that are simply unacceptable and which have Statewide and National implications. Executive
Analytical Tools and Decision Support Systems SANDAG I-15 ICM. ITS PA January 30 th, 2014
 Analytical Tools and Decision Support Systems SANDAG I-15 ICM ITS PA January 30 th, 2014 Project Partners/Stakeholders National ICM Evaluator National AMS Contractor 2 San Diego I-15 Corridor 21 mile corridor
AASHTO -- American Association of State Highway and Transportation Officials
 CHAPTER 8 TRAFFIC CONTROL 8.1. INTRODUCTION 8.1.1 GENERAL The standards contained in this chapter regulate all improvements and private work to be dedicated to the public and accepted by the City and all
South Dakota Department of Transportation. Interchange Modification Justification Report. Interstate 90 Exit 44 (Bethlehem Road - Piedmont)
") South Dakota Department of Transportation Interchange Modification Justification Report Interstate 90 Exit 44 (Bethlehem Road - Piedmont) February 28, 2014 Prepared By: SDDOT Office of Project Development
South Dakota Department of Transportation Interchange Modification Justification Report Interstate 90 Exit 44 (Bethlehem Road - Piedmont) February 28, 2014 Prepared By: SDDOT Office of Project Development
TABLE OF CONTENTS PAGE NUMBER. Executive Summary Why Variable Pricing? What Was Studied? User Surveys Air Quality Analysis User And Equity Analysis
 TABLE OF CONTENTS PAGE NUMBER Executive Summary Why Variable Pricing? What Was Studied? User Surveys Air Quality Analysis User And Equity Analysis Findings Scenario 1 Base Case Scenario 2 Detoll Scenario
Construction Alternative Screening with Regional Travel Demand Model
 Construction Alternative Screening with Regional Travel Demand Model By: Marty Milkovits (Corresponding Author) Cambridge Systematics, Inc. 100 CambridgePark Drive, Suite 400 Cambridge, MA 02140 Phone:
Rt. 29 Solutions Project Delivery Advisory Panel. February 18, 2016
 Rt. 29 Solutions Project Delivery Advisory Panel February 18, 2016 Agenda item 1: Introductions Project Delivery Advisory Panel Technical Team 2 Agenda item 2: Interaction and Feedback Live Streaming Feb
Appendix B Highway 407 Interchange Review - Cochrane Street Area
 Appendix B Highway 407 Interchange Review - Cochrane Street Area AECOM 300 ater Street hitby, ON, Canada L1N 9J2 www.aecom.com Memorandum To Michael May, P.Eng., Town of hitby Page 1 CC Subject Greg Hardy,
VDOT Land Use Overview. Brad Shelton, AICP Transportation and Mobility Planning Division June 2015
 VDOT Land Use Overview Brad Shelton, AICP Transportation and Mobility Planning Division June 2015 VDOT Land Development Programs Local/State Plan and Program Consistency Review local comp plan transportation
GEOMETRIC DESIGN CRITERIA for Non-freeway Resurfacing, Restoration, and Rehabilitation Projects
 GEOMETRIC DESIGN CRITERIA for Non-freeway Resurfacing, Restoration, and Rehabilitation Projects SEPTEMBER 1989 Arkansas State Highway and Transportation Department GEOMETRIC DESIGN CRITERIA for Non-freeway
Airport Road from 1 km North of Mayfield Road to 0.6 km North of King Street Public Information Centre #1
 Municipal Class Environmental Assessment Airport Road from 1 km North of Mayfield Road to 0.6 km North of King Street Public Information Centre #1 Date: Thursday, June 20, 2013 Time: 6:30 p.m. 8:30 p.m.
LOCATION AND DESIGN DIVISION
 VIRGINIA DEPARTMENT OF TRANSPORTATION LOCATION AND DESIGN DIVISION INSTRUCTIONAL AND INFORMATIONAL MEMORANDUM GENERAL SUBJECT: Design Exceptions / Waivers SPECIFIC SUBJECT: Design Exception Request Form
THE COMMONWEALTH OF MASSACHUSETTS NON-NHS BRIDGE R&R POLICY
 THE COMMONWEALTH OF MASSACHUSETTS Number: P-92-010 Date: 10-08-92 - ) HIGHWAY DEPARTMENT FROM: NON-NHS BRIDGE R&R POLICY The purpose of this Engineering Directive is to formally notify Department Personnel
YORK TOLL PLAZA MAINE TURNPIKE AUTHORITY AIR QUALITY REPORT. September 28, 2016 NOISE ANALYSIS REPORT MAINETURNPIKE AUTHORI TY
 NOISE ANALYSIS REPORT MAINETURNPIKE AUTHORI TY YORK TOLL PLAZA MAINE TURNPIKE AUTHORITY AIR QUALITY REPORT September 28, 2016 (Cover photograph provided by MTA) TABLE OF CONTENTS 1.0 EXECUTIVE SUMMARY...
MAINE TURNPIKE AUTHORITY ADDENDUM NO. 1 CONTRACT EXIT 103 SOUTHBOUND UNDERPASS BRIDGE REHABILITATION MILE 103.0
 MAINE TURNPIKE AUTHORITY ADDENDUM NO. 1 CONTRACT 2018.05 EXIT 103 SOUTHBOUND UNDERPASS BRIDGE REHABILITATION MILE 103.0 The bid opening date is Thursday March 15, 2018 at 11:00 a.m. The following changes
Time-In-Queue Delay (TIQD) is the difference between the time a vehicle joins the rear of a queue and the time the vehicle clears the intersection.
 is the difference between the time a vehicle joins the rear of a queue and the time the vehicle clears the intersection.") Chapter 7 Chapter 7 Formatted: Heading 1 INTERSECTION DELAY STUDY Chapter 2 Formatted: Heading 2 Chapter 3 INTERSECTION DELAY STUDY Chapter 4 Chapter 5 5.17.17.1 PURPOSE (1) The Intersection Delay Study
Chapter 7 Chapter 7 Formatted: Heading 1 INTERSECTION DELAY STUDY Chapter 2 Formatted: Heading 2 Chapter 3 INTERSECTION DELAY STUDY Chapter 4 Chapter 5 5.17.17.1 PURPOSE (1) The Intersection Delay Study
Traffic Study Guidelines
 Traffic Study Guidelines March 2015 Manatee County Public Works Transportation Planning Division 1022 26 th Avenue East Bradenton, FL 34208 Phone: (941) 708-7450 Fax: (941) 708-7503 TABLE OF CONTENTS
Hastings District Council. Whakatu Arterial Link Traffic Management Plan
 Hastings District Council Whakatu Arterial Link Traffic Management Plan June 2014 Table of contents 1. Introduction... 2 1.1 Purpose of this report... 2 1.2 The Whakatu Arterial Link... 2 2. Traffic Management...
FINAL REPORT GUIDELINES FOR PRELIMINARY SELECTION OF THE OPTIMUM INTERCHANGE TYPE FOR A SPECIFIC LOCATION
 FINAL REPORT GUIDELINES FOR PRELIMINARY SELECTION OF THE OPTIMUM INTERCHANGE TYPE FOR A SPECIFIC LOCATION Nicholas J. Garber, Ph.D. Faculty Research Scientist and Professor of Civil Engineering Michael
TRANSPORTATION MOBILITY PLAN GUIDELINES
 TRANSPORTATION MOBILITY PLAN GUIDELINES for Development Applications November 2016 Executive Summary The Regional Municipality of York (the Region) is located in the heart of the Greater Toronto Area (GTA)
COON CREEK WATERSHED DISTRICT PERMIT REVIEW. Spring Lake Park Schools Westwood Middle School st Avenue NE, Spring Lake Park, MN 55432
 PAN 16-112, Westwood Middle School, Page 1 of 6 COON CREEK WATERSHED DISTRICT PERMIT REVIEW MEETING DATE: August 22, 2016 AGENDA NUMBER: 10 FILE NUMBER: 16-112 ITEM: Westwood Middle School RECOMMENDATION:
I-85 Traffic Study: A State-of-the-Practice Modeling of Freeway Traffic Operation
 I-85 Traffic Study: A State-of-the-Practice Modeling of Freeway Traffic Operation Daiheng Ni * Keith Strickland ** Chunxia Feng * * School of Civil and Environmental Engineering, Georgia Institute of Technology,
Welcome to the Public Information Centre. Red Hill Business Park South Transportation Master Plan Addendum. June 25, :00 p.m. to 8:00 p.m.
 Welcome Welcome to the Transportation Master Plan Addendum June 25, 2012 6:00 p.m. to 8:00 p.m. Please sign-in Background In 2006 the City of Hamilton completed the North Glanbrook Industrial Business
OPTIMIZING RAMP METERING STRATEGIES
 OPTIMIZING RAMP METERING STRATEGIES Presented by Kouros Mohammadian, Ph.D. Saurav Chakrabarti. ITS Midwest Annual Meeting Chicago, Illinois February 7, 2006 Background Ramp control is the application of
Evaluating Design Alternatives using Crash Prediction Methods from the Highway Safety Manual
 Evaluating Design Alternatives using Crash Prediction Methods from the Highway Safety Manual Andrew Ooms November 2012 Outline Safety Overview Current practices Safety Fundamentals Introduction the Highway
Chapter 4: Alternatives Analysis
 Chapter 4: Alternatives Analysis 4.0 Introduction and Alternatives Analysis Process Detailed analysis and evaluation of the alternatives was a critical step in the development of comprehensive and workable
SECTION III - REGIONAL ARTERIAL SYSTEM. The Regional Arterial System is a subcomponent of a broader regional thoroughfare system.
 SECTION III - REGIONAL ARTERIAL SYSTEM SYSTEM IDENTIFICATION The Regional Arterial System is a subcomponent of a broader regional thoroughfare system. The NCTCOG Regional Thoroughfare Plan (RTP) recognizes
ENVIRONMENTAL STUDY REPORT
 Strasburg Road Extension From North of Stauffer Drive To New Dundee Road Class Environmental Assessment ENVIRONMENTAL STUDY REPORT APPENDICES Volume II October 2013 Strasburg Road Extension Environmental
TRAFFIC PROGRAM ACCESS MANUAL Edition WYDOT ACCESS MANUAL 0
 TRAFFIC PROGRAM ACCESS MANUAL 2014 Edition WYDOT ACCESS MANUAL 0 WYDOT ACCESS MANUAL WYDOT ACCESS MANUAL TABLE OF CONTENTS CHAPTER I INTRODUCTION PAGE INTRODUCTION 1 ACCESS MANAGEMENT 2 FUNCTIONAL ROAD
Safety. Introduction. Total System
 Safety Introduction Ohio is the 35 th largest state in the nation based on geographic size, however it carries the 5 th largest total traffic volume and the 4 th largest truck traffic volume. With such
APPENDIX H: TRAVEL DEMAND MODEL VALIDATION AND ANALYSIS
 APPENDIX H: TRAVEL DEMAND MODEL VALIDATION AND ANALYSIS Travel demand models (TDM) simulate current travel conditions and forecast future travel patterns and conditions based on planned system improvements
Executive Summary October 2017
 Executive Summary The King of Prussia Rail Draft Environmental Impact Statement/Draft Section 4(f) Evaluation (DEIS) describes and summarizes the transportation and environmental benefits and impacts of
TRANSPORTATION IMPACT ANALYSIS GUIDELINES
 TRANSPORTATION IMPACT ANALYSIS GUIDELINES SANTA CLARA COUNTY TRANSPORTATION AUTHORITY CONGESTION MANAGEMENT PROGRAM ADOPTED MARCH 2009 TABLE OF CONTENTS PART I - STATUTE AND AUTHORITY...1 CHAPTER 1. CMP
Public Informational Meeting November 8, 2007 Route 110 and 113 Methuen Rotary Interchange Study
 Public Informational Meeting November 8, 2007 Route 110 and 113 Methuen Rotary Interchange Study Welcome and Introductions Review of Planning Process Prior Study vs. Current Study Timeline and Implementation
RECOMMENDED RAMP DESIGN PROCEDURES FOR FACILITIES WITHOUT FRONTAGE ROADS
 1. Report No. FHWA/TX-05/0-4538-3 4. Title and Subtitle RECOMMENDED RAMP DESIGN PROCEDURES FOR FACILITIES WITHOUT FRONTAGE ROADS 2. Government Accession No. 3. Recipient's Catalog No. 5. Report Date September
HB2 Implementation Policy Guide
 report HB2 Implementation Policy Guide prepared for Commonwealth Transportation Board date August 1, 2015 6.0 Appendix A: Safety Measures Table 6.1 Safety Factor Measures Summary ID Measure Name Weight
Modeling Traffic Flow under Emergency Evacuation Situations: Current Practice and Future Direction
 Modeling Traffic Flow under Emergency Evacuation Situations: Current Practice and Future Direction Kevin D. Moriarty Research Assistant Transportation Engineering November 16, 2006 Overview Introduction
An Introduction to the. Safety Manual
 An Introduction to the Highway Safety Manual An Introduction to the HIGHWAY SAFETY MANUAL Table of Contents Section 1: HSM Overview... 1 What is the Highway Safety Manual?... 1 How is the HSM Applied?...
DISCUSSION DOCUMENT NOT FOR PUBLIC DISTRIBUTION
 Technical Memorandum Assessment of Analysis of MTA Purple Line Alternatives and Alignments and Other Documents Prepared by Sam Schwartz Engineering Maryland Transit Administration August 14, 2008 DISCUSSION
Scarborough Fire Department Scarborough, Maine Standard Operating Procedures
 Scarborough Fire Department Scarborough, Maine Standard Operating Procedures Book: Emergency Operations Chapter: Alarm & Response Procedures Subject: 3020 - Safe Vehicle Positioning Revision Date: 7/31/2007;
ACCESS MANAGEMENT Handbook
 ACCESS MANAGEMENT Handbook IOWA Balancing the Demands on Our Roadways ACCESS MANAGEMENT ACCESS MANAGEMENT HANDBOOK This handbook was prepared by the Center for Transportation Research and Education (CTRE)
Apply DynusT Model for Incident Management along Loop 101 Corridor
 Apply DynusT Model for Incident Management along Loop 101 Corridor Lili(Leo) Luo, P.E. ITS/Safety Engineer Sarath Joshua, P.E. ITS/Safety Program Manager What do Transportation Models do? Help us answer
I-15 South, MP 0 to MP 16 Environmental Assessment. Public Hearing. August 7, :00 PM to 7:00 PM
 I-15 South, MP 0 to MP 16 Environmental Assessment Public Hearing August 7, 2012 5:00 PM to 7:00 PM 1 PROJECT OVERVIEW The Federal Highway Administration (FHWA) and the Utah Department of Transportation