Introduction to Facets
|
|
|
- Iris Henderson
- 5 years ago
- Views:
Transcription
1 Introduction to Facets Aims and Objectives Preparing data for running in Facets Running Facets to familiarise you with the output An examination of examinations dataset Three facets: candidates, examiner, task; complex rating scale Small dataset but real and rather interesting Can be fitted in constraints of MiniFac (2000 data points) Similar to OSCEs etc in data structure General principles Never write a Facets program from scratch, but always edit an existing program Find something similar in the manual and work from there Facets is not the most elegant of programming languages, seeming to have just grown, but it does do good things

2

3
4 Bn = ability of examinee n Am = difficulty of task m Di = difficulty of skill item i Cj = severity of judge j Fk = difficulty of category k relative to category k-1 Pnmijk = probability of rating of k Pnmijk-1 = probability of rating of k-1
5 Bn = ability of examinee n Am = difficulty of task m Di = difficulty of skill item i Cj = severity of judge j Fk = difficulty of category k relative to category k-1 Pnmijk = probability of rating of k Standard Rasch modelling is a subset of the models that Facets runs Pnmijk-1 = probability of rating of k-1
6 Running Facets/MiniFac Easiest for today if all of the files are in the Facets directory where MiniFac was installed Facets does though handle directories with no trouble Files for this workshop are at: OfExaminations/ExOfEx Download the five files into the c:\facets directory A tip: Although the output goes to a Notepad file, it can be easier to use the free text editor Notepad++ Multiple tabs can be open at once Can see various program and output files Reloads file when changed (after asking)
7 Data Data have to be long and thin Each row is a single datapoint with descriptors Facets can read.csv files or SPSS.sav files SPSS data for exams are typically stored with candidates in rows and items in columns Make data long and thin using the VarsToCases command Menu: Data > Restructure > Restructure selected variables into cases Candidate 2, Paper 1, Examiner 4, Mark = 17 1,1,4,15 1,1,11,12 1,1,15,11 1,1,16,7 1,1,17,5 1,2,1,14 1,2,2,9 1,2,3,19 1,2,6,9 1,2,8,16 1,2,10,11 1,2,11,11 1,2,12,6 1,2,14,5 1,2,18,10 1,3,1,16 1,3,2,12 1,3,3,11 1,3,4,18 1,3,5,13 1,3,6,13 1,3,7,12 1,3,8,11 1,3,9,5 1,3,10,13 1,4,1,11 1,4,2,12 1,4,3,9 1,4,4,10 1,4,5,10 1,4,6,12 1,4,7,14 1,4,8,10 1,4,9,14 1,4,10,6 2,1,4,17 2,1,11,10 2,1,15,13 2,1,16,12 2,1,17,11 2,2,1,12 2,2,2,13


8 (1935)

9
10 Not all examiners marked all papers. Facets doesn t worry about this as long as all subsets are connected

11
12
13
14 The Program: ExOfEx-ExampleMark24.txt Programs are just text files. Naming them as.txt means they can be edited easily First line is a title; anything after semi-colon is a comment Lines can be in almost any order but sensible to keep them ordered First block after title specifies input and output files Title= An Examination of Examinations 24 point marking scheme ; anything following a semi-colon is a comment ;input and output files data=c:\facets\examinationofexaminations.csv ; ; data in the.csv file Output=ExOfEx-ExampleMark24.out ;name of output file for text ScoreFile=Tables-OutputScoresMark24; ; generate csv files for output summaries csv=yes Gstats=Yes HeadingLines=No
15 The Program: ExOfEx-ExampleMark24.txt Next commands specify the facets ; data description Facets=3 ; number of facets * Labels= 1,Candidate ;!!!check that max N is high enough for labels * 2, Paper 1=Ancient 2=MedMod 3=Essay 4=Polit * 3,Examiner ;!!!check that max N is high enough for labels 1=A 2=B 3=C [ lines deleted for other examiners] 17=Q 18=R *
16 The Program: ExOfEx-ExampleMark24.txt Now the model ;; the Model line specifies the model ;?,?,? means that all three facets 1,2 and 3 are to be estimated ; R24 means it is a 24-point rating scale, alpha+ to delta Model=?,?,?,R24 ;Rating scale model * ; at least one facet has to be non-centred or the model is not identified noncenter = 2,3
17 The Program: ExOfEx-ExampleMark24.txt Now specify the layout of the results ; specify the layout in the yardstick columns ; N: Numbers, L: Labels; * Counts Vertical=1N,2L,3L,SL ; specify the vertical axis of the yardstick Yardstick (columns lines low high extreme)= 0,25,-1,1,End ; the output listings to be produced Arrange = 1mN,2mN,3mN * inter-rater=3 ; facet 3 is the rater Note that the inter-rater reliability is akin to Cohen s kappa, and Linacre says that one does not want raters to be more similar than the model would suggest, so that their random errors are locally independent ( independent experts rather than rating machines [human optical scanners]). Treat with care!

18 Running Facets/MiniFac Open MiniFac in the usual way Opens in a new window Click on Files > Specification File Name Go to the c:\facets directory if you are not already there Select ExOfEx-ExampleMark24.txt and Open

19 Running Facets/MiniFac Click on OK Lots of output Output to ExOfEx-ExampleMark24.out Should/might open in a Notepad window If not, go to c:\facets and click on the.out file

 Put")
20 The output Lots and lots, some only of technical interest (e.g. iterations) The first and most important part is the Yardstick (developed by Ben Wright) Put different measures onto a common scale
21 Vertical = (1N,2A,3A,SL) Y Yardstick (columns lines low high extreme)= 0,25,-1,1,End Measr +Candidate -Paper -Examiner Scale (23) 21 Strong Hard Hawk Q P H L 14 N Essay Polit I J Ancient MedMod F G * 0 * 4 8 * * K * 12 * B D E O 11 A C R Weak Easy Dove (1) Measr +Candidate -Paper -Examiner Scale =alpha D,K,O,P,Q marked Paper 1 (Ancient) = alpha/beta borderline (~ I-II.i) ~ II.i-II.ii borderline 6-7 = beta/gamma borderline (~II.ii-III) 1=delta I have edited the output from Facets to make it look nicer: - Courier Font - Line Spacing =.65 - Looks much clearer The Yardstick command sets the range and the number of steps
22 Estimates for individual candidates, sorted by average score An Examination of Examinations 24 point marking scheme 22/11/ :13:52 Table Candidate Measurement Report (arranged by 1mN). Total Total Obsvd Fair(M) + Model Infit Outfit Estim. Corr. Score Count Average Average Measure S.E. MnSq ZStd MnSq ZStd Discrm PtBis Num Candidate Mean (Count: 16) S.D. (Population) S.D. (Sample) Model, Populn: RMSE.05 Adj (True) S.D..23 Separation 4.37 Strata 6.16 Reliability.95 Model, Sample: RMSE.05 Adj (True) S.D..24 Separation 4.52 Strata 6.36 Reliability.95 Model, Fixed (all same) chi-square: d.f.: 15 significance (probability):.00 Model, Random (normal) chi-square: 14.1 d.f.: 14 significance (probability):.44
23 Estimates for individual candidates, sorted by candidate ID An Examination of Examinations 24 point marking scheme 22/11/ :13:52 Table Candidate Measurement Report (arranged by 1N) Total Total Obsvd Fair(M) + Model Infit Outfit Estim. Corr. Score Count Average Average Measure S.E. MnSq ZStd MnSq ZStd Discrm PtBis Num Candidate Mean (Count: 16) S.D. (Population) S.D. (Sample) Model, Populn: RMSE.05 Adj (True) S.D..23 Separation 4.37 Strata 6.16 Reliability.95 Model, Sample: RMSE.05 Adj (True) S.D..24 Separation 4.52 Strata 6.36 Reliability.95 Model, Fixed (all same) chi-square: d.f.: 15 significance (probability):.00 Model, Random (normal) chi-square: 14.1 d.f.: 14 significance (probability):.44
24 Estimates for Exam Type, sorted by average score n Examination of Examinations 24 point marking scheme 22/11/ :13:52 Table Paper Measurement Report (arranged by 2mN) Total Total Obsvd Fair(M) - Model Infit Outfit Estim. Corr. Score Count Average Average Measure S.E. MnSq ZStd MnSq ZStd Discrm PtBis N Paper Essay Polit MedMod Ancient Mean (Count: 4) S.D. (Population) S.D. (Sample) Model, Populn: RMSE.03 Adj (True) S.D..00 Separation.16 Strata.55 Reliability.03 Model, Sample: RMSE.03 Adj (True) S.D..02 Separation.61 Strata 1.14 Reliability.27 Model, Fixed (all same) chi-square: 4.2 d.f.: 3 significance (probability):.24 Model, Random (normal) chi-square: 1.7 d.f.: 2 significance (probability):.42
25 Estimates for individual examiners, sorted by average score An Examination of Examinations 24 point marking scheme 22/11/ :13:52 Table Examiner Measurement Report (arranged by 3mN) Total Total Obsvd Fair(M) - Model Infit Outfit Estim. Corr. Exact Agree. Score Count Average Average Measure S.E. MnSq ZStd MnSq ZStd Discrm PtBis Obs % Exp % Nu Examiner Q P H L N I J G F K O E D B A C R Mean (Count: 17) S.D. (Population S.D. (Sample) Model, Populn: RMSE.06 Adj (True) S.D..16 Separation 2.66 Strata 3.88 Reliability (not inter-rater).88 Model, Sample: RMSE.06 Adj (True) S.D..17 Separation 2.75 Strata 4.00 Reliability (not inter-rater).88 Model, Fixed (all same) chi-square: d.f.: 16 significance (probability):.00 Model, Random (normal) chi-square: 13.6 d.f.: 15 significance (probability):.55 Inter-Rater agreement opportunities: 2320 Exact agreements: 208 = 9.0% Expected: = 9.4%
26 Estimates for individual examiners, sorted by examiner ID An Examination of Examinations 24 point marking scheme 22/11/ :13:52 Table Examiner Measurement Report (arranged by 3N) Total Total Obsvd Fair(M) - Model Infit Outfit Estim. Corr. Exact Agree. Score Count Average Average Measure S.E. MnSq ZStd MnSq ZStd Discrm PtBis Obs % Exp % Nu Examiner A B C D E F G H I J K L N O P Q R Mean (Count: 17) S.D. (Population S.D. (Sample) Model, Populn: RMSE.06 Adj (True) S.D..16 Separation 2.66 Strata 3.88 Reliability (not inter-rater).88 Model, Sample: RMSE.06 Adj (True) S.D..17 Separation 2.75 Strata 4.00 Reliability (not inter-rater).88 Model, Fixed (all same) chi-square: d.f.: 16 significance (probability):.00 Model, Random (normal) chi-square: 13.6 d.f.: 15 significance (probability):.55 Inter-Rater agreement opportunities: 2320 Exact agreements: 208 = 9.0% Expected: = 9.4%
27 Estimates for scale values, 24 points An Examination of Examinations 24 point marking scheme 22/11/ :13:52 Table 8.1 Category Statistics. Model =?,?,?,R DATA QUALITY CONTROL RASCH-ANDRICH EXPECTATION MOST RASCH- Cat Category Counts Cum. Avge Exp. OUTFIT Thresholds Measure at PROBABLE THURSTONE PEAK Score Total Used % % Meas Meas MnSq Measure S.E. Category -0.5 from Thresholds Prob % 1% ( -2.71) low low 100% % 2% -.84* % % 4% % % 11% % % 15% % % 20% % % 24% -.30* % % 25% % % 33% % % 40% % % 51% -.08* % % 62% % % 76% % % 81% % % 87% % % 91% % % 95% % % 96% % % 97% % % 99%.22* % % 99% % % 100%.22* % % 100%.22* ( 3.02) % (Mean) (Modal)--(Median)
28 The Program: ExOfEx-ExampleMark7.txt A 24-point score is a bit unwieldy Replace it with a 7-point score (<4, 5-7, 8-10, etc) Re-run the program but using ExOfEx-ExampleMark7.txt
29 Vertical = (1N,2A,3A,SL) Y Vertical = (1N,2A,3A,SL) Yardstick (columns lines low high extreme)= 0,25,-1,1,End Yardstick (columns lines low high extreme)= 0,10,-2.5,2.5,En Measr +Candidate -Paper -Examiner Scale Measr +Candidate -Paper -Examiner Scale (23) (7) Q Q P P L H 2 6 H L 14 2 N I J N 10 Essay Polit I J Essay Polit G 1 3 Ancient MedMod F G 1 3 Ancient MedMod F K * 0 * 4 8 * * K * 12 * * 0 * 4 * * * 4 * D E 12 B D E O 11 A B C O A C R 10 R (1) (1) Measr +Candidate -Paper -Examiner Scale Measr +Candidate -Paper -Examiner Scale
30 Graphs
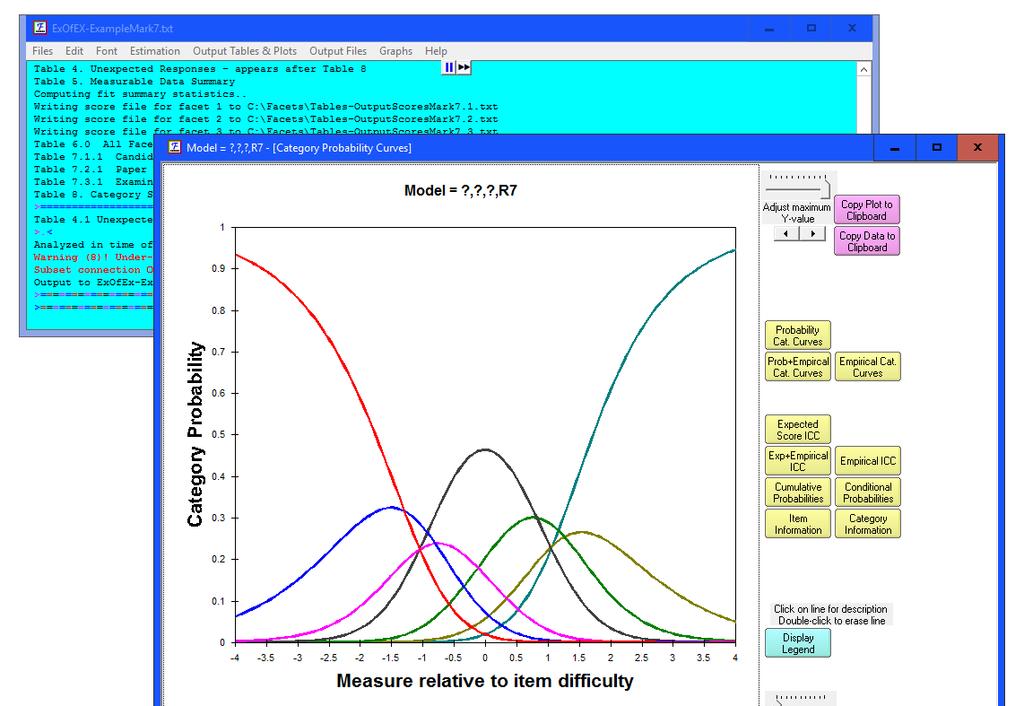
31
32 <
33
34 <

35
Introduction to FACETS: A Many-Facet Rasch Model Computer Program
 Introduction to FACETS: A Many-Facet Rasch Model Computer Program Antal Haans Outline Principles of the Rasch Model Many-Facet Rasch Model Facets Software Several Examples The Importance of Connectivity
Using SPSS for Linear Regression
 Using SPSS for Linear Regression This tutorial will show you how to use SPSS version 12.0 to perform linear regression. You will use SPSS to determine the linear regression equation. This tutorial assumes
SCENARIO: We are interested in studying the relationship between the amount of corruption in a country and the quality of their economy.
 Introduction to SPSS Center for Teaching, Research and Learning Research Support Group American University, Washington, D.C. Hurst Hall 203 rsg@american.edu (202) 885-3862 This workshop is designed to
Launch Store. University
 Launch Store University Importing and Exporting CSVs In this lesson, you will learn how to: What is a CSV? How to export a CSV document of your products from control panel How to import a CSV into your
LIR 832: MINITAB WORKSHOP
 LIR 832: MINITAB WORKSHOP Opening Minitab Minitab will be in the Start Menu under Net Apps. Opening the Data Go to the following web site: http://www.msu.edu/course/lir/832/datasets.htm Right-click and
Top Tips to Streamline Data Migration and Validation
 Top Tips to Streamline Data Migration and Validation Top Tips for Streamlining Data Migration and Validation Data migration and validation is a critical step when implementing new HR systems. Most systems
CONTENTS. How to install 3 How to set up a product How to edit Matrix Prices 7 Calculation Types 8
 MANUAL CONTENTS Subject Page(s) How to install 3 How to set up a product 4-6 How to edit Matrix Prices 7 Calculation Types 8 2 HOW TO INSTALL 1) Copy & Paste all the files inside the package to your Magento
Validity and Reliability of an E-Portfolio Indicators Instrument for Malaysian Skills Certification (MSC)
") Pertanika J. Soc. Sci. & Hum. 25 (S): 47-56 (2017) SOCIAL SCIENCES & HUMANITIES Journal homepage: http://www.pertanika.upm.edu.my/ Validity and Reliability of an E-Portfolio Indicators Instrument for Malaysian
Pertanika J. Soc. Sci. & Hum. 25 (S): 47-56 (2017) SOCIAL SCIENCES & HUMANITIES Journal homepage: http://www.pertanika.upm.edu.my/ Validity and Reliability of an E-Portfolio Indicators Instrument for Malaysian
SPSS 14: quick guide
 SPSS 14: quick guide Edition 2, November 2007 If you would like this document in an alternative format please ask staff for help. On request we can provide documents with a different size and style of
Use the interactive below to view examples of some of the types of charts that are available in Excel.
 Excel 2010 Working with Charts Introduction Page 1 A chart is a tool you can use in Excel to communicate your data graphically. Charts allow your audience to see the meaning behind the numbers, and they
The Dummy s Guide to Data Analysis Using SPSS
 The Dummy s Guide to Data Analysis Using SPSS Univariate Statistics Scripps College Amy Gamble April, 2001 Amy Gamble 4/30/01 All Rights Rerserved Table of Contents PAGE Creating a Data File...3 1. Creating
Transportation Management Accounting Portal Invoice Upload
 Transportation Management Accounting Portal Invoice Upload USER REFERENCE V.5 To help facilitate the submission of transportation invoices for payment, Crowley has designed a solution for the carrier to
Introduction of STATA
 Introduction of STATA News: There is an introductory course on STATA offered by CIS Description: Intro to STATA On Tue, Feb 13th from 4:00pm to 5:30pm in CIT 269 Seats left: 4 Windows, 7 Macintosh For
Intermediate Google AdWords Instructors: Alice Kassinger
 Intermediate Google AdWords Instructors: Alice Kassinger Class Objectives: Understand how Ads show on the results page Analyze the progress and success of your Ads Learn how to improve your Ad Rank with
How to Import Timesheet Data into Payroll Mate Using T-Sheets
 How to Import Timesheet Data into Payroll Mate Using T-Sheets Note: In order to use this feature you must purchase and enable Payroll Mate Option #3 (Additional Companies & Employees + Timesheet Import)
Department of Mathematics, Faculty of Science and Mathematics, Universiti Pendidikan Sultan Idris, Tanjong Malim, Perak, Malaysia.
 Validity and Reliability Graphing Calculator Circles Topic Test (GCCTT) Item Based On Table of Test Specification 3 Dimension (3D ToTS) Using Rasch Model: A Pilot Study Mohd Hafiszudin Ab Samad 1, Raja
Getting Started with HLM 5. For Windows
 For Windows Updated: August 2012 Table of Contents Section 1: Overview... 3 1.1 About this Document... 3 1.2 Introduction to HLM... 3 1.3 Accessing HLM... 3 1.4 Getting Help with HLM... 3 Section 2: Accessing
Linking the TestDaF to the CEFR: The Case of Writing Proficiency
 4th Annual EALTA Conference Sitges, 15th - 17th June 2007 Linking the TestDaF to the CEFR: The Case of Writing Proficiency Gabriele Kecker & Thomas Eckes, TestDaF-Institut, Germany, gabriele.kecker@testdaf.de,
Differential Item Functioning
 Differential Item Functioning Ray Adams and Margaret Wu, 29 August 2010 Within the context of Rasch modelling an item is deemed to exhibit differential item functioning (DIF) if the response probabilities
Risk Management User Guide
 Risk Management User Guide Version 17 December 2017 Contents About This Guide... 5 Risk Overview... 5 Creating Projects for Risk Management... 5 Project Templates Overview... 5 Add a Project Template...
Lanteria HR Report Center
 User Guide for version 4.2.0 Copyright 2015 Lanteria Table of Contents 1 Introduction... 3 1.1 Report Center Overview... 3 1.2 Terminology List... 3 2 General Reports... 4 2.1 Run General Reports... 4
Instructions for Creating a ParScore Course
 ParScore Single Section Exam Instructions 1 Instructions for Creating a ParScore Course 1. Open ParScore. Log in. 2. Create a New Course a. Select New b. Enter the Course ID.: Sample course ID: 150READS12=Reading
Pivot Table Tutorial Using Ontario s Public Sector Salary Disclosure Data
 Pivot Table Tutorial Using Ontario s Public Sector Salary Disclosure Data Now that have become more familiar with downloading data in Excel format (xlsx) or a text or csv format (txt, csv), it s time to
Employee Information
 Employee Information - - - - - - - - - - - - - - - - - - - - - - - - - Add New Employees You can add new employees at any time. All that is required for each employee is a name and what Positions they
Weka Evaluation: Assessing the performance
 Weka Evaluation: Assessing the performance Lab3 (in- class): 21 NOV 2016, 13:00-15:00, CHOMSKY ACKNOWLEDGEMENTS: INFORMATION, EXAMPLES AND TASKS IN THIS LAB COME FROM SEVERAL WEB SOURCES. Learning objectives
Microsoft Office: Excel 2013
 Microsoft Office: Excel 2013 Intro to Charts University Information Technology Services Training, Outreach and Learning Technologies Copyright 2014 KSU Department of University Information Technology Services
WINDOWS, MINITAB, AND INFERENCE
 DEPARTMENT OF POLITICAL SCIENCE AND INTERNATIONAL RELATIONS Posc/Uapp 816 WINDOWS, MINITAB, AND INFERENCE I. AGENDA: A. An example with a simple (but) real data set to illustrate 1. Windows 2. The importance
Activities supporting the assessment of this award [3]
![Activities supporting the assessment of this award [3]](/thumbs/96/128485615.jpg "Activities supporting the assessment of this award [3]") Relevant LINKS BACK TO ITQ UNITS [1] Handbook home page [2] Overview This is the ability to use a software application designed to record data in rows and columns, perform calculations with numerical data
Relevant LINKS BACK TO ITQ UNITS [1] Handbook home page [2] Overview This is the ability to use a software application designed to record data in rows and columns, perform calculations with numerical data
Excel 2016: Charts - Full Page
 Excel 2016: Charts - Full Page gcflearnfree.org/excel2016/charts/1/ Introduction It can be difficult to interpret Excel workbooks that contain a lot of data. Charts allow you to illustrate your workbook
LECTURE 17: MULTIVARIABLE REGRESSIONS I
 David Youngberg BSAD 210 Montgomery College LECTURE 17: MULTIVARIABLE REGRESSIONS I I. What Determines a House s Price? a. Open Data Set 6 to help us answer this question. You ll see pricing data for homes
Periodic Billing. Periodic Billing Customer Maintenance. Periodic Billing
 allows merchants to bill customers for memberships, subscriptions, or recurring product/service orders. Contact Shift4 Payments to enable this feature for an account. Note: To view options, the user must
How to view Results with. Proteomics Shared Resource
 How to view Results with Scaffold 3.0 Proteomics Shared Resource An overview This document is intended to walk you through Scaffold version 3.0. This is an introductory guide that goes over the basics
Performance Management System Reference Guide Reporting
 Performance Management System Reference Guide Reporting Statistics Dashboard 3 Note... 3 Company Performance... 3 Department Performance... 5 Individual Performance... 6 Company 360... 7 Department 360...
Chapter 2 Part 1B. Measures of Location. September 4, 2008
 Chapter 2 Part 1B Measures of Location September 4, 2008 Class will meet in the Auditorium except for Tuesday, October 21 when we meet in 102a. Skill set you should have by the time we complete Chapter
Utilizing Recruitment Planners Preparing your Exam Plan...1 Creating the Exam Plan...2
 Scheduling & Scoring Exams Utilizing Recruitment Planners... 1 Preparing your Exam Plan...1 Creating the Exam Plan...2 Exam Types M-Type Rows (T&E, Writing Exercise)...6 O-Type Rows (Written Exam Uploaded
1 BASIC CHARTING. 1.1 Introduction
 1 BASIC CHARTING 1.1 Introduction This section covers the basic principles of how to create and modify a chart in Excel. With Excel 2016, the charting process is user-friendly and offers many ways to amplify
Pinterest Ads Manager Guide
 Pinterest Ads Manager Guide Create and manage ads using the Pinterest Ads Manager and see how your ads help your business grow. Promoted Pins are ads that you pay for so they can reach a specific audience
Timesheets. Printing Timesheets for a Department
 Timesheets The job aid describes the process for running and printing timesheets either for a department, an employee, or as blank. This report may be run at any time for a limited selection of pay periods.
18: Manage Job Orders
 18: Manage Job Orders Chapter Contents Create an Internal Job... 18-1 Search for Internal Jobs... 18-2 Working with Job Orders... 18-4 Modifying a Job Order... 18-5 Search For and Refer All Jobs... 18-7
CHAPTER 8 T Tests. A number of t tests are available, including: The One-Sample T Test The Paired-Samples Test The Independent-Samples T Test
 CHAPTER 8 T Tests A number of t tests are available, including: The One-Sample T Test The Paired-Samples Test The Independent-Samples T Test 8.1. One-Sample T Test The One-Sample T Test procedure: Tests
Creating Simple Report from Excel
 Creating Simple Report from Excel 1.1 Connect to Excel workbook 1. Select Connect Microsoft Excel. In the Open File dialog box, select the 2015 Sales.xlsx file. 2. The file will be loaded to Tableau, and
MCSA BI Reporting. A Success Guide to Prepare- Analyzing and Visualizing Data with Microsoft Power BI. edusum.com
 70-778 MCSA BI Reporting A Success Guide to Prepare- Analyzing and Visualizing Data with Microsoft Power BI edusum.com Table of Contents Introduction to 70-778 Exam on Analyzing and Visualizing Data with
How to view Results with Scaffold. Proteomics Shared Resource
 How to view Results with Scaffold Proteomics Shared Resource Starting out Download Scaffold from http://www.proteomes oftware.com/proteom e_software_prod_sca ffold_download.html Follow installation instructions
Glossary of Standardized Testing Terms https://www.ets.org/understanding_testing/glossary/
 Glossary of Standardized Testing Terms https://www.ets.org/understanding_testing/glossary/ a parameter In item response theory (IRT), the a parameter is a number that indicates the discrimination of a
Credit Card Marketing Classification Trees
 Credit Card Marketing Classification Trees From Building Better Models With JMP Pro, Chapter 6, SAS Press (2015). Grayson, Gardner and Stephens. Used with permission. For additional information, see community.jmp.com/docs/doc-7562.
DIS 300. Quantitative Analysis in Operations Management. Instructions for DIS 300-Transportation
 Instructions for -Transportation 1. Set up the column and row headings for the transportation table: Before we can use Excel Solver to find a solution to C&A s location decision problem, we need to set
The SPSS Sample Problem To demonstrate these concepts, we will work the sample problem for logistic regression in SPSS Professional Statistics 7.5, pa
 The SPSS Sample Problem To demonstrate these concepts, we will work the sample problem for logistic regression in SPSS Professional Statistics 7.5, pages 37-64. The description of the problem can be found
Introduction. Creating Sparklines. Excel 2010 Working with Sparklines. Types of Sparklines. Page 1
 Excel 2010 Working with Sparklines Introduction Page 1 Sparklines are miniature charts that fit into a single cell. Since they're so compact, you can place a large number of them in your worksheets. For
= = Intro to Statistics for the Social Sciences. Name: Lab Session: Spring, 2015, Dr. Suzanne Delaney
 Name: Intro to Statistics for the Social Sciences Lab Session: Spring, 2015, Dr. Suzanne Delaney CID Number: _ Homework #22 You have been hired as a statistical consultant by Donald who is a used car dealer
Gegenees V User Manual :
 User Manual : Gegenees V 1.0.1 What is Gegenees?... 1 Version system:... 2 What's new... 2 Installation:... 2 Perspectives... 3 The workspace... 3 The local database... 4 Remote Sites... 5 Gegenees genome
Invoicing Overview - 1 -
 Invoicing Overview The Account options, such as invoicing and receipts, allow you to maintain separate balances of account for each of your contacts, such as parents or guardians. When you issue an invoice
SMRT Analysis Barcoding Overview (v6.0.0)
") SMRT Analysis Barcoding Overview (v6.0.0) Introduction This document applies to PacBio RS II and Sequel Systems using SMRT Link v6.0.0. Note: For information on earlier versions of SMRT Link, see the document
SMRT Analysis Barcoding Overview (v6.0.0) Introduction This document applies to PacBio RS II and Sequel Systems using SMRT Link v6.0.0. Note: For information on earlier versions of SMRT Link, see the document
Analyzing Generic Competency Required by Malaysian Contractors from Malaysian Construction Management Graduates using the Rasch Measurement Model
 Pertanika J. Soc. Sci. & Hum. 25 (S): 93-104 (2017) SOCIAL SCIENCES & HUMANITIES Journal homepage: http://www.pertanika.upm.edu.my/ Analyzing Generic Competency Required by Malaysian Contractors from Malaysian
Data Collection Advanced
 Data Collection Advanced Instructors : Joseph Reibenspies, Ph.D. Nattamai Bhuvanesh, Ph.D. Version 2.0.1_2009 Practicals X-ray Diffraction Series 1 APEXII Collect Matrix for UnitCell Practicals X-ray Diffraction
Lab 2. Analysis of Observational Study/Calculations with SPSS
 Lab 2 Analysis of Observational Study/Calculations with SPSS What does an article look like? Title/Title Page Abstract Introduction Method Results Discussion References What does an article look like?
Getting Started with Power BI 8 Easy Steps
 Getting Started with Power BI 8 Easy Steps Getting Started with Microsoft Power BI An easy to follow guide for beginners and end users like me! This guide is designed for end users like me, to help you
Workshop in Applied Analysis Software MY591. Introduction to SPSS
 Workshop in Applied Analysis Software MY591 Introduction to SPSS Course Convenor (MY591) Dr. Aude Bicquelet (LSE, Department of Methodology) Contact: A.J.Bicquelet@lse.ac.uk Contents I. Introduction...
Excel 2011 Charts - Introduction Excel 2011 Series The University of Akron. Table of Contents COURSE OVERVIEW... 2
 Table of Contents COURSE OVERVIEW... 2 DISCUSSION... 2 OBJECTIVES... 2 COURSE TOPICS... 2 LESSON 1: CREATE A CHART QUICK AND EASY... 3 DISCUSSION... 3 CREATE THE CHART... 4 Task A Create the Chart... 4
INTRO TO WORK PLANNING IN MIRADI 4.4
 INTRO TO WORK PLANNING IN MIRADI 4.4 Overview of Work Plan High Level Work Planning Adding Financial Information Analyzing & Using Work Plan Data Key Work Plan Controls Detailed Work Planning Work Planning
How to Configure the Workflow Service and Design the Workflow Process Templates
 How - To Guide SAP Business One 9.0 Document Version: 1.1 2013-04-09 How to Configure the Workflow Service and Design the Workflow Process Templates Typographic Conventions Type Style Example Description
Modelling prey-predator interactions
 Modelling prey-predator interactions Predator-prey relationships can be important for conservation, including the interactions between tigers and their ungulate prey. There is a good deal of ecological
If you want to flag a question for later review, select the "Mark for review" button.
 Exam Number: 584002RR Lesson Name: Microsoft Excel 2016 Exam Guidelines: This exam is now available only in the online assessment system. If your study guide still contains an exam, that exam is no longer
Measurement and sampling
 Name: Instructions: (1) Answer questions in your blue book. Number each response. (2) Write your name on the cover of your blue book (and only on the cover). (3) You are allowed to use your calculator
QuickStart Guide. Rev iclasspro Inc. All Rights Reserved
 QuickStart Guide Creating a New Family......................................... 1 Creating a New Student....................................... 2 Creating a New Charge.......................................
EMPLOYEE JOB AID GETTING STARTED IN WORKDAY KEY ICONS ICON FUNCTION DESCRIPTION
 EMPLOYEE JOB AID GETTING STARTED IN WORKDAY This job aid covers the basics to get started using Workday and the features that will help you use the system. Workday s proven processes simplify the way we
Econometric Analysis Dr. Sobel
 Econometric Analysis Dr. Sobel Econometrics Session 1: 1. Building a data set Which software - usually best to use Microsoft Excel (XLS format) but CSV is also okay Variable names (first row only, 15 character
Hierarchical Linear Modeling: A Primer 1 (Measures Within People) R. C. Gardner Department of Psychology
 R. C. Gardner Department of Psychology") Hierarchical Linear Modeling: A Primer 1 (Measures Within People) R. C. Gardner Department of Psychology As noted previously, Hierarchical Linear Modeling (HLM) can be considered a particular instance
Hierarchical Linear Modeling: A Primer 1 (Measures Within People) R. C. Gardner Department of Psychology As noted previously, Hierarchical Linear Modeling (HLM) can be considered a particular instance
3 Ways to Improve Your Targeted Marketing with Analytics
 3 Ways to Improve Your Targeted Marketing with Analytics Introduction Targeted marketing is a simple concept, but a key element in a marketing strategy. The goal is to identify the potential customers
Milk Data Analysis. 1. Objective: analyzing protein milk data using STATA.
 1. Objective: analyzing protein milk data using STATA. 2. Dataset: Protein milk data set (in the class website) Data description: Percentage protein content of milk samples at weekly intervals from each
GUIDE: Manage Stock in Kitomba
 GUIDE: Manage Stock in Kitomba What is Stock? Stock includes any physical items you sell to your customers e.g. shampoo, conditioner, oils, candles etc. Stock also includes any disposable items you use
Electronic Timesheet System Student User Guide Date Written 30 May 2017 Date Updated
 Electronic Timesheet System Student User Guide Date Written 30 May 2017 Date Updated 2018-04-24 Launching the Timesheet Management System (TMS)... 2 Recording Mentor Details... 3 Recording Hours, Breaks
Configuring the Expenditure/Monthly Spending Report
 Configuring the Expenditure/Monthly Spending Report Created: April, 2010 Last Updated: April, 2010 National Resource Center for Participant-Directed Services Table of Contents Step 1 Plan... 3 Step 2 Review
USAD Software Training Manual
 USAD Software Training Manual Introduction... 3 Web-Based Software... 4 Competition Setup... 4 Create and Setup New Contest... 4 Create and Setup New Teams... 9 Create and Setup New Tests... 15 Create
Solution to Task T3.
 Solution to Task T3. Data management in Gretl. Task T3.1. Generating Gretl data files Beach umbrella rental a. Enter data into Gretl manually. File --> New data set Number of observations: 21 Structure
Gush vs. Bore: A Look at the Statistics of Sampling
 Gush vs. Bore: A Look at the Statistics of Sampling Open the Fathom file Random_Samples.ftm. Imagine that in a nation somewhere nearby, a presidential election will soon be held with two candidates named
Administrator User Guide (Administrator Selects Raters)
") Administrator User Guide (Administrator Selects Raters) Contents Home Page... 4 Create Evaluation... 4 My Evaluations... 4 Product Support... 4 Subscription Status... 4 User Administration... 5 Update
Administrator User Guide (Administrator Selects Raters) Contents Home Page... 4 Create Evaluation... 4 My Evaluations... 4 Product Support... 4 Subscription Status... 4 User Administration... 5 Update
TRUST. Technology Reporting Using Structured Templates for the FCH JU. User Manual for data providers. Version 1.00
 TRUST Technology Reporting Using Structured Templates for the FCH JU User Manual for data providers Version 1.00 Table of contents TRUST ----------------------------------------------------------------------------------------------------------------------------
Getting Started with the TTU Requisition System in FileMaker
 Getting Started with the TTU Requisition System in FileMaker Academic Computing Support Information Technology Services Tennessee Technological University Revised June 1999 1. Customizing your Requisition
Define Metrics in Reports
 in Reports Metrics are used to build reports. They are the numerical values displayed in reports. They represent aggregations of facts and attributes. A metric is a simple or complex calculation applied
WE UNITED PLACINGS WORKSHEET GUIDE SINGLE JUDGE
 WE UNITED PLACINGS WORKSHEET GUIDE SINGLE JUDGE This guide is a companion to the WE United Placings Worksheet for a single judge. This guide will provide you with information on how to enter the necessary
Inventory Procedures
 Inventory Procedures Detailed Agenda Bill of Materials Model Templates Supplier Cost Upload Inventory Price Upload Inventory Count Course Description Inventory, Files, Bill of Materials/Assemblies Bill
Multiple Responses Analysis using SPSS (Dichotomies Method) A Beginner s Guide
 A Beginner s Guide") Institute of Borneo Studies Workshop Series 2016 (2)1 Donald Stephen 2015 Multiple Responses Analysis using SPSS (Dichotomies Method) A Beginner s Guide Donald Stephen Institute of Borneo Studies, Universiti
Institute of Borneo Studies Workshop Series 2016 (2)1 Donald Stephen 2015 Multiple Responses Analysis using SPSS (Dichotomies Method) A Beginner s Guide Donald Stephen Institute of Borneo Studies, Universiti
CCC Wallboard Manager User Manual
 CCC Wallboard Manager User Manual 40DHB0002USBF Issue 2 (17/07/2001) Contents Contents Introduction... 3 General... 3 Wallboard Manager... 4 Wallboard Server... 6 Starting the Wallboard Server... 6 Administering
Reliability & Validity
 Request for Proposal Reliability & Validity Nathan A. Thompson Ph.D. Whitepaper-September, 2013 6053 Hudson Road, Suite 345 St. Paul, MN 55125 USA P a g e 1 To begin a discussion of reliability and validity,
Version 7.x. Training Workbook. Scantron Corporation, World Headquarters 1313 Lone Oak Rd, Eagan, MN
 Version 7.x Training Workbook Scantron Corporation, World Headquarters 1313 Lone Oak Rd, Eagan, MN 55121-1334 www.scantron.com INTENTIONAL BLANK PAGE FOR NOTES Table of Contents MODULE 1 - INTRODUCTION...
MIS 0855 Data Science (Section 006) Fall 2017 In-Class Exercise (Day 32) Simple Predictive Analytics Using Tableau
 Fall 2017 In-Class Exercise (Day 32) Simple Predictive Analytics Using Tableau") MIS 0855 Data Science (Section 006) Fall 2017 In-Class Exercise (Day 32) Simple Predictive Analytics Using Tableau Objective: Analyze a data set to make inferences about future outcomes Learning Outcomes:
MIS 0855 Data Science (Section 006) Fall 2017 In-Class Exercise (Day 32) Simple Predictive Analytics Using Tableau Objective: Analyze a data set to make inferences about future outcomes Learning Outcomes:
Electronic Timesheet System Student User Guide Date Written 30 May 2017 Date Updated
 Electronic Timesheet System Student User Guide Date Written 30 May 2017 Date Updated 2018-09-25 Launching the Timesheet Management System (TMS)... 2 Recording Mentor Details... 3 Recording Hours, Breaks
Tutorial Formulating Models of Simple Systems Using VENSIM PLE System Dynamics Group MIT Sloan School of Management Cambridge, MA O2142
 Tutorial Formulating Models of Simple Systems Using VENSIM PLE System Dynamics Group MIT Sloan School of Management Cambridge, MA O2142 Originally prepared by Nelson Repenning. Vensim PLE 5.2a Last Revision:
Hiring - Pre-Selection
 Hiring - Pre-Selection Contents Page 3 Page 4 Page 5 Page 6 Page 6-7 Page 7-9 Page 7 Page 8 Page 8-9 Page 10-12 The Hiring Process Candidate Selection Page - Overview Display Candidates Page - Overview
Top N Pareto Front Search Add-In (Version 1) Guide
 Guide") Top N Pareto Front Search Add-In (Version 1) Guide Authored by: Sarah Burke, PhD, Scientific Test & Analysis Techniques Center of Excellence Christine Anderson-Cook, PhD, Los Alamos National Laboratory
Top N Pareto Front Search Add-In (Version 1) Guide Authored by: Sarah Burke, PhD, Scientific Test & Analysis Techniques Center of Excellence Christine Anderson-Cook, PhD, Los Alamos National Laboratory
Suspense Management Reports. September 2016
 Suspense Management Reports September 2016 Webinar logistics and materials Today s webinar is approximately 60 minutes The audio is one-way. Use the chat window to type your questions. We will answer questions
AcaStat How To Guide. AcaStat. Software. Copyright 2016, AcaStat Software. All rights Reserved.
 AcaStat How To Guide AcaStat Software Copyright 2016, AcaStat Software. All rights Reserved. http://www.acastat.com Table of Contents Frequencies... 3 List Variables... 4 Descriptives... 5 Explore Means...
MIS 0855 Data Science (Section 005) Fall 2016 In-Class Exercise (Week 11) Simple Predictive Analytics Using Tableau
 Fall 2016 In-Class Exercise (Week 11) Simple Predictive Analytics Using Tableau") MIS 0855 Data Science (Section 005) Fall 2016 In-Class Exercise (Week 11) Simple Predictive Analytics Using Tableau Objective: Analyze a data set to make inferences about future outcomes Learning Outcomes:
MIS 0855 Data Science (Section 005) Fall 2016 In-Class Exercise (Week 11) Simple Predictive Analytics Using Tableau Objective: Analyze a data set to make inferences about future outcomes Learning Outcomes:
ProGAGE ISO. Innovation in Gage Management Software
 Innovation in Gage Management Software ProGAGE ISO is the latest and most comprehensive automated gage management software from American Quality Systems. ProGAGE ISO saves you time and gives you complete
SOP16 DATA CHECKING OF MANUALLY INPUTTED DATA
 VERSION NUMBER 1 DATE OF VERSION (dd/mm/yyyy) 1 2 / 0 1 / 2 0 1 5 WRITTEN/REVIEWED BY Print Name Angela Attwood Date (dd/mm/yyyy) 1 2 / 0 1 / 2 0 1 5 APPROVED BY Print Name Angela Attwood Date (dd/mm/yyyy)
APPROVE, VIEW, AND ENTER ABSENCES FOR EMPLOYEES PROCESS GUIDE
 APPROVE, VIEW, AND ENTER ABSENCES FOR EMPLOYEES PROCESS GUIDE Overview This step- by- step guide will show you how to approve employee absences in PeopleSoft (MyFresnoState). It will also show you how
Lloyds Bank Commercial Cards CCDM User Guide
 Lloyds Bank Commercial Cards CCDM User Guide Reporting for Administrators Version 1.1, 22082017 Please note that this document is for guidance only and as such not all screenshots will mirror your view
CEIC Data Manager Version CEICData.com. All rights reserved.
 CEIC Data Manager Version 2.5 2 CEIC Data Manager Version 2.5 Table of Contents Part I Getting Started 6 1 About... CDM 6 2 Install... & Uninstall 7 3 Quick Tutorials... 7 Starting CDM... 7 CDM Tabs...
IBM Maximo Mobile Suite Version 7 Release 5.1. User Guide
 IBM Maximo Mobile Suite Version 7 Release 5.1 User Guide Note Before using this information and the product it supports, read the information in Notices on page 39. This edition applies to version 7, release
Fundamentals of Rietveld Refinement III. Additional Examples
 Fundamentals of Rietveld Refinement III. Additional Examples An Introduction to Rietveld Refinement using PANalytical X Pert HighScore Plus v3.0a Scott A Speakman, Ph.D. MIT Center for Materials Science