Climate and business-related effects of a Green STRING Transport Corridor Öresund-Hamburg COWI A/S
|
|
|
- Kenneth Brooks
- 5 years ago
- Views:
Transcription


1 Climate and business-related effects of a Green STRING Transport Corridor Öresund-Hamburg COWI A/S
2 Title: Client: Produced by: Climate and business-related effects of a Green STRING Transport Corridor Öresund-Hamburg Green STRING Corridor, Sandrina Lohse (WP-leader) Region Zealand COWI A/S Parallelvej 2, 2800 Kongens Lyngby Project leader: Experts/Team: Ole Kveiborg Jakob Dybdal Christensen, Kristian Pedersen, Monica Hansen Henrik Sylvan, Sylvan Transport Data Lab 2
3 Contents INTRODUCTION THE GREEN STRING CORRIDOR IS INFLUENCED BY NATIONAL AND INTERNATIONAL AGENDAS GREEN CORRIDORS A POLITICAL CONCEPT POLITICAL AMBITIONS WITH IMPLICATIONS FOR THE STRING TRANSPORT CORRIDOR Green objectives in the STRING countries Major changes in the infrastructure may have major impacts on the economy and on the environment A GREEN STRING CORRIDOR THE CHALLENGE IDENTIFICATION OF GAP TWO SCENARIOS PREDICTING TRAFFIC IN THE STRING CORRIDOR SCENARIOS Method for calculating long distance traffic in the corridor Emissions from vehicles are declining GREEN STRING CORRIDOR CO₂ EMISSION TARGET FOR TRAFFIC AND CO₂ EMISSIONS IN THE BUSINESS AS USUAL SCENARIO THE CO₂ GAP ADRESSING THE GAP Can changes in rail capacity accommodate a 30% modal share Known approaches to reduce CO₂ emissions BUSINESS GAINS AND POTENTIALS SECTORS BENEFITTING FROM A GREEN CORRIDOR Food sector Health care Greentech Logistics FIRMS WANT GREEN TRANSPORT, BUT ONLY WHEN IT IS BENEFICIAL FOR BUSINESS Some sectors are already advancing in rail transport Businesses react to cost savings Businesses adapt to new possibilities CO₂ reductions must mostly be driven by technological improvements Transparency increase private investments in the corridor Mutual beneficial cooperation
4 3.2.7 Beneficial trade imbalances WHO WILL BE ABLE TO EXPLOIT AND IMPLEMENT CONCLUDING REMARKS CONCLUSIONS REFERENCES ANNEX A. RELEVANT TARGETS UP TO
5 INTRODUCTION When the fixed link between Denmark and Germany - the Fehmarn Belt tunnel - is ready to open in 2021, a number of new transport possibilities will be made possible. This may have impacts on various economic sectors as well as on individuals choices with respect to transport solutions, daily activities and how to undertake business. Both freight- and passenger traffic to and from Scandinavia will be much more efficient due to the reduced transport- and travel times. The very large infrastructure improvements in the Green STRING corridor will allow for a stronger connection of the Öresund region to the central parts of Europe, and vice versa. Moreover, it is expected that the implementation of the Fehmarn Belt fixed link will complemented by other infrastructure improvements such as improved terminal structures, better possibilities to undertake intermodal transport that continuously support a greener approach for transportation. The European Commission has in its White Paper from 2011 outlined ambitious targets regarding the greenhouse gas emissions and is aiming at significant reductions also within the transport sectors. To achieve these targets, the Commission has introduced the concept of green transport corridors, to support the introduction of transport solutions that would further shifts towards more energy and emission friendly ways of transport. An overall objective of the Green String Corridor project is to identify ways that businesses and citizens of the STRING corridor between the Öresund region and Hamburg can exploit and benefit from being part of such a green corridor with the improved infrastructure. The current report presents the results of a study based on an analysis that has two overall objectives: 1. Identifying the difference between the forecasted long distance traffic and its related CO₂ emissions between EU targets and predicted traffic in the Green STRING Corridor ( identifying the gap ). 2. Outline how individual firms can benefit from the implementation of a green STRING corridor and further contribute to achieving the target CO₂ objectives. The report should support political and administrative authorities in the region in preparing and planning future activities in the their respective areas; moreover, the report also indicates areas, where individual businesses in the corridor can further exploit and contribute to the fulfilment of the targets. 5
6 This study is part of an activity within the projects work package entitled Development of a Green STRING Transport Corridor (WP1) but it also will have use for the work package on Business travel and accessibility (WP3). The analyses and results have been discussed with the partners of this project and certain aspects have been discussed with stakeholders from the transport sector as well as from significant business sectors in the corridor. The viewpoint and conclusions are those of the consultants. In Chapter 1 the Green STRING Corridor is set into a general political perspective and discusses the challenge facing the implementation of a green corridor. Chapter 2 calculates the CO₂ gap in order to implement the green targets and discusses some initiatives to close the gap, Chapter 3 is outlining the implications and possibilities that businesses have in the green corridor and finally a short summary and conclusion is given in Chapter 4. 6
7 1 THE GREEN STRING CORRIDOR IS INFLUENCED BY NATIONAL AND INTERNATIONAL AGENDAS Although, infrastructure is not a guarantee for economic development, it is an important driver for economic development during constructions of large infrastructure projects. We have learned from the Great Belt and the Öresund fixed link, that traffic flows crossing natural barriers e.g. water have changed completely and that the regional impact has been positive and a major economic development that had been unthinkable without these infrastructure investments emerged. The challenge has each time been to balance the traffic growth, and to recognise that it was not a purpose in itself. In this context politicians have been deciding upon a holistic solution where public transport should be encouraged and where the objective of more freight on rail and sea had to be met. At the same time it also had to be recognised that although the ambitions are pointing at increased use of environmentally friendly transport solutions, road transport will continue to be the dominant mode for most people and for most freight transport movements. Fulfilling the many political objectives in relation to the Green STRING Corridor is a complex matter. Focus is on both changing the behaviour of transport users, providing transport systems that are less polluting and can alleviate congestion in urban areas as well as on the development of new alternative fuel transport systems. An overall objective is to increase economic competitiveness and growth. 1.1 GREEN CORRIDORS A POLITICAL CONCEPT The STRING corridor covers the region from the Öresund region to Hamburg and is a small part of the European Scandinavian-Mediterranean corridor between Helsinki and Palermo/Valetta. The Scan-Med corridor covers both rail and road infrastructure. The European Commission has identified a number of these corridors as focus areas linked to the TEN-T network. The Scan-Med corridor and hence also the STRING corridor is covering a number of parallel routes. As illustrated in Figure 1-1, the STRING corridor is only a very small part of the entire corridor, and the STRING corridor moreover is only covering the most central of three parallel routes all being part of the Scan-Med corridor. In the following we denote the three parallel routes as: The Jutland corridor. Basically this is covering infrastructure crossing the Danish-German land border in Jutland. 7

8 The Baltic corridor. This corridor covers the links from Southern Sweden to Germany using the ferries from e.g. Trelleborg in Sweden to to Rostock and Travemünde in Germany. The STRING corridor, which covers the link from Sweden region Scania to Germany over Öresund and Fehmarn Belt and ending in Hamburg. The STRING corridor is also overlapping with the COINCO corridor. The COINCO corridor I slightly larger and includes the links to Oslo and Stockholm. Figure 1-1: The Scan-Med corridor between Helsinki and Palermo. STRING is the part between Öresund and Hamburg. Source: Sylvans Transport Data Lab. The corridor is thus a part of the overall European transport political agenda, but also relies on the objectives and ambitions of the three countries where the corridor is situated. Hence, it relates therefore to the different overall policies in these countries. The Green STRING Corridor project takes its departure in this discussion of green corridors and the planned Fehmarn fixed link. The Green Corridor is a strategic concept in the European Commission perspective. It has developed following a number of different planning processes regarding infrastructure networks in Europe. The green corridors focus on environmentally friendly transport concepts and focus on reducing the negative impacts of transport in the different corridors. 8
9 In the newsletter Europemagazine from April 2014, the Transport Commissioner Kallas comments on the expectations to the green corridors: A green and effective corridor for road and rail traffic is expected to give improved operations, to reduce health effects related to noise and air pollution and in the longer run it is foreseen to reduce the effect of greenhouse gasses impact on climate changes. In particular he emphasises the relevance of the Fehmarn Belt corridor as an important element in the European TEN-T network by saying: The Fehmarn Belt fixed link removes an important bottleneck between Germany and Denmark. This means that the Nordic countries will be tied closer to Europe in an effective and intelligent way. As an integrated part of the TEN-T network the fixed link across Fehmarn Belt will be a part of a pan-european network, which will strengthen the internal market and increase mobility. Although being part of the Paneuropean network, the main effects following a fixed link must be expected to happen close around the fixed link. This means the functional Öresund region towards Hamburg. To maximise the positive effects for the regions located in the corridor, it is necessary to focus on what authorities and businesses can do to support the exploiting of the improved infrastructure. In addition to this necessity, the opening of the fixed Fehmarn Belt link will lead to a significant increase in traffic in the same way as has been seen on e.g. the Great Belt and Oresund fixed links. Much of this traffic must be expected to be road based and hence, not very environmentally friendly in its outset. There is thus a need to focus on the growth and the environmental aspects following the fixed link, which has thus been the ambition of the Green STRING Corridor project. A green corridor is defined in Oxford Research (2012) as part of the Green STRING Corridor Project WP1 as: The concept of a green corridor is the result of several planning processes and visions for transport networks. Ultimately, a green corridor generates environmentally-positive effects, such as a mitigation of CO2 emissions or reduced particulate matter. However, beyond merely being green in terms of outcome, the concept of a green corridor is both an operational and a strategic concept that includes a number of sub-components, most commonly involving a concentration of transport between hubs but expanded choice within this concentration, allowing for an optimal choice across modes of transport (multimodal/ co-modal) that increases efficiency and improves environmental sustainability. In the European system, a Green corridor is a strategic concept. 9
10 1.2 POLITICAL AMBITIONS WITH IMPLICATIONS FOR THE STRING TRANSPORT CORRIDOR The European (EU) targets for future CO₂ emissions are outlined in the EU White Paper from The overall goal for CO₂ reductions in EU are in the White Paper set at 60 % until Moreover, by 2050 key goals include a 50% shift of medium and long distance intercity passenger and freight journeys from road to rail and waterborne transport. In addition to the CO₂ and the modal targets, the White paper outlines other political ambitions. Some of the most relevant targets for transport until 2050 is summarised in Annex A. The European targets give an overall objective for the ambitions in the STRING corridor. The targets are derived from both the objectives on the transport corridors and the ambition to reduce greenhouse gas emissions and reduce negative impacts from the transport system. However, the targets and definitions above must be made operational and aimed for the specific setting in which they are to be applied. Hence, it is chosen between the Green STRING project partners to interpret the green corridor and the targets as a corridor that satisfies the objective to reduce CO₂ emission from medium and long distance traffic (more than 300 km) with 30% in the period from 1990 to The gap between the CO₂ emission target and the estimated future traffic and derived CO₂ emissions (a business as usual scenario) in the Öresund-Hamburg STRING corridor are estimated below in Section GREEN OBJECTIVES IN THE STRING COUNTRIES The so-called green transport policy in Denmark has defined a scenario aiming at double the use of the rail. In principle, the volume of rail transport in Sweden and Denmark doubled in the period , and in that sense environmental policy proved successfully. There is much focus on keeping the growth of car driving to a minimum, and future growth should therefore not be based on the individual traffic. For public transport in Scania as well as traffic on the Danish side for the period up to 2030's political aspirations for a new doubling of the railway traffic, and expansion of capacity, is a top priority. The Danish government is aiming at significant CO₂ reductions with the first objective outlined by the Kyoto agreement with a 20% reduction by In the longer term further reductions in the range of 50-60% are discussed. There are also analyses of the potential use of alternative fuels within the different transport subsectors. Sweden has similarly outlined a number of general policy objectives also with focus on greening the transport sector. Basically there are a number of incentives and projects in Sweden supporting the shift to alternative environmentally friendly transport fuels. 10
11 The political discussion s and ambitions in Sweden aim at a zero-emissions target. The Swedish auto industry is working together with the Swedish authorities in investigating and implementing the use of alternative fuels in demonstration projects such as biogas and LNG gas for heavy vehicles. Germany has launched several projects and programs as well as introduced legislation to support the development and introduction of green transport alternatives both with respect to fuels, and use of specific vehicles in certain urban areas. Overall the German government s ambitions are to increase energy efficiency, to further introduce alternative fuels into the transport sector and significant CO₂ reductions in the long term (up to 80% by 2050) The STRING partners of the three countries have worked on defining a common green growth objective 1 : 1. Reduction of harmful emissions; 2. Efficient use of energy and resources; and 3. Provision of support to business and industry with regard to the innovation and implementation of green, low carbon approaches. As part of EU s common approach in cutting CO₂ emissions, the three countries related to the STRING corridor have as part of the EU implementation of the Kyoto agreement had ambitions of reducing overall CO₂ emissions (e.g. by 20% in Denmark, 17% in Sweden and 14% in Germany by 2025). However, in the January 2014 agreement the outcome was non-committing for the EU member states. 1 STRING (2014). Green Growth in STRING Ambition, Strategy and Profile Projects. 11
 50% reductions by 2050 PORTUGAL SPAIN IRELAND UNITED KINGDOM DENMARK GERMANY FRANCE AUSTRIA SWEDEN POLAND CZECH REPUBLIC NIA CROATIA")


12 BELGIUM LUXEMBOURG SLOVE- NETHER- LANDS MALTA GREECE ESTONIA LATVIA LITHUANIA EU ambitions 60% CO₂ reductions in % long distance on sea/rail DK ambitions Doubling rail a priority CO₂ reductions 20% by 2020 (Kyoto) 50% reductions by 2050 PORTUGAL SPAIN IRELAND UNITED KINGDOM DENMARK GERMANY FRANCE AUSTRIA SWEDEN POLAND CZECH REPUBLIC NIA CROATIA SLOVAKIA HUNGARY FINLAND ROMANIA ITALY BULGARIA SE ambitions Zero emission ambition CO₂ reductions 17% by 2020 (Kyoto) Support further use of alternative fuels CYPRUS DE ambitions Increase energy efficiency Develop alternative fuels CO₂ reductions 40% by % reductions by Figure 1-2: Ambitions for climate changes and modal split in the TRING countries. Source: COWI MAJOR CHANGES IN THE INFRASTRUCTURE MAY HAVE MAJOR IMPACTS ON THE ECONOMY AND ON THE ENVIRONMENT The authorities have managed to establish well-functioning public transport systems across the Great Belt opened in 1997 and the Öresund link opened in The performance in terms of supporting further use of public transport must be seen as successful as trains have a market share of 35% respectively 40% of the total traffic volumes overall on Great Belt and on Öresund. The increase in public transport on the fixed links significantly influenced the travel behaviour, which is indicated in Figure 1-3. Although this is only showing traffic across the fixed links, it is nevertheless a strong indicator for the increased activity in and between the connected regions. In particular, the public traffic between Sweden and Denmark is of interest here, given that it has grown bigger than internal traffic between East and West Denmark. The growth is due to the common interest for exploiting opportunities "on the other side". 12
13 Great Belt Oresund International Figure 1-3: Public transport across the fixed links. International is cross-border traffic, i.e. Denmark-Germany and Sweden-Germany via Denmark. Source: Statistics Denmark and Sund & Bælt Trucks/day Great Belt Oresund Fehmarn Figure 1-4: Number of vehicles per day on the 3 belts/sounds. Left: Passengers cars on the specific links, Right: Freight (1,000) including all trucks between Jutland and Zealand (Storbaelt), all trucks between Southern Sweden and Zealand (Öresund) and trucks passing the Fehmarn Belt. Source: Statistics Denmark and Sund&Bælt. As seen in Figure 1-4, the growing car and freight traffic on the fixed links have also increased significantly from the ferry line era to present situation with fixed links. In the same period the Fehmarn Belt ferry route experienced just a slight development showing the same tendency as the situation has been for the ferry lines on the Great Belt and Öresund before opening of the fixed links. The figures only shows the number of cars and lorries, and although there was a significant number of train and walk on 13
14 passengers on the ferry before the opening of the fixed links, the patterns are nevertheless clear. The traffic developments shown in the two figures are strong indicators on what can be expected when new fixed infrastructures are built. Hence, there are indications that the STRING corridor regions should be able to exploit the growth potential. However, the increasing traffic also put additional pressure on the implementation of being a green corridor. 1.3 A GREEN STRING CORRIDOR THE CHALLENGE The development of the green STRING corridor has a focus on long distance transport. In particular this means that long distance traffic related to the corridor must cross the Fehmarn Belt, but to evaluate potential changes it is necessary also to consider the traffic in the parallel corridors (the Jutland corridor and the Baltic corridor), where much of the future traffic in the STRING corridor can be expected to come from. For the commitment to develop a green corridor between Öresund and Hamburg it requires that the public transport system is given priority. This includes passenger public transport and the common freight systems publicly available (rail networks, ports and common terminal structures). Moreover, the organisation of the transport system must be such that access and use of the common infrastructures are easily made. Also political initiatives must be designed to support businesses and persons use of the green alternatives (e.g. through tax/subsidy incentives, priority to green alternatives such as access to prioritised infrastructure, parking, special lanes, limitations on the use of polluting vehicles in certain areas etc.). Although the number of passenger journeys by train is relatively low, it is an important signal that the transport volume in person km is higher due to the long distance trips that will characterise the Fehmarn Belt crossing. The implementation of the improved infrastructure (road, rail and the fixed Fehmarn link) is expected to lead to transport volumes of the same magnitude as across the Öresund (see e.g. the Environmental Impact Assessment prepared by Femern A/S in 2013), which however, is dominated by relatively short trips. It is the long distance trips are the focus of this study. The long distance trips in this corridor have to cross the fixed Fehmarn Belt link. It is therefore of importance whether the rail system can be designed to take as much as possible of the expected growth in passenger and freight traffic, which is expected to constitute a significant part of the traffic on the new fixed link. The forecast prepared by Femern A/S indicates more than a 300% increase in freight transport on Fehmarn Belt from 2001 to 2030 compared to a doubling in passenger traffic (the figures are presented in Section 2). 14
15 The environmental impact of the infrastructure changes in the corridor is defined on bases of transport volume. It is therefore very important for the successful conversion of the present transport system including the end of operation of the ferries that the greenest solutions available will be in favour of peoples individual choices to travel and the businesses need for efficient freight and business transport. Hence, there are strong individual incentives to continue or even increase the use of road based individual transport. The ambition of the green STRING corridor is to ensure that the new growth can be achieved and simultaneously avoiding that the improved infrastructure leads to even further increases in more energy consuming and emitting traffic. The solutions in the corridor must focus on enabling further uses of environmentally sustainable transport solutions, including more efficient road transport, and implementing transport systems using other transport fuels. These ambitions are much in line with the objectives outlined by the EU targets. In the definition and characterisation of the STRING corridor provided by Oxford Research (2012) for the Green STRING Corridor project, there is an overview of the main infrastructure in the corridor. The main developments of the infrastructure are covered in Hansen (2013) also for the Green STRING Corridor project. 2 In STRING (2012) some of the central bottlenecks are outlined as well as a description of the planned improvements to the infrastructure. 3 Many of these bottlenecks are in the railways, but in order to facilitate the increases in international freight traffic, also the ports, terminals and main road network must be considered. The increase in long distance traffic also influences the local and regional traffic and contributes to increase congestion in the corridor, since much of the infrastructure is used for both international and local (commuter) traffic. This is also relevant when considering the priority of the rail network, where an increase in the international freight trains will take capacity from the local and regional commuter trains. The current (2013) long distance traffic in the three parallel corridors is shown in Figure 1-5 as number of travelers (person transport) and ton (freight) in the three corri- 2 Povl A. Hansen (2013): The Green STRING Corridor and transport development. Roskilde Universitetscenter and Green STRING Development 3 STRING (2012): Bottlenecks in the infrastructure between Scandinavia and Central Europe. 15
16 dors. The figures only include long distance traffic and not the significant amounts of local and regional traffic undertaken in the three corridors. Moreover, only the direct traffic from Jutland to Germany, which may be shifted to the STRING corridor is included. Hence, the included long distance traffic is the traffic between Scandinavia and Germany, which may be influenced by a fixed Fehmarn Belt link and the figures are similar to those used by Femern A/S (2012) in the EIA analysis. For long distance freight the Jutland and the Baltic corridors are larger than the STRING corridor with 10 and 15 million ton respectively being moved on rail and road, where the STRING corridor is a channel for approximately 5 million ton. For person transport the Jutland and the STRING corridors are almost of the same size with 7 and 6 million travelers respectively. The Baltic corridor is mainly a freight corridor and the traveler numbers are lower at 2 million travelers. Figure 1-5: Long distance freight and person transport in the Jutland, STRING and Baltic corridors. Source: Femern A/S (2013) and own calculations. The distribution of traffic related CO₂ between road, rail and sea are shown in Figure 1-6. The traffic is strongly dominated by road transport (lorries and passenger cars). The figures do not include sea transport although the amount of freight on ships in the corridor is significant. However, most of this traffic is either passing through Great Belt or Öresund without visiting any of the ports in the corridor. There is also a significant amount of sea transport, which arrives or leaves a port in the corridor, but much of this traffic is not considered as traffic running parallel to the land based infrastructure 16

17 in the corridor. Only feeder traffic between ports in the corridor and Hamburg port is considered relevant for the current study. 1% 2% 0% 20% 1% 0% 1% Passenger cars Busses Walk-ons Passenger trains Lorries Freight trains 75% Combi trains Ferries Figure 1-6: Distribution of CO₂ emissions from long distance traffic between on different modes of transport in Source: Femern A/S (2013) and own calculations. Source: COWI Media library 17

18 Jutland corridor 2 IDENTIFICATION OF GAP The purpose of this chapter is to estimate CO₂ emissions from long distance transport in the corridor in 1990 and 2030 to give an idea of the CO₂ emissions gap if present trends continue and no further initiatives are taken beyond the already taken. The gap between the CO₂ targets defined as 30% 4 reduction of 1990 emissions in 2030 and the projected emissions in a business as usual scenario for the Green STRING corridor is calculated based on a set of basic conditions and assumptions as described below. Basically the calculations include all passenger traffic and freight transport between Scandinavia and continental Europe potentially passing through the STRING corridor. Hence, all routes and modes between Scandinavia and continental Europe potentially passing Fehmarn Belt are considered. This implies that long distance traffic in the three parallel corridors defines in Section 1 are included in the calculations. Any change in traffic and emissions caused by changes in the STRING corridor are included in the calculations. Figure 2-1: Three parallel corridors with traffic being influenced by changes in the STRING corridor. 4 The 30% reduction is chosen as an intermediate target onto the 2050 EU target of 60% reduction. The target is following the reduction targets set out by the three STRING countries (see Figure 1-2). 18
19 2.1 TWO SCENARIOS The gap in CO₂ emissions for 2030 is defined between two alternative scenarios: The business as usual scenario which comprises long distance traffic in the STRING corridor and the traffic in the two parallel corridors (Jutland and Baltic) also being part of the Scan-Med corridor. This traffic is potentially possible to shift to the STRING corridor as a result of changes in the infrastructure. The scenario includes the already planned changes to the current infrastructure as well as improved technology and reduction of CO₂ emission factors assuming enforcement of the EURO VI norm. The green STRING corridor scenario, which uses as basis the CO₂ emissions calculated on the basis of traffic in 1990 and using CO₂ emission factors as in 1990 and then implying a reduction of 30% to be reached by year The traffic included in the scenario is traffic in the three parallel corridors (Jutland, STRING and Baltic), which is potentially affected by the infrastructure changes in the STRING corridor. The impact may be due to changes in mode of transport, trips diverted to the STRING corridor and new trips being generated. The traffic and the CO₂ emissions derived in the two scenarios are calculated and described in Section 2.3 and 2.4 respectively. The background for the calculations is described in Section PREDICTING TRAFFIC IN THE STRING CORRIDOR SCENARIOS In the past decades different projections of traffic in relation to the STRING corridor has been prepared. These projections give different aspects of the development in the corridor. For example does each of the three involved countries produce forecasts of national traffic and forecasts have also been produced by regional authorities. In addition specific forecasts and descriptions of traffic have been developed for other corridors, where the STRING corridor constitutes parts of these other corridors (e.g. the COINCO corridor between Oslo/Stockholm and Palermo and the East-West transport corridor). Common for all of these predictions are that they do not cover exactly the same geographical area as the STRING corridor and the delimitation of the relevant traffic is also differing from the traffic included in the present study (only long distance transport). The traffic used in the calculations includes the ferry routes shown in Figure 2-2. Included is also traffic passing Great Belt Link or Öresund Link between Scandinavia and continental Europe, which is a potential source of traffic passing Fehmarn Belt in the future. 19
20 Used sources and background information It is chosen to estimate the gap taking advance of the traffic forecasts and greenhouse gas emission inventory prepared as part of the Environmental Impact Assessment (EIA) of the Fehmarn Belt fixed link in To adjust the calculations other main sources have been used: VVM redegørelse, Den faste forbindelse over Femern Bælt, Sammenfattende rapport (the EIA summary report). Issued of Femern A/S in June 2013 and background documentation including details of emission and traffic forecasts: Fehmarn belt fixed link, Greenhouse Gas Emission Inventory, Final Report, E6TR0221 prepared for Femern A/S by COWI in June 2013 Fixed Link across the Fehmarn Belt Effect on Emissions to Air Prepared for Danish Ministry of Transport and Energy and Bundesministerium für Verkehr, Bau- und Wohnungswesen prepared of COWI in cooperation with DMU in March 2005 Fehmarn Belt Forecast 2002, Reference Cases, Supplement to final Report of April 2003 prepared by FTC Fehmarnbelt Traffic Consortium in November 2003 Fehmarn Belt Forecast 2002, Final Report prepared for Trafikministeriet, København and Bundesministerium für Verkehr, Bau- und Wohnungswesen, Berlin by FTC Fehmarnbelt Traffic Consortium in April 2003 Traffic and transport between Jutland and the rest of continental Europe and traffic between Sweden and Zealand are not considered, as this traffic is not diverted to Fehmarn Belt in any of the scenarios considered. 20

21 Figure 2-2: Ferry route connections between Scandinavia and the European continent around the STRING corridor in Source: Fehmarn Belt forecast (2002) METHOD FOR CALCULATING LONG DISTANCE TRAFFIC IN THE CORRIDOR Femern A/S has in 2013 revised the Environmental Impact Assessment (EIA) for the fixed Fehmarn Belt link. This assessment included traffic in the three corridors outlined above with potential for shifting route to the STRING corridor. As part of the EIA Femern A/S calculated the changes in traffic with and without the fixed Fehmarn Belt link, including changes happening in the three parallel corridors. Hence, the EIA estimates are thus used as the basis for estimating traffic and CO₂ emissions related to the STRING corridor. The EIA calculates traffic for a 2012 basis and a forecast of traffic after the fixed Fehmarn Belt link is established and takes into consideration the land based changes in infrastructure in all three parallel corridors. In addition the specific accounts of traffic on the Fehmarn Belt in 1990 are obtained from official statistics. The EIA includes only long distance traffic, which may be influenced by the Fehmarn Belt link. This includes 21
22 the transit traffic from Norway and Sweden using either the Jutland or STRING corridor, the traffic from Sweden using ferries to Germany, and to some extent traffic from Jutland to Germany across the Fehmarn Belt. Hence, the figures used do not include local and short distance traffic between Jutland and Germany. There is no account of the traffic changes for the two parallel corridors considering only the long distance traffic. To find traffic in 1990, we therefore use the realised traffic growth generally in Denmark to adjust the figures from the EIA. The same procedure is used to predict the future traffic flows. The long distance traffic in the STRING corridor must pass the Fehmarn Belt. The distance from e.g. Copenhagen to Hamburg is approximately 300 km. Hence, it is not possible to have distances exceeding 300 km. in the corridor without it passing the Fehmarn Belt. Hence, estimations of traffic on the Fehmarn Belt for 1990 and 2030 are used as sufficiently accurate figures for the long distance traffic related to the corridor. Almost all freight traffic on the Fehmarn Belt is above 300 km. It is an insignificant amount of freight traffic that crosses the belt with origin and destination under 300 km. Hence, freight traffic assessed for the corridor is used for calculating the corridor s traffic. The traffic included in the EIA includes both short and long distance passenger traffic potentially passing Fehmarn Belt. There are no publicly available sources giving accurate figures for the origin and destinations of the passengers on Fehmarn Belt. Hence, it is necessary to make expert judgements to deduct the short trips. In the market study for an improved railway service in the corridor (COWI 2014a, for the Green STRING corridor project) figures for the number of short distance railway passengers has been estimated. These figures are applied to give an estimate also for the bus and car passengers. Short distance passenger traffic on Fehmarn Belt only contributes with an insignificant amount of CO₂ The passenger traffic on the Fehmarn Belt is assumed to include 10-20% short trips below 300 km, where this estimate is based on the mentioned market study (COWI, 2014). The short trips are assumed mainly to be border shopping trips and partly walk-on passengers. There is also some short distance trips for business purposes between cities in the regions close to Fehmarn Belt. The numbers are small, though based on the estimates made in COWI (2014a). Assuming 15% of the passenger car traffic on Fehmarn Belt is short trips of 100 km. The average emissions from short distance passenger traffic are estimated to be less than 1% of the total emissions. This is less than other uncertainties in the assumptions and therefore no adjustments are made to exclude emissions from short distance traffic from the calculations. 22
23 2.2.2 EMISSIONS FROM VEHICLES ARE DECLINING The emission factors in the business as usual scenario are assumed to be lower in 2030 compared to 1990 and compared to the present emissions factors, because of technological development in motor technology and cleaning of emissions. Emission factors as assumed in 2030 in the business as usual scenario are based on assumptions that nearly all vehicles (93% of lorries) have been changed after enforcement of the EURO VI norm. Emission factors were 10-20% higher in 1990 compared to the assumed factors for The traffic forecast includes several modes of transport including details of origin and destination allowing estimation of distances driven in each scenario. The transport volumes and distance driven on each transport mode are used to estimate the CO₂ emissions. These figures are determined in the Femern A/S EIA report. CO₂ emissions from ferries have been addressed in comprehensive analyses as part of the EIA process and as documented in the EIA reports. The only changes that have been included in the calculations here are the termination of ferries on the Rødby- Puttgarten link and increased number of ferries on the Sweden-Germany connections. 2.3 GREEN STRING CORRIDOR CO₂ EMISSION TARGET FOR 2030 To establish the Green STRING corridor scenario, we must first calculate CO₂ emissions in The travellers and freight passing Fehmarn Belt in 1990 are shown in Table 2-1. The figures are as explained above representing the traffic in the STRING corridor. The total traffic on the parallel corridors and the distribution between the Jutland corridor and the Baltic corridor are also shown in Table 2-1. The distribution is the consultants estimate on basis of historic and present traffic statistic and on basis of Femern A/S surveys and forecasts. As outlined above, the traffic on the Fehmarn Belt includes all the relevant long distance traffic related to the STRING corridor. Table 2-1: Long distance traffic 1990 in the three corridors with potential to be diverted to the STRING corridor. via Jutland Corridor STRING Corridor Baltic Corridor Total Travellers 1,000,000 7,800,000 2,000,000 10,800,000 Freight (ton) 2,100,000 5,700,000 15,000,000 22,800,000 Source: Statistics Denmark and consultants estimate The estimated CO₂ emissions in 1990 are shown in Figure 2-3. Most of the emissions are caused by lorries (50%) and passenger cars (35%). The total CO₂ emissions to be used are 2.1 million tons. 23
24 Green STRING Corridor CO₂ emission target for 2030 This means that the Green STRING Corridor CO₂ target to be achieved by 2030 is 1.4 million ton CO₂ Figure 2-3: CO₂ emissions per transport mode for Includes long distance traffic for all three corridors. Source: Own calculations. 2.4 TRAFFIC AND CO₂ EMISSIONS IN THE BUSINESS AS USUAL SCENARIO The transport across Fehmarn Belt in 2030 and the total transport including all traffic potentially diverted to Fehmarn Belt are as shown in Table 2-2. As described above the figures are derived from the EIA report from 2013 and are representative for the long distance transport in the STRING corridor and the relevant transport in the three parallel corridors. The distribution between the three parallel corridors are the consultants estimate on basis of historic and present traffic statistics and on basis of Femern A/S surveys and forecasts. Table 2-2: Long distance traffic 2030 in the three parallel corridors with relevance for Fehmarn Belt. via Jutland corridor STRING corridor Baltic corridor Total traffic Travellers 7,300,000 12,700,000 4,000,000 24,000,000 Freight (ton) 4,500,000 19,600,000 35,000,000 59,100,000 Source: Femern A/S and consultants estimate The traffic estimates include the effects of a new fixed Fehmarn Belt link, the planned improvements in the rail infrastructure in the STRING corridor as well as the planned 24
25 changes in the road infrastructure both in the corridor and in the competing corridors (Jutland and Baltic corridors). Moreover, the changes in the different ports and land based terminals which are planned for the period up to 2030 are also included in the calculations. The major changes of route of especially freight are caused by the opening of the Great Belt Fixed Link in and the assumed opening of Fehmarn Belt Fixed Link in The resulting estimate of how the passenger and freight traffic is assumed to increase and be distributed between routes in the corridor in 2013 and 2030 are shown in Figure 2-4 and Figure 2-5 Figure 2-4: Estimated long distance passenger traffic in 2013 and 2030 (million. travellers per year). Source: Femern A/S and own calculations. 25

26 The different transport modes considered, the estimated transport volumes (Vehiclekm, Passenger-km and Tonnes-km), the assumed future CO₂ emission factors and the estimated CO₂ in the 2030 business as usual scenario are all shown in Table 2-3. The total CO₂ emission from long distance transport in the Öresund-Hamburg corridor is estimated to 4.5 million ton in 2030 in the business as usual scenario. In the business as usual scenario the Fehmarn Belt Fixed Link is assumed to open in 2021 as planned. In the business as usual scenario emission factors are assumed to be less than in 1990 and less than current (2014) emissions factors because of initiatives already taken is assumed to be effective before This includes e.g. the introduction of EURO VI vehicles and new energy efficient vehicles gradually through to Figure 2-5: year). Estimated long distance freight transport 2013 and 2030 (million. ton per The total CO₂ emission from long distance transport in the Öresund-Hamburg corridor is estimated to 4.5 million ton in 2030 in the business as usual scenario. 26
27 Table 2-3: CO₂ emission in 2030 in the business as usual scenario Mode of transport Unit Value CO₂ (g/km) CO₂ (t/year) Passenger cars Vehicle-km 4,786,000, ,000 17% Busses Vehicle-km 82,000, ,000 1% Walk-ons Passenger-km % Passenger trains Passenger-km 1,609,000, ,000 1% Lorries Vehicle-km 4,698,000, ,111,000 69% Freight trains Tonnes-km 19,556,000, ,000 7% Combi trains Tonnes-km 4,082,000, ,000 1% Ferries 161,000 4% Total emission 4,530, % Source: Femern A/S and consultants estimate 69% of the CO₂ emissions in 2030 are assumed to be from freight traffic by lorries. To achieve major reductions in CO₂ emissions it is therefore important to reduce emissions from freight traffic by lorries. The figures for the business as usual scenario is further shown in Figure 2-6. It is quite obvious that the shift towards a 30% share of long distance transport on sea and rail is challenged by the expected heavy use of road. Freight transport Person transport 100% 90% 89% 100% 90% 88% 80% 80% 70% 70% 60% 60% 50% 50% 40% 40% 30% 30% 20% 10% 0% 9% 2% 20% 10% 0% 6% 6% Lorries Freight trains Combi trains Passenger cars Busses Passenger trains Figure 2-6: CO₂ emissions in 2030 in the business as usual scenario for freight and person transport. Source: own calculations. 2.5 THE CO₂ GAP The total CO₂ emissions in the corridor in the business as usual scenario are estimated to 4.5 million ton in 2030 as shown. The Green STRING Corridor scenario is aiming at 1.45 million ton in This significant gap is illustrated in Figure 2-7, which further shows the development of the gap since

28 CO 2 (Mill. ton/year) 5,0 4,5 4,0 3,5 3,0 1.6 mill. ton 2,5 2,0 1,5 1,0 0,5 0, Fehmarn Belt 3.1 mill. ton Business as usual scenario Green String Corridor scenario Figure 2-7: The gap between the business as usual and the Green STRING Corridor scenarios in total CO₂ emissions. Source: Own calculations. The gap in 2030 is approximately 3.1 million ton CO₂ per year, which corresponds to that the business as usual level is three times higher than the target set out in the Green STRING Corridor scenario. The gap has widened almost ever since 1990 and was already in 1990 at 1.6 million ton. The size of the gap is large and calls for significant action The development in the gap is mainly caused by the significant increases in road traffic in the corridor and it is driven by the economic growth, which raise demand for transport at an almost identical pace. The business usual development includes changes in the vehicle and fuel technology that has happened over the past decades. But even with the improved lower emission factors this has only led to slight decreases in the trend. The CO₂ emissions related to traffic on the three parallel corridors that were calculated for the Green STRING corridor scenario and the business as usual scenario are compared for the different modes of transport. The comparison is shown in Figure 2-8. It is for this illustration assumed that all modes have to reduce CO₂ emissions by 30% in 2030 compared to 1990 levels. In reality there is nothing mandating that this should be the case. It is chosen here for illustrative purposes. It is obvious from the figure, that the main challenge in the future is how to reduce the gap for lorry traffic, where the gap is very large as a consequence of the significant increase in freight transport through the corridor following the opening of the fixed Fehmarn Belt link. 28
29 Figure 2-8: The CO₂ emissions for each mode calculated for 2030 under the two scenarios. Source: Femern A/S and own calculations. 2.6 ADRESSING THE GAP Long distance transport as addressed in this project is not the only source of CO₂ emissions in the corridor. Emissions from local traffic and transport in cities, internal traffic and transport in the Öresund region and in northern Germany including Hamburg are in the same scale or even higher. In the broader perspective it is also required to reduce CO₂ emissions from local traffic and transport where the major source of emissions is from passenger cars. 69% of the estimated CO₂ emission is from long distance freight transport by lorries why initiates to reduce emissions from lorries are needed if to close the gap. The improvement of the rail infrastructure in the STRING corridor leads to an important extension of the capacity and a shift towards further use of rail will contribute to a reduction in the gap. For example can a reduction up to 325 kg CO₂ be achieved if a 40 ton lorry freight transport between the Öresund and Hamburg regions is moved to railway (based on average emission factors in TEMA2010) CAN CHANGES IN RAIL CAPACITY ACCOMMODATE A 30% MODAL SHARE There has not been made any concrete assessment of how the planned improvements of the rail infrastructure in the STRING corridor contribute to expanding the capacity. However, it has been assessed that the improvements will lead to better possibilities to run trains with different speeds (enabling trains to overtake each other), the expansion and renewal of the ERTMS (signaling system) will increase capacity and that the 29
30 higher speed also will add to this. Moreover allowing the operation of 1000 meter freight trains (compared to 750 meter maximum length today) also will lead to more trains running. However, Banedanmark (The Danish rail infrastructure administrator) has assessed that after the opening of the fixed Fehmarn Belt link and the other improvements, we can expect more than a tripling of the number of trains in the corridor. It is not indicated by Femern A/S in their EIA whether the rail capacity is fully used in the expected traffic in To get an idea of how an increased capacity can change the distribution on modes, a calculus example is presented in the box below. This example indicates that a tripling in the use of rail transport (for the entire trip) then the modal split change will contribute significantly to ensure a rail and sea share of 30% on long distance freight transport. The example is merely a simplified illustration of a potential and cannot exactly show the model split impact. It is nevertheless an indication of the gap in offered capacity in order to fulfill this modal split target. Example: an assessment of how increased capacity can lead to a better modal split To answer the question: can future rail infrastructure accommodate the necessary changes toward a 30% long distance freight transport on rail we have made a simple calculus example. Assume that the trains in the business as usual scenario are tripled. Let us also assume that the increase in freight trains CO₂ emissions can be removed from the lorry transport to represent the reduction in road transport. Measured in terms of CO₂, we get the following distribution of total CO₂ in the corridor in 2030 in the Business as usual scenario and if the capacity is fully used: Business as usual scenario (ton CO₂ and share are shown) Freight trains % Combi trains % Lorries Freight trains Combi trains Lorries % 30
31 Rail transport is tripled (ton CO₂ and share are shown) Combi trains % Freight trains % Lorries % In the calculations it is assumed that capacity is tripled all along the entire trip that the vehicles undertake (e.g. also outside the STRING corridor. The example does not represent an exact capacity computation, but illustrate what increase in the infrastructure is required to have a potential to accommodate the long distance freight transport. We must also note that the calculation does not reflect any reduction in CO₂, which is also happening if use of trains is tripled in combination with a reduction in lorry transport. The analyses of the gap and the example on how much rail transport must be increased to fulfill the 30% rail transport share in long distance transport makes it clear that initiatives to change engine technology and propellant, and other initiatives to reduce emissions from lorries are needed to close the gap KNOWN APPROACHES TO REDUCE CO₂ EMISSIONS There exist already a number of ways to reduce the CO₂ emissions. The following proposals outline initiatives and solutions with the ability to support a further greening of the STRING corridor. Only some of the most innovative solutions of traffic systems that take advantage of an upgraded infrastructure in the STRING corridor, and at the same time are considered realistic for future implementation are presented. These solutions all have a potential for reducing CO₂ emissions and to contribute to a modal shift towards especially rail transport. The solutions are: Improved intermodal shuttle train services including the parallel need of expanding terminal capacity in all three countries involved. Focus is on development of major transit flows, i.e. the Swedish-German long distance routes, where different rail undertakings are already in operation. One ex- 31
32 ample is the 50 weekly shuttle trains between Norway/Sweden and Duisburg. A problem is that rail capacity has not developed enough to meet the demand for these shuttle trains. Hence, this may benefit from increasing the capacity. Coordinated planning of ports and dry ports. There is a need for increasing the focus on improving accessibility to and from the port of Hamburg and coordination with the ports and dry-ports in the corridor. Today there is a significant bottleneck in and out of Hamburg port on both road and rail. Currently, container traffic from the large overseas ship is distributed to and from Hamburg with a high degree of railway shuttles towards the German market and the east European countries. In contrast, railway traffic between Hamburg harbour and the Öresund region is remarkable low. This can be improved by connecting the port of Hamburg with the terminals in the STRING corridor to handle the distribution of the containerised goods around in the region. Similarly the ports and terminals in the region can increase efficiency by working closer together and ensure that e.g. trains are operated between the ports and the dry-ports (intermodal terminals) in the hinterland to facilitate as easy an access to the trains as possible. Moreover, this will possibly also increase the utilisation of the trucks operating out of the terminals and ports. This may require significant public support since the actor traditionally are not working together, but focus more on their own operation. Terminal capacity. The capacity and access to the terminals are limited. The large operators in the logistics industry typically operate their own truck terminals and are not immediately willing to open up for competitors. There are a tendency also to monopoly operators of the rail based terminals, which is dominated by GreenCargo and DB respectively, which tend to favour own operations and according to stakeholders in the logistics industry are not very flexible towards other operators and the potential clients. The terminals have a potential to support cooperation between many smaller transport providers. In relation to the ports there is also a strong need for terminal operations. This could be as dry ports as well. The operation of these terminals and the efficiency of the ports can be improved by a further strategic cooperation between the ports, where the capacity in the different ports is used. An example of this is the Copenhagen-Malmoe port. Similar cooperation could be a case for Lübeck together with e.g. Danish ports or together with Hamburg port. There is some CO₂ potential to be gained from this, but there is naturally many barriers that prevent competitors in the industry to start cooperating. Modular trucks. The proposal from the hauliers and industry to extend the allowed route network for Long LKW, the modular trucks, should be consid- 32
33 ered. The Scandinavian experiences with the large truck are rather positive. The results indicate significant CO₂ reductions and reductions also in number of vehicles. The permitted network is limited in Denmark and it is almost non-existing in Germany. Moreover, it is not possible to drive a modular truck across the Danish-German border due to regulation today. The expansion of the network to allow the trucks to drive on more of the infrastructure and to drive closer to the senders and receivers of goods in urban areas can contribute rather much to reducing the CO₂ from road transport. There are aspects that need to be further addressed (such as traffic safety in and around denser populated urban areas etc.). Double tracks. Some of the other important bottlenecks are on the two bridges (Fehmarnsund Brücke and Storstömsbroen) and the single tracks along the main part of the corridor especially in the German part of the corridor. This reduces flexibility and speed of the trains and therefore is leading to a lower level of rail demand than there is a potential for. The removal of the bottlenecks requires significant investments and it is not straight forward to implement it. However, the impact on CO₂ may nevertheless be measurable. Rollende Landstrasse (RoLA). An opportunity to base freight flow on and support reduction of CO₂ as well as increasing the modal share for rail is the introduction of Rollende Landstrasse, RoLa, also called Lorry train, as a new way to reduce the load capacity of the road network and congestion in the major city areas. The concept is quite successful in the alpine crossing in Switzerland and Austria. The Fehmarn Belt and Öresund connections can be thought of as similar natural barriers to transport, where the concept of RoLa could be introduced. The concept needs building of supporting infrastructure which is easily accessible. This could be in relation to some of the terminals further away from the Fixed link (e.g. the intermodal terminal in Høje Taastrup). If fully implemented the impact may be significant, but it requires some mandatory public requirements in order to induce the logistics industry to start using it. Auto-zug. A similar concept exists for passenger cars (auto-zug). This is also used in the alpine regions with some success. However, the potential is limited compared to the RoLa, since it is somewhat more time consuming and is also mainly of interest for very long distances. Improved fast trains or long distance high speed trains (mainly for passengers) in combination possibly with a dedicated Fehmarn Belt regional express taking lessons from the Öresund into account is a possibility that can be considered. There have been an interest via DB-DSB, which today oper- 33
34 ates the long distance diesel version of ICE, and the Swedish SJ has announced a clear interest to go into commercial traffic on the line at the same time as deciding upon a major upgrade of all X2000 enabling them to run through Denmark and across the Fehmarn Belt to Germany. This high speed train has a significant potential to increase the number of rail passengers and can attract travellers from both road and air. In COWI (2014) the market potential for such a scheme is analysed. The CO₂ potential can be rather large depending on the specific design, however, some investments and decisions must be taken, which can be hard to overcome, especially since increasing the number of passenger trains may influence the potential for running more freight trains in the corridor. LNG infrastructure. An increased use of alternative fuels in transport; i.e. gas for freight transport and electric vehicles for passenger cars and in the future hydrogen technology; aiming at creating a corridor for liquefied natural and biogas in the corridor with infrastructure established at strategic ports and dry-ports. The maritime industry is already operating ships using LNG (liquefied natural gas) and some ports have installed refuelling infrastructure (Nynäshamn, Stavanger) and several others are considering LNG (e.g. Hamburg and Gothenburg). If this is combined with access for lorries running on LNG, there is a considerable potential or a shift in fuel. The CO₂ potential is large, if natural gas is interchanged with biogas. There are many issues still to be resolved, though. The costs of the infrastructure are very high and there is yet only demonstration LNG trucks being tested. Moreover, the availability of biogas is still debated and depending on where the biomass material is sourced from. The list is as mentioned not exhaustive and there are naturally other initiatives and solutions that can add to the implementation of the green corridor. However, the effects of these are expected to inferior compared to the solutions in the list. We have not made any strict calculation of the magnitude of the CO₂ potentials, but have made a subjective assessment based on the discussions represented above. We have also made an assessment of how easy it is to implement the discussed solutions. These assessments are shown in Figure

35 Figure 2-9: Assessing CO₂ potential effects and implementability of different initiatives and solutions. Source, own assessment. The different suggestions illustrated in the figure will if implemented have a significant CO₂ impact. However, there are limitations in the quantity that can be achieved. The suggestions are mainly addressing the behaviour of the logistics sector and they most likely cannot close the gap. This is illustrated in Figure CO 2 (Mill. ton/year) 5,0 4,5 4,0 3,5 3,0 2,5 2,0 1,5 1,0 0,5 0, Fehmarn Belt Business as usual scenario Range of additional CO 2 reductions Green String Corridor scenario Figure 2-10: Indication of the contribution of closing the gap from the discussed solutions. Source: own assessment. As indicated in the figure there is still a long way to go to fulfil the translated green corridor targets with respect to CO₂ emissions, and even with the potential initiatives more must be done. 35
36 3 BUSINESS GAINS AND POTENTIALS In this chapter we explore the potential for CO₂ reductions within main sectors in the STRING corridor while at the same attain business gains. Several business sectors can potentially gain from the opening of the fixed Fehmarn Belt link. Shorter transportation time will move northern Germany closer to the Scandinavian companies and thereby increase the business area for many businesses. To gain information about how the green corridor can generate business gains and potentials and how firms can contribute to achieve the CO₂ goals opportunities arising from the new infrastructure has been explored and discussed with a selection of stakeholders in the corridor. 5 The two main hypotheses are a) A green corridor may give businesses a chance to exploit new possibilities opened by the implementation of a green corridor. b) Businesses can contribute to CO₂ reductions through organising their transport and logistic solutions. The inputs from the dialogue with the stakeholders have been used as inspiration for the following sections, but the section is not as such a discussion of their positions. Other sources such as existing case studies and companies in relation to these hypotheses have also been taken into consideration (e.g. the cases investigated in Oxford Research and the analysis of the Greater Capitol Region as an international transport hub (COWI, 2014)). In Oxford Research (2012) there is a discussion of the concept of green corridors. Following an interpretation laid out by the Swedish government, this has been adapted to the STRING corridor in the report. The seven elements that can contribute to forming a Green STRING corridor are outlined in the box below. 5 The stakeholders interviewed include DI Transport, Lidl Denmark, Junckers, Novozymes, DB Schencker, Kuehne & Nagel, UPS as well as participants in the Green STRING corridor project and stakeholders participating ion events happening during the preparation of this report. The analyses and conclusions in this chapter are those of the consultants and do not necessarily represent the views of the interviewed stakeholder. 6 Oxford Research (2013). Environmental effects of a Green STRING corridor. Report prepared for the Grenn STRING corridor study. 36
37 Seven overall ingredients to constitute a green corridor: 1. Efficient logistics; focus on continued reductions in emissions and safety as well as on efficiency. 2. Intermodal transport. Support infrastructure to encourage cooperation and the use of alternative fuels. 3. Harmonised regulations with openness for all actors to a network of transport corridors. 4. Concentration long distance transport of national and international freight traffic. 5. Strengthened terminals for both intermodal and within mode transshipment. This entails coordination with local and international infrastructure systems. 6. A platform for innovation. Facilitate the possibilities to develop and demonstrate new systems and technology. 7. Local and regional embedment. In this chapter these different elements have been used as inspiration to identify potential contributions to closing the gap found in Chapter 2 and to find ways in which businesses can exploit the implementation of the green corridor. 3.1 SECTORS BENEFITTING FROM A GREEN CORRIDOR The different business sectors which are particularly represented in the corridor are those which may have significant changes in opportunities for business gains and CO₂ reductions. E.g. Oxford Research (2013), and Jacobsen and Wewstädt (2012) have discussed the main business sectors and clusters in the STRING corridor FOOD SECTOR Trade between two specific areas is more likely to take place when distances are short between the areas. We for example experience this when we look at trade between end-user/consumer markets and specialised food distributors (as well as different agriculture sectors). But can flows of consumer goods like food products become greener 7 Björn P. Jacobsen and L.ars Wewstädt (2012). Business Clusters in Lübeck, Ostholstein and Zealand. BELTTRADE 37
 is the breakthrough for healthy living and organic products significantly greater than in Germany.")
38 in the form of an "organic profile" if the time distances decrease; - empirical findings give some indications to this. 8 In Denmark (especially in Eastern Denmark) is the breakthrough for healthy living and organic products significantly greater than in Germany. Danish consumers buy twice as many organic items (per capita) as in Germany and Sweden. Organic production has increased tenfold in 8 years. There will still be a huge growth in this area. Germany's food trade with Scandinavia is annually about 9 billion. Denmark is a net exporter to Germany while the rest of Scandinavia is a net importer from Germany. It is particularly close to the Danish-German border (especially the Jutland-German border) trade has a relatively larger share of the total export volume. Around threequarters of the total Scandinavian food trade is going on between Denmark and (North) Germany. This trade is rather transport-intensive. Exports from Germany include agro-industry, feed for farm etc., while Denmark produces many meat and dairy products - often bio organic. 8 years ago, Denmark's organic sales to Germany reached 16%, but now German consumers consume almost 50% of all Danish products as organic products. The fresh organic goods intensify the need for a fast and reliable transport. The green standard of living involves higher production quality, and thus setting higher environmental specifications for logistics, leading to higher costs. The future society where consumers demand an increasingly healthy life in the region Source: COWI Media library will mean that the supply chain must be optimized environmentally and not just in terms of cost efficiency. Therefore it seems that the market is changing towards a willingness to pay for organic products and a green lifestyle with recognized higher costs but also higher consumer satisfaction. Citizens in the region constitute a high-productive workforce based on smart and highly educated performance culture. Danes and Swedes in the Öresund region and the citizens of the metropolitan region of Hamburg in many ways share the vision of a good and healthy life, while a relatively high consumer and purchasing power (GDP per capita) means that the preconditions for the development of the green corridor in this 'organic aspect' actually present. A 8 Landbrug & Fødevarer: Økologiens muligheder for vækst og eksport. yqk 38

39 willingness to pay more for higher quality of basic food is a driver for this development which in turn could justify a trade flow and transport structure with higher rates if transport of commodities can be produced in a more green way with low CO₂ emissions, etc. A larger critical mass can be achieved when the fixed link opens, since the transport costs from the producers to consumers is reduced. Of course, this will also lead to increased competition, but there is also the opportunity to create greater cooperation between companies. A food network can be created in a form of clustering if the trade sector and the respective companies see a business model and can spot the advantage of being together making greater strength toward global competition. If the green approach to be acceptable to business associations in terms of increased costs, it will also be necessary to increase the benefit of scale production in the whole agro-industrial and food complex including more slim line and efficient transport logistics that can enhance the competitiveness of private business economy. Cooperation between the companies in this sector may not arise out of the blue. It is often necessary to facilitate the initial steps and bring together the relevant different companies. If the cooperation can lead to cost reductions and increased competitiveness there will not be a need for public support after the initial phase. Figure 3-1: The pharmaceutical industries and research institutions that form the Medicon Valley. Source: Copenhagen Capacity,
40 3.1.2 HEALTH CARE Health care is one of the major business sectors in the corridor. In Jacobsen and Wewstädt (2012) this sector has been recognised as one of the strong and large sectors and it has seen an increased growth since The sector includes both health care (e.g. home care services and increases in hospital services) and the production of health care products. The health care service sector has decreases in employment, whereas, growth is found in the production of pharmaceuticals. There are large companies in the pharmaceutical industry in the corridor in all three countries. Some of the world leading pharmaceutical industries are located in the region e.g. Novo Nordisk, Novozymes, Leopharma, Lundbeck, Fraunhofer, and Astra Zeneca and a number of smaller businesses that benefit from being located in the geographical cluster for example due to the knowledge sharing from the leading companies. The cluster is often termed the Öresund Medicon Valley as illustrated in Figure 3-1. The universities in the German, Danish and Swedish part of the corridor are large suppliers of advanced knowledge and employees into these industries. With the improved infrastructure in the corridor it becomes easier for these firms to benefit from the activities happening in the other parts of the region and cooperation is becoming easier. The sector is highly specialised and the produced goods are often high value goods, where logistics and transport are not the main cost elements. However, also this industry is focussing on competitiveness. There are a number of advantages by being located in the corridor. Mainly the relatively good infrastructure enables the businesses to remain competitive. Also the trade imbalance, where the corridor is net importing of goods (especially into the Danish part of the corridor) means that it is possible to get cheaper transport out of the region, which further increase competitiveness. Generally access to better terminal infrastructure and easier access to container and dry ports will enable some of the industries to further seek rail and sea transport. (e.g. Novozymes will be able to send more of its enzyme product using ship directly out of Kalundborg to the world market). 40
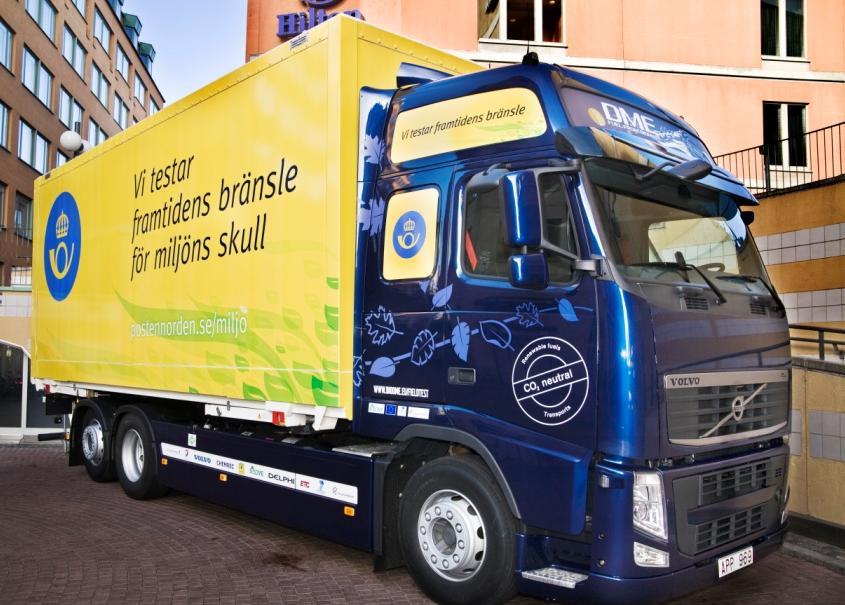
41 Specialised logistic cooperation The existence of the relatively large number of highly specialised businesses in the pharmaceutical cluster opens a possibility for further cooperation on the logistical side. For some of the companies there is a need for sophisticated logistics, which require special driver training, special equipment and possibly also high security. Due to the high number of similar needs, there is a greater market for niche transport providers aiming at servicing this special sector. Access to improved infrastructure, designed terminals etc. is an advantage that can benefit the pharmaceutical companies as well as the logistic supplier. Novozymes and Novo Nordisk have tried to coordinate their logistic need in e.g. Kalundborg, but due to still rather different needs did not continue any further. A way to support the pharmaceutical businesses in the direction of further logistic cooperation could be to initiate a project to identify similar and different needs to identify possibilities GREENTECH The industry in relation to energy engineering and construction in environmentally friendly buildings represents a distinctive and economically very large business area. Hamburg and Copenhagen are at the forefront of development as European Green Capitals. Both cities want to reduce CO₂ emissions and switch to renewable energy. Especially the big cities have the opportunity to influence the development towards a more sustainable future. The initiatives are well known in both cities where public transport is undergoing significant upgrading and expansion. In 2019, Copenhagen opens 19 new underground stations (Metro City Ring project) in addition to the existing metro lines. In Hamburg, the U-Bahn network and S-Bahn are being modernized as well. A strong field of competence is made up of wind energy business where the two largest global companies are German and Danish, i.e. Siemens Wind Power and Vestas. Previously, Denmark was dominant until Siemens acquired the Danish company Bonus Energy in order to get familiar with know-how and production methods in this field. We now have research and development departments in Copenhagen - including Risoe DTU - and at Siemens' headquarters in Hamburg. These core competencies together are capable of developing future energy supply systems including wind energy in the corridor holding a world class position. The authorities in the corridor are supporting and focussing on further use of alternative fuels in the public and private sectors; e.g. by public procurement demanding use of alternative fuels in the bus operations, sup- 41


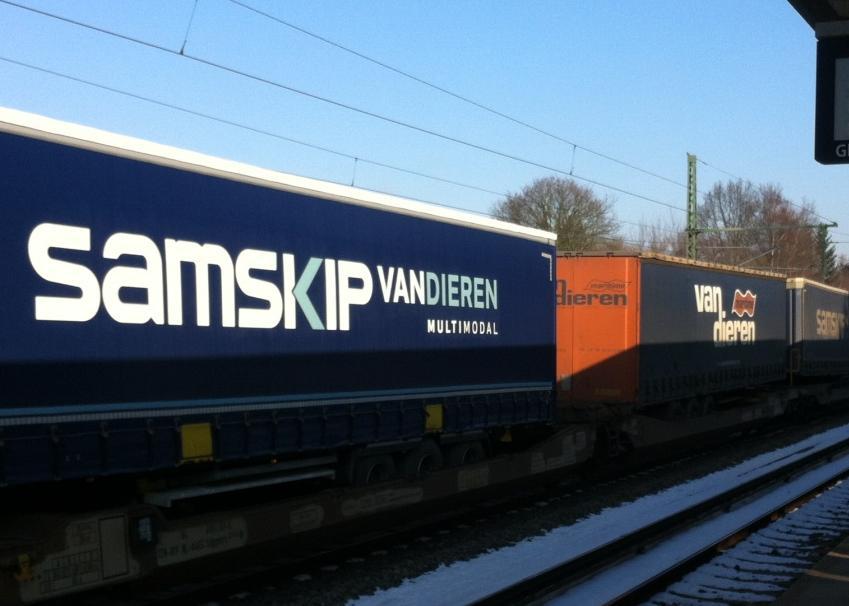
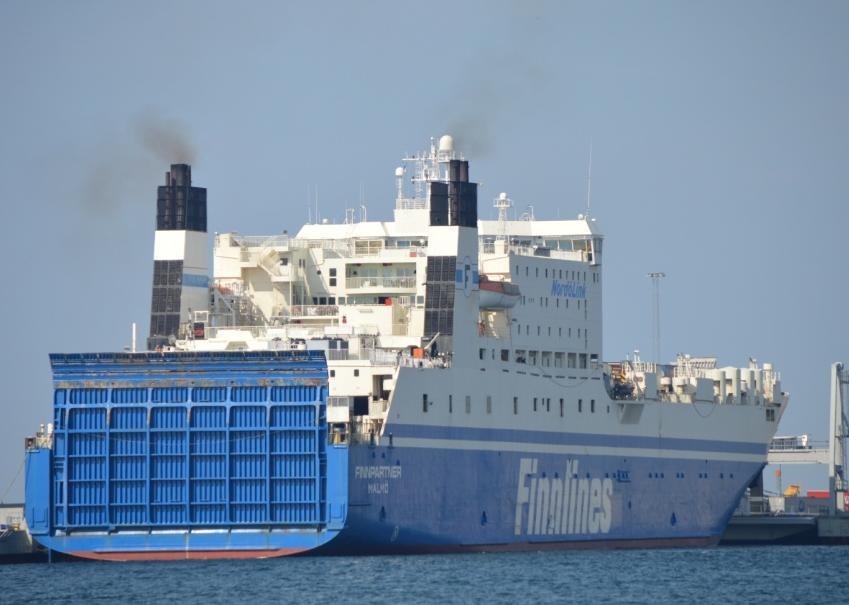
42 porting installations of public fuel and recharging infrastructure and participating in demonstration projects. Figure 3-2: Biogas is already used in the transport sector in Sweden and the large and increasing share of wind power in Denmark and Germany can support the transition towards an emission free private transport. Source: COWI media library. Strategically important greentech sectors are located in the region and can help create the foundation for greater self-supply in the corridor in the form of fossil-free energy production. A special competitive strength will be to develop the next generation of offshore wind turbines in 'mega size'. Currently, a greentech cluster is not really established although there is clear triple helix collaboration. The implementation of the Green STRING corridor has a potential to lead to the creation of larger and more formal collaborations and with greater involvement of many suppliers in the metal and electro-technical industry as well as construction and housing - mutually inspired by the implementation of the Green Corridor project. This may create a network of local suppliers to the major companies rather than importing from further away. This will tend to reduce demand for freight transport to and from the corridor. On the other hand there is also a risk that the industry will exploit the improved infrastructure to import from suppliers located further away. Increased production of renewable energy in the future is needed to make the entire corridor's energy supply green. Since, many of these greentech development businesses are already located in the corridor this creates a strong competitive advantage compared to other regions LOGISTICS Currently it is not easy to use the international rail line in the corridor between Scania and northern Germany. The freight trains run the 160-km-long detour through southern Jutland via the Great Belt. In terms of time and price freight trains seem competitive only on certain products and on certain lines. 42
43 The vast majority of traffic between Scandinavia and Germany is therefore carried out on the road network and often in combination with the ferries across the Baltic Sea. The transportation of goods from Scandinavia and central Germany to the remainder of Europe is handled with a certain volume on railway today. This characterizes the present performance and capacity of the railway system. By contrast, the short journeys are either based on trucks or feeder ship connections especially for distribution into/out of the port of Hamburg, Europe's 3rd largest, and is thus of great importance to southern Scandinavia. 30% of sea freight in the port of Hamburg is forwarded by rail - and Hamburg port expands its rail infrastructure leading to a potential increase to 50%. Today there is virtually no rail traffic from the port of Hamburg up to Scandinavia. If the birth of the corridor is equipped with only a single track line northbound, this will cause major restrictions on development opportunities for railway cargo and green perspectives. This particular situation will give special competitive advantages to the trucks in the corridor thus growing the number of lorries in central Hamburg. A potentially low level of ambition for railway investment on the German side of the Fehmarn Belt tunnel and a high level on the Danish side seem to be comparable to the situation when France and England were to establish the Channel Tunnel link. The English were not synchronized with respect to modernize the hinterland line, while the French took on a higher standard; long-term infrastructure investments. Several years later the UK finished a complete new line. Overall, the situation in Germany now seems to have similarities with the English approach in which the doctrine was that the British came to pay a large total price when the upgrade was split into several projects over many years. The logistics industry indicates that parallel to the existing DB Schenker Rail dominated freight service, the stakeholders want to establish strong alternatives, which increase competition. The prerequisite for operators is that the capacity of the railway line is to be found, and there must be terminals with sufficient capacity available. In the haulage industry and among service providers, many companies take advantage of an enhanced rail service if it is established from the outset in This concept could be based on block trains in regular timetables. Shippers therefore hope to avoid booking a freight transport with a railway undertaking well in advance. There is a wish for more flexibility like if the transport was carried out through the road part of the tunnel. Some of the forwarding companies deliver ship containers from the port of Hamburg to the customers in the Öresund region. Such containers could run on a freight train, 43

44 but price often settles at a high level on the railway. If the price is relatively low on the road transport, the result will be an increase in the number of trucks on the road network in Hamburg and on the A1 towards Denmark. Many forwarders have at their disposal trailers in different models at their disposal but only a smaller part can be used for rail transport i.e. can be lifted onto rail waggons. The concept is smart and is also used extensively in the context of a ferry transport. Focusing on the development of rail solutions can be a good idea since the authorities specifically consider the increase in Maut in Germany and the introduction of Source: COWI Media library some form of intelligent road toll for trucks in Denmark and Sweden. Incremental cost increases for dedicated road transport can be expected in the future. As a consequence, some of the logistics companies see a business opportunity in a new Rollende Landstrasse concept when the operator of such a rail service could be found and would accept the risk associated with the initial investments and start of operation. However, for many forwarding companies this new product is not considered to be a key mode of transport in the corridor, only that it can serve as an additional service to conventional freight by rail and the existing combined freight packages. For this alternative to be really successful in the STRING corridor, it has to be accompanied by regulation similar to the regulation in e.g. Switzerland where rail transport is mandated for many of the alpine crossings. The logistics sector has also indicated that the long modular trucks are something that they will be ready and happy to use further. This is indicated both by the transport providers and the transport buyers. There are some restrictions to the current use, which they think should be alleviated, as already described in Section 2. For example the possibility to drive closer to the end point of the deliveries closer to the urban centres or establishing better terminal structures for shifting to smaller distribution trucks. 44
45 3.2 FIRMS WANT GREEN TRANSPORT, BUT ONLY WHEN IT IS BENEFICIAL FOR BUSINESS In general, firms support the idea of making transport greener; however, the greening of the transport cannot lead to higher prices. Stakeholders in general believe that green transport will be attained by green fuels and technological innovation. Companies expect that in the future a greening of company profiles will become more significant due to increasing customer focus, and a greening of the transportation will follow. A more green responsible company profile cannot lead to a disadvantageous competitive state causing lower quality or higher prices than competitors', though. Stakeholders in general believe that green transport will be attained by green fuels and technological innovation. Shifting transport from trucks to other modes such as train or feeder ships will only account for a smaller share of green changes SOME SECTORS ARE ALREADY ADVANCING IN RAIL TRANSPORT The green corridor ambition set out in Section 2 is that 30% of long distance freight transport is shifted to sea or rail. As an overall target this is ambitious. There are a number of barriers deterring businesses from choosing rail. The lack of flexibility by the train undertaking companies as a main issue that many mention as a problem; secondly the rather inflexible travel planning and the rather similar prices across road and rail transport all have negative influence on the choice of rail. Potential markets for rail freight transport Freight by train is generally only relevant in specific markets. These markets are characterised by one or more of the following: transportation of the goods are flexible (e.g. fertilizers) it is too expensive to transport the goods by trucks (e.g. transport equipment); goods generally have a relatively low value (e.g. wood industry) the size or quantum of the goods is large (e.g. coal and corn) transport takes place over long distances (e.g. wood import from Russia) A strengthening of the intermodal infrastructure connecting the rail transport to road and sea is necessary to induce a shift towards rail. 45
46 There are companies, where further use of rail is considered beneficial. The wood floor producer Junckers is one such example. Example: Junckers industries (producer of wood floors) Junckers uses rail transport to import raw materials, and it is often considered the cheapest alternative. The production is in many cases such that a flexible in time frame for delivery of wood is possible. This means that the quantities can be rather large before a delivery. However, it is considered a problem, that the rail undertaking companies are not focussing on delivering the service that e.g. Junckers is asking for. Junckers considers it a problem that many of the rail freight terminals in the countries delivering wood are closed down (mainly in Eastern Europe and Germany, but also elsewhere). Some of the initiatives that can support an increased use of rail transport in the corridor are: Strengthen the intermodal infrastructure connecting rail with road and sea as also suggested in the 7 elements mentioned above (Oxford Research, 2012). This can be done both in the maritime ports and further expanding the intermodal dry-ports. Moreover, these terminals should be easy accessible for all operators and possibly also for some large transport buyers. Necessary to induce a shift towards rail e.g. through the pricing of freight rail trains with relatively lower prices compared to road transport. Increase flexibility by rail undertaking companies and the access for other operators to the infrastructure. This has been mentioned many times in the past years, also by some of the large logistic service providers. Prioritise freight on rail. Due to the focus on local passenger transport, the rail channels are often prioritised for passenger trains creating some difficulties for the freight trains. 46

47 3.2.2 BUSINESSES REACT TO COST SAVINGS In general the most important issue for the transportation companies and transportation customers is that a greening of the transport will not lead to higher costs relative to their competitors. There are a few examples of transport buyers that have a focus on the environmental impact of the transport services they use. Stakeholders indeed believe that, intuitively, when saving CO₂ it will often lead to lower transportation prices since a large part of the CO₂ reductions will stem from a more efficient use of fuels or by the introduction of a cheaper green alternative to fossil fuels. If however, CO₂ reductions do not lead to lower prices, the business sectors will not benefit from green initiatives as end-consumers allegedly do not care enough about transportation to reward companies that take actions to reduce CO₂. There are a few examples of transport buyers that have a focus on the environmental impact of the transport services they use. However, in the food sector it has come into focus by some companies. For example Carlsberg and Plymse have included requirements on using either green transport solutions and/or alternative fuels by their logistics providers. The general picture, though is that green solutions are initiated by the logistics companies only if it also leads to costs savings. Therefore, the incentive for CO₂ reductions must be induced by other means. One way of doing this is by introducing behavioural taxation. This could involve road pricing within the corridor or the possibility of becoming eligible for tax deductions. These Source: COWI Media library reductions could be triggered by reports of reduced CO₂ emissions and CSR initiatives. The introduction of tax changes is somewhat extensive, though, because the STRING corridor involves three countries and therefore should be implemented by EU or in conjunction by the STRING countries. Another way of supporting a further greening in the STRING corridor is to perform investments that lead to both CO₂ reductions and economic benefit for the business sec- 47
48 tors. Investments in new infrastructure will almost always lead to economic benefits and will in some cases create opportunities for CO₂ reductions. The question is to what degree. The economic benefits of the investment will accrue to those companies that have the ability to adapt to and utilize the new infrastructure. Most companies are usually no more entrenched in their concepts than being willing to alter behaviour if it involves cost savings or new profit opportunities BUSINESSES ADAPT TO NEW POSSIBILITIES Businesses react to incentives to make green choices when transporting their products. If new possibilities for easier or cheaper business operations are established, rational companies will adapt to those and take advantage of any chance of cost savings, efficiency improvements or increased profit opportunities. A crucial condition for increased freight on rail is, that it will not be more expensive than transportation by trucks, and that the total transport time will not increase compared to freight by trucks (alternatively, that the price is significantly lower, so that companies are compensated for slower total transportation time and the lacking flexibility). Today the total freight time will not be shortened by freight on rail even though the travelling time on rail through the corridor is shorter than the travelling time by road. To exploit the full potential of freight on rail, further investment in terminal infrastructure is necessary. Investments in terminal infrastructure Freight on rail will usually be accompanied by trucks in the end points. Therefore the infrastructure connecting the trains to the end-customer must be able to accommodate the subsequent freight by trucks. This is one of the focus points in the seven elements to form a green corridor (Oxford Research, 2012). Stakeholders argue that part of the challenge with rail freight today is that there is a deficiency in the infrastructure in relation to loading and unloading and thus shifting from rail to road/ship and vice versa. As a result many trucks run idle while waiting eroding the CO₂ reduction. To be able to offer a realistic alternative to freight by trucks investments in terminal infrastructure should be made to accommodate efficient reloading to other transport units. At the same time it should be ensured, that there is a sufficient number of terminals made available to the market, and that they are strategically placed along the corridor in transport hubs that are easy to access from freeways, rails and ports. The operation of terminals should offer flexibility for the companies using them. Specific needs expressed by both transport companies and customers are 24/7 access and it should be possible to perform other activities in the terminals than merely moving 48
49 goods from one vehicle to the other. The implementation of a green STRING corridor could therefore be supported by investments in the terminal infrastructure which in turn would support increased flexibility of the freight on rail solution. The terminals could be commercially driven, be driven by the region or in collaboration between regions, cross-border etc. The essential condition is that it meets political support. Attractive possibilities for rail freight could be the source of such incentive and some of the greening of the corridor could be attained by shifting freight from road to rail. For the incentive to exist to shift from road to rail would require that the rail freight service would be as good as the road service, or that the rail freight service is provided at a lower price in order to compensate for poorer service. Stakeholders explain, that when transporting by rail it is necessary to plan ahead, and for some companies this is difficult. Companies who offers a just in time delivery solution have difficulty predicting the demand and therefore difficulty planning ahead. Part of the solution to this problem is to introduce a higher degree of flexibility when transporting by train. Today you need to reserve a slot on the train one week in advance. Conversely transport by trucks is very flexible, and can be handled day-to-day. Therefore, to be able to meet the demand of the customers more flexibility on the railway is necessary. This could possibly be attained by investments in terminal infrastructure. By improving terminal infrastructure the loading and unloading of trains will become easier, which opens for other rail-based solutions such as Rollende Landstrasse (RoLa). RoLa is a more flexible transportation form whereby logistic planning in both ends becomes easier for transport companies. Another advantage of this solution is that drivers can rest in the trains. On the other hand including the whole truck in the transport will add extra weight to the freight of the goods causing overall costs of the transport to increase while at the same time eroding the CO₂ reduction. The terminals can also be supporting cooperation between smaller transport and logistic providers, who do not operate their own terminal structures. In general transport companies consider the trucks on train a good solution on longer distances, but the distance from Hamburg to Copenhagen is too short and thus too expensive. In Austria and Switzerland the RoLa is often an attractive and cheaper alternative in the Alp crossing due to rather high fees for using the road passes. A similar possibility could be implemented related to the passing of the fixed links in the STRING corridor; especially if it is backed up by regulation mandating the use of RoLa on the fixed link. 49
50 Another option that businesses have readily adjusted to is the modular trucks or long LKW. The logistics sector has quickly adopted this new possibility in their operation. Also the individual firms are interested in this possibility and to allow the vehicles to drive all the way to the receiver of the goods moved. However, this is often not an option available due to operational restrictions in certain areas. The modular vehicles and the RoLa have the potential not only to reduce CO₂, but also to reduce the impact on urban and interurban congestion. To support the achievement of this the network where these vehicles can be used should be expanded. This is particularly the case in Germany. Moreover, efficient terminals where the goods can be transferred to local and regional distribution vehicles should be made available. This may particularly be relevant for the small and medium sized businesses, which will not have the resources to construct and use such facilities alone CO₂ REDUCTIONS MUST MOSTLY BE DRIVEN BY TECHNOLOGICAL IMPROVEMENTS Both transport companies and transport customers believe that the most sustainable way to reduced CO₂ emissions is technological innovation. This includes the creation of the necessary infrastructure and initiating demonstration of the innovative solutions to support the new technologies. Oxford Research (2012) mention making room for innovative solutions as one of the ways to implement a green corridor. This is confirmed by the businesses. It is generally believed by the transport providers as well as the transport buyers that the CO₂ reductions can mainly be achieved through improving vehicle technology and the fuel use in the transport sector. This was confirmed several times during the project whenever, this topic was discussed with stakeholders at workshops, interviews, presentations of results etc. Hence, the main contribution to closing the gap is to be found in technological solutions. Since most of the vehicle technology is made outside the STRING corridor, the aim must be to facilitate an easy uptake and use of the new solutions in the corridor. Some of the development of alternative fuels as well as the production of e.g. biofuels are driven by businesses in the STRING corridor (see discussion of Greentech above). Hence, a possibility for the decision makers in the STRING corridor is to support the innovation and demonstration of these possibilities in the corridor and thereby support these businesses in the world market, which is also what is highlighted in the 7 elements to a greening of the STRING corridor (Oxford Research, 2012). Often technology within transport refers to alternative fuels such as electricity or biogas. Within the foreseeable future natural gas (CNG and in the long run LNG as out- 50

51 lined in Section 2) is the obvious alternative fuel when considering freight. Gas can be introduced on both sea and road freight. This involves a conversion of the truck fleet and feeder ships so that they are able to run on gas. Establishing an LNG/CNG corridor between Scandinavia and Hamburg There is an increasing focus on transforming ships to run on LNG. This puts pressure on establishment of LNG bunkering possibilities in the ports. The drive to get a shift towards gas fuelled trucks can be that the infrastructure is ready in and around the ports and intermodal terminals. Companies will only introduce this form of technology based green transition, if the market supports it. In other words the preconditions such as strategically located gas stations should be in order. EU is already working with the term of a gas freeway, and therefore the STRING corridor could be included in further work within this field. Another obvious circumstance to include the planning the location of gas stations is in connection to potential investments in terminal infrastructure. An intelligent setup of the gas station infrastructure would consider the modal shifts and therefore locate gas stations at ports and terminals along the corridor. The establishment should involve gas providers, the port authorities, a number of large international transport providers and other public authorities to initiate coordinated action towards the fulfilment of this objective. Fig.: Example of the LNG/CNG Highway. Source: COWI 51
52 Electricity is mainly for passenger transport and there is not a clear potential for electric trucks in the foreseeable future. In general companies believe that alternative fuel technologies are the future solution to green transport. Currently the costs of new fuel technologies are a barrier that deters companies from choosing most of the alternative fuels. Electric cars are still more expensive, gas busses and trucks are still too expensive to be really competitive for the transport sector to use. Moreover, the trucks available now are not suitable for long distance transport. In addition there is a lack of refuelling infrastructure especially in Denmark, where only two stations for CNG are available in the Danish part of the corridor, whereas there are several CNG tank stations in both Sweden and Germany. In Sweden there is already a demonstration project looking at LNG for trucks. Both of these must be developed before a change is likely to happen. There are many initiatives supporting the introduction of alternative fuels, and this must continue to be a necessity to ensure a change to happen. In the short to medium term the alternative fuels vehicles are mainly coming in operation in distribution functions. The logistic companies are reluctant to make the shift towards gas vehicles due both to the higher costs, but also due to uncertainty about the business case for making the shift. The vehicles are still relatively small and with limited operational range and they are therefore mainly introduced by transport operators that have flexibility in interchanging between other vehicles TRANSPARENCY INCREASE PRIVATE INVESTMENTS IN THE CORRIDOR Businesses need harmonisation and foresight in order to plan ahead. Especially when they are about to invest in future green initiatives or changes in the approach to operate. They demand transparency and equal approaches to do this. Business sectors are increasingly dominated by large international conglomerate companies. Such companies constitute an opportunity for private investments supporting a green STRING corridor. However, the large international businesses are flexible when deciding where to invest, and will often choose a location where the expected returns are maximized and the risks minimal. Therefore, sudden changes in taxation or regional planning can constitute a barrier for private investments. I.e. businesses demand transparency of plans for the reasonable foreseeable future if they are to invest in the area. This is also highlighted as one of the seven elements to constitute a green STRING corridor (see introduction to this chapter). This creates a trade-off with the easy/fast way of changing behaviour with regards to CO₂ emissions the introduction of road pricing or other behaviour based taxes within the corridor. By introducing tax related initiatives transport companies are incentivised to reduce CO₂ emissions immediately. However, this form of taxation will reduce com- 52
53 petitiveness for the products produced within the corridor in the export markets. Local markets could benefit from road pricing in that import would decrease and thereby protect the local market. The overall expectation is nonetheless, that the economic surplus will decrease MUTUAL BENEFICIAL COOPERATION Cooperation on logistics operations between businesses is a potential approach to cut CO₂ emissions. However, it is mainly small and medium sized businesses that can see the possibilities in this solution. Small businesses are not immediately able to achieve the same range of CO₂ reductions as the large companies. In order to realise CO₂ reduction small companies need to act like the larger companies. However, the large companies attain their CO₂ reductions because of their size therefore small companies need to work together. Large businesses often use the large logistics service providers. Small companies on the other hand tend to use the local haulier that usually does not have the size to provide cooperative and pooling solutions. 9 The introduction of cooperation in various ways could potentially add to the CO₂ reductions. Cooperation could entail transport customers to pool their freight in fewer trucks or in containers to be loaded on to trains. For small companies the train solution will only become meaningful if cooperation between companies is introduced since transport by train will only be worthwhile, if the rail wagon is full. For smaller companies this might be unrealistic. Even large businesses, which offer just in time delivery, will have trouble exploiting the full capacity of a rail wagon whereby the train freight becomes an unrealistic solution. By pooling freight with other transport buyers, companies save on their freight costs. A third party would be likely to provide this service for small and medium sized companies at a fee. If the fee is less than the costs saved, and the quality of the delivery (time, flexibility etc.) is not degraded this service would be attractive for transport customers. The pooling of freight will not be attractive to all types of businesses. Depending on the goods the business produce it could have special needs that must be taken into account when planning freight. For instance, some food products need to be refrigerated when en route while others do not. And food cannot be carried with products 9 Oxford Research (2012) contains a particular case example underlining the potentials of this. This is the Plyms that is particularly underlining this. 53
54 that have a distinctive smell. This creates a barrier for shared trucks and the solution will therefore be more attractive to companies producing goods without special transport needs. But even in companies within the same business sector, there can be barriers against cooperation about logistic solutions. Novozymes and Novo Nordisk have tried to find mutually beneficial logistic solutions from Kalundborg, where they are both having production facilities. However, the logistic needs, timing, ways of moving products etc. meant that it was not straight forward to have this cooperation. However, both these companies are large and thus have strong internal logistic organisations, which only to a limited extent can benefit from collaboration with other companies. When companies are small there are possibly better possibilities and mutual gains to be achieved. Some cooperation happens because of mutual benefits and a larger market for all partners. This is for example the cases for the cooperation between airline companies who can sell seats on each others flights, but under their own name as long as an agreement has been made. Another case is in the maritime industry, where for example Evergreen and Unifeeder have joined forces to offer a higher frequency on a route. operate by both. This example underline that in order for the collaboration to really work, it must be supported financially and more importantly by an organisation taking charge. Outsourcing of logistic planning is already being introduced in the market and the trend is expected to continue in the years to come. To further stimulate this evolution and facilitate cooperation investments could be made to strengthen the terminal infrastructure and make it available to the market. In addition the introduction of a common IT-interface would ease the cooperation between third party suppliers and customers and stimulate the availability of the solution BENEFICIAL TRADE IMBALANCES When trucks have concluded their delivery at the customer they often return empty to their departure destination. Instead of returning empty they could either make another pick-up nearby the delivery destination, or the initial customer could plan to send delivery the other way. In addition to transport cooperation facilitated by third party service providers which pool transport from A to B, third party service providers could enhance the utilization of empty trucks and thereby reduce CO₂ emissions. Logistics companies have a greater potential for planning and thereby exploit empty trucks returning from delivery by making a pick-up on the way back. 54
55 This minimizes the amount of empty trucks on the road. Larger companies also have such possibilities today; however, smaller companies often do not have the magnitude to conduct such behaviour. Utilizing empty trucks returning from delivery business potentials arising from the opening of the fixed Fehmarn Belt link Most of the Danish production is carried out in the western part of Denmark while most of the consumption takes place in the eastern part of Denmark. This creates an imbalance in the need for trucks in each direction in particular it will lead to empty trucks driving from Zealand to Jutland. Exploitation of this imbalance is possible though, and can lead to business gains: The introduction of the fixed Fehmarn Belt link will establish a port entry to the Danish market from the Zealand side creating more flexibility regarding delivery of imported goods. Larger companies that need delivery of imported goods might as well receive their delivery through the Femarn Belt link and utilize the empty trucks driving from Zealand to Jutland when managing delivery to multiple destinations within the Danish borders. Introducing this service would potentially lead to lower freight costs and would at the same time reduce overall CO₂ consumption, i.e. create business gains and support a greener transport at the same time. The most obvious customers for such services are located in areas that experience trade imbalances or customers performing deliveries to these areas depending on the direction of the imbalance. By trade imbalances should be understood areas where the production of goods is larger than the consumption of goods or vice versa. As with beneficial cooperation to pool freight this service will be easier to implement in some business sectors than others. The same sectors will presumably be eligible customers of both services. 3.3 WHO WILL BE ABLE TO EXPLOIT AND IMPLEMENT It is difficult to give precise estimates of who can gain and benefit from the proposed solutions and initiatives. Nevertheless there are some indications, which are summarized in Figure 3-3. The figure shows in general terms which of the possibilities presented in this chapter are eligible for different types of companies in the corridor. The companies are divided into four types consisting of 1. Large companies with specific or low transport needs 2. Large companies with standard transport needs 55
56 Small companies Large companies 3. Small companies with specific or low transport needs, and 4. Small companies with standard transport needs From the figure it can be derived, that the larger the company and the more standardized (and high) transport needs, the higher is the potential for contributing to the CO₂ reductions. Because of their size in both business and transport the large companies with standard transportation needs will be able to make further investments in green transport initiatives than any of the other company types. On the other hand, the smaller the company and more specified the transport needs, the fewer possibilities to contribute to reductions. - React to behavioural taxation - Invest in new infrastructures, e.g. private terminals - Invest in heavy gas fuelled vehicles and other technologies - Exploit trade imbalances and receive import deliveries in eastern Denmark rather western Denmark - Invest in improved energy efficiency on road transport Specific/low transport needs - Shift from road to rail and sea based transportation - React to behavioural taxation - Invest in new infrastructures, e.g. private terminals- Increased flexibility on rail, - Transport goods by RoLa - Invest in heavy gas fuelled vehicles and other technologies - Exploit trade imbalances and receive import deliveries in eastern Denmark rather western Denmark - Invest in improved energy efficiency on road transport Standard/high transport needs - React to behavioural taxation - React to behavioural taxation - Invest in new infrastructures, e.g. private terminals - Invest in heavy gas fuelled vehicles and other technologies - Accept third party services that makes small companies react like large companies (and thereby also shift from road to rail/sea) - Invest in improved energy efficiency on road transport Figure 3-3: Summary of what companies can do to contribute to reaching the 2030 CO₂ goal. As a given change in behavior within companies with large transport needs have a higher impact on the total CO₂ emissions than companies with a smaller transport need the effects of the initiatives proposed in Figure 3-3 could represent large reduction potentials even though all initiatives are not relevant for all company types. 56
57 3.4 CONCLUDING REMARKS The actions and impacts on the different businesses in the STRING corridor are to some extent rather limited. The analyses have highlighted a number of different areas where there are some benefits to be achieved by the businesses and areas where the businesses can support a further greening of the corridor in terms of closing the gap. Many of the aspects that have been discussed, fall within the 7 elements for a greener transport corridor Öresund-Hamburg as discussed in the beginning of this chapter. Intermodal transport Efficient logistics Harmonised regulations Regional embeddeness Green STRING Corridor Platform for innovation Strategic transport nodes Concentration of long distance transport Figure 3-4: 7 elements for a greener transport corridor Öresund-Hamburg. Source: Oxford Research (2012) As a guiding principle in searching for the potential gains in CO₂ and ways of exploiting the possibilities to be enabled by the Green STRING corridor, the 7 elements have proved useful. The businesses have given input onto how they can benefit from an implemented Green STRING corridor and how they can contribute to the implementation. The analyses carried out in this chapter builds upon these inputs. The different aspects analysed generally took their departure in one or more of the elements, although this was not specifically spelled out during the analyses. The businesses will exploit the new possibilities that are given if the 7 elements are pursued. Especially relevant are the possibilities to use combinations of transport modes, which will be facilitated by a further focus on the terminal structures. More efficient logistics can be obtained at intermodal terminals, which can lead to lower transport costs and at the same time support further use of sea and rail transport. 57

58 Equally relevant is it that solutions to make a greener corridor should not lead to increased transport costs. It is possible though, that costs may increase as a result of regulation or pricing instruments and this is accepted if the changes accrue to all competitors as well. Hence, unilateral public initiatives that only have an impact on the businesses in the corridor, but not on the competitors located in other regions are not well received. It is generally thought that the most effective measures to close the CO₂ gap can be achieved through technological changes. To facilitate this, it will be fruitful if the STRING corridor provides a platform for innovation for e.g. alternative fuels or the implementation of infrastructure that can support better use of vehicles. Despite the focus on the technological solutions, there are also CO₂ reductions that can easier be achieved by e.g. the opening of the fixed Fehmarn Belt link, which may facilitate better logistic solutions and better use of vehicles (e.g. the exploitation of trade imbalances to reduce transport costs and to consolidate goods for distribution in the Öresund region). Source: COWI Media library 58
59 59
60 4 CONCLUSIONS The ambition with this report has been to look at how a Green STRING corridor can influence businesses possibilities to get specific economic gains and how businesses can contribute to reduce their CO₂ emissions and thereby support the achievement of a green corridor. The analyses was split into two parts, where the first part focused on identifying the gap in CO₂ reductions between a 30% reduction of 1990 emissions until 2030 and a business as usual forecast of CO₂ emissions. The calculations are based on a long distance traffic forecast and include improvements in vehicles energy efficiency until 2030 and the already planned changes in infrastructure in relation to the STRING corridor. The analyses have found a significant gap in the CO₂ emissions, where the CO₂ emissions in a business as usual scenario are three times higher than the target CO₂ reductions by The analyses further showed that already today there is a significant gap to be closed. Hence, to fulfil the target reductions it is necessary to start as soon as possible using many different initiatives, since there is no single or simple solution that can close the gap. In addition there is a skewed modal split, where road transport is significantly higher than the target of 30% of the long distance transport on sea and rail. In order to achieve the targets significant changes are necessary e.g. to increase the rail infrastructure capacity both on the tracks, but especially in the terminals for both rail and sea transport. The analyses of the modal split indicates that with the improvement in the rail infrastructure in the corridor (including upgrading of the German single track stretches), the capacity on this corridor will be able to accommodate the freight volumes to fulfill the 30% modal split target. There are different possibilities to reduce the gap by implementing different proposed solutions that are already known. For example the RoLa concept, enlarging the infrastructure for modular trucks, high speed trains, dedicated freight rail infrastructure and expanding the intermodal terminal structures. Not all these examples are equally easy to implement. The RoLa concept for example will not be adopted by the industry without significant pressure such as e.g. a mandated use across Fehmarn Belt. On the other hand is much easier to enlarge the use of modular trucks to a larger part of the infrastructure. If this is made possible, it will be exploited immediately by the transport sector. The different rail solutions require large public investments to be implemented and coordination between different operators and terminals also require public support to initiate and facilitate any changes, since the individual operators mainly focus on running their own business independent from other operators. 60
61 These discussed alternatives alone will not be able to close the gap, since most of the traffic in the future will be road based. Therefore other solutions or initiatives need to be addressed. The second part of the analyses in this report looked at how businesses in the STRING corridor could contribute to closing the gap through their behavior and on how the options made possible through the STRING corridor could be further exploited. The discussed solutions and initiatives partly include behavioural changes and partly consider technological solutions. The stakeholders and businesses generally did not believe that the behavioural changes could make significant contributions to the gap reduction, and they underlined that adopting the different technological solutions seem to be the most effective way to reduce the gap. The general findings along these two approaches are summarised in Figure 4-1. CO₂ reductions from behavioural changes CO₂ reductions from fuel and vehicle technology Business view and feedback generally Only moderate contribution to close the gap Businesses always try to optimise Businesses try to exploit 'obvious' possibilities Cheap transport out from corridor (excess supply of transport) Cooperation between companies mainly for SMV and when facilities are present Large CO₂ potential Main part of future initiatives to close the gap Companies will use alternative fuels when made available (at lower costs) Companies will use alternative fuel vehicles if demanded by customers (however, seldom the case) Business inputs to solutions and initiatives needed Increased cooperation Better intermodal infrastructure Optimised logistics Exploit trade imbalances Use cheap supply out of corridor Easy access to rail terminals Figure 4-1: 61 LNG infrastructure involving ports and road terminals Electric transportation for light duty vehicles and local bus transport Increased energy efficiency of vehicles Continued development of vehicle technology Summary of findings behavioural changes and technological solutions.
62 Some of the solutions mentioned will be implemented by themselves since they support the reduction sin transport and logistics costs (see e.g. the inputs in the first left box). The transport sector is quick to adapt to new possibilities if they contribute to cost reduction, if the transport buyers require any change or if public regulation mandates a change. However, many of the solutions will not be initiated by the market and the private sector without public support. This means that authorities in the STRING corridor have an active role to play in e.g. supporting new initiatives or by initiating different projects. Some of the possibilities that have been discussed in the project are: Activities in the STRING corridor must support the introduction of new technologies. This can be done by e.g. building up infrastructures for alternative fuels (LNG/CNG infrastructure, e-highway in the STRING corridor). Initiating demonstration projects to show that a technology or proposed solution will work. This can e.g. be similar to the large electric vehicle demonstrations projects initiated by municipalities all around Europe and the EU initiated demonstration projects about hydrogen etc. Information campaigns aimed at the different business sectors to make the businesses aware of the different potentials that a Green STRING corridor can enable, information about specific infrastructure solutions or other business potentials. Organising local initiatives to support cooperation between small and medium sized businesses, since they are often not in positions to undertake new projects themselves. Public support (financial and organizational) is therefore needed to initiate and coordinate such projects. The authorities should further aim to make regulation that favor alternative fuelled vehicles, energy efficient transport, smart logistic solutions etc. This can for example be done by using different taxes and other economic incentives, giving financial support to initiatives within green transport solutions. It can also be achieved by giving other incentives such as priority to the infrastructure for certain types of vehicles (e.g. freight trains to rail infrastructure, alternative fuel vehicles to bus lanes). Nevertheless, such regulations in the STRING corridor have to be harmonized across all the countries in the corridor, since this is considered highly important for the businesses. An example is the use of modular trucks, where the legislation differs between Sweden, Denmark and Germany and therefore is a barrier to an even larger use of this CO₂ reducing possibility. The current infrastructure already shows bottlenecks in several locations and more bottlenecks are foreseen for the coming years due to more traffic and the improvement of parts of the central north-south rail and road infrastructure. Hence, stronger 62
63 focus is needed to remove these bottlenecks and especially prioritizing an upgrading of the current single tracks in the rail infrastructure. A summary of the overall findings are: Findings There is a large gap in CO₂ emissions in corridor Road transport will remain main transport mode also in the future Initiatives to address road transport is thus needed (e.g. modular trucks, alternative fuels) Firms can exploit the improved green infrastructure Firms react to reduce costs There are some potential gains in CO₂ emissions from cooperation and other behavioural changes Technical solutions, especially alternative fuels are the most promising solution, but must be complemented by behavioural changes by businesses Actions for the future Demonstration projects o e-highway in STRING o LNG infrastructure Facilitate cooperation (e.g. as STRING project, Terminals and removals of bottlenecks Work for access of e.g. modular trucks in entire corridor Authorities must work on harmonisation across administrative borders (between regions, countries and at EU level) 63
64 5 REFERENCES Earth Systems (2012): Discussion Paper on Green Growth in the STRING Region, Prepared for STRING COWI (2013): Fehmarnbelt Fixed Link, Greenhouse Gas Emission Inventory, Prepared for Femern A/S FTC Fehmarnbelt Traffic Consortium (2003): Fehmarn Belt Forecast 2002, Final Report, Prepared for Trafikministeriet, København and Bundesministerium für Verkehr, Bauund Wohnungswesen, Berlin FTC Fehmarnbelt Traffic Consortium (2003): Fehmarn Belt Forecast 2002, Reference Cases, Supplement to final Report of April 2003 COWI in coorperation with DMU (2005): Fixed Link across the Fehmarn Belt Effect on Emissions to Air, Prepared for the Danish Ministry of Transport and Energy and Bundesministerium für Verkehr, Bau- und Wohnungswesen COWI (2013): Vurdering af trafikstrømme og CO₂-udslip år 2030, Prepared for Region Hovedstaden COWI (2014a): Market study: Improved train service Öresund-Hamburg, Prepared for Green STRING Corridor COWI (2014b): Hovedstaden som et international transportknudepunkt. Report prepared for the Capitol Region. Femern A/S (2013): VVM redegørelse, Den faste forbindelse over Femern Bælt, Sammenfattende rapport, (The EIA summary report) Hansen, Povl A. (2013): The Green STRING Corridor and transport development. Roskilde Universitetscenter and Green STRING Development STRING (2012): Bottlenecks in the infrastructure between Scandinavia and Central Europe STRING (2014): Green Growth in STRING Ambition, Strategy and Profile Projects Jacobsen, Björn P. and Wewstädt, Lars (2012): Business Clusters in Lübeck, Ostholstein and Zealand, BeltTrade Oxford Research (2012): Green STRING Corridor 7 elements for a greener transport corridor Öresund-Hamburg, Prepared for Green STRING Corridor 64
65 Oxford Research (2013): Environmental Effects of a Green String transport Corridor, Prepared for Green STRING Corridor 65

66 6 ANNEX A. RELEVANT TARGETS UP TO 2050 The table is produced by EEA (2013). The inicators mentioned are the TERM indicators. Table should be adjusted to current purpose. 66
New Routes for Transport and Logistics in the STRING Corridor. Copenhagen, 11th March, 2013
 New Routes for Transport and Logistics in the STRING Corridor Copenhagen, 11th March, 2013 An interregional co-operation The project is funded through the Interreg IVA Öresund Programme 11 Swedish and
Efficient & reliable transport solutions
 Efficient & reliable transport solutions The direct way for your freight TT-Line has been operating direct ferry services between Germany and Sweden since 1962. The company offers reliable, high quality
TERM Member States with national transport and environment monitoring systems
 Indicator fact sheet TERM 2004 37 Member States with national transport and environment monitoring systems Indicator code / ID Analysis made on (Assessment date) 18 October 2004 EEA contact /fact sheet
Infrastructure endowment
 Infrastructure endowment Most public investment in Member States as well as that supported by the Structural Funds goes on infrastructure. An adequate endowment of infrastructure is a necessary, but not
ENERGY PRIORITIES FOR EUROPE
 ENERGY PRIORITIES FOR EUROPE Presentation of J.M. Barroso, President of the European Commission, to the European Council of 4 February 2011 Contents 1 I. Why energy policy matters II. Why we need to act
Stakeholder consultation on the mid-term review of the 2011 White Paper on transport
 1 von 11 01.06.2015 14:57 Case Id: 25d75e1b-6c50-4ec3-a704-189176957ecf Stakeholder consultation on the mid-term review of the 2011 White Paper on transport Fields marked with are mandatory. Please provide
CAP CONTEXT INDICATORS
 CAP CONTEXT INDICATORS 2014-2020 24. AGRICULTURAL TRAINING OF FARM MANAGERS 2017 update CONTEXT INDICATOR 24: AGRICULTURAL TRAINING OF FARM MANAGERS Learning by doing is still the main form of for the
Fehmarnbelt Fixed Link: Modal Split Drivers
 Fehmarnbelt Fixed Link: Modal Split Drivers Promoting an environmentally friendly modal shift for cargo traffic after the opening of the fixed link TENTacle WP 2, Group of Activities 2.1, Activity 2.1.3
EasyWay Project An overview
 EasyWay Project An overview Andreas Arnaoutis 26-06-09, Thessaloniki www.easyway-its.eu EasyWay : from systems to services 2 Background EasyWay follows on from the success of the TEMPO programme (MIP I),
EUROPEAN ECONOMIC AREA
 EUROPEAN ECONOMIC AREA STANDING COMMITTEE OF THE EFTA STATES 5 February 2007 SUBCOMMITTEE II ON THE FREE MOVEMENT OF CAPITAL AND SERVICES EEA EFTA COMMENTS ON THE MID-TERM REVIEW OF THE COMMISSION 2001
Fuel cells & hydrogen research and innovation in Horizon 2020
 Fuel cells & hydrogen research and innovation in Horizon 2020 Hydrogen is one of the few near-zero-emissions energy carriers that could play an important part of the future EU low-carbon energy and transport
External costs of traffic in Sweden with a European outlook, Summary Report 2015:4
 External costs of traffic in Sweden with a European outlook, 2015 Summary Report 2015:4 External costs of traffic in Sweden with a European outlook, 2015 Summary Report 2015:4 Transport Analysis Address:
Targeted stakeholder consultation regarding trends and prospects of jobs and working conditions in transport (For non-enterprises)
") Targeted stakeholder consultation regarding trends and prospects of jobs and working conditions in transport (For non-enterprises) Fields marked with are mandatory. 1 Questions to identify the organisation
Targeted stakeholder consultation regarding trends and prospects of jobs and working conditions in transport (For non-enterprises) Fields marked with are mandatory. 1 Questions to identify the organisation
Freight transport policy and measures in Norway
 PIARC meeting and seminar 13-15 June 2005 in Ouagadougou Freight transport policy and measures in Norway Senior Adviser Hans Silborn, Norwegian Public Roads Administration Norway is a sparsely inhabited
THE BALTIC SEA MOTORWAY - RECENT DEVELOPMENT AND OUTLOOK FOR THE FUTURE
 Journal of Maritime Research, Vol. IV. No. 2, pp. 21-30, 2007 Copyright 2007. SEECMAR Printed in Santander (Spain). All rights reserved ISSN: 1697-4840 THE BALTIC SEA MOTORWAY - RECENT DEVELOPMENT AND
Promotion of SSS in Europe Roberto Martinoli, Chairman & CEO GNV ESN Chair and Chair of SSS committee of CONFITARMA. September 29, 2015
 Promotion of SSS in Europe Roberto Martinoli, Chairman & CEO GNV ESN Chair and Chair of SSS committee of CONFITARMA 1 Shortsea Promotion Centres: 1. Belgium 2. Bulgaria 3. Croatia 4. Cyprus 5. Denmark
Effects of adapting the rules on weight and dimensions of heavy commercial vehicles as established within Directive 96/53/EC
 Effects of adapting the rules on weight and dimensions of heavy as established within Directive 96/53/EC TML (BE) - TNO (NL) - Sétra (FR) - LCPC (FR) - RWTH (DE) 1 Overview of the study Scenarios Stakeholder
INTERMODAL TRANSPORT IN THE POLICY DOCUMENTS CONTEXT
 INTERMODAL TRANSPORT IN THE POLICY DOCUMENTS CONTEXT Olivera Medar a*, Branislav Bošković a a University of Belgrade, Faculty of Transport and Traffic Engineering, Serbia Abstract: It is the policy analysis
ESTIMATION OF THE IMPACT OF LONG AND HEAVY VEHICLES ON FUTURE EUROPEAN TRANSPORT DEMAND AND MODAL SHIFT
 ESTIMATION OF THE IMPACT OF LONG AND HEAVY VEHICLES ON FUTURE EUROPEAN TRANSPORT DEMAND AND MODAL SHIFT Team leader Logistics at the Business Unit Mobility and Logistics of TNO. Completed an M.Sc. in Transport
Big Data and Logistics Views of a port authority. 05 April 2013 Groningen, Jan Egbertsen
 Big Data and Logistics Views of a port authority 05 April 2013 Groningen, Jan Egbertsen Some questions to start with? How do you book a trip from Groningen to New York? How do you book a container from
Intelligent Transport Systems (ITS)
") UNITED NATIONS ECONOMIC COMMISSION FOR EUROPE (UNECE) Workshop on ITS in intermodal transport 15-16 May 2013, Brussels Intelligent Transport Systems (ITS) Opportunites and challenges for intermodal transport
UNITED NATIONS ECONOMIC COMMISSION FOR EUROPE (UNECE) Workshop on ITS in intermodal transport 15-16 May 2013, Brussels Intelligent Transport Systems (ITS) Opportunites and challenges for intermodal transport
Background and objectives
 Workshop on greenhouse gas emission projections 12-13 December 2006, European Environment Agency, Copenhagen Background and objectives André Jol Head of Group climate change and energy European Environment
The Fehmarnbelt project
 The Fehmarnbelt project In 1955, the German and Danish state agreed to construct a road and railway connection between Copenhagen and Hamburg with a direct ferry service between Rødby on the Danish isle
THE MEDITERRANEAN GATEWAY TO ENERGY UNION What strategy on power and gas?
 THE MEDITERRANEAN GATEWAY TO ENERGY UNION What strategy on power and gas? Panel MEDITERRANEAN GAS CORRIDOR Prof. Valeria Termini Full Professor of Economics University of Roma Tre Commissioner - The Italian
Eu Public- Private Smart Move High Level Group
 Eu Public- Private Smart Move High Level Group Final Recommendations Follow up to the European Commission Transport White Paper and contribution to the EU 2020 Growth Agenda European Union // Eu Public-Private
UTILITIES: HOW THE EU DIRECTIVE IS IMPLEMENTED AND HOW IT WORKS IN EU MEMBER STATES
 A joint initiative of the OECD and the European Union, principally financed by the EU VIth IPA REGIONAL PUBLIC PROCUREMENT CONFERENCE UTILITIES: HOW THE EU DIRECTIVE IS IMPLEMENTED AND HOW IT WORKS IN
The new Energy Policy. Jean-Arnold Vinois Head of Unit Energy Policy and Security of Supply Directorate General for Energy and Transport
 The new Energy Policy Jean-Arnold Vinois Head of Unit Energy Policy and Security of Supply Directorate General for Energy and Transport 1 The 3 challenges Sustainable Development Competitiveness FULLY
REPORT SHORT VERSION Survey of road freight through RoRo-ports along the south and west coast of Sweden
 REPORT SHORT VERSION Survey of road freight through RoRo-ports along the south and west coast of Sweden Results from interviews with 2 500 truck drivers Trafikverket Address: Trafikverket, 781 89 Borlänge
Figure 1: Load factors for road of selected countries, 1980 to 1998 DK D NL FIN S
 The loading efficiency of road freight transport is improving slightly in some EU Member States but has remained relatively stable or worsened in most Member States. The picture is more encouraging for
Emissions Trading System (ETS): The UK needs to deliver its share of the total EU ETS emissions reduction of 21% by 2020, compared to 2005;
: The UK needs to deliver its share of the total EU ETS emissions reduction of 21% by 2020, compared to 2005;") Emissions Trading System (ETS): The UK needs to deliver its share of the total EU ETS emissions reduction of 21% by 2020, compared to 2005; Non-ETS emissions: The Effort Sharing Decision sets a target
Emissions Trading System (ETS): The UK needs to deliver its share of the total EU ETS emissions reduction of 21% by 2020, compared to 2005; Non-ETS emissions: The Effort Sharing Decision sets a target
10. Demand (light road freight veh shares)
") . Demand (light road freight veh shares) Overview Target The view is intended to calculate the share of light vehicles in total road freight vehicles. The light road freight vehicles are those belonging
. Demand (light road freight veh shares) Overview Target The view is intended to calculate the share of light vehicles in total road freight vehicles. The light road freight vehicles are those belonging
The EU Transport Policy Leo Huberts, European Commission
 The EU Transport Policy Leo Huberts, European Commission Advisor to Mr Pat Cox, European Coordinator Scandinavian-Mediterranean Core Network Corridor Brussels (BE), Alpeuregio Summer School, 04 July 2016
Revolution of the Scandinavian logistics market
 Revolution of the Scandinavian logistics market UK Northern Europe s strongest and most innovative logistics cluster in the making In the years to come, the regions in the STRING corridor will experience
ATTITUDES OF EUROPEANS TOWARDS AIR QUALITY
 Flash Eurobarometer ATTITUDES OF EUROPEANS TOWARDS AIR QUALITY REPORT Fieldwork: September 2012 Publication: January 2013 This survey has been requested by the European Commission, Directorate-General
TERM Transport prices (real change in passenger and freight transport prices by mode)
") Indicator fact sheet TERM 2005 20 Transport prices (real change in passenger and freight transport prices by mode) Indicator code / ID Analysis made on (Assessment date) 18 October 2005 EEA contact /fact
Indicator fact sheet TERM 2005 20 Transport prices (real change in passenger and freight transport prices by mode) Indicator code / ID Analysis made on (Assessment date) 18 October 2005 EEA contact /fact
REPORT FROM THE COMMISSION TO THE EUROPEAN PARLIAMENT AND THE COUNCIL
 EUROPEAN COMMISSION Brussels, 29.7.2016 COM(2016) 464 final REPORT FROM THE COMMISSION TO THE EUROPEAN PARLIAMENT AND THE COUNCIL Progress by Member States in reaching cost-optimal levels of minimum energy
Making Cities Work Sustainable Urban Infrastructure
 Making Cities Work Sustainable Urban Infrastructure Stuart Clarkson Chief Executive Officer - Siemens Southern Africa 20 Nairobi Megatrends pose urgent challenges to cities Urbanisation Climate Change
Unbundling and Regulatory Bodies in the context of the recast of the 1 st railway package
 Unbundling and Regulatory Bodies in the context of the recast of the 1 st railway package Presentation of briefing notes to the Committee on Transport and Tourism Tuesday 12 th April 2011 Steer Davies
LNG fuel distribution strategy for the BSR v5
 LNG fuel distribution strategy for the BSR v5 Introduction The land-based and the maritime LNG market will be closely connected in the future. With stricter emission restrictions, more ships will be built
WIND POWER TARGETS FOR EUROPE: 75,000 MW by 2010
 About EWEA EWEA is the voice of the wind industry actively promoting the utilisation of wind power in Europe and worldwide. EWEA members from over 4 countries include 2 companies, organisations, and research
ESF Ex-Post evaluation
 ESF 2007-2013 Ex-Post evaluation Fields marked with * are mandatory. Open public consultation Questionnaire Please consult the background document as it provides useful information on the European Social
ANNEXES. to the. Proposal for a REGULATION OF THE EUROPEAN PARLIAMENT AND OF THE COUNCIL
 EUROPEAN COMMISSION Brussels, 20.7.2016 COM(2016) 479 final ANNEXES 1 to 6 ANNEXES to the Proposal for a REGULATION OF THE EUROPEAN PARLIAMENT AND OF THE COUNCIL on the inclusion of greenhouse gas emissions
TERM EEA-31 Transport emissions of greenhouse gases by mode
 Indicator factsheet TERM 2003 02 EEA-31 Transport emissions of greenhouse gases by mode In the area of EEA-31, emissions of greenhouse gases (GHGs) from transport (excluding international transport) increased
CAP CONTEXT INDICATORS
 CAP CONTEXT INDICATORS 2014-2020 44. ENERGY USE IN AGRICULTURE, FORESTRY AND THE FOOD INDUSTRY 2017 update BE BG CZ DK DE EE IE EL ES FR HR IT CY LV LT LU HU MT NL AT PL PT RO SI SK FI SE UK CONTEXT INDICATOR
Future Energy Scenarios for EU27 in 2030
 Future Energy Scenarios for EU27 in 2030 Towards 50% oil reduction 50% CO2 emissions reduction Prepared by The Danish Board of Technology RISØ DTU Ea Energy Analyses Strasbourg, 23 April 2008 Future Energy
ODYSSEE-MURE, a decision support tool for energy efficiency policy evaluation. Recent energy efficiency trends in the EU
 ODYSSEE-MURE, a decision support tool for energy efficiency policy evaluation Recent energy efficiency trends in the EU Didier Bosseboeuf, ADEME, project coordinator Bruno Lapillonne, Karine Pollier; Enerdata
T E N - I n v e s t. Contract No.ETU/B S /2001/PLANCO F I N A L R E P O R T. presented by. PLANCO Consulting GmbH, Essen, Germany
 T E N - I n v e s t Transport Infrastructure Costs and Investments between 1996 and 2010 on the Trans-European Transport Network and its Connection to Neighbouring Regions, including an Inventory of the
CASE STUDY 5. Extension of the Adriatic-Ionian ferry corridor from Peloponnese to Crete" University of the Aegean Dpt. Shipping, Trade & Transport
 Lisbon, 15 December 2011 CASE STUDY 5 Extension of the Adriatic-Ionian ferry corridor from Peloponnese to Crete" University of the Aegean Dpt. Shipping, Trade & Transport The concept of the Case Study
How effective will the EU s largest post-2020 climate tool be?
 Understanding the Climate Action Regulation How effective will the EU s largest post-2020 climate tool be? Carbon Market Watch Policy Brief, April 2018 Introduction The Climate Action Regulation (CAR),
The need for better statistics for climate change policies
 The need for better statistics for climate change policies Jacqueline McGlade Greenhouse gas emission data: more timely and more spatial data needed EEA annual report on GHG trends and projections in Europe
A funding scheme supporting sustainable and efficient freight transport services
 A funding scheme supporting sustainable and efficient freight transport services Fields marked with are mandatory. A Respondent s profile Please provide information to help us build your profile as a respondent.
Transport policy and international goods shipments in the Nordic countries. Summary Memorandum Report 2014:4
 Transport policy and international goods shipments in the Nordic countries Summary Memorandum Report 2014:4 Transport policy and international goods shipments in the Nordic countries Summary Memorandum
25 % 20 % 15 % 10 % 5 % Share rail, inland waterways and oil pipelines 0 %
 Indicator fact sheet TERM 2003 13b EEA 17 Modal split in freight transport The share of road freight transport increased during the 1991 2000 period, whereas the modal share of short-sea shipping remained
Making the Parcel Regulation work. 17th Königswinter Postal Seminar 5-7 February
 Making the Parcel Regulation work 17th Königswinter Postal Seminar 5-7 February 2018 1 A lot going on. 2 Not just a parcel More A journey 3 AT DE DK FI FR IE LU NL SE CY EL ES IT MT PT BG HR HU
Alternative Waste Management can reduce Greenhouse Gas emissions
 Alternative Waste Management can reduce Greenhouse Gas emissions Experiences from Germany and the European Union Marlene Sieck Federal Environment Agency Germany Federal Environment Agency Division III
SOUTH EAST EUROPE TRANSNATIONAL CO-OPERATION PROGRAMME
 SOUTH EAST EUROPE TRANSNATIONAL CO-OPERATION PROGRAMME 3 rd Call for Proposals Terms of reference Network of (Hub) cities for an increased access and mobility of people in the SEE region March 2011 1.
SWIFTLY Green and GET Greener Two projects for sustainable transport corridors
 SWIFTLY Green and GET Greener Two projects for sustainable transport corridors Lina Wells October 26 2016 Brief data on the Swedish Transport Administration The Board Director-General Lena Erixon North
The European Commission s strategy on Corporate Social Responsibility (CSR) : achievements, shortcomings and future challenges
 : achievements, shortcomings and future challenges") The European Commission s strategy on Corporate Social Responsibility (CSR) 2011-2014: achievements, shortcomings and future challenges Fields marked with * are mandatory. 1 Introduction - Background and
The European Commission s strategy on Corporate Social Responsibility (CSR) 2011-2014: achievements, shortcomings and future challenges Fields marked with * are mandatory. 1 Introduction - Background and
Core projects and scientific studies as background for the NREAPs. 9th Inter-Parliamentary Meeting on Renewable Energy and Energy Efficiency
 Core projects and scientific studies as background for the NREAPs 9th Inter-Parliamentary Meeting on Renewable Energy and Energy Efficiency Brussels, 18.11.2009 Mario Ragwitz Fraunhofer Institute Systems
Summary Report on Status of implementation of the INSPIRE Based on 2016 Member States Reports
 Summary Report on Status of implementation of the INSPIRE Directive in EU Based on 2016 Member States Reports Introduction... 1 1. State of Play... 3 1.1 Coordination... 3 1.2 Functioning and coordination
ANNEXES. to the COMMUNICATION FROM THE COMMISSION TO THE EUROPEAN PARLIAMENT AND THE COUNCIL
 EUROPEAN COMMISSION Brussels, 23.7.2014 COM(2014) 520 final ANNEXES 1 to 3 ANNEXES to the COMMUNICATION FROM THE COMMISSION TO THE EUROPEAN PARLIAMENT AND THE COUNCIL Energy Efficiency and its contribution
Antitrust: Car price report shows price differentials for new cars in EU narrowing in 2010
 EUROPEAN COMMISSION - PRESS RELEASE Antitrust: Car price report shows price differentials for new cars in EU narrowing in 2010 Brussels, 26 July 2011 - The European Commission s latest car price report
Urban Agenda - Air Quality
 Urban Agenda - Air Quality Fields marked with are mandatory. Objective of the Public Feedback In order to realise the full potential of the European Union and deliver on its strategic objectives, the Urban
Cross border interconnections and inter-european cooperation. Cross border interconnections and inter- European cooperation
 Cross border interconnections and inter- European cooperation Disclaimer The information on which this presentation is based derives from our own experience, knowledge, data and research. The opinions
Long-term Market Analysis Nordics and Europe Executive summary
 Long-term Market Analysis Nordics and Europe 2018 2040 Executive summary 1 December 2018 Europe is set to develop a low carbon power system with significant contribution from renewable energy sources.
Energy Taxation Directive
 Contribution ID: 8dd99ce2-bb2e-492b-9612-d1cf4cffdfa3 Date: 04/06/2018 15:29:35 Energy Taxation Directive Fields marked with * are mandatory. Introduction Directive 2003/96/EC has been in force since 2004.
The Cancun Agreements: Land use, land-use change and forestry
 Decision 2/CMP.6 The Cancun Agreements: Land use, land-use change and forestry The Conference of the Parties serving as the meeting of the Parties to the Kyoto Protocol, Affirming that the implementation
MOBILITY MEETS BIG DATA
 MOBILITY MEETS BIG DATA www.transformingtransport.eu The future of transport for Europe Europe s ever-growing mobility and logistics sector currently represents 15 % of GDP and employs 11.2 million people
Joint contribution of the Conference of Atlantic Arc Cities-CAAC and the Atlantic Arc Commission Transport Group-AATG
 Joint contribution of the Conference of Atlantic Arc Cities-CAAC and the Atlantic Arc Commission Transport Group-AATG Submission to the consultation process opened by the DG of Energy and Transport of
EUROPEAN UNION HORIZON 2020 RESEARCH & INNOVATION PROGRAMME. ALLIANCE Fact Sheet N o 1:
 EUROPEAN UNION HORIZON 2020 RESEARCH & INNOVATION PROGRAMME ALLIANCE Fact Sheet N o 1: An overview of transportation networks interconnection in Europe This project has received funding from the European
TEN-T Corridors, Ports and Motorways of the Sea
 THE NEW TRANS-EUROPEAN TRANSPORT NETWORK A CORE NETWORK: BLUEPRINT FOR 2030 TEN-T Corridors, Ports and Motorways of the Sea April 24, 2012 European Commission DG MOVE TEN-T Jose Anselmo Transport lifeblood
THE SCANDINAVIAN 8 MILLION CITY
 COPENHAGEN PUTTGARDEN HAMBURG LAHOLM FREDRIKSTAD LUND MOSS FALKENBERG HALDEN ÖXNERED TROLLHÄTTAN THE SCANDINAVIAN 8 MILLION CITY FINAL REPORT 2014 ÄNGELHOLM LÜBECK SKI SARPSBORG LANDSKRONA OSLO COPENHAGEN
Revision of Directive 2009/33/EC on the promotion of clean and energy-efficient road vehicles (Clean Vehicles Directive)
") Contribution ID: a3c59ce7-c18d-436b-8138-90bf5b2fa997 Date: 23/03/2017 12:21:48 Review of the Clean Vehicles Directive Revision of Directive 2009/33/EC on the promotion of clean and energy-efficient road
Contribution ID: a3c59ce7-c18d-436b-8138-90bf5b2fa997 Date: 23/03/2017 12:21:48 Review of the Clean Vehicles Directive Revision of Directive 2009/33/EC on the promotion of clean and energy-efficient road
INTERMODAL TRANSPORT AND THE WHITE PAPER IRU POSITION
 GETC/G3311/SPR Geneva, 29 November 2001 INTERMODAL TRANSPORT AND THE WHITE PAPER IRU POSITION INTRODUCTION The White Paper EUROPEAN TRANSPORT POLICY FOR 2010: DECISION TIME published by the European Commission
Supply and Demand Analysis
 Technical, Socio-economic and Supply/Demand study regarding the transport of the FERRMED Great Rail Network (Scandinavia-Rhine- Rhône-Western Mediterranean) Supply and Demand Analysis Presented by Daniele
Approximated greenhouse gas emissions in 2016
 Approximated greenhouse gas emissions Approximated greenhouse gas emissions in 2016 This briefing presents early approximated (proxy) estimates of greenhouse gas (GHG) emissions for 2016 in the European
Danish and European plans for wind energy deployment
 Chapter 5 Danish and European plans for wind energy deployment By Peter Hjuler Jensen and Søren Knudsen, DTU Wind Energy; Poul Erik Morthorst, DTU Management Engineering Danish and European plans for wind
Trends and drivers in greenhouse gas emissions in the EU in 2016
 EU greenhouse gas inventory Trends and drivers in greenhouse gas emissions in the EU in 2016 Official data for 2016 confirm the longterm reduction in greenhouse gas emissions across Europe. This briefing
TERMS OF REFERENCE DK-Copenhagen: Outlooks on water use for the 2005 State of the Environment and Outlook Report
 Annex II TERMS OF REFERENCE DK-Copenhagen: Outlooks on water use for the 2005 State of the Environment and Outlook Report 1. Background information Open call for Tender EEA/RNC/03/007 The 2005 State of
Energy demand dynamics and infrastructure development plans in the EU. October 10 th, 2012 Jonas Akelis, Managing Partner - Baltics
 Energy demand dynamics and infrastructure development plans in the EU October 10 th, 2012 Jonas Akelis, Managing Partner - Baltics Forecasted energy demand dynamics of EU-11 will be significantly higher
COMMISSION OF THE EUROPEAN COMMUNITIES REPORT FROM THE COMMISSION TO THE EUROPEAN PARLIAMENT AND THE COUNCIL
 EN EN EN COMMISSION OF THE EUROPEAN COMMUNITIES Brussels, 12.11.2009 COM(2009)630 final REPORT FROM THE COMMISSION TO THE EUROPEAN PARLIAMENT AND THE COUNCIL PROGRESS TOWARDS ACHIEVING THE KYOTO OBJECTIVES
Transport. Relevance of the transport sector for green growth in Macedonia
 Transport Relevance of the transport sector for green growth in Macedonia Transport figures prominently on the green growth agenda for two reasons. First, transport has major environmental impacts in terms
Global energy trends in road freight transport
 Global energy trends in road freight transport Maja Piecyk Alan McKinnon LRN 2009 Cardiff 10th September 2009 Research background This research was carried out as part of the project undertaken with the
FRAMEWORK CONVENTION ON CLIMATE CHANGE - Secretariat CONVENTION - CADRE SUR LES CHANGEMENTS CLIMATIQUES - Secrétariat KEY GHG DATA
 UNITED NATIONS NATIONS UNIES FRAMEWORK CONVENTION ON CLIMATE CHANGE - Secretariat CONVENTION - CADRE SUR LES CHANGEMENTS CLIMATIQUES - Secrétariat KEY GHG DATA Greenhouse Gas Emissions Data for 1990 2003
Passenger Mobility in the Baltics A Catalyst for Regional Cohesion
 Passenger Mobility in the Baltics A Catalyst for Regional Cohesion Arnis Kakulis, Managing Director AECOM Baltics April 24, 2017 10 benefits from Rail Baltica (source RB Rail AS) 1. A powerful catalyst
COMMISSION OF THE EUROPEAN COMMUNITIES COMMISSION STAFF WORKING DOCUMENT. Annex to the
 COMMISSION OF THE EUROPEAN COMMUNITIES Brussels, 22.3.2007 SEC(2007) 363 COMMISSION STAFF WORKING DOCUMENT Annex to the COMMUNICATION FROM THE COMMISSION TO THE EUROPEAN PARLIAMENT AND THE COUNCIL 'Towards
New EU transport infrastructure policy background
 EUROPEAN COMMISSION MEMO Brussels, 11 September 2014 New EU transport infrastructure policy background What is the EU infrastructure policy? Transport is vital to the European economy: without good connections
Developing Infrastructure and Operating Models for Intermodal Shift - DIOMIS Intermodal Rail/Road Transport In Europe 2007
 Developing Infrastructure and Operating Models for Intermodal Shift - DIOMIS http://www.uic.org/diomis Intermodal Rail/Road Transport In Europe 2007 Geneva 12&13 October 2009 Main objectives To deliver
Output Scandria Green Transport Corridor Strategy Baltic Sea Region Project #026 Scandinavian-Adriatic Corridor for Growth and Innovation
 Output 5.1.2 Scandria Green Transport Corridor Strategy Baltic Sea Region Project #026 Scandinavian-Adriatic Corridor for Growth and Innovation Work Package Action Responsible Partner Author Work Package
CAP CONTEXT INDICATORS
 CAP CONTEXT INDICATORS 2014-2020 33. FARMING INTENSITY 2017 update CONTEXT INDICATOR 33: FARMING INTENSITY Intensification is an important restructuring process that has characterised European agriculture
THE RENEWABLE ENERGY CONTRACTOR MARKET IN EUROPE THE POWER INDEX
 THE RENEWABLE ENERGY CONTRACTOR MARKET IN EUROPE THE POWER INDEX There are 1.2 million jobs in renewable energy across the European Union In the European energy market, the shift towards renewables is
EUTRAIN Europe Neighbourhood Cooperation Countries (incl. Russia, CIS, Black Sea, Balkan States) 3rd Regional Workshop Moscow, Russia
 3rd Regional Workshop Moscow, Russia") EUTRAIN Europe Neighbourhood Cooperation Countries (incl. Russia, CIS, Black Sea, Balkan States) 3rd Regional Workshop Moscow, Russia 5-6 December 2012 Frank SMIT Directorate Transport "Horizontal aspects"
EUTRAIN Europe Neighbourhood Cooperation Countries (incl. Russia, CIS, Black Sea, Balkan States) 3rd Regional Workshop Moscow, Russia 5-6 December 2012 Frank SMIT Directorate Transport "Horizontal aspects"
A CER Statement on Brexit
 Brussels, 13 October 2017 A CER Statement on Brexit 1 CER aisbl - COMMUNITY OF EUROPEAN RAILWAY AND INFRASTRUCTURE COMPANIES Avenue des Arts, 53-1000 Bruxelles T: +32 (0)2 213 08 70 F: +32 (0)2 512 52
11 Transport Modal breakdown. Introduction
 Transport Transport plays a crucial role in an economy, transferring goods between the place of production and consumption, as well as transporting passengers for work or pleasure. However, key problems
ANNUAL ACTIVITY REPORT OF COORDINATOR KAREL VINCK ERTMS PROJECT. Brussels. August 2008
 ANNUAL ACTIVITY REPORT OF COORDINATOR KAREL VINCK ERTMS PROJECT Brussels August 2008 This report only represents the opinion of the European coordinator and does not prejudge the official position of the
Wind energy in Europe markets
 Wind energy in Europe markets Turkish Wind Energy Congress (TWEC 2012), 7 November 2012, Istanbul Christian Kjaer CEO European Wind Energy Association (EWEA) More than 600 members from almost 60 countries
Energy efficiency trends in EU industry
 Energy efficiency trends in EU industry Odyssee-Mure webinar series on Energy Efficiency organised by Leonardo ENERGY Bruno Lapillonne, Karine Pollier, Laura Sudries, Enerdata 16 November 2016 The webinar
11 October, 2016, Petten
 11 October, 2016, Petten The REmap approach IRENA s REmap programme explores potential, cost and benefits of doubling the share of renewables in global energy mix (SE4ALL objective), key to realize SDG
The Fourth Community Innovation Survey (CIS IV)
") The Fourth Community Innovation Survey (CIS IV) THE HARMONISED SURVEY QUESTIONNAIRE The Fourth Community Innovation Survey (Final Version: October 20 2004) This survey collects information about product
The Fourth Community Innovation Survey (CIS IV) THE HARMONISED SURVEY QUESTIONNAIRE The Fourth Community Innovation Survey (Final Version: October 20 2004) This survey collects information about product
Sustainable urban mobility in EU transport strategy
 Sustainable urban mobility in EU transport strategy May 2015 By including urban transport in the 2011 Transport White Paper, the EU has taken an important step in the right direction towards a more sustainable