Econometría 2: Análisis de series de Tiempo
|
|
|
- Horatio King
- 6 years ago
- Views:
Transcription
1 Econometría 2: Análisis de series de Tiempo Karoll GOMEZ Primer semestre 2016
2 I. Introduction
3 Content: 1. General overview 2. Times-Series vs Cross-section data 3. Time series components 4. How to deal with trend and seasonal components? 5. Stationarity concept
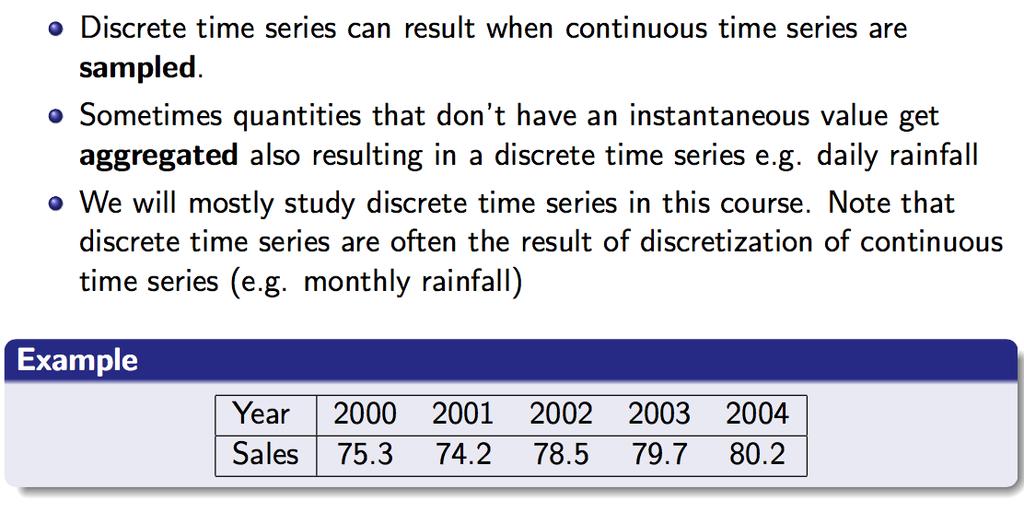
4 Introduction: Definition I. Overview: A time series is a set of observations X t (or denoted by Y t ), each one being recorded at a specific time t with 0 < t < T. Time series analysis refers to the branch of statistic where observation are collected sequentially in time, usually but no necessarily at equally spaced time points.
5 Introduction: Data
6 Introduction: Data
7 Introduction: Goals
8 Introduction: The importance of forecasting
9 Introduction: Times-Series in Economics Macro vs Financial Time series Macro limited by small number of observations available over long horizon. A typical data set has at best 20 years of monthly or 40 years of quarterly data, which sum up to less than 300 observations. This allows us to study linear relations between variables or model means. Macro Time series mostly focuses on means Financial data usually high-frequency over short period of time. This allows us to model volatility and higher moments. Examples: stock prices. Financial data mostly focuses on variances and higher moments.
10 Introduction: Examples
11 Introduction: Examples
12 Introduction: Examples
13 Introduction: Examples
14 Introduction: Examples
15 Introduction: Times-Series vs Cross-section II. Times-Series vs Cross-section data The main difference between time series and cross-section data is in dependence structure. Cross-section econometrics mainly deals with i.i.d. observations, while in time series each new arriving observation is stochastically depending on the previously observed. The dependence is our best friend and a great enemy. On one side, the dependence screw up your inferences: the Central Limit Theorem should be corrected to hold for dependent observations. That bring us to the task of correcting our procedures for dependence. On the other side, the dependence allow us to do more by exploiting it. For example, we can make forecasts (which are almost non-sense in cross-section).
16 Introduction: iid vs no-iid data
17 Introducción: iid vs no-iid data Then if the underlying common probability model for the X s is N(µ, σ 2 ) the sample mean and the sample variance are independently distributed. Question: What can one expect regarding the status of independence or dependence between sample mean and sample variance when the random variables X s are allowed to be non-iid or non-normal? Answer: The sample mean and the variance may or may not follow independent probability models!
18 Introducción: Consequences no-iid data The main consequences of long-range correlations in supposedly i.i.d. data are: The effects are mild for point estimation, but drastic for standard errors, confidence intervals and tests for not very small samples, and they increase exponentially with the size of the data set. Typical example: The true variance of the arithmetic mean of 130 observations can easily be 20 times the variance derived under the independence assumption.

19 Introduction: Time series Plot Times-Series components (types of dynamic variation)
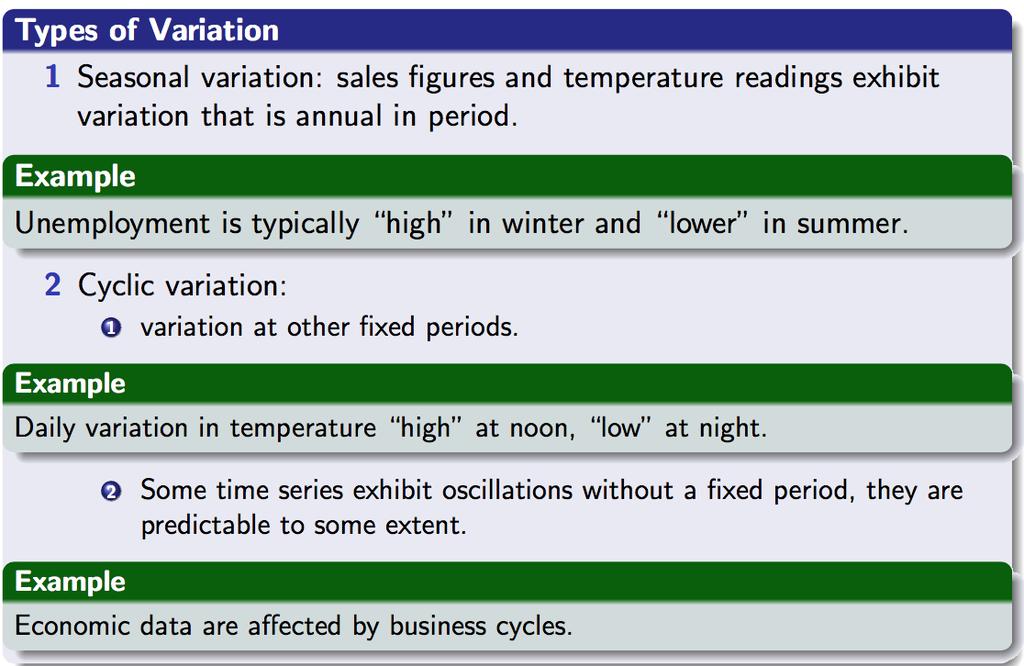
20 Introduction: Types of variation Are the series completely random?

21 Introduction: types of variation
22

23 Introduction: types of variation
24 Introduction: Types of variation Trend Component
25 Introduction: Types of variation Sesonal Component
26 Introduction: Types of variation Cyclical Component
27 Introduction: Types of variation Irregular Component
28 Introduction: Types of variation
29 Introduction: Types of variation
30 Introduction: Types of variation
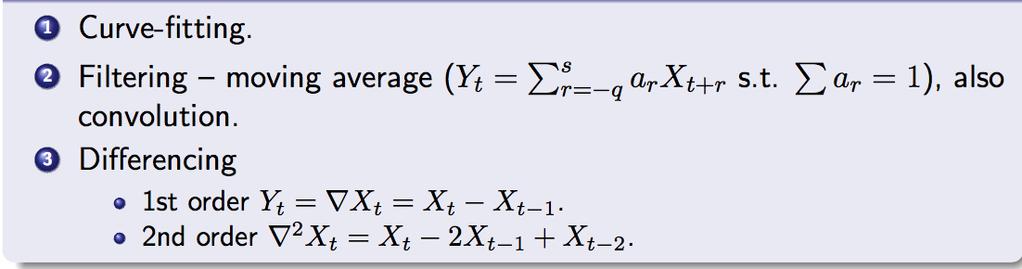
31 Introduction: Types of variation How to deal with trend and seasonal components? A. Time series with a trend component: curve Fitting, Filtering and differencing methods. B. Time series with a seasonal component: Seasonal filtering and Seasonal differencing methods
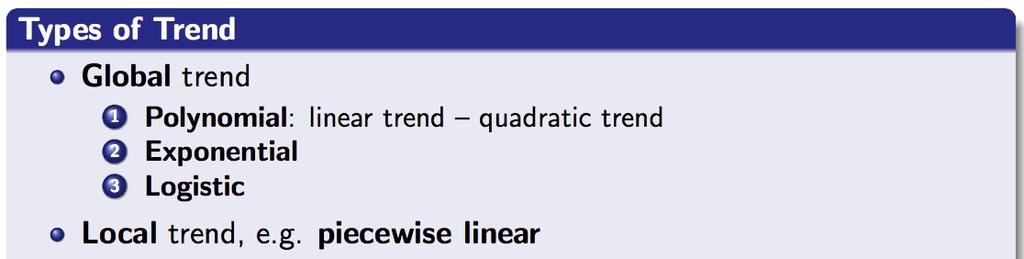
32 Introduction: Time series with trend A. Time series with a trend component There are two types of trends: Deterministic Stochastic A trending mean is a common violation of stationarity.
33 Introduction: Stochastic vs determisnistic There are two popular models for nonstationary series with a trending mean: 1. Trend stationary: The mean trend is deterministic. Once the trend is estimated and removed from the data, the residual series is a stationary stochastic process. 2. Difference stationary: The mean trend is stochastic. Differencing the series one or several times yields a stationary stochastic process.
34 Introduction: Trend features The distinction between a deterministic and stochastic trend has important implications for the long-term behavior of a process: * Time series with a deterministic trend always revert to the trend in the long run (the effects of shocks are eventually eliminated). Forecast intervals have constant width. ** Time series with a stochastic trend never recover from shocks to the system (the effects of shocks are permanent)
35 Introduction: Deterministic and Stochastic component of a trend Example: Considering the following process (Random walk plus drift): The solution is given by: X t = X t 1 + α + ε t X t = X 0 + αt + T t=1 where X 0 is an initial value, and the average behavior of X t in the long-run will be determined by the parameter α, which is the (unconditional) expected change in X t. ε t
36 Introduction: Deterministic vs Stochastic Trends We see that the random walk with drift has a trend, which includes a stochastic and deterministic component (that can account for a time series tendency to increase on average over time). 1 Deterministic part: series always changes by the same fixed amount from one period to the next. E[X t ] = X 0 + αt 2 Stochastic part: series changes from one period to the next is totally stochastic. T E[X t ] = X 0 + t=1 ε t
37 Introduction: Transitory vs Permanent effect of a trend What happend when a ε t shock occurs? 1 Deterministic part: E[X t ] = X 0 + αt which means X t will exhibit only temporary departures from the trend when a ε t shock occurs. 2 Stochastic part: E[X t ] = X 0 + which means X t will exhibit permanent departures from the trend when a ε t shock occurs. T t=1 ε t
38 Introduction: Deterministic vs Stochastic Trends The appropriate way to remove the trend components is the following (necessary to attained a stationary series): I Deterministic trend: Detrending (Curve-fitting or Filtering) II Stochastic trend: Differentiation

39 Introduction: Time series with trend I. Deterministc trend
40 Introduction: Time series with trend
41 Introduction: Time series with trend

42 Introduction: Curve fitting method

43 Introduction: Smoothing methods

44 Introduction: Smoothing methods
45 Introduction: Smoothing methods

46 Introduction: Differencing method II. Stochastic trend

47 Introduction: Modeling Seasonal variation B. Time series with a seasonal component

48 Introduction: Modeling Seasonal variation
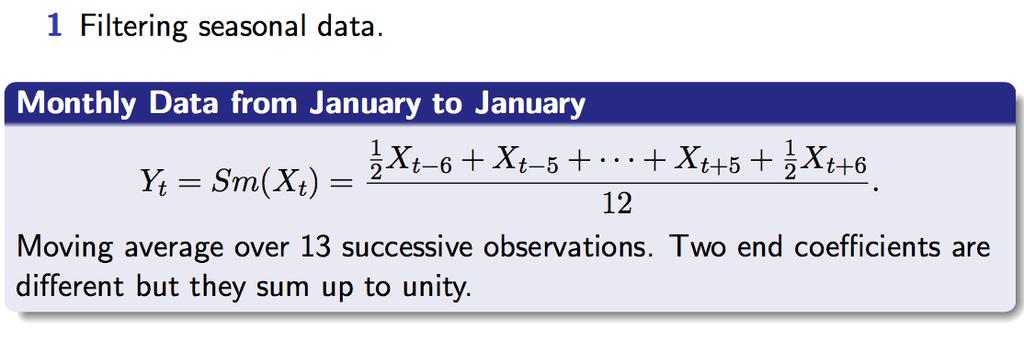

49 Introduction: Eliminating seasonal variation

50 Introduction: Modeling Seasonal variation
51 Introduction: Stationary vs Non-stationary series Stationarity in Time Series: A key idea in time series is that of stationarity. Roughly speaking, a time series is stationary if its behavior does not change over time. This means, for example, that the values always tend to vary about the same level and that their variability is constant over time. Obviously, not all time series are stationary. Indeed, non-stationary series tend to be the rule rather than the exception. However, some time series are related in simple ways to models which are stationary. Two important examples of this are:
52 Introduction: Stationary vs Non-stationary series
53 Introduction: Stationary vs Non-stationary series Are always those models a valid representation of trending time series? Answer: NO! Why might the trend model not be a valid representation? The trend and cyclical components of the time series might not be determined independently of one another. For instance, technology shocks might affect both the cyclical and trend behavior of the series.
54 Introduction: Stationary vs Non-stationary series What about integrated models? The Integrated model ( or random walk model) has a stochastic trend and may be a good starting point for describing the way many financial market prices and returns seem to behave. However, realizations of random walks will not usually be characterized by the tendency to grow over time that is so apparent in many macroeconomic time series. That is, the stochastic trend in the random walk is not sufficient to explain the kind of trend behavior we observe in the typical macroeconomic time series.
55 Introduction: Stationary vs Non-stationary series The general pattern of this data does not change over time so it can be regarded as stationary
56 Introduction: Stationary vs Non-stationary series There is a steady long-term increase in the yields. Over the period of observation a trend-plus-stationary series model looks like it might be appropriate. An integrated stationary series is another possibility (if trend is stochastic instead of deterministic).
57 Introduction: Stationary vs Non-stationary series There is clearly a strong seasonal effect on top of a general upward trend.
58 Introduction: Stationary vs Non-stationary series In summary: We know there are differences in the dynamic behavior of times series: the nature of the trend, the long-run behavior, and seasonal and/or components. In fact, there are different approaches to modeling trends in time series. Which process will be a valid representation of a trending time series? and How should we choose? It will not be obvious just by looking at the data. Time series plot helps but it is not enough! Does one or the other seem more plausible based on the economic theory (if there is any) that underlies the econometric model? How to apply formal tests to help select the appropriate form of the model?

59 Introduction: Stationary vs Non-stationary series Objectives of this course: Description - summary statistics, graphs. Analysis and interpretation - find a model to describe the time dependence in the data, can we interpret the model? Forecasting or prediction - given a sample from the series, forecast the next value, or the next few values
60 Exercise in R Exercise 1 in R We are going to analyze three time series: 1. Age of Death of Successive Kings of England 2. The number of births per month in New York city, from January 1946 to December The monthly sales for a souvenir shop at a beach resort town in Queensland, Australia, for January 1987-December Goals: Plot and to do a basic statistical analysis of the series Identify what components are presents in the series Decompose a time series into different components and interpret the results
Chapter 3. Introduction to Quantitative Macroeconomics. Measuring Business Cycles. Yann Algan Master EPP M1, 2010
 Chapter 3 Introduction to Quantitative Macroeconomics Measuring Business Cycles Yann Algan Master EPP M1, 2010 1. Traditional framework for Fluctuations Undergraduate textbook model Divide markets into
Stylised monetary facts
 Chapter 1 Stylised monetary facts 1.1 Motivation In this lecture we outline some simple summary statistics regarding the cyclical behaviour of real and nominal variables and their interactions. It provides
Building Confidence intervals for the Band-Pass and. Hodrick-Prescott Filters: An Application using Bootstrapping *
 Building Confidence intervals for the Band-Pass and Hodrick-Prescott Filters: An Application using Bootstrapping * Francisco A. Gallego Christian A. Johnson December Abstract This article generates innovative
The Effects of Permanent and Temporary Shocks to Permanent and Temporary Employment:
 The Effects of Permanent and Temporary Shocks to Permanent and Temporary Employment: Time Series Evidence from the Korean Economy November 2008 Sunoong Hwang and Youngmin Park School of Economics Yonsei
Current Methods for Flood Frequency Analysis
 Current Methods for Flood Frequency Analysis US Army Corps of Engineers Beth Faber, PhD, PE USACE, Hydrologic Engineering Center Workshop on Non-Stationarity, Hydrologic Frequency Analysis, and Water Management
8. Consumption, uncertainty, and the current account
 8. Consumption, uncertainty, and the current account Index: 8. Consumption, uncertainty, and the current account... 8. Introduction... 8. The deterministic case...3 8.3 Optimal consumption under uncertainty...4
Introduction to Research
 Introduction to Research Arun K. Tangirala Arun K. Tangirala, IIT Madras Introduction to Research 1 Objectives To learn the following: I What is data analysis? I Types of analyses I Different types of
DEPARTMENT OF QUANTITATIVE METHODS & INFORMATION SYSTEMS
 DEPARTMENT OF QUANTITATIVE METHODS & INFORMATION SYSTEMS Time Series and Their Components QMIS 320 Chapter 5 Fall 2010 Dr. Mohammad Zainal 2 Time series are often recorded at fixed time intervals. For
STRUCTURAL BREAKS AND TRADE ELASTICITIES IN BRAZIL: A TIME-VARYING COEFFICIENT APPROACH
 STRUCTURAL BREAKS AND TRADE ELASTICITIES IN BRAZIL: A TIME-VARYING COEFFICIENT APPROACH Angelo Marsiglia Fasolo ABSTRACT In this paper, new estimates for trade elasticities in Brazil are presented, using
DETECTING AND MEASURING SHIFTS IN THE DEMAND FOR DIRECT MAIL
 Chapter 3 DETECTING AND MEASURING SHIFTS IN THE DEMAND FOR DIRECT MAIL 3.1. Introduction This chapter evaluates the forecast accuracy of a structural econometric demand model for direct mail in Canada.
UNIT - II TIME SERIES
 UNIT - II TIME SERIES LEARNING OBJECTIVES At the end of this Chapter, you will be able to: Understand the components of Time Series Calculate the trend using graph, moving averages Calculate Seasonal variations
Lecture 9 - Sampling Distributions and the CLT
 Lecture 9 - Sampling Distributions and the CLT Sta102/BME102 February 15, 2016 Colin Rundel Variability of Estimates Mean Sample mean ( X): X = 1 n (x 1 + x 2 + x 3 + + x n ) = 1 n n i=1 x i Population
Seminar Master Major Financial Economics : Quantitative Methods in Finance
 M. Sc. Theoplasti Kolaiti Leibniz University Hannover Seminar Master Major Financial Economics : Quantitative Methods in Finance Winter Term 2018/2019 Please note: The seminar paper should be 15 pages
Modelling buyer behaviour - 2 Rate-frequency models
 Publishing Date: May 1993. 1993. All rights reserved. Copyright rests with the author. No part of this article may be reproduced without written permission from the author. Modelling buyer behaviour -
The information content of composite indicators of the euro area business cycle
 The information content of composite indicators of the euro area business cycle A number of public and private institutions have constructed composite indicators of the euro area business cycle. Composite
PERFORMANCE EVALUATION OF DEPENDENT TWO-STAGE SERVICES
 PERFORMANCE EVALUATION OF DEPENDENT TWO-STAGE SERVICES Werner Sandmann Department of Information Systems and Applied Computer Science University of Bamberg Feldkirchenstr. 21 D-96045, Bamberg, Germany
Vector Space Modeling for Aggregate and Industry Sectors in Kuwait
 Vector Space Modeling for Aggregate and Industry Sectors in Kuwait Kevin Lawler 1 1 Central Statistical Bureau: State of Kuwait/ U.N.D.P Abstract. Trend growth in total factor productivity (TFP) is unobserved;
Testing the Predictability of Consumption Growth: Evidence from China
 Auburn University Department of Economics Working Paper Series Testing the Predictability of Consumption Growth: Evidence from China Liping Gao and Hyeongwoo Kim Georgia Southern University; Auburn University
Inventory management under service level constraints with dynamic advanced order information
 SOCHASIC MODELS OF MANUFACURING AND SERVICE OPERAIONS SMMSO 2009 Inventory management under service level constraints with dynamic advanced order information Heinrich Kuhn Catholic University of Eichstätt-Ingolstadt,
Are Prices Procyclical? : A Disaggregate Level Analysis *
 Are Prices Procyclical? : A Disaggregate Level Analysis * Hemant Patil Department of Economics East Carolina University M. S. Research Paper Abstract This paper is an empirical investigation of the comovement
STATISTICAL TECHNIQUES. Data Analysis and Modelling
 STATISTICAL TECHNIQUES Data Analysis and Modelling DATA ANALYSIS & MODELLING Data collection and presentation Many of us probably some of the methods involved in collecting raw data. Once the data has
A NEW COINCIDENT INDICATOR FOR THE PORTUGUESE PRIVATE CONSUMPTION*
 A NEW COINCIDENT INDICATOR FOR THE PORTUGUESE PRIVATE CONSUMPTION* António Rua** 1. INTRODUCTION As it is well known, private consumption plays a major role in overall economic activity (1). Therefore,
Cluster-based Forecasting for Laboratory samples
 Cluster-based Forecasting for Laboratory samples Research paper Business Analytics Manoj Ashvin Jayaraj Vrije Universiteit Amsterdam Faculty of Science Business Analytics De Boelelaan 1081a 1081 HV Amsterdam
Revision confidence limits for recent data on trend levels, trend growth rates and seasonally adjusted levels
 W O R K I N G P A P E R S A N D S T U D I E S ISSN 1725-4825 Revision confidence limits for recent data on trend levels, trend growth rates and seasonally adjusted levels Conference on seasonality, seasonal
Seasonality in Revisions of Macroeconomic Data
 Journal of Official Statistics, Vol. 26, No. 2, 2010, pp. 361 369 Seasonality in Revisions of Macroeconomic Data Philip Hans Franses 1 and Rene Segers 1 We analyze the revision history of quarterly and
Employment, Trade Openness and Capital Formation: Time Series Evidence from Pakistan
 37 J. Glob. & Sci. Issues, Vol 1, Issue 4, (December 2013) ISSN 2307-6275 Employment, Trade Openness and Capital Formation: Time Series Evidence from Pakistan Muhammad Imran 1, Maqbool Hussian Sial 2 and
Targeted Growth Rates for Long-Horizon Crude Oil Price Forecasts
 Targeted Growth Rates for Long-Horizon Crude Oil Price Forecasts Stephen Snudden Queen s University Department of Economics snudden@econ.queensu.ca July 2017 This paper proposes growth rate transformations
In Chapter 3, we discussed the two broad classes of quantitative. Quantitative Forecasting Methods Using Time Series Data CHAPTER 5
 CHAPTER 5 Quantitative Forecasting Methods Using Time Series Data In Chapter 3, we discussed the two broad classes of quantitative methods, time series methods and causal methods. Time series methods are
Is Monthly US Natural Gas Consumption Stationary? New Evidence from a GARCH Unit Root Test with Structural Breaks
 DEPARTMENT OF ECONOMICS ISSN 1441-5429 DISCUSSION PAPER 09/14 Is Monthly US Natural Gas Consumption Stationary? New Evidence from a GARCH Unit Root Test with Structural Breaks Vinod Mishra and Russell
Analysis of Spanish Wholesale Gas Price Determinants and Non-stationarity Effects for Modelling
 Analysis of Spanish Wholesale Gas Price Determinants and Non-stationarity Effects for Modelling Cansado-Bravo P A 1, Rodríguez-Monroy C 2, Mármol-Acitores G 3 Abstract This study expands on previous research
A Cross-Country Study of the Symmetry of Business Cycles
 Economic Staff Paper Series Economics 1984 A Cross-Country Study of the Symmetry of Business Cycles Barry Falk Iowa State University Follow this and additional works at: http:lib.dr.iastate.eduecon_las_staffpapers
Multiple Equilibria and Selection by Learning in an Applied Setting
 Multiple Equilibria and Selection by Learning in an Applied Setting Robin S. Lee Ariel Pakes February 2, 2009 Abstract We explore two complementary approaches to counterfactual analysis in an applied setting
Time Series Modeling with Genetic Programming Relative to ARIMA Models
 Time Series Modeling with Genetic Programming Relative to ARIMA Models Miroslav Kľúčik 1, Jana Juriová 2, Marian Kľúčik 3 1 INFOSTAT, Slovakia, klucik@infostat.sk 2 INFOSTAT, Slovakia, juriova@infostat.sk
Methods and Applications of Statistics in Business, Finance, and Management Science
 Methods and Applications of Statistics in Business, Finance, and Management Science N. Balakrishnan McMaster University Department ofstatistics Hamilton, Ontario, Canada 4 WILEY A JOHN WILEY & SONS, INC.,
FORECASTING REVENUES FOR LANE TRANSIT DISTRICT: AN ECONOMETRIC ANALYSIS OF LANE COUNTY PAYROLLS
 FORECASTING REVENUES FOR LANE TRANSIT DISTRICT: AN ECONOMETRIC ANALYSIS OF LANE COUNTY PAYROLLS Brett M. Jossis, Zachary G. Penacho Presented to the Department of Economics, University of Oregon in partial
Business Quantitative Analysis [QU1] Examination Blueprint
![Business Quantitative Analysis [QU1] Examination Blueprint](/thumbs/94/121308410.jpg "Business Quantitative Analysis [QU1] Examination Blueprint") Business Quantitative Analysis [QU1] Examination Blueprint 2014-2015 Purpose The Business Quantitative Analysis [QU1] examination has been constructed using an examination blueprint. The blueprint, also
Business Quantitative Analysis [QU1] Examination Blueprint 2014-2015 Purpose The Business Quantitative Analysis [QU1] examination has been constructed using an examination blueprint. The blueprint, also
Operational Logistics Management (OLM612S)
") Ester Kalipi (M.LSCM.; B. Hons Logistics; B-tech. BA.; Dip. BA.; Cert. BA.) Operational Logistics Management (OLM612S) Unit 2: Logistics Planning 21 February 2018 Table of contents Unit Objectives The
Ester Kalipi (M.LSCM.; B. Hons Logistics; B-tech. BA.; Dip. BA.; Cert. BA.) Operational Logistics Management (OLM612S) Unit 2: Logistics Planning 21 February 2018 Table of contents Unit Objectives The
Forecasting Admissions in COMSATS Institute of Information Technology, CIIT, Islamabad
 Journal of Statistical Science and Application, February 2015, Vol. 3, No. 1-2, 25-29 doi: 10.17265/2328-224X/2015.12.003 D DAV I D PUBLISHING Forecasting Admissions in COMSATS Institute of Information
Correlation in Volatility Among Related Commodity Markets
 Correlation in Volatility Among Related Commodity arkets Clinton Watkins and ichael caleer Department of Economics, University of Western Australia (cwatkins@iinet.net.au) Abstract: Related commodity markets
Decision 411: Class 11
 Decision 411: Class 11 ARIMA models with regressors Forecasting new products Review of models: what to use and when ARIMA models with regressors By adding regressors to ARIMA models, you can combine the
COORDINATING DEMAND FORECASTING AND OPERATIONAL DECISION-MAKING WITH ASYMMETRIC COSTS: THE TREND CASE
 COORDINATING DEMAND FORECASTING AND OPERATIONAL DECISION-MAKING WITH ASYMMETRIC COSTS: THE TREND CASE ABSTRACT Robert M. Saltzman, San Francisco State University This article presents two methods for coordinating
Technical Appendix. Resolution of the canonical RBC Model. Master EPP, 2010
 Technical Appendix Resolution of the canonical RBC Model Master EPP, 2010 Questions What are the causes of macroeconomic fluctuations? To what extent optimal intertemporal behavior of households in a walrasssian
Quantification of Harm -advanced techniques- Mihail Busu, PhD Romanian Competition Council
 Quantification of Harm -advanced techniques- Mihail Busu, PhD Romanian Competition Council mihail.busu@competition.ro Summary: I. Comparison Methods 1. Interpolation Method 2. Seasonal Interpolation Method
Methods and estimation techniques of euro area GDP flash at T+30 days: preliminary reflections
 Methods and estimation techniques of euro area GDP flash at T+30 days: preliminary reflections (preliminary and incomplete) Filippo Moauro ISTAT - Direzione centrale di Contabilità Nazionale, Via A. Depretis
Distinguish between different types of numerical data and different data collection processes.
 Level: Diploma in Business Learning Outcomes 1.1 1.3 Distinguish between different types of numerical data and different data collection processes. Introduce the course by defining statistics and explaining
Seasonal Adjustment in ONS Quality through collaboration. Workshop on Handbook on Seasonal Adjustment Budapest 9 November 2006
 Seasonal Adjustment in ONS Quality through collaboration Workshop on Handbook on Seasonal Adjustment Budapest 9 November 2006 Quality through collaboration Structure of presentation 1. Requirement for
MODULE 1 LECTURE NOTES 2 MODELING OF WATER RESOURCES SYSTEMS
 1 MODULE 1 LECTURE NOTES 2 MODELING OF WATER RESOURCES SYSTEMS INTRODUCTION In this lecture we will discuss about the concept of a system, classification of systems and modeling of water resources systems.
DATA ANALYTICS WITH R, EXCEL & TABLEAU
 Learn. Do. Earn. DATA ANALYTICS WITH R, EXCEL & TABLEAU COURSE DETAILS centers@acadgild.com www.acadgild.com 90360 10796 Brief About this Course Data is the foundation for technology-driven digital age.
Modeling Heterogeneous User. Churn and Local Resilience of Unstructured P2P Networks
 Modeling Heterogeneous User Churn and Local Resilience of Unstructured P2P Networks Zhongmei Yao Joint work with Derek Leonard, Xiaoming Wang, and Dmitri Loguinov Internet Research Lab Department of Computer
Predictive Analytics
 Predictive Analytics Mani Janakiram, PhD Director, Supply Chain Intelligence & Analytics, Intel Corp. Adjunct Professor of Supply Chain, ASU October 2017 "Prediction is very difficult, especially if it's
Chapter 3. Table of Contents. Introduction. Empirical Methods for Demand Analysis
 Chapter 3 Empirical Methods for Demand Analysis Table of Contents 3.1 Elasticity 3.2 Regression Analysis 3.3 Properties & Significance of Coefficients 3.4 Regression Specification 3.5 Forecasting 3-2 Introduction
BUSINESS STATISTICS (PART-37) TIME SERIES & FORECASTING (PART-2) ANALYSIS FOR SECULAR TREND-I (UNITS V & VI)
 TIME SERIES & FORECASTING (PART-2) ANALYSIS FOR SECULAR TREND-I (UNITS V & VI)") BUSINESS STATISTICS (PART-37) TIME SERIES & FORECASTING (PART-2) ANALYSIS FOR SECULAR TREND-I (UNITS V & VI) 1. INTRODUCTION Hello viewers, we have been discussing the time series analysis and forecasting
BUSINESS STATISTICS (PART-37) TIME SERIES & FORECASTING (PART-2) ANALYSIS FOR SECULAR TREND-I (UNITS V & VI) 1. INTRODUCTION Hello viewers, we have been discussing the time series analysis and forecasting
A simple model for low flow forecasting in Mediterranean streams
 European Water 57: 337-343, 2017. 2017 E.W. Publications A simple model for low flow forecasting in Mediterranean streams K. Risva 1, D. Nikolopoulos 2, A. Efstratiadis 2 and I. Nalbantis 1* 1 School of
Ignazio Visco: -coin and the growth outlook for the euro area
 Ignazio Visco: -coin and the growth outlook for the euro area Presentation by Mr Ignazio Visco, Deputy Director General of the Bank of Italy, of the new Banca d Italia-CEPR Eurocoin indicator at the CEPR
Managers require good forecasts of future events. Business Analysts may choose from a wide range of forecasting techniques to support decision making.
 Managers require good forecasts of future events. Business Analysts may choose from a wide range of forecasting techniques to support decision making. Three major categories of forecasting approaches:
Trend inflation, inflation targets and inflation expectations
 Trend inflation, inflation targets and inflation expectations Discussion of papers by Adam & Weber, Slobodyan & Wouters, and Blanco Argia Sbordone ECB Conference Understanding Inflation: lessons from the
JMP TIP SHEET FOR BUSINESS STATISTICS CENGAGE LEARNING
 JMP TIP SHEET FOR BUSINESS STATISTICS CENGAGE LEARNING INTRODUCTION JMP software provides introductory statistics in a package designed to let students visually explore data in an interactive way with
2014 Summer Course School of Business, Nanjing University. State-Space Modelling and Its Applications in Economics and Finance
 2014 Summer Course School of Business, Nanjing University State-Space Modelling and Its Applications in Economics and Finance Instructor: Jun Ma (jma@cba.ua.edu) This version: May 14, 2014 Primary Textbooks:
Week 1 Business Forecasting
 Week 1 Business Forecasting Forecasting is an attempt to foresee the future by examining the past, present and trends Forecasting involves the prediction of future events or future outcomes of key variables.
Interpreting Data: How to Make Sense of the Numbers. Chris Neely Research Officer Federal Reserve Bank of St. Louis February 25, 2004
 Interpreting Data: How to Make Sense of the Numbers Chris Neely Research Officer Federal Reserve Bank of St. Louis February 25, 2004 Apologies Upfront Please excuse me if what I am about to tell you is
Forecasting Major Food Crops Production in Khyber Pakhtunkhwa, Pakistan
 Journal of Applied and Advanced Research 2017, 2(1): 21 30 doi.: 10.21839/jaar.2017.v2i1.40 http://www.phoenixpub.org/journals/index.php/jaar ISSN 2519-9412 / 2017 Phoenix Research Publishers Research
This is an important debate
 1 of 5 8/3/2009 2:46 PM Create account Login Research-based policy analysis and commentary from leading economists Andrew K. Rose 1 August 2009 Less synchronised business cycles would be good news for
INTERNATIONAL MONETARY FUND. Joint Vienna Institute / IMF Institute. Course on Macroeconomic Forecasting (JV10.14) Vienna, Austria
 Vienna, Austria") INTERNATIONAL MONETARY FUND Joint Vienna Institute / IMF Institute Course on Macroeconomic Forecasting (JV10.14) Vienna, Austria April 21 May 2, 2014 Reading List Session L 1 Overview of Macroeconomic
INTERNATIONAL MONETARY FUND Joint Vienna Institute / IMF Institute Course on Macroeconomic Forecasting (JV10.14) Vienna, Austria April 21 May 2, 2014 Reading List Session L 1 Overview of Macroeconomic
Container packing problem for stochastic inventory and optimal ordering through integer programming
 20th International Congress on Modelling and Simulation, Adelaide, Australia, 1 6 December 2013 www.mssanz.org.au/modsim2013 Container packing problem for stochastic inventory and optimal ordering through
RBC Models of Small Open Economies
 RBC Models of Small Open Economies Enrique G. Mendoza University of Pennsylvania, NBER & PIER Based on: The Terms of Trade, the Real Exchange Rate, and Economic Fluctuations, International Economic Review,
Estimation of Aggregate Demand and Supply Shocks Using Commodity Transaction Data
 October 13, 2016 Estimation of Aggregate Demand and Supply Shocks Using Commodity Transaction Data Naohito Abe, Noriko Inakura, Akiyuki Tonogi 1 Consumer Price Index in Japan Revision of tax rate 27 22
Decision 411: Class 11
 Decision 411: Class 11 ARIMA models with regressors Forecasting new products Review of models: what to use and when ARIMA models with regressors By adding regressors to ARIMA models, you can combine the
Stylized Facts of Business Cycles in the OECD Countries
 European Regional Science Association 36th European Congress ETH Zurich, Switzerland 26-30 August 1996 Jordi Pons, Ernest Pons and Jordi Suriñach Department of Econometrics, Statistics and Spanish Economy
Code Compulsory Module Credits Continuous Assignment
 CURRICULUM AND SCHEME OF EVALUATION Compulsory Modules Evaluation (%) Code Compulsory Module Credits Continuous Assignment Final Exam MA 5210 Probability and Statistics 3 40±10 60 10 MA 5202 Statistical
NOWCASTING PRIVATE CONSUMPTION: TRADITIONAL INDICATORS, UNCERTAINTY MEASURES, AND THE ROLE OF INTERNET SEARCH QUERY DATA
 NOWCASTING PRIVATE CONSUMPTION: TRADITIONAL INDICATORS, UNCERTAINTY MEASURES, AND THE ROLE OF INTERNET SEARCH QUERY DATA María Gil, Javier J. Pérez, and Alberto Urtasun Banco de España A. Jesus Sánchez
Design of Experiments
 Design of Experiments Statistical Principles of Research Design and Analysis Second Edition Robert O. Kuehl The University of Arizona Duxbury Thomson Learning* Pacific Grove Albany Belmont Bonn Boston
SINGLE MACHINE SEQUENCING. ISE480 Sequencing and Scheduling Fall semestre
 SINGLE MACHINE SEQUENCING 2011 2012 Fall semestre INTRODUCTION The pure sequencing problem is a specialized scheduling problem in which an ordering of the jobs completely determines a schedule. Moreover,
Short-Term Forecasting with ARIMA Models
 9 Short-Term Forecasting with ARIMA Models All models are wrong, some are useful GEORGE E. P. BOX (1919 2013) In this chapter, we introduce a class of techniques, called ARIMA (for Auto-Regressive Integrated
ANALYSING QUEUES USING CUMULATIVE GRAPHS
 AALYSIG QUEUES USIG CUMULATIVE GRAPHS G A Vignaux March 9, 1999 Abstract Queueing theory is the theory of congested systems. Usually it only handles steady state stochastic problems. In contrast, here
Principles of Inventory Management
 John A. Muckstadt Amar Sapra Principles of Inventory Management When You Are Down to Four, Order More fya Springer Inventories Are Everywhere 1 1.1 The Roles of Inventory 2 1.2 Fundamental Questions 5
Capacity and Complexity Control in Predicting the Spread Between Borrowing and Lending Interest Rates
 From: KDD-95 Proceedings. Copyright 1995, AAAI (www.aaai.org). All rights reserved. Capacity and Complexity Control in Predicting the Spread Between Borrowing and Lending Interest Rates Corinna Cortes
Technical Appendix. Resolution of the canonical RBC Model. Master EPP, 2011
 Technical Appendix Resolution of the canonical RBC Model Master EPP, 2011 1. Basic real business cycle model: Productivity shock and Consumption/saving Trade-off 1.1 Agents behavior Set-up Infinitively-lived
Forecasting Module 1. Learning Objectives. What is a time series? By Sue B. Schou Phone:
 Forecasting Module 1 By Sue B. Schou Phone: 28-282-468 Email: schosue@isu.edu Learning Objectives Identify the time series components in a graph Make a time series graph using Minitab What is a time series?
STAT 350 (Spring 2016) Homework 12 Online 1
 Homework 12 Online 1") STAT 350 (Spring 2016) Homework 12 Online 1 1. In simple linear regression, both the t and F tests can be used as model utility tests. 2. The sample correlation coefficient is a measure of the strength
STAT 350 (Spring 2016) Homework 12 Online 1 1. In simple linear regression, both the t and F tests can be used as model utility tests. 2. The sample correlation coefficient is a measure of the strength
INTRODUCTION AND CLASSIFICATION OF QUEUES 16.1 Introduction
 INTRODUCTION AND CLASSIFICATION OF QUEUES 16.1 Introduction The study of waiting lines, called queuing theory is one of the oldest and most widely used Operations Research techniques. Waiting lines are
Reconstructing Macroeconomics: A Perspective from Statistical Physics and Combinatorial Stochastic Processes
 Reconstructing Macroeconomics: A Perspective from Statistical Physics and Combinatorial Stochastic Processes M.Aoki and H.Yoshikawa December 9, 2005 1. Chapter 1 Introduction A New Approach to Macroeconomics
Choosing the Right Type of Forecasting Model: Introduction Statistics, Econometrics, and Forecasting Concept of Forecast Accuracy: Compared to What?
 Choosing the Right Type of Forecasting Model: Statistics, Econometrics, and Forecasting Concept of Forecast Accuracy: Compared to What? Structural Shifts in Parameters Model Misspecification Missing, Smoothed,
Math 29 Probability Final Exam. Saturday December 18, 2-5 pm in Merrill 03
 Name: Math 29 Probability Final Exam Saturday December 18, 2-5 pm in Merrill 03 Instructions: 1. Show all work. You may receive partial credit for partially completed problems. 2. You may use calculators
DYNAMICS OF ELECTRICITY DEMAND IN LESOTHO: A KALMAN FILTER APPROACH
 DYNAMICS OF ELECTRICITY DEMAND IN LESOTHO: A KALMAN FILTER APPROACH THAMAE Retselisitsoe Isaiah National University of Lesotho THAMAE Leboli Zachia National University of Lesotho THAMAE Thimothy Molefi
MATLAB Seminar for South African Reserve Bank
 MATLAB Seminar for South African Reserve Bank Nicole Beevers Application Engineer nicole.beevers@mathworks.com 2017 The MathWorks, Inc. 1 Agenda Introduction: Welcome from Opti-Num Solutions (15 mins)
Using Time-Series Analysis of Economic and Financial Phenomenon
 Using Time-Series Analysis of Economic and Financial Phenomenon Professor Constantin ANGHELACHE, Ph.D. Artifex University of Bucharest/ Academy of Economic Studies Bucharest Professor Radu Titus MARINESCU,
Population, Environmental Impacts, and Sustainability
 Population, Environmental Impacts, and Sustainability Reminders Environment External conditions that affect living organisms Ecology Study of relationships between living organisms and their environment
Estimating TFP in the Presence of Outliers and Leverage Points: An Examination of the KLEMS Dataset
 Catalogue no. 11F0027MIE No. 047 ISSN 1703-0404 ISBN 978-0-662-47187-5 Research Paper Economic Analysis (EA) Research Paper Series Estimating TFP in the Presence of Outliers and Leverage Points: An Examination
Reliability Engineering
 Alessandro Birolini Reliability Engineering Theory and Practice Sixth Edition Springer 1 Basic Concepts, Quality and Reliability Assurance of Complex Equipment & Systems.. 1 1.1 Introduction 1 1.2 Basic
Department of Economics, University of Michigan, Ann Arbor, MI
 Comment Lutz Kilian Department of Economics, University of Michigan, Ann Arbor, MI 489-22 Frank Diebold s personal reflections about the history of the DM test remind us that this test was originally designed
Department of Economics. Harvard University. Spring Honors General Exam. April 6, 2011
 Department of Economics. Harvard University. Spring 2011 Honors General Exam April 6, 2011 The exam has three sections: microeconomics (Questions 1 3), macroeconomics (Questions 4 6), and econometrics
DRAFT FOR DISCUSSION AND REVIEW, NOT TO BE CITED OR QUOTED
 DRAFT FOR DISCUSSION AND REVIEW, NOT TO BE CITED OR QUOTED USING MISSPECIFICATION TESTS ON WITHIN-SAMPLE MODELS AND CONSIDERING THE TRADE-OFF BETWEEN LEVEL AND SIGNIFICANCE AND POWER TO PROMOTE WELL-CALIBRATED,
Econometrics 3 (Topics in Time Series Analysis) Spring 2015
 Spring 2015") Econometrics 3 (Topics in Time Series Analysis) Spring 2015 Massimiliano Marcellino This course reviews classical methods and some recent developments for the analysis of time series data in economics,
Econometrics 3 (Topics in Time Series Analysis) Spring 2015 Massimiliano Marcellino This course reviews classical methods and some recent developments for the analysis of time series data in economics,
USING EXPECTATIONS DATA TO INFER MANAGERIAL OBJECTIVES AND CHOICES. Tat Y. Chan,* Barton H. Hamilton,* and Christopher Makler** November 1, 2006
 USING EXPECTATIONS DATA TO INFER MANAGERIAL OBJECTIVES AND CHOICES Tat Y. Chan,* Barton H. Hamilton,* and Christopher Makler** November 1, 6 VERY PRELIMINARY AND INCOMPLETE. PLEASE DO NOT CITE OR QUOTE!
Advertising and Market Share Dynamics. Minjung Park University of Minnesota
 Advertising and Market Share Dynamics Minjung Park University of Minnesota Introduction Sutton (1991) s Model of Endogenous Sunk Costs - As market size increases, (1) Market structure in exogenous sunk
Comment on A Macroeconomic Framework for Quantifying Systemic Risk by He and Krishnamurthy
 Comment on A Macroeconomic Framework for Quantifying Systemic Risk by He and Krishnamurthy Chris Sims May 2, 2013 c 2013 by Christopher A. Sims. This document is licensed under the Creative Commons Attribution-NonCommercial-ShareAlike
Multiple Choice Questions Sampling Distributions
 Multiple Choice Questions Sampling Distributions 1. The Gallup Poll has decided to increase the size of its random sample of Canadian voters from about 1500 people to about 4000 people. The effect of this
Temperature impacts on economic growth warrant stringent mitigation policy
 Temperature impacts on economic growth warrant stringent mitigation policy Figure SI.1: Diagrammatic illustration of different long-term effects of a one-period temperature shock depending on whether climate
The Role of Education for the Economic Growth of Bulgaria
 MPRA Munich Personal RePEc Archive The Role of Education for the Economic Growth of Bulgaria Mariya Neycheva Burgas Free University April 2014 Online at http://mpra.ub.uni-muenchen.de/55633/ MPRA Paper