SOIL CARBON RESEARCH PROGRAM: PROJECT 11 SOIL ORGANIC CARBON BALANCES IN TASMANIAN AGRICULTURAL SYSTEMS
|
|
|
- Jerome Tucker
- 5 years ago
- Views:
Transcription

1 SOIL CARBON RESEARCH PROGRAM: PROJECT 11 SOIL ORGANIC CARBON BALANCES IN TASMANIAN AGRICULTURAL SYSTEMS A collaborative project supported by the Climate Change Reduction Program of the Australian Department of Agriculture, Fisheries and Forestry and the Grains Research and Development Corporation involving staff and contributions from CSIRO, University of Western Australia, Department of Agriculture and Food of Western Australia, Victorian Department of Primary Industries, Murray Catchment Management Authority, Department of Environment and Natural Resources of South Australia, Queensland Government, University of New England, New South Wales Department of Primary Industries, The University of Tasmania, and The Tasmanian Institute of Agricultural Research.
2 SECTION C FINAL RESEARCH REPORT Project title: Soil Organic Carbon Balances in Tasmanian Agricultural Systems Lead organisation and partner organisations: Tasmanian Institute of Agriculture/School of Agricultural Science (TIA) and University of Tasmania Project team: Richard Doyle, Garth Oliver, Mark Downie, William Cotching, Ross Corkrey, Eve White and Jocelyn Parry-Jones Primary contact and contact details Dr Richard Doyle Tasmanian Institute of Agricultural/School of Agricultural Science (TIA) University of Tasmania Hobart Tasmania 1
3 Table of Contents EXECUTIVE SUMMARY 4 BACKGROUND 6 Tasmania soil carbon balances 8 METHODOLOGY 11 Sample site selection 11 Sampling procedure 12 Temporal Ferrosol study 12 SCaRP sampling protocol 13 Laboratory methods 13 Statistical methods 14 RESULTS OF THE PROJECT 15 Background to dataset 15 Unadjusted means - carbon 17 Carbon Stocks m 24 Results for adjusted data land use affects 25 Adjusted soil carbon land management effects 28 Soil bulk density 30 Total nitrogen 33 Carbon to nitrogen ratio 35 MIR predictions 36 Dermosols A case study 37 Temporal Ferrosol results 1997 to DISCUSSION OF THE RESULTS OF THE PROJECT 43 Soil carbon (TOC and Stocks) 43 Total nitrogen (TN) 44 Soil bulk density (BD) 45 Temporal Ferrosol study 1997 to LIST OF FINDINGS OF THE PROJECT 46 FUTURE RESEARCH NEEDS 47 PUBLICATIONS 48 PLAIN ENGLISH SUMMARY 49 REFERENCES 52 ACKNOWLEDGEMENTS 55 2
4 APPENDICES 56 Appendix 1: Explanation of land management variables 56 Appendix 2: Tables outlining explanatory models 58 Appendix 3: Significance of land use effects on carbon with adjusted P values 60 Appendix 4: Sample numbering key 61 Appendix 5: Unadjusted mean data 62 Appendix 6: Land Management Survey Form 67 Appendix 7: Farmer Fact Sheet 69 3
5 EXECUTIVE SUMMARY The aims of this project were; 1. To determine the levels of soil organic carbon and nitrogen in different soil types on agricultural land used for both pasture and cropping in Tasmania. 2. To determine the effect of agricultural land management practices and environmental influences on both soil organic carbon and nitrogen in different soil orders in Tasmania. 3. To contribute data about soil organic carbon in Tasmania to the national SCaRP project in order to calibrate a more economical and efficient method of measuring soil organic carbon using mid infrared (MIR) spectroscopy. 4. To measure soil bulk density to allow calculations of carbon stocks on a mass per hectare basis. 5. To physically fractionate the soil carbon and examine difference these fractions and how it changes over time. There were two aspects to meeting these aims 1) establishing a baseline in soil carbon, total nitrogen and soil bulk density in key soil orders and major land use types of Tasmania for SCaRP and 2) expanding on an existing temporal study of soil carbon and carbon size fractions in one soil order (Ferrosols). The Tasmanian component of the SCaRP investigated organic carbon, total nitrogen and bulk density levels in four key soil orders: dark cracking clay soils (Vertosol), reddish iron oxide rich soils (Ferrosol), structured uniform to gradational textured soils (Dermosol) and strong texture contrast soils (Chromosol/Sodosol/Kurosol). For each soil order the samples have been further split into two land uses, and. For each of these land uses, land management data such as tillage, fertiliser application, crop type, periods of fallow etc., were collected from farmers to determine impacts on soil carbon and nitrogen levels. Environmental data such as rainfall total and timing, temperature, altitude and aspect were included in the monitoring and analysis. The temporal component of the work involved further sampling and analysis of a 25-year long term study on the soil order Ferrosol in northern Tasmania initiated by Sparrow et al. (1999) which was also sampled in 2005 and The purpose of this study was to determine both the change in Total Organic Carbon (TOC) levels in pasture and cropping sites with time and to examine how two carbon fractions (> and < 50 µm) were affected by land use. The results indicate that rainfall, soil order and land use were all strong explanatory variables for differences in TOC, soil carbon Stock, total nitrogen (TN) and bulk density (BD) in Tasmania. sites had 29-36% less carbon in surface soils than pasture sites as well as high bulk densities. The difference between cropping and pasture was most pronounced in the top 0.1 m. The clay rich soils, Ferrosols and Vertosols, contained the greatest carbon Stocks. For all soil orders there is a significant difference in TOC between land uses at depths of m and m at P < For carbon Stocks there is a significant difference at 0 4
6 0.1 m depth to P<0.001, but no significance at depths below this. The highest carbon Stocks to 0.3 m depth occurs in Ferrosols at 150 Mg ha -1 under and 125 Mg ha -1 under, while the lowest are under Texture Contrast (Kurosols/Sodosols/Chromosols) soils at 65 Mg ha -1 and 58 Mg ha -1 respectively. The highest TOC values also occurred in Ferrosols at m depth, at 73 mg g -1 under and 47 mg g -1 under, with the lowest at the same depth under Texture Contrast soils with 33 mg g -1 and 23 mg g -1 respectively. Measuring Carbon as a Stock in Mg ha -1 can mask the true carbon story as land use affects soil bulk density. The carbon Stocks as measured in the m depth can be significantly influenced by compaction causing increased bulk density of the soil. Also any simple or quick field assessment of soil carbon will be hampered by the need to take adequate bulk density measurements needed to calculate stocks. Land management effects on soil carbon were minor when compared to rainfall, soil order and land use. The land management variables that had the most effect on carbon were the number of years cropped, and the number of years of conventional tillage. The 13-year temporal study of Ferrosol carbon showed that: 1. Total organic carbon (TOC) in surface horizons decreased with increasing years of prior cultivation, i.e., cropping intensity. 2. Total organic carbon levels did not decrease significantly between 1997 and 2010, suggesting that after many years of agricultural management equilibrium in carbon levels has been reached. 3. Sites which had been predominantly used for pasture had higher organic carbon levels than cropped sites. 4. Soil carbon associated with two soil particle size fractions (> and < 50 M) were uniformly affected by land use. There are limited options for farmers to sequester soil carbon in productive agricultural land. Of the factors that most influence soil carbon only the land use options and type and regularity of cultivation selected by the primary producer. The other dominating factors such as rainfall and soil order are exogenic parameters beyond the control of most farmers. Management practices can however have an impact. Increasing pasture leys, strategic irrigation and minimum till in cropping management may increase SOC or minimise further loss. This project was designed to look at soil carbon and total nitrogen levels in particular soil orders that have been influenced by a variety of management criteria over the last ten years. It was not a measure of the soil carbon stocks at the paddock level or for the most part changes in carbon levels over time. Further work is required to quantify the effects of management practices on soil carbon balances, and to identify the potential for sequestration or further carbon loss in particular soils. The possibility of soil carbon plateau at either the degradation or sequestration ends of the spectrum need to be identified before any carbon based compensation is considered. 5
7 BACKGROUND The world s soils have been both a source and a sink for atmospheric carbon since terrestrial life on earth began. Agriculture has driven the balance of this dynamic toward soil being a net source of atmospheric carbon. The challenge we face today is to reverse this trend in the face of a growing population, forecast to grow to over 9 billion by 2050 that will make increasing demands on agricultural production. Most agricultural soils have lost 30% to 75% of their antecedent soil organic carbon (SOC) pool or 30 to 40 t C ha -1 (Lal et al. 2007). This equates to about 30% of the post industrial revolution emissions of CO 2. It has been estimated that by 2050 world demand for cereals alone will need to increase by 50% (Lal 2010). This will put additional pressure on the Soil Organic Carbon (SOC) pools of agricultural soils requiring better soil management strategies to retain soil carbon. It is imperative that agricultural management practices are identified that either minimise or reverse this trend. One of the challenges to adjusting land management is the need for accurate measurement and monitoring of levels in SOC under agricultural production. In order to achieve this a number of technical obstacles need to be overcome. Firstly the existing SOC levels of a particular soil need to be assessed, and the potential of these soils to increase SOC. The difficulty in doing this arises from the high cost of SOC analysis using existing techniques in landscapes where SOC levels and soil type may vary across relatively small spatial increments. In addition to these analytical issues a sampling protocol that is representative of a particular spatial unit (paddock, farm and region) needs to be implemented. The type of land use has a major impact on how SOC levels change (Guo and Gifford 2002). Traditional cultivation methods cause a decline in SOC levels from the virgin or pastoral state. High input pastoral uses lead to soils with relatively high SOC levels (Cotching 2012). Even within these land use groups SOC levels fluctuate across climatic gradients of mean annual temperature and rainfall. For better carbon farming it is important to know the range of possible SOC levels that might be reasonably expected on each soil type under a particular land use and management practice. Soil Organic Matter (SOM) comprises a large range of carbon compounds mixed with mineral particles. Most soil carbon originates from plant debris that is progressively broken down by a range of organisms and incorporated into the mineral soil. Thus soil organic carbon is in a constant state of flux. High levels of inert charcoal can result in a soil with high TOC but with low levels of the functioning carbon needed for good soil health. Decaying organic matter is initially incorporated into the soil forming transient and then more persistent carbon pools (Baldock and Skjemstad 1999; Christensen 2001; Skjemstad et al. 2004). Protection of SOM against decomposition occurs in two main ways; either as part of the soil mineral matrix or by biochemical recalcitrance (Christensen 2001). Mineral protection occurs by soil aggregates physically protecting the SOM or it may be adsorbed on the reactive surfaces of mineral particles (Kaiser et al. 2002; Schulten and Leinweber 2000) with both processes inhibiting microbial access to the organic substrate (Lützow et al. 2006). Carbon exists in soils in a variety of forms and a range of classification systems exist. In some soils there is a mineral carbon component present as calcium and/or magnesium carbonate which is removed by acid leaching prior to determination of the total organic pool of carbon in soils (TOC). Charcoal (char-c) is the carbon which has accumulated due to fires 6
8 on and in the soil and this exists as a predominately inert pool. In Australia size separation has been used to divide the organic pool in to two parts. The first is defined as Particulate Organic Carbon (POC) that is considered to represent a more transient and active pool of decomposing coarser (>50 µm) organic material. The finer fraction (<50 µm) is considered to be a more stable carbon pool and is called the humate fraction (HUM). It is postulated to be more protected from oxidation either by chemical structure or the soil matrix of silt and clay sized particles and aggregates (Hassink et al. 1997). Active SOC simulation models such as the RothC model predict changes that would be associated with environmental and management criteria. They rely on the concept of TOC pools decomposing at various rates. In the case of the RothC model the pools are represented by resistant plant material RPM, inert organic matter IOM and humate pools. These pools are conceptual and cannot be physically or chemically measured. Skjemstad and Janik (1996) proposed a measurable system whereby the soil was physically fractionated at 53 µm giving a POC (=RPM) fraction >53 µm and a HUM and charcoal C (=IOM) fraction<53 µm. Each of these fractions could be individually measured. The large number of samples collected for SCaRP, and analysed empirically, will assist in such future modelling. It has long been established that rainfall and temperature can have an effect on SOC levels. The basic trend being that warm-moist soils have less TOC than cool-dry or cold-wet soils (Potter et al. 2007). A lack of adequate soil moisture results in the reduction of the biomass required to sequester carbon into the soil. There is evidence to suggest that the timing of rainfall can also effect SOC levels (Aanderud et al. 2010). Temperature has been found to be a major contributing factor to SOC levels (Potter et al. 2007). Low temperatures can result in the accumulation of undecomposed organic matter on the surface. Potter (2007) also found that SOC increased at cooler temperatures but as temperatures increased under the same tillage practice more crop residue returns were required to maintain SOC levels. Zimmermann et al.(2012) found that both SOC levels in mineral soil and the thickness of the O horizon increased with altitude. How global warming will affect soil carbon is another matter of research interest. Carbon sequestration is dependent on biomass accumulation that results originally from photosynthesising plant material through to the diverse ecology of microbial and biochemical decomposition. It has generally been accepted that C sequestration is also dependent on N inputs. Nitrogen application ought to promote humus formation by reducing the C:N ratio of carbonaceous crop residues. The lack of available N can reduce the amount of biomass produced and reduce the amount of crop waste and roots converted to humus (Lal 2001). However a number of long term studies have shown N application to have no effect on SOC accumulation (Halvorson et al. 2002; López-Bellido et al. 2010). Both these studies demonstrated that tillage and crop rotation had far more significant impacts. This was further backed up by Khan (2007) who demonstrated that NPK applications on identical soil, crop, climate and tillage had no impact on SOC after 50 years. A great deal of information has been generated over the years relating management practices with soil conditions. Much less has been achieved relating management practice with the various carbon pools. Agricultural land management practices have a major impact on the levels of soil carbon. Data about current soil carbon levels in different agricultural 7
9 lands is needed to help better understand how farming practices affect SOC levels. Previous studies have shown that variations in tillage for example can have significant effects on TOC levels (Ussiri and Lal 2009). Implementation of no till or controlled traffic, stubble retention, grass leys etc. may all make a contribution to slowing down or reversing the loss of SOC to the atmosphere. SOC can also be restored in soils by the adoption of management systems that add biomass to the soil, cause minimal soil disturbance, conserve soil and water, improve soil structure, enhance microbial activity and species diversity and strengthen mechanisms of nutrient cycling (Batjes 2004). Such practices include conservation tillage, decrease in fallow periods, use of cover crops, change from monoculture to crop rotation systems and increasing primary production by means of irrigation, fertiliser, manure (Jarecki and Lal 2003) and the application of lime (Batjes 2004). Tasmania soil carbon balances The present project forms one part of a national study examining the balances in soil carbon levels in a range of soils each with a range of different land uses. Tasmania as a relatively small island has a number of advantages when looking at SOC levels. While mean annual temperatures are relatively uniform across agricultural districts, rainfall, lithology and landforms types vary widely. All twelve Australian soil orders are found in Tasmania. The Tasmanian SCaRP project was designed to answer or expand our understanding of the following challenges and questions. 1) How to establish a robust sampling protocol that would be representative of a particular soil type under a given land use? 2) How to take a current snapshot of the SOC pool as it exists in specific soil orders under particular land uses and management practises? 3) Determine how current management practices effect SOC levels. 4) Determine if MIR analyses and partial least squares regressions (MIR PLS) of the derived data act as a reliable and economical technique for measuring SOC levels. 5) Determine the efficacy of MIR to measure the carbon levels of the various SOC fractions. 6) Determine the relevance of parameters such as clay content and C:N ratios on SOC levels. 7) Determine how has soil carbon changed in Ferrosols first sampled in 1997? The Tasmanian project has focussed on determining the differences in TOC levels in soil orders as classified under the Australian Soil Classification (Isbell 1996). The project recognised that different soil types have the potential to store and protect varying levels of SOC (Cotching 2012; Tan et al. 2004; Verheijen et al. 2005). Sample sites were selected to represent four key agricultural soil types: dark, reactive, cracking clay soils (Vertosols), reddish brown, iron oxide rich, clayey soils (Ferrosols), strong texture contrast soils (Chromosols/Sodosols/Kurosols), and other, structured soils (Dermosols). For each soil order identified the sites were further selected across two key land use types defined as dominantly and dominantly. In order to ensure a robust sample set at least 25 sites for each soil type land use combination were selected. Wherever 8
10 possible sites were pre-selected using published soil and topographic maps and then verified in the field. This reduced the possibility of biasing the sampling by relying on engaged or proactive farmer groups for site selection. The Australian Soil Classification System (ASC) is a hierarchical national system designed to suit Australian conditions (Isbell 1996). It does not necessarily differentiate a soils capacity to store or protect carbon; although it recognises carbon content in one soil order (Organosols) and is used to characterise certain classes of horizon e.g., humus and peaty topsoils. It has been suggested that the physical properties of soil such as clay content and level of aggregation are better indicators of soil carbon storage potential (Saidy et al. 2012). For this reason field texture was assessed on all samples taken including an estimate of clay content. This clay content estimate will be analysed to determine any correlation to SOC. Dermosols which have developed across different soil parent materials (SPM) were used to look at the impact of lithology and likely soil mineralogy on SOC within this single soil order. Dermosol are defined as soils with a structured B2 horizon and lacking strong texture contrast between A and B horizons (Isbell 1996). In Tasmania it is possible to sample Dermosol formed from igneous parent materials (both Tertiary basalt and Jurassic dolerite), Tertiary sediments (mostly clays) and those derived from Quaternary alluvium (mostly clayey). MIR data sets calibrated to these soil parent materials may provide more accurate predictions of TOC and its fractions although delays with this work will mean the detailed relationships will need to be reported elsewhere. Land use diversity in Tasmania The Tasmanian component of the project tried to incorporate the main agricultural management practises on the most common soil types used for agricultural production. is undertaken on much smaller land areas than the more typical broad acre grain, cotton and vegetable operations found on mainland Australia. Land use and management is characterised by a greater variety of crops and more diversity in crop rotations. There is also a mixture of irrigated and dry land operations. Recent, current and projected irrigation developments and a trend of low wool prices have seen increases in the areas of land opened up to both irrigated and arable uses. The cooler mean annual soil temperatures and generally higher mean annual rainfalls in Tasmania result in higher TOC levels within each soil order (Cotching 2012). All farmers were surveyed for records of the previous ten years of land use and management and data are presented below (Figure 1). Based on the surveyed data a cropping intensity value was applied to each site to examine the intensity of the cropping, this is a figure ranging from 0 (continuously pasture) to 1 (continuously cropped) for the period that we were able to obtain management data for. This value is referred to as the Crop Ratio. The SCaRP project has also generated data on total nitrogen (TN) levels and its impact of SOC levels. This was aided by the fact the University of Tasmania (UTAS) oxidative combustion elemental analyser (EA) allows for the simultaneous analysis of TN and TOC and hence C:N ratios can be calculated. In addition the land use histories give a record of fertiliser application for the last ten years. These data sets allow an analysis of the impact of total and applied nitrogen under varying soil types and land management systems on SOC. 9
11 Frequency of land management, including both and managements 3.2% 2.7% 8.9% 8.2% 9.8% 6.1% 35.2% Perennial Crop Cereal Mixed Annual Crop Veg Other Crop Root Veg Fallow Crop Perennial 26.0% Figure 1 Land use types, based on farmers ten year records, for the Tasmanian SCaRP project. Mid-Infrared (MIR) data and associated partial least square regression estimates The traditional analytical methods used to quantify and fractionate soils are time consuming and expensive. One of the aims of this project was to generate empirical data to facilitate the development of a more efficient and economical methods of measuring soil organic carbon using a dispersive Mid-Infrared (MIR) spectrometer. The MIR traces were analysed with partial least squares regression techniques against measured data to provide predictions. Diffuse reflectance spectroscopy provides an opportunity to monitor soil properties at a level of intensity that would be economically prohibitive using conventional methods of soil analysis. Dispersive MIR spectroscopy is rapid, inexpensive and non-destructive. Furthermore, a single spectrum allows for simultaneous characterisation and estimation of a diverse range of soil properties such as ph, CEC, silt, clay, exchangeable calcium (Ca) potassium (K) and aluminium (Al ) (Viscarra Rossel et al. 2006). This in addition to estimates of the carbon fractions; TOC, POC, HUM, carbonates and char-c (Janik et al. 2007). The predictive accuracy of dispersive MIR spectra is highly dependent on the quality and applicability of the calibration data sets used. For this reason it is the intent of this project to generate regional calibration sets that will enhance the accuracy of the MIR spectra. The full extent of this analysis will be reported elsewhere by Baldock et al (Report 2 - this issue). The SCaRP project has established an extensive MIR calibration set based on empirical measurements of thousands of different soils. These calibrations can later be refined to specific regions or soil orders to improve the predictability of soil properties such as TOC, the POM and HUM fractions, carbonates and charcoal. 10
. Figure 2 Location of sampled sites in Tasmania by soil order and land use.")
12 METHODOLOGY Sample site selection A total of 291 sites were used for sampling for the Tasmanian component of SCaRP. These sites were selected across the key agricultural regions of Tasmania (Figure 2). Figure 2 Location of sampled sites in Tasmania by soil order and land use. Potential sample sites were derived by a desktop study of topographic, geological and soil maps, rather than using existing farmers groups or TIA networks in an attempt to give a more representative cross section of land use and management across the agricultural regions of Tasmania. Where possible the existing Department of Primary Industries, Parks, Water and Environment (DPIPWE) Soil Condition Evaluation And Monitoring (SCEAM) sites were included as SCaRP sites. The purpose of which was to embed SCaRP data into the ongoing temporal SCEAM project. This resulted in a total of 61 complementary sites with an additional four sites being nearby to SCEAM sites which were not available for sampling 11
13 due to crop rotation, inappropriate land use history or because the sites were too steep and rocky. A total of 21 sites sampled for the SCaRP project were at locations that had previously been used by Sparrow et al. (1999) for an investigation of soil carbon in Ferrosols soils over time. Although we endeavoured to capture a representative of the four targeted soil orders across agricultural areas of Tasmania, some limitations on sampling dictated where sampling was undertaken. Sample sites were selected at generally more flat, uniform and less rocky areas, given that steep rocky slopes are difficult to access and sample. Flatter more uniform sites, are often of lower rock content, and this should be taken into account if analysing corrections for rocks and gravels. The regional sample site labelling code can be found in Appendix 4. Sampling procedure The national SCaRP project has chosen to sample soils cores to 0.3 m on a m grid basis at each soil type by land use combination. At least 25 soil order by land use combinations were required to provide sufficient representative samples for statistical analysis. By sampling from a relatively small area within each paddock potential errors due to sampling across soil types was minimised. However the carbon levels across the entire paddock selected remains unknown; although it might be estimated if the areas of each soil type are know. As SCaRP was not set up to generate baseline carbon contents on paddocks or farms, the issue of representativeness of the sampling site to the paddock was not as important as the within soil order information. It only mattered that the sampling site was a random representation of the management by soil type combination under investigation (SCaRP methods). Baseline assessments of carbon contents at the paddock and farm level provide problems that need to be overcome in the future. It may however suffice to know whether SOC pools are trending up or down for that sampled part of the paddock. Temporal Ferrosol study The study re-sampled and also re-analysed 25 sites on Ferrosols which were previously sampled as part of a long-term study in northern Tasmania. These sites were initially sampled in 1997 and then again in both 2005 and 2010 (Sparrow et al. 1999; Sparrow et al. 2011). The initial study looked at four land uses described as intermittent and continuous cropping and high input and low input pasture. The importance of further sampling these sites is to have some indication of temporal changes. A similar study of continuously cropped Ferrosols in subtropical Queensland found that declining SOC levels eventually plateau out at a level that reduced the productivity of these soils (Bell et al. 1995). In addition to TOC levels the archived 1997 soils and the 2010 samples were fractionated into two size fractions <50µm (HUM) and >50µm (POM). The purpose of which was to look at the change over time of the apparently transient POM and recalcitrant HUM pools. This was possible because the 1997 soil samples had been archived and were made available for this project by Drs Sparrow and Cotching (TIA-UTAS). The original 1997 and 2005 samples were analysed for TOC using the Walkley-Black method. For the sake of continuity the 2010 samples were also analysed with this method. The SCaRP project however used the oxidative combustion method. As a result both the 1997 and 2010 samples (in storage) were also re-analysed using oxidative combustion. Although restricted to Ferrosols this allows for the comparison of the different SOC analytical methods. 12
14 Sampling methods - temporal Ferrosol study This research forms a part of a long term study, in which the SOC content of Tasmanian Red Ferrosols was measured to determine the extent of management related change. Composite sampling was conducted at two depths ( m and m) over a total of 25 sites in Northern Tasmania, in 1997, 2005 and However unfortunately the 2005 samples were not archived. The 25 sites, for which we retained archived samples collected in 1997, were re-sampled in In this study individual sites were allocated to groups based on the dominant agricultural treatment received between 1997 and The two main land use categories were continuously cropped and predominantly pasture. Sub-samples of composite cores were taken at m and m using a 100 mm Jarret auger at 20 points within a grid. The soil was then processed as per standard SCaRP methodology. Bulk density was taken at three separate sites within the grid using 60 mm length x 60 mm diameter rings. Oxidative combustion was used for the determination of TOC and TN using a Perkin Elmer CHN-S 2400 analyser. Walkley-Black was used for TOC determination on the original samples and for confirmation on the 2010 samples. Fractionation of these samples was performed prior to the finalisation of the SCaRP procedure. Several steps were involved in the process of dividing each of the 100 samples into the two size fractions of POC (>50 µm) and HUM (<50 µm). Each sample was disaggregated by adding 20 g of soil and 90 ml of 5 g/l sodium hexametaphosphate solution to a 250 ml plastic container. The container was then placed on its side and shaken horizontally at rpm for hours by use of a Gio Gyrotory Shaker. Fractionation at 50 µm was carried out as per the SCaRP protocol. The fractions were then dried at 40 o C, reground and analysed for TOC using oxidative combustion. SCaRP sampling protocol The details of the sampling methodology are outlined in the SCaRP methods section (Sanderman, chapter 1 - this volume). The Tasmanian project differed slightly in that two different sample acquisition techniques were employed. On the soils with compact clayey subsoils, such as Vertosols and Texture Contrast soils, a truck mounted pneumatically assisted hydraulic push tube system was predominantly employed, whereas on the better structured more friable soils such as Ferrosols and Dermosols a 100 mm Jarret hand auger was predominantly used. In the case of the push tubes the extracted core was checked for compaction and the individual depth cores sliced to length using a modified mortice block. Samples acquired using the Jarret auger were taken at each of the depth intervals, mixed, quartered and sub-sampled into a composite sample bag. Laboratory methods With the exception of MIR and NMR the laboratories at UTAS performed all the processing, fractionation, analysis and freeze drying. This was undertaken in accordance with the standard SCaRP analytical protocols. TOC and TN analysis was performed using a Perkin Elmer CHN-S 2400 analyser and a Thermo Finnigan EA 1112 Series Flash Elemental Analyser. Air-dried, sieved and homogenised soil samples were later subjected to texture testing. Approximately 50 g of dried soil was wetted to field capacity, moulded into a ribbon and the field texture assessed for clay content (McDonald et al. 1990). Estimated clay contents were recorded increments of five percent. Higher clay soils >55% were attributed the arbitrary 13
15 value of 75%. It should be noted that 0.1 m interval homogenised field textures may not be reflective of natural horizon field textures. Statistical methods The nature of any possible spatial variation was evaluated by the use of variograms and the distribution of residuals by the use of quantile-quantile plots, all within PROC MIXED, SAS version 9.2. The alternative spatial covariance structures examined were no spatial correlation or the spherical, exponential, Gaussian, linear, log-linear, power, and Mateern structures. Of these the exponential proved most successful. Further examination by the use of the Akaike Information Criterion (AIC) indicated that an isotropic version was preferred to an anisotropic version of the exponential structure. The residuals plots indicated that the TOC, carbon stock, bulk density, TN, and C:N results at each depth required a log transformation to obtain Gaussian residuals distributions. This was done prior to model development. Model development proceeded in two steps. First, explanatory models for the data were developed for each sampling depth separately using PROC GLMSELECT, SAS version 9.2, to conduct stepwise selection to obtain models with the minimum corrected AIC. All models examined involving the main effects and also interactions of the categorical factors; soil order, land use, and aspect, with the continuous variables for April October and November March over both the previous five years and over the previous 30 years for rainfall, temperature and vapour pressure deficit, plus the continuous variables of elevation, slope, topographic wetness index, focal median of slope (300 m), focal range of elevation, plan curvature and profile curvature, and also the soil management data. The goodness-of-fit statistics, r 2 and root mean square deviation (RMSD) were generated for the models. The r 2 provides a measured of the degree of fit. The RMSD quantifies the degree of fit by indicating the variation of the model from the observed data, in the same units as the observed logtransformed data. In the second stage a mixed modelling approach was used to allow for spatial variation and which used the Satterthwaite degrees of freedom correction. The fitted models were used to construct adjusted outcome variables by subtracting away the continuous effect of 30-year mean annual rainfall. Mixed models were fitted to the adjusted outcomes and least square means calculated. Where appropriate, this was followed by multiple comparison adjustments using Tukey's method at the 95% confidence level to compare the means by soil order, land use and depth effects. The dependent variables TOC, Carbon stock, TN, BD, and C:N were analysed at each depth separately and for all land uses together with all the explanatory variables. Ratios of the means of the adjusted outcomes were plotted relative to the pasture land use. The grid sampling methodology used in this research means that type 1 errors may be increased and so only effects that were significant at P < 0.01 were accepted in the initial models. Tables of explanatory models are found in Appendix 2. Examination and presentation of unadjusted data in the graphs provide error bars set as +/- one standard error from means. Average is a synonym for the arithmetic mean. The unadjusted means data for TOC, Stock, BD, TN and C:N at all three depths are summarised in tables in Appendix 5. These represent all eight land use by soil order combinations and for all 14 sampling regions. 14
16 RESULTS OF THE PROJECT Background to dataset A total of 123 sites that were sampled were classified as. Of these sites, 104 had been permanently pasture (for the time period that management history was provided for), and 19 sites had a cropping intensity value between 0.1 and <0.3 (Figure 3). A total of 147 sites were classified as predominantly. Of these cropping sites 58 had been continuously cropped (for the period that management history was provided for), and 89 sites had a mixed cropping history, with cropping intensity values ranging from 0.4 to 0.9 (Figure 3). Five sites did not fit into either criteria as they had cropping intensity values between 0.3 and <0.4, these sites were labelled Intermittent so that they would not be considered when comparing with sites. For analysis of and sites together, these data points were included, and are useful in making a linear dataset of cropping intensity (Crop Ratio). The cropping intensity is illustrated below in Figure 3, this shows the spread of land use of the sampled sites with a clusters of 0 (permanent pasture) and 1 (permanent cropping) and a fairly even spread of data points in between. A total of 11 sites were sampled for which no land use management information was provided. 1 Intensity Crop ratio, 1 = site cropped 100% of the years Cumulative number of sample sites Figure 3 intensity of sites, measured as Crop Ratio where 1 = continuous cropping and 0 = continuous pasture in the last ten years. It should be noted that to observe trends in the effect of the crop grown, our crop definitions were condensed from 15 categories to four (see Appendix 1). These four categories were 15
17 selected by combining crops that were assumed to have similar effects on soil carbon, for example Crop Cereal contains Cereals, Poppies, Oilseed, Seed and Cereal Hay. Whilst Crop Root Vegetables contains both potatoes and bulb crops. A further breakdown of land uses is visible in Appendix 1. Table 1 below shows that cereal crops were dominant crop type, and perennial pasture was the dominant pasture type. Rotational grazing is the dominant grazing management, 95% of pasture sites had either rotational or set grazing, and only 5% mixed the two grazing management practises. Irrigation frequency is presented in Table 1 and shows irrigation to be common on cropping sites and uncommon on pasture sites, however no data on irrigation volume or timing was collected. Table 1 Breakdown of land management practises for type of crop, type of pasture, type of grazing management and irrigation frequency. Crop Category Percentage of cropping years Cereal 61% Grazing Management Percentage of total years Rotational Grazing 69% Vegetables Other 19% Set Stocking 31% Root Vegetables 14% Perennial 6% Category Percentage of pasture years Perennial 68% Grazing Management Percentage of sites Always Rotational 67% Mixed 21% Always Set 28% Mixed Annual 11% Set/Rotational 5% Crop//Fallow Percentage of total years Irrigation Frequency Percentage of years irrigated sites Perennial 35% Never 12% Crop Cereal 26% Intermittent 52% Mixed 10% Always 36% Annual 9% Crop Vegetables Other 8% Percentage of years irrigated sites Crop Root Vegetables 6% Never 75% Fallow 3% Intermittent 13% Crop Perennial 3% Always 12% Table 2 shows the average of farmer recorded fertiliser applications and indicates cropping sites are receiving times the fertiliser inputs of the pasture sites. Approximately 20% of fertiliser data was recorded as unknown. Table 2 Mean Annual Fertiliser Applications. Mean Annual Fertiliser Applications 16
18 N P K Initial modelling showed stubble management to have no significant difference on soil carbon, TN or bulk density, consequently it was dropped from further statistical modelling. Rainfall data by soil order is illustrated in Table 3. Ferrosols have the highest average of mean annual rainfalls while the Texture Contrast soils and Vertosols have the lowest rainfalls. Table 3 Rainfall data (mm) for the four soil orders analysed. Rainfall (mm) by Soil Order Mean Annual Median Annual Standard Deviation Minimum on Record Maximum on Record Dermosol Ferrosol Texture Contrast Vertosol Unadjusted means - carbon To analyse the effect of land use on soil carbon, all soil orders were first combined together, and later separated into the respective soil orders. The two land use groupings are and as defined in the methods. The data presented in this section are unadjusted means with +/- one standard error shown on all graphs. The log normal adjusted results will be discussed later along with further analysis of statistical variables, affects and valid models. Given that rainfall is a strongly correlated explanatory variable for soil carbon, a bias could be expected between soil orders towards soil orders found in higher rainfall areas (Table 3). Most of the data discussed in this section is summarised in Table 4. The two different measures of carbon (TOC and Stocks) are shown for each depth in Figure 4. Mean TOC for all Tasmanian soils m depth is 53 mg g -1 under pasture and 37 mg g -1 under cropping, while Stock values were 48 Mg ha -1 and 37 Mg ha -1 respectively. 17
19 60 Carbon Results, all soil types combined TOC (mg g 1 ) and Stock (Mg ha 1 ) mg g 1 for TOC, t ha 1 for Stock TOC Stock TOC Stock TOC Stock 0 0.1m m m Figure 4 TOC (mg g -1 ) and soil carbon Stocks (Mg ha -1 ) for each 0.1 m depth interval to 0.3 m. Figure 4 shows a trend of a greater difference in both TOC and Stock in m depth between the two land use categories. There are differences in TOC at m depth as a result of land use, but not at m depth. There are negligible differences in Stocks below 0.1 m. The P- values for significance are calculated on data normalised for rainfall on the log scale and indicate that for all soil types there is a significant difference in TOC between land uses at depths of m and m at P <0.001, and at m at P <0.05. For Carbon Stocks there is a significant difference at m depth to P<0.001, but no significance for depths m or m. It is clear that Cropped sites have less soil carbon than sites as TOC, especially at m depth but less so at m depth. However when converted to stocks, the difference between the two land uses is reduced. This is a result of the higher bulk density of cropping sites reducing the differences. This suggests when measuring carbon stocks that while cropping sites may have depleted carbon on a mass/mass basis, this loss is masked by the fact that with higher bulk density more soil is being sampled for a given depth interval. Figures 5 below show both the TOC and C Stocks in each soil order on the surface m. TOC is reported as mg g -1 and Stock is reported as Mg ha -1 per unit area per 0.1 m depth interval, both values are on the same Y-axis. 18
20 mg C/ g soil for TOC, Mg/ha per 0.1m depth for Stock TOC and Stock means at m depth TOC Stock TOC Stock TOC Stock TOC Stock Dermosol Ferrosol Texture contrast Vertosol Figure 5 Mean carbon content expressed as both TOC and Stock, for four soil types and two land use categories, at m sampling depth. Figures 5 and 6 again show the difference between land uses is more pronounced in TOC data than Stock data in each land use by soil order pairing. This is again a reflection of the generally higher bulk density in Cropped sites compared with sites. Each soil order behaves differently with respects to land use, with the differences between and expressed as a percentage difference in Figure 6. The highest TOC values at m occurred in Ferrosols at 73 mg g -1 under and 47 mg g -1 under, with the lowest under Texture Contrast soils with 33 mg g -1 and 23 mg g -1 respectively. 19
21 40% 35% 30% 25% 20% 15% 10% 5% 0% Carbon difference between and sites at m depth 35% 35% 36% 33% 29% 27% 20% 20% TOC Stock TOC Stock TOC Stock TOC Stock Dermosol Ferrosol Texture contrast Vertosol Figure 6 Percentage change in both TOC and Stock between and sites in m sampling depth. Figure 6 shows that Vertosols have the highest percentage change in TOC between land use categories at 36%, this is very similar to Dermosols and Ferrosols at 35%. Texture Contrast soils have the least difference in TOC between land use categories at 29%. The lower percentage change in Texture Contrast soils could reflect lower impact tillage practises and more ley phases within cropping rotations. The carbon Stock figures are quite different to the TOC figures, which reflect the change of bulk density between land uses being different from one soil order to the next. For Ferrosols the change in Stock is not much lower than the change in TOC (33% compared with 35%). This indicates that the Ferrosols soils do not increase in bulk density with cropping to the same degree as Vertosols which have a greater difference between TOC and Stock percentage changes with land use (36% compared with 20%). 20
22 60 TOC and Stock means at m depth TOC as mg g 1, Stock as Mg ha 1 TOC Stock TOC Stock TOC Stock TOC Stock Dermosol Ferrosol Texture contrast Vertosol Figure 7 TOC and Stock measures of carbon at m depth for all land use and soil order combinations. TOC as mg g 1, Stock as Mg ha TOC and Stocks at m depth TOC Stock TOC Stock TOC Stock TOC Stock Dermosol Ferrosol Texture contrast Vertosol Figure 8 TOC and Stock measures of carbon at m depth for all land use and soil order combinations. Figures 5, 7 and 8 indicate that the difference between pasture and cropping is strongest in the m depth, and this difference is reduced with depth. The levels of significance for are seen in the adjusted data which with a P<0.001 in the m depth for Dermosol, Ferrosols and Vertosols (for TOC), and Dermosol and Ferrosols (for Stock). However there 21
23 were no significant differences between land uses for either TOC or Stock at m or m depths using adjusted data. The following two charts, Figures 9 and 10, show the percentage change between means of TOC and Stock for the two land uses. These charts can be compared with Figure 6 illustrated the m depth. 40% 35% 30% 25% 20% 15% 10% 5% 0% Carbon difference between and sites at m depth 19% 11% 18% 11% 11% 0% 20% TOC Stock TOC Stock TOC Stock TOC Stock Dermosol Ferrosol Texture contrast Vertosol 3% Figure 9 Percentage change between TOC and Stock means for and land uses at m depth. 40% Carbon difference between and sites at m depth 35% 30% 25% 20% 15% 10% 5% 0% 5% 24% 17% 16% 12% 9% 4% 4% 0% TOC Stock TOC Stock TOC Stock TOC Stock Dermosol Ferrosol Texture contrast Vertosol Figure 10 Percentage change between means for and land uses at m depth. 22
24 Table 4 Surface soil properties (means) for Tasmanian soil orders under different land uses Soil order Land use No. of sites Depth TOC C stock C stock gc 1 Total Nitrogen Bulk density (m) (mg g -1 ) (Mg ha -1 ) (Mg C ha -1 ) (mg g -1 ) (Mg m -3 ) mean std dev mean std dev mean std dev mean std dev mean std dev Dermosol Ferrosol Texture Contrast Vertosol
25 Carbon Stocks m The highest carbon Stocks to 0.3 m depth occurs in Ferrosols at 150 Mg ha -1 under and 125 Mg ha -1 under, while the lowest are under Texture Contrast soils at 65 Mg ha -1 and 58 Mg ha -1 respectively (table 5). All carbon stocks to 0.3 m depth for each soil order and land use combination and percentage difference between land uses are shown in Table 5. The effect of soil order on carbon stocks is evident as all four soil orders are quite different from each other. Table 5 Carbon stocks to 0.3 m for each soil order and land use. Soil order Land use Tonnes C/ha Number of % difference mean sites sampled cropping/pasture Dermosol % Ferrosol % Texture Contrast % Vertosol % Carbon Stocks by Region Carbon (t ha 1 ) Figure 11 Soil carbon Stocks m by region. Figure 11 shows the total carbon stocks to 0.3 m depth by region. Figure 12 shows a similar trend with the carbon expressed as TOC, and includes all three depths.
26 Both Figures 11 and 12 illustrate higher carbon levels in the higher rainfall areas of; Devonport, Burnie, North East and Deloraine, whilst the drier regions of Brighton, Derwent Valley, Clarence have lower carbon values. Mean annual rainfall is plotted on Figure 12 to illustrate this. The tables of explanatory models in Appendix 2 (Table A1) has rainfall as one of the top two explanatory variables for TOC and C Stocks at all three depths and also for the total stocks to 0.3 m. TOC at three depth intervals by region with rainfall TOC as %C m m m Rainfall Average annual mean rainfall of sites (mm) Figure 12 TOC by region illustrating all three sampling depths. Results for adjusted data land use affects When the TOC values were adjusted to mean annual 30 year rainfall, it was found that land use significantly (P < ) explained the variation in TOC when all soil orders and all depths were analysed together. Rainfall adjusted TOC values at m depth were significantly (P < 0.01) greater under pasture than under cropping in Dermosols, Ferrosols and Vertosols but not in Texture Contrast soils (Figure 13). There were no significant difference between pasture and cropped sites on individual soil orders at m or m depths. 25
27 Figure 13 TOC values, data adjusted for rainfall on a log scale. Box plots with a dark central line indicating the adjusted median, the central box indicates the middle 50% of the data, and the whiskers extend to 1.5 times the inter-quartile range. Note 10 = m, 20 = m, 30 = m. 26
28 Figure 14 Carbon Stocks at three depths adjusted for rainfall on a log scale. Box plots with a dark central line indicating the adjusted median, the central box indicates the middle 50% of the data, and the whiskers extend to 1.5 times the inter-quartile range. Note 10 = m, 20 = m, 30 = m. Figures 13 and 14 highlight the difference between land use pairings for each soil order, are more pronounced when measuring TOC rather than carbon Stocks. 27
29 Adjusted soil carbon land management effects Variables that explained variation in the data at lower levels of significance than soil order or rainfall were identified by those variables that contributed to explanatory models with a level of significance of P < 0.05 rather than P < 0.01, see table of explanatory variables in Appendix 2 (Table A2). The two additional variables of Crop Ratio and Till 2 were identified as contributing to TOC and TN models indicating that the number of years cropped (crop ratio) and the number of years of conventional tillage (Till 2) also contributed to determining carbon content but to a lesser extent than either soil order or rainfall. Further investigation of the influence of tillage intensity was undertaken by analysing data from cropped sites after grouping according to whether a site had had five or more years of no or minimum tillage as well as two or less years of conventional tillage in the past ten years compared to sites that had had five or more years of conventional tillage in the past ten years. There was a trend for cropped sites under conventional tillage to have lower TOC concentrations than sites under no or minimum tillage but the differences were significant (P < 0.05) only in Ferrosols at m depth (Table 6). There was also a significant difference in annual rainfall between these groups of sites that may have accounted for the differences. C:N ratio was greater under conventional tillage than under no or minimum tillage but the differences were significant only on Ferrosols. BD was significantly lower at all depths sampled under no or minimum tillage than under conventional tillage on Dermosols and Ferrosols but not on Texture Contrast soils or Vertosols. Degradation of Tasmanian Texture Contrast soils has been associated with paddocks which had grown potatoes and would have had deeper and more rigorous cultivation than for other crops, which adds weight to the view that cropping rotation and associated soil management practices are critical for sustainable management of these soils (Cotching et al. 2001). Vertosols are thought to be resilient as they can redevelop good soil structure after only a few cycles of wetting and drying (Wenke and Grant 1994). It would appear that the type of tillage can influence TOC and C:N ratio but a more appropriately designed study is required to test this hypothesis more fully. The relevance of other variables (perennial crops, aspect, temperature, wetness index, and slope) in explaining data variation, particularly at lower soil depths, is uncertain as each of these variables appears only once in the series of models generated and so they are not consistently explaining variations in the data across a number of soil properties. We are not discounting the influence that these variables may have, but they would appear not to be dominant in explaining variation in soil properties. 28
30 Table 6 Effect of tillage intensity on soil properties at different depths of cropped sites. Soil order n 5 or more years no till or minimum tillage 5 or more years conventional tillage m m m 30 year annual rainfall (mm) N m m m 30 year annual rainfall (mm) Total organic carbon (mg g -1 ) Dermosol Ferrosol * 1024* Texture Contrast Vertosol * Bulk density (Mg m -3 ) Dermosol 1.0* 1.2* 1.2* Ferrosol 0.9* 0.9* 1.0* Texture Contrast Vertosol N fertiliser applied (kg/ha/yr) N fertiliser applied (kg/ha/yr) C:N Dermosol Ferrosol 12.3* 12.6* 13.4* nr Texture Contrast Vertosol * Difference between tillage categories by T-test at P < 0.05
31 Soil bulk density Figure 15 shows the bulk density (BD) of the four soil orders examined. The Texture Contrast soils had the highest BD ranging from 1.09 to 1.48 with depth. The Ferrosols the lowest ranging from 0.99 to 1.13 with depth. All soil types displayed an increase in BD with depth, and a higher bulk density for sites than for sites. The difference between BD between and land uses is given in Figure 16. g cm Bulk Density Dermosol g cm Bulk Density Ferrosol Depth (cm) and land use Depth (cm) and land use g cm Bulk Density Texture Contrast g cm Bulk Density Vertosol Depth (cm) and land use Depth (cm) and land use Figure 15 Bulk Density for all three sample depths and for both land uses. The four charts represent the four different soil orders. Error bars represent one Standard Error.
32 18% 16% Percent Change in Bulk Density with Landuse and Depth 16% 16% 17% 15% 14% 12% 11% 11% 10% 8% 6% 4% 2% 8% 2% 6% 4% 9% 7% 0% Dermosol Ferrosol Texture Contrast Vertosol Figure 16 Percentage increase in bulk density from to. All cropping sites are consistently of higher BD than pasture sites. Ferrosols have the least difference in bulk density between land uses, and Vertosols have the highest. This suggests that Ferrosols, which typically have strong aggregation, are more resilient to compaction when cultivated. Vertosols are the most susceptible to compaction and/or are able to build structure under pasture. There seems to be no obvious trends with depth. All values for the different soil orders are similar to those previously published for Sodosols (Cotching et al. 2001), Dermosols (Cotching et al. 2002a), Ferrosols (Sparrow et al. 1999) and Vertosols (Cotching et al. 2002b). Mean BD and TOC were significantly (P < 0.001) negatively correlated (r 2 = -0.69; P < 0.01 for all individual samples) as organic matter generally lowers the mean density of soils. BD increased with increasing depth (Figure 15) due to less organic matter and consolidation. The differences in BD between pasture and cropped sites within particular soil orders after data was adjusted for rainfall were significant only in Vertosols at m depth (P = on log adjusted data) and at m depth (P = on log adjusted data) indicating that Vertosols are the most susceptible to compaction under cropping. Texture Contrast soils have the greatest mean BD at each depth of the soil orders sampled. Figure 17 also illustrates a trend of increasing BD with the land use, and also of BD increasing with depth. BD exceeded 1.4 and 1.5 Mg m 3 at m and m respectively in only a few Dermosols and Texture Contrast soils under both pasture and cropping (data not shown). These densities indicate that compaction has occurred at these sites and root growth is likely to be inhibited. Soil compaction can occur under intensive stock grazing due to treading damage (Houlbrooke et al. 2011) and under cropping (Cotching et al. 2002a) which has implications for pasture production, soil hydrology and nutrient movement. BD in Ferrosols and Vertosols rarely exceeded 1.2 and 1.3 Mg m -3 at m and m depths respectively indicating that these soils are not severely compacted and root growth is not likely to be inhibited. 31
33 Figure 17 Bulk density for each soil order by land use and depth adjusted for rainfall on a log scale. Box plots with a dark central line indicating the adjusted median, the central box indicates the middle 50% of the data, and the whiskers extend to 1.5 times the inter-quartile range. Note 10 = m, 20 = m, 30 = m. 32
34 Figure 18 Ratio of means of bulk density between and land uses. The higher the value above 1 the greater the relative bulk density of cropped soils. Figure 18 shows the ratio of means for bulk density between cropping and pasture sites. This illustrates that Vertosols have the largest difference between bulk density between the two land uses, and Ferrosols the least. This indicates Vertosols are clearly the most deleteriously affected by cropping. There seems to be no obvious trend with depth. Vertosols are a swelling and reactive clay soil and due to their high plasticity, at lower water contents, may be more prone to soil compaction. Also under pasture the additional root mass and organic matter can contribute to better structure and consequently lower bulk density. Total nitrogen Total nitrogen (TN) levels showed similar trends to carbon, with respects to changes with depth and between soil types. The TN exhibited a noticeable change between the two land uses at the upper depth, tending to a negligible difference at depth. Figures illustrate TN for each depth. 33
35 7.0 Total Nitrogen Total nitrogn (mg g 1 ) Dermosol Ferrosol Texture Contrast Vertosol Dermosol Ferrosol Texture Contrast Vertosol Dermosol Ferrosol Texture Contrast Vertosol Figure 19 Total nitrogen levels (unadjusted raw means) for each soil order, land use and sampling depth. TN was found to be strongly correlated with TOC (r 2 = to 0.998; P < 0.01) and the influences of land use and depth are as described earlier for TOC (refer to Carbon Results). TN concentrations are similar to previously published values in Tasmania except for Dermosols which are lower in this study than those reported by Cotching et al. (2002a). This difference may be due to the sites in this study being collected from greater area in Tasmania than in the previous study. The SCaRP study covered greater numbers of lower rainfall areas than Cotching et al. (2002a) especially for Dermosols, this is likely to have contributed to lower TN in Dermosols. Soil order, land use and sampling depth were all significant (P < 0.01) in explaining the variance in TN values, the rainfall adjusted data is illustrated below in Figure
36 Figure 20 Total nitrogen, adjusted for rainfall on a log scale. Box plots with a dark central line indicating the adjusted median, the central box indicates the middle 50% of the data, and the whiskers extend to 1.5 times the inter-quartile range. Note 10 = m, 20 = m, 30 = m. Carbon to nitrogen ratio There were no significant differences in C:N ratio due to difference in land use or soil order as there was a large amount of variability in the data (Figure 21). The only significant differences in C:N were due to sampling depth under pasture in Ferrosols and Texture Contrast soils which had significantly (P = and P = respectively) greater C:N at m than at m depth. Ferrosols had the greatest increase in C:N on cropped sites compared to pasture sites but this increase was not significant (P < 0.05). 35
37 Figure 21 Carbon to Nitrogen ratio, data adjusted for rainfall on a log scale. Box plots with a dark central line indicating the adjusted median, the central box indicates the middle 50% of the data, and the whiskers extend to 1.5 times the inter-quartile range. Note 10 = m, 20 = m, 30 = m. MIR predictions The results of the MIR predictions will be only briefly covered here, a comprehensive analysis can be found in Baldock et al (Report 2 - this issue). Figure 22 shows MIR predictions for TOC in all Tasmanian soils with an r 2 of This was based on a calibration set of all Tasmanian soils rather than a soil order specific calibration. Of the soil orders Vertosol was the most accurate with an r 2 of and Ferrosol the least with an r 2 of 0.599, refer to Table 7. The r 2 values are calculated from a linear line of best fit set at Y- intercept of zero. 36
38 MIR TOC plotted against measured TOC y = x R² = TOC MIR Predicted TOC Measured EA Figure 22 MIR predicted TOC plotted against measured TOC. For all soil types and all depths. Table 7 r 2 values calculated in Excel from a linear line of best fit set with Y intercept of zero. Soil Order r 2 Dermosol 0.82 Ferrosol 0.60 Texture Contrast 0.73 Vertosol 0.89 Dermosols A case study Soils within the Dermosol order vary significantly throughout Tasmania. Dermosols are formed on a variety of Soil Parent Materials (SPM) which have variable clay contents and mineralogy. These variabilities within the soil order makes the Dermosol order a good case study for soil carbon in Tasmania. Consequently Dermosols form the largest sample data set (93 sample sites). Effect of soil parent materials on Dermosols Figure 23 summarises the carbon stocks for Dermosols formed on different SPM. These include Tertiary basalt, Jurassic dolerite, Tertiary sediments and Quaternary alluvial deposits. These figures are for both land uses combined. The chart on the left uses unadjusted data, and illustrates an obvious difference between the two igneous SPM groups (basalt and dolerite). 37
39 Carbon Stocks (t/ha) Mean Stocks of Dermosols Rainfall Adjusted Stocks of 12.0 on differing parent material Dermosols C Stocks after rainfall adjustments Basalt (10) Dolerite (25) Tert + t/b (23) Soil Parent Material Alluvial (34) 0.0 Basalt (10) Dolerite (25) Tertiary (22) Alluvial (33) Soil Parent Material Figure 23 Mean carbon stocks of Dermosols formed on different parent materials. Sample size (n) is in brackets, Tert + t/b is an abbreviation for Tertiary clay deposits plus soils mapped as formed on Tertiary clays but with obvious basalt influences. After the carbon stocks have been adjusted for rainfall (chart on the right), the values are now very similar across all SPM s. When comparing the two charts in Figure 23 you will notice that the error bars are reduced after adjusting for rainfall, this suggests that a lot of the variation could be accounted for with rainfall. Also the highest value on the rainfall adjusted chart (Alluvial) happens to be the SPM category with the highest ratio of pasture to cropping sites (see Figure 24), this could account for the higher C stocks in that category. Dermosols mapped as Cressy soil series (Doyle 1993) were identified during sampling as having three different SPM or substrate groups. These groups include; Tertiary sediments, Tertiary sediments with basalt influence and Cressy Soil Series underlain by basalt bedrock. When these three groups were analysed the mean Stocks at m were 88, 89 and 91 Mg ha -1 respectively, and all groups were within one standard error of each other. The fact that these soils were not significantly different illustrates that this narrow range of SPM or substrate differences had negligible effect on carbon Stocks within the Cressy soil series. This also justifies combining all Cressy series soils together in the one group being Tertiary. 38
40 Carbon Stocks m (Mg ha 1 ) Carbon Stocks in Dermosol soils of different SPM and land use pasture (6) cropping (4) pasture (14) cropping (11) pasture (4) cropping (19) pasture (25) cropping (9) Basalt Dolerite Tert + T/B Alluvial Figure 24 Dermosols formed on various parent materials and illustrating land use categories. Figure 24 shows the carbon Stocks to 0.3 m for and land uses for each SPM class of Dermosol. There are differences are between each land use category with always have greater stocks of carbon. The largest difference is stocks between and land uses is found in the Alluvial category with a 30% difference while the weakest is found in the Doleritic category with only a 4% difference. Clay content impacts on Dermosols Field textures undertaken on homogenised soil samples indicate that there is negligible correlation between field textured clay content and TOC in Dermosols (data not presented). Graphs of clay content plotted against TOC give r 2 values are less than 0.01 at all depths, indicating little or no relationship. Clay content data generated by GRDC on m depth samples also shows poor correlations. Preliminary analysis undertaken through Excel generated X Y scatter charts show the strongest relationship to be between percent silt plus percent clay within the Dermosol order plotted against TOC, this yielded an r 2 value of R 2 values for Ferrosols, Dermosol and Ferrosol combined, and for rainfall adjusted data all yielded lower r 2 values. Temporal Ferrosol results 1997 to 2010 At the depth of m there were no significant changes in the mean percentage of TOC between 1997 and 2010 in either the cropping or pasture land use categories (Figure 25). TOC decreased in Cropped sites by 10%, while it increased by 1.5% in site over the 13 year period. There was a significant difference (P< 0.001) between and land uses in TOC levels in 2010 but not 1997 (shown as C%, Figure 25). The mean TOC for Cropped sites was 4.4 %, whereas the mean for sites was 6.6 % in TOC was thus 33% higher in than in Cropped Ferrosols at the depth of m in 2010, and 25% higher in There were no significant differences in the mean values of TOC between these categories in either 1997 and 2010 at the depth of m. Therefore, 39

41 the type of management has had a larger influence on TOC in the m depth than the m depth. Figure 25 Mean TOC difference between 1997 and 2010 for continuously cropped and predominately pasture sites. Error bars = standard deviation of error. 40
. 1.0 Proportion of TOC (combustion) 0.9 0.8 0.7 0.6 0.5 0.4 0.3 0.2 0.")
42 Figure 26 Mean carbon (%) change in POC and HUM as proportion of the TOC between 1997 and 2010 for continuously cropped and predominately pasture sites, mm depth. There were no significant changes in the proportions of POC to HUM between 1997 and 2010, in either land use category (Figure 26). 1.0 Proportion of TOC (combustion) Years cropped in past 38 R² = R² = HUM mm HUM mm POC mm POC mm R² = R² = Figure 27 Relationship between number of years cropped (out of 38) and proportion of POC and HUM in TOC. Figure 27 shows a weak trend in changing ratios of POC to HUM with years cropped at m, and no trend at m. The weak trends at m suggests an increase in the ratio of HUM at the expense of POC as cropping frequency increases. However this is not significant (Figure 26) and has an r 2 of 0.32 (Figure 27).
43 Figure 28 shows a downward trend of % Carbon, measured by Walkley-Black method, in the upper depth ( m) with respect to years cropped. This relationship has a strong r 2 value of Whilst the lower horizon has a very poor relationship between years cropped and % Carbon, with an r 2 value of mm mm 5 Carbon % (Wakley Black) R² = R² = Years cropped out of past 38 Figure 28 TOC (%) in 2010 at both depths, plotted against the number of years cropped out of past
44 DISCUSSION OF THE RESULTS OF THE PROJECT Soil carbon (TOC and Stocks) Total organic carbon (TOC in mg g -1 ) values were a more sensitive measure of soil carbon changes than carbon Stocks (Mg C ha -1 ). This is because generally increases soil bulk density (Mg m -3 ) while decreasing TOC levels thus masking soil carbon changes as measured by Stocks. sites had on average 35% less TOC than sites at m depth on both Dermosols and Ferrosols. This difference was 36% on Vertosols and 29% less on Texture Contrast grouping of soils (Table 1). The corresponding difference at m depth was 18 20% for all soil orders except the Texture Contrast group which was only 11%. This change in TOC is similar to that reported in other Tasmanian studies of 30% on Ferrosols, 39% on Dermosol, 33% on Sodosols and 35% on Vertosols (Cotching et al. 2001; Cotching et al. 2002a; Cotching et al. 2002c; Sparrow et al. 1999). These differences are less than the 59% reported by (Guo and Gifford 2002)and the 51% reported by (Luo et al. 2010). The strongest influences on soil organic carbon concentration were soil order and mean annual rainfall with land use also being a more dominant influence than soil management variables including the number of crops grown and the type and amount of tillage practiced. There was a trend for conventional tillage to be associated with lower TOC than with no or minimum tillage but our results were not significant (P < 0.05). The influence of soil depth decreased in a similar manner so that TOC was influenced at all depths in all soil orders by mean annual rainfall but soil management had a greater influence closer to the soil surface. We found no associations between TOC and other soil management variables including grazing management, number of long fallows, type of crop grown, or rates and types of fertilisers applied. We propose the following hierarchy of influence of variables on SOC: Soil order > mean annual rainfall > land use > cropping frequency > tillage type Adjusting carbon values for rainfall is a useful mechanism for normalising for climatic variables to compare carbon amongst soil orders, depths and land uses. Significantly greater soil bulk densities occurred on Cropped than on sites and greater bulk density was also associated with conventional tillage on Dermosols and Ferrosols rather than with no or minimum tillage. The results indicate that carbon changes depending on whether the measured value is TOC (% Carbon) or Stocks (t ha -1 ). Quick simple assessments of soil carbon will remain elusive if a series of bulk density measurements are required for each paddock. Our findings confirm the collective understanding about the variables that influence soil organic carbon content (Ingram and Fernandes 2001). This being that potential SOC is determined by inherent soil characteristics of clay content and clay type that are encapsulated by the soil orders of the Australian Soil Classification, although we found no relationship to clay content with a single soil order (Dermosols). Organic matter is adsorbed onto clay surfaces, coated with clay particles or buried inside small pores or aggregates and is physically protected from decomposition and so the amount of SOC stored in soil tends to increase with increasing aggregation and clay content. The attainable level of SOC is
45 determined by the local climate predominantly annual rainfall. Actual SOC levels are determined by the type of land use and the soil management practices undertaken. Although it is not possible to increase the attainable SOC of a given soil, management practices determine whether or not the attainable storage of SOC in soil is achieved. Farmers can influence soil organic carbon concentrations more by their choice of land use than their day to day soil management but even though the influence of management is not as great as other site inherent variables, farmers are still able to select practices that retain more soil organic carbon than others. Farmers can retain more carbon by cropping less frequently and by reducing the amount of tillage during soil preparation as long as these practices are considered together with economic sustainability. More frequent annual cropping is likely to result in decreased organic matter inputs as much of the above ground crop biomass is invariably removed from the site and plants are not growing all year round. We might have expected Crop Ratio and Till 2 to be correlated but this was not apparent as r 2 = This could suggest that frequently cropped sites are not necessarily sites that are conventionally tilled. The association between the number of years cropped and TOC on individual soil types was weaker than expected with r at m for cropped sites only and r 2 < for both cropped and pasture sites combined on each soil order. This suggests that land use categories (/) gives a better explanation of TOC than the linear cropping intensity measurement of Crop Ratio. These results contrast with other Tasmanian studies where a significant negative correlation between SOC and years cropped was reported with r 2 = for Ferrosols (Sparrow et al. 2011) and r 2 = for Dermosols (Cotching et al b). The poorer correlation found in this data set could be due to the shorter length of management history record of ten years compared to the longer 25 year records in other studies, or the data set being dominated by pasture sites with ten of the last ten years under perennial pasture. TOC takes many years to adjust to different organic matter inputs (Baldock and Skjemstad 1999; Christensen and Johnston 1997) and monitoring of TOC over a period of ten years or less appears unlikely to demonstrate relationships to management history. Preliminary investigations of the soil order Dermosol indicated neither soil parent material nor field texture differences influenced TOC, however this requires further investigation. For unadjusted data, higher TOC levels were observed in Dermosols formed on basalt than those formed on dolerite. However after the TOC data was normalised for mean rainfall there was no obvious difference across any SPM. The Dermosol family makes a good case study to examine the effects of SPM and clay content, as they are an order with highly variable SPM and clay contents. They are also the order that the most samples were collect from, with 96 sites. Further work within the Dermosol soil order is ongoing, with Mark Downie to present an oral poster at the joint ASSSI and NZSSS Soil Science Conference in December. Total nitrogen (TN) Overall TN values closely mirrored TOC values. This is illustrated by fairly uniform C:N ratios in the range of The large difference in mean application rate of nitrogen fertiliser to pasture and cropped sites (Table 2) might have been expected to result in differences in the C:N ratio as greater availability of nitrogen in the soil can result in increased microbial digestion of carbon rich organic material resulting in a reduction in the C:N ratio (Hoyle and 44
46 Murphy 2006). This effect was not noticed; in fact the data is suggesting the converse in Ferrosols. The Cropped Ferrosols had the highest C:N ratio in the surface m yet they receive the highest N fertiliser applications. Table 6 supports this and shows significantly higher C:N ratios at all depths for sites with 5-years of conventional vs 5-years of no or minimum tillage. This data appears converse to the relationship suggested by Hoyle and Murphy (2006). This relationship may be specific to Ferrosols given they are very well structured and hence have free draining characteristics. This could lead to short term stimulation of plant growth, increasing soil carbon, followed by nitrate leaching, consequently reducing the TN and resulting in a higher C:N ratio. Nitrogen fertiliser applications were up to three times higher on cropped paddocks than pasture paddocks. Yet both TN and TOC were markedly reduced in cropping paddocks. Soil bulk density (BD) Ferrosols appear more resilient to increases in bulk density (BD) under vs while Vertosols had the greatest differences in BD across the two land uses. This suggests Vertosols are more prone to compaction, as suggested by greater BD under, or that may be increasing aggregation and hence porosity. Temporal Ferrosol study 1997 to 2010 There are three key conclusions that can be drawn from the 13-year temporal study of Ferrosols. Firstly despite a declining trend TOC levels for sites and higher levels of TOC in soils no significant change was measured in TOC levels between 1997 and 2010 in either land use class. This suggests that soil TOC levels are slow to change once established in a given management system. Indeed Sparrow et al. (1999) posed the question of whether TOC in cropped Red Ferrosols in Northern Tasmania had reached or was approaching equilibrium levels. Secondly there were no significant changes in the proportion of POC to HUM in either management system over the thirteen years between measurements, they changed uniformly. This appears counter to other studies and may be the result of the humate fraction not being as well protected within the iron oxide-kaolin clay type structural system of the Red Ferrosols. Finally it was the upper sampling depth ( m) which displayed the strongest relationship between TOC and years cropped (r ). Whilst the lower depth had only a very weak relationship (r ). 45
47 LIST OF FINDINGS OF THE PROJECT 1) Changes in TOC are generally only significant at cm and so this depth offers a potential simplification to further measurements or farm monitoring and sampling for carbon accounting purposes. 2) compared to pastoral land uses lowers soil carbon by >30% in the top 0.1 m of most soil orders but changes are less significant and <20% lower below this depth. 3) Changes in total nitrogen strongly mirrored changes in TOC. 4) Land use differences of vs appear as the key decision a farmer can make to increase TOC in Tasmanian environments. 5) Soil order (ASC) has the biggest effect on soil carbon. Ranking impacts on soil carbon is as follows: ASC > Rainfall > Land Use > Frequency > Tillage Type. 6) TOC vs Stock approaches to carbon accounting assessment are important considerations for government. It seems soil bulk density changes caused by soil compaction may be masking soil carbon losses in many situations. 7) No significant change in TOC was measurable in established long term productive Ferrosols despite a thirteen year assessment period ( ). 8) A temporal study of Ferrosols indicates there is no change in the ratio of POC and HUM fractions measured over 13 years ( ). 9) Soil order (ASC) is the major variable controlling carbon levels in Tasmanian soils. This is followed by mean annual rainfall and then land use. Other soil management affects had the least measurable impact on soil carbon; but key ones indicated include number of years cropped and the amount of conventional tillage vs minimum tillage and no tillage, termed conservation agriculture. 10) Higher fertiliser nitrogen inputs in cropping soils do not contribute to increased C stocks. 11) MIR as a method shows significant promise but will need further local calibration to improve accuracy to detect the slow changes in TOC levels. 12) A temporal study of Ferrosols found at m the number of years cropped (over a 38 year period) was strongly correlated (r ) with a decline in TOC. However at m this was very weakly correlated (r ). This suggests land use intensity maybe a long term explanatory for C loss in upper soil horizons. 13) Ferrosols are the most resilient, of the four soil orders assessed, to soil compaction as measured by bulk density increases under cropping, while Vertosols appear most susceptible. 14) Variations in soil parent material and field texture as assessed within the soil order Dermosols appears to have little impact on carbon levels. This suggests soil aggregation may be more significant than clay content per-se. 46
48 FUTURE RESEARCH NEEDS The project has identified the following possible research gaps. There is a need for more regional, appropriately designed, long-term and replicated controlled trials if we are to understand the multiple variables which affect the dynamics of soil carbon. There is a need to establish a temporal study to determine how quickly Cropped soils return to the higher TOC levels typically found under. This experiment ought to be undertaken on each of the major soil orders. Temporal studies require archival of collected samples. The value of such sample archives was shown by the data set generated from Ferrosol samples collected in Further work on the effects of soil mineralogy and clay content are needed to better understand soil type impacts on carbon storage. Although SPM is contributing little to carbon stocks in Dermosols in Tasmania, its influence on the bulk density differences due to land use between the high clay Ferrosol and Vertosol soils illustrates an effect that clay mineralogy has on soil structure, and would suggest an indirect influence on Carbon stocks. MIR calibrations based on specific soil orders or soil characteristics may be needed to improve Carbon measurements. In addition the 1997 samples could be re-analysed using the Walkley-Black method to determine the extent of TOC degradation during storage. 47
49 PUBLICATIONS Cotching, B. (2011) Soil Carbon Research in Tasmania TFGA Circular Head engaged farmers 35 attendees Forum. Oliver, G., Doyle, R., White, E. and Downie, M. (2011) An overview of the Tasmanian component of the SCaRP project: Soil organic carbon balances in Tasmanian Agricultural Systems. Academic and industry representatives 65 attendees Parry-Jones, J. (2010) The effect of agricultural land use on the soil carbon fractions of Red Ferrosols in North West Tasmania. Honours thesis. School of Agricultural Science, University of Tasmania. Parry-Jones, J., Oliver, G., White, E., Doyle, R., Cotching, B. and Sparrow, L. (2011) The effect of agricultural land use on the soil carbon fractions of Red Ferrosols in North West Tasmania Poster presented at the National Climate Change Research Program for Primary Industries, Melbourne, February Scandrett, J., Oliver, G., Doyle, R. and White, E. (2010) Agricultural land use and soil carbon in Tasmania. Poster presented at The 19 th World Congress of Soil Science, Brisbane 1-6 August Scandrett, J. (2009) Soil carbon dynamics under different land uses in Tasmania. Honours thesis. School of Agricultural Science, University of Tasmania. Sparrow, L.A., Cotching, W.E., Parry-Jones, J., Oliver, G., White, E., Doyle, R. (2011) Changes in carbon and soil fertility in agricultural soils in Tasmania, Australia. Presented at the 12 th International Symposium on Soil and Plant Analysis, June 2011, Crete. 48
50 PLAIN ENGLISH SUMMARY Project Details Project Title: GRDC Project Number:Primary Contact:Organisation: Phone: Fax: Objectives Background Research Soil Organic Carbon Balances in Tasmanian Agricultural Systems CSA00019 Richard Doyle Tasmanian Institute of Agricultural Science (TIAR) To determine current levels of soil organic carbon in different soil types on agricultural land used for pasture and cropping. 2. To determine the effect of agricultural land management practices and environmental influences on soil organic carbon in different soil types. 3. To contribute data about soil organic carbon in Tasmania to the national SCaRP project in order to calibrate a more economical and efficient method of measuring soil organic carbon using mid infrared (MIR) spectroscopy. Soils hold the potential for storing carbon and as such could help to mitigate against the effects of climate change attributed to carbon dioxide levels in the atmosphere. Agricultural land use and management practices are thought to have an impact on soil carbon levels. By acquiring data about current ( ) soil carbon levels in a range of key soil types used for different agriculture activities we can gain an understanding of how farming practices, soil type and other environmental factors affect soil organic carbon levels. Furthermore, the data will be used to enhance calibration of a mid infrared system (MIR), which has the potential to be a more efficient and economical method of measuring soil carbon than the methods that are currently available. There are two aspects to the Tasmanian component of the SCaRP study. The first aspect of the work involved investigating organic carbon levels in a range of soil types throughout the state. The samples came from four key soil groups: dark, cracking clay soils (Vertosols), iron oxide rich soils (Ferrosols), strong texture contrast soils (Chromosols/Sodosols/Kurosols) and other well structured soils (Dermsols). For each soil order/group the samples 49
51 were further split into two land uses, and. For each of these land uses, 10-year land management records such as tillage, fertiliser application, crop type, periods of fallow etc were collected to determine impacts on soil carbon levels. Environmental data such as rainfall total and timing, temperature, altitude and aspect were included in the monitoring. Outcomes Secondly component involved 25 long-term (13 years) field sites on Red Ferrosols in northern Tasmania which were re-sampled. This sampling contributed to a long term study initiated by TIA- UTAS in 1997 and re-sampled in 2005 and The purpose of this study was to determine not only the change in TOC levels in pasture and cropping sites but also which carbon pools,either Particulate Organic Carbon (POC) and/or Humus (HUM), are most affected by land use. Soil order, rainfall and land use were all strong explanatory variables for differences in TOC, soil carbon stock, total nitrogen (TN) and bulk density (BD) in Tasmania. sites had 29-36% less carbon in surface soils than pasture sites, they also had 2 16% greater bulk densities. The difference between cropping and pasture was most pronounced in the top 0.1 m. Clay rich soils (Ferrosols and Vertosols) contained the greatest carbon stocks. Land management effects on soil carbon were minor when compared to soil order, rainfall and land use. The number of years cropped and the number of years of conventional tillage had the most affect on soil carbon, i.e., both decreased soil carbon. The long term field trial component of the project, conducted on Ferrosols in the north of Tasmania, has been completed. This aspect of the study showed that: 1. Total organic carbon decreased with increasing years of cultivation. However, soil carbon levels did not decrease between 1997 and 2010, suggesting that after many years of agricultural management equilibrium may have been reached. 2. Sites which had been predominantly used for pasture had higher organic carbon levels than cropped sites. 3. Carbon associated with two soil particle size fractions (POC and HUM) which play different roles in the soil, was uniformly affected by land use. Implications Farmers can influence TOC and carbon Stocks more by their choice of land use than their day to day soil management but even though the influence of management is not as great as other site inherent variables, farmers are still able to select practices that retain more soil organic carbon than others, i.e. minimum tillage and increased ley phases. 50
52 Publications The results of the long term field trial suggest that carbon associated with the two soil fractions in Ferrosols is affected in a similar way by land management. This conflicts with the findings of previous studies which have generally shown that organic carbon associated with the humic fraction is more resistant to depletion than carbon associated with the particulate fraction. Red Ferrosols may have different properties to other soil types in regard to soil carbon storage. Cotching, B. (2011) Soil Carbon Research in Tasmania TFGA Circular Head engaged farmers 35 attendees Forum. Oliver, G., Doyle, R., White, E. and Downie, M. (2011) An overview of the Tasmanian component of the SCaRP project: Soil organic carbon balances in Tasmanian Agricultural Systems. Academic and industry representatives 65 attendees Parry-Jones, J. (2010) The effect of agricultural land use on the soil carbon fractions of Red Ferrosols in North West Tasmania. Honours thesis. School of Agricultural Science, University of Tasmania. Parry-Jones, J., Oliver, G., White, E., Doyle, R., Cotching, B. and Sparrow, L. (2011) The effect of agricultural land use on the soil carbon fractions of Red Ferrosols in North West Tasmania Poster presented at the National Climate Change Research Program for Primary Industries, Melbourne, February Scandrett, J., Oliver, G., Doyle, R. and White, E. (2010) Agricultural land use and soil carbon in Tasmania. Poster presented at The 19 th World Congress of Soil Science, Brisbane 1-6 August Sparrow, L.A., Cotching, W.E., Parry-Jones, J., Oliver, G., White, E., Doyle, R. (2011) Changes in carbon and soil fertility in agricultural soils in Tasmania, Australia. Presented at the 12 th International Symposium on Soil and Plant Analysis, June 2011, Crete. 51
53 REFERENCES Aanderud Z, Richards J, Svejcar T, James J (2010) A Shift in Seasonal Rainfall Reduces Soil Organic Carbon Storage in a Cold Desert. Ecosystems 13(5), Baldock JA, Skjemstad JO (1999) Soil organic carbon/soil organic matter. Soil Analysis: An Interpretation Manual, Batjes NH (2004) Estimation of soil carbon gains upon improved management within croplands and grasslands of Africa. Environment, Development and Sustainability 6(1-2), Bell MJ, Harch GR, Bridge BJ (1995) Effects of continuous cultivation on ferrosols in subtropical Southeast Queensland. I.Site characterization, crop yields and soil chemical status. Australian Journal of Agricultural Research 46(1), Christensen BT (2001) Physical fractionation of soil and structural and functional complexity in organic matter turnover. European Journal of Soil Science 52(3), Christensen BT, Johnston AE (1997)) Soil organic matter and soil quality lessons learned from long-term experiments at Askov and Rothamsted.. 'Soil Quality for Crop Production and Ecosystem Health'((Eds EG Gregorich, MR Carter) (Elsevier Science, Amsterdam, The Netherlands.)), pp Cotching WE (2012) Carbon stocks in Tasmanian soils. Soil Research 50(2), Cotching WE, Cooper J, Sparrow LA, McCorkell BE, Rowley W (2001) Effects of agricultural management on sodosols in northern Tasmania. Australian Journal of Soil Research 39(4), Cotching WE, Cooper J, Sparrow LA, McCorkell BE, Rowley W (2002a) Effects of agricultural management on dermosols in northern Tasmania. Australian Journal of Soil Research 40(1), Cotching WE, Cooper J, Sparrow LA, McCorkell BE, Rowley W, Hawkins K (2002b) Effects of agricultural management on Vertosols in Tasmania. Australian Journal of Soil Research 40(8), Cotching WE, Cooper J, Sparrow LE, McCorkell BE, Rowley W (2002c) Effects of agricultural management on tenosols in northern Tasmania. Australian Journal of Soil Research 40(1), Doyle RB (1993) 'Soil of the South Esk Sheet (Southern Half).' DPIW Tasmania: Hobart Guo LB, Gifford RM (2002) Soil carbon stocks and land use change: A meta analysis. Global Change Biology 8(4), Halvorson AD, Wienhold BJ, Black AL (2002) Tillage, nitrogen, and cropping system effects on soil carbon sequestration. Soil Science Society of America Journal 66(3), [In English] Hassink J, Whitmore AP, Kubát J (1997) Size and density fractionation of soil organic matter and the physical capacity of soils to protect organic matter. European Journal of Agronomy 7(1-3),
54 Houlbrooke DJ, Paton RJ, Littlejohn RP, Morton JD (2011) Land-use intensification in New Zealand: Effects on soil properties and pasture production. Journal of Agricultural Science 149(3), Hoyle FC, Murphy DV (2006) Seasonal changes in microbial function and diversity associated with stubble retention versus burning. Australian Journal of Soil Research 44(4), Ingram JSI, Fernandes ECM (2001) Managing carbon sequestration in soils: Concepts and terminology. Agriculture, Ecosystems and Environment 87(1), Isbell RF (1996) 'The Australian soil classification.' Janik LJ, Skjemstad JO, Shepherd KD, Spouncer LR (2007) The prediction of soil carbon fractions using mid-infrared-partial least square analysis. Australian Journal of Soil Research 45(2), Jarecki MK, Lal R (2003) Crop Management for Soil Carbon Sequestration. Critical Reviews in Plant Sciences 22(6), [In English] Kaiser K, Guggenberger G, Haumaier L, Zech W (2002) The composition of dissolved organic matter in forest soil solutions: Changes induced by seasons and passage through the mineral soil. Organic Geochemistry 33(3), Khan SA, Mulvaney RL, Ellsworth TR, Boast CW (2007) The Myth of Nitrogen Fertilization for Soil Carbon Sequestration. Journal of Environmental Quality 36(6), [In English] Lal R (2001) The potential of soil carbon sequestration in forest ecosystems to mitigate the greenhouse effect. Soil Carbon Sequestration and the Greenhouse Effect(57), [In English] Lal R (2010) Enhancing Eco-efficiency in Agro-ecosystems through Soil Carbon Sequestration. Crop Science 50(2), S120-S131. [In English] Lal R, Follett F, Stewart BA, Kimble JM (2007) Soil carbon sequestration to mitigate climate change and advance food security. Soil Science 172(12), [In English] López-Bellido RJ, Fontán JM, López-Bellido FJ, López-Bellido L (2010) Carbon Sequestration by Tillage, Rotation, and Nitrogen Fertilization in a Mediterranean Vertisol. Agronomy Journal 102(1), [In English] Luo Z, Wang E, Sun OJ (2010) Soil carbon change and its responses to agricultural practices in Australian agro-ecosystems: A review and synthesis. Geoderma 155(3-4), Lützow Mv, Kögel-Knabner I, Ekschmitt K, Matzner E, Guggenberger G, Marschner B, Flessa H (2006) Stabilization of organic matter in temperate soils: mechanisms and their relevance under different soil conditions a review. European Journal of Soil Science 57(4), McDonald RC, Isbell RF, Speight JG, Walker J, Hopkins MS (Eds) (1990) 'Australian Soil and Land Survey - Field Handbook.' (Inkarta Press: Melbourne) 53
55 Potter KN, Velazquez-Garcia J, Scopel E, Torbert HA (2007) Residue removal and climatic effects on soil carbon content of no-till soils. Journal of Soil and Water Conservation 62(2), [In English] Saidy AR, Smernik RJ, Baldock JA, Kaiser K, Sanderman J, Macdonald LM (2012) Effects of clay mineralogy and hydrous iron oxides on labile organic carbon stabilisation. Geoderma , Schulten HR, Leinweber P (2000) New insights into organic-mineral particles: Composition, properties and models of molecular structure. Biology and Fertility of Soils 30(5-6), Skjemstad JO, Spouncer LR, Cowie B, Swift RS (2004) Calibration of the Rothamsted organic carbon turnover model (RothC ver. 26.3), using measurable soil organic carbon pools. Australian Journal of Soil Research 42(1), Sparrow LA, Cotching WE, Cooper J, Rowley W (1999) Attributes of Tasmanian ferrosols under different agricultural management. Australian Journal of Soil Research 37(4), Sparrow LA, Cotching WE, Parry-Jones J, Oliver G, White W, Doyle RB (2011) Changes in carbon and soil fertility in agricultural soils in Tasmania, Australia. Presented at the 12th International Symposium on Soil and Plant Analysis, June 2011, Crete. Tan ZX, Lal R, Smeck NE, Calhoun FG (2004) Relationships between surface soil organic carbon pool and site variables. Geoderma 121(3-4), [In English] Ussiri DAN, Lal R (2009) Long-term tillage effects on soil carbon storage and carbon dioxide emissions in continuous corn cropping system from an alfisol in Ohio. Soil & Tillage Research 104(1), [In English] Verheijen FGA, Bellamy PH, Kibblewhite MG, Gaunt JL (2005) Organic carbon ranges in arable soils of England and Wales. Soil Use and Management 21(1), 2-9. Viscarra Rossel RA, Walvoort DJJ, McBratney AB, Janik LJ, Skjemstad JO (2006) Visible, near infrared, mid infrared or combined diffuse reflectance spectroscopy for simultaneous assessment of various soil properties. Geoderma 131(1-2), Wenke JF, Grant CD (1994) The indexing of self-mulching behaviour in soils. Australian Journal of Soil Research 32(2), Zimmermann M, Leifeld J, Conen F, Bird M, Meir P (2012) Can composition and physical protection of soil organic matter explain soil respiration temperature sensitivity? Biogeochemistry 107(1),
56 ACKNOWLEDGEMENTS We wish to thank the following staff at TIA for their assistance in completing this work; Dr Leigh Sparrow for assistance with the sampling of the temporal study and supply of the 1997 Ferrosol samples, Mr Suresh Panta for sample preparation and sample archiving work, Mr Robert Brockman, Mrs Sally Jones, Ms Alicia Tracy and Ms Chantal Woodhams for their work on financial management, travel arrangements and other administrative work associated with the project. Also at UTAS Drs Alistair Gracie (School of Agricultural Science-TIA) and Mark Hovenden (School of Plant Science) were of great assistance in helping gain DAFF funding for this project. Dr Hovenden also allowed us unfretted access to his carbon/nitrogen analyser and sample mill. We also wish to thank the staff at CSIRO for their helpful attitude to managing this project and indeed the many other soil carbon projects around the nation. In particular Drs Jeff Baldock and Elizabeth Schmidt have been extremely patient, prompt and helpful to the Tasmanian soil carbon team. 55
57 APPENDICES Appendix 1: Explanation of land management variables The land manager (farmer) was consulted prior to sampling site selection to determine if they were able to provide detailed 10-year land management information, sites were not sampled if the farmer was not able to provide such information. The farmer was asked to provide the information in the form of completing a survey form (Appendix 6), this data was entered into a spreadsheet. We added four more land use categories to the eleven defined by CSIRO namely; 12 Pyrethrum, 13 Grass Seed, 14 Bulbs e.g., Tulips, 15 Essential Oils e.g., Peppermint/Fennel. Generally most landowners/managers did not measure dry matter production of pastures, and almost half weren t sure of the year of land clearance. Once the land management data was collated several more calculations were performed to generate quantifiable data to use for statistical analysis. intensity was quantified with a Crop Ratio number, calculated by dividing the number of crops grown by the number of years of recorded data. The figure varied from 0.0 from a site that was pasture every year, to 1.0 for a site that was cropped every year. Fertiliser values were calculated for N, P and K by dividing the total k ha -1 of respective element added and divided by the number of years of fertiliser record. A standard deviation of fertiliser application per year was also calculated for each respective element. Irrigation Ratio was calculated by dividing years irrigated by the number of years of record. This value ranged from 0.0 (no irrigation) to 1.0 (irrigated every year). Set Stocking Ratio was calculated by dividing years set stocking grazing was used by the number of years of. This value ranged from 0.0 (never set stocked) to 1.0 (set stocked every year). Rotational Grazing Ratio was calculated by dividing years that rotational grazing was used by the number of years of. This value ranged from 0.0 (never rotationally grazed) to 1.0 (set stocked every year). Hay Ratio was calculated by dividing years that hay was cut by the number of years of. This value ranged from 0.0 (never cut for hay) to 1.0 (cut for hay every year). Tillage Ratio was calculated by adding the tillage figure (0 = Zero Till), (1 = Minimal Till), (2 = Conventional Till), and dividing this by the number of years that tillage data was provided. This yields a figure ranging from 0 (always Zero Till) to 2 (always Conventional Till) for cropping sites. Till_1 (a measure of minimal tillage) figure was calculated by dividing the number of times that a cropped site was cultivated with minimal till by the number of times cultivated with either minimal and/or no tillage. Consequently this compares minimal tillage against no tillage, and ignores conventional tillage. Till_2 (a measure of conventional tillage) figure was calculated by dividing the number of times that a cropped site was cultivated with conventional tillage i.e., two or more workings divided by the total number of times that the site was cropped. Consequently this compares conventional tillage to other, minimum, tillage practises. 56
58 Fallow Ratio was calculated by dividing years that the site was left in fallow for greater than eight months by the number of years of fallow. This value ranged from 0.0 (never long fallow) to 1.0 (long fallow every year). We attributed quantitative figures to based on whether it was dominantly annual, perennial or mixed. These values can be used when analysing sites categorised as. 1) Annual = number of years in annual pasture/total number of years in pasture. To give a value from 0.0 (never) to 1.0 (always). 2) Perennial = number of years in annual pasture/total number of years in pasture. To give a value from 0.0 (never) to 1.0 (always). 3) Mixed = number of years in annual pasture/total number of years in pasture. To give a value from 0.0 (never) to 1.0 (always). To gain quantitative figures for crop type, we condensed the fifteen categories down to four broader categories. These four represented the impact that the crop was likely to have on soil carbon. Crop Cereal includes crops categorised as; Cereal, Oilseed, Poppies, Cereal Hay, Grass Seed. Crop Veg Other includes crops categorised as; Grain Legume or Non- Root Vegetable. Crop Root Veg includes crops categorised as Root Vegetables and Bulbs. Crop Perennial includes crops categorised as Pyrethrum and Essential Oils. The figures can be used when analysing Sites. Each crop category was given a quantitative figure as follows; 1) Crop Cereal = number of years in cereal crop categories/total number of years in any crop. To give a value from 0.0 (never) to 1.0 (always) 2) Crop Veg Other = number of years in other vegetable crop categories/total number of years in any crop. To give a value from 0.0 (never) to 1.0 (always) 3) Crop Root Veg = number of years in root vegetable crop categories/total number of years in any crop. To give a value from 0.0 (never) to 1.0 (always) 4) Crop Perennial = number of years in perennial crop categories/total number of years in any crop. To give a value from 0.0 (never) to 1.0 (always) A quantitative Crop Weighting value was generated by attributing a value to each of the annual land use (crop or pasture) based on the likely impact that that land use would have on the soil. The weighting was as follows; 0, Perennial Crop 1, Cereal Crop 2, Veg Other Crop 3, Root Veg Crop -4. The values were totalled and divided by the number of years that land use data (crop or pasture) was provided for. The resulting number for this parameter varied from 0 (always pasture) to a maximum of 4 (always root vegetables). Another Crop Weighting value was calculated to take into account long fallow. It was calculated Crop Weighting Plus Fallow is calculated the same was as Crop Weighting (above) but it also had a weighting of 5 added to any year that had a long fallow of greater than 8 months. The resulting number for this parameter varied from 0 (always pasture) to a maximum of 9 (always root vegetables and long fallow). 57
59 Appendix 2: Tables outlining explanatory models Table A1 Explanatory models (with minimum corrected Akaike Information Criterion AICC) for soil properties under combined pasture and cropping sites in Tasmania. Soil property Depth (m) Model r 2 RMSD 3 Total organic carbon Soil order + 30 year annual rainfall + Crop ratio (log) Soil order + 30 year annual rainfall + Elevation + Crop ratio Soil order + 5 year annual rainfall Carbon stock gc 1 (log) year annual rainfall + Crop ratio + Soil order Soil order + 30 year annual rainfall + C:N Soil order + 30 year annual rainfall + C:N + C:N x soil order Carbon stock gc 1 (log) year annual rainfall + soil order + crop ratio + elevation + C:N + 30 year Apr- Oct VPD Bulk density (log) Soil order + 30 year Nov-Mar rainfall + P fert applied Soil order + crop ratio Soil order + P fertiliser applied Total nitrogen (log) Soil order + 30 year annual rainfall + crop ratio + C:N Soil order + 30 year Apr-Oct rainfall + C:N + crop ratio + elevation Soil order + 5 year annual rainfall + C:N gravel corrected; 3 root mean square deviation, 4 Vapour pressure deficit
60 Table A2 Explanatory models for soil properties under cropping and pasture in Tasmania (with minimum corrected Akaike information criterion) Depth Soil property (m) (P < 0.01) r 2 RMSD 1 P<0.05 Total organic carbon (log) Soil order + 30 year Apr-Oct rainfall + elevation crop ratio + till 2 + C:N year Apr-Oct rainfall + soil order crop ratio + till year April-Oct rainfall x soil order Bulk density (log) Soil order 5 year Nov-Mar rainfall till 2 x soil order Soil order + till year Nov-Mar VPD year Nov-Mar VPD Soil order + till year Nov-Mar Temp Total nitrogen (log) Soil order + 5 year Apr-Oct rainfall + elevation + till crop ratio Soil order + 5 year Apr-Oct rainfall + C:N crop ratio Soil order x 30 year annual rainfall + C:N C:N year Nov-Mar VPD year Nov-Mar VPD Perennial crops + aspect year Nov-Mar VPD soil order Total organic carbon (log) Soil order + 30 year annual rainfall + crop ratio Soil order + 30 year annual rainfall Soil order + 5 year annual rainfall Bulk density (log) Soil order + 5 year Nov-Mar rainfall Soil order year Nov-Mar rainfall Soil order year annual VPD + wetness index Total nitrogen (log) Soil order + 30 year annual rainfall + crop ratio + C:N Soil order + 30 year Apr-Oct rainfall + C:N Focal median of slope within 300m Soil order + 30 year annual rainfall + C:N elevation C:N no effects ns ns 5 year annual Temp + 30 year Apr-Oct Temp no effects ns ns 5 year Nov-Mar VPD year Apr-Oct rainfall N fert applied + 5 year Nov-MarVPD + elevation 1 root mean square deviation, 3 Vapour pressure deficit, ns = not significant 59
61 Appendix 3: Significance of land use effects on carbon with adjusted P values SIGNIFICANCE OF LAND USE CATEGORIES - TUKEY LOG CORRECTED TOC Significant Stock Significant Soil Order L Depth (m) adjusted P P <0.01 adjusted P P <0.01 All soil Y Y Y N N N Dermosol Y Y N N N N Ferrosol Y Y N N N N Texture Contrast N N N N N N Vertosol Y N N N N N
62 Appendix 4: Sample numbering key The sites were identified with a TIA code as follows; Three digit numbers beginning with 1, 2, 3, 4 or 5 indicate that it is a site that had been used for Cotching and Sparrow in temporal Ferrosol studies. Sites beginning with E followed by two digits are sites identified by Dr Eve White in the Cressy Region. Sites beginning with S, N or C followed by two digits are sites that have been used by the DPIPWE SCEAM project. The letter represents the three Tasmanian NRM regions of South (S), North (N) and Cradle Coast (C). Sites beginning with D were sites identified by Mr Mark Downie, and are further broken into regions by the subsequent numbers. D1xx Coal Valley and South East. D2xx Derwent Valley. D3xx Northern Midlands (Campbell Town and Cressy). D4xx Southern Midlands (Bothwell and Oatlands). D5xx - Deloraine and Devonport. D6xx - Scottsdale and East Coast. D7xx Burnie and Wynyard. Sites with other codes are; A1 Derwent Valley. UF1, UF2, UF3 University Farm, Coal Valley. CV8 = sites used in a study of Vertosol soils by Dr Bill Cotching in the Cressy region. JS4 = sites used by Mt Joshua Scandrett for his honours project in the Southern Midlands region. If the sites and samples were deemed fit to be used they would also be given a unique site SCaRP code ranging from TAS_0001 to TAS_0319. The samples were given a unique SCaRP code ranging from tas to tas
63 Appendix 5: Unadjusted mean data Unadjusted means for TOC, Stock, BD, TN and C:N, at all three depths are summarised in tables in Appendix 4, for all 8 land use by soil order combinations, and for all 14 regions. AVERAGE VALUES FOR DERMOSOL CROPPING SITES Depth (m) Total Organic Carbon (%) Carbon Stocks (t/ha) Total Nitrogen (%) Carbon to Nitrogen Ratio Soil Bulk Density Total Carbon Stocks to 0.3m (t/ha) 83 Number of Dermosol sites 47 AVERAGE VALUES FOR DERMOSOL PASTURE SITES Depth (m) Total Organic Carbon (%) Carbon Stocks (t/ha) Total Nitrogen (%) Carbon to Nitrogen Ratio Soil Bulk Density Total Carbon Stocks to 0.3m (t/ha) 102 Number of Dermosol sites 46 AVERAGE VALUES FOR FERROSOL CROPPING SITES Depth (m) Total Organic Carbon (%) Carbon Stocks (t/ha) Total Nitrogen (%) Carbon to Nitrogen Ratio Soil Bulk Density Total Carbon Stocks to 0.3m (t/ha) 124 Number of Ferrosol Sites 54 AVERAGE VALUES FOR FERROSOL PASTURE SITES Depth (m) Total Organic Carbon (%) Carbon Stocks (t/ha) Total Nitrogen (%) Carbon to Nitrogen Ratio Soil Bulk Density Total Carbon Stocks to 0.3m (t/ha) 150 Number of Ferrosol Sites 27 62
64 AVERAGE VALUES FOR TEXTURE CONTRAST CROPPING SITES Depth (m) Total Organic Carbon (%) Carbon Stocks (t/ha) Total Nitrogen (%) Carbon to Nitrogen Ratio Soil Bulk Density Total Carbon Stocks to 0.3m (t/ha) 58 Number of Texture Contrast Sites 29 AVERAGE VALUES FOR TEXTURE CONTRAST PASTURE SITES Depth (m) Total Organic Carbon (%) Carbon Stocks (t/ha) Total Nitrogen (%) Carbon to Nitrogen Ratio Soil Bulk Density Total Carbon Stocks to 0.3m (t/ha) 65 Number of Texture Contrast Sites 27 AVERAGE VAULES FOR VERTOSOL CROPPING SITES Depth (m) Total Organic Carbon (%) Carbon Stocks (t/ha) Total Nitrogen (%) Carbon to Nitrogen Ratio Soil Bulk Density Total Carbon Stocks to 0.3m (t/ha) 96 Number of Vertosol Sites 26 AVERAGE VALUES FOR VERTOSOL PASTURE SITES Depth (m) Total Organic Carbon (%) Carbon Stocks (t/ha) Total Nitrogen (%) Carbon to Nitrogen Ratio Soil Bulk Density Total Carbon Stocks to 0.3m (t/ha) 107 Number of Vertosol Sites 26 AVERAGE VALUES FOR SOUTHPORT REGION Depth (m) Total Organic Carbon (%) Carbon Stocks (t/ha) Total Nitrogen (%) Carbon to Nitrogen Ratio Soil Bulk Density Total Carbon Stocks to 0.3m (t/ha) 91 Number of Southport Region Sites 4 63
65 AVERAGE VALUES FOR SOUTHERN MIDLANDS REGION Depth (m) Total Organic Carbon (%) Carbon Stocks (t/ha) Total Nitrogen (%) Carbon to Nitrogen Ratio Soil Bulk Density Total Carbon Stocks to 0.3m (t/ha) 87 Number of southern Midlands Region Sites 41 AVERAGE VALUES FOR SORELL REGION Depth (m) Total Organic Carbon (%) Carbon Stocks (t/ha) Total Nitrogen (%) Carbon to Nitrogen Ratio Soil Bulk Density Total Carbon Stocks to 0.3m (t/ha) 105 Number of Sorell Region Sites 9 AVERAGE VALUES FOR NORTHERN MIDLANDS REGION Depth (m) Total Organic Carbon (%) Carbon Stocks (t/ha) Total Nitrogen (%) Carbon to Nitrogen Ratio Soil Bulk Density Total Carbon Stocks to 0.3m (t/ha) 81 Number of Northern Midlands Region Sites 65 AVERAGE VALUES FOR LAUNCESTON REGION Depth (m) Total Organic Carbon (%) Carbon Stocks (t/ha) Total Nitrogen (%) Carbon to Nitrogen Ratio Soil Bulk Density Total Carbon Stocks to 0.3m (t/ha) 124 Number of Launceston Region Sites 3 AVERAGE VALUES FOR NORTH EAST REGION Depth (m) Total Organic Carbon (%) Carbon Stocks (t/ha) Total Nitrogen (%) Carbon to Nitrogen Ratio Soil Bulk Density Total Carbon Stocks to 0.3m (t/ha) 147 Number of North East Region Sites 20 64
66 AVERAGE VALUES FOR EAST COAST REGION Depth (m) Total Organic Carbon (%) Carbon Stocks (t/ha) Total Nitrogen (%) Carbon to Nitrogen Ratio Soil Bulk Density Total Carbon Stocks to 0.3m (t/ha) 93 Number of East Coast Region Sites 18 AVERAGE VALUES FOR DEVONPORT REGION Depth (m) Total Organic Carbon (%) Carbon Stocks (t/ha) Total Nitrogen (%) Carbon to Nitrogen Ratio Soil Bulk Density Total Carbon Stocks to 0.3m (t/ha) 135 Number of Devonoport Region Sites 42 AVERAGE VALUES FOR DERWENT VALLEY REGION Depth (m) Total Organic Carbon (%) Carbon Stocks (t/ha) Total Nitrogen (%) Carbon to Nitrogen Ratio Soil Bulk Density Total Carbon Stocks to 0.3m (t/ha) 77 Number of Derwent Valley Region Sites 9 AVERAGE VALUES FOR DELORAINE REGION Depth (m) Total Organic Carbon (%) Carbon Stocks (t/ha) Total Nitrogen (%) Carbon to Nitrogen Ratio Soil Bulk Density Total Carbon Stocks to 0.3m (t/ha) 130 Number of Deloraine Region Sites 11 AVERAGE VALUES FOR CLARENCE REGION Depth (m) Total Organic Carbon (%) Carbon Stocks (t/ha) Total Nitrogen (%) Carbon to Nitrogen Ratio Soil Bulk Density Total Carbon Stocks to 0.3m (t/ha) 84 Number of Clarence Region Sites 20 65
67 AVERAGE VALUES FOR CENTRAL HIGHLANDS REGION Depth (m) Total Organic Carbon (%) Carbon Stocks (t/ha) Total Nitrogen (%) Carbon to Nitrogen Ratio Soil Bulk Density Total Carbon Stocks to 0.3m (t/ha) 79 Number of Central Highlands Region Sites 24 AVERAGE VALUES FOR BURNIE REGION Depth (m) Total Organic Carbon (%) Carbon Stocks (t/ha) Total Nitrogen (%) Carbon to Nitrogen Ratio Soil Bulk Density Total Carbon Stocks to 0.3m (t/ha) 131 Number of Burnie Region Sites 13 AVERAGE VALUES FOR BRIGHTON REGION Depth (m) Total Organic Carbon (%) Carbon Stocks (t/ha) Total Nitrogen (%) Carbon to Nitrogen Ratio Soil Bulk Density Total Carbon Stocks to 0.3m (t/ha) 63 Number of Brighton Region Sites 6 66
68 Appendix 6: Land Management Survey Form Soil Carbon Research Program Site Information Sheet Farmer s name & contact details: Location: Road, paddock name: Date: GPS location (Easting/Northing): Paddock size(ha): Year of land clearance: Sample collected by: Land use history and management Year since present Enter code 0 = no crop, 1=cereal, 2=oilseed, 3=grain legume, 4=sugarcane, 5=cotton, 6=non-root vegetables, 7=root vegetables, 8=maize, 9=sorghum, 10=poppies, 11=cereal hay Crop Yield Tons/ha Tillage Enter code 0 = Zero till (no workings other than sowing), 1 = minimum till (1 working in addition to sowing), 2 = conventional (2 or more workings) Stubble management Enter code 0 = residue retained on surface, 1 = residue retained by worked in, 2 = residue grazed, 3 = residue baled and removed, 4 = residue burnt 67
69 Enter code 0 = no pasture, 1 = annual pasture - grass dominant (>75%), 2 = annual pasture - legumes dominant (>75%), 3 = annual pasture - mixed grass/legume, 4 = perennial pasture - grass dominant (>75%), 5 = perennial pasture - legume dominant (>75%), 6 = perennial pasture - mixed grass/legume, 7 = mixed annual/perennial grass dominant (>75%), 8 = mixed annual/perennial legume dominant (>75%), 9 = mixed annual/perennial missed grass/legume Yield Tons dry matter/ha Grazing management Enter code 0 = no grazing, 1 = set stocking, 2 = rotational grazing Cut for Hay (crop or pasture) No=0, Yes=1 Long Fallow (>8 months) No=0, Yes=1 Irrigation No=0, Yes=1 Fertiliser N P K Total kg/ha Soil conditioners Enter code 0 = no soil conditioners added, 1 = agricultural lime, 2 = gypsum NOTES 68

70 Appendix 7: Farmer Fact Sheet 69
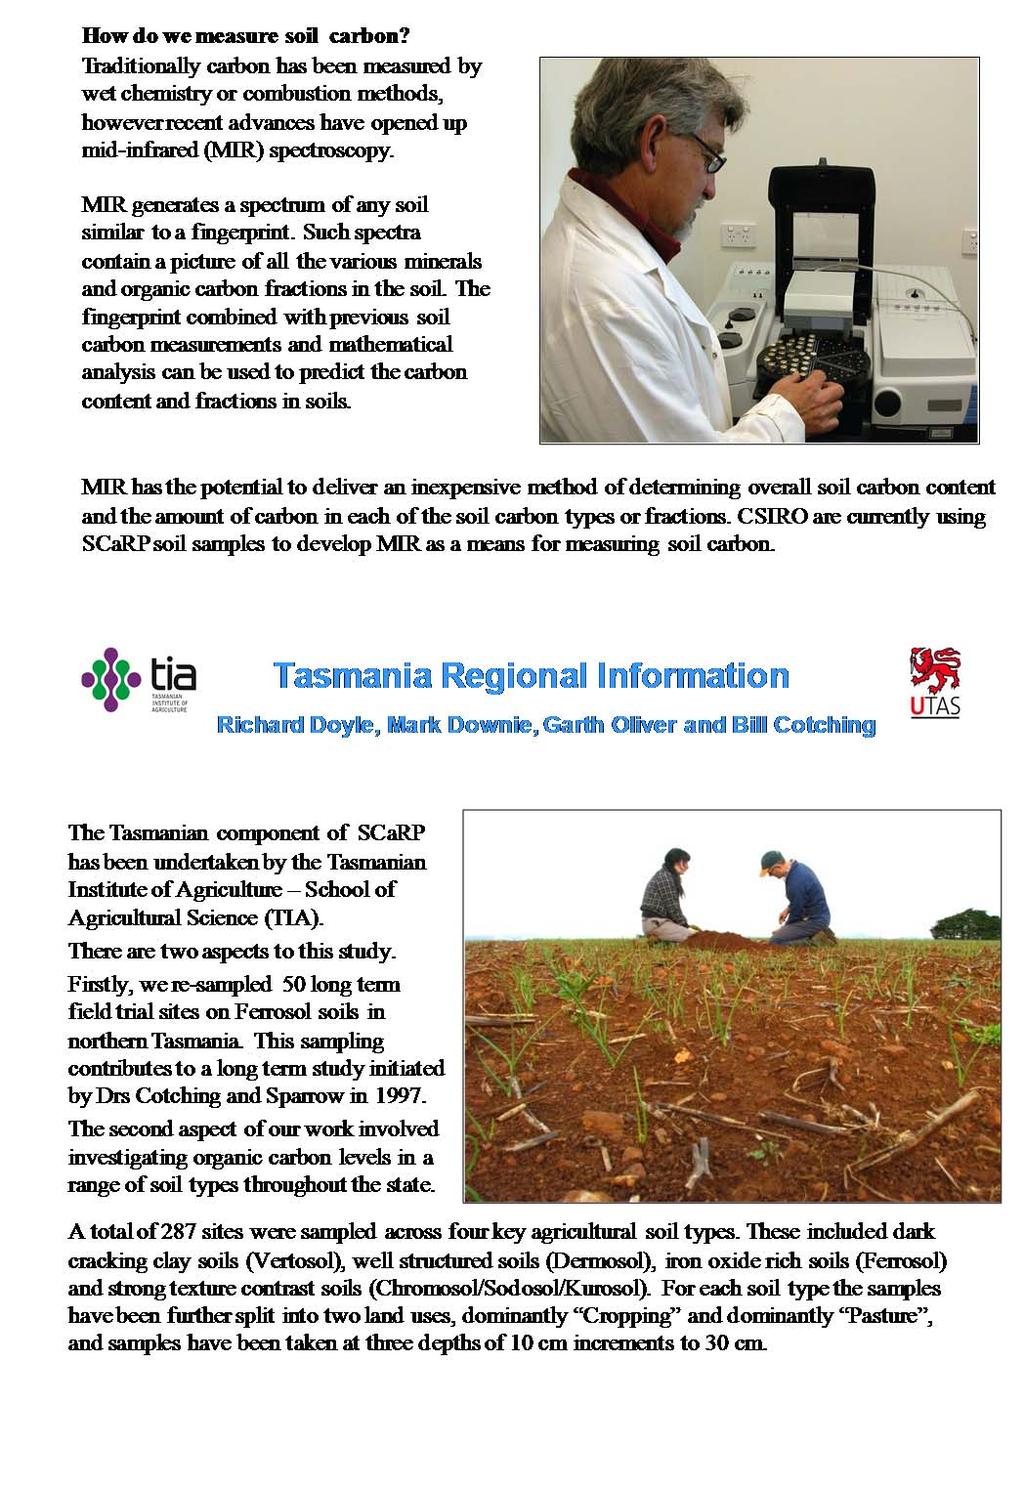
71 70
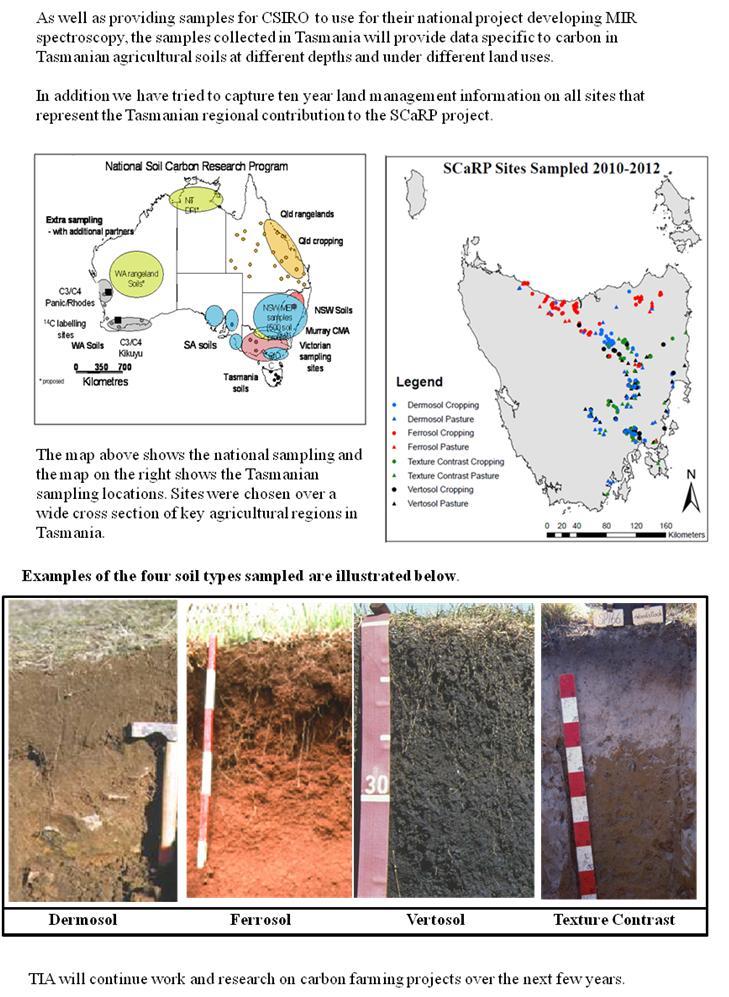
72 71
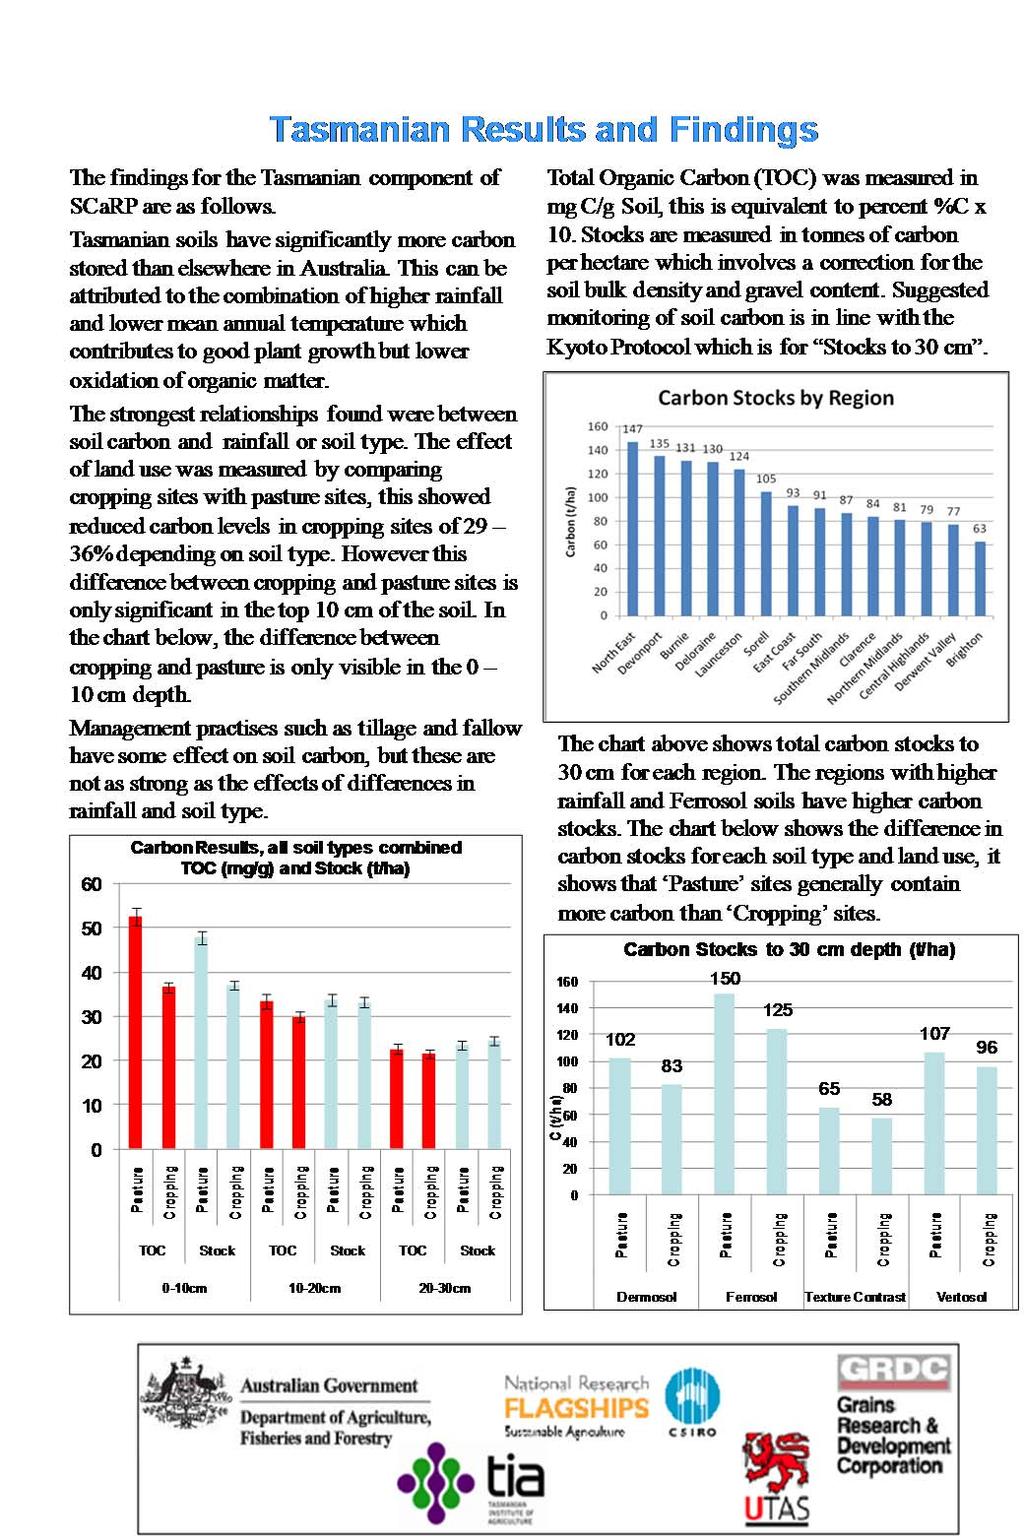
73 72
Department of Science, IT, Innovation and the Arts (formerly Department of Environment and Resource Management)
") final report Project code: Prepared by: Date published: B.CCH.2007 Ram Dalal and Diane Allen Department of Science, IT, Innovation and the Arts (formerly Department of Environment and Resource Management)
final report Project code: Prepared by: Date published: B.CCH.2007 Ram Dalal and Diane Allen Department of Science, IT, Innovation and the Arts (formerly Department of Environment and Resource Management)
Integrating pastures into farming systems soil health and the benefits to crops
 Tropical Grasslands (2009) Volume 43, 212 216 212 Integrating pastures into farming systems soil health and the benefits to crops DAVID LAWRENCE 1, MIKE BELL 2, BRIAN JOHNSON 1 and DAVID LLOYD 1 1 Queensland
Mid Infrared Spectroscopy for Rapid and Cheap Analysis of Soils
 Page 1 of 5 Mid Infrared Spectroscopy for Rapid and Cheap Analysis of Soils R.H. Merry and L.J. Janik CSIRO Land and Water, Urrbrae, South Australia. ABSTRACT Due to advances in spectrometer hardware,
Soil strength/soil wetness relationships on Red Ferrosols with visually assessed soil structure differences in north-west Tasmania.
 Soil strength/soil wetness relationships on Red Ferrosols with visually assessed soil structure differences in north-west Tasmania. Kristel Belbin 1 and Bill Cotching 2 1 University of Tasmania, Hobart,
Soil carbon In Tasmania Dr Bill Cotching
 Soil carbon In Tasmania Dr Bill Cotching www.billcotching.com research development extension education Rachel Brown, Jamie Cooper, Ross Corkrey, Mark Downie, Richard Doyle, Darren Kidd, Chris Grose, Duncan
Analysis of chicken litter
 Using chicken litter to fertilise pastures Raw chicken litter can be a valuable resource to optimise pasture production. It is mostly organic matter and supplies nutrients, helps hold moisture, improves
Soil carbon. Productivity benefits, methods explained, applicability in South West Queensland and implications
 Soil carbon Productivity benefits, methods explained, applicability in South West Queensland and implications Diane Allen, DSITI: Carbon workshop Charleville 15/12/2015 Soil and the carbon cycle Soil carbon
Agriculture and Society: Part II. PA E & E Standards 4.4
 Agriculture and Society: Part II PA E & E Standards 4.4 Let s get Dirty! 1. All agriculture ultimately depends on the soil. What is soil? Soil is the upper layer of the land surface that contains pieces
The use of 13 C & 14 C to quantify the amount of C sequestered below-ground in agricultural systems
 IAEA-CN-191-73 The use of 13 C & 14 C to quantify the amount of C sequestered below-ground in agricultural systems Ian Fillery, Jonathan Sanderman, Margaret Roper, Lynne Macdonald & Jeff Baldock - presented
A snapshot of current soil C and N research
 A snapshot of current soil C and N research Mark Farrell, Jeff Baldock, Lynne Macdonald, Jon Sanderman CSIRO AGRICULTURE FLAGSHIP Carbon cycle in agricultural systems Agricultural carbon cycle CO 2 C additions
soil carbon, erosion + moisture conservation
 soil carbon, erosion + moisture conservation in stubble retained systems in Central West NSW Project code CWF00018 KEY MESSAGES Soil carbon and microbial health are positively correlated. Carbon is influenced
Lime and lime quality for acid soils
 Lime and lime quality for acid soils More than two million hectares of land in South Australia are susceptible to soil acidification, a process that degrades the soil and reduces crop and pasture growth.
Biao Zhong and Y. Jun Xu
 Biao Zhong and Y. Jun Xu School of Renewable Natural Resources Louisiana State University Agricultural Center Baton Rouge, LA, 70803 USA Email: bongreat@gmail.com 1 Global Climate Change The Earth's climate
WHITBREAD Anthony (1), BLAIR Graeme J. (1), LEFROY Rod (2)
, BLAIR Graeme J. (1), LEFROY Rod (2)") Scientific registration n o : 457 Symposium n o : 20 Presentation: poster Management of legume leys, residues and fertilisers to enhance the sustainability of wheat cropping systems Gestion des fertilisants
Scientific registration n o : 457 Symposium n o : 20 Presentation: poster Management of legume leys, residues and fertilisers to enhance the sustainability of wheat cropping systems Gestion des fertilisants
THE INTRODUCTION THE GREENHOUSE EFFECT
 THE INTRODUCTION The earth is surrounded by atmosphere composed of many gases. The sun s rays penetrate through the atmosphere to the earth s surface. Gases in the atmosphere trap heat that would otherwise
Soil organic matter consists of a variety of components. These include, in varying proportions and many Intermediate stages:
 This article is adapted in part from a publication of the Alberta Department of Agriculture and Rural Development by J. Lickacz and D. Penny in the Plant Industry Division. What is Organic Matter? Soil
Spatial and temporal variability in organic carbon observed in soil under lucerne pastures
 Spatial and temporal variability in organic carbon observed in soil under lucerne pastures Richard Hayes, Mark Conyers, Graeme Poile, Albert Oates and Guangdi Li EH Graham Centre for Agricultural Innovation
JOINT AUSTRALIAN AND NEW ZEALAND SOIL SCIENCE CONFERENCE Soil solutions for diverse landscapes
 Soil Science JOINT AUSTRALIAN AND NEW ZEALAND SOIL SCIENCE CONFERENCE Soil solutions for diverse landscapes WREST POINT HOTEL AND CONVENTION CENTRE, HOBART, TASMANIA 2-7 DECEMBER 2012 Proceedings of the
This is a protocol that is designed to support the citizen
 Citizen Science Soil Sampling Protocol This is a protocol that is designed to support the citizen scientist in all of us. These soil tests will provide essential information about the short and long-term
Carbon Sequestration Why and How?
 16 th March 2017 Carbon Sequestration Why and How? Christopher Johns Research Manager Northern Australia and Land Care Research Programme Key Points To achieve the global warming targets set by the Paris
Soil Organic Matter. Soil degradation has become a major concern in. What is organic matter? Organic matter in virgin and cultivated soils
 Agdex 6- Soil degradation has become a major concern in Canada. Erosion, salinization, acidification and loss of organic matter are the main forms of soil deterioration. This factsheet deals with the role
Soil carbon sequestration - myths and mysteries M. Bell and D. Lawrence
 Soil carbon sequestration - myths and mysteries M. Bell and D. Lawrence PR09-4345 The Department of Primary Industries and Fisheries (DPI&F) seeks to maximise the economic potential of Queensland's primary
GLOBAL SYMPOSIUM ON SOIL ORGANIC CARBON, Rome, Italy, March2017
 GLOBAL SYMPOSIUM ON SOIL ORGANIC CARBON, Rome, Italy, 21-23 March2017 Long-term fertilization impacts on temperature sensitivity of soil organic carbon decomposition under wheat based cropping systems
6. Examples. Examples are used to highlight for each case only some aspects that appear particularly relevant for the purposes of the review.
 6. Examples Examples are used to highlight for each case only some aspects that appear particularly relevant for the purposes of the review. The analysis presented here should be considered as preliminary
Soil testing to benchmark DGT phosphorus testing and other soil health parameters on calcareous soils on Western Eyre Peninsula. Project Report.
 Soil Health in the West 212 Soil testing to benchmark DGT phosphorus testing and other soil health parameters on calcareous soils on Western Eyre Peninsula. Project Report. Brett Masters Soil and Land
The soil is a very. The soil can. The manure. Soil Characteristics. effective manure treatment system if manures are applied at the proper rate.
 The soil is a very effective manure treatment system if manures are applied at the proper rate. The soil can filter pollutants and prevent them from reaching groundwater. The manure application rate should
Incorporating stubble as climate change adaptation strategy by spatial estimation of soil organic carbon in NSW wheat belt
 Incorporating stubble as climate change adaptation strategy by spatial estimation of soil organic carbon in NSW wheat belt De Li Liu, Muhuddin Anwar and Mark K. Conyers NSW Department of Primary Industries
Soil is both a source of greenhouse gases and a sink for
 Soil carbon management and carbon trading By Sarah Bruce1, John Sims1, James Walcott1, Jeff Baldock2 and Peter Grace3 Soil is both a source of greenhouse gases and a sink for carbon. In total, soils contain
CARBON, GREENHOUSE GASES, AND HOW WE MEASURE THEM
 CARBON, GREENHOUSE GASES, AND HOW WE MEASURE THEM Mila Bristow ENV1 Lecture 215 Mila.Bristow@nt.gov.au http://www.nt.gov.au/d/primary_industry/index.cfm?header=action%2on%2the%2ground Quiz 1. What are
Nitrogen Dynamics Feeding the Crops that Feed Us
 Nitrogen Dynamics Feeding the Crops that Feed Us Overview All plants require nitrogen in relatively large amounts and nitrogen is the most commonly limiting nutrient in agriculture. Consequences of insufficient
Introduction. Manure Management Facts Prioritization and Rotation of Fields for Manure Application. July 2014
 Manure Management Facts Prioritization and Rotation of Fields for Manure Application July 2014 Introduction Farmers apply synthetic fertilizer and manure to their land to replace the nutrients removed
Very slight to negligible limitations no special land management practices required.
 Land Capability Classes Land and Soil Capability Class 1 Class 1 Definition Very slight to negligible limitations no special land management practices required. On-site impact of land management practices
Where do you start? Managing Soil Health. Three parts to soil health 3/3/2014. First, have a yard stick to measure by
 Where do you start? Managing Soil Health By Donald A. Horneck, Ph.D. CCA, CPAg, CPSS Oregon State University - HAREC First, have a yard stick to measure by Three parts to soil health Rick Haney-soil test,
Sustainable Land Management through Soil Organic Carbon Management and Sequestration
 Sustainable Land Management through Soil Organic Carbon Management and Sequestration The GEFSOC Modelling System Mohamed Sessay Eleanor Milne Overview of Presentation Background Why assess SOC stocks and
Biochar Soil Amendment Opportunities
 Biochar Soil Amendment Opportunities Curtis Dell Research Soil Scientist, USDA ARS and Adjunct Associate Professor, Ecosystems Science and Management Department, PSU Soils 101 Important soil properties
3.3.3 Landscape-Directed Soil Sampling
 12 3 Soil Sampling and Analysis 3.1 Principles of Soil Sampling Soil sampling and analysis is the only way to determine the available nutrient status of a field and to receive field-specific fertilizer
Nutrilime. The solution for soil conditioning is here. Penrice Soda Holdings Limited Quarry & Mineral ABN Committed To Success
 Penrice Soda Holdings Limited Quarry & Mineral ABN 62 008 246 942 Nutrilime Quality System Quality Endorsed Company ISO9001:2000 LIC10509 STANDARDS AUSTRALIA The solution for soil conditioning is here
The workshop will cover... TAFCO Myrtleford - Soil Testing Workshop. Critical success Factors. Soil testing- getting it right
 The workshop will cover... TAFCO Myrtleford - Soil Testing Workshop Understanding the health and productivity status of your soil how to read soil test results and the critical limits/target values particularly
Efficient Fertilizer Use Soil Sampling for High Yield Agriculture: by Dr. Harold Reetz
 SECTION CONTENTS: Soil Sampling Sampling Procedures Sampling Patterns Options Auxiliary Data Layers Sampling Under Different Tillage Systems Identifying Missed Opportunities Through Intensive Sampling
Chapter 9 Soil and Agriculture Guided Notes
 Chapter 9 Soil and Agriculture Guided Notes This lecture will help you understand: The relationship between and Major agricultural The fundamentals Causes and of soil erosion and Principles of soil No-till
Harvesting pasture cropped oats on Winona with summer perennial grass emerging beneath the crop. Pasture Cropping. Profitable Regenerative Agriculture
 Harvesting pasture cropped oats on Winona with summer perennial grass emerging beneath the crop Pasture Cropping Profitable Regenerative Agriculture Colin Seis Concerns about declining profitability, increased
10:00-10:30: Introductions 10:30-10:45: Introduction to biochar 10:45-11:15: Starting the fire, outline of biochar production physics 11:15-12:00:
 Agenda 10:00-10:30: Introductions 10:30-10:45: Introduction to biochar 10:45-11:15: Starting the fire, outline of biochar production physics 11:15-12:00: Biochar Benefits 12:00-12:30: Lunch 12:30-1:00:
7.0 - nutrient uptake, removal and budgeting
 7.0 - nutrient uptake, removal and budgeting - nutrient uptake - nutrient removal - nutrient budgeting 7.0 nutrient uptake, removal and budgeting NUTRIENT UPTAKE The generalised relationship between plant
technical report no. 30
 national carbon accounting system technical report no. 30 Sensitivity Analysis of the Roth-C Soil Carbon Model (Ver. 26.3 Excel ) Les Janik, Leonie Spouncer, Ray Correll and Jan Skjemstad The lead Commonwealth
MWELO Providing Insight on Soil and Compost Requirements. Will Bakx
 MWELO Providing Insight on Soil and Compost Requirements Will Bakx www.sonomacompost.com willbakx@sonomacompost.com Soils: 2 Sections 492.5 Soil Management report 492.6(3) Soil Preparation, Mulch and Amendments
Soil biology, organic matter, structure, functioning and crop yield Matthew Shepherd Soil Biodiversity Specialist Natural England
 Soil biology, organic matter, structure, functioning and crop yield Matthew Shepherd Soil Biodiversity Specialist Natural England Overview What do we want from soil? Living soils Keeping soils alive Crop
BGWA information session - Improving soil health
 BGWA information session - Improving soil health Belinda Rawnsley South Australian Research and Development Institute (SARDI) Tuesday 27 May 2014 Outline What is soil health and importance of soil biology
Agronomic and soil quality trends after five years of different tillage and crop rotations across Iowa
 21 Integrated Crop Management Conference - Iowa State University 185 Agronomic and soil quality trends after five years of different tillage and crop rotations across Iowa Mahdi Al-Kaisi, associate professor
Mulched rip lines stop soil erosion under annual cropping on steep slopes in northwest Tasmania
 Mulched rip lines stop soil erosion under annual cropping on steep slopes in northwest Tasmania Bill Cotching Department of Primary Industries, Water and Environment, Tasmania, Australia P.O. Box 303,
(ACLEP) 2008 / Final report
 2008 / Final report") Australian Collaborative Insert partner logos in Land this area Evaluation Program (ACLEP) 2008 / 2009 - Final report Peter Wilson - Manager, National Soil Information CSIRO Land and Water Project Report
Australian Collaborative Insert partner logos in Land this area Evaluation Program (ACLEP) 2008 / 2009 - Final report Peter Wilson - Manager, National Soil Information CSIRO Land and Water Project Report
Soil Carbon Accounting the Australian example
 Soil Carbon Accounting the Australian example Jeff Baldock 1 and Rachel Burgess 2 1) CSIRO Agriculture and Food, Locked Bag 2, Glen Osmond, SA 5064, Australia (jeff.baldock@csiro.au) 2) Australian Department
Effects of Different Land Use on Soil Hydraulic Properties
 Effects of Different Land Use on Soil Hydraulic Properties W.L. Bodhinayake 1, B.C. Si 1, and G. Van der Kamp 2 1 Department of Soil Science, University of Saskatchewan, Saskatoon, SK S7N 5A8 2 National
Soil Organic Matter. What is it How to build it. Clive Kirkby
 Soil Organic Matter What is it How to build it Clive Kirkby CSIRO Plant Industry Charles Sturt University EH Graham Centre for Agricultural Innovation John Kirkegaard Alan Richardson Graeme Batten Chris
Soil Quality: What is it & how do you improve it? Bill Crooks
 Soil Quality: What is it & how do you improve it? Bill Crooks Soil Quality: What is it? More productive? Nutrient status ph Drainage Structure More biodiversity? Organic content Amount and type Plant (crop)
National Soil Condition Monitoring
 National Soil Condition Monitoring Insert partner logos in this area for soil ph and soil carbon Objectives, Design, Protocols, Governance and Reporting CSIRO Land and Water Science Report 05/11 Authors:
Modelling the benefits of soil carbon in cropping systems
 Modelling the benefits of soil carbon in cropping systems A cropped allophanic soil showing the sharp boundary at cultivation depth - photo courtesy Craig Ross Soil organic matter has been long-recognised
GLOBAL SYMPOSIUM ON SOIL ORGANIC CARBON, Rome, Italy, March 2017
 GLOBAL SYMPOSIUM ON SOIL ORGANIC CARBON, Rome, Italy, 21-23 March 2017 Significant offset of long-term potential soil carbon sequestration by nitrous oxide emissions in the EU Emanuele Lugato 1 *, Arwyn
15. Soil Salinity SUMMARY THE ISSUE
 15. Soil Salinity AUTHORS: B.H. Wiebe, R.G. Eilers, W.D. Eilers and J.A. Brierley INDICATOR NAME: Risk of Soil Salinization STATUS: Provincial coverage (AB, SK, MB), 1981 to 2001 SUMMARY At very low levels,
Soil Quality: Soil Indicators. Dr. Paul Hargreaves SRUC Dairy Research and Innovation Centre
 Soil Quality: Soil Indicators Dr. Paul Hargreaves SRUC Dairy Research and Innovation Centre 1 Soil air, water, minerals Soil functions Support hooves and wheels Reduce gas losses, N 2 O, N 2, NH 3 and
APPENDIX F. Soil Sampling Programs
 166 Soil Sampling Programs Soil sampling for laboratory analysis is the only way to determine the levels of plant nutrients in a field and obtain fertilizer recommendations for that field It is also required
2010 Survey results Nadine Hollamby (Liebe Group) Roy Murray-Prior (Curtin University)
 Roy Murray-Prior (Curtin University)") Grower s Attitudes and Practices towards Soil Health in the Liebe Area 2010 Survey results Nadine Hollamby (Liebe Group) Roy Murray-Prior (Curtin University) Report to GRDC as part of the Improved stubble
Grower s Attitudes and Practices towards Soil Health in the Liebe Area 2010 Survey results Nadine Hollamby (Liebe Group) Roy Murray-Prior (Curtin University) Report to GRDC as part of the Improved stubble
14. Soil Organic Carbon
 14. Soil Organic Carbon AUTHORS: B. McConkey, J. Hutchinson, W. Smith, B. Grant and R. Desjardins INDICATOR NAME: Soil Organic Carbon Change STATUS: National coverage, 1981 to 2001 SUMMARY Soil organic
CHAPTER 7 ASSESSMENT OF GROUNDWATER QUALITY USING MULTIVARIATE STATISTICAL ANALYSIS
 176 CHAPTER 7 ASSESSMENT OF GROUNDWATER QUALITY USING MULTIVARIATE STATISTICAL ANALYSIS 7.1 GENERAL Many different sources and processes are known to contribute to the deterioration in quality and contamination
FIGURE SET HEADER for Set #1. Figure Set 1: Cultivation and Soil Carbon Losses
 FIGURE SET HEADER for Set #1 Set 1: Cultivation and Soil Carbon Losses Purpose: To teach students that cultivation of crops for food results in the oxidation of soil organic carbon, which in turn contributes
HINCKLEY AND BOSWORTH LOCAL PLAN Leicester Road, Hinckley 102/1/81 and 893/1/5 Agricultural Land Classiflcation February 1997
 HINCKLEY AND BOSWORTH LOCAL PLAN Leicester Road, Hinckley 102/1/81 and 893/1/5 Agricultural Land Classiflcation February 1997 Resource Planning Team ADAS Reference: 95/961 Eastern Statutory Centre MAFF
Sampling Soil and Crop Tissue
 Conventional Soil Sampling CHAPTER 7d Sampling Soil and Crop Tissue James J. Camberato Soil Sampling and Analysis Conventional soil sampling prior to land application of animal manures is required by DHEC
CAPRESE. Potential Options
 CAPRESE CArbon PREservation and SEquestration in agricultural soils: Options and implications for agricultural production Potential Options Land Resource Management Unit Soil Action (coordination) Francesca
Bulk Density Protocol
 Bulk Density Protocol Purpose To measure the soil bulk density of each horizon in your soil profile. Overview Students obtain a soil sample in the field using a container with a measured volume. The soil
2.7 Calibrating soil water monitoring devices
 Phil Goyne formerly Qld DPI&F, Warwick David Williams formerly NSW Agriculture, Dubbo Lance Pendergast DAFF Queensland, Emerald Jenelle Hare formerly DAFF Queensland, Dalby Key points Calibration of soil
Advanced Biology: Bahe & Deken. Agriculture & Nutrition. Chapter 9. Text Page
 Agriculture & Nutrition Chapter 9 Text Page - 107 - 9.1 Strategy of Agriculture What does it take to put food on the table at your house? Think about this question in terms of economics, energy, and ecology.
Executive Stakeholder Summary
 Soil as a Resource National Research Programme NRP 68 www.nrp68.ch Wildhainweg 3, P.O. Box 8232, CH-3001 Berne Executive Stakeholder Summary Project number 40FA40_154247 Project title COMET-Global: Whole-farm
Yield responses to breaking the sugarcane monoculture. M.J. Bell 1, A.L. Garside 2, N.V. Halpin 3 and J.E. Berthelsen 2 ABSTRACT
 Yield responses to breaking the sugarcane monoculture M.J. Bell 1, A.L. Garside 2, N.V. Halpin 3 and J.E. Berthelsen 2 1 QDPI, Kingaroy Qld. 2 BSES, Townsville Qld. 3 QDPI, Bundaberg Qld. ABSTRACT Yield
SOM management: have your cake and eat it too. Organic Fertility
 SOM management: have your cake and eat it too Michelle M. Wander mwander@uiuc.edu Natural Resouces and Environmetnal Sciences UIUC Organic Fertility Soil and soil management is the foundation of organic
Arlan Frick, Dan Pennock, and Darwin Anderson Saskatchewan Land Resource Centre, University of Saskatchewan. Abstract
 The Prairie Soil Carbon Balance Project Modelling and GIS Component: Landscape-Scale Modelling of Changes in Soil Organic Carbon and Extrapolation to Regional Scales Arlan Frick, Dan Pennock, and Darwin
European Climate Change Programme (ECCP) Working Group on Sinks Related to Agricultural Soils
 Working Group on Sinks Related to Agricultural Soils") European Climate Change Programme (ECCP) Working Group on Sinks Related to Agricultural Soils 1 Introduction Executive Summary Measures to enhance carbon sequestration in agricultural soils are potential
European Climate Change Programme (ECCP) Working Group on Sinks Related to Agricultural Soils 1 Introduction Executive Summary Measures to enhance carbon sequestration in agricultural soils are potential
STORAGE AND SEQUESTRATION
 STORAGE AND SEQUESTRATION POTENTIAL OF ORGANIC CARBON IN AGRICULTURE LANDS OF LOWLAND NEPAL Shalu Adhikari 1, Roshan M. Bajrachraya 1 and Bishal K. Sitaula 2 1 Department of Environmental Science and Engineering,
Developing Quick Guides for fertilizing hybrid maize in large areas
 Developing Quick Guides for fertilizing hybrid maize in large areas This document provides you with An overview of a Quick Guide The information required to develop a Quick Guide The steps involved in
Building Soil Organic Matter: What, Why, How?
 FarmSmart Conference, Guelph Ontario 20 January 2018 Building Soil Organic Matter: What, Why, How? Ray Weil Biosphere-2. A parable about soil organic matter and the carbon cycle. Biospherians in Biosphere2
Livestock and Poultry Environmental Learning Center Webcast Series October 17, 2008
 Contribution of Manure Amendments to Soil Fertility and Carbon Sequestration Animal wastes contain inorganic N (NH 4 + NO 3 -N) and organic N: Inorganic N is plant available Organic N is mineralized by
Should the gravel content of soils impact on your input management decisions?
 Should the gravel content of soils impact on your input management decisions? Bill Bowden, West Midlands Group. Key messages 1. The gravel content of soils (gv%) affects many soil processes which impact
Soil Enhancement versus Maintenance of Yield. Case Study: Broad Acre Grain and Silage
 Soil Enhancement versus Maintenance of Yield Case Study: Broad Acre Grain and Silage Soil enhancement processes have long been plagued by early term yield losses as lower nutrient application and changes
SUSTAINABLE SOILS IN NORTH QUEENSLAND. Soil Health for Sugarcane
 SUSTAINABLE SOILS IN NORTH QUEENSLAND Soil Health for Sugarcane Why is soil health important? Soil health is important because your soil asset is the foundation of a productive and profitable sugarcane
Grassed Waterway Improvement and Gully Restoration
 Revised April 2007 Agdex 573-5 Grassed Waterway Improvement and Gully Restoration Each year, tonnes of topsoil are eroded from localized areas on some Alberta farms. This loss is serious for several reasons:
Land North of Bishop's Stortford Hertfordshire. Site - ASR 5 Agricultural Land Classification ALC Map and Report. April 1998
 Land North of Bishop's Stortford Hertfordshire. Site - ASR 5 Agricultural Land Classification ALC Map and Report April 1998 Resource Planning Team RPT Job Number: 25/98 Eastern Region MAFF Reference:EL
Principles of nutrient management
 Principles of nutrient management A - Soil balance Tasmanian Office: 1/9 Arnold Street, Penguin PO Box 396 Penguin, Tasmania 7316 T (03) 6437 2264 F (03) 6437 2271 E rm@rmcg.com.au W www.rmcg.com.au ABN
GRAZING S IMPACT ON SOIL HEALTH
 GRAZING S IMPACT ON SOIL HEALTH Pasture Layout shelter Nutrients (ppm) by Landscape Unit Profile Nitrogen Lane Paddock Shelter Water Potassium Phosphorus Lane Paddock Shelter Water Lane Paddock Shelter
Introduction to Geotechnical Engineering, 2e Das/Sivakugan Chapter 2 Grain-Size Analysis Cengage Learning Engineering. All Rights Reserved.
 Chapter 2 Grain-Size Analysis 1 Learning Objectives and Outline To learn the size ranges for gravels, sands, and fines To understand how soils are formed To be able to develop the grain-size distribution
SHEPWAY LOCAL PLAN SITE 38: BRENZETT, KENT AGRICULTURAL LAND CLASSIFICATION REPORT. 1.0 Summary
 Al SHEPWAY LOCAL PLAN SITE 38: BRENZETT, KENT AGRICULTURAL LAND CLASSIFICATION ALC MAP & REPORT SEPTEMBER 1993 SHEPWAY LOCAL PLAN SITE 38: BRENZETT, KENT AGRICULTURAL LAND CLASSIFICATION REPORT 1.0 Summary
Annotated example of a land carbon stock calculation using standard values
 Annotated example of a land carbon stock calculation using standard values Ecofys UK Ltd 1 Alie street Aldgate London E1 8DE UK W: www.ecofys.co.uk T: +44 (0) 207 702 0972 F: +44 (0) 207 702 0971 E: info@ecofys.com
Potassium responses in wheat and canola, Glenthompson, 2016
 Potassium responses in wheat and canola, Glenthompson, 2016 Rob Norton 1 and Claudia Gebert 2 1 International Plant Nutrition Institute, Horsham, Vic. 2 Southern Farming Systems, Inverleigh, Vic. Key messages
Implementation of Tier 1 for Mineral Soil under Cropland and Grassland in EU MS
 Implementation of Tier 1 for Mineral Soil under Cropland and Grassland in EU MS IPCC Tier 1 Approach Roland Hiederer, Raul Abad-Viñas, Viorel Blujdea, Giacomo Grassi European Commission Joint Research
33. Fate of pesticides in soil and plant.
 33. Fate of pesticides in soil and plant. What Happens to Pesticides When a pesticide is released into the environment many things happen to it. Sometimes what happens is beneficial. For example, the leaching
MANURE MANAGEMENT IMPACTS ON PHOSPHORUS LOSS WITH SURFACE RUNOFF AND ON-FARM PHOSPHORUS INDEX IMPLEMENTATION. AN OVERVIEW OF ONGOING RESEARCH
 MANURE MANAGEMENT IMPACTS ON PHOSPHORUS LOSS WITH SURFACE RUNOFF AND ON-FARM PHOSPHORUS INDEX IMPLEMENTATION. AN OVERVIEW OF ONGOING RESEARCH Antonio P. Mallarino, professor Brett. L. Allen and Mazhar
Chapter 9: Soil and Agriculture
 Chapter 9: Soil and Agriculture Terms to know: Agriculture No-till farming Cropland Rangeland Soil Monoculture Polyculture Green Revolution Chemical weathering Biological weathering Physical weathering
FACTORS AFFECTING CROP NEEDS FOR POTASSIUM WESTERN PERSPECTIVE TERRY A. TINDALL AND DALE WESTERMANN MANAGER OF AGRONOMY J.R
 FACTORS AFFECTING CROP NEEDS FOR POTASSIUM WESTERN PERSPECTIVE TERRY A. TINDALL AND DALE WESTERMANN MANAGER OF AGRONOMY J.R. SIMPLOT COMPANY USDA-ARS SOIL SCIENTIST SOIL FACTORS--POTATOES Potassium uptake
The Management of Soil Nutrients: Chemical Fertilisers or Not?
 30 May 2017 The Management of Soil Nutrients: Chemical Fertilisers or Not? Christopher Johns Research Manager Northern Australia and Landcare Research Programme Key Points There are 17 chemical elements
Incorporating lime in order to ameliorate subsoil acidity faster
 Incorporating lime in order to ameliorate subsoil acidity faster Chad Reynolds, Wayne Parker, Department of Primary Industries and Regional Development Key messages Mechanical lime incorporation, using
NUTRIENT MANAGEMENT PLAN FIELD MONITORING 1. Bradford D. Brown ABSTRACT
 NUTRIENT MANAGEMENT PLAN FIELD MONITORING 1 Bradford D. Brown ABSTRACT Nutrient Management Plan Field Monitoring enables producers to evaluate the effectiveness of their Nutrient Management Plan implementation
Patrick Nimiago Forest Research Institute,Lae
 Patrick Nimiago Forest Research Institute,Lae PRESENTATION CONTENT 1. Why soil survey Is 2. soil What to a survey living and measure or non living thing? 3. Where to sample soil 4. Timing of sample 5.
Soil Properties that influence detachment and runoff
 Soil Properties that influence detachment and runoff Texture Structure Aggregation Density/compaction Wettability Antecedent soil moisture Organic Matter Sandy soils Sands are easily detacted However,