Using 2-way ANOVA to dissect gene expression following myocardial infarction in mice
|
|
|
- Cleopatra Singleton
- 6 years ago
- Views:
Transcription
1 Using 2-way ANOVA to dissect gene expression following myocardial infarction in mice Thank you for waiting. The presentation will be starting in a few minutes at 9AM Pacific Daylight Time. During this webinar you will be in listen only mode, so if you have a question, please type it into the Question and Answer panel at the end of the presentation. Dr. Olson will try to answer as many questions as possible at the end of the presentation. We will also make the slides and a recording of this presentation available after the webinar. Please contact Dr. Olson at eric@genesifter.net if you would like a copy of the slides.


2 Using 2-way ANOVA to dissect gene expression following myocardial infarction in mice N. Eric Olson
3 Using 2-way ANOVA to dissect gene expression following myocardial infarction in mice General microarray data analysis workflow From raw data to biological significance Comparison statistics Two-way ANOVA Correction for multiple testing GeneSifter Overview CardioGenomics Microarray analysis of gene expression following myocardial infarction Data overview Dissection of gene expression using 2-way ANOVA
4 The Microarray Data Analysis Process Experimental Design Number of groups, factors, replicates Data management Data, sample annotation, gene annotation, databases Differential Expression Comparison statistics, Correction for multiple testing, Clustering Biological significance Individual genes, Biological themes Platform Selection One-color, two-color, platform comparisons System access Ease of use, accessibility Making data public and using public data MIAME, Journals, GEO, meta-analysis
5 The Microarray Data Analysis Process Experimental Design Number of groups, factors, replicates Data management Data, sample annotation, gene annotation, databases Differential Expression Comparison statistics, Correction for multiple testing, Clustering Biological significance Individual genes, Biological themes Platform Selection One-color, two-color, platform comparisons System access Ease of use, accessibility Making data public and using public data MIAME, Journals, GEO, meta-analysis
6 Experiment Design Type of experiment Two groups Normal vs. cancer Control vs. treated Three or more groups, single factor Time series Dose response Multiple treatment Four or more groups, multiple factors Time series with control and treated cells The type of experiment and number of groups and factors will determine the statistical methods needed to detect differential expression Replicates The more the better, but at least 3 Biological better than technical Rigorous statistical inferences cannot be made with a sample size of one. The more replicates, the stronger the inference. Pavlidis P, Li Q, Noble WS. The effect of replication on gene expression microarray experiments. Bioinformatics Sep 1;19(13): Experimental Design and Other Issues in Microarray Studies - Kathleen Kerr -
7 Differential Expression The fundamental goal of microarray experiments is to identify genes that are differentially expressed in the conditions being studied. Comparison statistics can be used to help identify differentially expressed genes and cluster analysis can be used to identify patterns of gene expression and to segregate a subset of genes based on these patterns. Statistical Significance Fold change Fold change does not address the reproducibility of the observed difference and cannot be used to determine the statistical significance. Comparison statistics 2 group t-test, Welch s t-test, Wilcoxon Rank Sum, 3 or more groups, single factor One-way ANOVA, Kruskal-Wallis 4 or more groups, multiple factors Two-way ANOVA Comparison tests require replicates and use the variability within the replicates to assign a confidence level as to whether the gene is differentially expressed. Supporting material - Draghici S. (2002) Statistical intelligence: effective analysis of high-density microarray data. Drug Discov Today, 7(11 Suppl).: S55-63.
 df = n 1 + n 2-2 The larger the difference between the groups and the lower the variance the bigger t will be and")
8 t-test for comparison of two groups Calculate t statistic t = difference between groups difference within groups = Mean grp 1 Mean grp 2 ((s 12 /n 1 ) + (s 22 /n 2 )) 1/2 s = variance n = size of sample Determine confidence level for t (probability that t could occur by chance) df = n 1 + n 2-2 The larger the difference between the groups and the lower the variance the bigger t will be and the lower p will be
9 Differential Expression 2 groups, 4 replicates each Mean, standard deviation, fold change and p-value calculated 8 Mean Signal Exp Con Gene 1 Fold Change = 5.3 p = 0.19 Mean Signal Exp Con Gene 2 Fold Change = 5.3 p = 0.03 Fold change vs. p value
10 Analysis of Variance (ANOVA) Like t-test, identifies genes with large differences between groups and small differences within groups For use with 3 or more groups One-way and two-way One-way examines effects of one factor on gene expression Two-way can examine effects of two factors on gene expression as well as the interaction of the two factors Pavlidis P. Using ANOVA for gene selection from microarray studies of the nervous system. Methods Dec;31(4): Glantz S. Primer of Biostatistics. 5 th Edition. McGraw-Hill. Glantz S, Slinker B. Primer of Regression and Analysis of Variance. McGraw-Hill.
11 Two-way ANOVA Example Triple treatment in Huntington s Disease model (R6/2 mice, GSE857, Affymetrix U74Av2) Treatment - + Disease effect Disease WT R6/ WT - WT + R6/2 - R6/2 + Gene expression pattern Treatment effect Interaction Disease and treatment effect (no Interaction)
12 Two-way ANOVA compared to t-test Triple treatment in Huntington s Disease model (R6/2 mice, GSE857, Affymetrix U74Av2) Treatment - + Disease WT R6/ t-test Two-way Disease Differences Pavlidis P, Noble WS. Analysis of strain and regional variation in gene expression in mouse brain. Genome Biol. 2001;2(10):RESEARCH0042.
13 Differential Expression Correction for multiple testing- Methods for adjusting the p-value from a comparison test based on the number of tests performed. These adjustments help to reduce the number of false positives in an experiment. FWER : Family Wise Error Rate (FWER) corrections adjust the p-value so that it reflects the chance of at least 1 false positive being found in the list. Bonferonni, Holm, W & Y MaxT FDR : False Discovery Rate corrections (FDR) adjust the p-value so that it reflects the frequency of false positives in the list. Benjamini and Hochberg, SAM The FWER methods are more conservative, but the FDR methods are usually acceptable for discovery experiments, i.e. where a small number of false positives is acceptable Dudoit, S., et al. (2003) Multiple hypothesis testing in microarray experiments. Statistical Science 18(1): Reiner, A., et al. (2003) Identifying differentially expressed genes using false discovery rate controlling procedures. Bioinformatics 19(3):
14 Multiple Hypothesis Testing in Microarray Experiments Per comparison error rate (PCER) the probability of error for each comparison Family-wise error rate (FWER) the probability of at least one error for all comparisons False discovery rate (FDR) the expected proportion of errors among your results An error means a false positive Example : 1000 genes and 50 differentially expressed using cutoff of 5% PCER - using a 5% PCER means a 5% chance of error for each comparison, so perhaps 50 errors for 1000 comparisons. This is not acceptable, you don t have confidence than any of your results are real (not errors). FWER using 5% FWER means there is a 5% chance that you have at least 1 error. This is very good and would be a very conservative requirement, you are confident that all of your results are real. FDR using 5% FDR you would expect 2.5 errors (5% of 50). This is probably acceptable, you are confident that most of your results are real.
 5% FWER: 19 genes (5% chance of 1 error) 5% FDR: 904 genes (estimate 45")
15 Correction Example CodeLink Ms 10K BioArray Lacrimal + Placebo Lacrimal + Androgen 3 biological replicates 9982 Comparisons t-test 5% PCER : 2458 genes (estimate 499 errors) 5% FWER: 19 genes (5% chance of 1 error) 5% FDR: 904 genes (estimate 45 errors)
16 Identification and partitioning of expression patterns Cluster Analysis - clustering methods are descriptive or exploratory tools that can be used to identify groups within complex datasets. Visualization Methods such as hierarchical clustering can be used to help identify patterns in a large dataset. Hierarchical methods provide a hierarchy of clusters, from the smallest, where all objects (gene expression profiles) are in one cluster, through to the largest set, where each observation is in its own cluster. Partitioning this type of cluster analysis can be used to separate data into discrete groups or clusters. Partitioning methods partition the data (list of genes) into a prespecified number (K) of mutually exclusive groups based on feature vector (expression profile). - K-means -PAM (Partitioning around medoids) Cluster analysis is used to identify patterns of gene expression within large datasets and to segregate those genes based on these patterns. Quackenbush J. Computational analysis of microarray data. Nat Rev Genet Jun;2(6): Review. Kaufman L, Rousseeuw PJ: Finding Groups in Data: An Introduction to Cluster Analysis. New York: Wiley; 1990.

17 Identification and partitioning of expression patterns Hierarchical Partitioning Cluster analysis 1846 differentially expressed genes from FVB heart development time series.
18 Analysis Workflow Examples 2 groups (apoe -/- aorta vs. wt aorta) 5 groups, single factor (Drosophila Innate Immune Response Time Series) 18 groups, two factors (Gene expression after myocardial infarction in mouse) t-test BH (FDR) Up regulated Down regulated Gene Lists One-way ANOVA BH (FDR) Clustering Gene Lists Two-way ANOVA BH (FDR) Clustering Gene Lists Individual genes of interest Biological themes (Pathways, molecular functions, etc.)
19 Using 2-way ANOVA to dissect gene expression following myocardial infarction in mice General microarray data analysis workflow From raw data to biological significance Comparison statistics Two-way ANOVA Correction for multiple testing GeneSifter Overview CardioGenomics Microarray analysis of gene expression following myocardial infarction Data overview Dissection of gene expression using 2-way ANOVA
 Multiple upload tools CodeLink Affymetrix Illumina Agilent Custom")


20 GeneSifter Microarray Data Analysis Accessibility Web-based Secure Data management Data Annotation (MIAME) Multiple upload tools CodeLink Affymetrix Illumina Agilent Custom Differential Expression - Powerful, accessible tools for determining Statistical Significance R based statistics Bioconductor Comparison Tests t-test, Welch s t-test, Wilcoxon Rank sum test, one-way ANOVA, two-way ANOVA Correction for Multiple Testing Bonferroni, Holm, Westfall and Young maxt, Benjamini and Hochberg Unsupervised Clustering PAM, CLARA, Hierarchical clustering Silhouettes


21 GeneSifter Microarray Data Analysis Integrated tools for determining Biological Significance One Click Gene Summary Ontology Report Pathway Report Search by ontology terms Search by KEGG terms or Chromosome

22 The GeneSifter Data Center Free resource Training Research Publishing 6 areas Cardiovascular Cancer Endocrinology Neuroscience Immunology Oral Biology Access to : Data Analysis summary Tutorials WebEx


23 The GeneSifter Data Center
24 The Microarray Data Analysis Process Experimental Design Number of groups, factors, replicates Data management Data, sample annotation, gene annotation, databases Differential Expression Comparison statistics, Correction for multiple testing, Clustering Biological significance Individual genes, Biological themes Platform Selection One-color, two-color, platform comparisons System access Ease of use, accessibility Making data public and using public data MIAME, Journals, GEO, meta-analysis

25 The CardioGenomics Program for Genomic Appliactions Genomics of Cardiovascular Development, Adaptation, and Remodeling. NHLBI Program for Genomic Applications, Harvard Medical School. URL:

26 CardioGenomics Microarray Data Animal models of cardiomyopathy Human tissues Affymetrix Arrays MAS5 data and CEL files available
27 Using 2-way ANOVA to dissect gene expression following myocardial infarction in mice General microarray data analysis workflow From raw data to biological significance Comparison statistics Two-way ANOVA Correction for multiple testing GeneSifter Overview CardioGenomics Microarray analysis of gene expression following myocardial infarction Data overview Dissection of gene expression using 2-way ANOVA
 CEL files also available (RMA or")
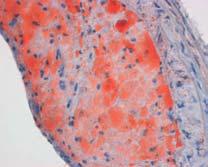
28 CardioGenomics - Mouse Myocardial Infarction Model 6 time points after ligation of LAD artery (1hr -> 8wk) Three sites - Sham LV, Infarcted LV, Non-infarcted LV Affymetrix Mouse U74Av2 Array MAS5 text files loaded (signal and detection call) CEL files also available (RMA or GC-RMA)
29 Analysis of Variance (ANOVA) Like t-test, identifies genes with large differences between groups and small differences within groups For use with 3 or more groups One-way and two-way One-way examines effects of one factor on gene expression Two-way can examine effects of two factors on gene expression as well as the interaction of the two factors Pavlidis P. Using ANOVA for gene selection from microarray studies of the nervous system. Methods Dec;31(4): Glantz S. Primer of Biostatistics. 5 th Edition. McGraw-Hill. Glantz S, Slinker B. Primer of Regression and Analysis of Variance. McGraw-Hill.
30 Project Analysis : Two-way ANOVA Factor One: Site (3 levels, LV, NILV, ILV) Factor Two: Time after ligation (6 levels, 1 hr, 4 hr, 24 hr,48 hr,1 wk, 8 wk) Site: Time: LV NILV ILV Gene expression pattern Site Effect Time Effect Interaction

31 Project Analysis : Two-way ANOVA

32 Project Analysis : Two-way ANOVA Identify Factors Indicate number of levels for each

33 Project Analysis : Two-way ANOVA Identify levels for each factor

34 Project Analysis : Two-way ANOVA Assign levels for each factor to cells

35 Project Analysis : Two-way ANOVA Include fold-change cutoff if desired Select effect to filter on first (you can switch later)
36 Two-way ANOVA : Interaction
37 Two-way ANOVA : Interaction
38 Biological Significance Gene Annotation Sources UniGene - organizes GenBank sequences into a non-redundant set of gene-oriented clusters. Gene titles are assigned to the clusters and these titles are commonly used by researchers to refer to that particular gene. LocusLink (Entrez Gene) - provides a single query interface to curated sequence and descriptive information, including function, about genes. Gene Ontologies The Gene Ontology Consortium provides controlled vocabularies for the description of the molecular function, biological process and cellular component of gene products, that can be used by databases such as Entrez Gene. KEGG - Kyoto Encyclopedia of Genes and Genomes provides information about both regulatory and metabolic pathways for genes. Reference Sequences- The NCBI Reference Sequence project (RefSeq) provides reference sequences for both the mrna and protein products of included genes. GeneSifter maintains its own copies of these databases and updates them automatically.
39 One-Click Gene Summary
40 Two-way ANOVA : Interaction

41 KEGG Report
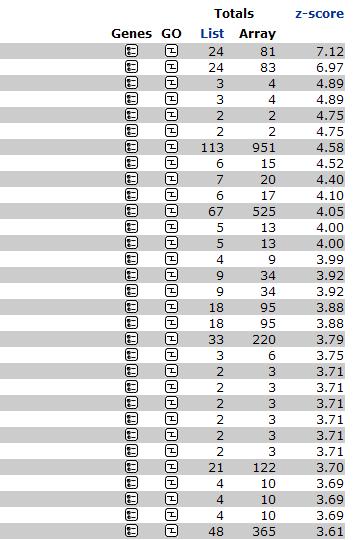
42 Ontology Report : z-score R = total number of genes meeting selection criteria N = total number of genes measured r = number of genes meeting selection criteria with the specified GO term n = total number of genes measured with the specific GO term Reference: Scott W Doniger, Nathan Salomonis, Kam D Dahlquist, Karen Vranizan, Steven C Lawlor and Bruce R Conklin; MAPPFinder: usig Gene Ontology and GenMAPP to create a global gene-expression profile from microarray data, Genome Biology 2003, 4:R7


43 KEGG Report

44 Two-way ANOVA : Interaction
45 Interaction - Visualization Visualization of 2513 genes (Interaction p < 0.001)

46 Interaction Partition Clustering


47 Interaction Cluster 1


48 Interaction Cluster 2


49 Interaction Cluster 3


50 Interaction Cluster 4
51 Two-way ANOVA : Summary Gene expression following myocardial infarction 18 groups (3 biological replicates) 2 factors (Site and Time) Differential Expression (Two-way ANOVA, interaction) Visualization (Hierarchical clustering) Partitioning (Partitioning around medoids) Biological significance (Biological process and KEGG) Glucan metabolism (10) Oxidative phosphorylation (56) Fatty acid metabolism (15) ~12,000 transcripts 2513 genes Cell division (21) Immune cell activation (18) Regulation of actin cytoskeleton (26) Cell adhesion (24) Proteolysis (21) TGF beta signaling (7) Inflammatory response (19) Regulation of cell cycle (21) Toll-like receptor signaling (10)
52 Gene expression following myocardial infarction Pathways Biological processes Molecular functions Inflammatory response Positive regulation of cell proliferation Regulation of cell cycle Toll-like receptor signaling Jak-STAT signaling pathway Cell division Immune cell activation Small GTPase mediated signal transduction Regulation of actin cytoskeleton Leukocyte transendothelial migration Cell adhesion Cell cycle arrest Extracellular matrix structural constituent Proteolysis TGF beta signaling

53 Future analysis - Transcription factors 63 genes with transcription factor activity differentially expressed - Isolate differences between infarcted and non-infarcted two-anova with only two sites (ilv and nilv)
 5 groups, single factor (Drosophila")

 Clustering Gene Lists")

54 GeneSifter Workflow Examples 2 groups (apoe -/- aorta vs. wt aorta) 5 groups, single factor (Drosophila Innate Immune Response Time Series) 18 groups, two factors (Gene expression after myocardial infarction in mouse) t-test BH (FDR) Up regulated Down regulated Gene Lists One-way ANOVA BH (FDR) Clustering Gene Lists Two-way ANOVA BH (FDR) Clustering Gene Lists Individual genes of interest Biological themes (Pathways, molecular functions, etc.)


55 Resources Monthly Webinar Series 7/20/06 - Using 2-way ANOVA to dissect gene expression following myocardial infarction in mice Archived - Using 2-way ANOVA to dissect the immune response to hookworm infection in mouse lung Archived - The microarray data analysis process - from raw data to biological significance Archived - Microarray analysis of gene expression in androgen-independent prostate cancer Archived - Microarray analysis of gene expression in male germ cell tumors Archived - Microarray analysis of gene expression in Huntington's Disease peripheral blood - a platform comparison


56 Thank You Trial account, tutorials, sample data and Data Center Eric Olson
Using 2-way ANOVA to dissect the immune response to hookworm infection in mouse lung
 Using 2-way ANOVA to dissect the immune response to hookworm infection in mouse lung Using 2-way ANOVA to dissect the immune response to hookworm infection in mouse lung General microarry data analysis
Microarray Analysis of Gene Expression in Huntington's Disease Peripheral Blood - a Platform Comparison
 Microarray Analysis of Gene Expression in Huntington's Disease Peripheral Blood - a Platform Comparison Thank you for waiting. The presentation will be starting in a few minutes at 9AM Pacific Daylight
Seven Keys to Successful Microarray Data Analysis
 Seven Keys to Successful Microarray Data Analysis Experiment Design Platform Selection Data Management System Access Differential Expression Biological Significance Data Publication Type of experiment
Microarray Analysis of Gene Expression in Huntington's Disease Peripheral Blood - a Platform Comparison. CodeLink compatible
 Microarray Analysis of Gene Expression in Huntington's Disease Peripheral Blood - a Platform Comparison CodeLink compatible Microarray Analysis of Gene Expression in Huntington's Disease Peripheral Blood
The microarray data analysis process - from raw data to biological significance
 The microarray data analysis process - from raw data to biological significance Thank you for waiting. The presentation will be starting in a few minutes at 6AM Pacific Daylight Time. During this webinar
The microarray data analysis process - from raw data to biological significance. N. Eric Olson
 The microarray data analysis process - from raw data to biological significance N. Eric Olson eric@genesifter.net Microarrays 60,000 56,000 Data Points per Experiment 50,000 40,000 30,000 20,000 10,000
Microarray analysis of gene expression in male germ cell tumors
 Microarray analysis of gene expression in male germ cell tumors Microarray analysis of gene expression in male germ cell tumors General microarry data analysis workflow From raw data to biological significance
Identification of biological themes in microarray data from a mouse heart development time series using GeneSifter
 Identification of biological themes in microarray data from a mouse heart development time series using GeneSifter VizX Labs, LLC Seattle, WA 98119 Abstract Oligonucleotide microarrays were used to study
Introduction to Microarray Technique, Data Analysis, Databases Maryam Abedi PhD student of Medical Genetics
 Introduction to Microarray Technique, Data Analysis, Databases Maryam Abedi PhD student of Medical Genetics abedi777@ymail.com Outlines Technology Basic concepts Data analysis Printed Microarrays In Situ-Synthesized
The Microarray Data Analysis Process: From Raw Data to Biological Significance
 NeuroRx : The Journal of the American Society for Experimental NeuroTherapeutics The Microarray Data Analysis Process: From Raw Data to Biological Significance N. Eric Olson VizX Labs, Seattle, Washington
Microarray Informatics
 Microarray Informatics Donald Dunbar MSc Seminar 4 th February 2009 Aims To give a biologistʼs view of microarray experiments To explain the technologies involved To describe typical microarray experiments
Gene Expression Data Analysis
 Gene Expression Data Analysis Bing Zhang Department of Biomedical Informatics Vanderbilt University bing.zhang@vanderbilt.edu BMIF 310, Fall 2009 Gene expression technologies (summary) Hybridization-based
Analysis of Microarray Data
 Analysis of Microarray Data Lecture 3: Visualization and Functional Analysis George Bell, Ph.D. Bioinformatics Scientist Bioinformatics and Research Computing Whitehead Institute Outline Review Visualizing
Analysis of Microarray Data
 Analysis of Microarray Data Lecture 3: Visualization and Functional Analysis George Bell, Ph.D. Senior Bioinformatics Scientist Bioinformatics and Research Computing Whitehead Institute Outline Review
Microarray Informatics
 Microarray Informatics Donald Dunbar MSc Seminar 31 st January 2007 Aims To give a biologist s view of microarray experiments To explain the technologies involved To describe typical microarray experiments
Annotation. (Chapter 8)
") Annotation (Chapter 8) Genome annotation Genome annotation is the process of attaching biological information to sequences: identify elements on the genome attach biological information to elements store
Annotation (Chapter 8) Genome annotation Genome annotation is the process of attaching biological information to sequences: identify elements on the genome attach biological information to elements store
PATHWAY ANALYSIS. Susan LM Coort, PhD Department of Bioinformatics, Maastricht University. PET course: Toxicogenomics
 PATHWAY ANALYSIS Susan LM Coort, PhD Department of Bioinformatics, Maastricht University 1 Data analysis overview Microarray scans Slide based on a slide from J. Pennings, RIVM, NL Image analysis Preprocessing
Agilent GeneSpring GX 10: Beyond. Pam Tangvoranuntakul Product Manager, GeneSpring October 1, 2008
 Agilent GeneSpring GX 10: Gene Expression and Beyond Pam Tangvoranuntakul Product Manager, GeneSpring October 1, 2008 GeneSpring GX 10 in the News Our Goals for GeneSpring GX 10 Goal 1: Bring back GeneSpring
Bioconductor. Course in Practical Microarray Analysis Berlin Slides 2002 Sandrine Dudoit, Robert Gentleman. Adapted by Wolfgang Huber.
 Bioconductor Course in Practical Microarray Analysis Berlin 27.-30.1.2003 Slides 2002 Sandrine Dudoit, Robert Gentleman. Adapted by Wolfgang Huber. Statistical computing Applications statistical design
Microarray Data Analysis in GeneSpring GX 11. Month ##, 200X
 Microarray Data Analysis in GeneSpring GX 11 Month ##, 200X Agenda Genome Browser GO GSEA Pathway Analysis Network building Find significant pathways Extract relations via NLP Data Visualization Options
CodeLink Human Whole Genome Bioarray
 CodeLink Human Whole Genome Bioarray 55,000 human gene targets on a single bioarray The CodeLink Human Whole Genome Bioarray comprises one of the most comprehensive coverages of the human genome, as it
Integrative Genomics 1a. Introduction
 2016 Course Outline Integrative Genomics 1a. Introduction ggibson.gt@gmail.com http://www.cig.gatech.edu 1a. Experimental Design and Hypothesis Testing (GG) 1b. Normalization (GG) 2a. RNASeq (MI) 2b. Clustering
Deakin Research Online
 Deakin Research Online This is the published version: Church, Philip, Goscinski, Andrzej, Wong, Adam and Lefevre, Christophe 2011, Simplifying gene expression microarray comparative analysis., in BIOCOM
Outline. Analysis of Microarray Data. Most important design question. General experimental issues
 Outline Analysis of Microarray Data Lecture 1: Experimental Design and Data Normalization Introduction to microarrays Experimental design Data normalization Other data transformation Exercises George Bell,
Introduction to Bioinformatics and Gene Expression Technology
 Vocabulary Introduction to Bioinformatics and Gene Expression Technology Utah State University Spring 2014 STAT 5570: Statistical Bioinformatics Notes 1.1 Gene: Genetics: Genome: Genomics: hereditary DNA
Standard Data Analysis Report Agilent Gene Expression Service
 Standard Data Analysis Report Agilent Gene Expression Service Experiment: S534662 Date: 2011-01-01 Prepared for: Dr. Researcher Genomic Sciences Lab Prepared by S534662 Standard Data Analysis Report 2011-01-01
Bioconductor. Course in Practical Microarray Analysis Heidelberg
 Bioconductor Course in Practical Microarray Analysis Heidelberg 23.-27.9.2002 Slides 2002 Sandrine Dudoit, Robert Gentleman. Adapted by Wolfgang Huber. Statistical computing Everywhere for statistical
Annotation and Function of Switch-like Genes in Health and Disease. A Thesis. Submitted to the Faculty. Drexel University. Adam M.
 Annotation and Function of Switch-like Genes in Health and Disease A Thesis Submitted to the Faculty of Drexel University by Adam M. Ertel in partial fulfillment of the requirements for the degree of Doctor
Bioinformatics for Biologists
 Bioinformatics for Biologists Microarray Data Analysis. Lecture 1. Fran Lewitter, Ph.D. Director Bioinformatics and Research Computing Whitehead Institute Outline Introduction Working with microarray data
GS Analysis of Microarray Data
 GS01 0163 Analysis of Microarray Data Keith Baggerly and Brad Broom Department of Bioinformatics and Computational Biology UT M. D. Anderson Cancer Center kabagg@mdanderson.org bmbroom@mdanderson.org 7
Gene expression: Microarray data analysis. Copyright notice. Outline: microarray data analysis. Schedule
 Gene expression: Microarray data analysis Copyright notice Many of the images in this powerpoint presentation are from Bioinformatics and Functional Genomics by Jonathan Pevsner (ISBN -47-4-8). Copyright
Bioinformatics : Gene Expression Data Analysis
 05.12.03 Bioinformatics : Gene Expression Data Analysis Aidong Zhang Professor Computer Science and Engineering What is Bioinformatics Broad Definition The study of how information technologies are used
Analyzing Gene Set Enrichment
 Analyzing Gene Set Enrichment BaRC Hot Topics June 20, 2016 Yanmei Huang Bioinformatics and Research Computing Whitehead Institute http://barc.wi.mit.edu/hot_topics/ Purpose of Gene Set Enrichment Analysis
Exercise1 ArrayExpress Archive - High-throughput sequencing example
 ArrayExpress and Atlas practical: querying and exporting gene expression data at the EBI Gabriella Rustici gabry@ebi.ac.uk This practical will introduce you to the data content and query functionality
GS Analysis of Microarray Data
 GS01 0163 Analysis of Microarray Data Keith Baggerly and Brad Broom Department of Bioinformatics and Computational Biology UT M. D. Anderson Cancer Center kabagg@mdanderson.org bmbroom@mdanderson.org 8
How to deal with the microarray results.
 How to deal with the microarray results. Britt Gabrielsson PhD RCEM, Div of metabolism and cardiovascular research Department of Medicine The Sahlgrenska Academy at Göteborg University and then we will
A WEB-BASED TOOL FOR GENOMIC FUNCTIONAL ANNOTATION, STATISTICAL ANALYSIS AND DATA MINING
 A WEB-BASED TOOL FOR GENOMIC FUNCTIONAL ANNOTATION, STATISTICAL ANALYSIS AND DATA MINING D. Martucci a, F. Pinciroli a,b, M. Masseroli a a Dipartimento di Bioingegneria, Politecnico di Milano, Milano,
Analysis of Microarray Data
 Analysis of Microarray Data Lecture 1: Experimental Design and Data Normalization George Bell, Ph.D. Senior Bioinformatics Scientist Bioinformatics and Research Computing Whitehead Institute Outline Introduction
AGILENT S BIOINFORMATICS ANALYSIS SOFTWARE
 ACCELERATING PROGRESS IS IN OUR GENES AGILENT S BIOINFORMATICS ANALYSIS SOFTWARE GENESPRING GENE EXPRESSION (GX) MASS PROFILER PROFESSIONAL (MPP) PATHWAY ARCHITECT (PA) See Deeper. Reach Further. BIOINFORMATICS
Understanding protein lists from proteomics studies. Bing Zhang Department of Biomedical Informatics Vanderbilt University
 Understanding protein lists from proteomics studies Bing Zhang Department of Biomedical Informatics Vanderbilt University bing.zhang@vanderbilt.edu A typical comparative shotgun proteomics study IPI00375843
Gene List Enrichment Analysis
 Outline Gene List Enrichment Analysis George Bell, Ph.D. BaRC Hot Topics March 16, 2010 Why do enrichment analysis? Main types Selecting or ranking genes Annotation sources Statistics Remaining issues
The essentials of microarray data analysis
 The essentials of microarray data analysis (from a complete novice) Thanks to Rafael Irizarry for the slides! Outline Experimental design Take logs! Pre-processing: affy chips and 2-color arrays Clustering
Designing a Complex-Omics Experiments. Xiangqin Cui. Section on Statistical Genetics Department of Biostatistics University of Alabama at Birmingham
 Designing a Complex-Omics Experiments Xiangqin Cui Section on Statistical Genetics Department of Biostatistics University of Alabama at Birmingham 1/7/2015 Some slides are from previous lectures of Grier
GS Analysis of Microarray Data
 GS01 0163 Analysis of Microarray Data Keith Baggerly and Kevin Coombes Department of Bioinformatics and Computational Biology UT M. D. Anderson Cancer Center kabagg@mdanderson.org kcoombes@mdanderson.org
Analysis of Microarray Data
 Analysis of Microarray Data Lecture 1: Experimental Design and Data Normalization George Bell, Ph.D. Senior Bioinformatics Scientist Bioinformatics and Research Computing Whitehead Institute Outline Introduction
Gene expression analysis: Introduction to microarrays
 Gene expression analysis: Introduction to microarrays Adam Ameur The Linnaeus Centre for Bioinformatics, Uppsala University February 15, 2006 Overview Introduction Part I: How a microarray experiment is
Exploration and Analysis of DNA Microarray Data
 Exploration and Analysis of DNA Microarray Data Dhammika Amaratunga Senior Research Fellow in Nonclinical Biostatistics Johnson & Johnson Pharmaceutical Research & Development Javier Cabrera Associate
Microarray Data Analysis Workshop. Preprocessing and normalization A trailer show of the rest of the microarray world.
 Microarray Data Analysis Workshop MedVetNet Workshop, DTU 2008 Preprocessing and normalization A trailer show of the rest of the microarray world Carsten Friis Media glna tnra GlnA TnrA C2 glnr C3 C5 C6
advanced analysis of gene expression microarray data aidong zhang World Scientific State University of New York at Buffalo, USA
 advanced analysis of gene expression microarray data aidong zhang State University of New York at Buffalo, USA World Scientific NEW JERSEY LONDON SINGAPORE BEIJING SHANGHAI HONG KONG TAIPEI CHENNAI Contents
Annotation and the analysis of annotation terms. Brian J. Knaus USDA Forest Service Pacific Northwest Research Station
 Annotation and the analysis of annotation terms. Brian J. Knaus USDA Forest Service Pacific Northwest Research Station 1 Library preparation Sequencing Hypothesis testing Bioinformatics 2 Why annotate?
GeneQuery: A phenotype search tool based on gene co-expression clustering. Alexander Predeus 21-oct-2015
 GeneQuery: A phenotype search tool based on gene co-expression clustering Alexander Predeus 21-oct-2015 About myself Graduated from Moscow state University (1998-2003) PhD: Michigan State University (2003-2009):
Gene Expression Data Analysis (I)
") Gene Expression Data Analysis (I) Bing Zhang Department of Biomedical Informatics Vanderbilt University bing.zhang@vanderbilt.edu Bioinformatics tasks Biological question Experiment design Microarray experiment
Gene Expression Data Analysis (I) Bing Zhang Department of Biomedical Informatics Vanderbilt University bing.zhang@vanderbilt.edu Bioinformatics tasks Biological question Experiment design Microarray experiment
Ingenuity Pathway Analysis (IPA )
") Ingenuity Pathway Analysis (IPA ) For the analysis and interpretation of omics data IPA is a web-based software application for the analysis, integration, and interpretation of data derived from omics
Ingenuity Pathway Analysis (IPA ) For the analysis and interpretation of omics data IPA is a web-based software application for the analysis, integration, and interpretation of data derived from omics
Microarrays & Gene Expression Analysis
 Microarrays & Gene Expression Analysis Contents DNA microarray technique Why measure gene expression Clustering algorithms Relation to Cancer SAGE SBH Sequencing By Hybridization DNA Microarrays 1. Developed
Measuring and Understanding Gene Expression
 Measuring and Understanding Gene Expression Dr. Lars Eijssen Dept. Of Bioinformatics BiGCaT Sciences programme 2014 Why are genes interesting? TRANSCRIPTION Genome Genomics Transcriptome Transcriptomics
Biological Interpretation of Metabolomics Data. Martina Kutmon Maastricht University
 Biological Interpretation of Metabolomics Data Martina Kutmon Maastricht University Contents Background on pathway analysis WikiPathways Building Research Communities on Biological Pathways Data Analysis
Figure S1. TT and MZ-CRC-1 cell viability and proliferation after Palbociclib treatment. Cell viability assays (A) and cell counting assays (B) were
 and cell counting assays (B) were") Figure S1. TT and MZ-CRC-1 cell viability and proliferation after Palbociclib treatment. Cell viability assays (A) and cell counting assays (B) were performed with TT and MZ-CRC-1 cells treated with Palbociclib
Figure S1. TT and MZ-CRC-1 cell viability and proliferation after Palbociclib treatment. Cell viability assays (A) and cell counting assays (B) were performed with TT and MZ-CRC-1 cells treated with Palbociclib
Designing Complex Omics Experiments
 Designing Complex Omics Experiments Xiangqin Cui Section on Statistical Genetics Department of Biostatistics University of Alabama at Birmingham 6/15/2015 Some slides are from previous lectures given by
What is Bioinformatics?
 What is Bioinformatics? Bioinformatics is the field of science in which biology, computer science, and information technology merge to form a single discipline. - NCBI The ultimate goal of the field is
11/22/13. Proteomics, functional genomics, and systems biology. Biosciences 741: Genomics Fall, 2013 Week 11
 Proteomics, functional genomics, and systems biology Biosciences 741: Genomics Fall, 2013 Week 11 1 Figure 6.1 The future of genomics Functional Genomics The field of functional genomics represents the
Final exam: Introduction to Bioinformatics and Genomics DUE: Friday June 29 th at 4:00 pm
 Final exam: Introduction to Bioinformatics and Genomics DUE: Friday June 29 th at 4:00 pm Exam description: The purpose of this exam is for you to demonstrate your ability to use the different biomolecular
April transmart v1.2 Case Study for PredicTox
 April 2015 transmart v1.2 Case Study for PredicTox Agenda Agenda! What is PredicTox?! Brief transmart overview! Answering scientific questions with transmart s help: A case study maximizing data value!
Kyoto Encyclopedia of Genes and Genomes (KEGG)
") NPTEL Biotechnology -Systems Biology Kyoto Encyclopedia of Genes and Genomes (KEGG) Dr. M. Vijayalakshmi School of Chemical and Biotechnology SASTRA University Joint Initiative of IITs and IISc Funded
NPTEL Biotechnology -Systems Biology Kyoto Encyclopedia of Genes and Genomes (KEGG) Dr. M. Vijayalakshmi School of Chemical and Biotechnology SASTRA University Joint Initiative of IITs and IISc Funded
Research Powered by Agilent s GeneSpring
 Research Powered by Agilent s GeneSpring Agilent Technologies, Inc. Carolina Livi, Bioinformatics Segment Manager Research Powered by GeneSpring Topics GeneSpring (GS) platform New features in GS 13 What
Gene expression analysis. Biosciences 741: Genomics Fall, 2013 Week 5. Gene expression analysis
 Gene expression analysis Biosciences 741: Genomics Fall, 2013 Week 5 Gene expression analysis From EST clusters to spotted cdna microarrays Long vs. short oligonucleotide microarrays vs. RT-PCR Methods
BIOINF/BENG/BIMM/CHEM/CSE 184: Computational Molecular Biology. Lecture 2: Microarray analysis
 BIOINF/BENG/BIMM/CHEM/CSE 184: Computational Molecular Biology Lecture 2: Microarray analysis Genome wide measurement of gene transcription using DNA microarray Bruce Alberts, et al., Molecular Biology
Basic aspects of Microarray Data Analysis
 Hospital Universitari Vall d Hebron Institut de Recerca - VHIR Institut d Investigació Sanitària de l Instituto de Salud Carlos III (ISCIII) Basic aspects of Microarray Data Analysis Expression Data Analysis
Outline. Array platform considerations: Comparison between the technologies available in microarrays
 Microarray overview Outline Array platform considerations: Comparison between the technologies available in microarrays Differences in array fabrication Differences in array organization Applications of
Web-based tools for Bioinformatics; A (free) introduction to (freely available) NCBI, MUSC and World-wide.
 introduction to (freely available) NCBI, MUSC and World-wide.") Page 1 of 24 Web-based tools for Bioinformatics; A (free) introduction to (freely available) NCBI, MUSC and World-wide. When and Where---Wednesdays at 1pm-2pmRoom 438 Library Admin Building Beginning September
Page 1 of 24 Web-based tools for Bioinformatics; A (free) introduction to (freely available) NCBI, MUSC and World-wide. When and Where---Wednesdays at 1pm-2pmRoom 438 Library Admin Building Beginning September
Experience with Weka by Predictive Classification on Gene-Expre
 Experience with Weka by Predictive Classification on Gene-Expression Data Czech Technical University in Prague Faculty of Electrical Engineering Department of Cybernetics Intelligent Data Analysis lab
Next-Generation Sequencing Gene Expression Analysis Using Agilent GeneSpring GX
 Next-Generation Sequencing Gene Expression Analysis Using Agilent GeneSpring GX Technical Overview Introduction RNA Sequencing (RNA-Seq) is one of the most commonly used next-generation sequencing (NGS)
Supplementary Methods
 Supplementary Methods Microarray Data Analysis Gene expression data were obtained by hybridising a total of 24 samples from 6 experimental groups (n=4 per group) to Illumina HumanHT-12 Expression BeadChips.
Introduction to Bioinformatics and Gene Expression Technologies
 Introduction to Bioinformatics and Gene Expression Technologies Utah State University Fall 2017 Statistical Bioinformatics (Biomedical Big Data) Notes 1 1 Vocabulary Gene: hereditary DNA sequence at a
Introduction to Bioinformatics and Gene Expression Technologies
 Vocabulary Introduction to Bioinformatics and Gene Expression Technologies Utah State University Fall 2017 Statistical Bioinformatics (Biomedical Big Data) Notes 1 Gene: Genetics: Genome: Genomics: hereditary
2. Materials and Methods
 Identification of cancer-relevant Variations in a Novel Human Genome Sequence Robert Bruggner, Amir Ghazvinian 1, & Lekan Wang 1 CS229 Final Report, Fall 2009 1. Introduction Cancer affects people of all
Bioinformatics. Microarrays: designing chips, clustering methods. Fran Lewitter, Ph.D. Head, Biocomputing Whitehead Institute
 Bioinformatics Microarrays: designing chips, clustering methods Fran Lewitter, Ph.D. Head, Biocomputing Whitehead Institute Course Syllabus Jan 7 Jan 14 Jan 21 Jan 28 Feb 4 Feb 11 Feb 18 Feb 25 Sequence
Product Applications for the Sequence Analysis Collection
 Product Applications for the Sequence Analysis Collection Pipeline Pilot Contents Introduction... 1 Pipeline Pilot and Bioinformatics... 2 Sequence Searching with Profile HMM...2 Integrating Data in a
STATISTICAL CHALLENGES IN GENE DISCOVERY
 STATISTICAL CHALLENGES IN GENE DISCOVERY THROUGH MICROARRAY DATA ANALYSIS 1 Central Tuber Crops Research Institute,Kerala, India 2 Dept. of Statistics, St. Thomas College, Pala, Kerala, India email:sreejyothi
ChIP-seq data analysis with Chipster. Eija Korpelainen CSC IT Center for Science, Finland
 ChIP-seq data analysis with Chipster Eija Korpelainen CSC IT Center for Science, Finland chipster@csc.fi What will I learn? Short introduction to ChIP-seq Analyzing ChIP-seq data Central concepts Analysis
Knowledge-Guided Analysis with KnowEnG Lab
 Han Sinha Song Weinshilboum Knowledge-Guided Analysis with KnowEnG Lab KnowEnG Center Powerpoint by Charles Blatti Knowledge-Guided Analysis KnowEnG Center 2017 1 Exercise In this exercise we will be doing
Gene Expression Analysis with Pathway-Centric DNA Microarrays
 Gene Expression Analysis with Pathway-Centric DNA Microarrays SuperArray Bioscience Corporation George J. Quellhorst, Jr. Ph.D. Manager, Customer Education Topics to be Covered Introduction to DNA Microarrays
Comparison of Microarray Pre-Processing Methods
 Comparison of Microarray Pre-Processing Methods K. Shakya, H. J. Ruskin, G. Kerr, M. Crane, J. Becker Dublin City University, Dublin 9, Ireland Abstract Data pre-processing in microarray technology is
Gene-centered resources at NCBI
 COURSE OF BIOINFORMATICS a.a. 2014-2015 Gene-centered resources at NCBI We searched Accession Number: M60495 AT NCBI Nucleotide Gene has been implemented at NCBI to organize information about genes, serving
Nima Hejazi. Division of Biostatistics University of California, Berkeley stat.berkeley.edu/~nhejazi. nimahejazi.org github/nhejazi
 Data-Adaptive Estimation and Inference in the Analysis of Differential Methylation for the annual retreat of the Center for Computational Biology, given 18 November 2017 Nima Hejazi Division of Biostatistics
Whole Transcriptome Analysis of Illumina RNA- Seq Data. Ryan Peters Field Application Specialist
 Whole Transcriptome Analysis of Illumina RNA- Seq Data Ryan Peters Field Application Specialist Partek GS in your NGS Pipeline Your Start-to-Finish Solution for Analysis of Next Generation Sequencing Data
A Genetic Algorithm Approach to DNA Microarrays Analysis of Pancreatic Cancer
 A Genetic Algorithm Approach to DNA Microarrays Analysis of Pancreatic Cancer Nicolae Teodor MELITA 1, Stefan HOLBAN 2 1 Politehnica University of Timisoara, Faculty of Automation and Computers, Bd. V.
David M. Rocke Division of Biostatistics and Department of Biomedical Engineering University of California, Davis
 David M. Rocke Division of Biostatistics and Department of Biomedical Engineering University of California, Davis Outline RNA-Seq for differential expression analysis Statistical methods for RNA-Seq: Structure
Bioinformatics Analysis of Nano-based Omics Data
 Bioinformatics Analysis of Nano-based Omics Data Penny Nymark, Pekka Kohonen, Vesa Hongisto and Roland Grafström Hands-on Workshop on Nano Safety Assessment, 29 th September, 2016, National Technical University
Ph.D. Program in Genetics, Genomics, and Cancer Biology
 Ph.D. Program in Genetics, Genomics, and Cancer Biology Program Requirements Required Courses Credits GE 501, 511, 521, 531 Experimental Methods Pre-entry, I, II, III (3 research rotations are usually
IPA Advanced Training Course
 IPA Advanced Training Course Academia Sinica 2015 Oct Gene( 陳冠文 ) Supervisor and IPA certified analyst 1 Review for Introductory Training course Searching Building a Pathway Editing a Pathway for Publication
Some Principles for the Design and Analysis of Experiments using Gene Expression Arrays and Other High-Throughput Assay Methods
 Some Principles for the Design and Analysis of Experiments using Gene Expression Arrays and Other High-Throughput Assay Methods BST 226 Statistical Methods for Bioinformatics January 8, 2014 1 The -Omics
Random matrix analysis for gene co-expression experiments in cancer cells
 Random matrix analysis for gene co-expression experiments in cancer cells OIST-iTHES-CTSR 2016 July 9 th, 2016 Ayumi KIKKAWA (MTPU, OIST) Introduction : What is co-expression of genes? There are 20~30k
Data-Adaptive Estimation and Inference in the Analysis of Differential Methylation
 Data-Adaptive Estimation and Inference in the Analysis of Differential Methylation for the annual retreat of the Center for Computational Biology, given 18 November 2017 Nima Hejazi Division of Biostatistics
Using Mechanistic Data to Predict and Interpret Clinical Outcomes in Probiotic Studies on Immunity.
 Using Mechanistic Data to Predict and Interpret Clinical Outcomes in Probiotic Studies on Immunity. Milano, Italy October 16, 2015 Thomas A. Tompkins, Ph.D. Research Director, Lallemand Health Solutions
Defining an informativeness metric for clustering gene expression data
 Defining an informativeness metric for clustering gene expression data Author Mar, Jessica, Wells, Christine, Quackenbush, John Published 20 Journal Title Bioinformatics DOI https://doi.org/0.093/bioinformatics/btr074
PCR Arrays. An Advanced Real-time PCR Technology to Empower Your Pathway Analysis
 PCR Arrays An Advanced Real-time PCR Technology to Empower Your Pathway Analysis 1 Table of Contents 1. Introduction to the PCR Arrays 2. How PCR Arrays Work 3. Performance Data from PCR Arrays 4. Research
Retrieval of gene information at NCBI
 Retrieval of gene information at NCBI Some notes 1. http://www.cs.ucf.edu/~xiaoman/fall/ 2. Slides are for presenting the main paper, should minimize the copy and paste from the paper, should write in
ELE4120 Bioinformatics. Tutorial 5
 ELE4120 Bioinformatics Tutorial 5 1 1. Database Content GenBank RefSeq TPA UniProt 2. Database Searches 2 Databases A common situation for alignment is to search through a database to retrieve the similar
Effects of heat stress on the transcriptomic profile of blood cells in lactating dairy goats
 Effects of heat stress on the transcriptomic profile of blood cells in lactating dairy goats A. Contreras-Jodar* 1, A.A.K. Salama 1, S. Hamzaoui 1, G. Caja 1, M. Vailati 2, J.J. Loor 2 G2R Grup Recerca
ArrayExpress and Gene Expression Atlas: Mining Functional Genomics data
 ArrayExpress and Gene Expression Atlas: Mining Functional Genomics data Functional Genomics Team EBI-EMBL emma@ebi.ac.uk http://www.ebi.ac.uk/~emma/bcn_2012/ Talk structure Why do we need a database for