Evaluation of traffic gases emissions: the case of the city of Tunis
|
|
|
- Austin Dalton
- 6 years ago
- Views:
Transcription
1 Evaluation of traffic gases emissions: the case of the city of Tunis Daniel De Wolf 1,2 Noomen Guirat 1 1 Institut des Mers du Nord 2 HEC Ecole de Gestion de l ULG Université du Littoral Cote d Opale Université de Liège 21 Quai de la Citadelle - BP 5528, Boulevard du Rectorat 7 (B31), Dunkerque, France 4000 Liège, Belgium daniel.dewolf@ulg.ac.be Noomen.Guirat@univ-littoral.fr Abstract The purpose of this paper is to show how the operations research techniques can help to evaluate the emissions of polluting gases from road traffic in urban area. Our practical study case is the center of Tunis city. To evaluate the emissions of several polluting gases (CO, CO2, SO2, NOx, CH4 and VOC), we have combined the traffic assignment model ATESAME [1] with new module implementing the CORINAIR [2] formulas. The traffic assignment model corresponds to a static User Equilibrium model that can be computed by solving a nonlinear optimization problem (See Sheffi [5]). This nonlinear convex model can be efficiently solved by using the classical Frank Wolfe technique. The CORINAIR formulas give an expression of the unitary emissions, i.e. the emissions per kilometer, as a function of the vehicle speed and of the current temperature. Several scenarios of traffic congestion and temperature conditions have been simulated for the center of Tunis City. We present here the mains results from the simulations for the center of Tunis city. 1
2 1 The emissions model Let us now briefly describe the functioning of the model evaluating the polluting gases emissions. This model combines a classical User Equilibrium model with an implementation of the polluting gases emissions formula. We first recall the definition of an User Equilibrium. Then we present the CORINAIR methodology [2] to evaluate the unitary emissions from road traffic. 1.1 The traffic assignment model We recall first the User Equilibrium definition which can be found, for example, in Sheffi [5]. It is assumed that each traveler has for objective to minimize his total travel time, which is the sum of the travel times of all the arcs constituting his route. Definition 2.1 An User Equilibrium will be reached when no traveler can improve his travel time by unilaterally changing his route. Mathematically, on can give the following equivalent formulation: Definition 2.2 At an User Equilibrium, for each group of travelers having the same origin point and the same destination point, the travel times for all used paths connecting the origin to the destination are the same. the travel times of unused path are greater or equal to the common travel time of used paths for this group. Following Sheffi [5], we recall how equilibrium solutions can be computed as solutions of an equivalent non linear optimization problem. The data of the problem are the following. 1. The supply side of the traffic assignment model is given by : the network which can be represented by a Graph G = (N, A) where N is the set of nodes and A is the set of arcs indiced by a. 2
3 the link performance function associated to each a, noted t a (x a ) giving the link travel time of arc a as a function of the traffic flow on arc, x a. 2. The demand for travel is represented by an origins-destinations matrix q, where element q od is the number of traveler between the origin node o and the destination node d for a specific time period (generally the peak hour). We use p as indice for a particular path linking an origin node to a destination node. The travel time on a particular path p is noted c p. It can be computed as the sum of travel times on the successive arcs of the path linking origin node o to destination node d : c p = X a p t a (1) The variables of the problem are the path flows, noted f p for the flow on path p. The following relation between path flows f p and arc flows x a can be established. The flow on an arc is the sum of the flow on all paths using arc a: x a = X f p, a A (2) p a p We can also establish the following relation the path flows f p and the demand q od. In fact, q od, the total demand between origin node o and destination node d is the sum of path flows for all paths linking o to d: X f p = q od, od (3) p od Sheffi [5] show that the solutions of the traffic assignment problem can be founded as solution of the following non linear problem: min s.t. Z xa z(x) = X t a (x a )dx a a 0 X f p = q od od p od f p 0 p x a = X f p a 3 p a p (4)
4 The proof is very simple. The Kuhn Tucker conditions (See Luenberger [4]) which are necessary satisfied at the optimum of problem (4) are precisely the User Equilibrium Conditions. 1.2 The CORINAIR methodology The CORINAIR methodology is presented in [2]. We summarize here the main principles of this methodology. The European Community group for evaluating the gas emissions from road traffic has established unitary emission formula for several polluting gases as a function of: the composition of the fleet of vehicles; the current temperature; the average speed of vehicles. These formulas can be applied for speed ranking from 5 to 110 km/h and for temperature ranking from -10 Celsius to + 35 Celsius. The main polluting gases that we consider in this study are the following : the monoxide of Carbon: CO; the carbon dioxide: CO 2 the sulphur dioxide: SO 2 ; the oxides of Nitrogen: N0 x ; the methane: CH 4 ; the organic compounds volatiles: OCV. The basic formula for evaluating the gases emissions is the following: Emissions[g] = unitary emission factor[g/km] distance[km] (5) The unitary emission factors are given as a function of the fleet composition. For example, the formula giving the CO unitary emissions (in g/km) 4
5 Figure 1: CO emissions as a function of the vehicle Speed for a benzine car from category EC of 1.4 litre with a speed between 60 and 130 km/h is the following: (vehicule speed) + 0, 0026 (vehicule speed) 2 Plotting this function (See Figure 1), we can see on that the emissions are minimal for 90 kilometers per hour. For urban area a great proportion of trips are done with a cold motor. This imply a suremission factor which is function of the current temperature. For the same example of the CO emissions, the multiplicative factor corresponding to suremissions for cold start is given by the formula: (current temperature) Table 1 presents the evolution of this suremission factor as a function of the current temperature. Remark that for temperature greater than 30 Celsius, 5
6 Temperature CO Suremissions (Celsius) Factor -10 4,6-5 4,15 0 3,7 5 3, ,8 15 2, ,9 25 1, ,55 Table 1: Suremission factor as a function of the temperature the suremission factor is lower than 1, i.e. the suremission factor becomes a reduction factor. We only consider this suremissions factor for particular cars, the buses and trucks are supposed to travel all the day. For the assignment of the origindestination matrix on the network,we have used the ATESAME software [1] which provides as results : 1. the flow on each arc; 2. the travel time for each arc; 3. the average speed on each arc. To calibrate the CORINAIR formulas we have used some technical data given by car manufacturers. Since the only information needed by the CO- RINAIR formula are: 1. the average speed on each arc, 2. the flow on each arc, 3. the current temperature, all the relevant information (except the current temperature of course) are given by the assignment model. 6
7 2 Application to the center of Tunis City Let us now apply this model to our practical study case, namely the City of Tunis. The main data of the traffic assignment model, are, 1. the network description thought its graph representation; 2. the link travel time functions thought their road performance functions; 3. the demand represented by an origin-destination matrix. 2.1 Study area Our study area is thus the center of Tunis City. The network representation is done with an graph composed of 49 nodes and 114 links (See Figure 2). The origin-destination matrix was computed using public data provided by studies of the National Institute of Statistics (such as the number of cars per hour). The link travel time functions were calibrated using also public data (such the average speed or maximal speed). 2.2 Traffic composition On this network, on can observe the traffic composition given in Table % Particular cars running on benzine 18 % Particular cars running on diesel 4 % Particular cars running on gas 8 % Buses running on diesel 2 % Trucks running on diesel 100 % Total traffic Table 2: Traffic composition 7


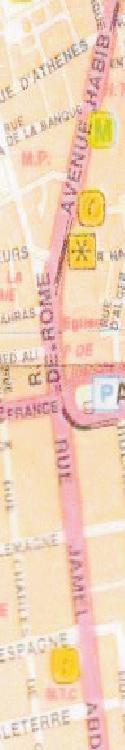


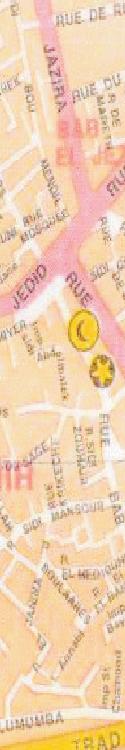


8 8 Figure 2: The center of Tunis City
9 2.3 Considered Senarii Four scenarios (See Table 3) were tested: Scenario 1: the first one corresponds to monday 6 february 2006 between 7 and 8 hours, which is the peak hour, the temperature was 17 0 C, Scenario 2: the second one corresponds to the same congested traffic condition, but with a current temperature of 34 0 C, Scenario 3: the third scenario corresponds to a fluid traffic and a temperature of 17 0 C, Scenario 4: the last scenario corresponds to a fluid traffic with a temperature of 34 0 C. Current temperature Current temperature 17 0 C 34 0 C Congested Scenario Scenario traffic 1 2 Fluid Scenario Scenario traffic 3 4 Table 3: Considered Senarii 3 Numerical results 3.1 Polluting gases emissions The implementation of the CORINAIR formulas gives the following results. Figure 3 gives the total emissions of Monoxide of Carbon (CO). Recall that this gas is very dangerous since it can not be detected and can be lethal in closed conditions. We can observe a diminution of CO emissions from Scenario 1 (low temperature) to Scenario 2 (high 9


10 Figure 3: CO Emissions temperature). Thus a greater temperature means lower CO emissions. This can be explained by the better combustion of the motor. The same conclusion can be done with the comparison of the two last senarii. The fact that the emissions are lower in the two last senarii is not surprising since the total demand is lower is this two scenarios. This directly imply lower emissions. Figure 4 gives the total emissions of Carbon Dioxide (CO 2 ). Recall that this gas is the main factor for the climatic warming. Note also that the scale has totally changed. We compute here the emissions in kg and not in g and the total emissions in Scenario 1 are of the order of magnitude of 350 tons. This is the main emission of road traffic. We can obverse the same phenomena that for the monoxide of carbon, namely that emissions are lower at an higher temperature but this reducing effect is lower here. Figure 5 gives the Oxides of Nitrogen (NO x ) emissions. This is an odorous gas which is factor of acid rains. The emissions are lower than the CO emissions. The great difference with the two oxides of carbon is the fact that the NO x emissions increase with the temperature ( from 10


11 Figure 4: CO2 Emissions Figure 5: NOx Emissions 11


12 Scenario 1 to Scenario 2). This can be explained by the fact that the NO x are emitted by a reaction that takes place at an high temperature. Figure 6 gives the Methane (CH 4 ) total emissions. This gas is also an important factor for the climatic warming. The CH4 emissions also increase with the temperature. Figure 6: CH4 Emissions Finally, Figure 7 gives the total emissions of Organic Compounds Volatiles: OCV. These very toxic gases can be carcinogenic. These emissions decreases with the temperature. This is not surprising if we recall that the combustion is better at an higher temperature and the fact that the Organic Compounds Volatiles are the subproducts of an incomplete reaction. 3.2 Emissions as a function of the vehicle types Our model also determine the quantity of gas emitted by each category of vehicles (See Figure 8). Some conclusions can be given. 12


13 Figure 7: VOC Emissions Figure 8: Emissions as a function of the vehicle types 13
14 First, the particular cars running on benzine, are the main factor of Carbon Monoxide emissions. Recall that theses cars represent 68 % of the total fleet but they cause 90 % of the total CO emissions. The cars running on diesel are responsible for greater CO 2 emissions. In fact, the particular cars running on diesel represent 18 % of the fleet but 30 % of the emissions. Note also that for the more toxic gasses, namely the dioxide of Sulfur (SO 2 ) and the oxides of Nitrogen (NO x ), the trucks and the buses which only represent 2 % and 8 % of the fleet are responsible of 40 % of their total emissions. This is due to the fact that these emissions are increasing with the power of the motor. 4 Conclusions This model can thus be used to evaluate the gas emissions in a variety of traffic conditions, temperature conditions and fleet composition. The limits of the model are the following: The traffic level and the unitary emissions remain approximate, The car fleet composition frequently changes, The vehicles counting used to define the origin-destination matrix are often incomplete or inaccurate. Future research will be devoted to compute a monetary evaluations of these traffic externalities. Acknowledgement Many thanks are due to Dr Eric Cornelis from the Groupe de Recherches sur les Transports of the Namur Faculty for helping us to apply the ATHESAME Software to our problem. 14
15 References [1] ATESAME: Another Traffic Equilibrium Software And Matrix Estimation, GRT, Facultés Universitaire de Notre Dame de la Paix, 2003, Namur. [2] ANDRIAS A., ZAFIRIS D., SAMARAS Z., CORINAIR Working Group on emission factors for calculating emissions from road traffic. Luxembourg: Office for official publications of the European Communities, vol. [3] GUIRAT Noomen, Evaluation des impacts du trafic automobile sur l atmosphère : application au centre-ville de Tunis, thèse de doctorat soutenue let 26 septembre 2007 à l Université du Littoral, Dunkerque, France. [4] LUENBERGER D, Linear and Nonlinear Programming, Addison Wesley, [5] SHEFFI Yosef, Urban Transportation Networks: Equilibrium Analysis with Mathematical Programming Methods, Prentice-Hall, New Jersey,
Appendix C: GHG Emissions Model
 Appendix C: GHG Emissions Model 1 METHOD OVERVIEW The Maryland Statewide Transportation Model (MSTM) Emissions Model (EM) is a CUBE-based model that uses emission rates calculated by the MOVES2010 EPA
Air Emissions 101. What are Some Types of Emissions? Oil & Gas Emissions: In Context VOC
 Oil & Gas Emissions: In Context Air Emissions 101 What are Some Types of Emissions? CO2 - Carbon dioxide is a greenhouse gas and is formed as one of the major products of combustion. CH4 - Methane, also
ROAD TRANSPORT EMISSIONS EVOLUTION IN URBAN AREAS; THE CASE OF THESSALONIKI, GREECE
 Proceedings of the 14 th International Conference on Environmental Science and Technology Rhodes, Greece, 3-5 September 2015 ROAD TRANSPORT EMISSIONS EVOLUTION IN URBAN AREAS; THE CASE OF THESSALONIKI,
Available online at ScienceDirect. Transportation Research Procedia 14 (2016 )
") Available online at www.sciencedirect.com ScienceDirect Transportation Research Procedia 14 (2016 ) 2649 2658 6th Transport Research Arena April 18-21, 2016 Estimated atmospheric emission from motor transport
Available online at www.sciencedirect.com ScienceDirect Transportation Research Procedia 14 (2016 ) 2649 2658 6th Transport Research Arena April 18-21, 2016 Estimated atmospheric emission from motor transport
NITROGEN OXIDES (NO-NO 2 )
") NITROGEN OXIDES (NO-NO 2 ) What is NOx? Where, when and how is it formed? What are its dangers? Are NO 2 emissions regulated? How can we get rid of it? What is the warning threshold for NO pollution? Here
NITROGEN OXIDES (NO-NO 2 ) What is NOx? Where, when and how is it formed? What are its dangers? Are NO 2 emissions regulated? How can we get rid of it? What is the warning threshold for NO pollution? Here
Developing Pollutant Emission Models for Diesel Public Vehicles in Tehran
 Developing Pollutant Emission Models for Diesel Public s in Tehran Mansour. Hadji Hosseinlou and Aidin.Massahi Abstract This paper presents diesel public vehicles models based on vehicle s speed for main
Emission inventory for urban transport in the rush hour: application to Seville
 Air Pollution XVI 291 Emission inventory for urban transport in the rush hour: application to Seville J. Racero, M. Cristina Martín, I. Eguía & F. Guerrero School of Engineering, University of Seville,
Some network flow problems in urban road networks. Michael Zhang Civil and Environmental Engineering University of California Davis
 Some network flow problems in urban road networks Michael Zhang Civil and Environmental Engineering University of California Davis Outline of Lecture Transportation modes, and some basic statistics Characteristics
250ST Optimization Models of Transport Networks
 Coordinating unit: Teaching unit: Academic year: Degree: ECTS credits: 2017 240 - ETSEIB - Barcelona School of Industrial Engineering 715 - EIO - Department of Statistics and Operations Research MASTER'S
EFFECT OF ROAD DETERIORATION ON VEHICLE EMISSION
 International Journal of Civil Engineering and Technology (IJCIET) Volume 8, Issue 5, May 2017, pp. 904 912, Article ID: IJCIET_08_05_099 Available online at http://www.iaeme.com/ijciet/issues.asp?jtype=ijciet&vtype=8&itype=5
Systems : An Analysis. TG Crainic, J Damay, M Gendreau, R Namboothiri June 15, 2009
 Strategic Planning of National/Regional Freight Transportation Systems : An Analysis TG Crainic, J Damay, M Gendreau, R Namboothiri June 15, 2009 Talk Outline Problem Motivation Multi-product Multi-modal
Energy and Environmental Issues for Transportation Sector of North Asia Mega-cities
 Proceedings of IGES/APN Mega-City Project 3-5 January (Rihga Royal Hotel Kokura, Kitakyushu Japan) Institute for Global Environmental Strategies All rights reserved. Energy and Environmental Issues for
Assessing the 02 external impacts of freight transport
 1 Assessing the 02 external impacts of freight transport Chapter summary This chapter examines various externalities associated with logistics, and discusses how their impact can be assessed. It starts
Introduction. The Traditional Approach
 A simplified approach to transportation system planning M. Galaverna, V. Recagno Dipartimento di Ingegneria Elettrica, University of Genova, Via air Opera Pia 11 a, 1-16145 Genova, Italy Introduction The
Precise estimates at municipality level of airborne pollutant emissions due to road traffic
 Urban Transport XIX 461 Precise estimates at municipality level of airborne pollutant emissions due to road traffic S. Carletti, G. Di Nicola & G. Passerini Department of Industrial Engineering and Mathematical
SUTRA : Sustainable Urban Transportation for the City of Tomorrow
 Preliminary Report SUTRA : Sustainable Urban Transportation for the City of Tomorrow WP 03: Multi-modal Transportation Modelling D03.3 User Manual and Example Test Data Sets First Draft Karlsruhe, January
Vista Canyon Transit Center - Air Quality Technical Memorandum
 803 Camarillo Springs Road, Suite C Camarillo, California 93012 (805) 437-1900 FAX (805) 437 1901 www.impactsciences.com MEMORANDUM To: Kris Markarian, City of Santa Clarita Job No. 1046.003 From: Susan
Air Pollution Zoning based on Land use and Traffic of Vehicles
 Air Pollution Zoning based on Land use and Traffic of Vehicles Elnaz Irannezhad Transportation Planning Engineering, Iran University of Science and Technology elnaziran@gmail.com Seyed Hossein Mousavi
Air Pollution Sources Overview. Amy Roberts, Division Manager January 24, 2019
 Air Pollution Sources Overview Amy Roberts, Division Manager January 24, 2019 Types of Air Pollutants Criteria Pollutants Particulate Matter Nitrogen Dioxide Ozone Carbon Monoxide Lead Sulfur Dioxide Air
Investigating the Environmental Costs of Deteriorating Road Conditions in South Africa
 Investigating the Environmental Costs of Deteriorating Road Conditions in South Africa L Mashoko, W L Bean*, W JvdM STEYN* CSIR, Built Environment, P O Box 395, Pretoria, 0001 Tel: 012 841-4466; Email:
Monterey Bay Unified Air Pollution Control District (
 3.3.8 Air Quality Introduction The Air Quality section addresses the impacts of the project on ambient air quality and the exposure of people, especially sensitive individuals, to hazardous pollutant concentrations.
METHOD FOR INVENTORYING CO EMISSIONS FROM ROAD TRAFFIC IN URBAN AREAS THROUGH TRANSPORT MODELING
 Environmental Engineering and Management Journal August 2014, Vol.13, No. 8, 1945-1956 http://omicron.ch.tuiasi.ro/eemj/ Gheorghe Asachi Technical University of Iasi, Romania METHOD FOR INVENTORYING CO
Lower Bounds for the Two-Echelon Vehicle Routing Problem
 Lower Bounds for the Two-Echelon Vehicle Routing Problem Teodor Gabriel Crainic Simona Mancini Guido Perboli Roberto Tadei Département de management et technologie, Ecole des sciences de la gestion and
Baseline concentration and raw gas composition. Relevance for Shale Gas operations.
 Baseline concentration and raw gas composition. Relevance for Shale Gas operations. TransAtlantic Knowledge Sharing on Unconventional Hydrocarbons: Resources, Risks, Impact and Research Needs Paula Costa
Fuels. N4 & N5 Homework Questions
 St Peter the Apostle High school Chemistry Department Fuels N4 & N5 Homework Questions Answer questions as directed by your teacher. National 4 level questions are first followed by National 5 level questions.
Identify three common gaseous pollutants in air and state how each of these pollutants are produced.
 1 Clean dry air contains mainly nitrogen and oxygen. (a) Name two other gases that are in clean dry air.. [2] (b) Air often contains pollutants. Identify three common gaseous pollutants in air and state
Microeconomics: Principles, Applications, and Tools
 Microeconomics: Principles, Applications, and Tools NINTH EDITION Chapter 16 External Costs and Environmental Policy Learning Objectives 16.1 Use the marginal principle to describe the optimum level of
Vehicle emission model of air pollutants from road traffic. Application to Catalonia (Spain) for 1994
 for 1994") Air Pollution VIII (Ed. Longhurst, Brebbia and Power. pp. 379-388. WIT PRESS. 2000. ISBN : 1-85312-822-8 Vehicle emission model of air pollutants from road traffic. Application to Catalonia (Spain) for
Air Pollution VIII (Ed. Longhurst, Brebbia and Power. pp. 379-388. WIT PRESS. 2000. ISBN : 1-85312-822-8 Vehicle emission model of air pollutants from road traffic. Application to Catalonia (Spain) for
Criteria Pollutants. Sulfur Dioxide (SO 2 ) Nitrogen Oxides (NOx)
 Nitrogen Oxides (NOx)") 1) Sulfur dioxide 2) Nitrogen oxides 3) Carbon monoxide 4) Ozone 5) Particulates 6) Lead Criteria Pollutants Sulfur Dioxide (SO 2 ) SO 2 is a colorless gas that is formed from the combustion of sulfur-containing
1) Sulfur dioxide 2) Nitrogen oxides 3) Carbon monoxide 4) Ozone 5) Particulates 6) Lead Criteria Pollutants Sulfur Dioxide (SO 2 ) SO 2 is a colorless gas that is formed from the combustion of sulfur-containing
Green Bond Program Sustainable Development Contribution of the Société de transport de Montréal
 Green Bond Program Sustainable Development Contribution of the Société de transport de Montréal February 24, 2017 Green Bond Program The Government of Quebec proceeded, on February 24, 2017, to the first
PDX Air Quality Overview David Breen Air Quality Program Manager. January 16, 2013
 PDX Air Quality Overview David Breen Air Quality Program Manager January 16, 2013 PDX Air Quality Overview What is the status of the airshed? How do we contribute to it? Are we constrained by it? What
Santa Barbara County Air Pollution Control District. (Contact: Vijaya Jammalamadaka, )
") To: From: Santa Barbara County Planning Commission Santa Barbara County Air Pollution Control District Date: (Contact: Vijaya Jammalamadaka, 961-8893) Subject: Air Quality Impacts of Drive-through Facilities
To: From: Santa Barbara County Planning Commission Santa Barbara County Air Pollution Control District Date: (Contact: Vijaya Jammalamadaka, 961-8893) Subject: Air Quality Impacts of Drive-through Facilities
Sulfur oxides (SO x ) - particularly sulfur dioxide, a chemical compound with the formula SO 2. SO 2 is produced by volcanoes and in various
 - particularly sulfur dioxide, a chemical compound with the formula SO 2. SO 2 is produced by volcanoes and in various") AIR CANCER Sulfur oxides (SO x ) - particularly sulfur dioxide, a chemical compound with the formula SO 2. SO 2 is produced by volcanoes and in various industrial processes. Coal and petroleum often
AIR CANCER Sulfur oxides (SO x ) - particularly sulfur dioxide, a chemical compound with the formula SO 2. SO 2 is produced by volcanoes and in various industrial processes. Coal and petroleum often
Case Study: Pollution in Los Angeles L.A. COURIER
 3.2 Read Case Study: Pollution in Los Angeles L.A. COURIER Los Angeles, California May 1, 2008 The Most Polluted City in America Los Angeles under a heavy layer of smog. Once again, Los Angeles has topped
Calculating Mode Shift and Congestion Relief-Related Greenhouse Gas Displacement For the Current Year (see last slide for contact information)
") Calculating Mode Shift and Congestion Relief-Related Greenhouse Gas Displacement For the Current Year (see last slide for contact information) 1 Step 1: Estimate Reductions in Annual Auto Vehicles Miles
Calculating Mode Shift and Congestion Relief-Related Greenhouse Gas Displacement For the Current Year (see last slide for contact information) 1 Step 1: Estimate Reductions in Annual Auto Vehicles Miles
AIR QUALITY AND CLIMATE CHANGE EVALUATION GUIDANCE
 AIR QUALITY AND CLIMATE CHANGE EVALUATION GUIDANCE The following guidance provides additional details regarding the process followed by PSRC to evaluate projects for potential air quality benefits. As
The Effect of a green wave on traffic emissions
 Martijn Kiers; Chris Visser The Effect of a green wave on traffic emissions 116 Energy, Environment & Transportation Abstract The demand for transport is closely linked with economic development. It is
Step by Step Instructions for the Using Sustainable Jersey Spreadsheet Tool to Calculate a Municipal Carbon Footprint
 Step by Step Instructions for the Using Sustainable Jersey Spreadsheet Tool to Calculate a Municipal Carbon Footprint Inventory methods that municipalities can use to calculate their municipal carbon footprint
Clean Air. for. Kaliningrad
 Clean Air for Kaliningrad Clean Air for Kaliningrad The urban air pollution induced by traffic in Kaliningrad is raising increasing concern. KALAIR is a LIFE-Third Countries Project, co-funded by the European
FOSSIL FUEL COMBUSTION:
 Science 30 Unit B Chemistry and the Environment Outcome 1: Students will analyze the sources of acids and bases and their effects on the environment. Specific Outcome 1.8: Outline the chemical reactions
AMOUNT OF TOXIC EXHAUST GASES EMITTED DURING ENGINE WARM UP
 AMOUNT OF TOXIC EXHAUST GASES EMITTED DURING ENGINE WARM UP Aivars Birkavs, Ilmars Dukulis Latvia University of Agriculture aivars.birkavs@llu.lv, ilmars.dukulis@llu.lv Abstract. Almost everyone of us
POLLUTION FROM MOTOR VEHICLES
 POLLUTION FROM MOTOR VEHICLES Urgency of development of environment-friendly, cleaner system for road transport: A. Introduction: Pollution from motor vehicle is the single largest source of air pollution
Thermodynamics: An Engineering Approach, 6 th Edition Yunus A. Cengel, Michael A. Boles McGraw-Hill, 2008
 Thermodynamics: An Engineering Approach, 6 th Edition Yunus A. Cengel, Michael A. Boles McGraw-Hill, 2008 Chapter 2 ENERGY, ENERGY TRANSFER, AND GENERAL ENERGY ANALYSIS SUMMARY DR. MUNZER EBAID Dr. Munzer
STOCHASTIC ANALYSIS FOR VEHICULAR EMISSIONS ON URBAN ROADS- A CASE STUDY OF CHENNAI
 Harikrishna, M., Arun C. Stochastic Analysis For Vehicular Emissions On Urban Roads- A Case Study Of Chennai in Martin J. Bunch, V. Madha Suresh and T. Vasantha Kumaran, eds., Proceedings of the Third
Transport and the Environment
 Partnership for Clean Fuels and Vehicles Transport and the Environment Glynda Bathan Policy and Partnership Manager Clean Air Initiative for Asian Cities Center UNEP-TNT Fleet Management Toolkit Launch
Modelling Traffic Assignment Objectives with Emission Cost Functions
 Australasian Transport Research Forum 2017 Proceedings 27 29 November 2017, Auckland, New Zealand Publication website: http://www.atrf.info Modelling Traffic Assignment Objectives with Emission Cost Functions
Air pollution is caused by high concentrations of gases and particles emitted form combustion sources (vehicles, power plants, industries)
") AIR POLLUTION Clean Air Act & Criteria Pollutants 7.1-7.5 Motor Vehicle Emissions: 7.8 Indoor Air and Box Models: 7.12 Air Pollution Meteorology: 7.10 Gaussian Plume Modeling: 7.11 1 Air pollution is caused
AIR POLLUTION Clean Air Act & Criteria Pollutants 7.1-7.5 Motor Vehicle Emissions: 7.8 Indoor Air and Box Models: 7.12 Air Pollution Meteorology: 7.10 Gaussian Plume Modeling: 7.11 1 Air pollution is caused
A. INTRODUCTION B. POLLUTANTS FOR ANALYSIS
 Chapter 2, Section F: Air Quality A. INTRODUCTION This section examines the potential for air quality impacts due to the proposed operational and geometric changes in traffic conditions along Fulton Street
time and distance data at the individual vehicle level. The valuable traffic data can be used for effective freeway control and management. For the to
 A Marginal-cost Pricing Model for Transportation Networks with Multiple-class Users An Application to the Toll Ceiling Problem Shou-Ren HU a, Hui Pei HUANG b a Department of Transportation and Communication
ENERGY USE IN TRANSPORTATION SECTOR & POLLUTION IMPLICATION IN THE MALAYSIAN ECONOMY
 ENERGY USE IN TRANSPORTATION SECTOR & POLLUTION IMPLICATION IN THE MALAYSIAN ECONOMY Al-Amin, Chamhuri Siwar 2, Abdul Hamid 3 & Elias Hossain 4 Abstract The rapid expansion of transportation sector in
MODULE I. Learning Objectives
 MODULE I Learning Objectives To make the students aware of history of air pollution; definition of air pollution and various types of sources and classification of air pollutants. Lecture 1 Lecture 2 Lecture
Transportation emissions in Lebanon: Extent and mitigation
 Transportation emissions in Lebanon: Extent and mitigation M. El-Fadel (1), E. Bou-Zeid (2) (1) Department of Civil & Environmental Engineering, American University of Beirut, 850 Third Avenue, New York,
YORK TOLL PLAZA MAINE TURNPIKE AUTHORITY AIR QUALITY REPORT. September 28, 2016 NOISE ANALYSIS REPORT MAINETURNPIKE AUTHORI TY
 NOISE ANALYSIS REPORT MAINETURNPIKE AUTHORI TY YORK TOLL PLAZA MAINE TURNPIKE AUTHORITY AIR QUALITY REPORT September 28, 2016 (Cover photograph provided by MTA) TABLE OF CONTENTS 1.0 EXECUTIVE SUMMARY...
PARETO-IMPROVING CONGESTION PRICING AND REVENUE REFUNDING WITH ELASTIC DEMAND
 PARETO-IMPROVING CONGESTION PRICING AND REVENUE REFUNDING WITH ELASTIC DEMAND Xiaolei Guo, Odette School of Business Cross-Border Transportation Centre University of Windsor Hai Yang, Department of Civil
THE AIR QUALITY CHALLENGE IN CHINA and ASIA
 TECHNICAL PAPER THE AIR QUALITY CHALLENGE IN CHINA and ASIA SUMMARY Global Warming as measured by increasing carbon dioxide levels is a major issue in China, and current air quality levels due to Particulates
Air quality in the vicinity of a governmental school in Kuwait
 Air Pollution XVI 237 Air quality in the vicinity of a governmental school in Kuwait E. Al-Bassam 1, V. Popov 2 & A. Khan 1 1 Environment and Urban Development Division, Kuwait Institute for Scientific
Table TSD-A.1 Source categories included under Section 202 Section 202 Source IPCC Sector IPCC Source Category Greenhouse Gases
 Technical Support Document Section 202 Greenhouse Gas Emissions Roadmap to Annex This Annex describes greenhouse gas emissions information from Section 202 source categories. The Annex provides an overview
Fuzzy Logic for Design of Air Quality Analyser
 uzzy Logic for Design of Air Quality Analyser uzzy Logic for Design of Air Quality Analyser Manjeet Chemistry Department, BRCM CET, Bahal, M.D University, Rohtak, Haryana, India, E-mail: manjeetvijay@rediffmail.com.
WP 3: ELABORATING CO 2 STRATEGIES. Specification for the trip calculator for Public Transport
 WP 3: ELABORATING CO 2 STRATEGIES Specification for the trip calculator for Public Transport December 2012 Table of contents INTRODUCTION... 3 1. METHODOLOGY... 5 2. PREREQUISITES... 7 3. SPECIFICATIONS...
Word Count: 3792 words + 4 figure(s) + 4 table(s) = 5792 words
 + 4 table(s) = 5792 words") THE INTERPLAY BETWEEN FLEET SIZE, LEVEL-OF-SERVICE AND EMPTY VEHICLE REPOSITIONING STRATEGIES IN LARGE-SCALE, SHARED-RIDE AUTONOMOUS TAXI MOBILITY-ON-DEMAND SCENARIOS Shirley Zhu Department of Operations
THE INTERPLAY BETWEEN FLEET SIZE, LEVEL-OF-SERVICE AND EMPTY VEHICLE REPOSITIONING STRATEGIES IN LARGE-SCALE, SHARED-RIDE AUTONOMOUS TAXI MOBILITY-ON-DEMAND SCENARIOS Shirley Zhu Department of Operations
10. Air Pollution. Air pollution. policy issue indicator assessment. - - urban air quality exceedances for particulates
 Air pollution 73 1. Air Pollution policy issue indicator assessment human health: protecting the population against pollution exposures urban air quality exceedances for ground-level ozone - - urban air
Study and Design on Small Scale Biomass Gasification for Electricity Generation (Dual Fuel)
") Study and Design on Small Scale Biomass Gasification for Electricity Generation (Dual Fuel) Prepared by: Assoc. Prof. Sengratry Kythavone Prof. Dr. Khamphone Nanthavong Mr. Vongsavanh Chanhthaboune. Outline
Study and Design on Small Scale Biomass Gasification for Electricity Generation (Dual Fuel) Prepared by: Assoc. Prof. Sengratry Kythavone Prof. Dr. Khamphone Nanthavong Mr. Vongsavanh Chanhthaboune. Outline
CE 213A Introduction to Environmental Science
 CE 213A Introduction to Environmental Science Module D Air Pollution Dr. Anubha Goel FB 308, anubha@iitk.ac.in, x 7027 Nazaroff, Ch. 7 Air Pollution 2 Key Concepts Structure and composition of the atmosphere
Module BASIC DEFINITIONS 1.2. COMPONENTS OF A SYSTEM: CE -751, SLD, Class Notes, Fall 2006, IIT Bombay
 Module 1 1.1. BASIC DEFINITIONS Goals: Goal is defined as the end to which a plan tends. Goals may be thought of as a set of statements that attempt to convey to the planner an image of the ideal system
ABSTRACT. Timetable, Urban bus network, Stochastic demand, Variable demand, Simulation ISSN:
 International Journal of Industrial Engineering & Production Research (09) pp. 83-91 December 09, Volume, Number 3 International Journal of Industrial Engineering & Production Research ISSN: 08-4889 Journal
The Methodology of Chemical Pollutants Approximation Model
 The Methodology of Chemical Pollutants Approximation Model STELIAN TARULESCU, CORNELIU COFARU Department of Mechanical Engineering Transilvania University of Brasov Eroilor Boulevard, No 29, Brasov ROMANIA
PARK CITY MUNICIPAL CORPORATION 1990 & 2007 CARBON INVENTORY BASELINE ASSESSMENT
 EXECUTIVE SUMMARY C6 PARK CITY MUNICIPAL CORPORATION 1990 & 2007 CARBON INVENTORY BASELINE ASSESSMENT Executive Summary Park City Municipal Corporation 1990 & 2007 Carbon Inventory Baseline Assessment*
The Challenges of Clean Air - Local, Regional & Global A Possible Solution
 The Challenges of Clean Air - Local, Regional & Global A Possible Solution ISATA Congress Dublin, Ireland - September Outline Summarize Progress To Date Highlight Remaining Problems Forecast Future Trends
The Greenhouse Gases, Regulated Emissions, and Energy Use in Transportation (GREET) Model Version 1.5
 Model Version 1.5") 1. Introduction The Greenhouse Gases, Regulated Emissions, and Energy Use in Transportation (GREET) Model Version 1.5 Michael Wang Center for Transportation Research Argonne National Laboratory August
1. Introduction The Greenhouse Gases, Regulated Emissions, and Energy Use in Transportation (GREET) Model Version 1.5 Michael Wang Center for Transportation Research Argonne National Laboratory August
On the environmental safety of automobile vehicles
 Submitted by the representative of the Russian Federation Informal document WP.29-161-22 (161 th WP.29 session, 11 14 November 2013, agenda item 20) On the environmental safety of automobile vehicles Automobile
A System Dynamics Model of Mobility Vouchers for Implementing Urban Road Pricing Davide FIORELLO, Francesca FERMI, Angelo MARTINO
 Davide FIORELLO, Francesca FERMI, Angelo MARTINO (Davide FIORELLO, TRT Trasporti e Territorio srl, via Rutilia 10/8, Milano, Fiorello@trttrasportieterritorio.it) (Francesca FERMI, TRT Trasporti e Territorio
PRODUCTS OF COMBUSTION
 PRODUCTS OF COMBUSTION Some of the fuel (hydrocarbon) may not completely burn during combustion and therefore is released into the atmosphere along with the products. The products that are formed during
SCHOOL OF BUSINESS, ECONOMICS AND MANAGEMENT. BF360 Operations Research
 SCHOOL OF BUSINESS, ECONOMICS AND MANAGEMENT Unit 4 Distribution and Network Models Moses Mwale e-mail: moses.mwale@ictar.ac.zm Contents Unit 4. Distribution and Network Models 3 4.1.0 The Transportation
Network Flows. 7. Multicommodity Flows Problems. Fall 2010 Instructor: Dr. Masoud Yaghini
 In the name of God Network Flows 7. Multicommodity Flows Problems 7.1 Introduction Fall 2010 Instructor: Dr. Masoud Yaghini Introduction Introduction In many application contexts, several physical commodities,
Impact of Transpotation Activities on the Ambient Air Quality along the Mm University Road Network: A Case Study
 IOSR Journal of Environmental Science, Toxicology and Food Technology (IOSR-JESTFT) e-issn: 2319-2402,p- ISSN: 2319-2399.Volume 9, Issue 12 Ver. III (Dec. 2015), PP 66-70 www.iosrjournals.org Impact of
CSCI 3210: Computational Game Theory. Inefficiency of Equilibria & Routing Games Ref: Ch 17, 18 [AGT]
![CSCI 3210: Computational Game Theory. Inefficiency of Equilibria & Routing Games Ref: Ch 17, 18 [AGT]](/thumbs/75/72896477.jpg "CSCI 3210: Computational Game Theory. Inefficiency of Equilibria & Routing Games Ref: Ch 17, 18 [AGT]") CSCI 3210: Computational Game Theory Inefficiency of Equilibria & Routing Games Ref: Ch 17, 18 [AGT] Mohammad T. Irfan Email: mirfan@bowdoin.edu Web: www.bowdoin.edu/~mirfan Split or steal game u NE outcome
CSCI 3210: Computational Game Theory Inefficiency of Equilibria & Routing Games Ref: Ch 17, 18 [AGT] Mohammad T. Irfan Email: mirfan@bowdoin.edu Web: www.bowdoin.edu/~mirfan Split or steal game u NE outcome
CHAPTER 11. Air Quality and the Transportation Plan
 Chapter 11. Air Quality and the Transportation Plan 159 CHAPTER 11. Air Quality and the Transportation Plan Background Air quality in Anchorage is subject to national ambient air quality standards established
1. INTRODUCTION AND BACKGROUND
 1. INTRODUCTION AND BACKGROUND Transportation planning has focused on moving people efficiently and safely. Freight demand modeling and assignment have received limited attention with little or no integration
Author's Personal Copy. DO NOT Distribute or Reproduce
 This article was originally published in a journal published by Elsevier, and the attached copy is provided by Elsevier for the author s benefit and for the benefit of the author s institution, for non-commercial
FHWA COST EFFECTIVENESS TABLES SUMMARY
 FHWA COST EFFECTIVENESS TABLES SUMMARY FHWA COST EFFECTIVENESS TABLES Summary... 1 Background And Summary Finding... 1 Introduction... 1 MAP-21... 2 Key Analytical Assumptions and Limitations... 2 Development
~9~ Memorandum CITY OF DALLAS. DFW Air Quality and State Implementation Plan Update
 Memorandum DATE June 20, 2014 CITY OF DALLAS TO Honorable Members of the Quality of Life & Environment Committee: Dwaine R. Caraway (Chair), Sandy Greyson (Vice Chair), Rick Callahan, Carolyn R. Davis,
3. LOCAL CALAMITIES EVER INCREASING
 1 3. LOCAL CALAMITIES EVER INCREASING Man causes Pollutions How many hands do the six types of pollutions? Land 14 Billion (7 billion x 2 ) What is the world Population? Space Water 7 Billion Food Humans
Executive Summary. Table 1: National emission ceilings for Italy. COV (kton/y) NOx (kton/y)
 NOx (kton/y)") NATIONAL PROGRAMME FOR THE PROGRESSIVE REDUCTION OF ANNUAL NATIONAL EMISSIONS OF SULPHUR DIOXIDE, NITROGEN OXIDES, VOLATILE ORGANIC COMPOUNDS AND AMMONIA December 2006 Executive Summary Summary of implemented
NATIONAL PROGRAMME FOR THE PROGRESSIVE REDUCTION OF ANNUAL NATIONAL EMISSIONS OF SULPHUR DIOXIDE, NITROGEN OXIDES, VOLATILE ORGANIC COMPOUNDS AND AMMONIA December 2006 Executive Summary Summary of implemented
OUR 2011 CARBON FOOTPRINT
 OUR 2011 CARBON FOOTPRINT OUR VALUE CHAIN FOOTPRINT We will reduce the carbon footprint of the drink in your hand by a third by delivering carbon reductions throughout our entire value chain We set this
LONDON ATMOSPHERIC EMISSIONS INVENTORY
 LONDON ATMOSPHERIC EMISSIONS INVENTORY Julius Mattai and David Hutchinson, Greater London Authority (julius.mattai@london.gov.uk and david.hutchinson@london.gov.uk) INTRODUCTION The London Atmospheric
GE 2211 Environmental Science and Engineering Unit III Air Pollution. M. Subramanian
 GE 2211 Environmental Science and Engineering Unit III Air Pollution M. Subramanian Assistant Professor Department of Chemical Engineering Sri Sivasubramaniya Nadar College of Engineering Kalavakkam 603
A. INTRODUCTION AND METHODOLOGY
 Chapter 10: Air Quality A. INTRODUCTION AND METHODOLOGY The different alternatives being evaluated as part of the Manhattan East Side Transit Alternatives Study have the potential to result in air quality
4-9 Chemistry/5-9 Trilogy Chemistry of the atmosphere
 4-9 Chemistry/5-9 Trilogy Chemistry of the atmosphere.0 This question is about fuels.. There are two main types of diesel fuel used for cars: biodiesel, made from vegetable oils petroleum diesel, made
Economic and Environmental Implications of Online Retailing in the United States
 1 Economic and Environmental Implications of Online Retailing in the United States H. Scott Matthews 1 and Chris T. Hendrickson 2 Abstract The advent of the Internet and e-commerce has brought a new way
AIR QUALITY IN PASSENGER CARS OF THE GROUND RAILWAY TRANSIT SYSTEM IN BEIJING, CHINA
 AIR QUALITY IN PASSENGER CARS OF THE GROUND RAILWAY TRANSIT SYSTEM IN BEIJING, CHINA TT Li, JF Liu, GS Zhang, ZR Liu and YH Bai College of Environmental Science, Peking University, Beijing, 100871, China
SIMULATION AND OPTIMIZATION OF URBAN TRAFFIC FLOW, BY THE USE OF PROGRAMS SYNCHRO AND SIMMTRAFFIC
 TECHNICAL UNIVERSITY OF CLUJ-NAPOCA ACTA TECHNICA NAPOCENSIS Series: Applied Mathematics and Mechanics 50, Vol. IV, 2007 INTERNATIONAL CONGRESS AUTOMOTIVE, ENVIRONMENT AND FARM MACHINERY AMMA 2007 11-13
3D Simulation of a fire inside a river tunnel and optimisation of the ventilation using Computational Fluid Dynamics
 3D Simulation of a fire inside a river tunnel and optimisation of the ventilation using Computational Fluid Dynamics Authors: B. TRUCHOT, A. TRIPATHI Fluidyn-France Abstract CFD simulation is used to predict
Pricing local emission exposure of road traffic An agent-based approach
 Pricing local emission exposure of road traffic An agent-based approach Benjamin Kickhöfer TU Berlin mobil.tum 2014 Motivation Page 2 Related to Popuation / Activity Location Density Costs Related to Exhaust
A GIS-BASED DECISION SUPPORT SYSTEM FOR PLANNING URBAN TRANSPORTATION POLICIES. G. Arampatzis*, C.T. Kiranoudis*, P.Scaloubacas**, D.
 A GIS-BASED DECISION SUPPORT SYSTEM FOR PLANNING URBAN TRANSPORTATION POLICIES G. Arampatzis*, C.T. Kiranoudis*, P.Scaloubacas**, D. Assimacopoulos* * Depatment of Chemical Engineering, National Technical
Appendix D: Carbon Model
 Appendix D: Carbon Model Carbon Model Dave Erickson, Climate Protection Campaign, September 2009 The Carbon Model is a mathematical representation of all of the significant sources of direct and indirect
TRANSPHORM. Transport related Air Pollution and Health impacts. Integrated Methodologies for Assessing Particulate Matter
 TRANSPHORM Transport related Air Pollution and Health impacts Integrated Methodologies for Assessing Particulate Matter Collaborative project, Large-scale Integrating Project SEVENTH FRAMEWORK PROGRAMME
Study of microscale urban air dispersion by ADMS - Urban
 Study of microscale urban air dispersion by ADMS - Urban Jason P.L. Huang Atmospheric, Marine and Coastal Environment Program (AMCE), The Hong Kong University of Science & Technology Jimmy C.H. Fung Department
Comprehensive Greenhouse Gases Inventory for the State of Ohio
 Comprehensive Greenhouse Gases Inventory for the State of Ohio Extended Abstract # 13009 Saikat Ghosh, Myoungwoo Kim, Kevin Crist Center for Air Quality, 171 Stocker Centre, Russ College of Engineering
Competition Effects and Transfers in Rail Rapid Transit Network Design
 Competition Effects and Transfers in Rail Rapid Transit Network Design Ángel Marín y Luís Cadarso Acknowledgements: Research supported by project grant TRA2011-27791-C3-01 and TRA2014-52530-C3-1-P by "Ministerio
APPENDIX E EMISSIONS ESTIMATE FOR GENERAL CONFORMITY
 APPENDIX E EMISSIONS ESTIMATE FOR GENERAL CONFORMITY Environmental and Planning Consultants 440 Park Avenue South, 7th Floor New York, New York 10016 tel: 212-696-0670 fax: 212-213-3191 www.akrf.com Memorandum