New River Estuary Water Quality UNCW-CMS Report 10-02
|
|
|
- Sybil Regina Henderson
- 6 years ago
- Views:
Transcription

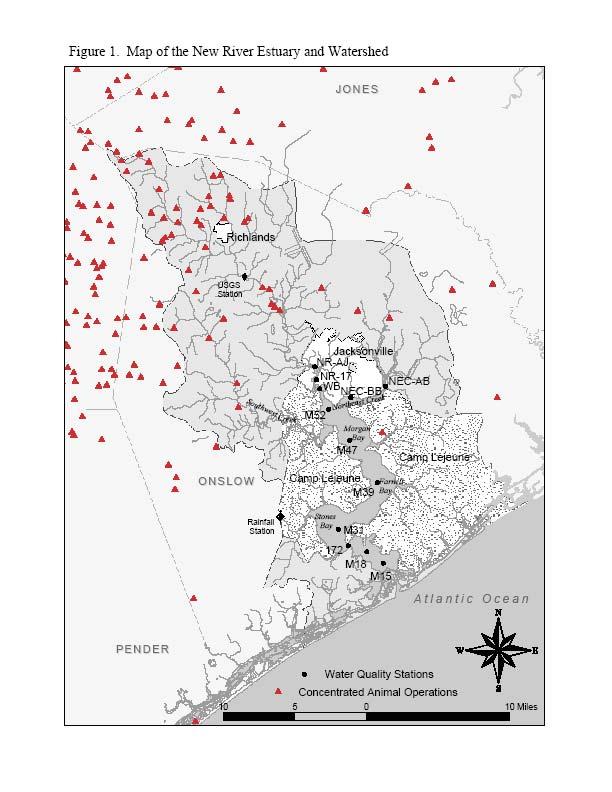
1 New River Estuary Water Quality UNCW-CMS Report Report to: Environmental Management Division, US Marine Corps, Camp Lejeune, N.C. By: Dr. Michael A. Mallin and Matthew R. McIver Center for Marine Science, University of North Carolina Wilmington Wilmington, N.C March 30, 2010 Executive Summary For several years the U.S. Marine Corps at Camp Lejeune has sponsored research efforts by the University of North Carolina Wilmington Center for Marine Science to investigate the water quality in the New River Estuary, North Carolina. Water sampling was conducted at 13 locations during stretching from the upper estuary above Jacksonville and upper Northeast Creek down to Channel Marker 15 near the Atlantic Intracoastal Waterway. The data indicate that the estuary remains greatly improved since before the USMC and the City of Jacksonville initiated improved wastewater treatment in the late 1990 s. However, we note that pulses of nitrate enter the estuary from the New River upstream of Jacksonville, and to a lesser extent from drainages feeding Northeast Creek. These nitrate pulses lead to algal blooms that exceed the North Carolina water quality standard in some of the upper estuary locations. The upper estuary is stratified by salinity differences, which reduces water column mixing. The algal blooms die and become labile organic matter and exert a biochemical oxygen demand (BOD), which contributes to bottom water low dissolved oxygen concentrations (sometimes severe). Thus, while water quality conditions have improved, efforts to control non-point source inputs of nutrients into the river and tributary creeks need to be continued and enhanced. Heterocapsa triquetra, a common dinoflagellate that blooms in the New River Estuary 1
2 Introduction The University of North Carolina Wilmington has conducted water quality sampling on the New River Estuary since Funding for this effort has come from a variety of sources, including the Water Resources Research Institute of the University of North Carolina, North Carolina State University, and for the past several years, the United State Marine Corps base at Camp Lejeune. This research has produced published scientific contributions that have combined both basic research and applied research, providing key information on topics such as diverse as the impact of large animal waste spills on rivers and estuaries (Burkholder et al. 1997) to the nutrient chemistry and impact of nutrient loading (Mallin et al. 1997; Dafner et al. 2007) to physical flushing and nitrogen processing in the estuary (Ensign et al. 2004) to the (positive) impact of sewage treatment upgrades to estuarine water quality (Mallin et al. 2005). The most important occurrence in recent years regarding the New River Estuary has been the strong action taken by the US Marine Corps and the City of Jacksonville to upgrade their sewage treatment plants during the period Immediate results of these actions included decreased ammonium and phosphate inputs to the estuary, large decreases in the size and persistence of the formerly frequent algal blooms, reductions in turbidity and increases in light penetration, and increases in bottom-water dissolved oxygen (Mallin et al. 2005). We also note that both the City and USMC have taken strong actions to reduce non-point source pollution that may enter the estuary from the base and the immediate urbanized areas. However, we note that the river can bring significant loads of nitrate downstream to the estuary, where it may encourage algal bloom formation. Thus, in USMC-sponsored UNCW sampling was expanded to include stations in Northeast Creek that are located both upstream and downstream of the highway bridge, as well as a station in the upper New River Estuary downtown near Highway 17, and a station at the border of the lower river/upper estuary which was designed to measure nutrient inputs coming into the estuary from upstream sources. Methods Samples were collected ten times during at the following twelve locations (see map Figure 1): 1) WB middle of Wilson Bay 2) M52 Channel Marker 52 3) M47 Channel Marker 47 4) M39 Channel Marker 39 5) M31 Channel Marker 31 6) 172 in channel near Highway 172 bridge 7) M18 Channel Marker 18 8) M15 Channel Marker 15 9) NR-17 - New River at Highway 17 bridge in Jacksonville 10) NR-AJ - New River above Jacksonville 11) NEC-AB - Northeast Creek at Highway 24 bridge 12) NEC-BB- Northeast Creek below Highway 24 bridge 2
3 Field parameters were measured at each site using a YSI 6920 Multi-parameter Water Quality Probe (sonde) linked to a YSI 610 display unit. Individual probes within the instrument measured water temperature, ph, dissolved oxygen, turbidity, salinity, and conductivity. Water samples were collected for nutrient analyses (ammonium, nitrate, orthophosphate) and were analyzed using U.S. EPA protocols. For chlorophyll a analysis triplicate water samples were filtered simultaneously through 25 mm Millipore AP40 glass fiber filters (nominal pore size 1.0 micrometer) using a manifold with three funnels. The chlorophyll a was extracted and subsequently analyzed using a Turner AU-10 fluorometer, following the method described in Welschmeyer (1994). Results and Discussion Salinity: Salinity patterns in the New River Estuary show lowest values on average in the lower river/upper estuary stations, ranging from about 3 ppt at NRAJ to about 12 ppt at M52 (Figure 2). Much of the upper and middle estuary averages mesohaline salinities (5 15 ppt), while the stations downstream of the Highway 172 bridge are at near-marine salinities (Figure 2). The estuary is only slowly flushed (Ensign et al. 2004) and thus experiences significant salinity stratification most of the way down the estuary. This occurs when fresher water (which is lighter) flows over saltier water, as is shown in Figure 2. Such stratification has water quality impacts because the stratification reduces mixing or dissolved oxygen into lower levels of the water column. Dissolved oxygen: Average surface dissolved oxygen (DO) concentrations in all areas of the estuary were well above the North Carolina standard of 5 mg/l (Figure 3). Surface water dissolved oxygen fell below the standard 30% of the times sampled at NRAJ and 20% of the time at NECAB. However, bottom water DO concentrations were usually considerably lower than surface water DO concentrations (Figure 3). This disparity between surface and bottom DO was exacerbated by the salinity stratification and slow flushing (Ensign et al. 2004) in the system. Bottom water DO fell below the state standard on 80% of occasions sampled at NRAJ and NR17, 50% of occasions sampled at Wilson Bay (WB) and NECAB, and 40% of the time at M52 and M39. This at times was at particularly stressful levels (for fish and invertebrates) especially when DO fell below 2.0 mg/l. Bottom water DO at WB was not found at particularly stressful levels, possibly due to mechanical aerators placed in that bay. Low DO often results from decomposition of algal blooms into labile organic matter, exerting a BOD (Mallin et al. 2006) and from direct inputs of BOD materials from point or non-point sources. In a system such as the New River Estuary, with low river discharge and low gravitational mixing, DO stratification can be severe when fueled by BOD (Lin et al. 2006). Low bottom water DO thus remains problematic at some sites in the upper estuary, although it has improved in general from pre-sewage upgrade days (Mallin et al. 2005). Turbidity: Average turbidity concentrations remained well below the North Carolina standard of 25 NTU (nephelometric turbidity units) at all stations (Figure 4). In fact, on no sampling occasion were turbidity values seen in excess of this standard in Light attenuation: Light attenuation is a measure of how much solar irradiance is decreased as it passes vertically through the water column. Attenuation of solar irradiance can be caused by 3
4 reflection from particulate matter, absorbance by water color, and absorbance by photosynthetic algae. Higher values reflect more attenuation. As a general guide, values greater than 3/m may constrain light availability to phytoplankton. Within the New River Estuary, light is plentiful at almost all stations for algal useage (Figure 5). Light attenuation improved greatly following the sewage upgrades (Mallin et al. 2005). Ammonium: Ammonium is a reduced inorganic form of nitrogen that is commonly seen in sewage treatment plant discharges, among other sources. Average ammonium concentrations in the estuary were highest at NRAJ, followed by NR17, with another peak at M18 in the lower estuary (Figure 6); however, on no sampling occasion were concentrations of ammonium unusually high in terms of provoking algal blooms or fish kills. Ammonium concentrations in general remained well below concentrations commonly found before the sewage treatment plants were upgraded. Nitrate: Nitrate as presented here includes nitrite, which usually is only a small fraction of the combined total. Nitrate concentrations were highest at NRAJ, followed in turn by NR17 and JAX (Figure 7). On occasion (mainly during winter and spring often called the spring freshet in estuaries) nitrate concentrations were high, well in excess of 500 µg-n/l. The maximum concentration experienced was 1,174 µg/l, at NRAJ in January Average nitrate concentrations from M52 downstream, including Northeast Creek (Figure 7) were generally low. Thus, the main source of nitrate entering the New River Estuary in was the New River, and sources in its watershed upstream of Jacksonville. There appears to be a second inflow source of nitrate (as well as ammonium) in upper Northeast Creek (Figure 7). We conclude that the local non-point source control efforts by the Corps and the City appear to be generally effective in reduction of local stormwater-driven nutrient loading, although the drainage into Northeast Creek may need more attention. Orthophosphate: Orthophosphate is the principal inorganic form of phosphorus in aquatic systems. Orthophosphate concentrations have considerably decreased since before the sewage plant upgrades. The areas presently yielding the highest orthophosphate concentrations include NR17 (downtown Jacksonville), the upper estuary above Jacksonville (NRAJ) and upper Northeast Creek (Figure 8). Orthophosphate concentrations can be described overall as moderate to low in this system. Chlorophyll a: Chlorophyll a is a water quality parameter that is an integrative measure of several variables, especially nitrogen loading but also light availability and flushing rate. Average chlorophyll concentrations at all locations were below the North Carolina standard of 40 µg/l (Figure 9). However, algal blooms in were far more abundant than during 2007, and average chlorophyll a was higher in than in 2007 (Figure 9; see also Mallin et al. 2009). Algal biomass was greatest in the upper estuary as well as in Northeast Creek. Chlorophyll a concentrations exceeded the NC standard 50% of times sampled at Wilson Bay, 40% of times sampled at NRAJ and NECAB, and 20% at NR17 and M52. Bioassays conducted by our laboratory and published in the scientific literature (Mallin et al. 1997; Mallin et al. 2005) showed that nitrogen is the principal nutrient controlling phytoplankton growth in the New River Estuary. Thus, we conclude that pulses of stormwater-driven nitrate entering the system are responsible for the algal blooms that still occur. 4
5 Conclusions Water quality in the New River Estuary in was considerably better than during the period before the sewage treatment plant upgrades. However, from 2007 to the period there was an increase in algal bloom activity in the upper estuary. The algal blooms mostly occur in the uppermost areas of the estuary from NRAJ upstream of Jacksonville through Wilson Bay, also in Northeast Creek. We also note that bottom-water hypoxia, sometimes severe, still occurs in some locations including NRAJ, NR17, NECAB and M52. While salinity stratification and the slow flushing rate contribute to the bottom-water hypoxia, the hypoxia is ultimately fueled by biochemical oxygen demand (BOD) resulting from algal blooms. The blooms that still occur appear to be the result of nitrate loading entering the estuary from the river, primarily from sources within the watershed upstream of Jacksonville, although drainage into Northeast Creek appears to be somewhat problematic as well. References cited Burkholder, J.M., M.A. Mallin, H.B. Glasgow, Jr., L.M. Larsen, M.R. McIver, G.C. Shank, N. Deamer-Melia, D.S. Briley, J. Springer, B.W. Touchette and E. K. Hannon Impacts to a coastal river and estuary from rupture of a swine waste holding lagoon. Journal of Environmental Quality 26: Dafner, E.V., M.A. Mallin, J.J. Souza, H.A. Wells and D.C. Parsons Nitrogen and phosphorus species in the coastal and shelf waters of southeastern North Carolina, Mid- Atlantic U.S. coast. Marine Chemistry. 103: Ensign, S.H., J.N. Halls and M.A. Mallin Application of digital bathymetry data in an analysis of flushing times of two North Carolina estuaries. Computers and Geosciences 30: Lin, J. L. Xie, L.J. Pietrafesa, J. Shen, M.A. Mallin and M.J. Durako Dissolved oxygen stratification in two microtidal partially-mixed estuaries. Estuarine, Coastal and Shelf Science. 70: Mallin, M.A., L.B. Cahoon, M.R. McIver, D.C. Parsons and G.C. Shank Nutrient limitation and eutrophication potential in the Cape Fear and New River Estuaries. Report No Water Resources Research Institute of the University of North Carolina, Raleigh, N.C. Mallin, M.A., M.R. McIver, H.A. Wells, D.C. Parsons and V.L. Johnson Reversal of eutrophication following sewage treatment upgrades in the New River Estuary, North Carolina. Estuaries 28: Mallin, M.A., V.L. Johnson, S.H. Ensign and T.A. MacPherson Factors contributing to hypoxia in rivers, lakes and streams. Limnology and Oceanography 51:
6 Mallin, M.A. and M.R. McIver New River Estuary Water Quality 2007, UNCW-CMS Report Report to: Environmental Management Division, US Marine Corps, Camp Lejeune, N.C. Center for Marine Sciences, University of North Carolina Wilmington, Wilmington, N.C. Welschmeyer, N.A Fluorometric analysis of chlorophyll a in the presence of chlorophyll b and phaeopigments. Limnology and Oceanography 39:
7 7
8 SALINITY Salinity (psu) NRAJ 1 NR17 2 WB 3 M52 4 NECAB 5 NECBB 6 M47 7 M39 8 M M18 11M15 12 Surface Bottom Figure 2. Average surface and bottom salinity, New River Estuary, DISSOLVED OXYGEN DO (mg/l) NC estuarine dissolved oxygen standard of 5.0 mg/l NRAJ NR17 WB M52 NECAB NECBB M47 M39 M M18 M Surface Bottom Figure 3. Average surface and bottom dissolved oxygen, New River Estuary,
9 TURBIDITY Turbidity (NTU) NRAJ 1 NR17 2 WB 3 M52 4 NECAB 5 NECBB 6 M47 7 M39 8 M M18 11M15 12 Surface Bottom Figure 4. Average surface and bottom turbidity, New River Estuary, LIGHT ATTENUATION K/m NRAJ 1 NR17 2 WB 3 M52 4 NECAB 5 NECBB 6 7M47 M39 8 9M M18 11 M15 12 Figure 5. Average light attenuation in the New River Estuary
10 AMMONIUM Ammonium (µg/l) NRAJ NR17 WB M52 NECAB NECBB M47 M39 M M18 M Figure 6. Average ammonium concentrations in the New River Estuary, NITRATE Nitrate-N (µg/l) NRAJ 1 NR17 2 WB 3 M52 4 NECAB 5 NECBB 6 M47 7 M39 8 M M18 11 M15 12 Figure 7. Average nitrate concentrations in the New River Estuary,
11 ORTHOPHOSPHATE 8 7 Orthophosphate-P (mg/l) NRAJ 1 NR17 2 WB 3 M52 4 NECAB 5 NECBB 6 M47 7 M39 8 M M18 11 M15 12 Figure 8. Average orthophosphate concentrations in the New River Estuary, CHLOROPHYLL a 30 Chlorophyll a (µg/l) NRAJ 1 NR17 2 WB 3 M52 4 NECAB 5 NECBB 6 M47 7 M39 8 M M18 11 M15 12 YEAR YEAR 2007 Figure 9. Average chlorophyll a concentrations in the New River Estuary, versus
Water Quality Assessment for the Town of Caswell Beach, 2008
 Water Quality Assessment for the Town of Caswell Beach, 2008 UNCW-CMS Report 08-02 Report to: Town of Caswell Beach 1100 Caswell Beach Rd. c/o Mr. Jim Carter, Town Administrator Caswell Beach, N.C. 28465
Chronic Stream Pollution in a CAFO Rich Watershed in Duplin County, NC
 Chronic Stream Pollution in a CAFO Rich Watershed in Duplin County, NC Michael A. Mallin, Matthew R. McIver, Amanda Kahn Dickens and Anna R. Robuck Center for Marine Sciences University of North Carolina
Environmental Assessment of the Lower Cape Fear River System, 2012
 Environmental Assessment of the Lower Cape Fear River System, 2012 By Michael A. Mallin, Matthew R. McIver and James F. Merritt October 2013 CMS Report No. 13-02 Center for Marine Science University of
Nutrients, Algal Blooms and Red Tides in Hong Kong Waters. Paul J. Harrison and Jie XU
 Nutrients, Algal Blooms and Red Tides in Hong Kong Waters Paul J. Harrison and Jie XU Division of Environment, Hong Kong University of Science & Technology 1. Introduction The Pearl River is China's second
Redwood Shores Lagoon November 2016 Monthly Water Quality Monitoring Report
 Redwood Shores Lagoon November 2016 Monthly Water Quality Monitoring Report Prepared for Redwood City Public Works Services Department 1400 Broadway Redwood City, CA 94063-2594 Prepared by Clean Lakes,
Redwood Shores Lagoon February 2019 Monthly Water Quality Monitoring Report
 Redwood Shores Lagoon February 2019 Monthly Water Quality Monitoring Report Prepared for Redwood City Public Works Services Department 1400 Broadway Redwood City, CA 94063-2594 Prepared by Clean Lakes,
Terrestrial Drivers of Coastal Plain Stream Water Quality in North Carolina
 Terrestrial Drivers of Coastal Plain Stream Water Quality in North Carolina Michael A. Mallin Center for Marine Science University of North Carolina Wilmington Wilmington, NC mallinm@uncw.edu As gathered
Redwood Shores Lagoon May 2017 Monthly Water Quality Monitoring Report
 Redwood Shores Lagoon May 2017 Monthly Water Quality Monitoring Report Prepared for Redwood City Public Works Services Department 1400 Broadway Redwood City, CA 94063-2594 Prepared by Clean Lakes, Inc.
Little Bay Water Quality Report Card Spring 2014
 Little Bay Water Quality Report Card Spring 2014 Little Bay is a small, semi-enclosed estuary located in the heart of Rockport, Texas. Estuaries, where freshwater from rivers and streams mixes with salt
Chemical and Physical Analysis of the Cape Fear Estuary
 The Cape Fear River Chemical and Physical Analysis of the Cape Fear Estuary The Cape Fear River (CFR), the most industrialized of all North Carolina s rivers, winds for over miles through the heart of
Effect of Turbidity on Dissolved Oxygen in the Lake Macatawa. Watershed
 Effect of Turbidity on Dissolved Oxygen in the Lake Macatawa Watershed Hope College GES 401 Research Project Group Members: Peter Van Heest, Rachel Burkhart, Wyatt Curry Advisor: Dr. G. Peaslee Introduction
Environmental Assessment of the Lower Cape Fear River System, 2012
 Environmental Assessment of the Lower Cape Fear River System, 2012 By Michael A. Mallin, Matthew R. McIver and James F. Merritt October 2013 CMS Report No. 13-02 Center for Marine Science University of
EUTROPHICATION. Student Lab Workbook
 EUTROPHICATION Student Lab Workbook THE SCIENTIFIC METHOD 1. Research Background literature research about a topic of interest 2. Identification of a problem Determine a problem (with regards to the topic)
Nitrogen Cycling, Primary Production, and Water Quality in the New River Estuary. Defense Coastal/Estuarine Research Program (DCERP)
") Nitrogen Cycling, Primary Production, and Water Quality in the New River Estuary Defense Coastal/Estuarine Research Program (DCERP) Introduction: A key theme of the ongoing DCERP program is monitoring
Nitrogen Cycling, Primary Production, and Water Quality in the New River Estuary Defense Coastal/Estuarine Research Program (DCERP) Introduction: A key theme of the ongoing DCERP program is monitoring
Analysis of Chlorophyll-a and other data collected in the Illinois River Watershed from
 Analysis of Chlorophyll-a and other data collected in the Illinois River Watershed from 1996-2003 By W.J. Andrews and D.N. Mott USGS Oklahoma Water Science Center For the Oklahoma Clean Lakes and Watersheds
Acidity and Alkalinity:
 Evaluation of Pollution Sources to Lake Glenville Quarterly Report December 2018 Kimberlee K Hall, PhD Environmental Health Program, Western Carolina University Summary Chemical and microbial analysis
Redwood Shores Lagoon August Monthly Water Quality Monitoring Report
 Redwood Shores Lagoon August Monthly Water Quality Monitoring Report Prepared for Redwood City Public Works Services Department 1400 Broadway Redwood City, CA 94063-2594 Prepared by Clean Lakes, Inc. P.
Environmental Assessment of the Lower Cape Fear River System, 2011
 Environmental Assessment of the Lower Cape Fear River System, 2011 By Michael A. Mallin, Matthew R. McIver and James F. Merritt September 2012 CMS Report No. 12-03 Center for Marine Science University
The Snapshot CONODOGUINET CREEK WATERSHED SNAPSHOT
 CONODOGUINET CREEK WATERSHED SNAPSHOT ABOVE: CONODOGUINET CREEK AT RT 74 BRIDGE FACING DOWNSTREAM The Snapshot The Conodoguinet Watershed Snapshot was a collaborative effort to engage local citizens in
Lower Cape Fear River Basin Cape Fear DO Issues
 Lower Cape Fear River Basin Cape Fear DO Issues by Jim Bowen, Assoc. Professor Civil Engr. Dept., UNC Charlotte Cape Fear Basin TMDL Conference Raleigh, NC September 9, 2003 Outline of Talk 1. Water Quality
7.9 Nitrogenous Nutrients and Plankton Production in Jamaica Bay, NY
 7.9 Nitrogenous Nutrients and Plankton Production in Jamaica Bay, NY Ray Sambrotto 7.9.1 SUMMARY Two blooms characterize phytoplankton growth in Jamaica Bay: the winter/spring bloom, between February and
2016 WATER QUALITY MONITORING PROMPTON RESERVOIR PROMPTON, PENNSYLVANIA
 2016 WATER QUALITY MONITORING PROMPTON RESERVOIR PROMPTON, PENNSYLVANIA U.S. Army Corps of Engineers Philadelphia District Environmental Resources Branch December 2016 2016 Water Quality Monitoring Prompton
5.0 PHYTOPLANKTON PHYSIOLOGY. Luke Twomey Christopher P. Buzzelli Hans W. Paerl. 5.1 Introduction
 5. PHYTOPLANKTON PHYSIOLOGY Luke Twomey Christopher P. Buzzelli Hans W. Paerl 5.1 Introduction Phytoplankon production is the primary source of organic carbon in the water column of the NRE (Matson and
ENVIRONMENTAL QUALITY OF WILMINGTON AND NEW HANOVER COUNTY WATERSHEDS, 2016
 ENVIRONMENTAL QUALITY OF WILMINGTON AND NEW HANOVER COUNTY WATERSHEDS, 2016 by Michael A. Mallin, Matthew R. McIver and Nicholas Iraola CMS Report 17-01 Center for Marine Science University of North Carolina
Bald Head Creek Water Quality: Before and After Dredging
 Bald Head Creek Water Quality: Before and After Dredging Michael A. Mallin 1, Byron R. Toothman 1, Matthew R. McIver 1 and Matt S. Hayes 2 1 Center for Marine Science University of North Carolina at Wilmington
Analysis of Seekonk River Water Quality Following the Fish Kill of May 2015
 Analysis of Seekonk River Water Quality Following the Fish Kill of May 2015 On May 25 th, 2015, the Rhode Island DEM began to receive notifications of a moderate fish kill of Atlantic menhaden (Brevoortia
Chapter Seven: Factors Affecting the Impact of Nutrient Enrichment on the Lower Estuary
 Chapter Seven: Factors Affecting the Impact of Nutrient Enrichment on the Lower Estuary As presented in Chapter Six, the water quality data for the upper stations of the tidal freshwater Potomac Estuary
Water Quality. Report for State of the Bay Casco Bay Water Quality Report for State of the Bay 2010 Friends of Casco Bay, 2009
 Water Quality Report for State of the Bay 2010 Casco Bay Water Quality Report for State of the Bay 2010 Friends of Casco Bay, 2009 Muskie School of Public Service University of Southern Maine www.cascobayestuary.org
Water Quality Monitoring Stations
 Water Quality Monitoring Stations Eastern Basin Race Narrows Western Basin Central Basin The CT Department of Environmental Protection (CT DEP) conducts a water quality CT DEP monitoring program for the
Documenting the Cause of a Fish Kill on the Neuse River Estuary
 Documenting the Cause of a Fish Kill on the Neuse River Estuary On October 23, 2006, a resident living on Upper Broad Creek noticed fish gulping for air at the surface. The next day, October 24 th, the
Causes of Eutrophication and its Effects of on Aquatic Ecosystems. Eutrophication can occur when inorganic nutrients are introduced into an aquatic
 Rachel Nash BIOL 271 Prof. Wagner T.A. Emily Bernhardt Eutrophication Lab Report 4/2/2008 Abstract Causes of Eutrophication and its Effects of on Aquatic Ecosystems Eutrophication can occur when inorganic
CBF Water Quality Interactive Map
 CBF Water Quality Interactive Map Student and adult groups that take part Often, they measure the water chemistry to evaluate the be doing it when you come out with us! By compiling these points on a map
Water Monitoring in Spa Creek: A Summary
 Water Monitoring in Spa Creek: A Summary Written by: Alexis Jones & Blake Harden Edited by: Hannah Krauss Water monitoring is very important in order to determine the health of the Chesapeake Bay and its
PRESS RELEASE. LOUISIANA UNIVERSITIES MARINE CONSORTIUM August 2, 2017 SUMMARY
 PRESS RELEASE LOUISIANA UNIVERSITIES MARINE CONSORTIUM August 2, 2017 SUMMARY The 2017 area of low oxygen, commonly known as the Dead Zone, measured 22,720 square kilometers (= 8,776 square miles) is the
Factors contributing to hypoxia in rivers, lakes, and streams
 Limnol. Oceanogr., 51(1, part 2), 2006, 690 701 2006, by the American Society of Limnology and Oceanography, Inc. Factors contributing to hypoxia in rivers, lakes, and streams Michael A. Mallin, 1 Virginia
Managing Excessive Algal Caused Oxygen Demand in the San Joaquin River Deep Water Ship Channel 1
 Managing Excessive Algal Caused Oxygen Demand in the San Joaquin River Deep Water Ship Channel 1 G. Fred Lee, PhD, PE, DEE Anne Jones-Lee, PhD G. Fred Lee & Associates 27298 E. El Macero Dr. El Macero,
The Nitrogen Cycle: Connections to the Neuse River Estuary
 1 The Nitrogen Cycle: Connections to the Neuse River Estuary Alexandria G. Hounshell Doctoral Student Department of Marine Sciences University of North Carolina-Chapel Hill E-mail: alexgh@live.unc.edu
Water Chemistry. Water 101
 Water Chemistry Water 101 I. Introduction A. Water is not pure Many different kinds of chemicals dissolved in it Ions, organic chemicals, organic matter, particulate matter, and gases can all be in water
Water Quality Analysis of Lakewood Lakes
 Water Quality Analysis of Lakewood Lakes December 2016 Prepared by WEST Consultants, Inc. Bellevue, Washington With support from HDR, Inc., Olympia, Washington TABLE OF CONTENTS EXECUTIVE SUMMARY... V
Estuaries and Catchments team, Water Wetlands and Coasts Science Branch, Science Division, Office of Environment and Heritage
 Impact assessment of Berkeley Vale subcatchment pollutant loads in nearshore zone of Tuggerah Lakes Rebecca Swanson, Aaron Wright, Peter Scanes and Angus Ferguson Estuaries and Catchments team, Water Wetlands
REPORT. Report No: 2013/0958 Prepared For: Natural Resources Committee Prepared By: Dean Olsen, Environmental Resource Scientist Date: 11 July 2013
 REPORT Document Id: A544088 Report No: 2013/0958 Prepared For: Natural Resources Committee Prepared By: Dean Olsen, Environmental Resource Scientist Date: 11 July 2013 Subject: Waianakarua River Water
MARYLAND DEPARTMENT OF THE ENVIRONMENT 1800 Washington Boulevard Baltimore MD
 MARYLAND DEPARTMENT OF THE ENVIRONMENT 1800 Washington Boulevard Baltimore MD 21230 410-537-3000 1-800-633-6101 Martin O Malley Governor Anthony G. Brown Lieutenant Governor November 6, 2009 Shari T. Wilson
What Characterizes the Taninim Estuary in Relation to Other Mediterranean Microestuaries in Israel and Implications for the River rehabilitation
 What Characterizes the Taninim Estuary in Relation to Other Mediterranean Microestuaries in Israel and Implications for the River rehabilitation Sarig Gafny (sarig@ruppin.ac.il) The RIME team: Gitai Yahel,
2016 WATER QUALITY MONITORING BELTZVILLE RESERVOIR LEHIGHTON, PENNSYLVANIA
 2016 WATER QUALITY MONITORING BELTZVILLE RESERVOIR LEHIGHTON, PENNSYLVANIA U.S. Army Corps of Engineers Philadelphia District Environmental Resources Branch December 2016 2016 Water Quality Monitoring
PRESS RELEASE. LOUISIANA UNIVERSITIES MARINE CONSORTIUM August 4, 2013
 PRESS RELEASE LOUISIANA UNIVERSITIES MARINE CONSORTIUM August 4, 2013 The 2014 area of low oxygen, commonly known as the Dead Zone, measured 13,080 square kilometers (= 5,052 square miles) as of Aug 1,
Relationships of water age with chlorophyll a concentrations in the eutrophic Lower Alafia River estuary. Michael S. Flannery Xinjian Chen
 Relationships of water age with chlorophyll a concentrations in the eutrophic Lower Alafia River estuary Michael S. Flannery Xinjian Chen Chlorophyll a (µg/l) Kilometers from river mouth KM = 16.47-1.96(Ln
CHAPTER 15 WATER POLLUTION. INTO THE GULF Researchers try to pin down what s choking the Gulf of Mexico
 CHAPTER 15 WATER POLLUTION INTO THE GULF Researchers try to pin down what s choking the Gulf of Mexico SAVING THE BAY Teams of researchers try to pin down what s choking the Chesapeake Water pollution
HARPETH RIVER MAIN STEM DISSOLVED OXYGEN STUDY
 HARPETH RIVER MAIN STEM DISSOLVED OXYGEN STUDY September 18, 2002 Report prepared by David J. Wilson Introduction Dissolved oxygen (dissolved O 2, a.k.a. DO) is essential for fish and benthic macroinvertebrates.
Nutrient Sources, Fate, Transport, and Effects Study of Galveston Bay, Texas Rachel Windham,
 Nutrient Sources, Fate, Transport, and Effects Study of Galveston Bay, Texas Rachel Windham, Department of Marine Biology Texas A&M University at Galveston 2 Acknowledgements: Dr. Antonietta Quigg Members
White Lake 2017 Water Quality Report
 Introduction Watersheds Canada believes that every person has the right to access clean and healthy lakes and rivers in Canada. We work to keep these precious places naturally clean and healthy for people
EUTROPHICATION. Teacher s Manual
 EUTROPHICATION Teacher s Manual Preface The following is a, hands on, and inquiry based lesson plan developed by COSEE Mid-Atlantic for teaching eutrophication. The National Education Science Standards
Analyses for geochemical investigations traditionally report concentrations as weight per volume of the measured ions (mg/l of NO 3 , NO 2
 Nitrate-Nitrogen 55 Nutrients The nutrients nitrogen and phosphorus occur naturally and also may be introduced to groundwater systems from urban and agricultural fertilizer applications, livestock or human
Dog River Watershed Management Plan
 Dog River Watershed Management Plan Preliminary Water Quality Data Analysis Doug Robison, PWS ESA is where solutions and service meet. Water Quality - Regulatory Primer Designated Use Categories Swimming
PROTECTING THE WACCAMAW WATERSHED. Water Quality Monitoring. Christine Ellis. Waccamaw RIVERKEEPER A Program of Winyah Rivers Foundation
 PROTECTING THE WACCAMAW WATERSHED Water Quality Monitoring Christine Ellis Waccamaw RIVERKEEPER A Program of Winyah Rivers Foundation Focusing on the Waccamaw Waccamaw RIVERKEEPER Program Citizen-Based
2018 WATER QUALITY MONITORING BLUE MARSH RESERVOIR LEESPORT, PENNSYLVANIA
 2018 WATER QUALITY MONITORING BLUE MARSH RESERVOIR LEESPORT, PENNSYLVANIA U.S. Army Corps of Engineers Philadelphia District Environmental Resources Branch January 2019 2018 Water Quality Monitoring Blue
Results from Fall Water Monitoring FortWhyte Alive Riverwatch Test Kit September October 2017
 Results from Fall Water Monitoring FortWhyte Alive Riverwatch Test Kit September October 2017 with: Westwood Collegiate, Elmwood Jr. High, Maples Met School, Miles Macdonnell Collegiate, Seven Oaks Met
Cultural accelerated by anthropogenic activities
 EUTROPHICATION IMPLICATIONS OF N & P Intent of this lecture? Link our discussions of terrestrial N & P dynamics with its influences on receiving water bodies How the relative amounts of N & P can influence
EXECUTIVE SUMMARY LEGISLATIVE REPORT 2011
 EXECUTIVE SUMMARY LEGISLATIVE REPORT 2011 January, 2012 2011 RiverNet Program RIVERNET: Continuous Monitoring of Water Quality in the Neuse River Basin Dr. William J. Showers Dept. of Marine, Earth & Atmospheric
Rocky River Monitoring Study, Division of Water Resources- Water Sciences Intensive Survey Branch
 Rocky River Monitoring Study, 2016 Division of Water Resources- Water Sciences Intensive Survey Branch Thank You Tim Sweeny Town of Siler City Area of Study 6.7 mile stretch of River located in Chatham
Predicting algal growth under climate change in the upper Thames Mike Hutchins, CEH Wallingford
 Predicting algal growth under climate change in the upper Thames Mike Hutchins, CEH Wallingford (plus Richard Williams, Christel Prudhomme, Sue Crooks) Changes in the Thames by 2080 Brought about by economic
OKLAHOMA CLEAN LAKES AND WATERSHEDS 23rd ANNUAL CONFERENCE AGENDA. SUCCESS STORY: 20 YEARS of HYPOLIMNETIC OXYGENATION of a RESERVOIR
 OKLAHOMA CLEAN LAKES AND WATERSHEDS 23rd ANNUAL CONFERENCE AGENDA SUCCESS STORY: 20 YEARS of HYPOLIMNETIC OXYGENATION of a RESERVOIR Agenda EBMUD & Camanche Reservoir Water Quality Challenges Speece Cone
Columbia River Plume correlation with Oregon/Washington dead zones
 Columbia River Plume correlation with Oregon/Washington dead zones The location of the Oregon and Washington dead zones strongly correlate with Columbia River Plum summer flow patterns. OSU map OSU Map
Santa Rosa Creek Water Quality Results 2004
 Santa Rosa Creek Water Quality Results 24 Community Clean Water Institute Site Description: SRC4: Off 3rd Street in downtown Santa Rosa. Behind the Vineyard Hotel just West of Highway 11 along the Prince
Water Quality Report: Ambient Monitoring Stations in the Oregon Coast Coho Evolutionarily Significant Unit
 Water Quality Report: Ambient Monitoring Stations in the Oregon Coast Coho Evolutionarily Significant Unit Laboratory Division 1712 SW 11th Avenue Portland, Oregon, 97201 (503) 229-5983 Prepared by: Steve
WALTON COUNTY COASTAL DUNE LAKES WATER CHEMISTRY SUMMARY 2016
 WALTON COUNTY COASTAL DUNE LAKES WATER CHEMISTRY SUMMARY 2016 Prepared by Choctawhatchee Basin Alliance in partnership with Mattie Kelly Environmental Institute Contents Overview Northwest Florida Coastal
South Venice Water Quality
 SARASOTA COUNTY South Venice Water Quality Summary of Data Collected in Support of the South Venice Civic Association Water Quality Task Force Sarasota County Water Resources 8//24 Introduction The South
North Carolina Nutrient Criteria Development Plan
 North Carolina Nutrient Criteria Development Plan Version 2.0 March 3, 2014 Submitted to the United States Environmental Protection Agency - Region 4 by the North Carolina Department of Environment and
Sarah Ludwig- Monty. Advisor: Dr. Jim Heffernan. April 24, requirements for the Master of Environmental Management degree in
 SPATIAL AND TEMPORAL ANALYSIS OF LONG- TERM WATER QUALITY DATA FOR THE PAMLICO RIVER ESTUARY, NORTH CAROLINA 1 by Sarah Ludwig- Monty Advisor: Dr. Jim Heffernan April 24, 2015 Masters project submitted
Results of the 2011 Water Quality Survey of Ten Lakes Located in the Carleton River Watershed Area of Digby and Yarmouth Counties, Nova Scotia
 Results of the 2011 Water Quality Survey of Ten Lakes Located in the Carleton River Watershed Area of Digby and Yarmouth Counties, Nova Scotia Prepared for Nova Scotia Environment By M. Brylinsky Acadia
FILLING THE GAP: DISSOLVED OXYGEN MONITORING IN NARRAGANSETT BAY
 FILLING THE GAP: DISSOLVED OXYGEN MONITORING IN NARRAGANSETT BAY Christopher F. Deacutis, Narragansett Bay Estuary Program, URI Coastal Institute Keywords: Narragansett Bay, intermittent hypoxia, volunteer
PHOTOSYNTHETIC AND HETEROTROPHIC IMPACTS OF NUTRIENT LOADING TO BLACKWATER STREAMS
 Ecological Applications, 14(3), 2004, pp. 823 838 2004 by the Ecological Society of America PHOTOSYNTHETIC AND HETEROTROPHIC IMPACTS OF NUTRIENT LOADING TO BLACKWATER STREAMS MICHAEL A. MALLIN, 1 MATTHEW
Human nutrient over-enrichment in coastal waterways and deltas; There s a long history
 www.marine.unc.edu/paerllab Human nutrient over-enrichment in coastal waterways and deltas; There s a long history Salomon van Ruysdael 1648 1 RN (ton/yr) Mississippi R. Basin Choptank R, Chesapeake Bay
KILROY TERMINOLOGY KILROY TERMINOLOGY DEFINITION UNITS NORMAL RANGE. Meter Feet Fathom = 6 feet (nautical) N/A. Page 1 of 7
 N/A. Page 1 of 7") KILROY TERMINOLOGY BACKGROUND: Kilroy is a water-quality system unlike any other. Kilroy systems monitor the physical, chemical and biological indicators of health in a particular body of water and it
KILROY TERMINOLOGY BACKGROUND: Kilroy is a water-quality system unlike any other. Kilroy systems monitor the physical, chemical and biological indicators of health in a particular body of water and it
Project Water Quality
 Project Water Quality Yadkin-Pee Dee Hydroelectric Project No. 2206 Water Resources Working Group May 7, 2003 Surveys of Existing Resources! Reservoirs (monthly sampling) " Lake Tillery (2000, 2002) "
Big Bend Model. Wayne Magley Watershed Evaluation and TMDL Section FDEP. March 7, 2016
 Big Bend Model Wayne Magley Watershed Evaluation and TMDL Section FDEP March 7, 2016 BACKGROUND As outlined in the EPA November 30, 2012 document Methods and Approaches for Deriving Numeric Criteria for
Nitrogen Management through Land Use. Holly Greening, Tampa Bay Estuary Program July 2010
 Nitrogen Management through Land Use Holly Greening, Tampa Bay Estuary Program July 2010 Importance of Water Quality Management Eutrophication (excess nutrients) common to many estuaries, streams and lakes
MODELING THE SPOKANE RIVER-LAKE ROOSEVELT SYSTEM
 MODELING THE SPOKANE RIVER-LAKE ROOSEVELT SYSTEM Chris J. Berger 1, Robert L. Annear, Jr. 2, Michael L. McKillip 3, Vanessa Wells 4 and Scott A. Wells, ASCE 5 1 Senior Research Associate, Department of
PRESS RELEASE. LOUISIANA UNIVERSITIES MARINE CONSORTIUM July 28, Abstract
 PRESS RELEASE LOUISIANA UNIVERSITIES MARINE CONSORTIUM July 28, 2013 Abstract The 2013 area of low oxygen, commonly known as the Dead Zone, measured 15,120 square kilometers (= 5,800 square miles) in this
Water Quality in Rice and Pike Lakes. Ryan Haney Water Resource Specialist Center for Watershed Science and Education UW Stevens Point
 Water Quality in Rice and Pike Lakes Ryan Haney Water Resource Specialist Center for Watershed Science and Education UW Stevens Point Tonight s discussion How do we measure water quality? How is the water
List of proposed interim changes to MWRA s Effluent Outfall Ambient Monitoring Plan April 15, 2009
 LIST OF PROPOSED INTERIM CHANGES TO MWRA S EFFLUENT OUTFALL AMBIENT MONITORING PLAN APRIL 2009 Changes to the plan are based on data collected and technical reports written since the monitoring began,
Estero Americano Watershed Sediment Reduction Project, Phase II, Sonoma and Marin Counties, CA. Draft Quarterly Monitoring Report Item B.4.
 Estero Americano Watershed Sediment Reduction Project, Phase II, Sonoma and Marin Counties, CA Draft Quarterly Monitoring Report Item B.4.2 This quarterly report summarizes data collected from December
ENVIRONMENTAL QUALITY OF WILMINGTON AND NEW HANOVER COUNTY WATERSHEDS, 2014
 ENVIRONMENTAL QUALITY OF WILMINGTON AND NEW HANOVER COUNTY WATERSHEDS, 2014 by Michael A. Mallin, Matthew R. McIver, Anna R. Robuck and John D. Barker CMS Report 15-01 Center for Marine Science University
STREAM WATER QUALITY CHANGES FOLLOWING TIMBER HARVEST IN A COASTAL PLAIN SWAMP FOREST
 PII: S0043-1354(01)00060-4 Wat. Res. Vol. 35, No. 14, pp. 3381 3390, 2001 # 2001 Elsevier Science Ltd. All rights reserved Printed in Great Britain 0043-1354/01/$ - see front matter STREAM WATER QUALITY
Aquatic Science Unit 2. Water Quality and Water Pollution
 Aquatic Science Unit 2 Water Quality and Water Pollution What is a healthy water body? In your own words, take a moment to describe what you believe are some of the characteristics of a healthy stream
Factsheet: Town of Deep River Water Quality and Stormwater Summary
 79 Elm Street Hartford, CT 06106-5127 www.ct.gov/deep Affirmative Action/Equal Opportunity Employer Factsheet: Town of Deep River Water Quality and Stormwater Summary This document was created for each
Results from the 2017 Water Quality Monitoring Program
 Results from the 217 Water Quality Monitoring Program As part of a larger project, this summer the BWC conducted water sampling throughout the Belleisle Bay to get a baseline of data and determine the
Josette M. La Hée, Ph.D. Limnologist Research and Development
 Aeration: A key tool in aquatic system restoration and management Josette M. La Hée, Ph.D. Limnologist Research and Development http://www.vertexwaterfeatures.com Aeration Aeration the process by which
Calibration of the CE-QUAL-W2 Model For Lake Murray. Final Report. December 2006
 Calibration of the CE-QUAL-W2 Model For Lake Murray Prepared for Prepared By Andy F. Sawyer and Richard J. Ruane, Reservoir Environmental Management, Inc Chattanooga, TN jimruane@comcast.net 423-265-5820
Continuous records for the Chariton River indicate that 2004 was an average water year, with total flow approximately equal to the average annual
 2004 Rathbun Report Iowa State University Limnology Laboratory John A. Downing, Ph.D. George Antoniou, Assistant Scientist For Rathbun Land and Water Alliance August 31, 2005 A. Tributaries Personnel of
Hydrology and Water Quality. Water. Water 9/13/2016. Molecular Water a great solvent. Molecular Water
 Hydrology and Water Quality Water Molecular Water Exists as an equilibrium But equilibrium altered by what is dissolved in it Water Molecular Water a great solvent In reality, water in the environment
Factsheet: City of West Haven Water Quality and Stormwater Summary
 79 Elm Street Hartford, CT 06106-5127 www.ct.gov/deep Affirmative Action/Equal Opportunity Employer Factsheet: City of West Haven Water Quality and Stormwater Summary This document was created for each
2009 ANNUAL LIST OF PROPOSED CHANGES TO MWRA S EFFLUENT OUTFALL AMBIENT MONITORING PLAN OCTOBER 23, 2009
 2009 ANNUAL LIST OF PROPOSED CHANGES TO MWRA S EFFLUENT OUTFALL AMBIENT MONITORING PLAN OCTOBER 23, 2009 Proposed changes to the plan are based on data collected and technical reports written since the
Hydrology and Water Quality. Water. Water 9/11/2018. Molecular Water a great solvent. Molecular Water
 Hydrology and Water Quality Water Molecular Water Exists as an equilibrium But equilibrium altered by what is dissolved in it Water Molecular Water a great solvent In reality, water in the environment
SESSION 4D WATER QUALITY 2
 SESSION 4D WATER QUALITY 2 139 UNDERSTANDING POLLUTANT TOXICITY ON FRESHWATER MUSSELS Nancy Scott, 1 MEM, The Catena Group Dwarf wedgemussel (DWM) is an endangered mussel species found in the eastern United
Long-Term Volunteer Lake Monitoring in the Upper Woonasquatucket Watershed
 Long-Term Volunteer Lake Monitoring in the Upper Woonasquatucket Watershed Linda Green URI Watershed Watch 1-87-95, lgreen@uri.edu WATER QUALITY IS A REFLECTION OF THE ACTIVITIES IN THE LANDS AND WATERS
MARK TWAIN LAKE 2002 WATER QUALITY
 MARK TWAIN LAKE 2002 WATER QUALITY REPORT U.S. ARMY CORPS OF ENGINEERS, ST. LOUIS DISTRICT ENVIRONMENTAL QUALITY SECTION - Water Quality Ted Postol, Section Chief Tori Foerste, Environmental Engineer Donna
McKenzie Watershed Water Quality Discussion Article
 McKenzie Watershed Water Quality Discussion Article Oregon Department of Environmental Quality Report: Water Years 1996 2004 fostering better stewardship of the McKenzie Watershed resources through voluntary
Factsheet: Town of East Lyme Water Quality and Stormwater Summary
 79 Elm Street Hartford, CT 06106-5127 www.ct.gov/deep Affirmative Action/Equal Opportunity Employer Factsheet: Town of East Lyme Water Quality and Stormwater Summary This document was created for each
MARK TWAIN LAKE 2002 WATER QUALITY REPORT
 MARK TWAIN LAKE 2002 WATER QUALITY REPORT U.S. ARMY CORPS OF ENGINEERS, ST. LOUIS DISTRICT ENVIRONMENTAL QUALITY SECTION - Water Quality Billy Arthur,Section Chief Ted Postol, Environmental Engineer Rick
Jordan River TMDL Study What Have We Learned So Far?
 Jordan River TMDL Study What Have We Learned So Far? Salt Lake Countywide Watershed Symposium October 29 th, 2008 Hilary Arens & James Harris Utah Division of Water Quality TMDL Update Impairments Water