Collection of Input Material to the Trialogue Workshops
|
|
|
- Cori Taylor
- 6 years ago
- Views:
Transcription

1 Earth Observation for Monitoring and Observing Environmental and Societal Impacts of Mineral Resources Exploration and Exploitation Project no: , call 2009, Theme 6, Topic ENV Collection of Input Material to the Trialogue Workshops Tamara Teršič, Gorazd Žibret, Colm Jordan


2 Collection of Input Material to the Trialogue Workshops Collection of Input Material to the Trialogue Workshops Deliverable D5.4 version 1.1 October, 2013 Tamara Teršič, Gorazd Žibret & Colm Jordan With the collaboration of all project partners Checked by: Approved by: Name: Horst Hejny Name: Chevrel Stephane Date: Signature: Date: Signature: 1
3 Collection of Input Material to the Trialogue Workshops Deliverable reference number and title EO-MINERS D5.4 Collection of Input Material to the Trialogue Workshops Due date of Deliverable Actual Submission Date Start Date of Project Duration Deliverable Lead Contractor 45 months GeoZS Revision Last Modifications Nature Dissemination level Public Summary enclosed Reference / Workpackage Report General No DoW - WP5 Digital File Name Keywords: workshop materials, presentations, earth observation, Sokolov, emalahleni, Kazarman In bibliography, this report should be cited as follows: Teršič, T., Žibret, G. & Jordan, C. (2013): Collection of Input Materials to the Workshop.- Earth Observation for Monitoring and Observing Environmental and Societal Impacts of Mineral Resources Exploration and Exploitation, FP7 Project EO- MINERS, Deliverable D5.4. 2
4 Collection of Input Material to the Trialogue Workshops Contents 1. Introduction The process of collecting input material DESCRIPTION OF WORK TOWARDS INPUT MATERIALS FOR THE WORKSHOPS THE PROCESS AND MAIN CHALLENGES IN COLLECTING INPUT MATERIAL RECOMMENDATIONS List of contributors to the booklets Conclusions References List of appendices APPENDIX 1: - The EO-MINERS project (Stéphane Chevrel) presentation held at all local workshops and at the EU workshop in Brussels APPENDIX 2: Presentations at the Czech Trialogue Workshop - Workshop principle and aims (Horst Hejny) - EO-MINERS indicator retrieval process, indicators relevant for Sokolov (Eberhard Falck) - Minerals Extraction and the Society (Dominic Wittmer) - EO Products (Veronika Kopačková, Colm Jordan, Christian Fischer) - Latest Products by TAU - Detection of Silicates and C-rich + Flying Ash in Dust by NIR Spectroscopy (Ido Livne) - Using Hyper-Multi-spectral Remote Sensing in the Thermal region for classifying soil s mineralogy and assisting in monitoring the environmental impacts caused by mining activities (Gila Notesco, Eyal Ben Dor, Ido Livne, Simon Adar, Veronika Kopačková, Christian Fischer, Christoph Ehrler, Gregoire Kerr, Henk Coetzee, Stephan Chevrel). APPENDIX 3: Presentations at the South African Trialogue Workshop - Introduction to EO-MINERS Products (Colm Jordan) APPENDIX 4: Presentations at the Kyrgyzstan Trialogue Workshop - Introduction to EO-MINERS Products (Colm Jordan) Kyrgyzstan case APPENDIX 5: Presentations at the EU trialogue Workshop in Brussels: - The Potential of remote sensing for monitoring throughout the minerals lifecycle (Christian Fischer, Stuart Marsh) - The EO-MINERS process and experiences: How to provide suitable integrated EO-based products (Stephane Chevrel) - Selected EO-MINERS products Integrated EO-based tools and methods for environmental and societal impact assessment of mining activities (Colm Jordan) - EO-MINERS products in the context of the national and the EU regulatory framework related to mineral raw materials (Patrice Christmann, ERA-MIN/French Geological Survey, BRGM) - Panel Discussion: Is the EO-MINERS process and are the EO-MINERS products suitable for use in monitoring environmental and societal impacts of mining activities. Moderation: EO-MINERS (Stéphane Chevrel, BRGM); Panel: DG Research and Innovation, ETP-SMR/Euromines (Corina 3
5 Collection of Input Material to the Trialogue Workshops Hebestreit), BRGM/ERA-MIN (Patrice Christmann), Milieudefensie Friends of the Earth Netherlands (Evert Hassink) - Resource efficient Europe: Macro Indicators on Sustainable Resource Extraction (Werner Bosmans, Policy Officer Resource Efficiency & Economic Analysis, DG Environment) - Global mineral extraction for the EU economy (Stefan Bringezu, Wuppertal Institute for Climate, Environment, Energy, International Resource Panel) - Accounting for minerals extraction and environmental pressures from a national perspective (Renato Marra Campanale, Ispra, Italian Institute for Environmental Protection and Research) - Earth observation, minerals and resource efficient Europe; Moderator: Stuart Marsh, British Geological Survey, BGS; Panel: DG Research (n.n.), DG Environment (Werner Bosmans), ETP SMR (Nikolaos Arvanitidis, SGU, Sweden), Ispra (Renato Marra Campanale), International Resource Panel (Stefan Bringezu) - Resourcing the Future: International Science Initiatives on Energy and Minerals (Marko Komac, International Union of Geological Sciences, IUGS) - Global Earth Observation: GEO, Geo-resources and Minerals (Georgios Sarantakos, Georesources Expert, Group on Earth Observations Secretariat; Stephane Chevrel, French Geological Survey, BRGM) - Panel Discussion on GEO Post-2015, the Copernicus Operational Phase and Minerals; Moderator: Luca Demicheli (EuroGeoSurveys Secretary General); Panel: Group on Earth Observations Secretariat (Georgios Sarantakos), International Union of Geological Sciences Minerals Initiative (Marko Komac), GMES/Copernicus Bureau (Hugo Zunker), EO-MINERS Project (Stuart Marsh) - Workshop Wrap-up and Conclusions (Stephane Chevrel) APPENDIX 6: - Material and information for the EO-MINERS workshop at the Sokolovská uhelná demonstration site (Sokolov booklet APPENDIX 7: - Material and information for the EO-MINERS workshop at the emalahleni Coalfield demonstration site (emalahleni booklet) APPENDIX 8: - Material and information for the EO-MINERS workshop at the Makmal gold deposit demonstration site (Makmal booklet) 4
6 Collection of Input Material to the Trialogue Workshops 1. Introduction This deliverable is related to WP5 (Communication, dissemination, capacity building and exploitation). The focus of WP5 is dissemination, promotion and capacity building actions, which are key factors in providing everybody involved and interested in the impact assessment of mining activities with the results of the project work. This report describes three workshops held at the local level and a workshop held at the European level. Local level workshops Three workshops were held at the three demonstration sites to introduce earth observation methods and demonstrate their application in monitoring the impacts of mining to three key stakeholder groups: industry, societal organisations and regulators. The workshops were held at: - Sokolov, Czech Republic (21 st March 2013); - Emalahleni, Mpumalanga, South Africa (24 th April 2013); - Makmal mine (19 th June 2013), Kazarman (20 th June 2013), Bishkek (24 th June 2013), Kyrgyzstan. The workshops targeted stakeholders at the local level at each site to inform them of the general project achievements and to obtain their views and feedback on the usefulness of the tools developed to monitor and support the assessment of the impacts of mining. A detailed description of the demonstration sites has been provided in the reports: Corporate Policies in a Mineral Extraction Context (deliverable D1.1-1) and Civil Society Policies in a Mineral Extraction Context (deliverable D1.1-2). A booklet was compiled for each workshop introducing the EO-MINERS project, describing the development and application of indicators for the site and presenting a selection of products developed using Earth Observation techniques for that site. The booklets were distributed among participants at the beginning of the workshops with the aim to provide material for the discussions during the workshop. European level workshops At the GEO level, a workshop titled "Minerals within Group on Earth Observation" was held on 4-5 July 2012 in Ljubljana, Slovenia. Its primary focus was to recognise the ways of better addressing minerals within GEO. Workshop included presentations from GEO as well as from the EO-MINERS and ImpactMin FP7 projects, panel discussions and round tables. 5
7 Collection of Input Material to the Trialogue Workshops Event hosted representatives of EO-MINERS and ImpactMin projects, representatives of DG R&I and GEO secretariat. At the European level, a Minerals and Society workshop was held on the 18 th 19 th September 2013 in Brussels, Belgium. The workshop was titled 'European Stakeholder Dialogue on Impact Assessment on Mineral Exploration and Exploitation using Earth Observation' and its aim was to discuss the results obtained during the project as well as the results obtained through local level activities. Some key-note presentations as well as technical presentations about the project results were presented to inform three specific stakeholder groups: - Stakeholders involved in material flow accounting (MFA) for used and unused extraction and in the EU Flagship Initiative for a Resource Efficient Europe, the EU Raw Material Initiative; - The Group on Earth Observation (GEO)/ Global Earth Observation System of Systems (GEOSS) community; - Stakeholders interested in EO tools and methods. All input material to the workshops is available through the EO-MINERS homepage: 6
8 Collection of Input Material to the Trialogue Workshops 2. The process of collecting input material The booklets presented a selection of the products that were developed using EO techniques aimed at addressing the prioritised environmental and socio-economic issues (impacts). The issues were identified through a series of stakeholder interviews conducted between May 2010 and April 2012 at each demonstration site. The issues were explored by the team to determine what information is needed by the stakeholders to provide the stakeholders with objective information on the issues/concerns these raised e.g. for their work (cf. Wittmer et al. 2013). Therefore, EO products were made for the most representative examples from the large amount of data that was collected during the project at the three sites. The booklets demonstrate the very broad range of possibilities that EO techniques can offer. They were compiled by GeoZS and BGS in cooperation with all EO-MINERS partners. The booklets and the presentations delivered at the local workshops and at the EU workshop in Brussels are available for download through the EO-MINERS website: Direct links to the booklets are available through the DOI number: In this chapter we describe the process of collecting the input materials, the challenges that emerged and the difficulties we confronted during this process DESCRIPTION OF WORK TOWARDS INPUT MATERIALS FOR THE WORKSHOPS The basis for the selection of the relevant EO products was agreed during the EO-MINERS project team meeting in Cologne in December A general guide on how to prepare the input materials for the different workshops, as well as a general frame was also agreed. The organization and collection of the material for the booklets started in the middle of January This included: - specifying the content of the booklets, - setting dates and deadlines for the work plan, - assigning responsibilities to the diverse project partners. 7
9 Collection of Input Material to the Trialogue Workshops Preparing the Sokolov booklet Step 1 (early February 2013): The structure of the booklet was broadly outlined and the first part of the booklets was presented and later revised by partners. The title was set: Indicators and Earth Observation Products for the Assessment of the Extractive Industry Environmental and Societal Impacts, Material and information for the EO-MINERS workshop. Step 2 (mid February 2013): The first preliminary draft of the Sokolov booklet was prepared and sent to all partners. Detailed instructions on how to prepare the products for the presentation in the booklet to ensure consistency and uniformity of the products, guidance were provided on the length of accompanying text based descriptions as well as the graphical display of any related images. GeoZS coordinated the collection of input from partners for the Sokolov booklet. Image and data processing was cooperatively undertaken by the corresponding EO-MINERS partners, each one contributing its own areas of scientific knowledge and expertise. Step 3 (end February 2013): The first version of Sokolov booklet was compiled and circulated for review by the project partners. The key changes as a result of the review were; A simplification of the language used as it included too many technical and scientific terms and detail which were not relevant for the target audience. Rationalisation of the images as some were repetitive and production of more images to further simplify the text. Altogether 16 products were finally included in the booklet. The final English version of the booklet was compiled on the 7 th March 2013 and sent to Czech GS for translation into Czech. The final version with incorporated Czech translation was compiled on 13 th March After final corrections, printing followed on 14 th and 15 th of March Preparing the emalahleni and Makmal booklets Learning from the experiences of collating the Sokolov booklet, the procedure for the preparation of emalahleni and Makmal booklets was refined. The data, images and descriptions were collected, processed and/or written by one partner (BGS) and the whole Chapter 5 (EO-MINERS products) was also prepared by the same partner (BGS). This assured a standard protocol for product preparation and also a common visual presentation of all EO products. The maps were disassembled so that in each case they could be 8
10 Collection of Input Material to the Trialogue Workshops displayed across two pages of the booklet. As a consequence, the layout of the Products Chapter in the emalahleni and Makmal booklets is different from the Sokolov booklet. The final booklets were compiled by GeoZS. GeoZS also coordinated the translation of the Kazarman booklet in association with the CAIAG partners. However, no translation was needed for the emalahleni booklet. The first preliminary draft of the emalahleni booklet was sent to all partners at the end of March The deadlines were set according to the experience we gained from creating the booklet for Sokolov workshop. Revisions and comments provided by many partners allowed the first part of the booklets to be greatly improved (chapters 1-4). The final draft of the booklet was compiled in the middle of April The fully formatted EO-MINERS products chapter was provided by BGS. On 18 th April 2013 the final version of the booklet was compiled and sent to all partners. 9 products were presented. The booklet was made available to all partners through the project FTP site. Arising from the decisions during the project partners meeting in emalahleni, the introductory part of the Makmal booklet did not require significant changes compared to the emalahleni one. It was agreed that the booklet would be translated into the Russian language and that, contrary to Sokolov, there would be two individual booklets, an English and a Russian version. In the beginning of May 2013, the introductory chapters were sent to CAIAG for translation into Russian. In the middle of May 2013 the first draft of the booklet was sent to all partners. As in emalahleni case, BGS contacted partners directly in order to prepare the materials for the EO-products chapter. CAIAG translated the text for each of the products as they were being made, so that both the English and Russian text could be embedded into each map product. These were subsequently compiled into the EO-MINERS products chapter. On 13 th June 2013 the final versions, English and Russian, were compiled and sent to all partners. Altogether 7 products are presented in the booklet. Word and PDF documents of the booklet were uploaded on the FTP site. At each of the local workshops, a series of non-technical presentations about the project and tools developed were presented and are described here. A number of key-note presentations as well as technical presentations about the project results were presented at the Minerals and Society Workshop in Brussels. The presentations followed 4 sessions: 1. Introduction and Context, 2. The EO-MINERS Project, 3. Resource Flows and Economics and 4. Minerals and Global Earth Observations. Presentations at the GEO Workshop in Ljubljana - Overview of GEO & GEOSS (H. Mudau) - EC FP7 in support of GEOSS (V. Bratina) 9
11 Collection of Input Material to the Trialogue Workshops - Geological elements of GEOSS and the GEO Tasks (S. Marsh) - Minerals components of Tasks EN-01 & SB-05 (S. Chevrel) - IMPACTMIN products and their relationship to GEO (P. Gyuris) - EO-MINERS products and their relationship to GEO (C. Jordan) - The GEO Work Plan and its annual updates (H. Mudau) - Short talks: minerals initiatives relevant to GEO & GEOSS (TBC) - Workshop outcomes and plan for follow-on meeting (S. Marsh) Presentations at the Czech Trialogue Workshop - The EO-MINERS project (Stéphane Chevrel) - Workshop principle and aims (Horst Hejny) - EO-MINERS indicator retrieval process, indicators relevant for Sokolov (Eberhard Falck) - Minerals Extraction and the Society (Dominic Wittmer) - EO Products (Veronika Kopačková, Colm Jordan, Christian Fischer) - Latest Products by TAU - Detection of Silicates and C-rich + Flying Ash in Dust by NIR Spectroscopy (Ido Livne) - Using Hyper-Multi-spectral Remote Sensing in the Thermal region for classifying soil s mineralogy and assisting in monitoring the environmental impacts caused by mining activities (Gila Notesco, Eyal Ben Dor, Ido Livne, Simon Adar, Veronika Kopačková, Christian Fischer, Christoph Ehrler, Gregoire Kerr, Henk Coetzee, Stephan Chevrel). It was generally perceived amongst the EO-MINERS consortium, that the Sokolov presentations were too long and too technical for the audience. A detailed description of the workshop performance and feedback from stakeholders is provided in D5.6 ( Trialogue Workshop in the Czech Republic: Summary and Results ). Booklets were generally appreciated very well by local stakeholders. On that basis, the EO-MINERS consortium decided that the number of presentations for the emalahleni trialogue workshop should be reduced and the presentations shortened. Therefore, only 2 presentations were prepared for the South African trialogue workshop. Furthermore, the EO products were presented in the booklets, on wall posters (A0), as digital interactive 3D visualisations on laptop computers, e.g. as GeoPDFs. Such an approach worked very well allowing stakeholders to interact with the products in the way they felt most comfortable and information. It was therefore partners agreed that the same approach should be adopted for the Kazarman workshops. 10
12 Collection of Input Material to the Trialogue Workshops Presentations at the South African trialogue Workshop - The EO-MINERS project (Stéphane Chevrel) - Introduction to EO-MINERS Products (Colm Jordan) Presentations at the Kyrgyzstan trialogue Workshop - The EO-MINERS project (Stéphane Chevrel) - Introduction to EO-MINERS Products (Colm Jordan) Presentations at the EU trialogue Workshop in Brussels: - The EO-MINERS project (Stephane Chevrel, EO-MINERS Coordinator, French Geological Survey, BRGM) - The Potential of remote sensing for monitoring throughout the minerals lifecycle (Christian Fischer, Stuart Marsh) - The EO-MINERS process and experiences: How to provide suitable integrated EO-based products (Stephane Chevrel) - Selected EO-MINERS products Integrated EO-based tools and methods for environmental and societal impact assessment of mining activities (Colm Jordan) - EO-MINERS products in the context of the national and the EU regulatory framework related to mineral raw materials (Patrice Christmann, ERA-MIN/French Geological Survey, BRGM) - Panel Discussion: Is the EO-MINERS process and are the EO-MINERS products suitable for use in monitoring environmental and societal impacts of mining activities. Moderation: EO-MINERS (Stéphane Chevrel, BRGM); Panel: DG Research and Innovation, ETP- SMR/Euromines (Corina Hebestreit), BRGM/ERA-MIN (Patrice Christmann), Milieudefensie Friends of the Earth Netherlands (Evert Hassink) - Resource efficient Europe: Macro Indicators on Sustainable Resource Extraction (Werner Bosmans, Policy Officer Resource Efficiency & Economic Analysis, DG Environment) - Global mineral extraction for the EU economy (Stefan Bringezu, Wuppertal Institute for Climate, Environment, Energy, International Resource Panel) - Accounting for minerals extraction and environmental pressures from a national perspective (Renato Marra Campanale, Ispra, Italian Institute for Environmental Protection and Research) - Earth observation, minerals and resource efficient Europe; Moderator: Stuart Marsh, British Geological Survey, BGS; Panel: DG Research (n.n.), DG Environment (Werner Bosmans), 11
13 Collection of Input Material to the Trialogue Workshops ETP SMR (Nikolaos Arvanitidis, SGU, Sweden), Ispra (Renato Marra Campanale), International Resource Panel (Stefan Bringezu) - Resourcing the Future: International Science Initiatives on Energy and Minerals (Marko Komac, International Union of Geological Sciences, IUGS) - Global Earth Observation: GEO, Geo-resources and Minerals (Georgios Sarantakos, Georesources Expert, Group on Earth Observations Secretariat; Stephane Chevrel, French Geological Survey, BRGM) - Panel Discussion on GEO Post-2015, the Copernicus Operational Phase and Minerals; Moderator: Luca Demicheli (EuroGeoSurveys Secretary General); Panel: Group on Earth Observations Secretariat (Georgios Sarantakos), International Union of Geological Sciences Minerals Initiative (Marko Komac), GMES/Copernicus Bureau (Hugo Zunker), EO-MINERS Project (Stuart Marsh) - Workshop Wrap-up and Conclusions (Stephane Chevrel) Three presentations, two from local workshops: The EO-MINERS project and Introduction to EO-MINERS Products Kyrgyzstan case and one from the EU workshop: The Potential of remote sensing for monitoring throughout the minerals lifecycle are available as appendices to this deliverable document. These presentations were selected because they were finally designed in a way to make the workshops interesting and informative. All other presentations are available through the EO-MINERS website: The setting of the three local trialogue workshops and the EU trialogue workshop are described by separate workshop summary reports that contain discussions on the level of EO products and the project approach, respectively (cf. deliverable D5.6) THE PROCESS AND MAIN CHALLENGES IN COLLECTING INPUT MATERIAL The main difficulties we confronted during the process of collecting input materials were: Short timeframe: The time set aside for getting the data to through to product delivery was too short. Consequently, the time available for translation and for compilation of the final booklets was inadequate. Also, the time remaining for final checking and improvements of the final drafts, especially in the case of the first one the Sokolov booklet was insufficient. Experience from preparing the first booklet allowed the team to make significant improvements to the following two booklets. Moreover, the translation of the text took some additional time for the two sites 12
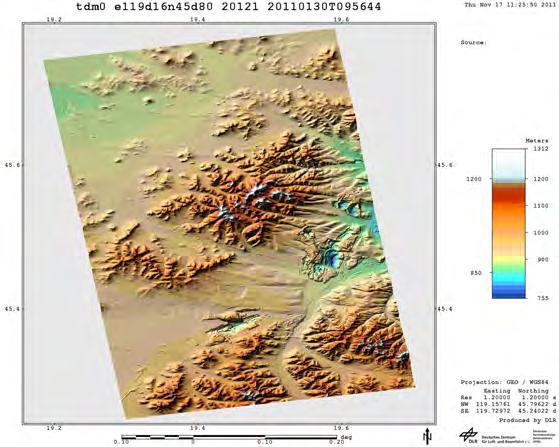
14 Collection of Input Material to the Trialogue Workshops where translations were required. However, one-to-one contacts between GeoZS and the translating partner worked extremely well and efficiently. Language: The language used in the first draft of the Sokolov booklet was too technical, and was not simple enough for the target audience. We managed to improve this in the introductory parts of the booklet, however, in the Products Chapter the language could not be simplified to the desired level due to shortage of time and the absence of non-scientist opinion. This was improved in the following two booklets. Collection of data and creating EO-PRODUCTS: The process for collecting the data, creating the EO products and compiling the product sections of the booklets has already been briefly described in this report. This process differed between Sokolov and the following two workshops in South Africa and Kyrgyzstan. For Sokolov, GeoZS contacted the data suppliers in the project and requested them to provide outputs that could be included in the booklet. In parallel, BGS requested that all partners supply them with raw and processed data so that the products could be produced to a set standard, and subsequently reformatted (where appropriate) for inclusion in the booklet. This parallel process resulted in both standard and non-standard EO products being included in the Sokolov booklet; however this was rectified for South Africa and Kyrgyzstan where BGS stipulated that they alone were supplied with the raw data and subsequently developed all of the products to an agreed standard and template. Expertise in public engagement was utilised in BGS to simplify both the graphics and the text interpretation so that the full range of stakeholders could understand the products. The process for developing the products is described in the EO-MINERS Deliverable 4.1, the EO Product Review (Jordan et al., 2013). The choice of which product to make was defined by the EO Product Matrix; a decision-making tool that integrated various facets of the project including the Conceptual Site Models, the Indicator list, the available EO data and the expertise available in the project. Once it was agreed that a product should be made for a particular test site, the partners were informed of what data were required of them, and in what format it should be delivered to BGS. For example, some data were vector files such as ESRI shapefiles while others were raster files such as an ERDAS Imagine satellite image. It was acknowledged that some partners did not have access to the full suite of software so BGS accepted other formats of data e.g. MSOffice spreadsheets, which they subsequently converted to an appropriate format. Various types of product were produced by BGS including: 1. Paper maps (A0 and A3) 2. Digital maps (two-dimensional GeoPDF format) 3. 3D PDFs 4. GoogleEarth visualisations (KML/KMZ format) 13
15 Collection of Input Material to the Trialogue Workshops 5. Digital 3D visualisations (in GeoVisionary format) 6. Animated fly-throughs The first step in product creation was to process the data so that they could be manipulated in a project GIS (the project agreed to use ESRI ArcMap10 as the standard) and that they conformed to INSPIRE standards, where appropriate. This process ranged from relatively simple operations, such as reprojecting the data, to more complex actions such as reprocessing multispectral or hyperspectral data or defining derivative outputs from data, such as deriving potential drainage patterns from terrain models. A map template (agreed by relevant partners) was produced in ArcMap (Fig. 1). The template included standard map layout components such as north arrow, scale bar, legend, description and title. Moreover, it was agreed that only the project logo would appear, rather than all of the partners logos. The appropriate EO data were integrated and visualised in the GIS and displayed in the template. Fig. 1: EO-MINERS Map template The maps were included in the Sokolov booklet in the standard template (shown above) along with some additional outputs provided directly to GeoZS by some project partners. However for the following booklets all of the products were made by BGS using the project 14
16 Collection of Input Material to the Trialogue Workshops template. In order to display the maps in the A4 booklets, BGS reformatted them across two A4 pages with the graphic data on one page and the explanatory text on the facing page. By nature of the hardcopy format of the booklets, the additional product formats (2 to 6 above) could not be included in the booklets, however they were presented at the workshops as live interactive displays RECOMMENDATIONS Key learning and recommendations arising from the preparation of the booklets include: - one partner with appropriate skills should be designated for the preparation of all technical aspects of the booklet; - responsibilities and deadlines should be set at least 3 months ahead of the final deadline; - allow at least 2 weeks for final editing and proof reading; - only one partner should be responsible and a major contact point for the compilation; only this partner should distribute workload, including translation. - allow time for last-minute technical difficulties such as fonts, large size of the final pdf file, transfer of large files, incompatibilities between different character sets or systems or similar. 15
17 Collection of Input Material to the Trialogue Workshops 3. List of contributors to the booklets Many authors generously gave their time, energy and resources in order to contribute to the successfully produced booklets. However, it was not possible to extensively describe each of the partners role, so we are providing such list at this place. SOKOLOV BOOKLET: Compilation of the booklet: Žibret Gorazd, GeoZS. Title: Hejny Horst, MIRO EO-MINERS project introduction: Hejny Horst, MIRO; Žibret Gorazd, GeoZS. Dialogue with stakeholders: Wittmer Dominic, WI. Indicators of mining impact: Hejny Horst, MIRO; Žibret Gorazd, GeoZS. Sokolov demonstration site-specific indicators: Falck W.Eberhard, UVSQ. EO-MINERS outputs: all EO-MINERS partners; main contact for each specific product is provided in the booklet. Revising and simplifying the text in introductory chapters: Falck W.Eberhard, UVSQ. Revising the text in introductory chapters: Hejny Horst, MIRO; Chevrel Stephane, BRGM. Design and front cover: Ferriday Sadie, MIRO; Teršič Tamara, GeoZS. English check: McEvoy Fiona M., BGS. Translation into Czech language: Kopačkova Veronika, Jelenek Jan, Mišurec Jan, CzechGS. WITBANK BOOKLET: Compilation of the booklet: Teršič Tamara, GeoZS. Formulation of Chapters 1 4 (based on Ch. 1 4 of the Sokolov booklet): Falck W.Eberhard, UVSQ. Revision, comments and inputs regarding Chapters1 4: Falck W.Eberhard, UVSQ; Wittmer Dominic, WI; Hejny Horst, MIRO; Jordan Colm J., BGS; Coetzee Henk, CGS; Chevrel Stephane, BRGM; Fischer Christian, DLR. Integration of comments on Chapters 1 4: Wittmer Dominic, WI. Improvements in the text of Chapter 5: Wittmer Dominic, WI. Compilation of Chapter 5 (EO-MINERS products): Jordan Colm J., Grebby Stephen R., BGS. Front cover: Ferriday Sadie, MIRO. Design: Teršič Tamara, GeoZS. English check: McEvoy Fiona M., BGS. Final checking: Žibret Gorazd, GeoZS. MAKMAL BOOKLET: Compilation of the booklet: Teršič Tamara, GeoZS. Adjustment of country-specific information in Chapters 1 4: Falck W.Eberhard, UVSQ. Revising and improving text in Chapters 1 4: Wittmer Dominic, WI. Compilation of Chapter 5 (EO-MINERS products): Jordan Colm J.,Grebby Stephen R., BGS. Checking and corrections of the final draft: Chevrel Stephane, BRGM, Žibret Gorazd, GeoZS. Translation into Russian language: Kylychbaev Ernis, CAIAG. English check: McEvoy Fiona M., BGS. Design and front cover: Teršič Tamara, GeoZS. Final checking: Žibret Gorazd, GeoZS. 16
18 Collection of Input Material to the Trialogue Workshops 4. Conclusions This report describes the process of collecting input materials to the workshops and presents the results of this process the presentations in their final version (as presented in SA, KG), and the three booklets, which were successfully compiled on time and distributed among the participants of the workshops. In the booklets a selection of the most representative examples from the large amount of data that were developed using Earth Observation techniques within the EO-MINERS project, and that aim to address the prioritised environmental issues related to indicators, are presented. The booklets present site-specific results to date and proposed approaches with a view to gathering comments on the usefulness of EO products from stakeholders. 17
19 Collection of Input Material to the Trialogue Workshops 5. References FALCK, W.E., REICHEL, V., ZELENKOVÁ, K., HANISE, B., KYLYCHBAEV, E. (2012a): Corporate Policies in a Mineral Extraction Context. Earth Observation for Monitoring and Observing Environmental and Societal Impacts of Mineral Resources Exploration and Exploitation, CEC FP7 Project EO-MINERS, Deliverable D1.1-1 (updated 2012) FALCK, W.E., REICHEL, V., ZELENKOVÁ, K., HANISE, B., KYLYCHBAEV, E. (2012b): Civil Society Policies in a Mineral Extraction Context. Earth Observation for Monitoring and Observing Environmental and Societal Impacts of Mineral Resources Exploration and Exploitation, CEC FP7 Project EO-MINERS, Deliverable D1.1-2 (updated 2012). JORDAN, C., GREBBY, S. (2013): EO Product review. Earth Observation for Monitoring and Observing Environmental and Societal Impacts of Mineral Resources Exploration and Exploitation, CEC FP7 Project EO-MINERS, Deliverable D4.1. WITTMER, D., JELÉNEK, J. (2013): Trialogue Workshop in the Czech Republic, Summary and Results, CEC FP7 Project EO-MINERS, Deliverable D5.6. WITTMER, D., ŠOLAR, S., SCHEPELMANN, P., HANISE, B., JELÉNEK, J. (2013): Final Report on Information Needs and Indicators. Earth Observation for Monitoring and Observing Environmental and Societal Impacts of Mineral Resources Exploration and Exploitation, CEC FP7 Project EO-MINERS, Deliverable D
20


21 EO-MINERS Earth Observation for Monitoring and Observing Environmental and Societal Impacts of Mineral Resources Exploration and Exploitation Stéphane CHEVREL Project Coordinator BRGM, France Mineral Resources Div. The EO-MINERS project EO-MINERS is a Research and Technological Developement project funded by the European Commission To help EC improve its raw material policy and better exploiting mineral resources from the European territory To demonstrate how to improve the capacity of Europe in implementing new mining sites To improve interaction between the mining industry and society Economic importance of minerals The mining and extractive industry play a significant role in the development of many countries all over the world Mining, and the industries it supports, is a basic building block of a modern society EU-25 non-energy extractive industry direct turnover of about 40 billion employment to about 250,000 Significantecologicalfootprintof mining 1 kg Gold requires 540,000 kg, a large share of which is due to extraction Steel: 21 (1 kg of steel carries an ecological rucksack of 21 kg), Aluminum: 85, Diamond: 53,000,000, Recycled Aluminum: 3.5, Rubber: 5 The average tonnage imported/tonnage mining waste ratio increased from 1:4 to 1:16 in the past 25 years EO in the Mineral Resource Development Cycle Overall objective Earth Observation (EO) offers a unique opportunity to collect spatial parameters to monitor and assess each phase of the mining cycle Spaceborne and airborne imagery Ground and airborne geophysics Geochemistry In situ measurements Monitoring networks 3D modelling to bring into play EObased methods and tools to facilitate and improve interaction between the mineral extractive industry and society for its sustainable development while improving its societal acceptability. Mining vs Society After Solar and Shields,

 Bureau de Recherches Géologiques et Minières France Coordination British Geological Survey Tel-Aviv University UK Israel Beneficiary name Country Council for")
22 Scientific objectives - 1 Assess policy requirements at macro (public) and micro (mining companies) levels Number of indicators Define environmental, socio-economic, societal and sustainable development criteria and indicators to be possibly dealt with EO Scientific objectives - 2 Demonstrate the capabilities of integrated EObased methods and tools in: monitoring, managing contributing to reducing the environmental and societal footprints of all phases of a mining project Mineral Mapping Sokolov (CZ) Where we work? Who we are? Beneficiary name Country (BRGM) Bureau de Recherches Géologiques et Minières France Coordination British Geological Survey Tel-Aviv University UK Israel Beneficiary name Country Council for Geoscience South Africa Anglo Operations Limited, Anglo Technical Division South Africa CZ(2) DE(2) KG(2) UK(2) â FR(2) Université de Versailles St Quentin France Deutsches Zentrum für Luft und Raumfahrt e.v. Germany Česká Geologická Služba Czech Republic Wuppertal Institut für Klima, Umwelt, Energie GmbH Germany Sokolovská Uhelná a.s. Czech Republic Geoloski Zavod Slovenije Slovenia Central Asian Institute for Applied Geoscience Mineral Industry Research Organisation UK KyrgyzAltyn â SI(1) IL(1) ZA(2) Kyrgyzstan â 3 demonstration sites (CZ, ZA, KG) Kyrgyzstan Our general approach What are the methods we use? EO methods and tools Expert knowledge Indicators EO-based monitoring products On-site investigations In situ measurements Stakeholder interviews Airborne data acquisition Satellite imagery Trialogue workshops Stakeholder feedback Integration of satellite, airborne and in situ monitoring tools and methods 2
23 Project T0 Affected Environment Environment Project Tn Affected Environment Environment Environmental and societal impacts Societal acceptability Environmental and societal impacts Societal acceptability Pathways Transfer media Pathways Transfer media EO and GIS in societal acceptability a simplified conceptual model Affected Populations Populations EO and GIS in societal acceptability a simplified conceptual model Affected Populations Populations (Last but not least) Scientific objectives - 3 initiate and develop a sound "trialogue" between industrialists, regulatory bodies and society based on reliable and objective information about ecosystems, populations and societies affected by mining activities 3
24


25

26


27

28
29 The impacts of mining operations can be complex. Why indicators for mining impact? The effects of decisions made by the different actors are difficult to assess and predict. The absence of reliable and objective site data may complicate monitoring and assessment. Meaningful information on complex issues can often be more easily understood in the form of indicators. Indicators measure the state of complex systems, or Indicators allow to follow trends, when observations are repeated over time. The properties of indicators Indicators must be based on measurable quantities in order to be useful. However, every process of indicator selection inevitably results in a gain in clarity, but also a loss of information. Indicators need to have a number of specific qualities and properties Indicators must have a clearly defined purpose. Indicator development is a social process and not an engineering one. Stakeholder define what has to be indicated for whom and why. 1

30 EO-Miners indicator development process A multi-pronged approach was chosen in EO-MINERS. The approach consisted of the development of an initial set of indicators by technical experts. At the same time, site-specific conceptual models were developed. Stakeholders at the study sites were interviewed and the set of indicators updated as a result These three processes ran in parallel and through several loops of iterations at the study sites. A consolidated set of candidate indicators for each of the study sites resulted. The proposed set of indicators was reviewed by Earth Observation specialists in order to assess their measurability. EO-Miners indicator development process 2

31 EO-Miners candidate indicators A. Land-use B. Mass and energy flows C. Air-quality and other nuisances D. Soil quality E. Water quality F. Transport G. Geotechnical hazards and accidents H. Industrial and other accidents I. Social impact J. Regional development K. Economic vulnerability/resilience Site-specific candidate indicators Only indicators that can be measured using EO techniques have been retained for further work at the study sites The set of indicators varies from study site to study site 3
32 Sokolov-specific indicator development In 2010 a group of EO-MINERS project scientists visited the Sokolov region and undertook interviews with various stakeholders. Notes were taken during these interviews. The views or concerns expressed and information needs related were compared to the set of candidate indicators. This allowed to evaluate whether an appropriate selection of them would reflect those views, concerns and needs. Causes Acid mine drainage (AMD) Windblown coal dust, gaseous emissions Mine operation AMD sources/buffer material Environmental issues Indicators Water quality &soil properties Atmospheric pollution Overburden instability Landslide Self-combustion of coal Sokolov-specific indicators E. Water quality E4: Acid drainage generation potential D. Air qualitiy D1: Aerosols (particle concentrations in off-site air Land degradation/loss A. Land-use A1: Total land-use by mining A4: Residentail land-use A6: Sites set aside, protected areas A8: Recultivation success on mined-out areas etc. A9: Soil fertility of remediated areas Water quality &soil properties Coal fires B. Mass Flow B1: Waste volumes generated B. Geotechnical hazards and accidents G3: Dam stability G. Geotechnical Hazards and Accidents G4: Underground and mining waste deposit fire 4


33 EO-MINERS Earth Observation for Monitoring and Observing Environmental and Societal Impacts of Mineral Resources Exploration and Exploitation Dominic WITTMER Wuppertal Institute, Germany Material Flows and Resource Management WP1 Policy Analysis & Indicator Identification Minerals Extraction and the Society EO-MINERS Workshop Sokolov, CZ, 21 March 2013


34 Industrial Production of the EU drives Economy and Employment while Depending on Raw Materials Most sectors, such as construction, chemicals, automotive, aerospace, machinery and equipment sectors that provide in the EU a total value added of billion, and employment for some 30 million people, depend on unimpaired access to raw materials. 2 Source: ETP-SMR
35 Industrial Production Requires Increasingly Extensive Supply Chains: High Dependency on Several Levels Automobile Space Aircraft Electronics & IT White goods Infrastructure construction Food & Drink Manufacturing Construction Chemicals/Pharma Machinery Agriculture Energy Ferrous metals Non-ferrous metals Ind. minerals Ornamental stones Aggregates Oil Gas Coal Mineral resources, material science and technology Source: after ETP-SMR
36 Growing Import Dependency of EU27 EU27 net import (import-export) - Eurostat Billion US $ Year Million tonnes 4 Metallic minerals (13.1; 13.2) LHS in B$ Industrial minerals (14.2; 14.3; 14.4; 14.5) LHS in B$ Aggregates (14.1) LHS in B$ Metallic minerals ( ) RHS in Mtonnes Industrial minerals (14.2; 14.3;14.4; 14.5) RHS in Mtonnes Aggregates (14.1) RHS in Mtonnes Source: ETP-SMR


37 Conceptual Site Model for the Sokolov mining area Source: Palumbo-Roe B. et al.(2011)
38 Environmental Issues in the Sokolov Coal Mining Basin: Causes, Indicators, Parameters, and Potential for Remote Sensing Assessment Environ -mental Issues Water Quality Causes Indicators Measureable Parameters AMD Water quality: Acid drainage generation potential (distribution of sulphidic iron minerals) Distribution of secondary iron oxide minerals Distribution of minerals with neutralisation capacity Surface drainage map Contaminated surface waters Groundwater table and flow direction Relief maps Potential for Remote Sensing Assessment YES Hyperspectral airborne data, ASTER or Hyperion satellite YES Hyperspectral airborne data, ASTER or Hyperion satellite YES SRTM, LiDAR or elevation derived from stereo airborne photography or satellite imagery such as ASTER, GeoEye or WorldView-II YES - ground network required unless regional scale when GRACE satellite data could be utilised YES Any suitable scale elevation model and optical imagery such as SRTM/LiDAR and ASTER, SPOT, GeoEye, etc. Source: Palumbo-Roe B. et al.(2011)
39 Physical and Socio-Economic Diversity of the 3 Mining Sites The 3 Mining Sites CZ / SA / KG were selected to cover a variety of characteristics (selection): Physical Dimension Different mining commodities (Gold, hard coal, lignite) Mining type (open pit, underground) Altitude, remoteness, landscape Vegetation (precipitation, climate) Tailing Dam Socio-economic Dimension Mine as Employer Interlinkage with other sectors (agriculture, metal mining/energy, manufacturing) Transport (mode and distance) Integration of mine in Society Health issues
40 EO-MINERS Thank you for your attention
41 EO-MINERS Earth Observation for Monitoring and Observing Environmental and Societal Impacts of Mineral Resources Exploration and Exploitation EO Products Veronika Kopačková (CGS) Colm Jordan (BGS) Christian Fischer (DLR) Workshop SU a.s. March 2013 Basis of Remote Sensing Differences in chemical and physical properties Reflectance/ Emissivity: -in situ (field spectroradiometer s) remotely (air-born space-born sensors ) 1
42 What is Earth Observation? Acquisition of information about a body (without physical contact) Each type of EO provides different information, and best results are achieved when they are integrated Image Spectroscopy 2
43 Image Resolution Images to explain spatial and spectral resolution Hyperspectral vs. multispectral The acquisition of images in hundreds of registered continuous spectral bands such that for each picture element it is possible to derive a complete reflectance spectrum (Goetz 1983). 3
 EnMAP Hyperion from space DAIS 7915 reflective; from 3000 m DAIS 7915 AHS thermal TM/ETM")
44 The Hyperspectral Cube Up to pix 1024 pix ~ 220 bands => spectral dimension! Optical Satellite Sensor Systems Number of spectral bands HyMap reflective AVIRIS (from m) EnMAP Hyperion from space DAIS 7915 reflective; from 3000 m DAIS 7915 AHS thermal TM/ETM thermal xs HRG xs TIMS (from 3200 m) IKONOS pan HRG pan LISS-1C ETM pan TM thermal detailed assessments, monitoring with infrequent coverage MODIS reflective MERIS full spatial resolution Large scale assessments, monitoring with frequent coverage MODIS thermal MERIS red spatial resolution AVHRR METEOSAT Spatial resolution (GSD in meter) 4
45 Satellite Large coverage Revisit at regular time Standardized image product Costs depends on the sensor system Merits of satellite, airborne and in situ EO techniques Airborne Customized sensor system Flexible survey (time, flight parameters) Standardized image product but need expert knowledge for processing Comparable expensive In-situ measurements Point measurements (spatial interpolation needed often ill posed) Time (and cost) intensive for large areas Link Between Indicators and Earth Observation Products Conceptual model causes Indicators for each site Available EO data Parameters measurable with EO Project Resources EO Products 5
46 Sokolov-specific Indicators EO data collected at Sokolov EO Source Dataset Data type Satellite Airborne In situ ASTER Cartosat 2009, 2010, 2012 ALI HyMAP 2009 & 2010 AHS 2011 CASI 2011 Orthophoto mosaic ASD spectra TIR spectra Temperature measurements Dust measurements Geology and Land-cover 15 bands VNIR SWIR TIR a 30 m DEM 5 m DEM 7 bands VNIR SWIR, 1 pan Hyperspectral VNIR - SWIR Multipectral TIR Hyperspectral VNIR Aerial photographs and 10 m DEM Spectral library Spectral library 6


47 Standardized Pre-processing of Airborne Data HyMap 2010, reflektance AHS 2011, emissivity preprocessing & validation of VIS-SWIR Standardized pre-processing of Reference Measurements reflectance measurements (lab) of goethite samples measured vs. library spectra of goethite resampled measurements vs. HyMap image spectrum 7
")


48 Mineral Mapping (VIS-SWIR) flooded lignite mine Mineral Mapping (VIS-SWIR) Clay minerals, goethite Jarosite+goethite Jarosite Jarosite+lignit e Lignite - weathered Lignite - fresh surface ph model 8
49 Mineral Mapping (TIR) Lake Medard blue: quartz yellow: clay Sokolov Product List Validated Products Indicator Dust pollution and vegetation health Acid mine drainage contamination potential Spatial distribution of iron oxides possibly associated with acid mine drainage Fe content of water and acid mine drainage Soil composition and acid mine drainage-producing minerals Air Quality: aerosol concentration in off-site air Land-use: recultivation success on mined-out areas Water Quality: acid drainage generation potential Water Quality: acid drainage generation potential Water Quality: acid drainage generation potential Soil properties and water quality: acid drainage generation potential and Soil fertility These products are displayed around this room for you to study at your leisure 9
50 EO Product Types Project results are provided in a number of form, each designed to explain results to a range of stakeholders Reports Digital layers Paper maps Digital maps Animated fly-throughs Many layers of information are collected, processed and combined to make each product. We will now describe how some Sokolov products were made Each with associated information and validation histories EO Product 1 Dust pollution and vegetation health 10

51 EO Product 2 - Mineral Mapping used for water quality assessment Feedback and Ideas Thank you for your attention We are happy to hear any feedback and ideas Questions & Discussion Please take some time to look at the products displayed in this room 11
52 Latest products by TAU Sokolov
53 The Apparent Thermal Inertia (ATI) of soils as retrieved from AHS airborne overpass. High values may indicate on high or low soils density with high water content, whereas low values may indicate on high or low soils density with low water content.

54 A change detection map based on two HyMap images acquired over in summers 2009 and The map highlights the changed areas with a specific color indicating the category of the new land cover type. In that way we can recognize all the areas that were changed to water, coal, soil, vegetation and so on.
55 Clay and Quartz content of the exposed soil in the surroundings of the mine. The classification is based on the emissivity spectrum, which was generated from the Airborne Hyperspectral Scanner (AHS). As can be seen, the dominant mineralogy of the surface is of a clayish nature (blue and green areas).

56 The following two maps show the concentration of C-rich + Fly Ash and Silicates in settled dust particles in the surroundings of the mine. The data for this map was obtained from spectral measurements combined with chemical analysis of samples taken from dust traps distributed in the Sokolov area.

57
58 Detection of Silicates and C-rich + Flying Ash in Dust by NIR Spectroscopy Ido Livne 1. Spectra of dust samples from the Sokolov mine area where extracted by subtracting blank spectrum (glass Petri dish on a dark polymeric material) from the original measured spectrum (slide no. 2). 2. The samples spectra where visually inspected. One main characteristic found is the spectrum s trend between the edge of the red region and the edge of the NIR region. A spectral index to determine this trend was applied by dividing the reflectance value at 1300nm with the reflectance value at 700nm. This was named Spectral Trend Index 1300/700 (STI1300/700) (slide no. 3). 3. Samples with very low spectral signal where left out (slide no. 3). These samples also have a low percentage of total measured dust area in the chemical analysis. 4. To calibrate spectral data with the chemical data, the STI1300/700 of the remaining 8 samples was compared to various chemical measurements made by the British Geological Survey (BGS). A correlation to silicate concentrations in the dust and to C-rich dust + flying ash was found (slide no. 4). 5. Given the small amount of data sets, validation of the results was somewhat problematic. Despite of that, some validation was possible as each location contained at least one additional sample (this sample was spectrally measured but not chemically). The assumption is that the STI1300/700 of each of those samples should be correlative to the chemical measurements results of other samples from the same locations (slide no. 5).
59 Extraction of the dust spectrum from the measurement: a blank measurement is subtracted from the original measurement to obtain the dust spectrum
60 Spectra of the chemically analyzed dust samples: certain samples have a positive trend between 700 nm and 1300 nm while others have a negative trend in this region. 3 samples with very low signal where excluded from the calibration process (marked in blue at the bottom). 700 nm 1300 nm
61 Results The STI1300/700 was found to be correlative to the following chemical composition: 1. Percentage of Silicates in the sample. 2. Percentage of C-rich + flying ash in the sample. Mes name Spec name Spectral Trend Index 1300/700 Silicates% C-rich + Fly Ash% T2-5 11_S T _S T _S T _S T _S3* T _S T _S3* T2-20 7_S Correlation between STI1300/700 and the % of total measured features of Silicates and C-Rich + Ash R² = % Total features Silicates% C-rich + Fly Ash% R² = Spectral Trend Index 1300/700
62 The STI1300/700 of the additional samples in each location was found to be correlative to the percentage of Silicates and percentage of C-rich + flying ash measured in other samples from the same location % Total Features - original sample Correlation between STI1300/700 of second samples and the % of total measured features of Silicates and C-Rich + Ash of the original samples R² = R² = Silicates% C-rich + Fly Ash% STI1300/700 - second sample
63 Conclusions Dust samples with a positive trend between 700 nm and 1300 nm are C-rich, contain a significant amount of ash and a relatively low amount of silicates. Dust samples with a negative trend between 700 nm and 1300 nm are low in Carbon, contain small amounts of ash and are rich in silicates. C-rich + flying ash% in a dust sample can be determined by entering the 1300nm/700nm spectral ratio to the equation y = x Silicates% in a dust sample can be determined by entering the 1300nm/700nm spectral ratio to the equation y = x The results presented here are primary, to establish a statistically significant spectral model, further measurements are needed.
64 Using Hyper- Multi- spectral Remote Sensing in the Thermal region for classifying soil s mineralogy and assisting in monitoring the environmental impacts caused by mining activities Gila Notesco (a), Eyal Ben Dor (a), Ido Livne (a), Simon Adar (a), Veronika Kopačková (b), Christian Fischer (c), Christoph Ehrler (c), Gregoire Kerr (c), Henk Coetzee (d), Stephan Chevrel (e) (a) Remote Sensing Laboratory, Tel Aviv University (b) Remote Sensing Unit, Czech Geological Survey (c) German Remote Sensing Data Center Applied Spectroscopy Group, German Aerospace Center (d) Environmental Geoscience Unit, Council for Geoscience (e) Bureau de Recherches Géologiques et Minières

65 Part of EO-Miners FP7 To investigate how hyper- multi- spectral technology in the Thermal, Long Wavelength InfraRed, region can contribute to the mapping of mining areas.

66 Soils spectra and mineralogy The spectra of about 90 soil samples, collected in IL, CZ and ZA, were measured IL_C5 IL_A5 ZA_WI05 ZA_WI07 CZ_PVS1004 CZ_KA1004 VNIR-SWIR region Reflectance Carbonates CO 3 group Iron oxides Clay OH group WVL However, the Si-O group, an important class of soil mineralogy, is not represented in the VNIR-SWIR region. Therefore,
 + (1-ε λ )L dλ Radiance (at ground sensor)= Target emission + Reflected downwelling flux L bbλ (T) of each soil sample was selected by fitting its radiance with a tangent Planck s")
67 The LWIR spectra of Soils The radiance in the LWIR (8-12µm) region of each soil sample was measured with a spectroradiometer SR L λ = ε λ L bbλ (T) + (1-ε λ )L dλ Radiance (at ground sensor)= Target emission + Reflected downwelling flux L bbλ (T) of each soil sample was selected by fitting its radiance with a tangent Planck s curve, L dλ was measured with a reflective mirror and the soil s emissivity (ε) was calculated: ε λ = (L λ - L dλ )/(L bbλ (T) L dλ ) 1.4E E Radiance (W m -2 sr -1 m -1 ) 1.0E E E+06 CZ_PVS1004 CZ_KA K 321K 323K 325K Mirror (downwelling radiance) Emissivity CZ_PVS1004 CZ_KA E E WVL WVL 8.3µm&9.1µm Quartz s Si-O features 9.4µm Clay s Si-O feature
68 The emissivity spectra of soils Emissivity IL_A5 ZA_WI04 ZA_WI05 ZA_WI03 ZA_WI07 Clay rich According to XRD Quartz rich Emissivity CZ_PVS1004 CZ_PVS1013 CZ_KA1005 CZ_KA1002 CZ_KA1004 Clay rich According to XRD Quartz rich WVL 8.3µm 9.4µm WVL 8.3µm 9.4µm Changing from Clay rich soil to Quartz rich soil is expressed in the emissivity (Ԑ) spectra: Ԑ(λ=9.4µm)-Ԑ(λ=8.3µm) Ԑ(λ=9.4µm)-Ԑ(λ=8.3µm) Clay rich soil more negative Clay rich soil more negative Quartz rich soil more positive Quartz rich soil more positive
, 7 bands in the MWIR region (3.18-5.")

69 Sokolov, the Czech Republic, 2011 campaign- AHS (Airborne Hyperspectral Scanner ) AHS- 63 bands across the VNIR-SWIR region ( µm), 7 bands in the MWIR region ( µm) and 10 in the LWIR region ( µm). AHS sensor was flown onboard a CASA 212 aircraft and operated by trained operators from INTA. Day and night flights, 3 days apart, during July AHS image
 1.1E+07 1.0E+07 9.0E+06 8.0E+06 7.0E+06 LWIR day 2.0E+07 6.0E+06 Soil Conifers Water 0.0E+00 0.4 0.")
70 VNIR-SWIR AHS day ( ) images LWIR Radiance (W m -2 sr -1 m -1 ) 1.2E E E E E+07 VNIR-SWIR Soil Conifers Water Radiance (W m -2 sr -1 m -1 ) 1.1E E E E E+06 LWIR day 2.0E E+06 Soil Conifers Water 0.0E WVL 5.0E WVL
 τ λ + (1-ε λ )L dλ τ λ + L pλ Radiance (at-sensor)= Target emission + Reflected downwelling flux + Path radiance with: τ λ")
71 AHS night ( ) image 1.1E+07 LWIR night 1.0E+07 Radiance (W m -2 sr -1 m -1 ) 9.0E E E+06 Water Conifers Soil 6.0E E WVL The at-sensor radiance of each pixel: L sλ = ε λ L bbλ (T) τ λ + (1-ε λ )L dλ τ λ + L pλ Radiance (at-sensor)= Target emission + Reflected downwelling flux + Path radiance with: τ λ =atmospheric transmission Required: a target s surface temperature (T) and its emissivity (ε)
72 Temperature estimation from AHS LWIR data L sλ = ε λ τ λ L bbλ (T) + (1-ε λ )L dλ τ λ + L pλ The emissivity of soil, vegetation and water is approximately 1 for most of the LWIR region. Thus, Target emission is dominant, Reflected downwelling flux is negligible and Path radiance is relatively small. The at-sensor radiance (L s ) of each pixel in the LWIR image was fitted with a tangent L bb (T) curve and the appropriate surface temperature was extracted (by applying an IDL algorithm). 8.5E E E+06 Radiance (W m -2 sr -1 m -1 ) 7.0E E E E E+06 Water Conifers Soil Water fitted Lbb(288K) Conifers fitted Lbb(279K) Soil fitted Lbb(278K) 4.5E WVL

73 Day surface temperature, as estimated from AHS LWIR data The temperature differences between the estimated values and the measured values are 1-3 C. These differences might be the result of inaccuracies either in the estimated temperatures or in the measured temperatures.

74 Night surface temperature, as estimated from AHS LWIR data The temperature differences between the estimated values and the measured values are 0-2 C. An application of ΔT (day-night):

75 Apparent Thermal Inertia (ATI) ATI=(1-Albedo)/ΔT is commonly used to describe the resistance of a material to temperature changes, higher resistance smaller ΔT larger ATI. Soil typical ATI- few percentages ; Soil water content increases Soil ATI increases ATI of soils, as calculated from day&night AHS data
 Water body typical ATI- few tenths ; Water body turbidity increases Water body ATI")
76 Apparent Thermal Inertia (cont.) Water body typical ATI- few tenths ; Water body turbidity increases Water body ATI decreases ATI of water bodies, as calculated from day&night AHS data
77 ATI - soil/mineral ROIs, a possible moisture indicator Type Albedo ΔT (day-night) ATI Dry Soil\Mineral High Low typical range Dry Soil\Mineral Low High typical range Moist Soil\Mineral Lower Lower Higher heat capacity Higher 0.06 numbers= % humidity (measured) numbers=%moisture (measured) ATI Albedo
78 εmisivity calculation from airborne LWIR data L sλ = ε λ τ λ L bbλ (T) + (1-ε λ )L dλ τ λ + L pλ The emissivity of water and conifers is approximately 1 for the LWIR region Emissivity Water emissivity (ENVI SLIB.) Conifers emissivity (ENVI SLIB.) WVL Thus, the at-sensor radiance of water and conifers can be written as: L sλ = ε λ L bbλ (T) Gain λ +Offset λ with: Gain λ = τ λ (atmospheric transmission)+ and Offset λ =L pλ (path radiance)+

79 εmisivity calculation from AHS LWIR data Gain and Offset were calculated for water and conifers ROIs in the day or night AHS image Conifers ROI Water ROI Gain gain night gain day offset night offset day 3.4E E E E E E E E E E E E+05 Offset WVL Day curves shape Night curves shape, reflects cloudy day vs. clear night -2.0E+05 The Gain and Offset, as calculated for water and conifers, were applied to the entire day or night image and the emissivity of each pixel was calculated: ε λ = (L sλ - Offset λ )/(L bbλ (T) Gain λ )

80 Emissivity, as calculated from AHS night data 1.00 The emissivity spectra of 3 soil ROIs CZ_MD1102D CZ_MD1103A CZ_MD1101B Emissivity WVL Emissivity The emissivity spectra of 4 soil ROIs CZ_DR1102A CZ_DR1102D CZ_DR1102F CZ_DR1102G WVL To validate the results, the emissivity spectra of these soil ROIs were calculated from ground measurements


81 The emissivity of soils, from ground measurements 1.00 Spectroradiometer SR-5000 collected samples measurements 0.98 Emissivity WVL Quartz rich soil Clay rich soil CZ_DR1102A CZ_DR1102D CZ_DR1102F CZ_DR1102G CZ_MD1102D CZ_MD1103A CZ_MD1101B Emissivity µftir spectrometer field measurements Clay rich soil CZ_DR1102A CZ_DR1102D CZ_DR1102F CZ_DR1102G CZ_MD1102D CZ_MD1103A CZ_MD1101B WVL Quartz rich soil Although the SR-5000 emissivity curves are not identical to the µftir emissivity curves, two types of soil can be noticed, Clay rich soils and Quartz rich soils.
82 The emissivity of soils, as calculated from AHS data and from ground measurements Emissivity CZ_DR1102F_AHS CZ_DR1102F_SR5000, resampled to AHS config. CZ_DR1102F_FTIR, resampled to AHS config. CZ_MD1103A_AHS CZ_MD1103A_SR5000, resampled to AHS config. CZ_MD1103A_FTIR, resampled to AHS config WVL 8.77µm 9.68µm The emissivity curves, as calculated from the AHS data are similar to the emissivity curves from the ground measurements. A distinction between Clay rich soil and Quartz rich soil can be done according to: Clay rich soils with Ԑ(λ=9.68µm)-Ԑ(λ=8.77µm)<0, Quartz rich soils with Ԑ(λ=9.68µm)-Ԑ(λ=8.77µm)>0. This distinction can be used for the mapping of the Clay and Quartz content in soils in the Sokolov area
-Ԑ(λ=8.")
83 Clay and Quartz content in exposed soils, based on the Ԑ(λ=9.68µm)-Ԑ(λ=8.77µm) value, as calculated from AHS night data.
84 Conclusions Ground Thermal (LWIR) hyperspectral data analysis was performed for the determination of Clay and Quartz content in soil samples. An atmospheric correction of airborne Thermal (LWIR) multispectral data was performed for the purpose of evaluating the temperature and the emissivity of the surface. Some important parameters such as Apparent Thermal Inertia of soils and water bodies, Clay and Quartz content in soils were derived from the corrected data set. The TIR hyper- multi- spectral remote sensing may contribute an additional data layer to the mapping of the chemical and physical properties of mining areas and to assist to the monitoring of such areas.
85
86 EO-MINERS Earth Observation for Monitoring and Observing Environmental and Societal Impacts of Mineral Resources Exploration and Exploitation Introduction to EO-MINERS Products Dr Colm Jordan British Geological Survey
87 Understanding the Mining Area Potential Sources: Pits: dewatering (AMD) Washing plants: effluent (SO 4, metals) Dumps: water and air pollutants, dust, slope stability Underground works (fire, AMD, subsidence, sinkhole) Pathways: Surface water, surface runoff Groundwater Air Receptors: Towns, informal settlements, people (gases, dust, drinking water) Wetlands, terrestrial ecosystems, lake (water quality)
88 Product Development Environmental Issues Societal Issues Which issues can be monitored with EO? What EO did we collect here Products Today we will show you a selection of different types of product and ask for your feedback
89 We have 9 products to show you, grouped into 4 categories* Land Use Air quality Water Quality Geohazards *the full list is in Table 1 of your booklets
90 EO Product List *the full list is in Table 1 of your booklets Category Land Use Air Quality Related Product Change of mining footprint through time Residential land use around mining areas Urban footprint Mining and areas of ecological importance Distribution of antimony (Sb) dust Distribution of chromium (Cr) dust Distribution of vanadium (V) dust Distribution of barium (Ba) dust Water Quality and Land fragmentation Acid Mine Drainage (AMD) contamination potential Density of roads per km 2 Geohazards Geotechnical hazards and ground stability Geotechnical hazards: mining-related fires
91 Types of Product Paper maps Digital maps (PDF) that you can use on any PC or even an ipad Three dimensional views GoogleEarth files will be available from
92 How the product demonstrations will work today 10 minute presentation on each product 15 minutes interaction Feedback (Break for lunch during product demos) Wrap-up session
93

94 EO-MINERS Earth Observation for Monitoring and Observing Environmental and Societal Impacts of Mineral Resources Exploration and Exploitation Introduction to EO-MINERS Products Dr Colm Jordan British Geological Survey
 Pathways: Surface water, surface runoff Groundwater Air Receptors: Towns Shallow and deep groundwater")
95 Understanding the Mining Area Conceptual Site Model Makmal Pit source Potential pathway Active and future tailings dam source Plant source Potential pathway Town receptor Potential pathway Potential Sources: Plant: cyanide Tailings dam: water pollutants, dust Dam stability: leakages (CN, metals) Pathways: Surface water, surface runoff Groundwater Air Receptors: Towns Shallow and deep groundwater Ecosystem


96 Product Development Environmental Issues Societal Issues Which issues can be monitored with EO? What EO did we collect here Products Today we will show you a selection of different types of product and ask for your feedback
97 We have 7 products to show you, grouped into 3 categories* Cadastral & Land information Water Quality Geohazards & Radioactivity *the full list is in Table 1 of your booklets
98 EO Products *the full list is in Table 1 of your booklets Category Related Products Cadastral & Land information Cadastral information Change of the mining footprint through time Air and surface water contamination potential Water Quality Soil and surface water contamination potential Cyanide concentration in water bodies Geohazards & Radioactivity Tailings dam stability Radioactive Contamination
99 Paper maps Types of Product Digital maps (PDF) that you can use on any PC or even an ipad Three dimensional views GoogleEarth files Leaflets Video available from
 Wrap-up")
100 How the product demonstrations will work today Presentation on each product 15 minutes interaction Feedback (Break for lunch) Wrap-up session
101
102 EO-MINERS The Potential of Remote Sensing for Monitoring throughout the Minerals Lifecycle Christian Fischer, DLR Stuart Marsh, BGS European Stakeholder Dialogue on Impact Assessment of Mineral Exploration and Exploitation using Earth Observation Brussels, th September 2013 Presentation Outline - Short Introduction on Satellite Remote Sensing Sensor Systems - Earth Observation in the Mineral Resources Development Cycle - Quantitative mapping using hyperspectral data cubes - Surface information derived by high resolution SAR data - GEO - Conclusion & Outlook 1
 AVIRIS (from 20000 m) EnMAP MERIS WorldView-3 MERIS red spatial full spatial resolution TM/ETM+")
103 Sensor Systems Number of spectral bands HySpex HyMap reflective (from 3000 m) AVIRIS (from m) EnMAP MERIS WorldView-3 MERIS red spatial full spatial resolution TM/ETM+ resolution ASTER LDCM SPOT AVHRR ms IKONOS, World-View pan METEOSAT SPOT pan ETM pan TM thermal detailed assessments, monitoring with infrequent coverage MODIS reflective Large scale assessments, monitoring with frequent coverage MODIS thermal SAR Spatial resolution (GSD in meter) Relevant EO missions (selection) TerraSAR-X TanDEM-X FireBird RapidEye TerraSAR-X2 Tandem-L EnMAP MERLIN ERS-2 ENVISAT ADM-Aeolus EarthCARE Sentinel 1 Sentinel 2 BIOMASS CoReH2O PREMIER Earth Explorer 7 Sentinel 3 Sentinel 5p Sentinel-4 Sentinel
104 Copernicus Dedicated Missions: Sentinels Sentinel 1 SAR imaging All weather, day/night applications, interferometry Sentinel 2 Multispectral imaging Land applications: urban, forest, agriculture,.. Continuity of Landsat, SPOT Sentinel 3 Ocean and global land monitoring Wide-swath ocean color, vegetation, sea/land surface temperature, altimetry Sentinel 4 Geostationary atmospheric Atmospheric composition monitoring, transboundary pollution (payload on geost. satellite) Sentinel 5 Low-orbit atmospheric Atmospheric composition monitoring (Payload on polar orbiting satellite (S5 Precursor launch in 2014) , This year! EO in the Mineral Resource Development Cycle [ 3

105 Mining Life Cycle - Stakeholder Engagement - Mineral Exploration - Deposit Evaluation, EIS - Mine Development - Operations - Closure, Rehabilitation and Remediation - 2D/3D Environmental visualisation (optical data and elevation models) - Geologic mapping (optical & radar) - Mineral mapping (spectroscopy) - Detailed mineral mapping and characterisation (spectroscopy) - 3D Mine visualisation (optical, DEM) - Monitoring mine, environment, mine products and outputs (optical, DEM, spectroscopy, radar interferometry) - Environmental monitoring (optical, radar interferometry, spectroscopy) EO data collection - hierarchy of scales region catchment mining site Coarse scale regional data, national and EU levels Complex spatial interactions at ecosystem levels Intermediate level water balance parameter detailed information on land-cover and land-use High resolution data, geostatistical tools for spatialization of point data quantification of measured parameter & environment geo-chemistry 4


106 Quality assessment & Current Developments Hyperspectral vs. multispectral optical data The acquisition of images in hundreds of registered continuous spectral bands such that for each picture element it is possible to derive a complete reflectance spectrum (Goetz 1983). 5


107 Siderite Erzberg mine, Austria, lithology and iron-carbonate weathering intensity Siderite Erzberg mine, Austria, re-vegetation & monitoring 6
: Mission and Instrument Characteristics EnMAP Satellite Operational Lifetime: >5 years Orbit: 643 km @ 48 N (Sun-Synchronous)")


 Total Length per Day: > 5000 km Maximum Track Length: 1000 km Swath Width: 30 km Ground Pixel Size: 30 m 30 m TerraSAR-X")
108 EnMap (2017): Mission and Instrument Characteristics EnMAP Satellite Operational Lifetime: >5 years Orbit: N (Sun-Synchronous) Local Crossing Time Descending Node: 11:00 hrs ± 15 min Inclination: Orbit Period: ~ 98 minutes X-Band Downlink 320 Mbps SWIR Detector Array 900 nm < λ < 2450 nm Signal-To-Noise: 2200 nm Sampling: 10 nm Actively cooled: 150 K FPA: Mercury Cadmium Telluride Spectral 134 Dynamic range 14 bit VNIR Detector Array 420 nm < λ < 1000 nm Signal-To-Noise: 495 nm Sampling: 6.5 nm Thermally controlled to 0.1 K FPA: Complementary Metal Oxide Semiconductor CMOS FOV Separation 88 msec or 600 m Spectral 94 Pointing Capability: ±30 (±5 ) Target Revisit Time: 4 days (23 days) Total Length per Day: > 5000 km Maximum Track Length: 1000 km Swath Width: 30 km Ground Pixel Size: 30 m 30 m TerraSAR-X / TanDEM-X TerraSAR-X TanDEM-X TerraSAR-X ad-on for Digital Elevation Measurements -514 km altitude -11 days repeat orbit -Right looking, but rolling to left looking possible -Transmit & receive in H or V polarization (single / dual) -Experimental dual receive antenna mode Acquisition of a global DEM 7


109 TerraSAR-X / TanDEM-X TerraSAR-X / TanDEM-X 8
110 Change detection / TerraSAR-X Chuquicamata, Chile Mining and its impacts GEO Secretariat 9
111 GEO Structure GEO Work Plan : Observations & Infrastructure IN-01 Earth Observing Systems (inc. e.g. improved seismic network) IN-02 Earth Data Sets (inc. global, digital geological map of the world) GEO Structure GEO Work Plan : Societal Benefits SB-05 Impact Assessment of Human Activities EN-01 Energy and GeoResource Management 10
112 Conclusion & Outlook Remote Sensing (RS) data is among the panel of techniques that can significantly contribute to the Mineral Resources Development Cycle. EO imagery complements and optimizes conventional information and mapping techniques, without substituting for them and can be used to improve existing and often only selective approaches to a recording of environmental status and changes. Important aspects: data harmonization & linking existing geological information with RS data definition of data products, including meta-information, and improvement of processing work-flows within COPERNICUS & HORIZON

113 EO-MINERS The EO-MINERS process and experiences: How to provide suitable integrated EO products for environmental and societal impact assessment of mining activities? Minerals and society workshop Brussels, September 18-19, 2013 Stéphane CHEVREL Project Coordinator Social license The Social License has been defined as existing when a project has the ongoing approval within the local community and other stakeholders, ongoing approval or broad social acceptance and, most frequently, as ongoing acceptance. Social License is dynamic and non-permanent because beliefs, opinions and perceptions are subject to change as new information is acquired. Social license depends on the extent of the social, environmental and economic impacts of a project Source : Project T0 Affected Environment Environment Project Tn Affected Environment Environment Environmental and societal impacts Societal acceptability Environmental and societal impacts Societal acceptability Pathways Transfer media Pathways Transfer media EO and GIS in societal acceptability a simplified conceptual model Affected Populations Populations EO and GIS in societal acceptability a simplified conceptual model Affected Populations Populations The EO-MINERS view Why indicators for mining impact? Challenge in a societal acceptability perspective To define tools opposable during discussions between the parties = Mutually accepted documents dispassionately depicting the status and impact(s) of a project Need for objective, reliable, affordable and reproducible methods to identify, observe, characterise, measure and map these impacts and monitor them along time Based on protocols and standards that guarantee their quality and objectivity The impacts of mining operations can be complex. The effects of decisions made by the different actors are difficult to assess and predict. The absence of reliable and objective site data may complicate monitoring and assessment. Meaningful information on complex issues can often be more easily understood in the form of indicators. Indicators measure the state of complex systems, or Indicators allow to follow trends, when observations are repeated over time 1

114 Developing indicators framework Defining information requirements by stakeholders The development of meaningful indicators is a social and not an engineering process The social process defines what to indicate for whom and why We have to evaluate, whether a proposed indicator can be related to quantities measurable by EO Therefore, the development of indicators is a process iterating between stakeholder expectation and operational feasibility 7 Local stakeholder interviews Indicator development strategy Interview of Chet Bulak village authorities, Kyrgyzstan WP2 Technology assessment Technology Development Technology testing Expert elucidation WP1, WP5 Stakeholder elucidation Indicator A Indicator B Indicator X Indicator 1 Indicator 2 Indicator n Feasibility evaluation Feasibility evaluation Indicator A Indicator C Indicator G Indicator 2 Indicator 7 Indicator 9 Merge indicators Indicator C Indicator 7 Indicator λ Conceptual Site model WP3 Indicator α Indicator β Indicator µ Feasibility evaluation Indicator α Indicator δ Indicator λ Developing indicators framework On-site interviews with stakeholders over the first two years to understand their mining-related concerns These concerns have been grouped to identify their priorities Indicators include A. Land-use B. Mass and energy flows C. Soil quality D. Air-quality and other nuisances E. Water quality F. Transport G. Geotechnical hazards and accidents H. Industrial and other accidents I. Social impact J. Regional development K. Economic vulnerability/resilience Frequency Stakeholder most important issues Frequency of thematic areas (groups of indicators) A B C D E F G H I J K Classes of indicators Only indicators that could be measured using EO techniques have been retained for product development The priority indicators vary from study site to study site A: land use D: Air quality E: water quality F: transport G: geotech hazards I: social impact J: regional dvpt K: economical vulnerability Government Civil Society Industry 2


 Looking for compensations From indicators to EO-based")

 Vector layer of surface drainage Potentially contaminated surface drainage Sokolov lignite open pit Czech Republic Mapping soil ph")
115 Stakeholder derived indicators Themes covered by information requirements of local/regional stakeholders South Africa Land use Remediation / Czech Republic Status after Environment Materials mining Transport / Energy / Infrastructure A major challenge Need for a neutral attitude Stakeholders with very different concerns vs. environmental and societal issues Establishing confident relations with mining companies Reluctance to deal with environmental and societal impacts Reluctance to put data in the public domain Do not like we work with other stakeholders Working constraints (security, ) Need for a better engagement of the mining industry Get acquainted with local communities concerns and demands Lack of information, rumours Economical dependence (jobs, contribution to the community, infrastructure development, ) Looking for compensations From indicators to EO-based integrated products Hyperspectral imagery and high-resolution DEM in mapping potential surface drainage contamination Environmental issue: (Surface) Water quality and soil properties Indicator: Water Quality Acid drainage generation potential Product : Acid drainage contamination potential Measurable parameter Distribution of secondary Fe-ox minerals Surface drainage map Surface drainage contamination pathway EO data for assessment Hyperspectral imagery Digital terrain Model Fe-oxlayer + drainage layer Scale Local Regional to local Local EO-based GIS layer maplayer of Fe-ox(image or vector) Vector layer of surface drainage Potentially contaminated surface drainage Sokolov lignite open pit Czech Republic Mapping soil ph using hyperspectral imagery Change detection using hyperspectral imagery Aerial 2005 HyMap 2009 HyMap 2010 Any to coal Any to soil Any to water Sokolov lignite open pit Czech Republic Sokolov lignite open pit - Czech Republic 3

 Enhances")


116 Exploitation of TIR hyperspectral imagery Lake Medard (CZ) Enhances geotechnical engineered banks and trails Quartz : yellow Clay rich : blue Modelling tailings dam leakage or failure Evolution of mining and urbanisation Makmal gold processing plant - Kyrgyzstan Mpumalanga coalfield South Africa Geotechnical hazard - subsidence Geotechnical hazard coal fires Mpumalanga coalfield South Africa Meters Mpumalanga coalfield South Africa Subsidence cracks Meters Kopano Energy Resources (Pty) Ltd 4


117 Potential downstream flow path from contaminated surface waters Legend Identified contamination source Drainage within 10 m of a source Drainage SHREVE Closed watershed Depth Aerial image RGB Red Green Blue hillshade Valeur High : 254 Low : 0 Kilometers Mpumalanga coalfield South Africa Conclusions EO tools and methods have been proven invaluable in producing indisputable documents for further use by stakeholders Meeting information requirements Reconciling interest in a dialogue among stakholders Improving of exchanges between the mineral industry and other stakeholders based on standardised, reliable and objective documents Towards the development of EO-based services Thanks for your attention! Visit us at Thanks for your attention! This paper is presented thanks to the contributions of: Anne Bourguignon, Francois Blanchard, Olivier Rouzeau, Vincent Mardhel, BRGM, France Stuart Marsh, Colm Jordan, Richard Ogilvy, Fiona McEvoy, Barbara Palumbo-Roe, British Geological Survey Eyal Ben Dor, Simon Adar, Tel Aviv University, Israel Christian Fischer, Christoph Erhler, Grégoire Kerr, DLR (German Aerospace Agency) Phillip Schepelmann, Dominic Wittmer, Wuppertal Institute for Climate, Environment, and Energy, Germany Slavko Solar, Gorazd Zibret, Anna Burger, Geological Survey of Slovenia Horst Hejny, MIRO, Mineral Industry Research Organisation, UK Henk Coetzee, Bantu Hanise, Council for Geoscience, South Africa Fatima Ferraz, Anglo Coal, South Africa Eberhard Falck, Joachim Spangenberg, Université de Versailles St Quentin, France Veronika Kopackova, Jan Misurec, Jan Jelenek, Czech Geological Survey Petr Rojik, Sokolovska Uhelna, Czech Republic Ernis Kylychbaev, Central Asian Institute for Applied Geosciences, Kyrgyzstan Galina Cheban, KyrgyzAltyn, Kyrgyzstan Contact : s.chevrel@brgm.fr Contact : s.chevrel@brgm.fr 5


118 EO-MINERS Selected EO-MINERS Products; Integrated EO- based tools and methods for environmental and societal impact assessment of mining activities Colm Jordan, BGS European Stakeholder Dialogue on Impact Assessment of Mineral Exploration and Explotation using Earth Observation Brussels, th September 2013 Outline EO Product development EO Product formats EO Product examples Feedback from stakeholders Product Development Plan Product Development Plan Timeline EO Product development: Integrating components from several WPs Conceptual site models (WP3) Indicators for each site (WP1) Parameters measurable with EO (WP1) EO Products (WP4) Available EO data (WP 2 & 3) Project Resources (WP0) EO Data Acquisition Conceptual site models Indicators for each site Parameters measurable with EO EO Products Project Resources WP5 Stakeholder interaction Stakeholder interaction Conceptual Site Model Conceptual Site Model Conceptual Site Model Makmal Pit source Potential pathway Active and future tailings dam source Plant source Potential pathway Town receptor Potential pathway Potential Sources: Pits: dewatering (AMD) Washing plants: effluent (SO 4, metals) Dumps: water and air pollutants, dust, slope stability Underground works (fire, AMD, subsidence, sinkhole) Pathways: Surface water, surface runoff Groundwater Air Receptors: Towns, informal settlements, people (gases, dust, drinking water) Wetlands, terrestrial ecosystems, lake (water quality) Potential Sources: Plant: cyanide Tailings dam: water pollutants, dust Dam stability: leakages (CN, metals) Pathways: Surface water, surface runoff Groundwater Air Receptors: Towns Shallow and deep groundwater Ecosystem 1
, South Africa Sokolov, Czech Republic Makmak (Kazarman), Kyrgyzstan Conceptual Site Model Sokolov A Land use A1 - Total land use by mining")

119 Conceptual Site Model Indicators emalahleni (Witbank), South Africa Sokolov, Czech Republic Makmak (Kazarman), Kyrgyzstan Conceptual Site Model Sokolov A Land use A1 - Total land use by mining and milling; A3 - Artisanal and small-scale mining; A4 - Residential land use; A6 - Sites set aside, protected areas; B Mass flows B1 - Waste volumes generated; D Air quality and other nuisances D1- Aerosols; E Water quality E4 - Acid drainage potential; E5 - Seepage from engineered structures; F Transport F2- Land fragmentation by transport infrastructure; G Geotechnical hazards and accidents G1 - Grade of slopes; G2 - Ground stability small and large scale subsidence; G4 - Underground fires. A Land use A Land-use A1 - Total land use by mining and milling - topographical A1 - Total land use by mining and milling; footprint; A2 - Mining and Land use intensity - topographical D Air quality and other nuisances footprint versus amount of marketable product; D1 - Aerosols; A4 - Residential land use residential developments D2 - Volatiles; around mining areas; D3 - Air-related health impacts; A6 - Sites set aside, protected areas nature reserves, wetlands, sites of spiritual value and similar ones; E Water quality A8 - Recultivation success on mined-out areas and E1 - Hydrological balance; waste/spoil heaps designated mining areas covered by E2 - Process waters and contaminated surface runoff/storm water; specific vegetation; A9 - Areas indirectly affected and its potential use E3 - Aqueous contaminant releases; impact of mining on the potential use of operation and E5 - Seepage from engineered structures; surrounding areas, impact on land value/prices; E6 - Drinking/irrigation water availability; A10 - Soil fertility of remediated mine areas; G Geotechnical hazard and accidents B Mass Flow G3 - Dam stability; B1 - Waste volumes generated; I Social impacts D Air Quality and other nuisances I5 - Health-care and welfare infrastructure provided by D1 - Aerosols particle concentration in off-site air; mining companies. E Water quality E4 - Acid Drainage Potential distribution of sulfidic ironminerals; E5 - Seepage from engineered structures; G Geotechnical hazards and accidents G2 - Ground stability small and large scale subsidence; G3 - Dam stability water saturation in retaining dams. EO-MINERS did not make a product relating to every indicator at each site The EO-Product Matrix Matrix Example Sokolov (v2) Matrix was a decision-making tool: 1. Have we forgotten anything? 2. Have we fully included the requirements of trialogue participants? 3. Not all potential products can be developed, can we prioritise? 4. How will the products be formatted? what will they look like? what format(s) should we use? will they differ depending on stakeholder ability to deal with analogue/digital data? Grouped by Indicator Revised Matrix Example Sokolov (v3) Matrix Example Sokolov Environmental issues Indicators Measurable parameters Potential for EO assessment of parameters EO data availability for parameters EO Investigating Task /status Comments Scale Product institute Distribution of YES secondary Hyperspectral iron oxide airborne data minerals Airborne hyperspectral Selected AMDrelated minerals finishing ph map Czech GS are available for 09, 10 and 11 (although cloudy); some can be mapped. based on ASTER imagery may be of CzechGS used mineral/coal limited use ASTER for composition - mineral compare with other mapping(?) results from TAU/DLR? Local image/grid DLR, TAU, or vector BGS, BRGM layer of & Czech GS iron oxide minerals Matrix also documented the EO data availability within the EO-MINERS project Distribution of YES Airborne hyperspectral Selected Selected soils and Local image/grid DLR, TAU, minerals with Hyperspectral available for 09, 10 and 11 minerals/soils minerals can be or vector BGS, BRGM neutralisation airborne data (although cloudy); some can be mapped. mapped. Map scale? layer of & Czech GS capacity ASTER imagery may be of CzechGS used neutralisin Water limited use ASTER for g minerals Quality: E4 mineral Acid drainage mapping(?) Water quality & generation soil properties potential Surface YES SRTM, 5 m DEMs derived from DEMs exist but Hydrologically? surface BRGM to (distribution of drainage map LiDAR DEM from Cartosat stereo images of they need to be correct DEM and/or draining lead, with sulphidic iron stereo aerial 2009, 2010 and 2011 (not edited. BRGM to dgps data required; map - support from minerals) photography or currently suitable). There is discuss potential can potentially use Strahler Czech GS, satellite imagery. also a photogrammetric 5m improvements photogrammetric order DLR & BGS Note: digital terrain DEM from approx 2008 with with DLR? DEM. GIS stream streams, model is required a 3 year age range network exists => vector map drainage map of mining area risk? Relief maps YES SRTM, 5 m DEMs derived from Task for Czech GS;? DEM, Czech GS & LiDAR ordem Cartosat stereo images and Cartosat DEM may displayed BGS derived from some ASTER imagery. We be useful once as shaded stereo aerial also have 10k and 25k validated. 1:10,000- relief base photography or vector topographic map scale maps on FTP map satellite imagery data and VK indicates that (raster the IPR will allow us to use format) them Legend Data described on this line is ready and available Information in this cell is ready, but data described on this line has missing items Information about this cell is missing, requires further information or needs improving Processing Name Extend Data characteristics Metadata On project FTP Status Type applied Dust samples punctual Collected In-house:?????? NO - done DATA /analysis TAU/CzechGS GeoZS/TAU/BGS Dust samples punctual Collected on streets: GeoZS?????? NO - GeoZS done DATA / analysis XRF punctual Both lab and field measurements?????? NO - CGS preprocessing DATA not over done Soil moisture spatial One specific area preprocessed see YES DATA documentation 2

 Multi-temporal Landsat TM satellite imagery Multi-temporal Landsat TM satellite imagery Multi-temporal SPOT satellite imagery Census data showing extent")
 Land Use: A6 Site set aside, protected areas (nature reserves, wetlands, sites of spiritual value and similar) Distribution of dust contamination: Air Quality and")
 Landsat TM satellite imagery GIS of habitat classes Multi-elemental dust analyses SPOT satellite imagery GIS of industrial sites 7")
120 EO Products Developed, emalahleni Product Title Related Indicator Primary EO Datasets Change of the mining footprint through time Residential land use around mining areas 3 Urban footprint Mining and areas of ecological importance Land Use: A1 Total land use by mining and milling Land Use: A4 Residential land use (residential developments around mining areas) Land Use: A5 Informal settlement (sprawl of squatters areas, slums) Multi-temporal Landsat TM satellite imagery Multi-temporal Landsat TM satellite imagery Multi-temporal SPOT satellite imagery Census data showing extent of residential developments Land Use: A4 Residential land use (residential developments around mining areas) TerraSAR-X Radar satellite data Land Use: A5 Informal settlement (sprawl of squatters areas, SPOT satellite imagery slums) Land Use: A6 Site set aside, protected areas (nature reserves, wetlands, sites of spiritual value and similar) Distribution of dust contamination: Air Quality and other Nuisances: D1 Aerosols (particle antimony (Sb), chromium (Cr) concentration in off-site air) vanadium (V), barium (Ba Acid mine drainage contamination potential Water Quality: E4 Acid drainage generation potential (distribution of sulphidic iron minerals) Landsat TM satellite imagery GIS of habitat classes Multi-elemental dust analyses SPOT satellite imagery GIS of industrial sites 7 Density of road per km2 SPOT satellite imagery Transport: F2 Land fragmentation by transport infrastructure GIS of industrial sites 8 9 Geotechnical hazards and ground stability Geotechnical hazards: miningrelated fires Geotechnical Hazards and Accidents: G2 Ground stability (changes in elevation of areas unaffected by residue disposal) Geotechnical Hazards and Accidents: G4 Underground and mining waste deposit fires WorldView-II satellite imagery WorldView-II DEM Drainage network derived from WorldView-II DEM Potential contamination pathway derived from WorldView-II DEM Airborne LiDAR DEM Aerial photographs WorldView-II satellite imagery Airborne LiDAR-derived slope map Airborne thermal infrared imagery Airborne LiDAR DEM Aerial photographs Indicator category Land Use Air Quality Water Quality and Land fragmentation Geohazards Related Product South Africa Kyrgyzstan Czech republic 1. Change of mining footprint through time 2. Residential land use around mining areas 3. Urban footprint 4. Mining and areas of ecological importance 5. Distribution of dust contamination antimony (Sb), chromium (Cr), vanadium (V), barium (Ba) 6. Acid Mine Drainage (AMD) contamination potential 7. Density of roads per km 2 8. Geotechnical hazards and ground stability 9. Geotechnical hazards: mining-related fires EO Product List 1. Cadastral information 2. Change of mining footprint through time 3. Air and surface water contamination potential 4. Soil and surface water contamination potential 6. Cyanide concentration in water bodies 7. Tailings dam stability 8. Radioactive contamination 1. Dust pollution and vegetation health 2. Spatial distribution of iron oxides possibly associated with AMD 3. Soil composition and AMD contamination potential 4. An example of AMD drainage contamination potential 5. AMD-producing minerals and water quality EO-MINERS made 22 EO Products - available in various formats EO Product Formats Paper Maps Paper maps Digital maps in 2D and 3D (PDF) for use on a PC or even a mobile device e.g. ipad Three dimensional models and animations GoogleEarth files available from Change of Mining Footprint Through Time, SA Acid Mine Drainage Contamination Potential, SA 3
 Interactive Multi scale Layers can be")

 Interactive 2D PDFs (e.g. from Kyrgyzstan) 4")
121 D PDFs Interactive 2D PDFs (e.g. from Kyrgyzstan) Interactive Multi scale Layers can be turned on / off Added functionality Distance measurement Area measurement Field GPS display Interactive 2D PDFs (e.g. from Kyrgyzstan) Interactive 2D PDFs (e.g. from Kyrgyzstan) Interactive 2D PDFs (e.g. from Kyrgyzstan) Interactive 2D PDFs (e.g. from Kyrgyzstan) 4

")

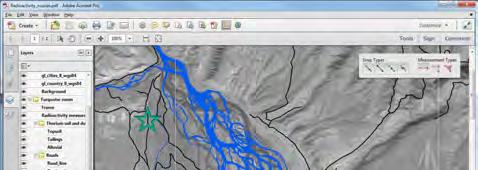


122 Interactive 2D PDFs (e.g. from Kyrgyzstan) Interactive 2D PDFs (e.g. from Kyrgyzstan) Interactive 2D PDFs (e.g. from Kyrgyzstan) Interactive 2D PDFs (e.g. from Kyrgyzstan) Interactive 2D PDFs (e.g. from Kyrgyzstan) Sample 3D PDF 5


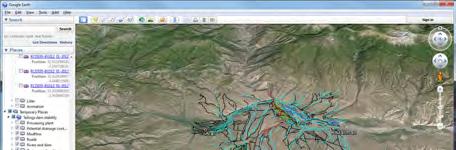


123 Sample 3D PDF Sample 3D PDF Sample 3D PDF 3D Visualisations and Videos Google Earth Kyrg Tailings Dam Leakage Google Earth Kyrg Tailings Dam Leakage 6


 Kyrg (Makmal) Kyrg")
 Key EO Products:")


124 Google Earth Kyrg Tailings Dam Leakage Google Earth Kyrg Tailings Dam Leakage Google Earth Kyrg Tailings Dam Leakage Google Earth and EO Miners data comparison Stakeholder Feedback All products were presented at a series of trialogue workshops held at the three test sites Sokolov (public) South Africa Sokolov (mining) Kyrg (Makmal) Kyrg (Kazarman) Kyrg (Bishkek) Stakeholder Feedback (1) Key EO Products: Sokolov: Water Quality E4, Acid Drainage Potential, distribution of sulfidic ironminerals; emalahleni: D Air quality and other nuisances, D1- Aerosols Makmal: Water Quality E4, Acid drainage potential and seepage from engineered structures (cyanide) 7
125 Stakeholder Feedback (2) Attractive tools that provide the information in an easy-to-use form Benefit of spatially continuous and repeated measurements Beyond the posters, the 3D presentation of EO Products was much appreciated The maps and data are able to help develop a common language and base of communication between otherwise separate stakeholders Stakeholder Feedback (3) Question of benefit to minor mines was raised, will detailed control be available? Air quality products were of interest in South Africa, in particular the press distributed the results with enthusiasm (several local press articles) could this product be extended to include medical recommendations? EO Products - Summary Successful demonstration of integrated EO Products for three test sites Methodology and tools are exportable to other sites New data (in situ, airborne & satellite) will increase how (and which) indicators can be monitored Costs may be reduced with streamlined methodology and new data sources 8

126 EO-MINERS products in the context of the national and EU regulatory framework related to raw materials Brussels workshop, September 18th, 2013 Patrice Christmann Deputy Director Strategy Directorate Direction de la Stratégie mercredi 9 octobre 2013 can materialise by multiple legacies with an important impact on Eurpe s sustainable competitiveness Land subsidence; Pollution of soil and surface water by migration of acid mine drainage; Accidental spillage of tailings further to dam failures; Contamination of groundwater; Wind erosion of mine tailings. Accidents and/or poor operational practice are one of the reasons of the deep mistrust between potentially impacted populations and mining companies. The negative image many citizens have of mining or metallurgical industries much contributes to the de-industrialisation of the European Union, to its economic vulnerability and to the transfer of environmental burdens to non-ec countries, especially to China, where impacts can be much more severe than what would happen if the minerals and metals industry would operate in a properly regulated EU framework. This is unbearable from a sustainable development perspective. Nom du service émetteur Nom du service émetteur mercredi 9 octobre 2013 > 3 mercredi 9 octobre 2013 > 4 MINING STAKEHOLDERS Mining projects involve multiple stakeholders with conflicting interests, different levels of knowledge and perceptions, they need understandable, science-based evidence to trade their positions and reach the consensus needed for the transparent, sustainable operation of mining projects. Such evidence is also needed by companies willing to document their sustainability performance. Shareholders Commercial banks Rating agencies Development banks Insurance Co. Others (equipment, engineering ) Political parties Suppliers Employee s Unions Mining Companies Governement Sectoral authorities Mine Local Buyers populations Professional organisations Academia & research NGOs Industry Consumers Development organisations Media Nom du service émetteur mercredi 9 octobre 2013 > 5 1
127 Verifiable facts and figures are essential: > As a management tool: For companies to monitor, manage and report their impacts in a transparent and verifiable manner; to engage their stakeholders; For national, regional and local authorities to monitor the impacts of mining and metallurgical activities and verify their regulatory compliance > As a trust developing instrument: Serving locally as a basis for stakeholder dialogue; For the broader reporting of sustainable performance within frameworks such as the one developed by the Global Reporting Initiative Sustainable performance reporting is a key to address the XXIst century challenges > Adam Smith, Ricardo and the founders of the conceptual framework of moder economic science were living in a sparsely populated, agrarian Europe where natural resources were not an issue. > The definition of competitiveness in a global, interdependent, resource constrained world of 9 billion people in 2050 will need to be revisited in depth, and based on sustainability indicators. > Earth Observation, from space and in situ, has an important role to play in this Nom du service émetteur Nom du service émetteur mercredi 9 octobre 2013 > 7 mercredi 9 octobre 2013 > 8 Sustainable performance reporting is a key to address the XXIst century challenges > Adam Smith, Ricardo and the founders of the conceptual framework of moder economic science were living in a sparsely populated, agrarian Europe where natural resources were not an issue. > The definition of competitiveness in a global, interdependent, resource constrained world of 9 billion people in 2050 will need to be revisited in depth, and based on sustainability indicators. > Earth Observation, from space and in situ, has an important role to play in this Nom du service émetteur mercredi 9 octobre 2013 > 9 EC Mining Waste Directive EC 2006/21 It requires: > Art.5 Waste management plan > Art. 6 Major-accident prevention and information > Art. 8 Public participation > Art. 10 To identify and manageme voids Nom du service émetteur mercredi 9 octobre 2013 > 11 2

128 The Global Reporting Initiative > The world largest voluntary sustainability reporting initiative > Born in 1997, with i.a the support of UNEP and the World Business Council for Sustainable Development > It publishes general sustainability reporting guidelines and sector supplements, including one for the minerals and metals industry > In 2011, over 140 minerals and metals producing companies reported their sustainability performance according to one of the 3 GRI compliance levels 0% 60% 50% 40% 30% 20% 10% Copper Molybdenum Zinc ore % of world mine or metals production 2009 by Global Reporting Initiative Reporters Data sources: Raw Materials Data, Global Reporting Initiative - Compiled by P. Christmann, BRGM Titanum ores Iron ore Uranium ore Bauxite Palladium Zirconium ore Nickel Alumina Manganese ore Boron oxyde Aluminium Gold Cobalt Lead Phosphate Lithium Silver Niobium Vanadium ore Chromite Antimony Tantalum Tin Nom du service émetteur mercredi 9 octobre 2013 > 15 3
129 Panel discussion The EO-MINERS process and products Your personnal feedback Can they contribute to policy requirements? Policy developments? and how? Raw material initiative Flagship initiative EIP on raw material other Can they provide an efficient and/or costeffective way of ensuring monitoring to meet high environmental standards and contribute to improving public acceptance. Applicability? at what scale? Local Regional Global Can they be linked to BATs? 1


130 Growth of the World Economy A Resource Efficient Europe: which indicators? Werner Bosmans European Commission DG Environment Brussels, 19 September 2013 Planetary boundaries & human activity Rising resource prices: Bubble or Paradigm Shift? The Roadmap to a Resource Efficient Europe & the 7 th EAP Resource efficiency: Doing more with less = Producing more value while living, producing and consuming within the physical and biological limits of the planet Part of a new Europe 2020 strategy for growth and jobs Communication The Roadmap to a Resource Efficient Europe" (20 Sept. 11) raw materials: metals, minerals-fuels-biomass ecosystems biodiversity water land and soils air marine resources 1

131 Another economic model: Circular Economy The main lines of the Roadmap Three time lines long term 2050 vision milestones for 2020 actions to be taken now Take Parts manufacturer Product manufacturer Service provider Mining/materials manufacturing Re-make Renewable energy in Three action lines Transforming the economy Addressing natural capital Tackling key sectors Getting the prices right, reflecting environmental externalities Make Consumer New consumer? Use Accompanied by governance and monitoring Source: Ellen MacArthur Foundation circular economy team 7th EAP -Thematic priority objectives 1. To protect, conserve and enhance our natural capital base, which is the foundation on which so much of our economic activity is built 2. To put in place the right conditions for resource-efficient, low-carbon growth, which is at the core of the green economy we want to create 3. To tackle the remaining environmentrelated pressures and new and emerging risks, to help safeguard the health and wellbeing of Europe's citizens 7th EAP: soils & land Priority objective 1: to protect, conserve and enhance the EU's natural capital Main messages Better implement existing legislation and strategies New element: the degradation, fragmentation and unsustainable use of land in the EU is jeopardising the provision of several key ecosystem services, threatening biodiversity and increasing Europe s vulnerability to climate change and natural disasters => future action (and targets) on soil and on land Why do we need indicators (and targets)? Resource efficiency indicators Spur debate & action on Resource Efficiency policy Monitor the progress to a more Resource Efficient Europe (and the performance of related policies) Focus political attention through tangible figures and objectives (e.g. EU 2020 headline indicator) 2
 Links resource efficiency and economic performance Shortcomings: only captures material resources ; does not reflect differences between various")
132 Three layers approach 1. Lead indicator : Resource productivity (GDP/DMC) Links resource efficiency and economic performance Shortcomings: only captures material resources ; does not reflect differences between various materials; does not deal with shifts to non-eu countries 2.Dashboard of macro-indicators on Water, Land and Carbon 3.Thematic indicators: Measure progress towards specific objectives and actions Consultation Process European Resource Efficiency Platform High level group including European Commissioners, Members of the European Parliament, ministers, business CEOs, academia and representatives of NGOs and civil society Public consultation More than 170 answers, half of them from industry Way Forward (Indicators) Broad agreement with the options put forward by the Commission Move to Raw Material Consumption (RMC) instead of Direct material Consumption (DMC) Disaggregate material data in order to differentiate between various nature of materials Better reflect biodiversity and eco system services; re-use and recycling Better integrate the international perspective ( footprinting ) Way Forward (Targets) The EU should set ambitious and credible targets In addition to Carbon, targets should address o Materials (material productivity) o Water o Land What can Earth Observation deliver for resource efficiency policies? Zooming in : Hotspot Information Information about areas of special interest: trends & changes; benchmarks => Support for biodiversity policies 3

133 EO: red mud sludge Hungary, Oct Using EO for mining 'footprint? Measuring the Impact of mining activities - monitoring specific sites of interest: Monitoring soil degradation and contamination (potential of hyperspectral EO data?) Monitoring impact on ecosystems and biodiversity (land cover/use change, land fragmentation..) Monitoring illegal activities or illegal practices Support to emergency management Material extraction? What can Earth Observation deliver? Land cover/use changes at global and european level in a high resolution Land degradation, desertification, droughts, food security Biodiversity and reduction of its loss Deforestation Material extraction? Water? =>Evidence base behind environment policies - megatrends : Make data widely available, comparable, fit-for-purpose => information werner.bosmans@ec.europa.eu 4


 after Krausmann et al.")

134 The presentation Global mineral extraction for the EU economy Stefan Bringezu Director Material Flows and Resource Management Wuppertal Institute Global trends of mineral use Competition for land based resources Mineral supply of the EU Shifting regional pattern of global mining Ongoing research Presentation at the EO Miners "Minerals and Society Workshop" 19 September 2013 Brussels Professor for Sustainable Resource Management Co-chair WG Land&Soil of the International Resource Panel 19 Sep 2013 S. BRINGEZU 2 WUPPERTAL INSTITUTE The presentation World GDP decouples from resource use Global material extraction used Global trends of mineral use Competition for land based resources Mineral supply of the EU Shifting regional pattern of global mining Ongoing research Source: UNEP (2011) after Krausmann et al WUPPERTAL INSTITUTE WUPPERTAL INSTITUTE 19 Sep 2013 S. BRINGEZU 4 19 Sep 2013 S. BRINGEZU 3 Growing global resource use Growing environmental impacts by mineral extraction: Purposeful excavation which remains per se unused Projected doubling of used extraction from 2000 to t Unused extraction adds double to triple amount* Source: Mudd 2009, Australia Source: Aachen Foundations based on SERI/FoE 2009 *not shown: e.g. in 2000: 50 bill t used plus bill t unused extraction "Unused extraction" grows more waste, water distraction, landscape change Foto Edgar Llamoca 19 Sep 2013 WUPPERTAL INSTITUTE WUPPERTAL INSTITUTE 19 Sep 2013 S. BRINGEZU 6 S. BRINGEZU 5 1


135 Ratio of used to "unused" extraction varies Extreme example: Gold mining in rain forest in Peru Rucksack Ratio 1:(20*10 6 ) Environmental Impact of Copper Mine Ok Tedi Mine, Papua New Guinea These images show environmental impact of the mine Total extraction dominated by overburden Without translocation of "unused extraction" the forest would remain undisturbed Mine Madre de Dios Source: Sonja Valivia (2004), Fotos Edga Llamoca the overall extraction volume determines the magnitude of local damage 1990: Both the mine and township of Tabubil, are clearly visible 2004: Raised river beds, forest damage and decline in biodiversity are some impacts 19 Sep 2013 S. BRINGEZU 7 WUPPERTAL INSTITUTE 19 Sep 2013 S. BRINGEZU 8 WUPPERTAL INSTITUTE Limestone quarrying in Western Europe The example of Lengerich, Germany Unused extraction of underground potash mining Hesse, Germany sdf Fotos: Fabian Hanneforth 19 Sep 2013 S. BRINGEZU 9 WUPPERTAL INSTITUTE 19 Sep 2013 S. BRINGEZU 10 WUPPERTAL INSTITUTE The presentation Open pits may have large footprint And may conflict with agriculture for land and water Global trends of mineral use Competition for land based resources Mineral supply of the EU Shifting regional pattern of global mining Ongoing research Tailings pond Open pit Source: wikimedia.org Waste dump Yanacocha gold mine in Peru, aerial view WUPPERTAL INSTITUTE 9. Oktober Sep 2013 S. BRINGEZU Sep 2013 S. BRINGEZU 11 WUPPERTAL INSTITUTE 2


136 Underground mining has also impacts on surface For instance per se unused extraction for roads A mineral rich country Geological deposits in the Northwest of Germany Pogo gold mine, Alaska Quelle: WUPPERTAL INSTITUTE 19 Sep Sep 2013 S. BRINGEZU 13 WUPPERTAL INSTITUTE S. BRINGEZU Mineral deposits in the Northwest of Germany with overlay of various protection areas Main causes of degradation of terrestrial and semi-terrestrial biotop types in Germany Wasserschutzgebiete Intensified use 36.3 % Eutrophication ofsoil and waterbodies 22.4 % Changes of water household 15.6 % Abandonment of extensive agriculture 13.3 % Mechanical impacts 13.3 % Intervention in forests 12.7 % Complete distruction 10.5 % Mineral excavation 10.5 % Browsing by game 9.1 % Interventions in vegetation i.w.s. 7.4 % Soil, air and water pollution 7.1 % Waterway construction/maintenance 5.1 % Start ofmaking use 4.5 % Mining and quarrying Restoration, sealing, conservation practises 2.5 % The challenge is to minimize Removal/release ofplants and animals 2.5 % conflicts with other types of Use of biocides 2.0 % resource use domestically Erosion protection measures 1.4 % and abroad 0 % 10 % 20 % 30 % Quelle: nach Raths et al in: Bundesamt für Naturschutz (BfN), Daten zur Natur 2002 SBr-05/23 Quelle: WUPPERTAL INSTITUTE 19 Sep Sep S. BRINGEZU WUPPERTAL INSTITUTE S. BRINGEZU Pollution Agriculture The presentation Europe imports most of the ores used from other regions The example of iron ore from Brasil Global trends of mineral use Competition for land based resources Mineral supply of the EU Shifting regional pattern of global mining Ongoing research Duisburg Nord Carajás Mine, Brasilien Duisburg Nord Primary material (TMR) per tonne of steel: 8.1 t/t blast furnace 1.5 t/t recycling Quelle: 19 Sep 2013 WUPPERTAL INSTITUTE WUPPERTAL INSTITUTE S. BRINGEZU Sep 2013 S. BRINGEZU 17 3


 products erosion excavation metals minerals fossil fuels biomass Mineral use of the EU-27 Metal ores Mineral use of the EU-27 Non metallic minerals 4.")
137 Environmental profile of mining, beneficiation and smelting technologies The example of copper in Chile and Germany Regional disparity of environmental pressure: Platinum-Group- Metal production for Europe s supply Source: Schüller et al Sep 2013 S. BRINGEZU 19 WUPPERTAL INSTITUTE 19 Sep 2013 S. BRINGEZU 20 WUPPERTAL INSTITUTE Overview of the socio-industrial metabolismus of the EU Input of minerals dominates tonnes Global resource use of the EU is growing Total Material Requirement TMR Tonnes per capita 35,0 30,0 25,0 20,0 15,0 10,0 5,0 0, TMR domestic TMR imports TMR exports EU increasingly uses resources outside 19 Sep 2013 Metal minerals determine TMR of imports and exports Sources: Schütz/Bringezu, Eurostat WUPPERTAL INSTITUTE WUPPERTAL INSTITUTE 19 Sep 2013 S. BRINGEZU 22 S. BRINGEZU % 90% 80% 70% 60% 50% 40% 30% 20% 10% 0% TMR domestic TMR import TMR export other (n.e.c.) products erosion excavation metals minerals fossil fuels biomass Mineral use of the EU-27 Metal ores Mineral use of the EU-27 Non metallic minerals Million tonnes TMR RMI DMI Million tonnes TMR RMI DMI Source: Eurostat and Wuppertal Institute Source: Eurostat and Wuppertal Institute 19 Sep 2013 S. BRINGEZU 23 WUPPERTAL INSTITUTE 19 Sep 2013 S. BRINGEZU 24 WUPPERTAL INSTITUTE 4


138 Metal ores - Trade Balance: The EU-27 is a net importer Non metallic minerals - Trade Balance: The EU-27 is net importer of absolute import flows and unused extraction Million tonnes Foreign Trade Balance in TMR Foreign Trade Balance in RME Direct Foreign Trade Balance Million tonnes Foreign Trade Balance in TMR Direct Foreign Trade Balance Foreign Trade Balance in RME Source: Eurostat and Wuppertal Institute Source: Eurostat and Wuppertal Institute 19 Sep 2013 S. BRINGEZU 25 WUPPERTAL INSTITUTE 19 Sep 2013 S. BRINGEZU 26 WUPPERTAL INSTITUTE The presentation World trade: Direct Flows Net suppliers and demanders in 2005 Europe is a net importer Global trends of mineral use Competition for land based resources Mineral supply of the EU Shifting regional pattern of global mining Ongoing research Source: Dittrich/Bringezu 2010 WUPPERTAL INSTITUTE WUPPERTAL INSTITUTE 19 Sep 2013 S. BRINGEZU Sep 2013 S. BRINGEZU 27 World trade: Physical trade balances including ecological rucksacks EU net import shifts burden of resource extraction to other regions GDP is less important for trade balance of resources (incl. rucksack flows)......than population density and natural endowment 19 Sep 2013 Source: Dittrich/Bringezu 2011 Source: Dittrich/Bringezu/Schütz 2012 WUPPERTAL INSTITUTE S. BRINGEZU 29 WUPPERTAL INSTITUTE 19 Sep 2013 und ressourcenmanagement FG S. BRINGEZU 3: stoffströme 30 5

 Scource: Bringezu et al. 2009 Quelle: Firma Rheinbraun ARD Fotogalerie 19 Sep 2013 WUPPERTAL INSTITUTE WUPPERTAL INSTITUTE 19 Sep 2013 S.")


, Bands 751, 15-01-2013 Footprint (2013): 2995 ha The EU")
139 Social acceptance: Resource extraction prefers sparsely populated areas as conflicts grow with population density Social conflicts due to largescale mining The example of lignite mining in Germany Rucksack ratio (unused: used extraction) 9 t/t large scale open pits translocation of villages Domestic TMR (t/cap) massive groundwater extraction costly rehabilitation Foto Jörg Gläscher, Die Welt Population density (persons/km 2 ) Scource: Bringezu et al Quelle: Firma Rheinbraun ARD Fotogalerie 19 Sep 2013 WUPPERTAL INSTITUTE WUPPERTAL INSTITUTE 19 Sep 2013 S. BRINGEZU 32 S. BRINGEZU 31 Transformation of landscapes will proceed in less populated areas The example of iron ore mining in Australia The presentation Global trends of mineral use Competition for land based resources Mineral supply of the EU Shifting regional pattern of global mining Ongoing research Jimblebar iron ore mine in the Pilbara region, Western Australia. 19 Sep 2013 S. BRINGEZU 33 WUPPERTAL INSTITUTE 19 Sep 2013 S. BRINGEZU 34 WUPPERTAL INSTITUTE Land surface disturbances by large-scale mining Ongoing research Conclusions What is the global footprint of largescale mining of certain metals? Where are the highest current and future pressures on biodiversity? Footprints are calculated based on images from the Landsat archive Hypothesis states a significant correlation exists between (total) material mined and surface disturbed at mine site Ongoing Ph.D work at University of Kassel and Wuppertal Institute Corporation with RMG and ZFL/Bonn Yandi iron ore mine in Australia Landsat 5 (TM), Bands 751, Footprint (2013): 2995 ha The EU increasingly sources (metal) mineral resources from other regions The net import is associated with growing indirect flows The impact of mining and quarrying to the local environment depends on the overall extraction (both used and "unused" extraction) - landscape changes - biodiversity impacts - water pumping and diversion - waste generation The risk of conflicts with other types of land use might increase, if mining and quarrying will not use options to reduce resource intensity Monitoring total extraction and land use by remote sensing will help mining industry and governments to keep the real footprint as small as possible Source: Diego Murguia 19 Sep 2013 S. BRINGEZU 35 WUPPERTAL INSTITUTE 19 Sep 2013 S. BRINGEZU 36 WUPPERTAL INSTITUTE 6

 Used extraction (ore milled): 12 Mt Unused")


 in Mio.")

140 yyy yyy BACK-UP Many thanks for your attention! ISBN: Sep 2013 S. BRINGEZU 38 WUPPERTAL INSTITUTE Or this: Surface mining open pit mining example Material mined/moved: 85 Mt (yearly) Used extraction (ore milled): 12 Mt Unused extraction (waste): 73 Mt 19 Sep 2013 S. BRINGEZU 39 Cerrejón coal mine in La Guajira Department, North of Colombia. WUPPERTAL INSTITUTE Av. Grade Au: 2,4 gpt Waste-to-ore ratio: 6 : 1 Superpit mine - Australia 9. Oktober Sep 2013 S. BRINGEZU 40 WUPPERTAL INSTITUTE Indirekte Ressourcenflüsse der deutschen Importe Indirekte Ressourcenflüsse der deutschen Exporte Direkte plus Indirekte Flüsse der Importe (TMR der Importe) in Mio. t ÖR-Verhältnis Direkte plus Indirekte Flüsse der Exporte (TMR der Exporte) in Mio. t ÖR-Verhältnis Importmenge steigt Rucksackflüsse ca. 4mal höher hoher Anteil Metalle Exportmenge steigt Rucksackflüsse ca. 5mal höher Metalle dominieren ÖR-Verhältnis = RF/Warenfluss Quelle: Bringezu/Schütz 2012 Quelle: Bringezu/Schütz Sep 2013 WUPPERTAL INSTITUTE WUPPERTAL INSTITUTE 19 Sep 2013 S. BRINGEZU 42 S. BRINGEZU 41 7


 Indications that human activities lead to long-term changes within the biogeo-sphere: \"anthroposcene\" (Crutzen and Stoermer 2000, Steffen et al.")
. natural translocations of earth crust material lie in the order of magnitude of ca.")

141 Meso level: Material system: PGM flows in Europe PGMs in glass industry: organized in closed loop secondary PGM input represent ~ 43 % of European secondary input primary input represent only 0.5 % of European primary input PGMs in car catalysts: low recycling rate (~30 %), mainly due to exports expanding car fleet, growing average cylinder capacity, stricter emissions standards => The automotive industry represents 76 % of PGM primary input to Europe Approaching a "low risk" level of man-made mineral flows by comparison with natural flows A plausible hypothesis would be that if anthropogenic flows are within the same order of magnitude as natural flows, the ecosphere might not be overloaded beyond existing capacities (resilience etc.) Indications that human activities lead to long-term changes within the biogeo-sphere: "anthroposcene" (Crutzen and Stoermer 2000, Steffen et al. 2011) Sediment freight of large rivers without human influence: 15 Gt/a (Syvitski and Kettner 2011) Largest volcano eruption in historical times: Tambora in 1815: 140 Gt (50 km 3 ) magma caused dead. Long-term global average probably much lower (14 Gt/a?). natural translocations of earth crust material lie in the order of magnitude of ca. 30 Gt/a (preliminary) PGM flows in EU 25 + Norway + Switzerland in 2004 Source: Mathieu Saurat and Stefan Bringezu WUPPERTAL INSTITUTE WUPPERTAL INSTITUTE FG S. BRINGEZU 3: stoffströme Sep 2013 und ressourcenmanagement 19 Sep 2013 S. BRINGEZU 44 Global resource extraction Some estimates Rationale of a possible target of global mineral extraction The original rationale Global resource extraction in fossil fuels, metals, other minerals, biomass (used + unused): 80 Gt - earth excavation: Gt - erosion in agriculture: Gt - total mineral extraction (without biomass and erosion): Gt -> man-made mineral translocations of earth crust material exceed natural flows Global mineral extraction in 2000: bill. t (= t/cap) (without erosion; including used and unused extraction) Schmidt-Bleek (1992) suggested target: 50% of global resource extraction ("precautionary" <-> low risk) Equity criterion: equal distribution per capita Long-term target: -> after 2050 <-> 9 bill. people -> target value: t/cap TMC abiot However, would that be a realistic target before the background of global development dynamics? Source: Bringezu et al Source: Bringezu (2009) after Schmidt-Bleek (1992) Aachen Foundation/Lehman fotos dreamstime.com 19 Sep 2013 WUPPERTAL INSTITUTE WUPPERTAL INSTITUTE 19 Sep 2013 S. BRINGEZU 46 S. BRINGEZU 45 Many developing countries seem to exceed already 6 t/cap TMC* abiot 2005 Possible target for mineral extraction A recent consideration Global mineral extraction in 2000: bill. t (= t/cap) (without erosion; including used and unused extraction) Globally it would already be progress towards lower risk resource flows, if 2000 level could be regained and distributed equally among 9 bill. People (-> t/cap) For communication purposes and to be a bit more on the safer side: 10 t/cap TMC abiot (for 2050) TMC abiot in 2008 Required reduction EU-27 Germany 31 t/cap 43 t/cap 68 % 77 % Total Material Consumption of abiotic primary material (TMC abiot ) Source: Dittrich 2009, based on UN Comtrade and Schütz and Bringezu 2008; TMC*: preliminary calculations 19 Sep 2013 pressure indicator based on mass turnover of primary materials integrates all flows exerting volume related impacts (robust against substitution, and captures problem shifting) primary extraction = waste +/- NAS Source: Bringezu (2011) Bringezu et al. (2012) WUPPERTAL INSTITUTE WUPPERTAL INSTITUTE 19 Sep 2013 S. BRINGEZU 48 S. BRINGEZU 47 8
142 What can EO methods contribute to the development (population) of Resource Efficiency macro/mesoscale indicators - with a particular focus on mining activities? At which scale are the potentials highest? What could indicators benefit from EO data regarding: Accuracy? Timeliness? Costs?? What is the applicability of EO methods to improve the current material accounting schemes? on European flows on global material flows 1
143 International Union of Geological Sciences International Union of Geological Sciences Minerals Initiative Dr. Marko Komac Director of Geological Survey of Slovenia & IUGS Vice- President on behalf of the IUGS Bureau EO-Miners Workshop, Brussels, September, 2013 Largest scientific Union in ICSU formed in 1961 non-political, non-governmental & non-forprofit organisation Supports 121 member countries Represents approximately 1 million earth scientists around the world Formal body representing all geosciences Has 54 international Affiliated Organizations International Union of Geological Sciences Started the International Geoscience Program (IGCP) in collaboration with UNESCO in 1972 Current IUGS priorities: Keep core mission of IUGS standards Develop new activities in geological education Improve outreach & visibility of geology Increase cooperation & funding International Union of Geological Sciences Evolution of focus and outreach of IUGS Keep core mission of IUGS standards Develop new activities in geological education Improve outreach & visibility of geology Increase cooperation & funding Resourcing Future Generations RGF initiative addressing RMS, H20 & EN IUGS RFG RATIONALE Numerous activities in the RMS sector (in 2 nd phase addressed also water and energy issues) but missing: what needs to be done now to address future RMS challenges? aimed at guiding RM exploration in the long term (beyond 2030) IUGS huge international network used as the catalyser/galvaniser of different forms of RMS activities for the enhanced CaBu & KnTr IUGS RFG RATIONALE current problems: lowering of ore grades, landuse conflicts (agriculture, nature protection ), negative perception of mining deep-seated resources subsurface studies opportunities in technology, geological understanding/research & training needs focus on Africa and C&E Asia launch at the end of October 2013 (< 1 month) 1
144 IUGS RFG ISSUES ADDRESSED detailed evaluation of potentials in underexploited regions (metalogenesis similar.) evaluation of future RM demand & supply better data integration and utilisation for advanced modelling (in 3, 4, 5D) applications of novel sensors (not only satellite) RS technology integrated with in-situ data & monitoring (relation to GEO) new RM frontiers (sea-floor, asteroids ) IUGS RFG ISSUES ADDRESSED urban mining, minerals life cycles addressing negative perception of mining in general public good practices setting international standards research the substitution of current RM with novel ones IUGS RFGIN A LARGER PICTURE RFG as a part of ICSU s FUTRUE EARTH. FE focuses on: Solution-oriented sustainability Effective interdisciplinary collaboration Timely information for policy-makers Participation of stakeholders Increased capacity building RFG CHALLENGES Demand for most minerals will continue to rise. Needs of society in the long-term will be challenging to meet. Inclusion of wide range of stakeholders. Strong collaboration and knowledge integration. IUGS a catalyst & coordinator (a demanding task with limited resources). THANK YOU! Any questions? 2
 - Largest consortium of data providers in the world - Coordinating efforts to build a Global Earth Observation")
145 What is GEO and GEOSS? EO-Miners and GEO/GEOSS Stéphane Chevrel, BRGM, PoC of GEO SB-05-C2 programme Georgios Sarantakos, GEO Secretariat Intergovernmental organisation Group on Earth Observations (GEO) - Largest consortium of data providers in the world - Coordinating efforts to build a Global Earth Observation System of Systems (GEOSS) - Launched in response to calls for action by the 2002 World Summit on Sustainable Development and by the G8 (Group of Eight) leading industrialized countries and created in Provides a framework within which the partners can develop new projects and coordinate their strategies and investments in data products and services GEO Secretariat The Vision for GEO is to realize a future wherein decisions and actions for the benefit of humankind are informed by coordinated, comprehensive and sustained Earth observations and information. GEOSS 10-Year Implementation Plan, February 2005 Group on Earth Observations (GEO) GEO today:90 Members 67 Participating Organisation GEO Objectives Improve and Coordinate Observation Systems Advance Broad Open Data Policies/Practices Foster Increased Use of EO Data and Information Build Capacity 1
146 GEOSS Minerals in GEO GEO Minerals related target 11. Close critical gaps in energy-related Earth observations and increase their use in all energy sectors in support of energy operations, as well as energy policy planning and implementation, to enable affordable energy with minimized environmental impact while moving towards a low-carbon footprint This will be demonstrated by: Significant increase in use of Earth observations by all sectors for improved: o Environmental, economic and societal impact assessments of energy exploration, extraction, conversion, transportation and consumption. o Prediction of potential hazards to the energy infrastructure. o Prediction of the production of intermittent sources of energy. o Mapping of renewable energy potential. GEO Strategic Targets Document 12(Rev1) As accepted at GEO-VI GEO Minerals related tasks EN-01-C1: Tools and Information for the Resource Assessment, Monitoring and Forecasting of Energy Sources (including solar, wind, ocean, hydropower, and biomass) and Geological Resources (including mineral and fossil resources, raw material and groundwater) SB-05: Impact Assessment of Human Activities SB-05-C1: Tools and Information for Impact Assessment and Energy Policy Planning SB-05-C2: Impact Monitoring System for Geo-Resource Exploration and Exploitation Stéphane Chevrel (BRGM): Stuart Marsh (BGS): Leads (Point of Contact) SB-05-C2 Contributes to EN-01-C1 Leads SB-05-C2 Priority actions SB-05-C2 1. Develop new tools for impact monitoring of mining operations using Earth observations 2. Integrate information from in-situ, airborne and satellite observation (through data assimilation) to provide impact diagnostics 3. Identify and implement strategic measures for the competitive, reliable and sustainable management of geo-resources exploitation and treatment of re-usable materials, based on innovative monitoring and accounting methodologies (see also EN-01) 4. Integrate often-sectoral monitoring approaches (and corresponding impact analysis) into a coherent approach, based on innovative Earth observation techniques (related to space-borne, airborne and groundbased sensor systems) Priority actions EN-01-C1 3. Promote the use of Earth observations for the mapping of geothermal resources, with a focus on the East African Rift System (EARS). Locate geothermal anomalies using thermal and mineral mapping under different climate conditions (desert, savannah, rain forest) 4. Develop and promote the use of integrated Earth observations for each stage of the mineral life cycle (exploration, extraction, transportation, waste disposal, mine remediation and aftercare) to provide the basis for informed decision-making and improved georesources management. Develop a sustainable trialogue between the mining industry, regulators and civil society 2

147 GEO Energy and Georesources Ecosystem EO-MINERS for GEO EO-MINERS contributes significantly to the GEO Work Plan implementation because: Focuses on minerals that are essential for any human activity and high priority for several GEO country members Demonstrates the added value of EOs including space-, air- borne and in situ at the decision making process Addresses users needs Demonstrates synergies between several SBAs Successful collaboration between Geological Surveys in Europe Successful PPP bridging the gaps between academy, private sector, national authorities and general public Follows holistic approach taking into consideration social information EO-MINERS and GEO EO-MINERS initial Objectives identify synergies and gaps between EO-MINERS and GEO mapping mining and environmental observation systems into the GEOSS Societal Benefit Areas identify EO-MINERS contributions to existing GEOSS targets and define new EO-MINERS activities in support of GEOSS Foreseen deliverables proposal for the update of the GEO Work Plan, proposals for follow-on projects to deliver against common EO- MINERS and GEO targets Participation and presentations at GEO Workshops and Conferences. Organisation of GEO and Minerals workshops EO-MINERS other GEO mining related projects: (potential) collaborations GEO Mining related activities 1. Energy Resources including fossil fuels GEO Mining related activities 1. Energy Resources including fossil fuels Environmental impact monitoring of mining operations [ImpactMin] Scale: Project (Bosnia and Herzegovina, Romania, Sweden, and Russia) Description: Environmental impact monitoring of mining operations using EO techniques. Four pilot projects have been undertaken in Mostar Valley, Bosnia and Herzegovina; Rosia Montana, Romania; Kristineberg, Sweden; and Karabash, Russia. Innovation: New methods and a corresponding tool-set for environmental impact monitoring have been developed. Scale: Global/ Project (Poland) Description: General activities: Monitoring applications for changing atmospheric composition due to fuel combustion and land subsidence due to mining a)emission trends NOx b)emission trends CO c)land subsidence Specific Example: The location of subsidence areas are strongly correlated with the Land cover change and land subsidence due to coal location of exploitation fields within mining areas of Kazimierz-Juliusz and Sobieski coal mines [EnerGEO] mining activities were assessed. Innovation: Correlation between the location of subsidence areas and the location of exploitation fields 3
, and predictive map of conflicts between licensed gold exploration and other land use")
![(right) in East Senegal [AEGOS] Focus: Africa Description: Establishing a preparatory phase for building a pan- African spatial data infrastructure (SDI) making accessible data and knowledge on](/docs-images/73/68514255/images/148-3.jpg "georesources i.e. minerals, construction materials, groundwater and geothermal energy [AEGOS]. After developing governance maps on mineral potential/mining activities vs.")
.")

148 GEO Mining related activities 1. Energy Resources including fossil fuels GEO Mining related activities 1. Energy Resources including fossil fuels Map of conflicts between existing gold mining and other land use (left), and predictive map of conflicts between licensed gold exploration and other land use (right) in East Senegal [AEGOS] Focus: Africa Description: Establishing a preparatory phase for building a pan- African spatial data infrastructure (SDI) making accessible data and knowledge on georesources i.e. minerals, construction materials, groundwater and geothermal energy [AEGOS]. After developing governance maps on mineral potential/mining activities vs. land use planning (through pilots in Ghana and Senegal), the group presently works on involving AEGOS in the geographic information systems component of the African Union Action Plan for implementing the Africa Mining Vision, as a partner project of the new African Minerals Development Centre (AMDC). The pixel-level changing trend analysis of vegetation from 2000 to 2011 (data sets of 250m-1000m resolutions (SPOT-4/5 NDVI and EVI) as applied to 12-year monitoring of surface vegetation variation. Images indicate that the local vegetation had generally improved in the world s largest coal mining area, which is ascribed to environment preservation policy and special investment on vegetation recovery. Focus: China/ Project (Shendong (world s largest coal mining area)) Description: Satellite-based vegetation change monitoring is the key to long-term environmental assessment of coal mining. Innovation: First time that this high resolution approach has been used for such a large area of mining activities. This tool demonstrated the impacts of the environmental preservation policy and of vegetation recovery activities. GEO Mining related activities Potential contributions: Regional to global initiatives 2. Energy Mix Scenarios Decision making process [EnerGEO] Power generation and CO2 emissions for the three low carbon scenarios. [EnerGEO] Focus: Regional (Europe) Description: A modelling platform to forecast and monitor the environmental and health impact of changes in the energy mix for alternative energy scenarios. This platform includes: Integrated assessment models for designing and evaluating mitigation strategies for fossil fuels installation. Currently, the Team has developed a fossil fuel pilot that correlates the particulate matter, ozone and mercury emissions from fossil fuels to atmospheric levels of air pollutants with the use of Chemistry transport models (CTM). A modeling framework that incorporates energy potential maps into energy models and subsequently integrated impact assessment models. The PECOMINES project methodology Mineral map of Australia from ASTER imagery by CSIRO (now in IN-02-C2) Mineral resource of Afghanistan from ASTER and HyMap imagery by USGS EuroGeoSurveys EGDI EO-MINERS GEO Programmes (tasks) 4
 and possibly the source of the dust (mining, other industry, roads etc) Soil quality the level of toxic substances in")


 * Independent validation databases * Global Land Cover Portal * Growing int l consensus Manila Global & Local Urban Footprints (CN, EC, DE, GR, IT, PK, US, EEA) Related Indicator:")
 * Global night-time lights for 2012 Rapid & Open Disasters Information (DE, IT, JP, TR, US, CEOS, EPOS, ESA) Related Indicator: Geotechnical hazards and accidents More Water Information")
 Precip * Global high-res precipitation datasets 1979-2010 * New Soil Moisture OS products & soil moisture datasets 1978-2010 *")
149 EO-MINERS GEO Programmes(tasks) DATA Potential uses of EO data during the mining and processing stages include: Land-use the extent of workings, mine waste dumps, mine infrastructure, Air quality the amount of dust particles in the air, what the dust is made up of (toxic metals) and possibly the source of the dust (mining, other industry, roads etc) Soil quality the level of toxic substances in the soil, where these occur and where they may have came from Water quality where acid mine drainage (AMD) may be occurring, the source of the problem, where AMD could travel along rivers and areas at risk Transport where and how many roads occur in the area, how the roads break-up productive land and how close communities live to busy roads carrying mining related vehicles Geotechnical hazards and accidents identifying areas with ground stability problems due to mine related subsidence, risks of large mine dumps becoming unstable and the location of underground fires Social impact mapping residential land-use including both formal and informal settlements and how these change over time GEO tasks GEO Global Land Cover task GEO Health task/geo Weather task GEO Forest task/geo Water task GEO Water task GEO Urban task/geo Global Land Cover task GEO Disasters task GEO Impacts task Minerals as part of the Earth System BGS Economic vulnerability/resilience GEO Urban task/geo Global map areas of informal settlements to understand the impact on local infrastructure Land Cover task Source: EO-MINERS-Publicity Leaflet 5 - Earth Observation Advanced Land-Cover Products (CA,CN,EC,GR,JP,NL,NG,ES,SE,UK,USA,EEA,ESA,GTOS,ISPRS) Related Indicator: Land-use, Transport, Economic vulnerability/resilience * Global 30m products * Major land cover types (e.g., settlements) * Independent validation databases * Global Land Cover Portal * Growing int l consensus Manila Global & Local Urban Footprints (CN, EC, DE, GR, IT, PK, US, EEA) Related Indicator: Transport, Economic vulnerability/resilience * 35-yr evolution of 26 mega-cities * Over cities mapped using ASTER (15m), - European Urban Atlas (global products with all the settlements under development) * Global night-time lights for 2012 Rapid & Open Disasters Information (DE, IT, JP, TR, US, CEOS, EPOS, ESA) Related Indicator: Geotechnical hazards and accidents More Water Information (AT, EC, DE, JP, US, CEOS, ESA, WCRP, WMO) Related Indicator: Soil quality, Water quality * Hawaii Supersite fully operational * 3 new Supersites (Europe) * Supersites selection & definition * In-situ and space data * All data online Soil Moisture (SMOS, ESA) Precip * Global high-res precipitation datasets * New Soil Moisture OS products & soil moisture datasets * Satellite data validation * Global Drought Information System underway * Asian/African Water Cycle Initiative 5
 Service Monitoring Clearinghouse (CH) Component & Service Register Registry (CSR) Resources Providers harvest GEOSS Resources Services and SW Applica ons *")

150 Data Accessibility and Discoverability Data Accessibility and Discoverability Discovery & Access GEOSS User GEO Web Portal GEOSS Registries: Standards & Interoperability User Requirements Discovery and Access Best Prac ces Wiki Broker (DAB) Service Monitoring Clearinghouse (CH) Component & Service Register Registry (CSR) Resources Providers harvest GEOSS Resources Services and SW Applica ons * Prototype e.g. So ware, Data Access, Processing, capabili es Community Portals, Documents GEOSS Common Infrastructure Seman c Component* Integrated/Federated EO Discovery/Access Systems e.g. GENESI, CWIC, FedEO* real- me search data data EO data Catalogues & Repositories e.g. IDN, INSPIRE, geo.data.gov Infrastructure Currently more than 14,000,000 resources Accessibility and discoverability of data Outreach / Users Engagement EO-MINERS communication at GEO events Target audience GEO Members and Participating organizations GEO scientific community New GEO Website Newsletters GEO Events (Plenary, Ministerial) GEO Plenary XIII, Geneva, April 2012 Presentation of first achievements and key impediments Recommendations included in the GEO report "Minerals in GEO" EO-MINERS internal workshop, Ljubljana July 2012 EC DG RTD and GEO secretariat attendance First mapping of minerals in GEO GEOSS tasks EO-MINERS side event at GEO Plenary IX, Foz de Iguaçu, November 2012 Opportunities for global mineral mapping (IN-02-C2) Potential for a "mineral component" in EN-01 Way forward Post-2015 (as recommended by post-2015 WG and interpreted by GEO Secretariat for this presentation): GEO will continue through Employ methods and strategies to attract additional resources Focus on the development of global initiatives Maintain SBAs but allow modifications Promote regionally-based implementation of GEOSS (regional nodes) Strengthen the role of the Community of Practices (user oriented) Engagement with the UN organisations Engagement with the Private Sector (PPPs) Integrate social and economic data Enhance communication and outreach Way forward Near-term: Establishment of a GEO Coal and Environmental Working group Global Initiative on Coal and Environment So far - Under establishment by Prof. Lixin Wu -Sends invitations to experts from around the world -Important: Participation of the EO-Miners community - Proposal for a side event / 1 st meeting of the GEO the GEO Week (Plenary/Ministerial) -Proposed date January 15th afternoon, ½ day Please note that the integration of the activities of this working group in the GEO Work Plan is the subject of recommendation from the GEO country members during the Work Plan review process 6

151 Conclusion EO-MINERS contribution is essential for GEO there are potentials for further collaborations with other GEO scientific communities, the GEO country members and the GEO Secretariat Back up slides and we would be happy to explore them in more details. Thank you for your attention GEO EGDI Links Strategic objectives Mining companies, regulatory bodies and stakeholders need various EObased tools and methods adequately juxtaposed regarding the local contexts and applications (in compliance with GEO and GMES objectives and tasks). Forecasting impacts and footprints and relevant remediation measures require developing prospective tools. GIS using EO data will enable to visualise prospective evolution over time (flow modelling), playing on one or several GIS-layer parameter. For instance, population migration flow is often taken into account during the pre-feasibility phase, but not properly monitored further. Cumulative impacts must be adequately addressed at regional scale (valley, district...), including induced impacts (population migration, livestock impact ) with respect to the concept of heavily exploited area. As the EU is strongly interested in the establishment of measures for raw material flow analysis, especially for imported mineral resources, this project will contribute to the development of measures that can be used to analyze the mining operations taking the individual potential ecological and societal footprint into account. EO-MINERS for GEO Plan Previous slide: potential collaboration with these task on data (1slide) Examples with activities of these tasks that are related to mining (4-5 slides describe fast and the most essential) (use for indicators and Alexia s slides for highlights) These data are accessible and discoverable through GEOSS that could be used as portal The data sharing principals contribute to the increase of the number of these data Also potential collaboration with the GEO Secretariat at the outreach (communication manager) GEO EGDI Links Scientific and technical objectives The social acceptability of a mining project, from exploration to closure, is among the major key issues to be dealt with. EO-MINERS scientific and technical objectives are to: assess policy requirements at macro (public) and micro (mining companies) levels and define environmental, socio-economic, societal and sustainable development criteria and indicators to be possibly dealt using Earth Observation (EO); use existing EO knowledge and carry out new developments on demonstration sites to demonstrate the capabilities of integrated EObased methods and tools in monitoring, managing and contributing reducing the environmental and societal footprints of the extractive industry during all phases of a mining project and contribute making available reliable and objective information about affected ecosystems, populations and societies, to serve as a basis for a sound trialogue between industrialists, governmental organisations and stakeholder Institutions Networking Governance Data sharing GEO EGDI Links Infrastructure Space-based + in situ instrumentation Architecture + Data management + Data portals Software + tools GEOSS Deliverables Information for supporting decision-making Human capital Experience + expertise Informal + formal Capacity building 7


152 GEO EGDI Links WP2. Stakeholders consultations Data Accessibility and Discoverability Data and services needs assessment Resources Introduction of the Brokering approach (Sep) 2011 (Nov) 2012 (Nov) Resources Data Legal and Organizational aspects In practice The GEOSS 10-Year Implementation Plan (2005), which is endorsed by all GEO Members, states: The societal benefits of Earth observations cannot be achieved without data sharing and then goes on to set out the GEOSS Data Sharing Principles GEOSS Data Sharing Principles There will be full and open exchange of data, metadata and products shared within GEOSS, recognizing relevant international instruments and national policies and legislation. All shared data, metadata and products will be made available with minimum time delay and at minimum cost. All shared data, metadata and products being free of charge or no more than cost of reproduction will be encouraged for research and education. Mainly attached to the international energy targets 1. double the share of renewable energy in the global energy mix, 2. ensure universal access to modern energy services, and 3. double the global rate of improvement in energy efficiency in buildings, industry, agriculture, and transportation sectors UN Secretary General s Sustainability Energy for All (SE4All) Initiative GEO Minerals related tasks SB-05-C2 Recent Progress and Key Outputs (as reported at the SB-05- C2 GEO Component Sheet end of May 2012, with contribution from EO-MINERS and ImpactMin projects, under updating( Stéphane Chevrel (BRGM): Stuart Marsh (BGS): Leads (Point of Contact) SB-05-C2 and Contributes to EN-01-C1 Leads SB-05-C2 Integration of spaceborne, airborne and ground-based EO datasets into mature, stakeholder-oriented EO products Integrated EO-based products and tools to monitor the societal and environmental impact of the extractive industry over all phases of a project, from exploration to closure Starting on-site trialogue (industry, regulators, local communities) activities E-training program for impact monitoring from EO 8

153 Data Legal and Organizational aspects GEOSS Data Sharing Principles Extreme Weather Early Warning (AU, BR, CA, CH, FR, JP, KR, UK, US, ECMWF, WMO) Related Indicator: Air quality Legal, Semantic and Technical data interoperability There will be full and open exchange of data, metadata and products shared within GEOSS, recognizing relevant international instruments and national policies and legislation. All shared data, metadata and products will be made available with minimum time delay and at minimum cost. All shared data, metadata and products being free of charge or no more than cost of reproduction will be encouraged for research and education. * Warnings for 4 types of extreme weather (warm, cold, precip, wind) * Multi-model products * TIGGE 5-yr global database * 10 leading forecast centers * 100 s of users 9
154 Minerals and GEO Sustainable mineral resources have risen up the agenda in Europe and Internationally: How should initiatives like GEO evolve to reflect that? What kind of observing system is needed to support these changes? And how can we work through initiatives like Copernicus to realise the key elements of that observing system? 1
155 Wrap up and conclusions Need to adress mineral exploraion Contribution to (wastes) volume estimation Secondary raw material Potential for mapping wastes at European scale Products to be made easily acessible to local organisations EO-MINERS need to better define and clarify the meaning of indicators Need for a cost/benefit analysis Develop downstream services Potential for UAVs Potential contribution to environmental and societal excellence public acceptance Land use conflicts Clearly define what is achievable and what is not Possible contribution to global reporting Potential in change detection A possible product : subsidence and induced seismicity European initiative to use these techniques? Better lobby involved parties EO potential for hotspot information Impact on ecosystems and vegetation Illegal activities and practices (law enforcement) Support to emergency management Monitoring progresses in rehabilitation Contribution to integrated planning (new projects) Public authorities to put money on monitoring through EO (CORINE-like projects) Need for timeliness data : service to be developped?); Combien different methodologies to improve accuracy (e.g. combine statistical and EO approaches) Who does the job? (need for independant structure) 1
156

157
158 Front image: Kostolac coal mine (Republic of Serbia), author Bojan Ranković, reprinted with permission. Obrázek v pozadí: uhelný důl Kostolac (Republika Srbsko), autor Bojan Ranković, vytištěno se svolením.
159 EO-MINERS collection of selected products Indicators and Earth Observation Products for the Assessment of the Extractive Industry Environmental and Societal Impacts Material and information for the EO-MINERS workshop at the Sokolovská uhelná demonstration site MARCH, 2013 EO-MINERS project 2013 The EO-MINERS project (Earth Observation for Monitoring and Observing Environmental and Societal Impacts of Mineral Resources Exploration and Exploitation) is executed with financial support from the European Commission under the Seventh Framework Programme, FP7-ENV , Grant Agreement No The publication reflects only the author's views and European Union is not liable for any use that may be made of the information contained. DOI: /eo-miners EO-MINERS eo-miners.eu
160 EO-MINERS collection of selected products List of contributors (in alphabetical order) Surname Name Acronym Institution Country Adar Simon TAU Tel-Aviv University Israel Ben-Dor Eyal TAU Tel-Aviv University Israel Bourguignon Anne BRGM Bureau de Recherches Géologiques et Minières France Chevrel Stephane BRGM Bureau de Recherches Géologiques et Minières France Ehrler Christoph DLR Deutschen Zentrums für Luft- und Raumfahrt Germany Falck Eberhard UVSQ Université de Versailles Saint-Quentin-en-Yvelines France Fischer Christian DLR Deutschen Zentrums für Luft- und Raumfahrt Germany Grebby Stephen R. BGS British Geological Survey United Kingdom Hejny Horst MIRO The Mineral Industry Research Organisation United Kingdom Jelenek Jan CzechGS Česká geologická služba Czech Republic Jordan Colm J. BGS British Geological Survey United Kingdom Kerr Grégoire DLR Deutschen Zentrums für Luft- und Raumfahrt Germany Kopačkova Veronika CzechGS Česká geologická služba Czech Republic Livne Ido TAU Tel-Aviv University Israel Mardhel Vincent BRGM Bureau de Recherches Géologiques et Minières France McEvoy Fiona M. BGS British Geological Survey United Kingdom Mišurec Jan CzechGS Česká geologická služba Czech Republic Notesco Gila TAU Tel-Aviv University Israel Palumbo-Roeindex Barbara BGS British Geological Survey United Kingdom Rogge Derek DLR Deutschen Zentrums für Luft- und Raumfahrt Germany Šolar Slavko V. GeoZS Geološki zavod Slovenije Slovenia Teršič Tamara GeoZS Geološki zavod Slovenije Slovenia Wittmer Dominic WI Wuppertal Institut Germany Žibret Gorazd GeoZS Geološki zavod Slovenije Slovenia This work should be cited by using DOI, as: Žibret G, Adar S, Ben-Dor E, Bourguignon A, Ehrler C, Falck E, Fischer C, Grebby SR, Hejny H, Jelenek J, Jordan CJ, Kerr G, Kopačkova V, Livne I, Mardhel V, McEvoy FM, Mišurec J, Notesco G, Palumbo-Roe B, Rogge D, Šolar SV, Teršič T, Wittmer D, Chevrel S. Indicators and Earth Observation Products for the Assessment of the Extractive Industry Environmental and Societal Impacts - Material and information for the EO-MINERS workshop at the Sokolovská uhelná demonstration site. EO-MINERS project, 2013, DOI: /eo-miners List of Abbreviations: AHS AMD ATI DEM DOC EO EO-MINERS GIS GEODIS HyMAP ICP-MS ph RSL Airborne Hyper-Spectral imaging sensor, covering reflective and thermal domain a remote sensing method Acid Mine Drainage phenomena where due to oxidation processes in soil/rocks waters become acidic Apparent Thermal Inertia the property of material to preserve heat Digital Elevation Model a model of the terrain, which can be used to generate realistic 3D images Dissolved Organic Matter this parameter tells you how much organic matter is dissolved in water Earth Observation a broad range of techniques which are used to gain the data about the environment acronym for this project, co-funded by EC commission Geographical Information System a kind of database which allows the storage and analysis of geographical data A company situated in Brno Airborne hyperspectral imaging sensor, covering reflectance domain an instrument usually mounted on a plane which is used for remote sensing Inductively coupled plasma mass spectrometry - a method for chemical analysis of soils and other materials measure for soil acidity/alkalinity; low ph means that toxic elements might become dissolved in water, thus possessing risks to environment and health Remote Sensing Laboratory
161 EO-MINERS collection of selected products Indikátory a produkty dálkového průzkumu Země pro hodnocení environmentálních a sociálních dopadů těžebního průmyslu Informační materiál pro workshop projektu EO- MINERS Sokolovská hnědouhelná pánev zkušební lokalita BŘEZEN, 2013 projekt EO-MINERS 2013 Projekt EO-MINERS (Earth Observation for Monitoring and Observing Environmental and Societal Impacts of Mineral Resources Exploration and Exploition) je finančně podporován v rámci 7. rámcového programu Evropské komise FP7-ENV , grant č Publikace reflektuje pouze osobní názory autorů a Evropská unie není nijak zodpovědná následky vyplývající z použití uvedených informací. DOI: /eo-miners EO-MINERS eo-miners.eu 2
162 EO-MINERS collection of selected products Seznam přispěvatelů (řazeno abecedně): Příjmení Jméno Akronym Instituce Stát Adar Simon TAU Tel-Aviv University Izrael Ben-Dor Eyal TAU Tel-Aviv University Izrael Bourguignon Anne BRGM Bureau de Recherches Géologiques et Minières Francie Chevrel Stephane BRGM Bureau de Recherches Géologiques et Minières Francie Ehrler Christoph DLR Deutschen Zentrums für Luft- und Raumfahrt Německo Falck Eberhard UVSQ Université de Versailles Saint-Quentin-en-Yvelines Francie Fischer Christian DLR Deutschen Zentrums für Luft- und Raumfahrt Německo Grebby Stephen R. BGS British Geological Survey Velká Británie Hejny Horst MIRO The Mineral Industry Research Organisation Velká Británie Jelenek Jan CzechGS Česká geologická služba Česká republika Jordan Colm J. BGS British Geological Survey Velká Británie Kerr Grégoire DLR Deutschen Zentrums für Luft- und Raumfahrt Německo Kopačkova Veronika CzechGS Česká geologická služba Česká republika Livne Ido TAU Tel-Aviv University Izrael Mardhel Vincent BRGM Bureau de Recherches Géologiques et Minières Francie McEvoy Fiona M. BGS British Geological Survey Velká Británie Mišurec Jan CzechGS Česká geologická služba Česká republika Notesco Gila TAU Tel-Aviv University Izrael Palumbo-Roeindex Barbara BRGM Bureau de Recherches Géologiques et Minières Francie Rogge Derek DLR Deutschen Zentrums für Luft- und Raumfahrt Německo Šolar Slavko V. GeoZS Geološki zavod Slovenije Slovinsko Teršič Tamara GeoZS Geološki zavod Slovenije Slovinsko Wittmer Dominic WI Wuppertal Institut Německo Žibret Gorazd GeoZS Geološki zavod Slovenije Slovinsko Tento dokument by měl být citován jako: Žibret G, Adar S, Ben-Dor E, Bourguignon A, Ehrler C, Falck E, Fischer C, Grebby SR, Hejny H, Jelenek J, Jordan CJ, Kerr G, Kopačkova V, Livne I, Mardhel V, McEvoy FM, Mišurec J, Notesco G, Palumbo-Roe B, Rogge D, Šolar SV, Teršič T, Wittmer D, Chevrel S. Indicators and Earth Observation Products for the Assessment of the Extractive Industry Environmental and Societal Impacts - Material and information for the EO-MINERS workshop at the Sokolovská uhelná demonstration site. EO-MINERS project, 2013, DOI: /eo-miners Seznam zkratek: AHS Airborne Hyper-Spectral imaging sensor, letecký hyperspektrální sensor pořizující obrazová data v optické a termální části spektra AMD Acid Mine Drainage (kyselé důlní vody) jev, při kterém v důsledku oxidačních procesů v půdě/horninách dochází k okyselení vody ATI Apparent Thermal Inertia (zdánlivá tepelná setrvačnost) parametr vyjadřující schopnost materiálu udržet teplo DEM Digital Elevation Model (Digitální výškový model) model terénu který může být využit k tvorbě realistických 3D pohledů DOC Dissolved Organic Matter (Rozpuštěná organická hmota) parametr vyjadřující množství organické hmoty rozpuštěné ve vodě EO Earth Observation (pozorování Země) široké spektrum metod které jsou využívány k získání dat o zemském povrchu a životním prostředí EO-MINERS označení projektu spolufinancovaného Evropskou komisí GIS Geographical Information System (Geografický informační systém) druh databázového systému umožňujícího ukládání a analýzy prostorových geografických dat. GEODIS GEODIS Brno spol. s.r.o. HyMAP letecký hyperspektrální senzor pořizující obrazová data v optické části spektra ICP-MS Inductively coupled plasma mass spectrometry chemická analytická metoda pro zpracování vzorků půdy a dalších materiálů ph parametr popisující kyselost/zásaditost prostředí; nízké hodnoty ph představují riziko spojené s možným rozpouštěním toxických látek ve RSL Laboratoř dálkového průzkumu Země 3
163 EO-MINERS collection of selected products Table of contents Contents 1. EO-MINERS project introduction Představení projektu EO-MINERS Dialogue with stakeholders Dialog zúčastněných subjektů Indicators of mining impact Indikátory dopadů těžby Sokolov demonstration site-specific indicators Specifické indikátory pro lokalitu Sokolovsko EO-MINERS outputs Finální výstupy projektu EO-MINERS Spatial distribution of geological materials in soil Prostorová distribuce vybraných minerálů v odkrytých substrátech Clay abundance Nabohacení odkrytých substrátů jílovými minerály Relative abundance of clay versus quartz rich soils based on AHS emissivity data Relativní nabohacení odkrytých materiálů jílovou a silikátovou složkou vytvořené na podkladě leteckého termálního snímkování (sensor AHS) Surface ph using aerial hyper spectral data (HyMap) Modelování ph povrchu s využitím leteckých hyperspektrálních dat (HyMap) Surface water quality monitoring using aerial hyperspectral data (HyMap) Použití leteckých hyperspektrálních dat (senzor HyMap) ke sledování kvality povrchových vod Spatial distribution of Fe-oxide locations potentially associated with Acid Mine Drainage (AMD) Prostorové rozložení oblastí s výskytem oxidů železa, které jsou potenciálně spjaty s odtokem kyselých důlních vod Potential drainage contamination by AMD
164 EO-MINERS collection of selected products Table of contents 5.7. Potenciální kontaminace odtokového systému kyselými důlními vodami Change detection over Sokolov open pit mining area using Hyperspectral technology Detekce změn s využitím technologie hyperspektrálního snímkování v oblasti hnedouhelných dolů na Sokolovsku Night-time surface temperature map Mapa noční povrchové teploty povrchu Apparent Thermal Inertia of the surface Zdánlivá tepelná setrvačnost povrchu C-rich + Fly Ash and silicates distribution Prostorová distribuce materiálu bohatého na uhlík, polétavého popílku a materiálu bohatého na silikáty Areas of enriched arsenic content in street dust Obsah arzenu v částicích pouličního prachu Distribution of lead (Pb) in street dust Obsah olova v částicích pouličního prachu Distribution of "coal dust factor" in street dust Potencionální nabohacení částic pouličního prachu uhelnou složkou Assessing forest health status using aerial hyperspectral data (HyMap) Hodnocení zdravotního stavu lesních porostů s využitím leteckých hyperspektrálních dat (HyMap) Appendix 1. Consolidated Set of Candidate Indicators for the EO-MINERS Project Příloha 1. Souhrnný přehled kandidátních indikátorů v projektu EO-MINERS
165 EO-MINERS collection of selected products Project summary and methods 1. EO-MINERS project introduction The mining industry plays a key role in the development of many countries around the world. The industry has been, and continues to be an important contributor to both regional and national economies. Minerals, and the industries it supports, are among the basic building blocks of modern society. While the exploitation of mineral resources in many countries is a vital part of economic growth, employment and infrastructure development, it comes at a cost to the environment. Past mining operations have left an historical legacy of negative environmental impacts that affect our perception of mining. With the emergence of the concept of sustainable development it is now recognised that environmental protection is as fundamental to a healthy economy and society as is development. However, the need to simultaneously promote both economic growth and environmental protection is challenging even in some more developed countries. The aim of the EO-MINERS project is to facilitate and improve interaction between the mining industry and society through the use of Earth Observation (EO) based methods and tools. These methods and tools (using satellite or airborne sensors as well as measurements on site) collect data relevant to a particular area that can be used to assess potential miningrelated environmental and socio-economic impacts. This data, which is freely available, will help to make decision-making processes over the whole life-time of a mine, from exploration to final closure, more transparent. It will support discussion between the mining industry, the regulating authorities and other stakeholders concerned, such as local communities and nongovernmental organisations (NGO's). Importantly, it will empower less technically versed stakeholders. The goal of the EO-MINERS research project is to use EO tools to help reduce miningrelated environmental and societal footprints and improve the societal acceptability of mining projects. In order to achieve this goal, the data collected have to be of high quality, objective and accurate. Data collected using remotely sensed methods fulfil these criteria. The objectives of the project are threefold: (1) To assess what information is needed to empower stakeholders from global to local level on issues relating to the mining industry (from exploration to mine closure and remediation). These needs are then distilled into a set of indicators that can be supported by dedicated EO services. (2) To develop EO tools and services in support of the indicators. These will include existing remote sensing methods and new developments, combined with visualisation methods. 6
166 EO-MINERS collection of selected products Project summary and methods (3) To develop strategies and methods to initiate an open dialogue between the different groups of stakeholders based on reliable and objective information on issues of concern. This approach will be tested at three demonstration sites located in heavily exploited mining areas: In Europe: the Sokolov lignite open cast mines, Czech Republic In Southern Africa: the Witbank Coalfields, Mpumalanga Province, South Africa In Central Asia : the Makmal gold mine, Kyrgyzstan A compendium of best practises for both the application of EO techniques, as well as the effective interaction between the different groups of stakeholders, will be a key outcome of the project. This booklet presents to the stakeholders the results to-date and proposed approaches with a view to solicit comments on their usefulness from the various actors during a series of workshops to be held at the three demonstration sites. 7
167 EO-MINERS collection of selected products Project summary and methods 1. Představení projektu EO-MINERS Těžební průmysl hraje významnou úlohu v rozvoji mnoha zemí světa, jelikož byl a do budoucna pravděpodobně také bude nedílnou součástí mnoha regionálních i národních ekonomik. Lze tedy říci, že těžba nerostných surovin je jedním ze základních stavebních pilířů moderní společnosti. Přestože je využívání přírodních surovin v mnoha zemích důležitým zdrojem ekonomického růstu, rozvoje zaměstnanosti a infrastruktury, znamená současně zátěž pro životní prostředí. Právě negativní dopady, které v minulosti těžba surovin měla na životní prostředí, často ovlivňují i náš současný pohled na hornictví. Se vznikem a uplatňováním koncepce trvale udržitelného rozvoje se ukazuje, že ochrana životního prostředí je pro rozvoj společnosti stejně důležitá jako ekonomický růst. Zajištění ekonomického růstu a současná ochrana životního prostředí však může být velmi obtížné, a to i ve vyspělých zemích. Snahou projektu EO-MINERS je usnadnit a zlepšit vzájemné vztahy mezi těžebním průmyslem a společností pomocí využití metod a nástrojů dálkového průzkumu Země (DPZ). Hlavním cílem projektu je pak s využitím výše uvedených metod a nástrojů napomoci v procesu omezování environmentálních a sociálních dopadů těžby surovin, a v souladu s konceptem trvale udržitelného rozvoje přispět ke zvýšení sociální akceptovatelnosti těžebních projektů. Metody dálkového průzkumu Země, využívající satelitní a letecké senzory, stejně tak jako měření provedená přímo v terénu, umožňují pro danou zkoumanou lokalitu získat data, která hrají při hodnocení možných environmentálních a sociálních dopadů těžby nerostných surovin klíčovou roli. Veřejně dostupná data dálkového průzkumu Země v podobě produktů a služeb mohou napomoci tomu, aby rozhodovací procesy týkající se těžby byly po celou dobu aktivního využívání těžební lokality pro všechny zúčastněné subjekty transparentní. Mezi tyto zúčastněné subjekty mohou patřit jak tvůrci politické koncepce státu, krajské, městské a obecní úřady, tak i veřejnost. Přístup k datům týkajících se těžebních oblastí může pozitivně podpořit dialog mezi zástupci těžebního průmyslu, regulačními úřady (báňské úřady, místní samospráva apod.) a dalšími účastníky, kdy mohou posílit postavení i technicky méně zkušených osob. Proto je i rozvoj odborných kapacit jedním z cílů projektu EO-MINERS. K dosažení výše popsaných cílů je nutné vyžadovat data co nejvyšší kvality, zejména s ohledem na jejich objektivnost, přesnost a spolehlivost. Je zřejmé, že tyto požadavky mohou být v případě produktů dálkového průzkumu velmi dobře naplněny. EO-MINERS je výzkumný projekt, jehož vědecké a technické cíle lze shrnout v následujících třech bodech: (1) Zhodnotit, o jaký druh informací mají jednotlivé zúčastněné subjekty zájem na různých úrovních (od lokální až po celostátní), a tyto požadavky pak převést do podoby sady indikátorů, které mohou být přímo propojeny se službami a produkty dálkového průzkumu 8
168 EO-MINERS collection of selected products Project summary and methods Země. Tyto sady indikátorů jsou definovány ve spolupráci se zástupci jednotlivých zúčastněných subjektů. (2) Vývoj nástrojů a služeb dálkového průzkumu, které jsou propojeny s výše uvedenými sadami vhodných indikátorů. Tato část zahrnuje jak využití již existujících metod, tak i vývoj nových postupů v kombinaci s jejich vhodnou vizualizací. (3) Vývoj strategie k iniciování otevřeného dialogu mezi jednotlivými zúčastněnými stranami založeného na spolehlivých a objektivních informacích týkajících se diskutované problematiky. Tento přístup je v rámci projektu EO-MINERS demonstrován na třech zkušebních lokalitách, které se nacházejí v oblastech silně poznamenaných těžbou surovin: Evropa: povrchové hnědouhelné doly v Sokolovské pánvi (Česká republika) jižní Afrika: uhelné doly Witbank (provincie Mpumalanga, Jihoafrická republika) střední Asie: důl na zlato Makmal (Kyrgyzstán) Souhrnnou snahou projektu je vytvořit přehled osvědčených postupů jak z hlediska aplikace metod dálkového průzkumu, tak i z hlediska efektivity interakce mezi různými zájmovými skupinami. Tento brožura představuje současné výsledky projektu s cílem získat v rámci série workshopů organizovaných na jednotlivých zkušebních lokalitách připomínky k jejich užitečnosti z pohledu různých zúčastněných osob. 9
169 EO-MINERS collection of selected products Project summary and methods 2. Dialogue with stakeholders The dialogue with the stakeholders, to which this workshop contributes, is an important part of EO-MINERS. It builds on the findings from previous interviews with stakeholders in the Sokolov area and on a subsequent analysis of what kind of information is of most relevance for these stakeholders. The purpose of this workshop is to explain the Earth Observation (EO) products and services developed and invite feedback from the participating stakeholders on the: Appropriateness of the selection of indicators and supporting EO products and services Perceived quality of the EO products and services Perceived applicability of the EO products and services More specifically, we ask for the participant's opinion on the following central questions: Do the proposed indicators reflect the participant's information needs? Do the EO products and services appear to measure the right parameters, i.e. do they support the indicators adequately? Does the temporal and spatial resolution provided satisfy the need of the participants? If not, what resolution would be more appropriate? Is the indicator classification adequate for the participants needs? In addition, we would like to receive feedback from the participants on the following: Which is the EO-MINERS products most interesting for them? Please indicate the top three. Would they consider using such an EO product or service? What appears to be the added value of EO-MINERS products and services over alternative options for obtaining relevant information? Do you think you can save time and money by using EO-MINERS products to get relevant information for your decisions? 10
170 EO-MINERS collection of selected products Project summary and methods 2. Dialog zúčastněných subjektů Dialog všech zúčastněných subjektů, k němuž má přispět i tento workshop, je významnou součástí projektu EO-MINERS. Vychází přitom ze zjištění získaných v rámci předchozích interview se zástupci jednotlivých zúčastněných subjektů v oblasti Sokolovska a následné analýzy toho, jaké informace jsou pro tyto zúčastněné subjekty nejrelevantnější a nejpotřebnější. Účelem tohoto semináře je prezentace jednotlivých produktů a služeb dálkového průzkumu Země a současně získání zpětné vazby od jejich potenciálních uživatelů v následujících oblastech: Vhodnost vybraných indikátorů, produktů a služeb dálkového průzkumu. Kvalita produktů a služeb dálkového průzkumu. Praktická využitelnost produktů a služeb dálkového průzkumu. Přesněji řečeno, autoři projektu žádají účastníky o názory na následující otázky: Reflektuje sada vybraných indikátorů potřeby jednotlivých účastníků? Jsou pomocí produktů a služeb dálkového průzkumu sledovány správné parametry tj. jsou tyto produkty adekvátně propojeny s navrhovanými indikátory? Dostačuje časové a prostorové rozlišení nabízených produktů a služeb potřebám jednotlivých účastníků? Pokud ne, jako rozlišení by tyto požadavky uspokojilo lépe? Je navrhovaná klasifikace vybraných indikátorů adekvátní k potřebám jednotlivých účastníků? Kromě toho by autoři projektu dále rádi získali od účastníků zpětnou vazbu v následujících otázkách: Které produkty projektu EO-MINERS považujete za nejzajímavější. Označte prosím 3 nejlepší. Uvažujete o používání produktů nebo služeb dálkového průzkumu Země? Jakou přidanou hodnotu vidíte v produktech a službách projektu EO-MINERS ve srovnání s alternativními zdroji relevantních informací. Myslíte si, že používání produktů a služeb navržených v rámci projektu EO-MINERS při vyhledávání relevantních informací může vést k úspoře času a finančních prostředků? 11
171 EO-MINERS collection of selected products Project summary and methods 3. Indicators of mining impact The impact of mining operations on the physical and socio-economic environment can be complex. The effects of decisions made by the mine operators, regulatory bodies or indeed civic society stakeholders are difficult to assess and predict. The absence of reliable and objective site data further complicate monitoring and assessment. Meaningful information on complex environmental or social issues can often be more easily understood when provided in the form of indicators. Indicators offer a metric of the state of complex systems or of issues, or for trends of their development when measurements or observations are repeated over time. A good example of a commonly known indicator is the Gross Domestic Product (GDP) per capita in a given country. It is generally considered an indicator for the wellbeing of the citizens in this country. The GDP is composed of a multitude of accounting steps in a vast array of economic activities that are consolidated into a single value. This value can be followed from year to year and also allows comparisons between different countries, thus indicating change and relative performance. Indicators must be based on measurable quantities or at least observable and distinguishable qualities in order to be useful. While indicators are useful tools to reduce a complex set of diverse data, it should be kept in mind that every process of indicator selection or aggregation inevitably includes both, a gain in clarity but also a loss of information. Indicators need to have a number of specific qualities and properties in order to be useful, and they must have a clearly defined purpose. A multi-pronged approach to developing indicators was chosen in EO-MINERS. The approach consisted of the development of an initial set of indicators by technical experts, the development of site-specific conceptual models and a stage where stakeholders at the demonstration sites have been interviewed (Figure 1). These three processes ran in parallel, but the process went also through several loops of iterations, resulting in a consolidated set of candidate indicators applicable to each of the study sites. This development of meaningful indicators is a social process and not an engineering one. The social process defines what has to be indicated for whom and why. The scientists and engineers, who are also stakeholders in the process, are in charge of the how : they have to evaluate whether the proposed indicators can be related to measurable quantities. For this reason, the proposed set of indicators was reviewed by specialists in order to assess their measurability using Earth Observation (EO) techniques. For the purpose of the EO-MINERS project, only indicators that can be measured using EO techniques have been retained for further work (Figure 2). 12

172 EO-MINERS collection of selected products Project summary and methods A candidate set of 59 indicators covering 11 categories has been developed, namely on: A. Land-use B. Mass and energy flows C. Air quality and other nuisances D. Soil quality E. Water quality F. Transport G. Geotechnical hazards and accidents H. Industrial and other accidents I. Social impact J. Regional development K. Economic vulnerability/resilience The complete set of candidate indicators can be found in Appendix 1. Figure 1. Multiple strategies to develop indicators. Obrázek 1. Strategie vývoje a výběru indikátorů. 13

173 EO-MINERS collection of selected products Project summary and methods 3. Indikátory dopadů těžby Dopady těžby nerostných surovin na fyzické i socioekonomické prostředí mohou mít komplexní charakter. Je přitom obtížné hodnotit a předvídat jaké účinky a následky na něj budou mít rozhodnutí provedená provozovateli těžebních lokalit, regulačními úřady nebo zástupci občanské společnosti. Jejich hodnocení a monitoring navíc dále komplikuje absence spolehlivých a objektivních dat, týkajících se dané lokality. Informace týkající se komplexních environmentálních a sociálních záležitostí mohou být často srozumitelnější, pokud jsou podány ve formě vhodných indikátorů. Tyto indikátory nabízejí jednak srovnávací měřítko pro hodnocení současného stavu těchto komplexních systémů a trendu jejich vývoje, pokud jsou pozorování v průběhu času opakována. Dobrým příkladem všeobecně známého indikátoru je hrubý domácí produkt (HDP) přepočtený na jednoho obyvatele, který je obecně považován za ukazatel blahobytu obyvatel dané země. Výpočet HDP se skládá z velkého množství účetních kroků, které jsou realizovány v širokém spektru různých ekonomických činností a které jsou následně sloučeny do jedné souhrnné hodnoty. Tato hodnota pak může být určována každý rok, takže umožňuje nejen vzájemné relativní srovnání výkonnosti jednotlivých zemí, ale indikuje i její změny v čase. Figure 2. Relationship between different sets of indicators as defined by the EO-MINERS project. Obrázek 2. Vztahy mezi různými soubory možných indikátorů tak, jak byly definovány v projektu EO- MINERS. 14
174 EO-MINERS collection of selected products Project summary and methods K tomu aby byly indikátory dále využitelné, je zapotřebí, aby byly založeny buď na podkladě měřitelných kvantitativních veličin, anebo přinejmenším na pozorovatelných a vzájemně odlišitelných kvalitativních charakteristikách. Přestože jsou indikátory užitečné ke zredukování komplexity různorodých dat, nesmíme zapomínat na to, že proces jejich výběru a agregace vede nevyhnutelně na jedné straně ke zvýšení přehlednosti dat, ale na straně druhé i ke ztrátám informace. Pro další využití tedy musí mít každý indikátor celou řadu specifických vlastností a vždy musí mít jasně definovaný účel. Pro vývoj a výběr indikátorů byl v rámci projektu EO-MINERS zvolen tzv. vícečetný princip. Tento přístup se skládá z ustavení základního souboru indikátorů skupinou technických expertů, vývoje lokálního konceptuálního modelu, který je dále následován fází, během níž dochází k interview se zástupci jednotlivých zúčastněných subjektů (viz obr. 1). Tyto tři procesy probíhají paralelně, avšak celkový postup obsahuje i iterace a opakování některých kroků, přičemž výsledkem je konsolidovaný soubor tzv. kandidátních indikátorů, které jsou použitelné pro jednotlivé zkušební lokality. Vývoj smysluplných indikátorů je sociální (a nikoliv technický) proces, který definuje, co má být komu indikováno a proč. Vědci a technici (kteří jsou rovněž jedním ze zúčastněných subjektů) mají na starosti především otázku jak tento proces prakticky realizovat, přičemž musí ověřovat, zda navrhované indikátory mohou být propojeny s nějakou exaktně měřitelnou veličinou. Z tohoto důvodu byla sada navržených indikátorů zhodnocena specialisty za účelem posouzení jejich měřitelnosti pomocí metod dálkového průzkumu a pro další práci byly v rámci projektu EO-MINERS vybrány pouze takové indikátory, které tuto podmínku splňují (viz obr. 2). Kandidátní soubor 59 indikátorů rozdělených do 11 základních kategorií: A. Využití půdy (land-use) B. Toky hmoty (materiálu) a energií C. Kvalita ovzduší a další škodlivé vlivy D. Kvalita půdy E. Kvalita vody F. Doprava G. Geotechnická rizika a nehody H. Průmyslové a jiné nehody I. Sociální dopady J. Regionální rozvoj K. Ekonomická zranitelnost/pružnost Kompletní seznam kandidátních indikátorů je uveden v příloze 1. 15
175 EO-MINERS collection of selected products Project summary and methods 4. Sokolov demonstration site-specific indicators In 2010 a group of EO-MINERS project scientists visited the Sokolov region and undertook interviews with various actors there. Notes were taken during these interviews. The views or concerns expressed and information needs related were compared to the set of candidate indicators. This allowed evaluating whether an appropriate selection of them would reflect those views, concerns and needs. It was considered useful to group the actors into three broad groups of likely diverging views and interests, namely mine operators, government/regulatory bodies, and civil society actors. Within these groups a further division was made into a group that is likely to have previous knowledge of EO tools, methods and objectives and another group that is likely not to have such knowledge. Having grouped the stakeholders into those where one can assume that they have some knowledge about EO services and those who presumably do not, one observes that the former seem to have a much narrower field of interest (Figure 3). Land-use questions seem of relevance to all. Closely related to this are questions of recultivation success and areas indirectly affected by the mining. Otherwise water quality issues, such as acid mine drainage generation appear to be high on the agenda of most concerned. Comparing, on the other hand, government with civil society stakeholders, one notes that all are concerned about land-use and environmental issues (Figure 4). However, interestingly the civil society stakeholders appear to be less interested in socio-economic issues compared to those in government and administration. Having outlined some of the principal findings from the interviews with actors in the Sokolov area in 2010, the workshop participants are now invited to reflect upon the findings and to indicate, whether they would support these findings or whether they would put different emphasis on the indicators. Participants are also invited to comment on the scope and coverage of these indicators (Appendix 1). For the purposes of directing the development of EO products and services, the set of indicators was selected from the candidate set and is shown in Table 1. For presentation and for discussion at the workshop a number of the EO products and services were selected (Chapter 4). 16
176 EO-MINERS collection of selected products Project summary and methods Table 1. Set of indicators selected for Sokolov area and related EO-MINERS outputs. Causes Environmental issues Indicators Representative EO-MINERS result AMD Water quality & soil properties Water Quality E4: Acid drainage generation potential (distribution of sulphidic iron minerals) Figures: 5 and 8-11 Windblown coal dust, gaseous emissions Atmospheric pollution Air quality and other nuisances D1: Aerosols (particle concentration in off-site air) Figures: Land Use Figures: AMD and Mining Land degradation / loss A1: Total land-use by mining and milling (topographic footprint) A4: Residential land-use (residential developments around mining areas) A6: Sites set aside, protected areas (nature reserves, wetlands, sites of spiritual value and similar) A8: Recultivation success on mined-out areas and waste/spoil heaps (designated mining areas covered by specific vegetation) A9: Soil fertility of remediated mine areas 5 and and , 19 and 20 5, 8, 11, 12, 14 and 16 AMD sources/buffer material Water quality & soil properties Mass Flow B1: Waste volumes generated (volume change versus amount of marketable product) Figure: 12 Overburden instability Landslide Geotechnical hazards and accidents G3: Dam stability (water saturation in retaining dams) Figures: 6, 7 and 14 Self-combustion of coal Coal fires Geotechnical Hazards and Accidents G4: Underground and mining waste deposit fires (number, duration and area affected) Figures: 13 17
177 EO-MINERS collection of selected products Project summary and methods Figure 3. Comparison of frequency between issues mentioned for stakeholders with previous knowledge (2, red) and no knowledge assumed (5, blue). Obrázek 3: Frekvence, se kterou byly zmiňovány jednotlivé problematiky účastníky provedených interview účastníci s předchozími znalostmi dálkového průzkumu (červeně, celkem 2 účastníci), a bez předchozích znalostí (modře, celkem 5 účastníků) 18
 and civil society stakeholders (4, blue).")
178 EO-MINERS collection of selected products Project summary and methods Figure 4. Comparison of frequency between issues mentioned for government stakeholders (3, red) and civil society stakeholders (4, blue). Obrázek 4: Frekvence, se kterou byly zmiňovány jednotlivé problematiky účastníky provedených interview zástupci státních institucí (červeně, celkem 3 účastníci) a zástupci veřejnosti (modře, celkem 4 účastníci) 19
179 EO-MINERS collection of selected products Project summary and methods 4. Specifické indikátory pro lokalitu Sokolovsko V roce 2010 navštívila skupina odborníků v rámci projektu EO-MINERS Sokolovsko a provedla zde interview s různými osobnostmi. V průběhu těchto rozhovorů byly pořizovány poznámky, přičemž názory jednotlivých účastníků těchto rozhovorů a jejich požadavky na informace byly přetvořeny v soubor tzv. kandidátních indikátorů. to umožnilo posoudit, zda vhodný výběr z těchto indikátorů bude odrážet názory, zájmy a potřeby oslovených účastníků. V rámci této fáze bylo považováno za účelné, aby jednotliví oslovení účastníci byli rozděleni do tří hlavních skupin, u nichž byly očekávány rozdílné názory a zájmy, a to na: provozovatele dolů, zástupce státních regulačních orgánů a zástupce veřejnosti. V rámci těchto tří základních skupin bylo dále provedeno další dělení na podskupinu lidí, kteří mají předchozí znalosti nástrojů a metod dálkového průzkumu Země. Druhou podskupinou byly účastníci, kteří žádné předchozí znalosti tohoto odboru neměli. Po seskupení oslovených účastníků na ty, kteří již mají dřívější zkušenosti s prudukty dálkového průzkumu a na ty, kteří tyto zkušenosti nemají, bylo zjištěno, že okruh zájmů účastníků s předchozími znalostmi dálkového průzkumu je mnohem užší než v případě účastníků bez předchozích znalostí (Obr. 3). Zdá se, že například otázky týkající se využití půdy (land-use) jsou relevantní pro všechny skupiny oslovených účastníků, jelikož toto téma je velice úzce spjato s otázkami týkajícími se úspěšnosti rekultivací a zacházením s oblastmi, jenž jsou těžbou ovlivňována pouze nepřímo. Naopak otázky týkající se kvality vody, jako například problematika vzniku kyselých důlních vod, se zdají být jedním z hlavních témat pro většinu oslovených. Při srovnání skupin reprezentujících státní zúčastněné subjekty (různé úřady apod.) a skupiny reprezentující zástupce veřejnosti lze odvodit, že obě tyto skupiny mají zájem o problmatiku land-use a o otázky týkající se životního prostředí (Obr. 4). Nicméně je zajímavé, že skupina reprezentující zástupce veřejnosti projevuje menší zájem o socieekonomické otázky v porovnání se zástupci oficiálních státních úřadů a institucí. Po nastínění některých zásadních zjištění, která byla učiněna v rámci rozhovorů v roce 2010 jsou nyní účastníci semináře vyzývání k tomu, aby se k těmto zjištěným skutečnostem vyjádřili, zda s těmito závěry souhlasí nebo zda by raději kladli důraz na jiné skupiny indikátorů. Účastníci semináře jsou rovněž vybízení k tomu, aby ohodnotili zaměření a rozsah navrhovaných indikátorů (Příloha 1). Pro potřeby řízení vývoje produktů a služeb dálkového průzkumu byl z původní sady kandidátních indikátorů vybrán nový soubor indikátorů, které jsou uvedeny v Tabulce 1.Pro potřeby prezentace a následné diskuse v rámci tohoto semináře byly rovněž vybrány příklady různých produktů a služeb dálkového průzkumu týkající se oblasti Sokolovska (Kapitola 5). 20
180 EO-MINERS collection of selected products Project summary and methods Tabulka 1.Soubor indikátorů vybraných pro oblast Sokolovska a s nimi související produkty projektu EO-MINERS. Příčiny Environmentá lní problematika Indikátory Relevantní výstupy projektu EO- MINERS kyselé důlní vody (AMD) kvalita vody a charakteristiky půdy Kvalita vody E4: Potenciál vzniku kyselých důlních vod (distribuce sírano-železnatých minerálů) Obrázky č.: 5 and 8-11 polétavý uhelný prach a plynné emise znečištění ovzduší Kvalita ovzduší a další škodlivé vlivy D1: Aerosoly (koncentrace částic v ovzduší) Obrázky č.: Využití půdy (land-use) Obrázky č.: kyselé důlní vody (AMD) a těžební aktivity zdroje kyselých důlních vod (AMD) a materiál v jejich okolí degradace a ztráty půdy kvalita vody a charakteristika půdy A1: Rozsah oblastí využívaných pro A4: Rozsah oblastí využívaných pro bydlení (rozvoj bydlení v okolí těžebních lokalit) A6: Území vyňatá z těžby a chráněná území (přírodní rezervace, mokřady apod.) A8: Úspěšnost rekultivací ve vytěžených oblastí a výsypek A9: Úrodnost půdy na rekultivovaných plochách Toky materiálu B1: Objem vygenerovaného odpadu (podíl objemu zpracovávaného materiálu k objemu výsledného produktu) 5 and and , 19 and 20 5, 8, 11, 12, 14 and 16 Obrázky č.: 12 nestabilita výsypek sesuvy svahové nestability Geotechnická rizika a nehody G3: Stabilita retenčních nádrží Obrázky č.: 6, 7 and 14 Geotechnická rizika a nehody Obrázky č.: samovznícení uhlí požáry uhelných slojí G4: Podpovrchové požáry uhlí a odpadních materiálů z těžby (počet, výskyt, doba trvání) 13 21
181 EO-MINERS collection of selected products Sokolov demonstration site EO-MINERS outputs 5. EO-MINERS outputs This chapter provides a selection of outputs, made by using earth observation (EO) techniques during the lifetime of the EO-MINERS project. Only selections of the most representative examples from the vast amount of data collected are presented. Until the project reaches completion, the results presented are able to be regarded as preliminary and may be a subject to change. The final products will be made available on the EO-MINERS web pages at the end of the project. This booklet demonstrates the very broad range of possibilities that EO techniques can offered: determination of surface geological materials (Figures 5-7); soil ph and risks, associated with acid mine drainage (Figures 8-11); detection of changes in time (Figure 11); thermal properties of the area, including water content in soil (Figures 13 and 14); atmospheric pollution with dust (Figures 15-18); vegetational health status (Figures 19 and 20). Image and data processing was cooperatively undertaken by all EO-MINERS partners, each one contributing its own scientific knowledge and expertise. A main contact is provided for each specific product/image should further information be required. Special thanks goes to BRGM, France, for coordination of the project, to the Czech Geological Survey for organising the field campaigns and Sokolovská uhelná for allowing their open-pit coal mine to be used as one of the EO-MINERS test sites. 5. Finální výstupy projektu EO-MINERS V této kapitole jsou představeny finální výstupy projektu EO-MNERS, které jsou postaveny na aplikacích distančních metod pozorován Země. V kapitole jsou ve formě mapových výstupů uvedeny pouze stěžejní výsledky. Popsat veškerá data, která byla pořízena a s kterými se pracovalo, nebylo cílem workshopu. Vzhledem k tomu, že projekt EO-MINERS ještě není ukončen (konec projektu je plánován na 10/2013), jsou představeny pouze produkty, které vznikly v období 01/ /2013. Lze tedy předpokládat, že uváděný výčet není ještě finální. I přesto však předložená brožura ukazuje široké spektrum aplikací využívající distanční data: Vlastnosti geologického materiálu (Obr. 5-7) Povrchové ph a rizika spojená s kyselým prostředím antropogenních substrátů (Obr. 8-11) Detekce změn v čase (Obr. 11) Fyzikální charakteristiky, které lze derivovat na podkladě dat termálního snímání (Obr ) Atmosférické znečištění polétavým prachem (Obr ) Zdraví vegetace (Obr. 19 a 20) Výsledné produkty jsou výsledkem spolupráce celého kolektivu EO-MINERS, každý produkt však má uvedený kontakt na hlavního řešitele, na kterého lze směrovat případné dotazy. Hlavní poděkování patří Francouzské geologické službě (BRGM) za koordinaci celého projektu, České geologické službě za organizování pozemních kampaní a prací na Sokolovsku. Speciální poděkování pak patří společnosti Sokolovská uhelná a. s. za to, že podporovala projekt a poskytla nezbytná povolení pro vstupy na své pozemky a pracovníky, s jejichž pomocí bylo možné uskutečnit pozemní sběr dat. 22
182 EO-MINERS collection of selected products Sokolov demonstration site EO-MINERS outputs Prepared by / Připravil: Contact / Kontakt: These results support indicator / Výsledky jsou podloženy těmito indikátory: DLR Christian Fischer - c.fischer@dlr.de E4, A1, A8, A Spatial distribution of geological materials in soil The thematic map shows geological materials and soils based on the data from the hyperspectral airborne survey using the HyMap sensor system in These materials include variable clays and iron (Fe) content (legend). In addition, the map includes Fe-oxides that may be related to areas with lower hydrogen ion concentrations (ph value), which refer often to locations with an outflow of acidic water and subsequent precipitation of minerals, called Acid Mine Drainage. Materials were determined by observing in the image data and comparing it with field spectral measurements of known materials. The thematic map shows complex spatial distributions of the various materials: soils, weathered tuffs and iron rich clays, coal, gypsum and others. The map documents the mine site environment and the spatial distribution of geological materials within the mining area. The information can be used to support mining management activities, e.g. report activities to mining authorities and legal bodies involved in monitoring aspects. Data processing and product compilation was completed by the Land Surface Department, DLR Prostorová distribuce vybraných minerálů v odkrytých substrátech Tato tematická mapa podává informaci o prostorové rozmístění vybraných minerálů, jež byly identifikovány na podkladě leteckých hyperspektrálních dat HyMap pořízených 07/2009. Byly mapovány minerály s různým obsahem jílových minerálů a Fe-oxidů (viz legenda). Feoxidy mohou identifikovat místa, kde díky nízkému ph substrátového prostředí, může docházet i k okyselování povrchových vod (anglický termín Acid Mine Water - AMD). K identifikaci minerálů byly využity optické vlastnosti cílových minerálů pořízené pozemním spektroradiometrem a jejich následné porovnání s optickými vlastnostmi příslušných pixelu obrazových hyperspektrálních dat. Mapa ukazuje distribuci především následujících materiálů: půda, zvětralé tufy charakteristické vysokým podílem jílových minerálů, jíly bohaté na oxidy Fe, hnědé uhlí, sádrovec a další. Data byla zpracována a výsledná mapa vytvořena německou agenturou pro letectví a vesmír (DLR). 23

183 EO-MINERS collection of selected products Sokolov demonstration site EO-MINERS outputs Figure 5. Spatial distribution of geological materials in soil. Obrázek 5. Prostorová distribuce vybraných minerálů v odkrytých substrátech. 24
184 EO-MINERS collection of selected products Sokolov demonstration site EO-MINERS outputs Prepared by / Připravil: Contact / Kontakt: These results support indicator / Výsledky jsou podloženy těmito indikátory: BRGM Stephane Chevrel - s.chevrel@brgm.fr A8, G Clay abundance This image is a ternary image of clay abundance (kaolinite / smectite in red, kaolinite in green, illite in blue) obtained by applying the Spectral Angle Mapper algorithm to the 2009 HyMap mosaic, using three reference spectra. Terrain stability depends on clay content, the mixture kaolinite - smectite being the less stable Nabohacení odkrytých substrátů jílovými minerály Mapa představuje zastoupení kaolinitu (zelená barva), smektitu (červená barva) a ilitu (modrá barva) v odkrytých substrátech. Byla klasifikována letecká hyperspektrální data HyMap pořízená 07/2009 Pro tento druh identifikace bylo využito metody Spectral Angle Mapper. Vzhledem k fyzikálním vlastnostem smektitu (velké objemové změny spojené s vodním režimem) může vyšší zastoupení smektitu způsobit i nižší stabilitu materiálů. 25
. Obrázek 6.")
185 EO-MINERS collection of selected products Sokolov demonstration site EO-MINERS outputs Figure 6. The clay abundance (kaolinite/smectite in red, kaolinite in green, illite in blue). Obrázek 6. Zastoupení kaolinite (zelená barva), smektitu (červená barva) a ilitu (mudra barva) v odkrytých substrátech. 26
186 EO-MINERS collection of selected products Sokolov demonstration site EO-MINERS outputs Prepared by / Připravil: Contact / Kontakt: These results support indicator / Výsledky jsou podloženy těmito indikátory: DLR & TAU Christian Fischer & Eyal Ben-Dor c.fischer@dlr.de & bendor@post.tau.ac.il A8, G Relative abundance of clay versus quartz rich soils based on AHS emissivity data The spatial distribution of clay versus quartz rich soils was derived from spectral emissivity data collected by the AHS airborne thermal survey flown on July 22, The airborne imagery was corrected for atmospheric influences as well as calibrated and validated against reference measurements taken on site. This map shows the relative spatial distribution of clay versus quartz rich soils based on assessing their individual emissivity values. This information can be used to derive soil properties like fertility and acidity buffering capacity, which are relevant for localized reclamation efforts, assessing soil quality and selection of appropriate reclamation methods. In addition, the data can support evaluating the reclamation success. Beyond clay and quartz separation, processed thermal infrared data can be used to improve land-use/land-cover mapping approaches as many common minerals show distinctive spectral emissivity signatures in the thermal domain. Data processing and product compilation was completed by the Land Surface Department, DLR and TAU Relativní nabohacení odkrytých materiálů jílovou a silikátovou složkou vytvořené na podkladě leteckého termálního snímkování (sensor AHS) Mapa ukazující nabohacování odkrytých substrátů jílovou a silikátovou složkou byla vytvořena na podkladě termálních dat sensoru AHS (data pořízena 07/2012). U dat došlo nejdříve ke korekci vlivu atmosféry, data byla dále korigována a validována na podkladě referenčních pozemních měření. Tato mapa může dále sloužit např. pro zhodnocení vlastností půd, naplánování vhodného způsobu rekultivace, způsobu využití území (land use/land cover) apod. Data byla zpracována a výsledná mapa vytvořena německou agenturou pro letectví a vesmír (DLR) a Univerzitou Tel Aviv (TAU). 27

187 EO-MINERS collection of selected products Sokolov demonstration site EO-MINERS outputs Figure 7. Relative Abundance of clay versus quartz rich soils based on AHS emissivity data. Obrázek 7. Relativní nabohacení odkrytých materiálů jílovou a silikátovou složkou vytvořené na podkladě leteckého termálního snímkování. 28
188 EO-MINERS collection of selected products Sokolov demonstration site EO-MINERS outputs Prepared by / Připravil: Contact / Kontakt: These results support indicator / Výsledky jsou podloženy těmito indikátory: CzechGS Veronika Kopačkova - Veronika.kopackova@seznam.cz E4, A8, A Surface ph using aerial hyper spectral data (HyMap) The ph is a predominant factor in trace element mobilization and distribution. Several trace metals (especially Cd, Zn, Co, Cu and Ni) are readily mobile in such acid soils, which are generally characterized by oxidizing conditions, and are available to vegetation. The surface ph could be modeled by identifying the specific minerals which are stable under certain ph conditions (e.g. jarosite and goethite). The minerals present distinct spectral fingerprints in specific spectral regions and can be identified and also quantified using hyperspectal data Modelování ph povrchu s využitím leteckých hyperspektrálních dat (HyMap) ph je hlavním faktorem v procesu v procesu uvolňování a distribuce různých stopových prvků. Některé stopové kovové prvky (zejména kadmium Cd, zinek Zn, kobalt Co, měď Cu a nikl - Ni) se za daných oxidačních podmínek stávají snadno mobilními a mohou být dále přijímány například rostlinami. Povrchové ph může být modelování pomocí detekce přítomnosti minerálů, které jsou stabilní pouze při určitém rozsahu hodnot ph (např. jarosit nebo goethit). Tyto minerály jsou tedy jakýmisi spektrálními otisky prstů ve specifických oblastech spektra, které mohou být identifikovány a kvantifikovány s využitím hyperspektrálních dat. 29


189 EO-MINERS collection of selected products Sokolov demonstration site EO-MINERS outputs Figure 8. The surface ph map, the geochemical properties and mineralogical composition of the substrate are characterized by using their hyperspectral signatures. High soil acidity (low ph) may be responsible for mobilisation of metals when washed by waters. Obrázek 8. Mapa ph povrchu, geochemické vlastnosti a minerální složení substrátu bylo charakterizováno na podkladě spektrálních signatur. Vysoká kyselost půdy (které odpovídá nízké ph) může být příčinou uvolňování kovových prvků a jejich vyplavování vodou. 30
190 EO-MINERS collection of selected products Sokolov demonstration site EO-MINERS outputs Prepared by / Připravil: CzechGS & Faculty of Science, the Charles University in Prague Contact / Kontakt: Veronika Kopačkova - Veronika.kopackova@seznam.cz These results support indicator / Výsledky jsou podloženy těmito indikátory: E4, A Surface water quality monitoring using aerial hyperspectral data (HyMap) Water has been traditionally monitored by in-situ measurements, taking point samples at regular intervals. But point samples are not adequate to observe spatial and temporal variations in large areas or in polluted regions where the water quality can change dramatically and needs to be monitored on a regular basis. Image spectroscopy (hyperspectral remote sensing) provides a new way to obtain continuous information on water quality at regional scales. In the Sokolov example, we demonstrate how HyMap can be used to estimate selected water parameters (dissolved Fe, inorganic and organic suspension content) using a sub-pixel classification method (Linear Spectral Unmixing) Použití leteckých hyperspektrálních dat (senzor HyMap) ke sledování kvality povrchových vod Voda je tradičně sledována pomocí fyzických měření v místě pozorování (tzv. in-situ), což znamená sbírání dat v pravidelných intervalech přímo v terénu. Bodová měření jsou však nevhodná pro sledování plošné kvality vody nebo pro sledování časových změn v kvalitě vody na velkém území. Problém vzniká také při sledování kvality vody v zamořených či znečištěných oblastech, kde se kvalita vody mění velmi rychle na malých vzdálenostech. V takových oblastech je navíc nutné měřit kvalitu vody v krátkých časových intervalech, což při tradičním in-situ měření značně zvyšuje náklady. Obrazová spektroskopie (neboli hyperspektrální dálkový průzkum Země) představuje nový způsob získávání kontinuálních měření kvality povrchových vod na regionální úrovni. Na příkladu Sokolovska lze ukázat, jak mohou být využita letecká hyperspektrální data (senzor HyMap) k určení vybraných charakteristik povrchových vod (rozpuštěné ionty železa, anorganické a organické částice). Využitou metodou je sub-pixelová klasifikace obrazu (Linear Spectral Unmixing LSU). 31
 Estimated dissolved Fe content, additionally the ground measurements of dissolved Fe which were used for validation are also displayed.")
191 EO-MINERS collection of selected products Sokolov demonstration site EO-MINERS outputs (a) (b) (c) Figure 9. (a) Estimated dissolved Fe content, additionally the ground measurements of dissolved Fe which were used for validation are also displayed.(b) Estimated organic suspension, additionally the ground measurements (DOC- Dissolved Organic Matter content) which were used for validation are also displayed. (c) Estimated inorganic suspension, additionally the ground measurements of suspension content which were used for validation are also displayed. Obrázek 9. (a) Odhadovaný obsah rozpuštěného železa se zobrazenými pozemními měřeními železa, které byly použity k validaci. (b) Odhadované organické suspenze se zobrazenými pozemními měřeními (DOC obsah rozpuštěných organických látek), které byly použity k validaci. (c) Odhadované anorganické suspenze se zobrazenými pozemními měřeními suspendovaných částic, které byly použity k validaci. 32
192 EO-MINERS collection of selected products Sokolov demonstration site EO-MINERS outputs Prepared by / Připravil: Contact / Kontakt: These results support indicator / Výsledky jsou podloženy těmito indikátory: DLR Christian Fischer - c.fischer@dlr.de E4, A Spatial distribution of Fe-oxide locations potentially associated with Acid Mine Drainage (AMD) This image shows Fe-oxides related to AMD overlaid on the Digital Elevation Model of terrain. Exposed Fe-oxides related to AMD are rare and occur as small clusters of pixels (insets) spatially associated with active mining, overburden dump sites and in rehabilitation sites. Fe-oxide locations from 2009 (red) and 2010 (green) airborne data are included. This map highlights the sparsity of the distribution of the AMD related sights, which is important to describe and evaluate possible environmental impacts on surface water and vegetation. For possible risk assessment, data sets can be used with vector drainage information generating buffering zones by using standard GIS routines. The information can be used to support mining management activities, such as reporting activities to mining authorities and legal bodies involved in monitoring aspects. Data processing and product compilation was completed by the Land Surface Department, DLR Prostorové rozložení oblastí s výskytem oxidů železa, které jsou potenciálně spjaty s odtokem kyselých důlních vod Tento obrázek ukazuje oxidy železa spjaté s kyselými důlními vodami zobrazené nad digitálním modelem terénu. Odkryté oxidy železa spjaté s kyselými důlními vodami jsou vzácné a na obrázku se objevují jako malé shluky pixelů (zobrazené na vloženém obrázku), prostorově svázané s aktivní důlní činností, přetíženými výsypkami a rekultivovanými oblastmi. Obrázky zahrnují oblasti oxidů železa indikované na leteckých snímcích z let 2009 (červeně) a 2010 (zeleně). Mapa dále zdůrazňuje řídké rozložení jevů spojených s kyselými důlními vodami, které jsou důležité pro popis a vyhodnocení možných dopadů na životní prostředí, na povrchovou vodu a na vegetaci. Vyhodnocení možného rizika lze provést pomocí standardních GIS (Geoinformačních systémů) metod, jako je buffer, neboli obalová zóna určité velikosti, kolem linií povrchového odtoku. Informace z takového postupu může být použita jako podpora rozhodování při těžebních aktivitách, jako například pravidelná hlášení těžebním úřadům a dalším právním subjektům zahrnutým v monitoringu. Zpracování dat a vytvoření výsledného produktu bylo provedeno oddělením Land Surface Department (LAX), německého kosmického centra (DLR). 33

193 EO-MINERS collection of selected products Sokolov demonstration site EO-MINERS outputs Figure 10. Spatial Distribution of Fe-Oxide locations potentially associated with AMD. Obrázek 10. Prostorové rozložení oxidů železa, potenciálně spjatých s kyselými důlními vodami. 34
194 EO-MINERS collection of selected products Sokolov demonstration site EO-MINERS outputs Prepared by / Připravil: Contact / Kontakt: These results support indicator / Výsledky jsou podloženy těmito indikátory: BRGM Vincent Mardhel - v.mardhel@brgm.fr E4, A8, A Potential drainage contamination by AMD This map represents the potentially contaminated downstream flow from an AMD source located on the Western flank of a major overburden dump. It had been computed using a modified flow accumulation algorithm applied to the 5-m photogrammetric Digital Elevation Model from GEODIS Potenciální kontaminace odtokového systému kyselými důlními vodami Tato mapa představuje potenciálně kontaminované odtoky z oblasti západního svahu hlavní výsypky, kde se nachází zdroj kyselých důlních vod. K výpočtu potenciální kontaminace bylo použito algoritmu akumulovaného odtoku, aplikovaného na fotogrammetrický digitální model terénu s rozlišením 5 metrů od firmy GEODIS. 35

195 EO-MINERS collection of selected products Sokolov demonstration site EO-MINERS outputs Figure 11. Potential drainage contamination by AMD. Obrázek 11. Potenciální kontaminace odtokového systému kyselými důlními vodami. 36
196 EO-MINERS collection of selected products Sokolov demonstration site EO-MINERS outputs Prepared by / Připravil: Contact / Kontakt: These results support indicator / Výsledky jsou podloženy těmito indikátory: TAU Eyal Ben-Dor - bendor@post.tau.ac.il A1, A8, A9 and B Change detection over Sokolov open pit mining area using Hyperspectral technology A change detection map based on two HyMap images acquired over the same lignite openpit mining site in Sokolov in summers 2009 and 2010 (12 months apart), This map was generated in 2 stages: 1) determining spectral differences between reflectance values on a pixel by pixel basis using Spectral OveRlapping Thresholding algorithm and 2) making a change map showing the change from one class to another. The following classes were used: forest, grass, soil mixed with grass, soil, water, asphalt and coal. The final change map highlights the changed areas with a specific colour indicating the category of the new land cover type. In that way we can recognize all the areas that were changed to water, coal, soil, vegetation and so on Detekce změn s využitím technologie hyperspektrálního snímkování v oblasti hnedouhelných dolů na Sokolovsku Mapa detekce změn je založena zpracování dvojice scén pořízených nad oblastí hnědouhelných dolů na Sokolovsku pomocí leteckého hyperspektrálního senzoru HyMap v časovém rozestupu 12-ti měsíců (léto 2009 a léto 2010). Tvorba mapy probíhala ve dvou krocích: 1) výpočet spektrálních rozdílů pro jednotlivé pixely obrazu pomocí algoritmu SORT (Spectral OveRlapping Threshold), 2) určení změn v klasifikaci jednotlivých pixelů obrazu do tříd. Pro tuto část analýzy byly uvažovány následující třídy: lesní porosty, půda s travními porosty, holá půda, vodní plochy, asfalt a uhlí. Finální mapa zvýrazňuje oblasti, na nichž došlo ke změnám, různými barvami, které odpovídají různým typům výsledného krajinného pokryvu. Je tedy tím pádem možné detekovat oblasti, které byly přeměněny na vodní plochy, oblasti odkrytých uhelných slojí, holou půdu, vegetaci apod. 37
, overburden removal westwards (any to soil), overburden backfilling (any to soil) and water rise following")
197 EO-MINERS collection of selected products Sokolov demonstration site EO-MINERS outputs Figure 12. Change detection over Sokolov open pit mining area using Hyperspectral technology. This map in particular highlights the progress of lignite exploitation (any to coal), overburden removal westwards (any to soil), overburden backfilling (any to soil) and water rise following dewatering stop in Jiri pit. Obrázek 12. Detekce změn v oblasti hnědouhelných dolů na Sokolovsku s využitím technologie hyperspektrálního snímkování. Mapa zejména zvýrazňuje postup těžby hnědého uhlí (reklasifikace jakékoliv třídy na třídu uhlí ), odstraňování skrývky a ukládání odtěženého materiálu (reklasifikace jakékoliv třídy na třídu půda ) a zvýšení vodní hladiny v souvislosti se zastavením odvodňování v dolu Jiří. 38
198 EO-MINERS collection of selected products Sokolov demonstration site EO-MINERS outputs Prepared by / Připravil: Contact / Kontakt: These results support indicator / Výsledky jsou podloženy těmito indikátory: DLR Christian Fischer - c.fischer@dlr.de A4, A6, G Night-time surface temperature map This map shows the spatial pattern of surface temperature in the Sokolov region derived from thermal infrared data of the AHS airborne survey flown on July 22, 2011 at 2:00 am. The airborne imagery was corrected for atmospheric influences as well as calibrated and validated against reference measurements. Water bodies like Lake Medard and water courses like Eger River stand out as relatively warm objects due to the high heat capacity of water. Also, manmade structures like the urban area of Sokolov show elevated temperatures compared to the surrounding woods and agricultural fields. The temperature data can be used to locate and monitor high temperature events such as fires in coal accumulations due to spontaneous combustion. Spatial information of surface temperatures can also be correlated to soil moisture. Furthermore it may be used for inspection of industrial plants, housing and large machinery, e.g. for thermal insulation, release of cooling water and hot gas emissions, or the urban heat island effect. Data processing and product compilation was completed by the Land Surface Department, DLR Mapa noční povrchové teploty povrchu Tato mapa zobrazuje prostorové rozložení teploty povrchu v oblasti Sokolovska, která byla odvozena na podkladě termálního snímkování leteckým senzorem AHS, které bylo provedeno v noci 22. července 2011 kolem 2:00 hodin. Pořízená letecká data byla korigována na vliv atmosféry, a stejně tak byla kalibrována a validována oproti pozemním referenčním měřením. Vodní plochy jako např. jezero Medard a vodní toky jako např. řeka Ohře zde vystupují jako objekty s relativně vysokou teplotou díky vysoké tepelné kapacitě vody. Stejně tak uměle vytvořené antropogenní struktury jako např. městská oblast Sokolova vykazují vyšší povrchovou teplotu ve srovnání s okolními lesy a zemědělskými plochami. Termální data mohou být rovněž použita k lokalizaci a sledování výskytu lokalit s abnormálně vysokou teplotou způsobenou například samovznícením uhlí. Prostorové rozložení hodnot teploty povrchu může být rovněž korelováno s vlhkostí půdy. Navíc mohou být tato data využita ke sledování průmyslových závodů a různých budov např. ve spojitosti s tepelnou izolací objektů, vypouštěním chladicích kapalin a horkých plynů nebo ke studiu tzv. efektu městského tepelného ostrova. Zpracování dat a sestavení výsledného produktu bylo realizováno oddělením Land Surface Department (LAX) Německého centra pro letectví a vesmír (DLR). 39

199 EO-MINERS collection of selected products Sokolov demonstration site EO-MINERS outputs Figure 13. Night-time surface temperature map. Obrázek 13. Mapa noční povrchové teploty. 40
200 EO-MINERS collection of selected products Sokolov demonstration site EO-MINERS outputs Prepared by / Připravil: Contact / Kontakt: These results support indicator / Výsledky jsou podloženy těmito indikátory: TAU Eyal Ben-Dor - bendor@post.tau.ac.il A6, A9, G Apparent Thermal Inertia of the surface The Apparent Thermal Inertia (ATI) of soils as retrieved from AHS airborne overpass from two locations in the Sokolov area. High values may indicate soils with high water content, whereas low values may indicate soils with low water content. Two ground truth locations, where water content of soils samples was measured by Czech Geological Survey, are presented with their ATI values. The map was generated by RSL TAU Zdánlivá tepelná setrvačnost povrchu Zdánlivá tepelná setrvačnost povrchu (Apparent Thermal Inertia - ATI) byla odvozena z termálních leteckých dat AHS pro dvě lokality v oblasti Sokolovska. Vysoké hodnoty ATI mohou indikovat vysoký obsah vody v půdách jak s nízkou, tak s vysokou hustotou, zatímco nízké hodnoty ATI indikují nízký obsah vody v půdě. Kontrolní hodnoty obsahu vody v půdě byly změřeny pro dvě referenční lokality Českou geologickou službou. Tyto hodnoty jsou prezentovány společně s odpovídajícími hodnotami ATI. Výsledná mapa byla vytvořena Laboratoří dálkového průzkumu Země Univerzity v Tel-Avivu (TAU). 41

201 EO-MINERS collection of selected products Sokolov demonstration site EO-MINERS outputs Figure 14. Distribution of the Apparent Thermal Inertia in the Sokolov area. Obrázek 14. Prostorové rozložení zdánlivé tepelné setrvačnosti povrchu (ATI). 42
202 EO-MINERS collection of selected products Sokolov demonstration site EO-MINERS outputs Prepared by / Připravil: Contact / Kontakt: These results support indicator / Výsledky jsou podloženy těmito indikátory: TAU Eyal Ben-Dor - bendor@post.tau.ac.il D C-rich + Fly Ash and silicates distribution The two maps show the concentration of C-rich + Fly Ash (a) and Silicates (b) in settled dust particles in the surroundings of open-mine sites. The data for this map was obtained from spectral measurements combined with chemical analysis of samples taken from dust traps distributed in the Sokolov area. A spectral model to distinguish between C-rich + Fly Ash and silicates nature of the dust was generated. These measurements can identify contamination relating to these materials and help monitor and improve the human living environment. The chemical analyses were done by Dr. Barbara Palumbo-Roe from the BGS and spectral analyses were conducted by Mr. Simon Adar and Mr. Ido Livne from RSL-TAU Prostorová distribuce materiálu bohatého na uhlík, polétavého popílku a materiálu bohatého na silikáty Tyto dvě mapy zobrazují koncentraci materiálu bohatého na uhlík a polétavého popílku (a) a materiálu bohatého na silikáty v usazených prachových částicích v okolí hnědouhelných dolů. Data pro tvorbu této mapy byla získána na základě spektrálních měření a chemických analýz vzorků získaných pomocí lapačů prachu rozmístěných v oblasti Sokolovska. Následně byl vytvořen model pro odlišení materiálu bohatého na uhlík a polétavého popílku od materiálu bohatého na silikáty. Pomocí spektrálních měření je možné okamžité zjištění aktuálního stavu znečištění výše uvedenými látkami, což může napomoci při ochraně a zlepšování životního prostředí. Chemické analýzy byly provedeny na podkladě indexu Dr. Barbary Palumbo-Roe z Britské geologické služby (BGS), spektrální analýzy provedli Simon Adar a Ido Livne z Laboratoře dálkového průzkumu Země Univerzity v Tel-Avivu (TAU). 43
 C-rich + Fly Ash and (b) silicates in settled dust particles in the surroundings of open-mine sites. Obrázek 15.")
203 EO-MINERS collection of selected products Sokolov demonstration site EO-MINERS outputs (a) (b) Figure 15. Concentration of (a) C-rich + Fly Ash and (b) silicates in settled dust particles in the surroundings of open-mine sites. Obrázek 15. Koncentrace (a) materiálu bohatého na uhlík a polétavého popílku a (b) silikátů v prachových částicích usazených v okolí hnědouhelných dolů. 44
204 EO-MINERS collection of selected products Sokolov demonstration site EO-MINERS outputs Prepared by / Připravil: Contact / Kontakt: These results support indicator / Výsledky jsou podloženy těmito indikátory: GeoZS Gorazd Žibret - gorazd.zibret@geo-zs.si D1, A Areas of enriched arsenic content in street dust This image shows the arsenic (As) level in street dust (analytics: fraction <0.125 mm, total 4- acid digestion, ICP-MS) and identified any areas where the optimum value (29 mg/kg) may be exceeded. No samples, however, were found to exceed the action value, which is regarded as a concentration where certain measures should be undertaken. Optimum (natural background) and action values were taken from The New Dutchlist, which is internationally recognised as one of the possible guidelines for the assessment of contamination. Possible sources of As enriched dust may be attributed to coal mining where the dominant western wind blows the dust eastwards. Similar maps showing other elements (such as Hg, Cd, Mn, Cr, etc.) can be prepared using the same methodology Obsah arzenu v částicích pouličního prachu Předně je potřeba zdůraznit, že nebyly zjištěny žádné kontaminace arzenem, které by představovali jakékoliv vážné riziko, jelikož v žádném z odebraných vzorků nebyly překročeny kritické hodnoty obsahu arzenu (v takových místech by bylo nutné provést další měření). Obrázek vyznačuje oblasti, v nichž koncentrace arzenu ve vzorcích pouličního prachu překračuje optimální hodnotu, která je stanovena na 29 mg/kg (analýza prachových částic byla provedena na frakci <0.125 mm, kompletní výluh ve směsi 4 kyselin a za použití metody ICP-MS). Optimální a kritické hodnoty koncentrace arzenu byly převzaty z dokumentů The New Dutchlist, které jsou mezinárodně uznávány jako jedna z možných referenčních směrnic pro hodnocení kontaminace půdy. Koncentrace arzenu v prachových částicích může pomoci definovat zdroje prachu, který je uvolňován do ovzduší. Obohacení prachových částic arzenem může být připsáno těžbě uhlí. Vlivem převládajícího západního proudění jsou prachové částice unášeny větrem na východ. Obdobné mapy mohou být s využitím této metodiky sestaveny i pro další prvky (např. rtuť Hg, kadmium Cd, mangan Mn, chrom Cr aj.). 45

205 EO-MINERS collection of selected products Sokolov demonstration site EO-MINERS outputs Figure 16. Distribution of street dust samples, where As exceeds optimum value according to The New Dutchlist. Obrázek 16. Mapa znázorňující výsledky stanovení obsahu arzenu (As) v prachových částicích. 46
206 EO-MINERS collection of selected products Sokolov demonstration site EO-MINERS outputs Prepared by / Připravil: Contact / Kontakt: These results support indicator / Výsledky jsou podloženy těmito indikátory: GeoZS Gorazd Žibret - gorazd.zibret@geo-zs.si D Distribution of lead (Pb) in street dust The image shows the spatial distribution of Pb in street dust at 113 locations, sampled between August 2010 and March 2012 (analyses were made on fraction <0.125 mm, total 4- acid digestion, ICP-MS). As street dust is the indicator of atmospheric deposition of metals to the environment, mixed with local sources (previously contaminated soil), results might point to the source of Pb in the environment, including population activities, as traffic, heating, wastes, as well as to past Pb mining, because we see the anomaly of Pb in the town of Olovi. This information must be accompanied by the fact that we did not measure dangerous levels of Pb as no samples exceeded action values, according to The New Dutchlist. Data can be used for the assessment of the soil contamination and for the detection of the sources of the contamination. The distribution maps of other elements of interest (such as Hg, Cd, Cr, Th, U etc.) can be prepared by using the same methodology Obsah olova v částicích pouličního prachu Předně je nutno zdůraznit, že nikde nebyly zjištěny nebezpečné koncentrace olova a že v žádném ze zkoumaných vzorků nebyly překročeny kritické hodnoty uváděné v The New Dutchlist. Obrázek dokumentuje výsledky stanovení obsahu olova v prachových částicích na podkladě vzorků, které byly odebrány na celkem 113 lokalitách v období od srpna 2010 do března 2012 (analýzy vzorků byly provedeny na frakci <0.125 mm, kompletní výluh ve směsi 4 kyselin s využitím metody ICP-MS). Pouliční prach je jedním z ukazatelů atmosférické depozice kovových prvků. Studium těchto prachových částic proto může pomoci detekovat zdroje olova v životním prostředí, jakými jsou například doprava, vytápění, ukládání odpadu, stejně tak jako dřívější těžba olověných rud (viz data v oblasti města Oloví). Data mohou být využita při hodnocení potenciální kontaminace půdy a pro detekci možných zdrojů kontaminací. Obdobné mapy mohou být s využitím této metodiky sestaveny i pro další prvky (např. rtuť Hg, kadmium Cd, chrom Cr, thorium Th, uran - U aj.). 47

207 EO-MINERS collection of selected products Sokolov demonstration site EO-MINERS outputs Figure 17. Distribution of Pb in street dust. Obrázek 17. Mapa znázorňující výsledky stanovení obsahu olova (Pb) v prachových částicích. 48
208 EO-MINERS collection of selected products Sokolov demonstration site EO-MINERS outputs Prepared by / Připravil: Contact / Kontakt: These results support indicator / Výsledky jsou podloženy těmito indikátory: GeoZS Gorazd Žibret - gorazd.zibret@geo-zs.si D Distribution of "coal dust factor" in street dust This map show the result of statistical method called factor analysis, which groups elements with similar spatial distribution into one single variable, called factor. Five factors were extracted, and one of them, named factor 4, possibly reflects the amount of coal dust in the atmosphere. It joins the distribution of following elements: Be, Li, As and Al into single variable. Higher factor score means higher impact. Such results can be useful for monitoring of impacts and for planning of measures which prevents the mobilisation of dust Potencionální nabohacení částic pouličního prachu uhelnou složkou Tato mapa je výsledkem statistické analýzy (faktorové analýzy), která umožnila seskupit do jedné proměnné (faktoru) prvky, které mají podobný prostorový výskyt. V našem případě faktor 4 koreluje s množstvím uhelného prachu v atmosféře. Tento faktor zahrnuje tyto prvky: Be, Li, As and Al. Tyto výsledky mohou být dále využity pro účely monitoringu kvality ovzduší a pro plánování rozmístění měřících stanic. 49

209 EO-MINERS collection of selected products Sokolov demonstration site EO-MINERS outputs Figure 18. Distribution of "coal dust factor" in street dust. Obrázek 18. Faktorová analýza obsahu prvků v částicích pouličního prachu. 50
210 EO-MINERS collection of selected products Sokolov demonstration site EO-MINERS outputs Prepared by / Připravil: Contact / Kontakt: These results support indicator / Výsledky jsou podloženy těmito indikátory: Czech Geological Survey Veronika Kopačkova - Veronika.kopackova@seznam.cz D1, A Assessing forest health status using aerial hyperspectral data (HyMap) The biochemical composition of spruce needles with their longevity and exposure to environmental conditions is often used as a bioindicator of soil or air contamination. Particularly the contents of photosynthetic pigments are closely related to photosynthetic performance and can serve as early-warning symptoms of plant stress, before macroscopic changes are detected. We used aerial hyperspectral data HyMap acquired in 07/2009 and 08/2010 to model the photosynthetic pigment content, which was further used to assess the Norway Spruce health status. Analyzing the health status temporal differences between the two HyMap data sets (07/2009 and 08/2010) the trees with changed health status were identified Hodnocení zdravotního stavu lesních porostů s využitím leteckých hyperspektrálních dat (HyMap) Biochemické složení smrkového jehličí je v souvislosti s jeho vystavením působení různých environmentálních vlivů často používáno jako bioindikátor kvality ovzduší a znečištění půdy. Jedná se především o obsah fotosyntetických barviv, který úzce souvisí s procesem fotosyntézy a který tedy může sloužit jako jakýsi varovný signál ještě předtím, než u rostlin začne docházet k reálnému poškození velkého rozsahu. Na podkladě leteckých hyperspektrálních dat HyMap, pořízených v červenci 2009 a srpnu 2010 byl modelován obsah fotosyntetických barviv, který byl dále využit ke zhodnocení celkového zdravotního stavu lesních porostů smrku ztepilého. Součástí analýzy byla též detekce změn zdravotního stavu porostů, k nimž došlo v období mezi pořízením obou srovnávaných scén. 51
 2009 and (b) 2010, colour scale 1 through 5 health status classes; 1 -")
 a 2010 (b).")
211 EO-MINERS collection of selected products Sokolov demonstration site EO-MINERS outputs (a) (b) Figure 19. The Norway spruce health status map in (a) 2009 and (b) 2010, colour scale 1 through 5 health status classes; 1 - the worst and 5 - the best result. Obrázek 19. Mapa zdravotního stavu porostů smrku ztepilého v letech 2009 (a) a 2010 (b). Barevná stupnice odpovídá jednotlivým třídám zdravotního stavu kdy 1 nejhorší zdravotní stav, 5 nejlepší zdravotní stav. 52
 Hymap 2009 data: true colour combination showing the actual situation of the site, B) Hymap 2010 data: true colour combination showing the actual situation of the site; C) and D) the")
212 EO-MINERS collection of selected products Sokolov demonstration site EO-MINERS outputs Figure 20. Studenec: A) Hymap 2009 data: true colour combination showing the actual situation of the site, B) Hymap 2010 data: true colour combination showing the actual situation of the site; C) and D) the Norway spruce health status in 2009 and 2010 respectively, colour scale 1 through 5 health status classes; 1 - the worst and 5 - the best result. E) Health class change detection. Obrázek 20. Studenec A) barevná kombinace dat HyMap 2009 (pravé barvy) dokumentující stav dané lokality v roce 2009, B) barevná kombinace dat HyMap 2010 (pravé barvy) dokumentující stav lokality v roce 2010, C) a D) klasifikace zdravotního stavu smrkových porostů v letech 2009 resp. 2010, barevná stupnice odpovídá jednotlivým třídám zdravotního stavu kdy 1 nejhorší stav, 5 nejlepší stav E) detekce změn zdravotního stavu smrkových porostů 53
213 EO-MINERS collection of selected products APPENDIX Appendix 1. Consolidated Set of Candidate Indicators for the EO-MINERS Project. A A1 Land-use Total land-use by mining and milling - topographical footprint. The total area used by the mine/mill is an overarching proxy for a variety of environmental and social impacts. The assumption is that the larger the area the larger the impact. A2 Mining land-use intensity topographical footprint vs. amount of marketable product. A time series of this indicator gives an impression of the space occupied by the mining and milling/energy conversion operation vs. the amount of end product that leaves the operation as marketable product. Changes in space intensity can point to less efficient residues management, lower quality of ore/coal, or deeper mining required. A3 Artisanal and Small-Scale Mining topographical footprint of ASM sites. Number of operating/abandoned sites of artisanal and small-scale mining (ASM). A4 Residential land use - residential developments around mining areas. The spatial relationship between residential and mining areas could be an indicator for potential use conflicts and impacts on health and safety. A5 Informal settlements sprawl of squatters areas, slums. Mining areas attract a variety of people and can cause the development of informal settlements in areas where there is not sufficient enforcement of zoning regulations. These suffer from poor piped water quality and in-house air pollution caused by using the bottom quality coal they collect. A6 Sites set aside, protected areas nature reserves, wetlands, sites of spiritual value and similar. On the basis of the current land use planning/zoning regulations at the site, this indicates constraints on mine development and also indicates zones sensitive to environmental impact arising from the mine. A7 Surface water courses percentage area covered by surface waters. Changes in surface area of lakes, rivers etc. can point to mining-induced changes in the water balance A8 Recultivation success on mined-out areas and waste/spoil heaps designated mining areas covered by specific vegetation (grassland, forest, water bodies,...), area returned to agricultural use. The remediation of mining and milling sites, including waste management areas (waste/spoil heaps) may include the recultivation of residues management sites with predetermined plant communities. Ground-covering vegetation is the best provision against wind erosion and an easy-to-monitor measure of recultivation efforts. Background information required: Legal provisions regarding submission of remediation plans (environmental, also employment) upfront, backed by a sufficient deposit payment to make remediation economically sensible. 54
214 EO-MINERS collection of selected products APPENDIX Příloha 1. Souhrnný přehled kandidátních indikátorů v projektu EO-MINERS. A A1 A2 A3 Využití půdy Celkové využití půdy těžbou a mlýnkováním topografická stopa Celková plocha využívaná dolem je rámcovým ukazatelem pro různorodost environmentálních a sociálních dopadů. Předpokladem je, že čím větší je rozloha, tím větší je dopad. Intenzita využití půdy k těžbě topografické stopy vs. množství prodejných produktů. Časové řady tohoto ukazatele podávají informaci o prostoru zabraného těžbou a o poměru energie spotřebované na těžbu a zpracování materiálu ku množství konečných produktů, které opouštějí provoz. Změny v prostorové intenzitě mohou ukazovat na méně efektivní řízení reziduí, nižší kvalitu rudy/uhlí, nebo požadavky hlubší těžbu. Řemeslná těžba a těžba malého rozsahu Počet lokalit (současných/opuštěných) souvisejících s řemeslnou a malorozměrovou těžbou surovin. A4 A5 A6 A7 A8 Rezidenční využití půdy rezidenční zástavba v okolí oblastí těžby Prostorový vztah mezi obytnými a těžebními oblastmi by mohl být ukazatelem pro potenciální konflikty a dopady na zdraví a bezpečnost. Neoficiální sídla předměstí složená z oblastí squatů a slumů Těžební oblasti přitahují různé druhy lidí a mohou způsobit rozvoj neformálních sídel v oblastech, kde nejsou dostatečně prosazovány územní předpisy. Ty trpí špatnou kvalitou zavedené vody a znečištěným vzduchem v domech, který je způsobený používáním uhlí nízké kvality, které si lidé shromažďují. Území vyňatá z těžby a chráněná území přírodní rezervace, mokřady, místa duchovního významu a podobné Na základě současného územního plánování/územních předpisů v místě, ukazatel indikuje omezení rozvoje dolu a také naznačuje citlivé zóny z hlediska dopadu na životní prostředí. Povrchové vodní toky podíl plochy pokryté povrchovými vodami Změny v povrchové rozloze jezer, řek atd. mohou ukazovat na změny vodní bilance vyvolané těžbou. Úspěšnost rekultivací ve vytěžených oblastech a na výsypkách vybrané důlní oblasti pokryté určitou vegetací (louky, les, vodní plochy...), návrat k zemědělskému využití. Sanace těžebních lokalit a výsypek může zahrnovat rekultivaci založenou na výsadbě předem vybraných rostlinných společenstev. Zakládání nových vegetačních pokryvů je nejlepším opatřením proti větrné erozi a současně je snadno sledovatelným ukazatelem rozsahu rekultivačních prací. Vyžadované doplňující informace: Právní předpisy týkající se předložení sanačních plánů (životní prostředí, nebo také zaměstnanost), podpořené zaplacením dostatečné zálohy, aby sanace byla ekonomicky výhodná. 55
215 EO-MINERS collection of selected products APPENDIX Appendix 1 continue: A9 Areas indirectly affected and its potential use - Impact of mining on the potential use of operation and surrounding areas, impact on land value / prices (opportunity cost). The type and economic value of potential alternative uses are location specific; the relevant characteristics need to be identified. Once described And validated by ground work, they can potentially be monitored by EO techniques. A10 Existence and legal status of environmental impact assessments for the operation and the remediation phase. Related to A7, but exploring the legal basis and indicating whether a lack of regulation or a lack of enforcement is the main course in case of negative impacts B B1 Mass Flows and Energy Flows Waste volumes generated volume (change) vs. amount of marketable product. This indicator is related to A1, but would require the determination of volume changes in deposited materials. Such an indicator points towards the ore-grade mined, the depths of the mine and the efficiency of the mining technique. When properly contextualised, this indicator allows comparisons between mines/mine types and the analysis of time series for a particular mine. B2 Erosion erosional losses on residues heaps. Erosion of residues heaps can lead to the dispersion of contaminants and the degradation of agricultural soils. B3 Total energy consumption per ton of coal / lignite /ore produced. This indicator gives an impression of the energy efficiency of the operation. It is related to Indicator B1. In addition to allow intercomparison between different (types of) mines and in a time series also allows to assess efficiency gains. B4 Energy Return on Energy Investment (EROI). EROI is a measure for assessing at policy-making level, whether a mining operation for fuel materials makes sense from an energy balance point of view. C C1 Soil quality Contaminant concentrations. One or more indicator that describes toxicological or radiological contamination relevant elements or compounds. In the case of radiological contamination, this could also be gamma-fields. C2 Soil fertility of remediated mine areas. Related to A3 and A4, but assessing the potential, rather than the actual vegetation. Also focusing on agricultural plants, rather than perennial plants. D D1 Air quality and other nuisances Aerosols particle concentration in off-site air. Aerosols, dust, in itself constitutes a nuisance or a health hazard, in particular if they contribute to high concentrations in in-house air, e.g. in worker dormitories. At the same time it can be an indicator of the quality of operational and residues management. 56
216 EO-MINERS collection of selected products APPENDIX Příloha 1 pokračování: A9 A10 B B1 B2 B3 B4 C C1 C2 D D1 Těžbou nepřímo ovlivněné oblasti a jejich potenciální využití dopady těžby na potenciální využití lokalit v okolní míst těžby, dopady na hodnotu/cenu pozemků Typ a ekonomická hodnota potenciálního alternativního využití nepřímo dotčených území zaujímají zvláštní místo. Je potřeba identifikovat příslušné charakteristiky, které by následně mohly být sledovány metodami délkového průzkumu. Existence a právní postavení hodnocení vlivů na životní prostředí pro provoz a sanační fázi Tento indikátor souvisí s A7, ale zkoumá právní základ a uvádí, zda nedostatek nařízení nebo jejich nedostatečné prosazování je hlavní důvodem negativních vlivů na životní prostředí. Toky hmoty a energií Objem vygenerovaného odpadu objem (změna) vs. množství prodejných produktů Ukazatel souvisí s A1, rozdílem je požadavek stanovení změny objemu uložených materiálů. Tento ukazatel zkoumá kvalitu těžené rudy, hloubku dolu a efektivnost těžebních technik. Pokud je ukazatel správně zasazen do kontextu, umožňuje srovnání důlního typu s analýzou časových řad konkrétního dolu. Eroze erozní ztráty materiálu uloženého na haldách Eroze materiálu uloženého na haldách může vést k rozptýlení znečišťujících látek a k degradaci zemědělských půd. Celková spotřeba energie potřebná k produkci 1 tuny uhlí / lignitu / rudy Tento ukazatel poskytuje představu o energetické efektivitě procesu. Souvisí s ukazatelem B1. Kromě toho umožňuje srovnávání různých (typů) dolů a posouzení nárůstu efektivity těžby pomocí časových řad. Energetická návratnost energetické investice (EROI) EROI je hodnotící měřítko aplikovatelné na úrovni tvorby politiky a celkové koncepce zda je daný provoz efektivní z hlediska energetické balance (energie spotřebovaná na těžbu/energie získaná využitím vytěžených surovin). Kvalita půdy Koncentrace znečišťujících látek Jeden nebo více ukazatelů, které popisují koncentraci znečišťujících prvků a sloučenin způsobujících toxické či radioaktivní znečištění. V případě radioaktivního znečištění se může jednat například o intenzitu gama záření. Úrodnost půdy v místech rekultivací Souvisí s A3 a A4. Rozdílem je, že se spíše posuzuje potenciál půdy než výskyt skutečné vegetace. Také se zaměřuje spíše na zemědělské rostliny. Kvalita ovzduší a další škodlivé vlivy Aerosoly koncentrace částic v ovzduší Aerosoly a prach samy o sobě představují zdravotní rizika, zejména pokud přispívají silnému znečištění vzduchu v obydlích, např. v dělnických ubytovnách. Zároveň mohou být ukazatelem kvality řízení provozu a odpadového hospodářství. 57
217 EO-MINERS collection of selected products APPENDIX Appendix 1 continue: D2 Volatiles emission of gases from waste deposits (composition and sources). Volatiles released can be a nuisance (odour) health hazard (e.g. carcinogenic) as well as a technical risk (e.g. if combustible). In addition, they can jeopardise recultivation, e.g. methane in the soil can suffocate plants. D3 Air-related health impacts incidence of health problems due to air-borne pollutants. Besides gaseous emissions (D2) particulate matter (partly from erosion, partly from production processes) can cause air-related health impacts; metals like Cr6 are of particular health relevance. Could become part of risk maps generated based on EO results. D4 Air-related soil degradation soil fertility loss due to particulates deposited. Besides gaseous emissions (D2) particulate matter (partly from erosion, partly from production processes) can lead to soil quality degradation. D5 D6 E E1 Noise from blasting and machinery - proximity and impact on settlements. Vibrations from blasting - proximity and impact on settlements, damage to houses and other risks. Water quality Hydrological balance relates the natural water balance to the use of the catchment area. Measurements of the amount of precipitation, evaporation, discharge and abstraction per catchment area, i.e. total water natural and anthropogenically induced flows in and out of the catchment area. E2 E3 E4 Process waters and contaminated surface run-off / storm water volumes of waters treated/untreated/directly discharged to surface-water courses. Aqueous contaminant releases contaminant concentrations in (surface) water bodies. Acid Drainage Generation Potential distribution of sulfidic minerals. Acid drainage from mines and residue heaps can have significant impacts on water courses. The distribution of sulfidic iron-minerals indicates the potential for acid drainage generation. E5 Seepage from engineered structures quantity and quality. Seepage, e.g. from tailings ponds, can be a vehicle for contaminant release and also an early indicator for problems with dam stability. Seepage can affect surface-water courses and ground waters. E6 Drinking/irrigation water availability quantity and quality. Amount of clean(able) drinking and irrigation water that can be supplied in a sustainable way. F F1 F2 Transport Road / rail freight volumes from/to operation sites frequency and type of traffic. Land fragmentation by transport infrastructure. Length of infrastructure, or (better) density [km/km 2 ], median and maximum size of not fragmented patches, and distance to next undisturbed site measure the dominant pressure an operation enacts on biodiversity and other aspects of the environment. 58
218 EO-MINERS collection of selected products APPENDIX Příloha 1 pokračování: D2 D3 D4 D5 D6 Těkavé látky emise těkavých plynů z ukládaných odpadů (složení a zdroje) Těkavé látky mohou být na obtíž (zápach) a mohou představovat i značné zdravotní riziko (např. karcinogenní látky), stejně tak se může jednat o technické riziko (např. pokud jde o hořlaviny). Kromě toho mohou ohrozit rekultivační práce, např. metan v půdě může rostliny dusit. Zdravotní dopady související s ovzduším výskyt zdravotních problémů souvisejících s obsahem škodlivých látek v ovzduší Vedle plynných emisí (D2) mohou také pevné částice (vznikajících např. v důsledku eroze nebo při výrobních procesech) způsobovat negativní dopady na zdraví (např. vliv Cr6). Výskyt těchto látek by se mohl stát součástí rizikových map vytvářených na základě výsledků nástrojů dálkového průzkumu. Degradace půdy související s ovzduším ztráta úrodnosti půdy v důsledku ukládání znečišťujících částic Vedle plynných emisí (D2) může ukládání pevných částic (vznikajících např. v důsledku eroze nebo při výrobních procesech) vést k degradaci půdy. Hluk z odstřelů a ze strojů blízkost sídel a vliv na ně Otřesy způsobené odstřely blízkost sídel a vliv na ně, poškození domů a další rizika E E1 Kvality vody Hydrologická bilance souvisí s přirozenou bilancí vody využitou v oblasti povodí Měření množství srážek, evaporace, průtoku a odběru vody z povodí, např. celkový příjem vody přírodní a antropogenní vodní toky tekoucí do či z povodí. E2 Užitková voda a povrchový odtok znečištěné vody / srážková voda objemy vody vyčištěné / nevyčištěné / přímo vypouštěné do povrchových vodních toků. E3 E4 E5 E6 F F1 F2 Úniky kontaminantů povrchových vod koncentrace kontaminantů povrchových vod Potenciál vzniku kyselých důlních vod distribuce sulfidických minerálů Kyselé důlní vody, jejichž výskyt je spojen s oblastmi aktivní těžby a s výsypkami, mohou mít zásadní význam na povrchové vodní toky. Sledováním prostorové distribuce sírano-železnatých minerálů je možné detekovat místa s vysokým potenciálem vzniku kyselých důlních vod. Průsak z inženýrských struktur množství a kvalita Průsak, například z jezírek na haldách, může být příčinou uvolnění znečišťujících látek a také raný indikátor problémů stability hrází. Průsak může ovlivnit toky povrchových i podzemních vod. Dostupnost pitné vody a vody na zavlažování množství a kvalita Množství čisté (vyčistitelné) pitné vody a vody na zavlažování, kterou je možné poskytovat udržitelným způsobem. Doprava Objem silničního a železničního nákladu z/na provozní lokality frekvence a druh dopravy Fragmentace krajiny dopravní infrastrukturou Délka infrastruktury, nebo (lépe) hustota [km/km 2 ], medián a maximální velikost nefragmentovaných ploch a vzdálenost k další nenarušené lokalitě měří převládající tlak provozu působící na biodiverzitu a další aspekty životního prostředí. 59
219 EO-MINERS collection of selected products APPENDIX Appendix 1 continue: F3 Local air, noise and accident impacts from transport. Impacts from transport outside the operational area (see also D) F4 Transport infrastructure quality. Heavy mine traffic may use public roads and add to their degradation without adequate compensation. F5 Accessibility due to mine-related transport infrastructure. Mining companies may build transport infrastructure that also can be used by the local population, thus improving access. G G1 Geotechnical hazards and accidents Grade of slopes steepness of engineered slopes vs. height. A too steep slope of residues heaps or dams can indicate potential geotechnical risks of failure. The indicator can be used for initial assessment and problem scoping, but will have to be related to the materials properties determined on the ground for a more detailed assessment. G2 Ground stability changes in the elevation of areas unaffected by residue disposal. Subsidence, pothole formation and other ground movement indicate inadequate underground mining techniques when exceeding certain rates of change. Sudden major losses of recultivation area indicate planning and/or management mistakes (not taking into account extreme events). G3 Dam stability water saturation in retaining dams. As was demonstrated recently in Hungary, failing retaining dams of tailings ponds can have a significant environmental impact and threaten life and property. Water saturation, leading to suberosion and piping can be an early indicator for impeding disaster. G4 Underground and mining waste deposit fires number, duration and area affected. Underground fires of coal seams or bituminous materials, and mining waste fires can be caused by natural processes or be the result of (mining) accidents. They mean loss of natural resources, but also CO 2 emissions and nuisance due to smoke. G5 Flooding risks area that may be exposed to flooding. Mapping of areas that could be under threat from flooding due to breaking retaining dams of tailings ponds etc. H H1 Industrial and other accidents Accidents in the mining / milling operation. Working days lost and other societal costs due to workplace accidents H2 Accidents in the operation environment (transport, construction etc.). Working days lost and other societal costs due to workplace accidents 60
220 EO-MINERS collection of selected products APPENDIX Příloha 1 pokračování: F3 F4 F5 G G1 G2 G3 G4 G5 H H1 H2 Vlivy dopravy na ovzduší, hluk a nehodovost Vlivy dopravy mimo provozní oblast (viz. také D) Kvalita dopravní infrastruktury Těžká těžební nákladní doprava využívá veřejné cesty a urychluje tak jejich degradaci bez adekvátní náhrady. Dostupnost díky dopravní infrastruktuře vybudované kvůli těžbě Těžební společnosti mohou postavit dopravní infrastrukturu, která pak slouží místnímu obyvatelstvu, zlepšuje tak dostupnost. Geotechnická rizika a nehody Sklon svahů příkrost inženýrských svahů vs. jejich výška Příliš příkrý svah zbytkových hald nebo hrází může značit potenciální geotechnické riziko nebo poruchu. Indikátor může být použit k počátečnímu zhodnocení a vytyčení problému, musí být ale spojen s vlastnostmi materiálu určenými na povrchu pro podrobnější zhodnocení. Stabilita půdy změny v nadmořské výšce oblastí nepostižených likvidovanými zbytky materiálu Sesedání, tvorba obřích hrnců a jiné pohyby půdy značí nepřiměřené podzemní těžební techniky, kdy je přesáhnuta určitá hranice výměny. Náhlé významné ztráty rekultivačních oblastí značí chyby v plánování a/nebo chyby v managementu (zde nejsou brány v úvahu extrémní události). Stabilita hrází nasycení zadržovacích hrází vodou Jak se nedávno ukázalo v Maďarsku, protržení zadržovacích hrází nebo haldových jezírek může mít významný vliv na životní prostředí a může ohrozit životy a majetky. Nasycení vodou, vedoucí k podpovrchové erozi, může být časným indikátorem blížící se katastrofy. Podzemní požáry a požáry odpadního těžebního materiálu počet, trvání a zasažená plocha Podzemní požáry uhelných slojí nebo bitumózních materiálů, a také požáry odpadních těžebních materiálů mohou být způsobeny přírodními procesy nebo mohou být výsledkem těžebních nehod. Požáry představují ztrátu přírodních zdrojů, ale také emise CO 2 a nepříjemnosti kvůli kouři. Povodňová rizika plocha, která může být vystavena povodni Mapování oblastí, které mohou být ohroženy povodněmi z důvodu prolomení zadržovacích hrází nebo haldových jezírek, atd. Průmyslové a ostatní nehody Nehody při těžbě/mlýnkování Ztráta pracovních dnů a jiné společenské ztráty kvůli pracovním nehodám Nehody v provozu (doprava, konstrukce, atd.) Ztráta pracovních dnů a jiné společenské ztráty kvůli provozním nehodám 61
221 EO-MINERS collection of selected products APPENDIX Appendix 1 continue: H3 Damages and accidents on neighbouring land due to ground instability. Related to G2, but focusing on the impacts. Cracked or collapsing buildings, water-collecting depressions that devalue agricultural land etc. can be caused by mining-induces ground instability. The damages and the compensation payments are relevant factors for determining the economic impact. I I1 Social impacts Number of jobs created. Qualification levels, median salary, working hours, gender balance I2 Job security (long term). Average duration of employment, share of local citizens in staff at different levels, share of workers retiring early, share of staff years I3 Contribution to regional income. Share of population, remuneration relative to business sector standards and to regional average I4 Education provided. In-house education and training for company specific skills / for general employability, education and training provided by whom (company, business associations, public authorities, etc.), for whom (income group, qualification level and sex of participants) I5 Health-care and welfare infrastructure provided by mining companies. In more remote areas mining companies often provide for infrastructure, even to non-mine staff. I6 Civil rights in mining companies. The right to organise, to freedom of speech (including on malperformance and cover-ups), and the means to secure such rights such as to an ombudsman or the like. I7 Civil society activism level. Existence of pressure groups, lobbies, activists and their level of public resonance and political influence on the local and regional level. J J1 Regional development Mandatory contributions. Taxes paid, share in local, regional and national tax income, including other mandatory payments/obligations, expenditures caused by mining operations (administrative procedures, monitoring, enforcement, etc.) J2 Voluntary contributions to the community. Donation of money and/or staff working hours to activities of public interest / for the common good, etc. on the local level 62
222 EO-MINERS collection of selected products APPENDIX Příloha 1 pokračování: H3 I I1 I2 I3 Poruchy a nehody na sousedící půdě kvůli povrchové nestabilitě Bod je spojen s bodem G2, ale je více zaměřen na dopady. Narušené nebo hroutící se budovy, znehodnocení zemědělské půdy kvůli depresím způsobeným nahromaděním vody, atd. mohou být způsobeny nestabilitou půdy z důvodu těžby. Poškození a platby náhrad jsou podstatnými faktory při určování ekonomického dopadu. Sociální dopady Počet vytvořených pracovních míst Úrovně kvalifikace, medián mzdy, pracovní hodiny, vyvážení pohlaví Dlouhodobá pracovní jistota Průměrná délka zaměstnání, podíl místních obyvatel v zaměstnanosti na jednotlivých úrovních, podíl zaměstnanců s předčasným důchodem, podíl zaměstnanců ve věku let Přínos do místních příjmů Podíl obyvatelstva platově srovnané s obchodním sektorem a s místním platovým průměrem I4 I5 I6 I7 J J1 J2 Poskytnuté vzdělání Školení a vzdělání dovedností, specifických pro těžební společnost / pro všeobecnou zaměstnanost, vzdělání a školení poskytnuté kým (společnost, obchodní asociace, úřady, atd.), pro koho (příchozí pracovní síla, úroveň kvalifikace a pohlaví účastníků) Zdravotní péče a infrastruktura sociálního zabezpečení poskytnutá těžebními společnostmi Ve více odlehlých oblastech poskytují těžební společnosti infrastrukturu také pro obyvatele nepracující pro tuto společnost. Občanská práva v těžebních společnostech Právo sdružovat se, právo na svobodu slova (včetně zveřejnění podvýkonnosti a skrývaných skutečností) a prostředky k zajištění těchto práv, jako například zřízení funkce ombudsmana nebo podobné kroky. Úroveň veřejného aktivismu Existence nátlakových skupin, lobbingu, aktivistů a úroveň jejich veřejné odezvy a politický vliv na místní a regionální úrovni. Regionální rozvoj Povinné příspěvky Zaplacené daně, podíl na místním, regionálním a národním daňovém příjmu, včetně jiných povinných plateb a závazků, výdaje způsobené těžební činností (administrativní procesy, monitoring, vymáhání, atd.) Dobrovolné příspěvky místní komunitě Finanční dary a/nebo poskytnutí pracovních hodin pro obecné blaho / všeobecný zájem, atd. na místní úrovni. 63
223 EO-MINERS collection of selected products APPENDIX Appendix 1 continue: J3 Infrastructure development. Housing, industrial premises, roads/railroads, sealed areas. Akin to A2 and F2, but assessing qualitative as well as quantitative changes. The number of houses and industrial premises and their state would indicate economic developments. J4 Existence and effectiveness of local/regional institutions for information management. Collecting and integrating monitoring information, comparing to benchmarks (best practice), making this information publicly accessible J5 Capabilities of local and regional authorities. For monitoring and compliance enforcement, including the capability to make use of EO-information, in particular remote sensing data K K1 Economic Vulnerability/Resilience Risk for the community. Share of income and employment dependent on the mining operation. K2 Corporate vulnerability. Dependency ratios (on the largest supplier, e.g. for key equipment parts, main customer, logistics partner, etc.). K3 Vulnerability management cost. Payment to insurance companies, liability regulations, management accountability regulations, or similar issues K4 Damage costs. Payments for violation of environmental, social, taxation or other legal provisions (polluter pays principle, speculator pays principle), compensation payments for health and other damages, cases of and fines paid and due for social, ethnic, gender or other discrimination. K5 Sustainability management plan. Sustainable development part of the core strategy with board level responsibility. Core strategy vs. sub-strategy vs. PR, voluntary code of conduct? Regular sustainability report? K6 Prevalence of corruption. Direct and indirect assessment of the levels of corruption around mining issues relevant to stakeholders, such as enforcement of rules and regulations pertaining to land-use planning or environmental impact assessment. 64
224 EO-MINERS collection of selected products APPENDIX Příloha 1 pokračování: J3 J4 J5 K K1 K2 K3 K4 K5 K6 Rozvoj infrastruktury Bydlení, průmyslové předpoklady, silnice/železnice, uzavřené oblasti. Bod je blízký bodům A2 a F2, ale stanovuje kvalitativní a také kvantitativní změny. Počet domů a průmyslových předpokladů a jejich stav může značit ekonomický rozvoj. Existence a efektivita místních a regionálních institucí ve směru správy informací Shromažďování a sdružování vysledovaných informací, srovnání s ukazateli (nejlepší zkušenosti) a poskytnutí těchto informací veřejnosti. Schopnosti místních a regionálních úřadů Pro sledování a dodržování vyhovění, zahrnující schopnost využít informace ze sledování Země, především data dálkového průzkumu Země. Ekonomická zranitelnost/odolnost Rizika komunity Podíl příjmu a zaměstnanost závislá na těžebních aktivitách. Firemní zranitelnost Podíl závislosti (na největším dodavateli, např. klíčových dílů výbavy, hlavní zákazník, logistický partner, atd.) Náklady zranitelnosti managementu Platby pojišťovnám, regulace závazků, regulace odpovědnosti managementu nebo podobné situace. Náklady za poškození Platby za poškození životního prostředí, sociálních a daňových nebo jiných zákonných ustanovení (princip znečišťovatel platí a princip spekulant platí ), finanční kompenzace zdravotního a jiného poškození, pokuty zaplacené kvůli sociální, etnické, genderové diskriminaci. Udržitelný plán řízení Udržitelný rozvoj jako součást hlavní strategie se zodpovědností na úrovni vedení firmy. Hlavní strategie vs. dílčí strategie vs. komunikace s veřejností, dobrovolný kodex řízení, zpráva o udržitelnosti Rozšíření korupce Přímé a nepřímé vyhodnocení úrovní korupce, týkající se těžebních věcí, důležitých pro zainteresované subjekty, jako například prosazování pravidel a omezení vztažených k managementu využití půdy nebo vyhodnocení dopadů na životní prostředí. 65
225
226
227
228 EO-MINERS collection of selected products Indicators and Earth Observation Products for the Assessment of the Extractive Industry Environmental and Societal Impacts Material and information for the EO-MINERS workshop at the emalahleni Coalfield demonstration site APRIL, 2013 EO-MINERS project 2013 The EO-MINERS project (Earth Observation for Monitoring and Observing Environmental and Societal Impacts of Mineral Resources Exploration and Exploitation) is executed with financial support from the European Commission under the Seventh Framework Programme, FP7-ENV , Grant Agreement No The publication reflects only the author's views and European Union is not liable for any use that may be made of the information contained. DOI: /eo-miners EO-MINERS eo-miners.eu
229 EO-MINERS collection of selected products List of contributors (in alphabetical order) Surname Name Acronym Institution Country Adar Simon TAU Tel-Aviv University Israel Andriamasinoro Fenintsoa BRGM Bureau de Recherches Géologiques et Minières France Ben-Dor Eyal TAU Tel-Aviv University Israel Blanchard Francois BRGM Bureau de Recherches Géologiques et Minières France Bourguignon Anne BRGM Bureau de Recherches Géologiques et Minières France Chevrel Stephane BRGM Bureau de Recherches Géologiques et Minières France Coetzee Henk CGS Council for Geoscience South Africa Ehrler Christoph DLR Deutsches Zentrum für Luft- und Raumfahrt Germany Falck W. Eberhard UVSQ Université de Versailles Saint-Quentin-en-Yvelines France Ferriday Sadie MIRO The Mineral Industry Research Organisation United Kingdom Fischer Christian DLR Deutsches Zentrum für Luft- und Raumfahrt Germany Grebby Stephen R. BGS British Geological Survey United Kingdom Hanise Bantu CGS Council for Geoscience South Africa Hejny Horst MIRO The Mineral Industry Research Organisation United Kingdom Jordan Colm J. BGS British Geological Survey United Kingdom Kerr Grégoire DLR Deutsches Zentrum für Luft- und Raumfahrt Germany Kwata Maphuti CGS Council for Geoscience South Africa Livne Ido TAU Tel-Aviv University Israel Mardhel Vincent BRGM Bureau de Recherches Géologiques et Minières France McEvoy Fiona M. BGS British Geological Survey United Kingdom Nosteco Gila TAU Tel-Aviv University Israel Palumbo-Roe Barbara BGS British Geological Survey United Kingdom Rogge Derek DLR Deutsches Zentrum für Luft- und Raumfahrt Germany Rouzeau Olivier BRGM Bureau de Recherches Géologiques et Minières France Šolar Slavko V. GeoZS Geološki zavod Slovenije Slovenia Spangenberg Joachim H. SERI Sustainable Europe Research Institute Germany Teršič Tamara GeoZS Geološki zavod Slovenije Slovenia Van Tonder Danel NWU North West University, Pochefstroom South Africa Wittmer Dominic WI Wuppertal Institute Germany Žibret Gorazd GeoZS Geološki zavod Slovenije Slovenia Žibret Lea UL University of Ljubljana Slovenia This work should be cited by using DOI, as: Teršič T, Andriamasinoro F, Ben-Dor E, Blanchard F, Bourguignon A, Coetzee H, Ehrler C, Falck WE, Ferriday S, Fischer C, Grebby SR, Hanise B, Hejny H, Jordan CJ, Kerr G, Kwata M, Livno I, Mardhel V, McEvoy FM, Mišurec J, Nosteco G, Palumbo- Roe B, Rogge D, Rouzeau O, Šolar SV, Van Tonder D, Wittmer D, Žibret G, Žibret L, Chevrel S. Indicators and Earth Observation Products for the Assessment of the Extractive Industry Environmental and Societal Impacts - Material and information for the EO-MINERS workshop at the emalahleni Coalfield demonstration site. EO-MINERS project, 2013, DOI: /eo-miners List of Abbreviations: AHS Airborne Hyper-Spectral imaging sensor, covering reflective and thermal domain AMD Acid Mine Drainage phenomena where due to oxidation processes in soil/rocks waters become acidic ATI Apparent Thermal Inertia the property of material to preserve heat DEM Digital Elevation Model a model of the terrain, which can be used to generate realistic 3D images DOC Dissolved Organic Matter this parameter tells you how much organic matter is dissolved in water EO Earth Observation a broad range of techniques which are used to gain the data about the environment EO-MINERS acronym for this project, co-funded by EC commission GIS Geographical Information System a kind of database which allows the storage and analysis of geographical data GEODIS A company situated in Brno HyMAP Airborne hyperspectral imaging sensor, covering reflectance domain an instrument usually mounted on a plane which is used for remote sensing ICP-MS Inductively coupled plasma mass spectrometry - a method for chemical analysis of soils and other materials ph measure for soil acidity/alkalinity; low ph means that toxic elements might become dissolved in water, thus possessing risks to environment and health RSL Remote Sensing Laboratory
230 EO-MINERS collection of selected products Table of contents Contents 1. EO-MINERS project introduction Aim of the workshop Indicators of mining impacts Site-specific indicators for emalahleni Coalfield EO-MINERS Products Appendix 1. Consolidated Set of Candidate Indicators for the EO-MINERS Project
231 EO-MINERS collection of selected products Project summary and methods 1. EO-MINERS project introduction The mining industry plays a key role in the development of many countries around the world and continues to be an important contributor to both regional and national economies. Minerals, and the industries it supports, are among the basic building blocks of modern society. While the exploitation of mineral resources in many countries is a vital part of economic growth, employment and infrastructure development, it comes at a cost to the environment and can negatively impact local communities. Past operations have left a historical legacy of environmental and/or societal impacts that affect our perception of mining. With the emergence of the concept of sustainable development it is now recognised that environmental protection and societal protection is as fundamental to a healthy economy and society as is economic growth. However, the need to simultaneously promote development in these three areas is challenging even in developed countries. The aim of the EO-MINERS project is to develop methods and tools that help to facilitate and improve interaction between the mining industry and society through the use of Earth Observation (EO) based methods and tools. These methods and tools (using satellite and airborne sensors as well as measurements on site) collect data relevant to a particular area that can be used to objectively assess potential mining-related environmental and socioeconomic impacts over the whole life-time of a mine, from exploration to final closure. The resulting EO products will help to make decision-making processes more transparent. They will support discussion between the mining industry, the regulating authorities and other stakeholders concerned, such as local communities and NGO. Importantly, they empower the public by providing complex geo-information in a way (such as interactive maps) that is understandable to stakeholders with diverse expertise and differing levels of background knowledge. This is achieved by integrating different processed data sets into single EO products. The goal of the EO-MINERS research project is to use EO tools to help identify miningrelated environmental and societal footprints. This, in turn will contribute to their reduction and improve the societal acceptability of mining projects and related activities. In order to achieve this goal, the data collected have to be objective and accurate. Data collected using remotely sensed methods, integrated with in situ information, fulfil these criteria. The objectives of EO-MINERS are threefold: (1) To assess what information is needed to empower stakeholders from global to local levels on activities relating to the mining industry (from exploration to mine closure and remediation). These needs are then cast into a set of indicators 1, which highlight environmental and societal issues of concern to stakeholders. 1 The term indicators is explained in chapter 3. 2
232 EO-MINERS collection of selected products Project summary and methods (2) To develop EO products in support of the indicators. These will include existing EO methods along with others that were newly developed within EO-MINERS, supported by visualisation methods. (3) To develop strategies and methods to facilitate an open dialogue between the different groups of stakeholders based on objective and accurate information on issues of concern. This approach is demonstrated at three mining areas: In Southern Africa: the emalahleni Coalfields, Mpumalanga Province, South Africa In Central Asia : the Makmal gold mine, Kyrgyzstan In Europe: the Sokolov lignite open cast mines, Czech Republic The results referred to in the following chapters are derived from the EO-MINERS project (). A handbook of best practice for both the application of EO techniques, as well as the effective support for interaction between the different groups of stakeholders, will be a key outcome of the project. 3
233 EO-MINERS collection of selected products Project summary and methods 2. Aim of the workshop This booklet presents site-specific results to date and proposed approaches with a view to gathering comments on the usefulness of EO products from you as a stakeholder. The booklet serves as preparatory information for the workshop in emalahleni on the 24 th March 2013 where diverse stakeholders are invited to contribute to discussions. Presenting the EO products developed for the mining site of emalahleni (and the other sites), and receiving feedback on their applicability and potential usefulness is a critical step in the project. Our dialogue with stakeholders, facilitated further within this workshop, will help to assess the usefulness of EO when discussing mining-related concerns. The prioritisation of the EO products developed for the emalahleni coalfield are related to the findings from interviews with stakeholders in the emalahleni area in May 2010 and February 2011, and on subsequent analyses of what information is of most relevance for you. The purpose of this workshop is to explain the EO products we have developed and to invite feedback from you, with respect to your main concerns, on the: 1. Appropriateness of the selection of indicators and supporting EO products 2. Perceived quality of the EO products 3. Perceived applicability of the EO products. In the following chapter, a short introduction is given on how the concept of indicators helped us to prioritise EO products for emalahleni and the other mining sites. Then, the results are presented in detail, i.e. the products are presented in light of the issues prioritised (the indicators). 4
234 EO-MINERS collection of selected products Project summary and methods 3. Indicators of mining impacts The impact of mining operations on the physical and socio-economic environment can be complex. The effects of decisions made by the mine owners and operators, regulatory authorities, or civil society stakeholders are difficult to assess and predict. In some cases, the impacts only become apparent over a long time-scale (up to decades). Absence of objective and accurate site data can further complicate monitoring and assessment, and thus also delay any actions required. This can result in the lack of social acceptance of mining. Meaningful information on complex environmental or social issues can often be more easily understood and discussed when provided in the form of indicators. Common economic indicators are Gross Domestic Product (GDP), or the Unemployment Rate of countries. Many environmental indicators exist. An example of an environmental indicator is counting the number of a rare species of animals or birds to estimate the health of the environment within a particular area. For more background information on indicators, see the text box below. What are indicators? Indicators offer a metric of the state of complex systems or of issues, or for trends of their development, when measurements or observations are repeated over time. An example of a commonly accepted economic indicator is the inflation in a given country. It is generally considered a lagging indicator, this means it usually changes after the economy as a whole. The inflation reflects the (national) decrease in the purchasing power of money (price inflation). As the price level can be measured in a multitude of ways, also the inflation can be measured by many different measures. Usually it is measured by calculating the change of a price index, e.g. the consumer price index, that themselves require lots of background data and are consolidated into a single value. This value can be followed from year to year and also allows comparisons between different countries, thus indicating change and relative performance. Indicators must be based on measurable quantities or at least observable and distinguishable qualities in order to be useful. While indicators are useful tools to reduce a complex set of diverse data, it should be kept in mind that every process of indicator selection or aggregation inevitably includes both, a gain in clarity, but also a loss of information. Indicators need to have a number of specific qualities and properties in order to be useful, and they must have a clearly defined purpose. 5
235 EO-MINERS collection of selected products Project summary and methods A multi-pronged approach to developing indicators was used (Figure 1). The approach consisted of: the development of an initial set of indicators by technical experts; the development of site-specific conceptual models; and interviews at the sites with stakeholders. Figure 1: Multiple strategy to develop indicators. These three processes ran in parallel. The process went through several loops of iterations, resulting in a set of candidate indicators that are applicable generally, and thus to each of the study sites. The development of meaningful indicators is mostly a social process and not an engineering process. This social process defines what indicators need to be developed, for whom and what purpose. Within EO-MINERS the specialists were in charge of evaluating whether or not a proposed indicator could be related to quantities measurable by EO. For this reason, the proposed set of indicators was reviewed by them in order to assess their measurability using EO techniques. For practical reasons, indicators currently immeasurable were disregarded (cf. Figure 2) without considering the actual needs for measurement. To that effect the development of indicators is an iterative process balancing stakeholder expectations and operational feasibility. 6

236 EO-MINERS collection of selected products Project summary and methods Figure 2: Relationship between different sets of indicators as defined by the EO-MINERS project (set theory representation) of the candidate indicator set A candidate set of 59 indicators covering eleven thematic areas has been developed in the frame of the project, namely on A. Land-use B. Mass and energy flows C. Air quality and other nuisances D. Soil quality E. Water quality F. Transport G. Geotechnical hazards and accidents H. Industrial and other accidents I. Social impact J. Regional development K. Economic vulnerability/resilience The set of candidate indicators can be found in the appendix. 7
237 EO-MINERS collection of selected products Project summary and methods 4. Site-specific indicators for emalahleni Coalfield Selected stakeholders of the emalahleni mining area were interviewed by EO-MINERS project researchers in May 2010 and February Notes were taken during these interviews, in some cases complemented by sound recordings. The views or concerns expressed and information needs related were compared with the set of candidate indicators, i.e. the comprehensive list of 59 indicators that are not site-specific. This allowed the team to prioritise indicators, which reflect best those views, concerns, and needs of the stakeholders met at the emalahleni area. The stakeholders were grouped into three broad groups of likely diverging views and interests - mine operators, regulators and civil society stakeholders. However, at the emalahleni demonstration site no regulators could be interviewed. Within the three groups, a further division was made into those likely to have previous knowledge of EO tools, methods and objectives, and those that are less likely to have such knowledge. An analysis of the interests and concerns of each group was undertaken. The field of interest of those stakeholders with and without previous knowledge of EO was very similar, although with somewhat different emphasis (Figure 3). Land-use questions seem to be of relevance to all groups. Closely related to this are questions of recultivation success and areas indirectly affected by mining. Otherwise water quality issues, such as acid mine drainage generation appeared to be high on the agenda of most concerned. A comparison of operators with civil society stakeholders shows that all are concerned about land-use and environmental issues (Figure 4). However, air quality, noise and related nuisances seem to be more of concern to the public than to the operators. Overall the data show a public concern over off-site environmental and societal impacts, which may be given less weight by the operators. For the purpose of directing the development of EO products, a subset of indicators was selected from the candidate set of indicators. This subset of indicators, for which EO products were developed, is shown in Table 1. Having outlined some of the principal findings from the interviews with stakeholders in the emalahleni region, the workshop participants are invited to reflect upon the findings and to comment on the scope and coverage of the emalahleni subset of indicators (for further details on the scope of indicators, see also appendix 1): Do the proposed indicators reflect your information needs? 8
238 EO-MINERS collection of selected products Project summary and methods Figure 3: Comparison of frequency between issues mentioned for stakeholders with previous EO knowledge (red) and without EO knowledge (blue). Classification based on assumptions 9

 and civil society stakeholders")
239 EO-MINERS collection of selected products Project summary and methods Figure 4: Comparison of frequency between issues mentioned for mining operators (red) and civil society stakeholders (blue). 10
240 EO-MINERS collection of selected products emalahleni demonstration site EO-MINERS outputs 5. EO-MINERS Products This chapter provides a selection of the outputs that were developed using Earth Observation techniques within the EO-MINERS project, and that aim to address the prioritised indicators (cf. Table 1). A selection of the most representative examples from the large amount of data are presented that was collected during the project. Moreover, as the project is still ongoing, the outputs shall be regarded as preliminary and can be subject to change. Nevertheless, their presentation in this booklet aims to prepare discussions at the workshop. At a later stage, the final products will be placed on the EO-MINERS website ( The EO products presented in this chapter and discussed in the workshop are listed in Table 1. The products will be described and explained in the workshop, and the functionality of the digital counterparts e.g. the PDF files, will be illustrated. While the images in this booklet are static, their digital counterparts enable greater interaction with the data, so that, for example, various layers of information can be turned on/off to see how they relate to eachother; while useful functionality is also available such as the ability to measure distances and areas. The PDF files will be available for download from the EO-MINERS website. Addtional digital outputs include three dimensional (3D) visualisations which can be displayed in full resolution in programs such as GeoVisionary (TM) and in lower resolution in GoogleEarth (TM). 11
241 EO-MINERS collection of selected products emalahleni demonstration site EO-MINERS outputs We ask you for your general feedback on the Earth Observation products presented on the following pages. More specifically, we would be pleased to receive your opinion on the following questions: with regard to comprehension: Do the EO products present the mapped information in a clear and understandable way? Which EO products are (most) useful / interesting for you ( top three )? Which EO products tell you something new? Would you consider using one or more of the EO products presented? with regard to their technical implementation: Do the EO products support the concerns you initially raised (i.e. do they support the indicators - cf. Table 1)? Are there any concerns with regard to the parameters (ie Chromium etc) that were selected to provide information about your concerns? Should or could we have used different parameters)? Is the detail (i.e. spatial resolution) of the EO products sufficient to satisfy your needs? Otherwise, what level of detail would be more appropriate? For one of the EO products, could you suggest a different way of showing the information/data that would be more useful or understandable? We would like to discuss with you not only the usefulness of the individual EO products for your purposes, but also what appears to be the added value of EO products over alternative options for obtaining relevant information. Would you estimate that the use of EO products provides information relevant for your decisions (a) that otherwise would not at all be available or (b) that has already been measured or could be measured, but with higher efforts (time, money)? 12
242 EO-MINERS collection of selected products emalahleni demonstration site EO-MINERS outputs Table 1: EO-MINERS products and related indicators for the emalahleni area. All of the products were compiled by BGS. Product Title Related Indicator Primary contact 1 Change of the mining footprint through time Land Use: A1: Total land use by mining and milling Stephane Chevrel (BRGM) s.chevrel@brgm.fr 2 Residential land use around mining areas Land Use: A4: Residential land use (residential developments around mining areas) Land Use: A5: Informal settlement (sprawl of squatters areas, slums) Stephane Chevrel (BRGM) s.chevrel@brgm.fr 3 Urban footprint Land Use: A4: Residential land use (residential developments around mining areas) Land Use: A5: Informal settlement (sprawl of squatters areas, slums) Christian Fischer (DLR) c.fischer@dlr.de 4 Mining and areas of ecological importance Land Use: A6: Site set aside, protected areas (nature reserves, wetlands, sites of spiritual value and similar) Stephane Chevrel (BRGM) s.chevrel@brgm.fr Henk Coetzee (CGS) henkc@geoscience.org.za i) Distribution map of antimony (Sb) dust contamination 5 ii) Distribution map of chromium (Cr) dust contamination iii) Distribution map of vanadium (V) dust contamination iv) Distribution map of barium (Ba) dust contamination Air Quality and other Nuisances: D1: Aerosols (particle concentration in off-site air) Gorazd Žibret (GeoZS) gorazd.zibret@geo-zs.si 6 Acid mine drainage contamination potential Water Quality: E4: Acid drainage generation potential (distribution of sulphidic iron minerals) Eyal Ben-Dor (TAU) bendor@post.tau.ac.il Stephane Chevrel (BRGM) s.chevrel@brgm.fr 7 Density of road per km2 Transport: F2: Land fragmentation by transport infrastructure Stephane Chevrel (BRGM) s.chevrel@brgm.fr Christian Fischer (DLR) c.fischer@dlr.de 8 Geotechnical hazards and ground stability Geotechnical Hazards and Accidents: G2: Ground stability (changes in elevation of areas unaffected by residue disposal) Henk Coetzee (CGS) henkc@geoscience.org.za Colm Jordan (BGS) cjj@bgs.ac.uk 9 Geotechnical hazards: miningrelated fires Geotechnical Hazards and Accidents: G4: Underground and mining waste deposit fires Christian Fischer (DLR) c.fischer@dlr.de Henk Coetzee (CGS) henkc@geoscience.org.za 13

243 CHANGE OF THE MINING FOOTPRINT THROUGH TIME - EMALAHLENI - SOUTH AFRICA km ± Coordinate System: Projected Geographic Projection: Datum: UTM Zone 35S WGS84 Geographic (DMS) WGS84 14
244 Legend: Town emalahleni municipality National route Interchange Main road Secondary road Other roads Railway River Mining footprint In 1989 In 2002 In 2010 Interpretation: This product shows how the amount of land used by mining (i.e. the footprint) has changed between 1989 and 2010 in emalahleni and the neighbouring area. Although the shape of the mining footprint differed between 1989 and 2002, the total area occupied by mining remained largely unchanged. However, between 2002 and 2010, the total area occupied by mining more than doubled from 16,000 hectares to 40,000 hectares. The land occupied by mining was mapped through visual interpretation of satellite imagery (i.e. Landsat TM). The product relates to indicator A1 Total land used by mining. Namibia Botswana Zimbabwe Pietersburg (Polokwane) Pretoria Johannesburg Nelspruit Framework: The EO-MINERS project (Earth Observation for Monitoring and Observing Environmental and Societal Impacts of Mineral Resources Exploration and Exploitation) is running with financial support from the European Commission under the Seventh Framework Programme, FP7-ENV , Grant Agreement No South Africa Kimberley Bloemfontein Durban Whilst this product is realised to the best of our ability using the available resources, the producers are not liable for its content or consequences arising from its use. Bisho East London For more information regarding this product and the EO-MINERS project please visit Cape Town Port Elizabeth EO-MINERS project 2013 Fig. 5: Change of the mining footprint through time (Indicator A1). 15
 WGS84 16")
245 RESIDENTIAL LAND USE AROUND MINING AREAS - EMALAHLENI - SOUTH AFRICA km ± Coordinate System: Projected Geographic Projection: Datum: UTM Zone 35S WGS84 Geographic (DMS) WGS84 16
246 Legend: Interpretation: Town emalahleni municipality National route Interchange Main road Secondary road Other roads Railway River Mining areas Residential development within 500m of mining area Mapped from satellite imagery Formal residential development Informal residential development Mapped using 2011 census Formal residential development Informal residential development This product shows residential developments (both formal and informal) around the mining areas in the emalahleni municipality and neighbouring area. Residential developments within 500m of mining areas are identified in yellow. These show the areas potentially most at risk from associated issues such as heavy truck traffic, structural damage and dust pollution. Mining areas and formal and informal residential developments were mapped through visual interpretation from satellite imagery (i.e. Landsat TM and SPOT). For comparison, residential developments from the 2011 census are also shown in the insets. These comparisons show that satellite imagery is a useful tool for mapping and also monitoring residential developments and urban planning. Botswana Zimbabwe Pietersburg (Polokwane) The product relates to indicators A4 Residential land use (residential land use around mining areas) and A5 Informal settlements (sprawl of squatters areas). Namibia Pretoria Johannesburg Nelspruit Framework: South Africa Kimberley Bloemfontein Durban The EO-MINERS project (Earth Observation for Monitoring and Observing Environmental and Societal Impacts of Mineral Resources Exploration and Exploitation) is running with financial support from the European Commission under the Seventh Framework Programme, FP7-ENV , Grant Agreement No Whilst this product is realised to the best of our ability using the available resources, the producers are not liable for its content or consequences arising from its use. Cape Town Bisho East London Port Elizabeth For more information regarding this product and the EO-MINERS project please visit. EO-MINERS project 2013 Fig. 6: Residential land use around mining areas (Indicators A4 and A5). 17
")
247 URBAN FOOTPRINT - EMALAHLENI - SOUTH AFRICA km ± Coordinate System: Projected Geographic Projection: Datum: UTM Zone 35S WGS84 Geographic (DMS) WGS84 18
248 Legend: Interpretation: Town National route Interchange Main road Secondary road Other roads Railway Urban area This product shows urban areas (residential and industrial) in the emalahleni municipality that have been automatically mapped using Synthetic-Aperture Radar (SAR) data. Due to the high resolution capability of TerraSAR-X, individual buildings can be identified in the images. Satellites like TerraSAR-X regularly record new images, which means that the extent of urban areas and how these change can easily be monitored over time. Further analyses and combinations with other data allow different types of urban structures and residential developments to be identified. This information can be used to support local and regional planning activities. It can also be used to gain a better understanding of the societal issues associated with mining, particularly the proximity of buildings to mining areas. Zimbabwe The product can be related to indicators A4 Residential land use (residential land use around mining areas) and A5 Informal settlements (sprawl of squatters areas). Namibia Botswana Pietersburg (Polokwane) Nelspruit Pretoria Johannesburg Kimberley South Africa Bloemfontein Durban Framework: The EO-MINERS project (Earth Observation for Monitoring and Observing Environmental and Societal Impacts of Mineral Resources Exploration and Exploitation) is running with financial support from the European Commission under the Seventh Framework Programme, FP7-ENV , Grant Agreement No Whilst this product is realised to the best of our ability using the available resources, the producers are not liable for its content or consequences arising from its use. Cape Town Bisho East London Port Elizabeth For more information regarding this product and the EO-MINERS project please visit. EO-MINERS project 2013 Fig. 7: Urban footprint (Indicators A4 and A5). 19

249 MINING AND AREAS OF ECOLOGICAL IMPORTANCE - EMALAHLENI - SOUTH AFRICA km ± Coordinate System: Projected Geographic Projection: Datum: UTM Zone 35S WGS84 Geographic (DMS) WGS84 20
250 Legend: Interpretation: Town emalahleni municipality National route Interchange Main road Secondary road Other roads Railway River Surface water Wetland Mining area Habitat classification Highly significant/ irreplaceable Important/ necessary Protected This product shows mining areas in relation to areas of ecological importance in the emalahleni municipality. It shows that mining occurs close to and coincides with many areas of significant ecological importance. In these areas, mining-related issues such as air pollution, land loss and degradation, and acid mine drainage (AMD) could damage the natural habitat and therefore affect both species diversity and numbers. The land occupied by mining was mapped through visual interpretation of satellite imagery (i.e. Landsat TM). The habitat classification information was adapted from that contained in the emalahleni municipality Geographical Information System (GIS). Botswana Zimbabwe Pietersburg (Polokwane) The product relates to indicator A6 Sites set aside and protected areas. Namibia South Africa Nelspruit Pretoria Johannesburg Kimberley Bloemfontein Durban Framework: The EO-MINERS project (Earth Observation for Monitoring and Observing Environmental and Societal Impacts of Mineral Resources Exploration and Exploitation) is running with financial support from the European Commission under the Seventh Framework Programme, FP7-ENV , Grant Agreement No Whilst this product is realised to the best of our ability using the available resources, the producers are not liable for its content or consequences arising from its use. Cape Town Bisho East London Port Elizabeth For more information regarding this product and the EO-MINERS project please visit. EO-MINERS project 2013 Fig. 8: Mining and areas of ecological importance (Indicator A6). 21


251 DUST POLLUTION - EMALAHLENI - SOUTH AFRICA km ± Coordinate System: Projected Geographic Projection: Datum: UTM Zone 35S WGS84 Geographic (DMS) WGS84 22
252 Interpretation: Legend: Town emalahleni municipality National Route Interchange Main Road Secondary Road. Smelting Street dust sample location plant Power station This product shows the content of four metals measured in street dust samples collected in emalahleni in February Street dust is a complex mixture of different materials of both natural and anthropogenic origin. Dust particles of natural origin include soils, volcanic ash, pollen, plant remains and smoke from forest fires. Anthropogenic dust particles can originate from weathering and abrasion of man-made materials (e.g. asphalt, concrete), demolition or construction activities, metal and energy production (e.g. smelters, coal-burning power stations), agriculture and road traffic (e.g. wear of brake pads and tyres, fuel combustion). Namibia Other Roads Railway River Botswana Fly-ash dump Coal mine Pretoria Johannesburg Zimbabwe Pietersburg (Polokwane) Nelspruit Dust produced through these various mechanisms is first released into the atmosphere before being deposited at street level, and then subsequently remobilised by wind or passing traffic, for example. As a result, street dust particles often form a major component of the air that we breathe. However, street dust can contain high amounts of toxic metals, especially in urban environments and close to busy roads and industrial areas. Accordingly, dust containing high levels of toxic metals can pose a health risk, particularly to young children, because such metals can easily enter into the blood stream through the ingestion or inhalation of the relatively fine-grained dust particles. Additionally, because some of these toxic metals are easily be dissolved in water, the runoff produced following a rainy period can lead to contamination of the surface water and potentially harm aquatic life. By analysing the chemical composition of the deposited street dust, we are able to identify its potential source (e.g. vehicles). South Africa Kimberley Bloemfontein It relates to indicator D1 Aerosols (particles concentration in off-site air). Durban Framework: Cape Town Bisho East London Port Elizabeth The EO-MINERS project (Earth Observation for Monitoring and Observing Environmental and Societal Impacts of Mineral Resources Exploration and Exploitation) is running with financial support from the European Commission under the Seventh Framework Programme, FP7-ENV , Grant Agreement No Whilst this product is realised to the best of our ability using the available resources, the producers are not liable for its content or consequences arising from its use. For more information regarding this product and the EO-MINERS project please visit. EO-MINERS project 2013 Fig. 9: Dust Pollution (Indicator D1). 23

253 ACID MINE DRAINAGE CONTAMINATION POTENTIAL - EMALAHLENI - SOUTH AFRICA km ± Coordinate System: Projected Geographic Projection: Datum: UTM Zone 35S WGS84 Geographic (DMS) WGS84 24
254 Legend: Interpretation: This product assesses the potential effect of acid mine drainage (AMD) on water quality. It shows where minerals associated with AMD occur (in 2011) in relation to where surface water flows. It also shows the potential downstream flow paths of AMD contamination from several sources, and pre-existing contaminated surface water. AMD-producing minerals frequently occur close to drainage channels, potentially putting them at risk of contamination. Possible AMD-producing minerals and contaminated water were mapped using satellite imagery (World View II) and aerial photography, respectively. Drainage channels and the potential downstream flow paths were mapped using a 1-m Digital Elevation Model. This product relates to indicator E4 Acid Mine Drainage generation potential (distribution of sulphidic iron minerals). Zimbabwe Botswana Pietersburg (Polokwane) Namibia South Africa Nelspruit Pretoria Johannesburg Kimberley Bloemfontein Durban Framework: The EO-MINERS project (Earth Observation for Monitoring and Observing Environmental and Societal Impacts of Mineral Resources Exploration and Exploitation) is running with financial support from the European Commission under the Seventh Framework Programme, FP7-ENV , Grant Agreement No Whilst this product is realised to the best of our ability using the available resources, the producers are not liable for its content or consequences arising from its use. Bisho East London For more information regarding this product and the EO-MINERS project please visit. Cape Town Port Elizabeth EO-MINERS project 2013 Fig. 10: Acid mine drainage contamination potential ( Indicator E4). 25
")
255 DENSITY OF ROADS PER SQUARE KM - EMALAHLENI - SOUTH AFRICA km ± Coordinate System: Projected Geographic Projection: Datum: UTM Zone 35S WGS84 Geographic (DMS) WGS84 26
256 Legend: Interpretation: Town emalahleni municipality National route National Freeway Interchange Main road Secondary road Street Other roads Coal transport route Railway Power station Ì Coal mine Length of road per unit area (m/km 2 ) > > 4000 This product shows the road infrastructure and the possible impact it has on the landscape in emalahleni municipality. The total length of road within a given area can be used as a measure of how fragmented (or divided) the landscape is, with large values indicating a high degree of land fragmentation. A high degree of land fragmentation can be seen in the main urban area of Witbank and in developments that appear to be coalrelated (e.g. mining areas and power stations). Land fragmentation can cause disturbance of migratory species, constraints on farming and traffic disturbances to communities. The road infrastructure was mapped using satellite imagery (i.e. SPOT), and the length of road per square kilometer was subsequently derived from this. The product relates to indicator F2 Land fragmentation by transport infrastructure. Zimbabwe Namibia Botswana Pietersburg (Polokwane) Nelspruit Pretoria Johannesburg Kimberley South Africa Bloemfontein Durban Framework: The EO-MINERS project (Earth Observation for Monitoring and Observing Environmental and Societal Impacts of Mineral Resources Exploration and Exploitation) is running with financial support from the European Commission under the Seventh Framework Programme, FP7-ENV , Grant Agreement No Whilst this product is realised to the best of our ability using the available resources, the producers are not liable for its content or consequences arising from its use. Cape Town Bisho East London Port Elizabeth For more information regarding this product and the EO-MINERS project please visit. EO-MINERS project 2013 Fig. 11: Density of road per km2 (Indicator F2). 27

257 GEOTECHNICAL HAZARDS AND GROUND STABILITY - EMALAHLENI - SOUTH AFRICA km ± Coordinate System: Projected Geographic Projection: Datum: UTM Zone 35S WGS84 Geographic (DMS) WGS84 28
258 Legend: Interpretation: Town National route Interchange Main road Secondary road Other roads Railway " Location and look-direction of 3D view Slope angle 90 0 This product shows high resolution elevation data from an airborne system called LiDAR along with aerial photos and satellite imagery from WorldView II. The high resolution elevation data enables subtle features on the ground (such as sink holes) to be identified, many of which are the result of underground mining that may cause some ground movement or mining-related subsidence. In this map, the cross section in the upper left inset box shows where the ground has moved due to underground mining. The insets also include slope maps derived from the elevation data. These indicate the steepness of the terrain; this in turn is a factor for stability and can highlight the location of collapse structures or areas at potential risk of collapse. Zimbabwe This relates to Indicator G2, Geotechnical hazards and ground stability. Botswana Pietersburg (Polokwane) Namibia Pretoria Johannesburg Nelspruit Framework: South Africa Kimberley Bloemfontein Durban The EO-MINERS project (Earth Observation for Monitoring and Observing Environmental and Societal Impacts of Mineral Resources Exploration and Exploitation) is running with financial support from the European Commission under the Seventh Framework Programme, FP7-ENV , Grant Agreement No Whilst this product is realised to the best of our ability using the available resources, the producers are not liable for its content or consequences arising from its use. Cape Town Bisho East London Port Elizabeth For more information regarding this product and the EO-MINERS project please visit. EO-MINERS project 2013 Fig. 12: Geotechnical hazards and ground stability (Indicator G2). 29

259 GEOTECHNICAL HAZARDS: MINING- RELATED FIRES - EMALAHLENI - SOUTH AFRICA km ± Coordinate System: Projected Geographic Projection: Datum: UTM Zone 35S WGS84 Geographic (DMS) WGS84 30

260 Legend: Surface temperature ( C) > 35 < 10 > 35 Temperature ( C) < Height (m) 1575 Interpretation: This product shows the night-time surface temperature as measured using an airborne thermal infra-red camera. While ground measurements can provide only local information, an airborne survey allows complete coverage of a much larger area. This information can be used to locate high temperature anomalies that potentially relate to subsurface coal fires in mining areas. Repeat-measurements can support monitoring of known coal fires and their severity, as well as locating new fires. Such analysis can take advantage of ground stability data, by linking collapse structures to high temprature events to provide a better understanding of the subsurface conditions (see upper left map inset). Hot-spots (e.g., potential coal fires) Warm areas (e.g., smelters, water bodies) Zimbabwe Data processing and product compilation was done by KOPANO. The measured temperatures were validated against ground survey reference measurements of different land-cover types. The product relates to indicators G4 Geotechnical Hazards and Accidents: Underground and mining waste deposit fires. Botswana Pietersburg (Polokwane) Namibia Pretoria Johannesburg Nelspruit Framework: South Africa Kimberley Bloemfontein Durban The EO-MINERS project (Earth Observation for Monitoring and Observing Environmental and Societal Impacts of Mineral Resources Exploration and Exploitation) is running with financial support from the European Commission under the Seventh Framework Programme, FP7-ENV , Grant Agreement No Whilst this product is realised to the best of our ability using the available resources, the producers are not liable for its content or consequences arising from its use. Cape Town Bisho East London Port Elizabeth For more information regarding this product and the EO-MINERS project please visit. EO-MINERS project 2013 Fig. 13: Geotechnical hazard: mining-related fires (Indicators G4). 31
261 EO-MINERS collection of selected products APPENDIX Appendix 1. Consolidated Set of Candidate Indicators for the EO-MINERS Project. A A1 Land-use Total land-use by mining and milling - topographical footprint. The total area used by the mine/mill is an overarching proxy for a variety of environmental and social impacts. The assumption is that the larger the area the larger the impact. A2 Mining land-use intensity topographical footprint vs. amount of marketable product. A time series of this indicator gives an impression of the space occupied by the mining and milling/energy conversion operation vs. the amount of end product that leaves the operation as marketable product. Changes in space intensity can point to less efficient residues management, lower quality of ore/coal, or deeper mining required. A3 Artisanal and Small-Scale Mining topographical footprint of ASM sites. Number of operating/abandoned sites of artisanal and small-scale mining (ASM). A4 Residential land use - residential developments around mining areas. The spatial relationship between residential and mining areas could be an indicator for potential use conflicts and impacts on health and safety. A5 Informal settlements sprawl of squatters areas, slums. Mining areas attract a variety of people and can cause the development of informal settlements in areas where there is not sufficient enforcement of zoning regulations. These suffer from poor piped water quality and in-house air pollution caused by using the bottom quality coal they collect. A6 Sites set aside, protected areas nature reserves, wetlands, sites of spiritual value and similar. On the basis of the current land use planning/zoning regulations at the site, this indicates constraints on mine development and also indicates zones sensitive to environmental impact arising from the mine. A7 Surface water courses percentage area covered by surface waters. Changes in surface area of lakes, rivers etc. can point to mining-induced changes in the water balance A8 Recultivation success on mined-out areas and waste/spoil heaps designated mining areas covered by specific vegetation (grassland, forest, water bodies,...), area returned to agricultural use. The remediation of mining and milling sites, including waste management areas (waste/spoil heaps) may include the recultivation of residues management sites with predetermined plant communities. Ground-covering vegetation is the best provision against wind erosion and an easy-to-monitor measure of recultivation efforts. Background information required: Legal provisions regarding submission of remediation plans (environmental, also employment) upfront, backed by a sufficient deposit payment to make remediation economically sensible. 32
262 EO-MINERS collection of selected products APPENDIX continued APPENDIX 1 continue. A9 Areas indirectly affected and its potential use - Impact of mining on the potential use of operation and surrounding areas, impact on land value / prices (opportunity cost). The type and economic value of potential alternative uses are location specific; the relevant characteristics need to be identified. Once described And validated by ground work, they can potentially be monitored by EO techniques. A10 Existence and legal status of environmental impact assessments for the operation and the remediation phase. Related to A7, but exploring the legal basis and indicating whether a lack of regulation or a lack of enforcement is the main course in case of negative impacts B B1 Mass Flows and Energy Flows Waste volumes generated volume (change) vs. amount of marketable product. This indicator is related to A1, but would require the determination of volume changes in deposited materials. Such an indicator points towards the ore-grade mined, the depths of the mine and the efficiency of the mining technique. When properly contextualised, this indicator allows comparisons between mines/mine types and the analysis of time series for a particular mine. B2 Erosion erosional losses on residues heaps. Erosion of residues heaps can lead to the dispersion of contaminants and the degradation of agricultural soils. B3 Total energy consumption per ton of coal / lignite /ore produced. This indicator gives an impression of the energy efficiency of the operation. It is related to Indicator B1. In addition to allow intercomparison between different (types of) mines and in a time series also allows to assess efficiency gains. B4 Energy Return on Energy Investment (EROI). EROI is a measure for assessing at policy-making level, whether a mining operation for fuel materials makes sense from an energy balance point of view. C C1 Soil quality Contaminant concentrations. One or more indicator that describes toxicological or radiological contamination relevant elements or compounds. In the case of radiological contamination, this could also be gamma-fields. C2 Soil fertility of remediated mine areas. Related to A3 and A4, but assessing the potential, rather than the actual vegetation. Also focusing on agricultural plants, rather than perennial plants. D D1 Air quality and other nuisances Aerosols particle concentration in off-site air. Aerosols, dust, in itself constitutes a nuisance or a health hazard, in particular if they contribute to high concentrations in in-house air, e.g. in worker dormitories. At the same time it can be an indicator of the quality of operational and residues management. 33
263 EO-MINERS collection of selected products APPENDIX continued APPENDIX 1 continue. D2 Volatiles emission of gases from waste deposits (composition and sources). Volatiles released can be a nuisance (odour) health hazard (e.g. carcinogenic) as well as a technical risk (e.g. if combustible). In addition, they can jeopardise recultivation, e.g. methane in the soil can suffocate plants. D3 Air-related health impacts incidence of health problems due to air-borne pollutants. Besides gaseous emissions (D2) particulate matter (partly from erosion, partly from production processes) can cause air-related health impacts; metals like Cr6 are of particular health relevance. Could become part of risk maps generated based on EO results. D4 Air-related soil degradation soil fertility loss due to particulates deposited. Besides gaseous emissions (D2) particulate matter (partly from erosion, partly from production processes) can lead to soil quality degradation. D5 D6 E E1 Noise from blasting and machinery - proximity and impact on settlements. Vibrations from blasting - proximity and impact on settlements, damage to houses and other risks. Water quality Hydrological balance relates the natural water balance to the use of the catchment area. Measurements of the amount of precipitation, evaporation, discharge and abstraction per catchment area, i.e. total water natural and anthropogenically induced flows in and out of the catchment area. E2 E3 E4 Process waters and contaminated surface run-off / storm water volumes of waters treated/untreated/directly discharged to surface-water courses. Aqueous contaminant releases contaminant concentrations in (surface) water bodies. Acid Drainage Generation Potential distribution of sulfidic minerals. Acid drainage from mines and residue heaps can have significant impacts on water courses. The distribution of sulfidic iron-minerals indicates the potential for acid drainage generation. E5 Seepage from engineered structures quantity and quality. Seepage, e.g. from tailings ponds, can be a vehicle for contaminant release and also an early indicator for problems with dam stability. Seepage can affect surface-water courses and ground waters. E6 Drinking/irrigation water availability quantity and quality. Amount of clean(able) drinking and irrigation water that can be supplied in a sustainable way. F F1 F2 Transport Road / rail freight volumes from/to operation sites frequency and type of traffic. Land fragmentation by transport infrastructure. Length of infrastructure, or (better) density [km/km 2 ], median and maximum size of not fragmented patches, and distance to next undisturbed site measure the dominant pressure an operation enacts on biodiversity and other aspects of the environment. 34
264 EO-MINERS collection of selected products APPENDIX continued APPENDIX 1 continue. F3 Local air, noise and accident impacts from transport. Impacts from transport outside the operational area (see also D) F4 Transport infrastructure quality. Heavy mine traffic may use public roads and add to their degradation without adequate compensation. F5 Accessibility due to mine-related transport infrastructure. Mining companies may build transport infrastructure that also can be used by the local population, thus improving access. G G1 Geotechnical hazards and accidents Grade of slopes steepness of engineered slopes vs. height. A too steep slope of residues heaps or dams can indicate potential geotechnical risks of failure. The indicator can be used for initial assessment and problem scoping, but will have to be related to the materials properties determined on the ground for a more detailed assessment. G2 Ground stability changes in the elevation of areas unaffected by residue disposal. Subsidence, pothole formation and other ground movement indicate inadequate underground mining techniques when exceeding certain rates of change. Sudden major losses of recultivation area indicate planning and/or management mistakes (not taking into account extreme events). G3 Dam stability water saturation in retaining dams. As was demonstrated recently in Hungary, failing retaining dams of tailings ponds can have a significant environmental impact and threaten life and property. Water saturation, leading to subrosion and piping can be an early indicator for impeding disaster. G4 Underground and mining waste deposit fires number, duration and area affected. Underground fires of coal seams or bituminous materials, and mining waste fires can be caused by natural processes or be the result of (mining) accidents. They mean loss of natural resources, but also CO 2 emissions and nuisance due to smoke. G5 Flooding risks area that may be exposed to flooding. Mapping of areas that could be under threat from flooding due to breaking retaining dams of tailings ponds etc. H H1 Industrial and other accidents Accidents in the mining / milling operation. Working days lost and other societal costs due to workplace accidents H2 Accidents in the operation environment (transport, construction etc.). Working days lost and other societal costs due to workplace accidents 35
265 EO-MINERS collection of selected products APPENDIX continued APPENDIX 1 continue. H3 Damages and accidents on neighbouring land due to ground instability. Related to G2, but focusing on the impacts. Cracked or collapsing buildings, water-collecting depressions that devalue agricultural land etc. can be caused by mining-induces ground instability. The damages and the compensation payments are relevant factors for determining the economic impact. I I1 Social impacts Number of jobs created. Qualification levels, median salary, working hours, gender balance I2 Job security (long term). Average duration of employment, share of local citizens in staff at different levels, share of workers retiring early, share of staff years I3 Contribution to regional income. Share of population, remuneration relative to business sector standards and to regional average I4 Education provided. In-house education and training for company specific skills / for general employability, education and training provided by whom (company, business associations, public authorities, etc.), for whom (income group, qualification level and sex of participants) I5 Health-care and welfare infrastructure provided by mining companies. In more remote areas mining companies often provide for infrastructure, even to non-mine staff. I6 Civil rights in mining companies. The right to organise, to freedom of speech (including on melperformance and cover-ups), and the means to secure such rights such as to an ombudsman or the like. I7 Civil society activism level. Existence of pressure groups, lobbies, activists and their level of public resonance and political influence on the local and regional level. J J1 Regional development Mandatory contributions. Taxes paid, share in local, regional and national tax income, including other mandatory payments/obligations, expenditures caused by mining operations (administrative procedures, monitoring, enforcement, etc.) J2 Voluntary contributions to the community. Donation of money and/or staff working hours to activities of public interest / for the common good, etc. on the local level 36
266 EO-MINERS collection of selected products APPENDIX continued APPENDIX 1 continue. J3 Infrastructure development. Housing, industrial premises, roads/railroads, sealed areas. Akin to A2 and F2, but assessing qualitative as well as quantitative changes. The number of houses and industrial premises and their state would indicate economic developments. J4 Existence and effectiveness of local/regional institutions for information management. Collecting and integrating monitoring information, comparing to benchmarks (best practice), making this information publicly accessible J5 Capabilities of local and regional authorities. For monitoring and compliance enforcement, including the capability to make use of EO-information, in particular remote sensing data K K1 Economic Vulnerability/Resilience Risk for the community. Share of income and employment dependent on the mining operation. K2 Corporate vulnerability. Dependency ratios (on the largest supplier, e.g. for key equipment parts, main customer, logistics partner, etc.). K3 Vulnerability management cost. Payment to insurance companies, liability regulations, management accountability regulations, or similar issues K4 Damage costs. Payments for violation of environmental, social, taxation or other legal provisions (polluter pays principle, speculator pays principle), compensation payments for health and other damages, cases of and fines paid and due for social, ethnic, gender or other discrimination. K5 Sustainability management plan. Sustainable development part of the core strategy with board level responsibility. Core strategy vs. sub-strategy vs. PR, voluntary code of conduct? Regular sustainability report? K6 Prevalence of corruption. Direct and indirect assessment of the levels of corruption around mining issues relevant to stakeholders, such as enforcement of rules and regulations pertaining to land-use planning or environmental impact assessment. Framework: The EO-MINERS project (Earth Observation for Monitoring and Observing Environmental and Societal Impacts of Mineral Resources Exploration and Exploitation) is running with financial support from the European Commission under the Seventh Framework Programme, FP7-ENV , Grant Agreement No
267


268
269
270 Material and information for the EO-MINERS workshop Indicators and Earth Observation Products for the Assessment of the Extractive Industry Environmental and Societal Impacts Material and information for the EO-MINERS workshop at the Makmal gold deposit demonstration site JUNE, 2013 EO-MINERS project 2013 The EO-MINERS project (Earth Observation for Monitoring and Observing Environmental and Societal Impacts of Mineral Resources Exploration and Exploitation) is executed with financial support from the European Commission under the Seventh Framework Programme, FP7-ENV , Grant Agreement No The publication reflects only the author's views and European Union is not liable for any use that may be made of the information contained. DOI: /eo-miners eng EO-MINERS eo-miners.eu
271 Material and information for the EO-MINERS workshop List of contributors (in alphabetical order) Surname Name Acronym Institution Country Abdybachaev Ulan CAIAG Central Asian Institute for Applied Geosciences Kyrgyzstan Blanchard Francois BRGM Bureau de Recherches Géologiques et Minières France Cheban Galina Kyrgyzaltyn Kyrgyzaltyn Open-End Joint Stock Company Kyrgyzstan Chevrel Stephane BRGM Bureau de Recherches Géologiques et Minières France Ehrler Christoph DLR Deutsches Zentrum für Luft- und Raumfahrt Germany Falck W. Eberhard UVSQ Université de Versailles Saint-Quentin-en-Yvelines France Fischer Christian DLR Deutsches Zentrum für Luft- und Raumfahrt Germany Grebby Stephen R. BGS British Geological Survey United Kingdom Hejny Horst MIRO The Mineral Industry Research Organisation United Kingdom Jordan Colm J. BGS British Geological Survey United Kingdom Kerr Grégoire DLR Deutsches Zentrum für Luft- und Raumfahrt Germany Kylychbaev Ernis CAIAG Central Asian Institute for Applied Geosciences Kyrgyzstan Mambetaliyev Elaman CAIAG Central Asian Institute for Applied Geosciences Kyrgyzstan Mardhel Vincent BRGM Bureau de Recherches Géologiques et Minières France McEvoy Fiona M. BGS British Geological Survey United Kingdom Rouzeau Olivier BRGM Bureau de Recherches Géologiques et Minières France Šajn Robert GeoZS Geological Survey of Slovenia Slovenia Šolar Slavko V. GeoZS Geological Survey of Slovenia Slovenia Teršič Tamara GeoZS Geological Survey of Slovenia Slovenia Wittmer Dominic WI Wuppertal Institute Germany Žibret Gorazd GeoZS Geological Survey of Slovenia Slovenia This work should be cited by using DOI, as: Teršič T, Abdybachaev U, Blanchard F, Cheban G, Ehrler C, Falck WE, Fischer C, Grebby SR, Hejny H, Jordan CJ, Kerr J, Kylychbaev E, Mambetaliyev E, Mardhel V, McEvoy FM, Rouzeau O, Šajn R, Šolar SV, Wittmer D, Žibret G, Chevrel S. Indicators and Earth Observation Products for the Assessment of the Extractive Industry Environmental and Societal Impacts - Material and information for the EO-MINERS workshop at the Makmal gold deposit demonstration site. EO-MINERS project, 2013, DOI: /eo-miners eng List of Abbreviations: ASTER DEM DOI EO-MINERS GDP GIS NGO SRTM TM Advanced Spaceborne Thermal Emission and Reflection Radiometer - high resolution imaging instrument Digital Elevation Model a model of the terrain, which can be used to generate realistic 3D images Digital Object Identifier - an international standard for document identification acronym for this project, co-funded by EC commission Gross Domestic Product Geographical Information System a kind of database which allows the storage and analysis of geographical data Non-Governmental Organisation Shuttle Radar Topography Mission Thematic Mapper multispectral observation equipment for the Earth's surface
272 Material and information for the EO-MINERS workshop Table of contents Contents 1. EO-MINERS project introduction Aim of the workshop Indicators of mining impacts Site-specific indicators for the Makmal Gold Mine EO-MINERS Products...11 Appendix 1. Consolidated Set of Candidate Indicators for the EO-MINERS Project
273 Material and information for the EO-MINERS workshop Project summary and methods 1. EO-MINERS project introduction The mining industry plays a key role in the development of many countries around the world and continues to be an important contributor to both regional and national economies. Minerals, and the industries they support, are among the basic building blocks of modern society. While in many countries the provision of mineral resources is a vital part of economic growth, employment and infrastructure development, it can come at a cost to the environment and negatively impact local communities. Past operations have left a historical legacy of environmental and/or societal impacts that affect our perception of mining. With the emergence of the concept of sustainable development it is now recognised that environmental protection and societal protection is as fundamental to a healthy economy and society as is economic growth. However, the need to simultaneously promote development in these three areas in a balanced way is challenging. The aim of the EO-MINERS project is to develop methods and tools that help to facilitate and improve interaction between the mining industry and society through the use of Earth Observation (EO) based methods and tools. These methods and tools (using satellite and airborne sensors as well as measurements on site) collect data relevant to a particular area that can be used to objectively assess potential mining-related environmental and socioeconomic impacts over the whole life-time of a mine, from exploration to final closure. The resulting EO products will help to make decision-making processes more transparent. They will support discussion between the mining industry, the regulating authorities and other stakeholders concerned, such as local communities and non-governmental organisations (NGO). Importantly, they empower the public by providing complex geo-information in a way (such as interactive maps) that is understandable to stakeholders with diverse expertise and differing levels of background knowledge. This is achieved by integrating different processed data sets into single EO products. The goal of the EO-MINERS research project is to use EO tools to help identify miningrelated environmental and societal footprints. This, in turn will contribute to their reduction and improve the societal acceptability of mining projects and related activities. In order to achieve this goal, the data collected have to be objective and accurate. Data collected using remotely sensed methods, integrated with in situ information, fulfil these criteria. The objectives of EO-MINERS are threefold: (1) To assess what information is needed to empower stakeholders from global to local levels on activities relating to the mining industry (from exploration to mine closure and remediation). These needs are then cast into a set of indicators 1, which highlight environmental and societal issues of concern to stakeholders. 1 The term indicator is explained in chapter 3. 2
274 Material and information for the EO-MINERS workshop Project summary and methods (2) To develop EO products in support of the indicators. These will include existing EO methods along with others that were newly developed within EO-MINERS, supported by visualisation methods. (3) To develop strategies and methods to facilitate an open dialogue between the different groups of stakeholders based on objective and accurate information on issues of concern. This approach is demonstrated at three mining areas: In Central Asia: the Makmal gold mine, Kyrgyzstan In Southern Africa: the emalahleni Coalfields, Mpumalanga Province, South Africa In Europe: the Sokolov lignite open cast mines, Czech Republic The results referred to in the following chapters are derived from the EO-MINERS project (). A handbook of best practice for both the application of EO techniques, as well as the effective support for interaction between the different groups of stakeholders, will be a key outcome of the project. 3
275 Material and information for the EO-MINERS workshop Project summary and methods 2. Aim of the workshop This booklet presents site-specific results to date and proposed approaches with a view to gathering comments on the usefulness of EO products from you as a stakeholder. The booklet serves as preparatory information for the workshops in Kazarman and Bishkek on the 19 th /20 th and the 24 th June 2013, respectively, where diverse stakeholders are invited to contribute to discussions. Presenting the EO products developed for the Makmal gold mine, and receiving feedback on their applicability and potential usefulness is a critical step in the EO product development. Our dialogue with stakeholders, facilitated further within this workshop, will help to assess the usefulness of EO when discussing mining-related concerns. The prioritisation of the EO products developed for the Makmal gold mine are related to the findings from interviews with stakeholders in the Makmal area in April 2012, and on subsequent analyses of what information is of most relevance for you. It must be noted at this point that scientific EO data within the scope of EO-MINERS project was collected and is presented only in the area around Makmal gold processing plant next to the town of Kazarman, and around tailing dam nearby. No EO data was acquired around Makmal gold mine, located around 25 km south from Makmal ore processing plant. Thus, all presented EO-products express the situation around the area of ore processing plant (Makmal gold processing Combinate - Макмальский золотодобывающий комбинат). The purpose of this workshop is to explain the EO products we have developed and to invite feedback from you, with respect to your main concerns, on the: 1. Appropriateness of the selection of indicators and supporting EO products 2. Perceived quality of the EO products 3. Perceived applicability of the EO products. In the following chapter, a short introduction is given on how the concept of indicators helped to prioritise EO products for Makmal mining site and the other mining sites. Then, the results are presented in detail, i.e. the products are presented in light of the issues prioritised (indicators). 4
276 Material and information for the EO-MINERS workshop Project summary and methods 3. Indicators of mining impacts The impact of mining operations on the physical and socio-economic environment can be complex. The effects of decisions made by the mine owners and operators, regulatory authorities, or civil society stakeholders are difficult to assess and predict. In some cases, the impacts only become apparent over a long time-scale (up to decades). Absence of objective and accurate site data can further complicate monitoring and assessment, and thus also delay any actions required. This can result in the lack of social acceptance of local and/or regional mining activities. Meaningful information on complex environmental or social issues can often be more easily understood and discussed when provided in the form of indicators. Common economic indicators are Gross Domestic Product (GDP), or the Unemployment Rate of countries. In terms of environmental or societal issues, diverse environmental or societal indicators exist. An example of an environmental indicator is counting the population of a rare species of animals, which are sensitive with respect to environmental pollution, in order to estimate the health of the environment within a particular area. For more background information on indicators, see the text box below. What are indicators? Indicators offer a metric of the state of complex systems or of issues, or for trends of their development, when measurements or observations are repeated over time. An example of a commonly accepted economic indicator is the inflation in a given country. It is generally considered a lagging indicator, this means it usually changes after the economy as a whole has changed (after a lag of time). The inflation reflects the (national) decrease in the purchasing power of money (price inflation). As the price level can be measured in a multitude of ways, also the inflation can be measured by many different measures. Usually it is measured by calculating the change of a price index, e.g. the consumer price index, that themselves require lots of background data and are consolidated into a single value. This value can be followed from year to year and also allows comparisons between different countries, thus indicating change and relative performance. Indicators must be based on measurable quantities or at least observable and distinguishable qualities in order to be useful. While indicators are useful tools to reduce a complex set of diverse data, it should be kept in mind that every process of indicator selection or aggregation inevitably includes both, a gain in clarity, but also a loss of information. Indicators need to have a number of specific qualities and properties in order to be useful, and they must have a clearly defined purpose. 5

277 Material and information for the EO-MINERS workshop Project summary and methods A multi-pronged approach to developing indicators was used (Figure 1). The approach consisted of: the development of an initial set of indicators by technical experts; the development of site-specific conceptual models; and interviews at the sites with stakeholders. Figure 1: Multiple strategy to develop indicators. These three processes ran in parallel. The process went through several loops of iterations, resulting in a set of candidate indicators that are applicable generally, and thus to each of the study sites. The development of meaningful indicators is mostly a social process and not an engineering process. This social process defines what indicators need to be developed, for whom and what purpose. Within EO-MINERS the specialists were in charge of evaluating whether or not a proposed indicator could be related to quantities measurable by EO. For this reason, the proposed set of indicators was reviewed in order to assess their measurability using EO techniques. For practical reasons, indicators currently immeasurable were disregarded (cf. Figure 2). To that effect the development of indicators is an iterative process balancing stakeholder expectations and operational feasibility. 6
 of the candidate indicator set A candidate set of 59 indicators covering eleven thematic areas has been developed in the frame of the project, namely on A. Land-use B.")
278 Material and information for the EO-MINERS workshop Project summary and methods Figure 2: Relationship between different sets of indicators as defined by the EO-MINERS project (set theory representation) of the candidate indicator set A candidate set of 59 indicators covering eleven thematic areas has been developed in the frame of the project, namely on A. Land-use B. Mass and energy flows C. Air quality and other nuisances D. Soil quality E. Water quality F. Transport G. Geotechnical hazards and accidents H. Industrial and other accidents I. Social impact J. Regional development K. Economic vulnerability/resilience The set of candidate indicators can be found in the appendix. 7
279 Material and information for the EO-MINERS workshop Project summary and methods 4. Site-specific indicators for the Makmal Gold Mine Selected stakeholders of the Makmal mining area were interviewed by EO-MINERS project researchers in April Notes were taken during these interviews. The views or concerns expressed and information needs related were compared with the set of candidate indicators, i.e. the comprehensive list of 59 indicators that are not site-specific (Appendix 1). This allowed the team to prioritise the indicators that reflect best those views, concerns, and needs of the stakeholders met at the Makmal area. The stakeholders were grouped into three broad groups of likely diverging views and interests mine operators, regulators/government agencies and civil society stakeholders. Within the three groups, a further division was made into those likely to have previous knowledge of EO tools, methods and objectives (based on assumptions), and those that are less likely to have such knowledge. An analysis of the interests and concerns of each group was undertaken. The field of interest of those stakeholders with and without previous knowledge of EO was very similar, although with somewhat different emphasis (Figure 3). Impacts due to aqueous releases and dust or gaseous releases being generated, and the health-impacts related to them, figure clearly high on the agendas of most stakeholders. A comparison of mine operators, government agencies and civil society stakeholders shows that all are similarly concerned about these above-mentioned impacts (Figure 4). Overall the data show a clear public concern not only over environmental, but also societal impacts, which may be given less weight by the mine operators, who are more concerned by indicators relevant to output performance. For the purpose of directing the development of EO products, a subset of indicators was selected from the candidate set of indicators. This subset of indicators, for which EO products were developed, is shown in Table 1. Having outlined some of the principal findings from the interviews with stakeholders in the Makmal region, the workshop participants are invited to reflect upon the findings and to comment on the scope and coverage of the Makmal subset of indicators (for further details on the scope of the indicators, see Appendix 1): Do the proposed indicators reflect your information needs? 8
280 Material and information for the EO-MINERS workshop Project summary and methods Figure 3: Comparison of frequency between issues mentioned for stakeholders with previous EO knowledge (red) and without EO knowledge (blue). Classification based on assumptions. 9
281 Material and information for the EO-MINERS workshop Project summary and methods Figure 4: Comparison of frequency between issues mentioned for mining operators (red), government agencies (green) and civil society stakeholders (blue). 10
282 Material and information for the EO-MINERS workshop Makmal demonstration site EO-MINERS outputs 5. EO-MINERS Products This chapter provides a selection of the outputs that were developed using Earth Observation techniques within the EO-MINERS project, and that aim to address the prioritised indicators (cf. Table 1). A selection of the most representative examples from the large amount of data are presented that was collected during the project. Moreover, as the project is still ongoing, the outputs shall be regarded as preliminary and can be subject to change. Nevertheless, their presentation in this booklet aims to prepare discussions at the workshop. At a later stage, the final products will be placed on the EO-MINERS website ( The EO products presented in this chapter and discussed in the workshop are listed in Table 1. The products will be described and explained in the workshop, and the functionality of the digital counterparts e.g. the PDF files, will be illustrated. While the images in this booklet are static, their digital counterparts enable greater interaction with the data, so that, for example, various layers of information can be turned on/off to see how they relate to each other; while useful functionality is also available such as the ability to measure distances and areas. The PDF files will be available for download from the EO-MINERS website. Additional digital outputs include three dimensional (3D) visualisations which can be displayed in full resolution in programs such as GeoVisionary (TM) and in lower resolution in GoogleEarth (TM). Presented EO-products have been made only for the Makmal gold processing plant area (Combinate) next to the town of Kazarman. No scientific data was acquired within the scope of this project for the Makmal gold mine. 11
283 Material and information for the EO-MINERS workshop Makmal demonstration site EO-MINERS outputs We ask you for your general feedback on the Earth Observation products presented on the following pages. More specifically, we would be pleased to receive your opinion on the following questions: with regard to comprehension: Do the EO products present the mapped information in a clear and understandable way? Which EO products are (most) useful and interesting for you (your top three )? Which EO products tell you something new? Would you consider using one or more of the EO products presented? with regard to their technical implementation: Do the EO products support the concerns you initially raised (i.e. do they support the indicators - cf. Table 1)? Are there any concerns with regard to the parameters (i.e. Chromium etc.) that were selected to provide information about your concerns? Should or could we have used different parameters? Is the detail (i.e. spatial resolution) of the EO products sufficient to satisfy your needs? Otherwise, what level of detail would be more appropriate? For one of the EO products, could you suggest a different way of showing the information/data that would be more useful or understandable? We would like to discuss with you not only the usefulness of the individual EO products for your purposes, but also what appears to be the added value of EO products over alternative options for obtaining relevant information. Would you estimate that the use of EO products provides information relevant for your decisions (a) that otherwise would not at all be available or (b) that has already been measured or could be measured, but with higher efforts (time, money)? 12
284 Material and information for the EO-MINERS workshop Makmal demonstration site EO-MINERS outputs Table 1: EO-MINERS products and related indicators for the Makmal gold combinate area. All products were compiled by BGS; primary contact is Colm Jordan Product Title Related Indicator Primary contact 1 Change of the mining footprint through time Land Use: A1 Total land use by mining and milling Colm Jordan (BGS) cjj@bgs.ac.uk 2 Air and surface water contamination potential Water Quality: E2 Process waters and contaminated surface run-off / storm water Gorazd Žibret (GeoZS) gorazd.zibret@geo-zs.si 3 Soil and surface water contamination potential Water Quality: E2 Process waters and contaminated surface run-off / storm water Ulan Abdybachaev (CAIAG) u.abdybachaev@caiag.kg 4 Cyanide concentration in water bodies Water Quality: E3 aqueous contaminant releases, contaminant concentrations in (surface) water bodies Water Quality: E5 Seepage from engineered structures (quantity and quality) Ulan Abdybachaev (CAIAG) u.abdybachaev@caiag.kg 5 Tailings dam stability Geotechnical hazards and accidents: G3 Dam stability (water saturation in retaining dams) Stephane Chevrel (BRGM) s.chevrel@brgm.fr 6 Radioactivity Radioactive contamination Stephane Chevrel (BRGM) s.chevrel@brgm.fr Gorazd Žibret (GeoZS) gorazd.zibret@geo-zs.si 7 Cadastral information Cadastral collection of data for Makmal gold combinate area Stephen Grebby (BGS) stgrebby@bgs.ac.uk 13

285 CHANGE OF THE MINING FOOTPRINT THROUGH TIME - KAZARMAN - KYRGYZSTAN km ± Coordinate System: Projected Geographic Projection: Datum: UTM Zone 43N WGS84 Geographic (DMS) WGS84 14
286 Legend: Interpretation: Town Road River or stream Kombinat Kazakhstan Tailings dam plant This product demonstrates how freely available satellite imagery can be used to monitor changes in the amount of land used by mining activity (i.e. the footprint) through time. It shows how the tailings dam has changed between 1996 and Although the area occupied by the tailings has appeared to change relatively little over this period, the volume is likely to have increased somewhat. The satellite images also show that the size of the tailings pond varied quite considerably during this period. Bishkek Talas Kyrgyzstan Naryn Karakol The ability to monitor the changes in the land used by mining activity is demonstrated here using Landsat TM satellite imagery, which has been processed by experts to highlight the area of the tailings dam. Uzbekistan Osh This product relates to indicator A1 Total land used by mining and milling. China Tajikistan Framework: The EO-MINERS project (Earth Observation for Monitoring and Observing Environmental and Societal Impacts of Mineral Resources Exploration and Exploitation) is running with financial support from the European Commission under the Seventh Framework Programme, FP7-ENV , Grant Agreement No Whilst this product is realised to the best of our ability using the available resources, the producers are not liable for its content or consequences arising from its use. For more information regarding this product and the EO-MINERS project please visit. EO-MINERS project 2013 Figure 5: Change of the mining footprint through time (Indicator A1). 15

287 AIR AND SURFACE WATER CONTAMINATION POTENTIAL - KAZARMAN - KYRGYZSTAN km ± Coordinate System: Projected Geographic Projection: Datum: UTM Zone 43N WGS84 Geographic (DMS) WGS84 16
288 Legend: Town Kombinat Road Tajikistan River or stream Drainage channel Tailings dam plant Talas Uzbekistan Kyrgyzstan Osh Bishkek 0 2. / Kazakhstan Naryn Topsoil sample location Tailings dam sample location Alluvial sediment sample location House dust sample location China Karakol Interpretation: This product assesses the potential impact of mining-related contamination on air and water quality in the Kazarman region. It shows the content of two metals (gold and arsenic) in relation to surface water and where it may flow. Mining activity in this region comprises the processing of gold ore at the Kombinat plant. During ore processing, dust is first released into the atmosphere before being deposited at ground level, and then subsequently remobilised by wind or rain water, for example. Dust containing high levels of toxic metals can pose a health risk if ingested or inhaled. By measuring the content of elements typically associated with gold ore (e.g. gold and arsenic) in soil and dust, we are able to determine the extent and severity of potential air and water contamination caused by the mining activity. Therefore, the gold and arsenic content was measured in 47 samples of topsoil, alluvial deposits, mine tailings and house dust collected in the region. As can be seen in both maps, the area most affected by dust emitted during ore processing is that within 2 km of Kombinat plant and tailings. In most cases, less than harmful amounts of toxic arsenic were observed close to drainage channels, meaning that there is generally a low risk of water contamination. However, potentially harmful amounts of arsenic were measured in the tailings, meaning that flooding or failure of the dam could potentially transfer this material downstream and contaminate the river. The chemical composition of the dust and soil samples was measured using the aqua regia digestion method applied to particles less than mm. Drainage channels were mapped using a 1-m Digital Elevation Model derived from WorldView-II satellite imagery. This product relates to indicator E2 Process waters and contaminated surface run-off/stormwater. Framework: The EO-MINERS project (Earth Observation for Monitoring and Observing Environmental and Societal Impacts of Mineral Resources Exploration and Exploitation) is running with financial support from the European Commission under the Seventh Framework Programme, FP7-ENV , Grant Agreement No Whilst this product is realised to the best of our ability using the available resources, the producers are not liable for its content or consequences arising from its use. For more information regarding this product and the EO-MINERS project please visit. EO-MINERS project 2013 Figure 6: Air and surface water contamination potential (Indicator E2). 17


289 SOIL AND SURFACE WATER CONTAMINATION POTENTIAL - KAZARMAN - KYRGYZSTAN km ± Coordinate System: Projected Geographic Projection: Datum: UTM Zone 43N WGS84 Geographic (DMS) WGS84 18
290 Legend: Town Kombinat Road River or stream Tailings dam plant Cyanide content in soil (mg/kg) \ \ Talas Uzbekistan Kyrgyzstan Osh Kazakhstan Bishkek! Spring locations Drainage channel Land-use and land cover Reed bed Cheegrass pasture Pasture Ploughed field Settlement Stony ground Unused pasture Waste land Naryn Karakol Interpretation: This product assesses the potential impact of mining-related contamination on soil and water quality in the Kazarman region. It shows the soil content of cyanide in relation to surface water and where it may flow. Mining activity in this region comprises the processing of gold ore at the Kombinat plant. During processing, compounds containing cyanide (i.e. sodium cyanide) are used to extract gold from the ore through a process known as heap leaching. Cyanide is highly toxic and, if released into the environment, can be harmful or even lethal to humans and animals if ingested or inhaled at sufficiently high doses. Recognised guidelines suggest that more than 1.0 mg/kg of cyanide in soil could be harmful to the environment and possibly humans. By measuring the content of cyanide in soil, we are able to determine the extent and severity of potential soil and water contamination caused by the mining activity. This product shows that the cyanide content of all samples collected in the Kazarman region is much less than the guideline amounts for potentially causing harm to the environment and humans. It therefore suggests that none of the land-use/land cover types are affected by cyanide contamination. Although the map indicates the presence of cyanide close to drainage channels and springs (activity unknown), the low cyanide content means that there is likely to be a low risk of surface water contamination. Cyanide content was measured in samples collected from the top 5-10 cm of soil. Drainage channels were mapped using a 1-m Digital Elevation Model derived from WorldView-II satellite imagery. This product relates to indicator E2 Process waters and contaminated surface run-off/stormwater. Framework: Tajikistan China The EO-MINERS project (Earth Observation for Monitoring and Observing Environmental and Societal Impacts of Mineral Resources Exploration and Exploitation) is running with financial support from the European Commission under the Seventh Framework Programme, FP7-ENV , Grant Agreement No Whilst this product is realised to the best of our ability using the available resources, the producers are not liable for its content or consequences arising from its use. For more information regarding this product and the EO-MINERS project please visit. EO-MINERS project 2013 Figure 7: Soil and surface water contamination potential (Indicator E2). 19

291 CYANIDE CONCENTRATION IN WATER BODIES - KAZARMAN - KYRGYZSTAN km ± Coordinate System: Projected Geographic Projection: Datum: UTM Zone 43N WGS84 Geographic (DMS) WGS84 20
292 Legend: Town Road River or stream Tailings dam # Cyanide concentration in water (mg/l) October # #! Spring locations Drainage channel Kombinat plant April Kazakhstan Bishkek Karakol Talas Kyrgyzstan Uzbekistan Osh Naryn Interpretation: This product assesses the potential impact of contaminants on water quality. It shows the cyanide concentration in water samples from the Kazarman region, in October 2012 and April Mining activity in this region comprises the processing of gold ore at the Kombinat plant. During processing, compounds containing cyanide (i.e. sodium cyanide) are used to extract gold from the ore through a process known as heap leaching. Cyanide is highly toxic and, if released into the environment, can be harmful or even lethal to humans and animals if ingested or inhaled at sufficiently high doses. Recognised guidelines suggest that more than 0.1 mg/l of cyanide in water could be harmful to aquatic life and possibly humans. By measuring the concentration of cyanide in streams, springs and other water bodies it is possible to determine the extent and severity of potential water contamination caused by the mining activity. The map shows that, at the time of sampling, water contamination due to cyanide is not a concern, since the concentration in all water samples is much less than the guideline level for potentially causing harm to aquatic life and humans. As anticipated, the highest cyanide concentration was found in the tailings dam pond (0.046 mg/l in October 2012). However, stream samples taken directly downstream of the dam during the same time period have much lower cyanide concentrations, suggesting that the dam is effectively retaining the material in the tailings. Moreover, measurements taken downstream of the dam in April 2013 also indicate that less than harmful concentrations of cyanide were present. Repeat measurements of the cyanide concentration in water at regular time intervals provides a useful way of monitoring seepage from the dam and potential water contamination. This product relates to indicator E3 Aqueous contaminant releases, contaminant concentrations in water bodies and E5 Seepage from engineered structures. Tajikistan China Framework: The EO-MINERS project (Earth Observation for Monitoring and Observing Environmental and Societal Impacts of Mineral Resources Exploration and Exploitation) is running with financial support from the European Commission under the Seventh Framework Programme, FP7-ENV , Grant Agreement No Whilst this product is realised to the best of our ability using the available resources, the producers are not liable for its content or consequences arising from its use. For more information regarding this product and the EO-MINERS project please visit. EO-MINERS project 2013 Figure 8: Cyanide concentration in water bodies (Indicators E3 and E5). 21

293 TAILINGS DAM STABILITY - KAZARMAN - KYRGYZSTAN km ± Coordinate System: Projected Geographic Projection: Datum: UTM Zone 43N WGS84 Geographic (DMS) WGS84 22
294 Legend: Town Kombinat Road River or stream Drainage channel Tailings dam plant Potential drainage contamination pathway Maximum possible extent of 5-m thick mud flow Kazakhstan Landslide risk Low Moderate Seismic risk Moderate High Interpretation: This product shows the potential impact of geohazards on the tailings dam stability, and the possible consequences should the dam stability be compromised. It suggests that there is a moderate risk of the tailings dam stability being affected by seismic activity and landslides. Should the stability be affected and material leak from the dam, the potential downstream surface drainage contamination pathway suggests that it should not affect the town of Kazarman, but may however contaminate the Naryn River. In the event of a complete failure of the tailings dam, subsequent mud flows could represent a major threat to the Kazarman region. In order to determine the potential impact of such an event, the maximum possible downstream extension of a 5-m thick mud flow was modelled. According to this model, potentially only the most western part of the Kazarman urban area might be affected by the mud flow. However, it is also likely that the western part of the Naryn river floodplain could be affected by the flow, potentially leading to grassland contamination. The mud flow model was computed by assuming a constant mud thickness of 5 m. The actual thickness should decrease with distance from the source, depending on the viscosity of the mud. This product relates to indicator G3 Dam stability (water saturation in retaining dams). Tajikistan Uzbekistan Bishkek Talas Kyrgyzstan Osh Naryn China Karakol Framework: The EO-MINERS project (Earth Observation for Monitoring and Observing Environmental and Societal Impacts of Mineral Resources Exploration and Exploitation) is running with financial support from the European Commission under the Seventh Framework Programme, FP7-ENV , Grant Agreement No Whilst this product is realised to the best of our ability using the available resources, the producers are not liable for its content or consequences arising from its use. For more information regarding this product and the EO-MINERS project please visit. EO-MINERS project 2013 Figure 9: Tailings dam stability (Indicator G3). 23

295 RADIOACTIVITY - KAZARMAN - KYRGYZSTAN km ± Coordinate System: Projected Geographic Projection: Datum: UTM Zone 43N WGS84 Geographic (DMS) WGS84 24
296 Legend: Town Kombinat 0 2. / Road River or stream Tailings dam plant Radioactivity measurement Topsoil sample location Tailings dam sample location Alluvial sediment sample location House dust sample location Thorium (Th) content (mg/kg) #0 < 6.0 %2 / %2 %2 Radioactivity (counts/second) < 50!. /!. /! > 85 # #0 > 8.0 Interpretation: This product shows radioactivity levels measured in the Kazarman region in Radioactivity was mapped using a combination of Geiger-counter measurements and the content of the radioactive element thorium (Th) in dust and soil samples collected in this region. Although there are other radioactive elements, thorium was chosen because it is an abundant, naturallyoccurring, long-lived element, and is therefore ideal for a general representation of radioactivity. It shows low levels of radioactivity around the Kombinat processing plant and nearby mine tailings. Higher levels of radioactivity were observed in southern and north-eastern areas, which is due to the natural radioactivity associated with the type of rocks (i.e. granites) found at these locations. Therefore, the measured radioactivity in the Kazarman region is naturally occurring and at low levels that are unlikely to be harmful. Although this product does not directly relate to one of the indicators, it could provide supporting information for Water Quality indicator E3 (aqueous contaminant releases and contaminant concentrations in surface water bodies). Kazakhstan Framework: Uzbekistan Bishkek Talas Kyrgyzstan Osh Naryn Karakol The EO-MINERS project (Earth Observation for Monitoring and Observing Environmental and Societal Impacts of Mineral Resources Exploration and Exploitation) is running with financial support from the European Commission under the Seventh Framework Programme, FP7-ENV , Grant Agreement No Whilst this product is realised to the best of our ability using the available resources, the producers are not liable for its content or consequences arising from its use. For more information regarding this product and the EO-MINERS project please visit. China EO-MINERS project 2013 Tajikistan Figure 10: Radioactivity. 25

297 CADASTRAL INFORMATION - KAZARMAN - KYRGYZSTAN 26
EO-MINERS. The EO-MINERS project A general overview. EO-MINERS Final Conference Versailles, October 11-12, 2013
 EO-MINERS The EO-MINERS project A general overview EO-MINERS Final Conference Versailles, October 11-12, 2013 Stéphane CHEVREL Project Coordinator s.chevrel@brgm.fr The EO-MINERS project EO-MINERS is a
EO-MINERS. Earth Observation for Monitoring and Observing Environmental and Societal Impacts of Mineral Resources Exploration and Exploitation
 EO-MINERS Earth Observation for Monitoring and Observing Environmental and Societal Impacts of Mineral Resources Exploration and Exploitation Stéphane CHEVREL Project Coordinator BRGM, France Mineral Resources
creating a unity for the future
 EO-MINERS Earth Observation for Monitoring and Observing Environmental and Societal Impacts of Mineral Resources Exploration and Exploitation Minerals and Society European Stakeholder Dialogue on Impact
Impact assessment of human activities, the EO-MINERS showcase. EO contribution in monitoring environmental and societal impact of mining Activities
 Impact assessment of human activities, the EO-MINERS showcase EO contribution in monitoring environmental and societal impact of mining Activities Stephane CHEVREL General context Securing EC raw material
EO-MINERS. Selected EO-MINERS Products; Integrated EObased tools and methods for environmental and societal impact assessment of mining activities
 EO-MINERS Selected EO-MINERS Products; Integrated EObased tools and methods for environmental and societal impact assessment of mining activities Colm Jordan, BGS cjj@bgs.ac.uk European Stakeholder Dialogue
Stakeholder-Driven Enablement Through Earth-Observation Information The project EO-MINERS
 Stakeholder-Driven Enablement Through Earth-Observation Information The project EO-MINERS W. Eberhard Falck Laboratoire REEDS, Université de Versailles St. Quentin-en-Yvelines (UVSQ), France Francois Blanchard
EO-MINERS. From Indicators to EO-based Integrated Products. Colm Jordan & Stephen Grebby, British Geological Survey
 EO-MINERS From Indicators to EO-based Integrated Products Colm Jordan & Stephen Grebby, British Geological Survey cjj@bgs.ac.uk EO-MINERS Final Conference Versailles, 10 th October 2013 Outline EO Product
Key elements of the GMES EC Draft Action Plan Initial Period
 Brussels, 27/07/2001 Key elements of the GMES EC Draft Action Plan Initial Period 2001-2003 For information: Michel.Cornaert@cec.eu.int Hugo.De_Groof@cec.eu.int Neil.Hubbard@jrc.it Errol.Levy@cec.eu.int
Impact Monitoring of Mineral Resources Exploitation FP7
 Impact Monitoring of Mineral Resources Exploitation FP7 ProMine Final Conference Levi Finland, 24.04.2013. ImpactMin Admin (C. No. 244166) Impact Monitoring of Mineral Resources Exploitation Budget: 2,6
MOVING FROM GLOBAL INFORMATION TO LOCAL DECISION MAKING: AN EXAMPLE FROM WISCONSIN RICK LAWFORD AND STEVE GREB WORLD WATER FORUM IV MARCH 21, 2006
 MOVING FROM GLOBAL INFORMATION TO LOCAL DECISION MAKING: AN EXAMPLE FROM WISCONSIN RICK LAWFORD AND STEVE GREB WORLD WATER FORUM IV MARCH 21, 2006 A VISION THAT MOTIVATES COLLABORATION: IMPLEMENTING A
European Forest Fire Information System (EFFIS) - Rapid Damage Assessment: Appraisal of burnt area maps with MODIS data
 - Rapid Damage Assessment: Appraisal of burnt area maps with MODIS data") European Forest Fire Information System (EFFIS) - Rapid Damage Assessment: Appraisal of burnt area maps with MODIS data Paulo Barbosa European Commission, Joint Research Centre, Institute for Environment
European Forest Fire Information System (EFFIS) - Rapid Damage Assessment: Appraisal of burnt area maps with MODIS data Paulo Barbosa European Commission, Joint Research Centre, Institute for Environment
(ACLEP) 2008 / Final report
 2008 / Final report") Australian Collaborative Insert partner logos in Land this area Evaluation Program (ACLEP) 2008 / 2009 - Final report Peter Wilson - Manager, National Soil Information CSIRO Land and Water Project Report
Australian Collaborative Insert partner logos in Land this area Evaluation Program (ACLEP) 2008 / 2009 - Final report Peter Wilson - Manager, National Soil Information CSIRO Land and Water Project Report
One year into the EU s Raw Materials Initiative: An update from the industrial perspective
 One year into the EU s Raw Materials Initiative: An update from the industrial perspective Fennoscandian Exploration and Mining FEM 2009 1 3 December 2009 Rovaniemi, Finland Dr. Corina Hebestreit Euromines
Research on future mining
 Research on future mining EUROPEAN UNION This Project is funded by the EU www.biomore.info A project for accessing deep deposits The BIOMOre project aims at extracting metal ore from underground mineralised
THE GEO COMMUNITY ACTIVITY "EARTH OBSERVATIONS FOR MANAGING MINERAL AND NON-RENEWABLE ENERGY RESOURCES": HISTORY, PRESENT AND FUTURE ACTIVITIES
 THE EO COMMUNITY ACTIVITY "EARTH OBERVATION FOR MANAIN MINERAL AN NON-RENEWABLE ENERY REOURCE": HITORY, PREENT AN FUTURE ACTIVITIE téphane Chevrel, MinPol, Austria, PoC CA-06 and Michael Abrams, JPL, UA
Fusion of lidar, hyperspectral and thermal data a Southern African experience
 Fusion of lidar, hyperspectral and thermal data a Southern African experience by Alex Fortescue, Southern Mapping Company Abstract This paper describes three operational airborne remote sensing techniques,
Terms of Reference MONITORING THE IMPACT OF GOLD MINING ON THE FOREST COVER AND FRESHWATER AT THE GUIANA SHIELD REGIONAL SCALE
 Terms of Reference MONITORING THE IMPACT OF GOLD MINING ON THE FOREST COVER AND FRESHWATER AT THE GUIANA SHIELD REGIONAL SCALE REDD+ for the Guiana Shield Regional technical collaboration project in cooperation
EO Mission Planning for Environmental Monitoring of Mining Impact
 Earth Observation for Monitoring and Observing Environmental and Societal Impacts of Mineral Resources Exploration and Exploitation Project no: 244242, call 2009, Theme 6, Topic ENV.2009.4.1.3.2 EO Mission
CRYOLAND Copernicus Snow and Land Ice Service. SUMMARY OF ACHIEVEMENTS IN 1st, 2nd, 3rd and 4th PERIOD
 CRYOLAND Copernicus Snow and Land Ice Service SUMMARY OF ACHIEVEMENTS IN 1st, 2nd, 3rd and 4th PERIOD Author: Thomas Nagler / ENVEO, Project Coordinator USER REQUIREMENTS AND USER SUPPORT, PRODUCT AND
Role and importance of Satellite data in the implementation of the COMIFAC Convergence Plan
 Plenary Meeting of the Congo Basin Forest Partnership (CBFP) Palais des Congrès, Yaoundé. Cameroon 11-12 November, 2009 Role and importance of Satellite data in the implementation of the COMIFAC Convergence
Coordinated European Animal Welfare Network (EUWelNet)
") Coordinated European Animal Welfare Network (EUWelNet) Executive summary Title Executive summary of the project Coordinated European Animal Welfare Network (EUWelNet) Authors Isabelle Veissier, Inra Marek
Coordinated European Animal Welfare Network (EUWelNet) Executive summary Title Executive summary of the project Coordinated European Animal Welfare Network (EUWelNet) Authors Isabelle Veissier, Inra Marek
EO-MINERS products in the context of the national and EU regulatory framework related to raw materials Brussels workshop, September 18th, 2013
 EO-MINERS products in the context of the national and EU regulatory framework related to raw materials Brussels workshop, September 18th, 2013 Patrice Christmann Deputy Director Strategy Directorate Direction
Europroms User Guide. Public document. Europroms. PRODCOM Data
 Europroms PRODCOM Data Brian Williams 1/18 latest version: 06.02.2008 Table of contents 1. Summary of the PRODCOM regulation... 3 1.1 Introduction... 3 1.2 What data are to be collected?... 3 1.3 Which
Date: Author: Doc Title. 20/08/14 Jimmy Slaughter Copernicus Services. Copernicus Services
 Date: Author: Doc Title 20/08/14 Jimmy Slaughter Copernicus Services Copernicus Services Table of Contents Introduction... 3 What Will Copernicus Do?... 3 2.1 Land Monitoring... 3 2.2 Marine Monitoring...
Challenges and trends of the metal mining industry in Europe. Corina Hebestreit
 Challenges and trends of the metal mining industry in Europe Corina Hebestreit 1 Membership: EU 28 Austria Bulgaria Czech Rep. Finland France Germany Greece Ireland Netherlands Poland Romania Slovakia
Overview of Fire Related Tasks in GEOSS/GEO
 Global Observation of Forest and Land Cover Dynamics Overview of Fire Related Tasks in GEOSS/GEO Michael Brady 2nd Workshop on Geostationary Fire Monitoring and Applications Darmstadt, 4-6 December 2006
LAND AND WATER - EARTH OBSERVATION INFORMATICS FSP
 Earth Observation for Water Resources Management Arnold Dekker,Juan P Guerschman, Randall Donohue, Tom Van Niel, Luigi Renzullo,, Tim Malthus, Tim McVicar and Albert Van Dijk LAND AND WATER - EARTH OBSERVATION
REDDAF. Infosheet. Content. Objective and Concept. November 2012
 November 2012 REDDAF Infosheet Content Objective and Concept Objective and Concept 1 User Requirements 2 Methods Development 2 Service Development 5 Validation and Proof of Concept 6 Capacity Building/Training
TAC Request for Proposals: Discussion Paper on Connected and Automated Vehicles
 1. BACKGROUND TAC s Board of Directors has approved the creation of a new Connected and Automated Vehicles Task Force (CAV Task Force) that will report directly to the Board. A brief description of the
Review of the Monitoring & Reporting Decision (2009/442/EC) Explanatory Note
 Explanatory Note") INSPIRE Infrastructure for Spatial Information in Europe Review of the Monitoring & Reporting Decision (2009/442/EC) Explanatory Note Type Information document Creator DG ENV Date/status/version 20/10/2018
INSPIRE Infrastructure for Spatial Information in Europe Review of the Monitoring & Reporting Decision (2009/442/EC) Explanatory Note Type Information document Creator DG ENV Date/status/version 20/10/2018
COMMISSION STAFF WORKING DOCUMENT IMPACT ASSESSMENT. Accompanying the document. Proposal for a Council Regulation
 EUROPEAN COMMISSION Brussels, 11.1.2018 SWD(2018) 6 final PART 3/4 COMMISSION STAFF WORKING DOCUMENT IMPACT ASSESSMENT Accompanying the document Proposal for a Council Regulation on establishing the European
User Awareness & Training: LAND. Tallinn, Estonia 9 th / 10 th April 2014 GAF AG
 User Awareness & Training: LAND Tallinn, Estonia 9 th / 10 th April 2014 GAF AG Day 2 - Contents LAND (1) General Introduction to EO and the COPERNICUS Sentinel Programme Overview of COPERNICUS/GMES LAND
GEO-CRADLE at GEO WEEK 2017, 23-27/10/2017, Washington D.C., USA
 GEO-CRADLE at GEO WEEK 2017, 23-27/10/2017, Washington D.C., USA INSIGHT FOR A CHANGING WORLD The Group on Earth Observations (GEO) community, with over 700 people from diverse geographies, sectors and
Securing a sustainable raw materials supply basis for Europe
 ETP SMR Policy Document for the EIP on Raw Materials Securing a sustainable raw materials supply basis for Europe A mineral resources and metals industry view on the future of innovation in Europe and
ITP: 308 Mine water and mine waste management
 www.sida.se/itp AFRICA ADVANCED INTERNATIONAL TRAINING PROGRAMME ITP: 308 Mine water and mine waste management 30 September 22 October, 2018 in Malå Sweden 20 24 August 2019 in one of the participating
Overview of what GEO-CRADLE has achieved
 2018 Eurisy Members Day Friday 7 December 2018 @ CRTS, Rabat, Morocco Overview of what GEO-CRADLE has achieved Alexia Tsouni GEO-CRADLE Project Coordination Team National Observatory of Athens http://geocradle.eu
Chart 2 > Vortrag > Autor Dokumentname > Datum
 www.dlr.de Chart 1 > Vortrag > Autor Dokumentname > Datum www.dlr.de Chart 2 > Vortrag > Autor Dokumentname > Datum www.dlr.de Chart 3 > Vortrag > Autor Dokumentname > Datum www.dlr.de Chart 4 > Vortrag
AERONET The European Thematic Network on Aircraft Emissions and Reduction Technologies
 AERONET The European Thematic Network on Aircraft Emissions and Reduction Technologies Global commerce and the mobility of private persons are based on a well functioning air transportation system. Beside
Monitoring Norway spruce forest conditions using hyperspectral data
 Monitoring Norway spruce forest conditions using hyperspectral data Jana Albrechtová, Lucie Kupková, Charles University in Prague Veronika Kopačková, Czech Geological Survey Petya K.E. Campbell, NASA GSFC,
EO-MINERS. Assessment of forest health using hyperspectral data, example in Czech Republic. Veronika Kopačková et al. Czech Geological Survey
 EO-MINERS Assessment of forest health using hyperspectral data, example in Czech Republic Veronika Kopačková et al. Czech Geological Survey Conceptual scheme 2 Sokolov test site Foliar samling 2009 and
REMOTE SENSING FOR SOIL SCIENCE. Remote Sensing (GRS-20306)
") REMOTE SENSING FOR SOIL SCIENCE Remote Sensing (GRS-20306) Outline Soils RS & soils How to derive soil information from (remote) sensing data Instructions for the Exercise Why is soil so important? Vital
REMOTE SENSING FOR SOIL SCIENCE Remote Sensing (GRS-20306) Outline Soils RS & soils How to derive soil information from (remote) sensing data Instructions for the Exercise Why is soil so important? Vital
Sustainable Aggregate Resource Management - SARMa
 Sustainable Aggregate Resource Management - SARMa Slavko Šolar, Geological Survey of Slovenia Project Coordinator GEOLOŠKI ZAVOD SLOVENIJE SARMa Romanian National Workshop, Bucharest, October 8, 2010 INTRODUCTION
Study program: Mining. Semester I Required subject Code Subject ECTS. Hours per week
 Study program: Mining Semester I Hours per week 2FI 100112 Mathematics 1 8 3+2+2 216 2FP100212 Physics 1 8 3+2+2 216 UGD101312 Computer Science 6 2+2+1 156 Optional subject from faculty A 4 2+1+1 120 Optional
EU-Africa collaboration on Space applications for Africa
 EU-Africa collaboration on Space applications for Africa Background Maputo Declaration: African policy makers request EC to open its GMES initiative to Africa (Oct 2006) Build on existing EO activities
TRAINING WORKSHOP ON REVIEW OF REMEDIATION PLANS AND ACTIVITIES FOR URANIUM MINING AND MILLING SITES
 TRAINING WORKSHOP ON REVIEW OF REMEDIATION PLANS AND ACTIVITIES FOR URANIUM MINING AND MILLING SITES 2 CONTENTS CHAPTER 1. INTRODUCTION...3 Background...3 Objective...3 Scope...3 Structure...4 CHAPTER
RESGen. RES Generation From Research Infrastructure to Sustainable Energy and Reduction of CO2 Emissions
 RESGen RES Generation From Research Infrastructure to Sustainable Energy and Reduction of CO2 Emissions Grant agreement No 229993 REPORT WP Number and TITLE Task Number and TITLE Deliverable Number and
Public consultation on pharmaceuticals in the environment
 Contribution ID: 1bdef173-cd9f-44e0-a6bb-b9fef643f15d Date: 16/02/2018 12:07:54 Public consultation on pharmaceuticals in the environment Fields marked with * are mandatory. About this consultation This
Use of EO for integrated Coastal Zone Management [ICZM]
![Use of EO for integrated Coastal Zone Management [ICZM]](/thumbs/78/78380350.jpg "Use of EO for integrated Coastal Zone Management [ICZM]") Use of EO for integrated Coastal Zone Management [ICZM] Prof. George Zalidis Aristotle University of Thessaloniki, School of Agriculture Director of the Laboratory of Applied Soil Science Director of the
Use of EO for integrated Coastal Zone Management [ICZM] Prof. George Zalidis Aristotle University of Thessaloniki, School of Agriculture Director of the Laboratory of Applied Soil Science Director of the
Questions and Answers on call for tender RAN Centre of excellence HOME/2014/ISFP/PR/RADZ/0023) First set.
 First set.") Questions and Answers on call for tender RAN Centre of excellence HOME/2014/ISFP/PR/RADZ/0023) First set. Q1. Could you please provide Annex 1 in Word, Annex 2 in either Word or Excel, Annex 3A in Excel
Questions and Answers on call for tender RAN Centre of excellence HOME/2014/ISFP/PR/RADZ/0023) First set. Q1. Could you please provide Annex 1 in Word, Annex 2 in either Word or Excel, Annex 3A in Excel
What is the purpose of the EIP on Raw Materials?
 What is the purpose of the EIP on Raw Materials? Why are we talking about Raw Materials? Over the past decade, we have seen a significant increase in the global demand for industrial raw materials, whilst
Modernising and simplifying the CAP
 Modernising and simplifying the CAP Summary of the results of the public consultation Client: European Commission - DG AGRI Brussels, 7 July 2017 Table of contents 1 Introduction 9 2 Methodology 11 2.1
Public Consultation on the preparation of a new Communication on Raw Materials
 Public Consultation on the preparation of a new Communication on Raw Materials Objective The Commission intends to adopt a Communication on the subject above by end of this year. It will highlight the
4.365 localities in 2012
 SEKM Contaminated sites register CONTAMINATED SITES INVENTORY PROJECT IN THE CZECH REPUBLIC - METHODOLOGY OUTLINES Zdeněk Suchánek 1 2 SEKM Contaminated sites register SEKM Contaminated sites register
Mapping the depth to groundwater in Europe. Lisbon, June 7, 2002 Torsten Hauck BASF AG, Limburgerhof
 Mapping the depth to groundwater in Europe Lisbon, June 7, 2002 Torsten Hauck AG, Limburgerhof FOCUS groundwater higher tier leaching assessment Higher Tier assessment with geo-information data - description
Metallic products Types of inspection documents
 BRITISH STANDARD BS EN 10204:2004 Metallic products Types of inspection documents The European Standard EN 10204:2004 has the status of a British Standard ICS 01.110; 77.080.01; 77.120.01 BS EN 10204:2004
CONTINUOUS HANDLING EQUIPMENT AND
 IRISH STANDARD I.S. EN 620:2002 ICS 53.040.10 CONTINUOUS HANDLING EQUIPMENT AND National Standards Authority of Ireland Dublin 9 Ireland Tel: (01) 807 3800 Tel: (01) 807 3838 SYSTEMS - SAFETY AND EMC REQUIREMENTS
Earth Observation in Support of Science-Driven Policy & Decision Making: GEO Global Agricultural Monitoring (GEOGLAM)
") Earth Observation in Support of Science-Driven Policy & Decision Making: GEO Global Agricultural Monitoring (GEOGLAM) Alyssa Whitcraft Program Scientist, GEOGLAM Secretariat akwhitcraft@geooglam.org on
Earth Observation in Support of Science-Driven Policy & Decision Making: GEO Global Agricultural Monitoring (GEOGLAM) Alyssa Whitcraft Program Scientist, GEOGLAM Secretariat akwhitcraft@geooglam.org on
INTRODUCTION INTRODUCTION
 INTRODUCTION 1-1 1. INTRODUCTION 1.1. Background The exploitation of mining deposits in Namibia has been going on for more several thousand years. At first this productive activity was undertaken by Late
ENhanced DURability materials for Advanced stacks of New solid oxide fuel CElls. Project Number Project Acronym Endurance 1.04.
 ENhanced DURability materials for Advanced stacks of New solid oxide fuel CElls Project Number 621207 Project Acronym Endurance 1.04.2014-3 years 1. Publishable Summary (Mid-term review) Project context
082596/EU XXIV. GP. Eingelangt am 25/05/12 COUNCIL OF THE EUROPEAN UNION. Brussels, 25 May /12 TRANS 177 MAR 75
 082596/EU XXIV. GP Eingelangt am 25/05/12 COUNCIL OF THE EUROPEAN UNION Brussels, 25 May 2012 10418/12 TRANS 177 MAR 75 COVER NOTE from: Secretary-General of the European Commission, signed by Mr Jordi
Tender Specifications for subcontracting external expertise
 Tender Specifications for subcontracting external expertise Project Title and Number: Title: Anticipating, Preparing and Managing Employment in the Private Security Industry (VS/2017/0020) 1. Background
Philippe SCHILD New and Renewable Energy Sources Directorate General for Research
 Philippe SCHILD New and Renewable Energy Sources Directorate General for Research Mid-term review of the work programme (including the road map and the call text) Call text will specify which areas are
JOB AND REQUIREMENT PROFILE FOR HEADS OF DEPARTMENT AT CBS 1. INTRODUCTION 2. CBS STRATEGY
 JOB AND REQUIREMENT PROFILE FOR HEADS OF DEPARTMENT AT CBS 1. INTRODUCTION This memorandum is intended for use in connection with a recruitment process, in which CBS is to recruit candidates for positions
GLOBAL ENVIRONMENT OUTLOOK: PROSPECTUS
 Chapter 1: Introduction GEO-3 contents Introduction The introduction will place GEO in the context of other global assessment and reporting processes. GEO-3 Contents Chapter 2: State of the Environment
European Pathway to Zero Waste: embedding sustainable procurement for public sector organisations in south east England
 Final Report : embedding sustainable procurement for public sector organisations in south east England Report on the provision of bespoke advice on embedding sustainable procurement within procurement
IncREO. ( Increasing Resilience through Earth Observation. Copernicus Emergency Projects WS EC/REA, Brussels 4 December 2014
 IncREO (www.increo-fp7.eu) Increasing Resilience through Earth Observation Copernicus Emergency Projects WS EC/REA, Brussels 4 December 2014 Coordinator: Dr Marc Mueller (Airbus DS Geo SA [former Spot
A Remote Sensing Based System for Monitoring Reclamation in Well and Mine Sites
 A Remote Sensing Based System for Monitoring Reclamation in Well and Mine Sites Nadia Rochdi (1), J. Zhang (1), K. Staenz (1), X. Yang (1), B. James (1), D. Rolfson (1), S. Patterson (2), and B. Purdy
Authors: Jannick H. Schmidt, 2.-0 LCA consultants
 SIXTH FRAMEWORK PROGRAMME PRIORITY [policy-oriented research priority SSP 5A] SPECIFIC TARGETED RESEARCH OR INNOVATION PROJECT FORWAST Overall mapping of physical flows and stocks of resources to forecast
D031 Evaluation strategy for the JA EUWHF
 D031 Evaluation strategy for the JA EUWHF WORK PACKAGE 3 27 September, 2013 University of Eastern Finland Ministry of Social Affairs and Health in Finland Ministry of Health in Malta 1 D031 Evaluation
GALILEO JOINT UNDERTAKING
 GALILEO Research and Development Activities First call Activity D Application Market Development STATEMENT OF WORK GJU/03/102/issue3/OM/ms Issue 3 102 issue3 6 th FP D SOW 1 TABLE OF CONTENTS 1. INTRODUCTION
CASE STUDY FACT SHEET
 Protocol on Strategic Environmental Assessment to the Convention on Environmental Impact Assessment in a Transboundary Context (Kiev, 2003) CASE STUDY FACT SHEET Spatial Development Planning at the regional
REACH. Main concerns resulting from the implementation of REACH. Within the Aerospace Defence and Security business VERSION 1.5
 REACH Main concerns resulting from the implementation of REACH Within the Aerospace Defence and Security business VERSION 1.5 This final document - version 1.5 issued on 16 May 2014 Cancels and replaces
Getting Started and Participating in the Program
 Overall Workflow Getting Started and Participating in the Program David Barron Vice President, Cisneros Inc. david.barron@cisneros-si.com Kevin Carlson Associate Vice President, AECOM kevin.carlson@aecom.com
- Terms of Reference - 1. CONTEXT AND GENERAL INFORMATION Background
 Analysis and development of methodologies for estimating potential industrial emissions reductions and compliance costs of BAT conclusions adopted under the Industrial Emissions Directive - Terms of Reference
Audit of Human Resources Planning
 Health Canada Santé Canada Final Audit Report Audit of Human Resources Planning March 2012 Table of Contents Executive summary... i 1. Introduction... 1 1.1 Background... 1 1.2 Audit objective... 2 1.3
Project Scope and Timetable
 2 PROPOSED SCOPE OF WORK The timetable enclosed in this proposal presents the schedule for completing all of the work items identified within a six-month timeframe from receipt of a signed professional
Recommendations for establishing Pan European transparent and independent road accident investigations
 Loughborough University Institutional Repository Recommendations for establishing Pan European transparent and independent road accident investigations This item was submitted to Loughborough University's
Promoting Employment and Quality of Work in the European Rail Sector
 Promoting Employment and Quality of Work in the European Rail Sector Call for tenders Scientific expertise on: Promoting Employment and Quality of Work in the European Rail Sector Dear Sir / Madam, If
Investigating ecological patterns and processes in tropical forests using GIS and remote sensing
 Investigating ecological patterns and processes in tropical forests using GIS and remote sensing Carlos Portillo-Quintero Center for Earth Observation Sciences (CEOS) Department of Earth & Atmospheric
Project Report. - Part 2: Publishable Summary -
 Project Report - Part 2: Publishable Summary - Grant Agreement number: 296282 Project acronym: plan4business Project title: A service platform for aggregation, processing and analysis of urban and regional
BLAST INTERREG IV North Sea Region Program. Work Package 3 Developing the Marine & Coastal Reference Base. Summary Report
 BLAST INTERREG IV North Sea Region Program Work Package 3 Developing the Marine & Coastal Reference Base Summary Report Date: 20 th August 2012 Author: Rust, A M, Version R1r0 www.blast-project.eu 1 Authors
Economic and Social Council
 United Nations Economic and Social Council Distr.: General 19 December 2018 Original: English Statistical Commission Fiftieth session 5-8 March 2019 Item 4(g) of the provisional agenda* Items for information:
Economic and Social Council
 United Nations Economic and Social Council Distr.: General 17 December 2003 E/CN.3/2004/26 Original: English Statistical Commission Thirty-fifth session 2-5 March 2004 Item 6 (e) of the provisional agenda*
STEERING COMMITTEE FOR CULTURE, HERITAGE AND LANDSCAPE (CDCPP)
") Strasbourg, 27 April 2017 CDCPP(2017)8 Item 5.2 of the agenda STEERING COMMITTEE FOR CULTURE, HERITAGE AND LANDSCAPE (CDCPP) LAUNCH OF STRATEGY 21 (Limassol, 6-7 April 2017) FARO CONVENTION ACTION PLAN
Strasbourg, 27 April 2017 CDCPP(2017)8 Item 5.2 of the agenda STEERING COMMITTEE FOR CULTURE, HERITAGE AND LANDSCAPE (CDCPP) LAUNCH OF STRATEGY 21 (Limassol, 6-7 April 2017) FARO CONVENTION ACTION PLAN
Regulations regarding coal ash utilisation in Europe
 Workshop on Environmental and Health Aspects of Coal Ash Utilization International workshop 23 rd 24 th November 2005 Tel-Aviv, Israel Regulations regarding coal ash utilisation in Europe Hans-Joachim
The Regional Data Hub of GEO-CRADLE and the BEYOND Data Platforms in support to the data exploitation platform concept
 The Regional Data Hub of GEO-CRADLE and the BEYOND Data Platforms in support to the data exploitation platform concept Alexia Tsouni National Observatory of Athens Bucharest, 11/10/2018 Why data exploitation
D.B.E. Digital Business Ecosystem. WP33: Dissemination and Community Building. D33.1: DBE Brand Identity Definition.
 D.B.E. Digital Business Ecosystem Contract n 507953 WP33: Dissemination and Community Building D33.1: DBE Brand Identity Definition Project funded by the European Community under the Information Society
C-Roads Platform Terms of Reference
 C-Roads Platform Terms of Reference Dissemination level: C-Roads Platform internal Author: AustriaTech Status: Final Index 1 Purpose... 3 2 Governance Structure... 4 3 C-Roads Steering... 6 3.1 Tasks and
Miniwaste project synthesis report
 www.miniwaste.eu With the financial support of the European Commission Table of Contents Presentation of the Project & Partners...3 The Inventory of good practices...6 The Protocols on compost quantity
SMART oilfield GIS: Application of GIS for economic and environmental monitoring of oil and gas fields
 GEOLOGIJA 46/2, 429 434, Ljubljana 2003 SMART oilfield GIS: Application of GIS for economic and environmental monitoring of oil and gas fields A. TCHISTIAKOV, A. T. GANZEVELD & J. F. KEPPEL Netherlands
Official Journal C 271 A. of the European Union. Information and Notices. Announcements. Volume 60. English edition. 17 August 2017.
 Official Journal of the European Union C 271 A English edition Information and Notices Volume 60 17 August 2017 Contents V Announcements ADMINISTRATIVE PROCEDURES European Commission 2017/C 271 A/01 DG
Final Report for ESA Validation Data Centre, EVDC
 OR 9/2015 Final Report for ESA Validation Data Centre, EVDC 5 May 2015 Ann Mari Fjæraa Scientific report 2 Contents Page 1 Introduction... 3 2 Management status... 3 3 Technical Status of the project
Economic and Social Council
 United Nations Economic and Social Council Distr.: General 30 July 2012 Original: English Economic Commission for Europe Timber Committee Seventieth session Geneva, 16-19 October 2012 Item 8 of the provisional
C-Roads Platform Terms of Reference
 C-Roads Platform Terms of Reference Dissemination level: C-Roads Platform internal Author: AustriaTech Status: Final C-Roads Platform Coordinator AustriaTech www.austriatech.at Index 1 Purpose... 3 2 Governance
Guidelines for the Closure and Reclamation of Advanced Mineral Exploration and Mine Sites in the Northwest Territories
 DRAFT Guidelines for the Closure and Reclamation of Advanced Mineral Exploration and Mine Sites in the Northwest Territories Preface... 5 Introduction... 7 Purpose... 7 Authority... 7 How These Guidelines
TOPIC BRIEFING PRIOR TO THE REMOTE EVALUATION
 EO-3 TOPIC BRIEFING PRIOR TO THE REMOTE EVALUATION 4 April 2017 1 Purpose To ensure common understanding of the WP's key elements in order to guarantee a single and harmonized approach in the evaluation,
Sensors And Image Processing
 Sensors And Image Processing Craig Poling Chief Technology Officer Sentek Systems craigpoling@senteksystems.com (952) 500-3533 Sentek Systems, LLC Sensors For High-Throughput Phenotyping 1 / 32 Platforms
Networking as a tool to improve education and training in environmental remediation of uranium production sites the role of the ENVIRONET/CONNECT
 URAM 2014 Networking as a tool to improve education and training in environmental remediation of uranium production sites the role of the ENVIRONET/CONNECT Vienna 23 27 June 2014 Horst Monken-Fernandes,
Capture, transport and geological storage of CO 2 : - an environmental NGO perspective. Derek M. Taylor Bellona Environmental CCS Team
 Capture, transport and geological storage of CO 2 : - an environmental NGO perspective Derek M. Taylor Bellona Environmental CCS Team What is Bellona: The Bellona Foundation: International environmental
INTRODUCTION TO THE BREAKOUT SESSIONS. ESA-FAO-GWSP Workshop on WEF Rome, Italy March 25, 2014 Richard Lawford Cat Downy, Lucie Pluschke
 INTRODUCTION TO THE BREAKOUT SESSIONS ESA-FAO-GWSP Workshop on WEF Rome, Italy March 25, 2014 Richard Lawford Cat Downy, Lucie Pluschke The Breakout Groups are a critical element in the Workshop structure