Table of Contents Listing of Figures and Tables Section 1 Executive Summary Introduction.. 5
|
|
|
- Osborn Hart
- 6 years ago
- Views:
Transcription


1 Annual Air Quality Report 2008
2 Table of Contents Table of Contents... 2 Listing of Figures and Tables... 3 Section 1 Executive Summary... 4 Introduction.. 5 Hamilton Air Monitoring Network Overview. 5 HAMN Participating Industries 5 Annual Report Overview... 5 Network Enhancements.. 5 Public Web Based Data Access.. 6 Section 2 Air Quality Summary Data - Pollutant Trends Historical Trend Graphs Appendix 1 Wind Frequency Distribution The Wind Rose. 14 Appendix 2 Activities and Progress. 15 Appendix 3 Legend.. 17 Appendix 4 Where do We Measure Air Quality? 18 How do We Measure Air Quality? Appendix 5 Ministry of the Environment s Role in HAMN.. 21 Appendix 6 HAMN Structure 24 Appendix 7 Summary Statistics and Data Set 2008 Attachment 2
3 Figures and Tables Figure 1 Sulphur Dioxide Annual Trends Figure 2 Sulphur Dioxide Monthly Trends 2008 Figure 3 Figure 4 Figure 5 Total Reduced Sulphur Annual Trends Total Reduced Sulphur Number of Hours Exceeding 10 ppb Nitrogen Dioxide Annual Trends Figure 6 Nitrogen Dioxide Monthly Trends 2008 Figure 7 Figure 8 Total Suspended Particulate Annual Trends PM 10 - Inhalable Particulate Annual Trends Figure 9 PM 10 - Inhalable Particulate Monthly Trends 2008 Figure 10 PAH (Benzo[a]Pyrene) Annual Trends Figure 11 PAH (Benzo[a]Pyrene) Exceedances 2008 Figure 12 Volatile Organic Compounds Benzene Annual Trends Figure 13 Volatile Organic Compounds Benzene Annual Means 2008 Figure 14 Figure 15 Figure 16 Figure 17 Figure 18 Wind Rose Graphics Hamilton Air Monitoring Network Map Telemetry System Data Flow Rotek Environmental MOE Audit Record HAMN Framework Table 1 HAMN Participating Industries Table 2 Sulphur Dioxide Statistics 2008 Table 3 Total Reduced Sulphur Statistics 2008 Table 4 Nitrogen Dioxide Statistics 2008 Table 5 Total Suspended Particulate Statistics 2008 Table 6 PM 10 - Inhalable Particulate Statistics 2008 Table 7 PAH (Benzo[a]Pyrene) Statistics 2008 Table 8 Volatile Organic Compounds Benzene Statistics 2008 Table 9 HAMN Air Monitoring Network Configuration 3
4 Executive Summary Since May 1 st, 2003, the industrial air shed monitoring network in the City of Hamilton has been operated, serviced and maintained by Hamilton Air Monitoring Network (HAMN). HAMN is a group of industries that are committed to ongoing measurement of local air quality as part of the Ministry of the Environment (MOE) industrial Source Emissions Monitoring (SEM) program. Companies participating in the MOE SEM program are required to submit an annual summary report of their air quality monitoring results obtained in the previous calendar year. This report contains an overview of the HAMN network, historical trends for major air pollutants and an explanation of the roles and responsibilities of HAMN and MOE in the SEM program. The complete 2008 monitoring results are provided in a separate appendix to this report. Some of the highlights of this report are: Sulphur dioxide levels continue to decline and remain well below the MOE's annual criteria. The sulphur dioxide 2008 annual average was the lowest in 10 years. Total Reduced Sulphur (TRS) annual trends for 2008 were the lowest in ten years. We have seen a decrease in the number of hours over the 10 ppb odour threshold level. There was a 50%decrease from the previous year. Nitrogen dioxide (NO 2 ) levels continue to decline in This year was the lowest in ten years. Inhalable Particulate (PM10) levels continue to exceed the 24-hour interim AAQC. Although annual trends seen at the three industrial sites monitoring Total Suspended Particulate (TSP) remain the same over the last 6 years, levels at specific point source stations continue to exceed the 24-hour TSP objective. Based on the location of the ambient air monitoring stations and their proximity to local sources it is evident that road dust, fugitive emissions and industrial emissions continue show elevated TSP levels. Benzene levels remain constant over the last five years. Benzo[a]Pyrene (B[a]P) levels increased slightly in All three sites continue to record periodic exceedances of the 24-hour Ambient Air Quality Criteria (AAQC). HAMN has surpassed the MOE yearly valid data collection requirement criteria of 95% for six consecutive years. HAMN has averaged 97% over each of the first five years of operation, with minimal down time. The MOE performs regular audits of activities and processes related to the collection of air quality data under the MOE Source emission monitoring (SEM) program. The audits provide an indication of the effectiveness of quality control activities used by station operators and data management staff. HAMN meets or exceeds all of the requirements under the MOE SEM program. HAMN continues to provide resources for network enhancement; 2008 projects include: A new air monitoring station was commissioned in late 2008 for St Christopher Park. Two new real-time particulate samplers we purchased in These additional samplers will enhance the HAMN particulate monitoring program Continuing to participate in joint monitoring programs with the MOE such as fugitive emissions. A new oxides of nitrogen (NOX) analyzer was added to the HAMN network in All upgrades to the HAMN real-time telemetry and data acquisition system were completed in Completion of this project was required to move ahead with the HAMN website scheduled for release for June,
5 Introduction Hamilton Air Monitoring Network (HAMN) Since May 1 st, 2003, the point source air-monitoring network in the City of Hamilton has been operated, serviced and maintained by the Hamilton Air Monitoring Network (HAMN). The Hamilton industrial area is made up of various industrial sectors including integrated iron and steel plants, chemical producers, manufacturing facilities and several recycling facilities. With the close proximity of these facilities to each other, and the complexity of meteorological conditions in Hamilton, assessing sources of industrial emissions has always been a difficult task. HAMN represents participating industries that are committed to carrying out their own air quality monitoring as part of the MOE s SEM program, which is designed to identify, monitor and report the levels of target pollutants near industrial plants. HAMN Participating Industries Table 1 Bartek Ingredients MultiServ - ArcelorMittal Dofasco Inc. Liberty Energy Inc. Baycoat Ltd. MultiServ - U.S Steel Canada U.S Steel Canada Bunge Canada Lafarge Canada Jones Road ArcelorMittal Hamilton East City of Hamilton Lafarge Canada - Victoria Rurtgers Canada Shell Canada Lafarge Hamilton Slag Vopak Terminals of Canada Inc. ArcelorMittal Dofasco Inc. Triple M Metal LP Columbian Chemicals Canada ULC Federal Marine Terminals Annual Report Overview Companies participating in the MOE s SEM program are required to submit an annual summary report of their air quality monitoring results obtained in the previous calendar year. This report is HAMN s annual submission which summarizes HAMN s 2008 air quality data as per the MOE s reporting requirements. This report contains an overview of the HAMN network, historical trends and annual data for major air pollutants and an explanation of the roles and responsibilities of HAMN and MOE in the SEM program. The complete 2008 monitoring results are provided in a separate appendix to this report. Network Enhancements The total capital value of HAMN assets now exceeds $500,000. The HAMN members support the network s annual operating costs of approximately $400,000 through user fees. These fees fund the service, repair and maintenance of the monitoring equipment in the HAMN network, as well as the costs of meeting all QA/QC requirements required by the MOE and paying for all laboratory analyses. Approximately 10% of the budget is committed toward the purchase of new equipment or the conducting of special air monitoring surveys. 5
6 Public - Web Based Data Access The HAMN steering committee is committed to securing funding needed to make the real-time data collected by HAMN available to the public via a web-based data portal. The funding needed to host and maintain this web site may be identified in the near future so that HAMN members and the general public will have access to this unique data resource. Funding for this project was approved by HAMN in late 2007 and Installation of hardware and system software is expected for early spring of Development of a website will be carried out throughout most of the summer with an expected release of June Air Quality Summary Data - Pollutant Trends An important tool used for air pollution data analysis is the evaluation of pollutant trends. Data collected from the HAMN air monitoring sites is summarized and illustrated in the following historical trend graphs. Trend analysis is a good approach to learn more about how a pollutant behaves over time and space. Some data trend categories include the following: Hourly data - How does a given pollutant tend to 'behave' during an average day. Annual data - How a given pollutant 'behaves' during the course of the year. Seasonal data - How inversions affect the dispersion of pollutants in the local air shed. Historical data - This is the trend over several years. These analyses help in assessing the impacts of emission reductions initiatives, deciding where to deploy monitors and gauging the effectiveness of Provincial pollution abatement and control legislation. The following graphs and bar charts provide annual trends for the pollutants monitored at selected monitoring locations. Figure 15 in Appendix 4 provides the locations of the individual monitoring stations in the Hamilton Area. A summary table for each pollutant is also provided indicating the Maximum 1-Hr Average Value, the Maximum 24-Hr Average Value, the Number of Hours over the 1-Hr Ambient Air Quality Criteria (AAQC) the Number of Days over the 24-Hr AAQC, Annual Mean and Percent Valid Data. All 2008 data is available in the Summary Statistics and Data Set
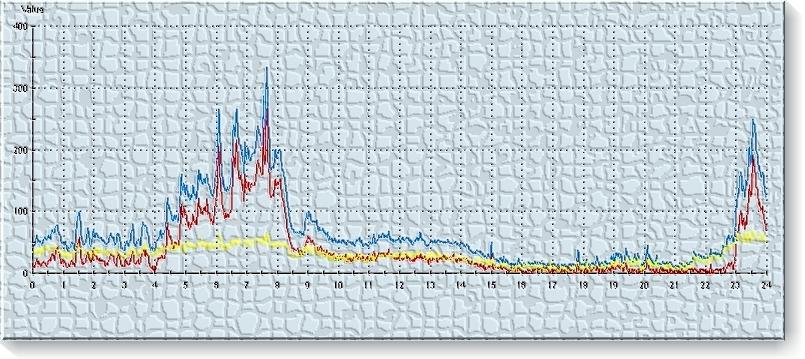
7 Air Quality Monitoring Sulphur Dioxide Characteristics Sulphur Dioxide (SO 2 ) belongs to the family of sulphur oxide gases (SOx). These gases dissolve easily in water. Sulphur is prevalent in many raw materials, including crude oil, coal, and ores that contain common metals like aluminum, copper, zinc, lead, and iron. SOx gases are formed when fuels containing sulphur, such as coal or oil, are burned, and when gasoline is extracted from oil, or metals are extracted from ore. SO 2 dissolves in water vapour to form an acid which interacts with other gases and particles in the air to form sulphate particulates and other products that can be harmful to people and their environment. Annual Average (ppm) SULPHUR DIOXIDE ANNUAL TREND Annual Objective Barton Street (Niagara-Land) and Beach Blvd. Over 65% of SO 2 released to the air comes from electric power utilities, especially those that burn coal. Other sources of SO 2 are industrial facilities that derive their products from raw materials like coal and crude oil, or that burn coal or oil to produce process heat. Examples are the steel industry, petroleum refineries, cement manufacturing, and metal processing facilities. Ontario AAQC s for SO 2 are: Figure 1 Figure Annual average SO 2 trend. Barton Street terminated in 07. The 08 average is based on Niagara/Land and Beach stations. Monthly SO 2 trends for Monthly average concentrations ranged from to ppm. SO2 MONTHLY TREND hour average 0.25 ppm 24 hour average 0.10 ppm Annual average 0.02 ppm SO 2 levels in Hamilton remain well below the MOE's annual objective. In 2008 the annual mean for Station 29102, Beach Blvd, was ppm compared to Station 29567, Niagara/Land, at ppm. The highest 1 hour average for Station was ppm and ppm for Station Monthly Average (ppm) J F M A M J J A S O N D Niagara-Land Beach Blvd. Table 2 Sulphur Dioxide Statistics for 2008 Station Maximum 1Hr Average ppm Maximum 24 Hr Average ppm No. of Hrs > 1 Hr AAQC No. of Days > 24 Hr AAQC Annual Mean ppm Percent Valid Data Land Beach
8 Air Quality Monitoring Total Reduced Sulphur (TRS) Characteristics Total Reduced Sulphur (TRS) is a term used for a class of compounds that have offensive odours similar to rotten eggs; these compounds are a common basis for odour complaints. Common sources of TRS compounds are the steel industry (coke ovens and blast furnace releases), and pulp and paper mills. TRS compounds are not normally considered a health hazard except at very high concentrations. The odour threshold for TRS is low and is approximately 10 parts per billion (ppb). Number of Hrs Over 10 ppb TOTAL REDUCED SULPHUR TREND Hours Over 10 ppb Odour Threshhold Year Ontario AAQC s for TRS are: 1 hour average 27 ppb 1 hour odour threshold 10 ppb Figure 3 Beach Woodw ard Niagara/Land Historical annual TRS trends for the number of hours over the odour threshold of 10 ppb for the past 10 years. In recent years there has been a decrease of between 70% to 90% in the number of hours that TRS levels have exceeded 10 ppb. Significant improvements in the management and operations of the coke ovens, the blast furnaces and slag quenching operations have resulted in these substantial improvements. Improvement in the long term trend line continues for Woodward Station (STN29163) was commissioned in Number of Hrs Over 10 ppb Figure 4 Annual TRS trends for the number of hours over the odour threshold of 10 ppb for the past 3 years. TOTAL REDUCED SULPHUR TREND Hours Over 10 ppb Odour Threshhold Year Beach Woodw ard Niagara/Land Table 3 Total Reduced Sulphur Statistics for 2008 Station Maximum 1 Hr Average ppb Maximum 24 Hr Average ppb No. of Hrs > 1 Hr AAQC No. of Hrs > 1 Hr Threshold Annual Mean ppb Percent Valid Data Land Woodward Beach
9 Air Quality Monitoring Nitrogen Oxides (NOx) Characteristics Oxides of Nitrogen (NOx) is the generic terms used for a group of highly reactive gases, all of which contain nitrogen and oxygen in varying amounts. The MOE lists criteria for NO X as Nitrogen Oxides which is defined as the sum of nitrogen dioxide and nitric oxide (NO 2 + NO). Nitric Oxide (NO) is colorless and odourless and is emitted from combustion sources. Nitrogen Dioxide (NO 2 ) is a reddish-brown gas that causes the brown layer commonly seen over many urban areas. Oxides of Nitrogen form when air is heated to over 675 C during combustion processes. The primary manmade sources of NOx are motor vehicles, electric power utilities and other industrial, commercial, and residential sources that burn fuels. NOx can also be formed naturally by lightning. Emissions of NO X consist mainly of NO and to a lesser extent NO 2. in atmosphere NO will convert to NO 2. The adverse health effects of NO 2 occur at much lower concentrations and so although the AAQC standard is for NO X, it is based on the health effects of nitrogen dioxide (NO 2 ). NO X causes a wide variety of health impacts in humans as well as other environmental impacts. Annual Average (ppm) Figure 5 Annual average NO 2 trend over the past 10 years for STN29102, Beach Blvd. Figure 6 NITROGEN DIOXIDE TREND Beach Blvd Monthly NO 2 trends for Monthly average concentrations range from ppm to ppm M ONTHLY NITROGEN DIOXIDE TREND 2008 Ontario AAQC s for NO X (as NO 2 ) are: 1 hour average 0.20 ppm 24 hour average 0.10 ppm Nitrogen Dioxide levels have remained almost constant over the past decade. There is a direct link between the number of vehicles, the number of miles the vehicles are driven and the Nitrogen Dioxide levels. These data show that there has been no improvement in the overall impacts of car and truck traffic emissions over the past decade. A number of other major urban centres have seen increases in the Nitrogen Dioxide levels in those cities over the same period. Monthly Average (ppm) J F M A M J J A S O N D Beach Blvd Table 4 Nitrogen Dioxide Statistics for 2008 Station Maximum 1 Hr Average ppm Maximum 24 Hr Average ppm No. of Hrs > 1 Hr AAQC No. of Days > 24 Hr AAQC Annual Mean ppm Percent Valid Data Beach
10 Air Quality Monitoring Total Suspended Particulate (TSP) Characteristics Particle pollution (also called total suspended particulate or TSP) is the term for a mixture of solid particles and liquid droplets found in the air. Some particles, such as dust, dirt, soot, or smoke, are large or dark enough to be seen with the naked eye. TSP includes all particulate material smaller than 44 µm (44 micrometres or 44 microns) in diameter. The largest TSP particles have diameters similar to the diameter of a human hair (about 50 µm) while others are so small they can only be detected using an electron microscope. Ontario AAQC s for TSP are: 24 hour average 120 µg/m 3 Annual mean 60 µg/m 3 A substantial portion of TSP is related to industrial activities, road dusts, agricultural dusts and other sources of airborne soils. The TSP values in Figure 7 are the geometric means of TSP data from 3 industrial monitoring sites and is representative of the impacts experienced by those communities bordering on the industrial area. Geometric Mean (ug/m3) SUSPENDED PARTICULATE (TSP) TREND Annual Objective Year 3 Industry Sites Figure 7 Annual average TSP trend over the past 10 years. Years 99 through 07 based on the combined averages of Station 29025, Barton St, Station 29113, Gertrude and Station 29102, Beach. Station was terminated in 07. Station 29567, Niagara/Land, used for the 08 average calculation. Table 5 summarizes the 2008 statistics for 7 TSP monitoring sites. Station 29161, Strathearne, was re-established in June of There was insufficient data to calculate an annual mean. STN29166, Jones Road, TSP samples are not analyzed for metals. Table 5 Total Suspended Particulates (TSP) Statistics for 2008 Station Number of 24 Hr Samples Maximum 24 Hr µg/m3 No. of Days > 24 Hr TSP AAQC No. of Days > 24 Hr Metals AAQC Annual Mean µg/m3 Percent Valid Data Beach Blvd Gertrude Wilfred St (Mn) Strathearne (Fe) Eastport Dr Land Jones Rd
11 Air Quality Monitoring Inhalable Particulate Matter (PM 10 ) Characteristics Particulate Matter (PM) is a complex mixture of extremely small particles and liquid droplets. PM is made up of a number of components, including acids (such as nitrates and sulphates), organic chemicals, metals, and soil or dust particles. The size of particles is directly linked to their potential for causing health problems. There is concern about particles that are 10 micrometers in diameter or smaller (PM 10 ) because those are the particles that generally pass through the throat and nose and enter the lungs. Once inhaled, these particles can affect the heart and lungs and cause serious health effects. Some particles, known as primary particles are emitted directly from a source, such as construction sites, unpaved roads, fields, smokestacks or fires. Other particles are formed in complex reactions in the atmosphere from gases such as SO 2 and NOx that are emitted from power plants, industries and automobiles. These particles, known as secondary particles, make up most of the fine particulate pollution in the country. Ontario Interim AAQC for PM 10 is: 24 hour average 50 µg/m 3 A continuous PM 10 monitor was added to the network at Station 29102, Beach, for Levels of PM 10 have decreased by about 20% in most areas of the City since the early 1990 s. There was little change in the trend line for HAMN will continue to attempt to identify sources of PM 10 throughout Annual Mean (ug/m3) No. of AAQC Exceedances INHALABLE PARTICULATE (PM1 0) TREND Year STN29567 (Land) STN29565 (Strathearne) STN29102 (Beach) Figure 8 Annual average PM 10 trend over the past 9 years for 29557, Niagara/Land, and STN29565, Strathearne (29102 new for 06). Figure 9 Monthly PM 10 exceedance trends for Monthly average concentrations range from 12 µg/m 3 to 66 µg/m 3. MONTHLY EXCEEDANCE TREND J F M A M J J A S O N D Month STN29567 (Land) STN29565 (Strathearne) STN29102 (Beach) Table 6 Inhalable Particulate Matter (PM 10 ) Statistics for 2008 Station Maximum 1 Hr Average Maximum 24 Hr Average µg/m 3 µg/m 3 No. of Days > 24 Hr AAQC Annual Mean µg/m 3 Percent Valid Data Land Strathearne Beach >
12 Air Quality Monitoring Polycyclic Aromatic Hydrocarbons (PAH) Characteristics Benzo[a]Pyrene (BaP) is a compound representative of a class of chemicals called Polycyclic Aromatic Hydrocarbons (PAH). BaP is a known carcinogen and is produced by the combustion of carbonaceous fuels (gasoline, diesel fuel, wood, coal, etc.) and tobacco. PAH is present in the atmosphere predominantly in particulate form. A less significant formation mechanism is the volatilization of lightweight polycyclic organic matter, which occurs in the production and use of naphthalene. Ontario AAQC s for Benzo[a]Pyrene: 24 Hour Average 1.10 ng/m 3 Annual Mean 0.22 ng/m 3 Annual Average (ng/m3) BENZO(A)PYRENE TREND Year Pier 25 Gertrude Niagara/Land Figure 10 Annual average BaP trend over the past 10 years for Station 29547, Pier 25, Station 29113, Gertrude and Station 29567, Land. The principal sources of BaP in Hamilton are vehicle and coke oven emissions. Improvements made to the coke oven operations have led to dramatic reductions (65-85% since the mid-1990 s) in the ambient BaP levels near and away from the industries. No. of Days > 24 Hr AAQC Figure 11 Annual BaP trends for the number of days which exceeded the AAQC threshold for the past year. BENZO(A)PYRENE EXCEEDANCES Year Pier 25 Gertrude Niagara/Land Table 7 Benzo[a]Pyrene (BaP) Statistics for 2008 Station Number of 24 Hr Samples Maximum 24 Hr ng/m 3 No. of Days > 24 Hr AAQC Annual Mean ng/m 3 Percent Valid Data Land Gertrude Pier
13 Air Quality Monitoring Volatile Organic Compounds (VOC) Characteristics Benzene is a volatile organic compound that has been classified as a human carcinogen. It is a non-threshold toxicant, a substance for which there is considered to be some probability of harm for critical effects at any level of exposure. The main sources of benzene are wood combustion (including forest fires and residential wood combustion), transportation, natural gas dehydrators, steel industry and petroleum distribution and refining. Industrial Benzene emissions arise primarily from the coke ovens and the associated by-products plants in the steel industry. Improvements in the control of benzene vapours at the by-products plants have resulted in large reductions (60-80%) at a monitoring site near the steel mills over the past several years. Background benzene levels measured by Environment Canada have dropped below 2 µg/m 3. Annual Average (ug/m3) Figure 12 BENZENE TREND Figure 13 Beach Blvd Gertrude Niagara/Land Annual average Benzene trends over the past 10 years for Stations 29102, Beach Blvd, 29113, Gertrude and 29567, Land. Annual Benzene means (2008) for Station 29102, Beach Blvd, Station 29113, Gertrude and Station 29567, Land. BENZENE ANNUAL MEANS 2008 Annual Average (ug/m3) Beach Blvd Gertrude Niagara/Land Table 8 Volatile Organic Compounds - Benzene Statistics for 2008 Station Number of 24 Hr Samples Minimum 24 Hr Maximum 24 Hr Annual Mean µg/m 3 µg/m 3 µg/m 3 Percent Valid Data Beach Blvd Gertrude Land

14 Appendix 1 Wind Frequency Distribution Wind Roses, 2008 To show the information about the distributions of wind directions and wind speeds, one may draw a radial plot of the data as a so-called wind rose, based on meteorological observations of wind speeds and wind directions. Wind roses are a form of meteorological fingerprint. It is important to be able to read the wind rose correctly. The arms of a wind rose point to where the wind was coming from, not the direction the wind was blowing. Wind roses summarize the relative occurrence (or frequency) of winds blowing from different directions as narrow wedges or spokes about a central point; the longer the wedge or spoke, the more frequent the winds blew in from that direction, with North at the top of the diagram. Each wedge is divided into segments of different colours, representing wind speed ranges. Examination of a wind rose is extremely useful for siting air monitoring stations. If a large share of the energy in the wind comes from a particular direction, then you will want to site an air monitoring location in that predominant downwind vector. Examples of wind rose graphics from two of the network Meteorological Stations are provided below. For example, the longest spokes in the wind rose for STN29026 point toward the southwest, which means these spokes represent data for winds which were blowing from the southwest about 225 degrees on the compass. In other words the predominant winds for 2008 at STN29026 were from the southwest. Conversely, the predominant winds at STN29567 came from a direction that is about 270 degrees on the compass. This difference in wind directions highlights the fact that winds in Hamilton are affected a great deal by the both the harbour and the escarpment. 0 N % 2% 3% 4% STN29567 Niagara and Land WS 225 km/hr >0.5-3 >3-5 > % 2% 3% 4% STN29026 Woodward Ave 90 >10-15 >15-20 > >25-30 > Figure 14 14
 St Christopher Park air monitoring station was commissioned at the end of 2008.")

15 Appendix 2 Activities and Progress New Air Monitoring Station - St. Christopher Park (STN29168) St Christopher Park air monitoring station was commissioned at the end of The following parameters will be measured continuously; Particulate Matter (PM 10 ), Total Reduced Sulphur (TRS), Wind Speed and Wind Direction. Data will be available through the HAMN public website. Location - Aerial Overview Location of new Air Monitoring Station St. Christopher Park 15

16 HAMN Website All the required hardware / software has been purchased, installed and integrated with the current HAMN data acquisition network. This will provide a platform for the new public web-based air quality data access portal. The public web-site is scheduled for release in
17 Appendix 3 Legend QA/QC - Quality Assurance/Quality Control SEM - Source Emissions Monitoring HAMN - Hamilton Air Monitoring Network AAQC - Ambient Air Quality Criteria (Ontario) EST - Eastern Standard Time MOE - Ministry of the Environment NO - Nitric Oxide NO 2 - Nitrogen Dioxide NO x - Oxides of Nitrogen PM 10 - Inhalable Particulates less than 10 microns in diameter SO 2 - Sulphur Dioxide TSP - Total Suspended Particles TRS - Total Reduced Sulphur VOC - Volatile Organic Compounds PAH - Polycyclic Aromatic Hydrocarbons B[a]P - Benzo[a]Pyrene MDL - Minimum Detection Limit ng/m 3 - Nanograms (of contaminant) Per Cubic Metre (of air) µg/m 3 - Micrograms (of contaminant) Per Cubic Metre (of air) ppb - Parts (of contaminant) Per Billion (parts of air) ppm - Parts (of contaminant) Per Million (parts of air) TEOM - Tapered Element Oscillating Microbalance SSI - Size Selective Inlet (Manual) Mn - Manganese Fe - Iron Continuous - Continuous Real Time Monitoring Non Continuous - 24 Hr Samples 6 or 12 Day Rotating Schedule 17

18 Appendix 4 Where Do We Measure Air Quality in Hamilton? For many years the MOE and Environment Canada (EC) carried out routine ambient monitoring in the Hamilton area. Since May, 2003 HAMN s industrial air quality monitoring program has been responsible for collecting and reporting accurate, real-time continuous measurements of ambient pollutants at five sites located around the industrial area (Figure 15). These pollutants include Sulphur Dioxide (SO 2 ), Total Reduced Sulphur (TRS), Oxides of Nitrogen (NO x ), and Inhalable Particulate Matter (PM 10 ). As well, there are 13 non-continuous air monitoring samplers in the HAMN network that collect data every sixth or twelfth day in a rotating schedule. Hamilton Air Monitoring Network Map Hamilton Harbour STN29567 STN29167 STN29102 STN29547 N STN29160 STN29161 STN29164 Lake Ontario STN29113 STN29026 STN29168 STN29565 STN29163 STN STN STN - Continuous - Non Continuous - MOE Site - Meteorological Parameters STN29166 Figure 15 These samplers monitor such pollutants as Total Suspended Particulates (TSP), Volatile Organic Compounds (VOC s), Polycyclic Aromatic Hydrocarbons (PAH) and Metals (Table 9). The data generated are used to monitor air quality in and around the industrial area, determine which areas meet and/or exceed Ontario Ambient Air Quality Criteria (AAQC) and develop pollution trends. The HAMN program encompasses operation of the sampling and monitoring 18

19 network, laboratory analysis of air samples, and quality assurance activities to ensure the quality of the data collected. HAMN provides the MOE with real-time access to continuous air monitoring data and submits quarterly and annual data summary reports of all continuous and non-continuous air monitoring data. Also, HAMN provides immediate notification of all exceedances of the AAQC. The MOE has real-time data access to the air quality information to assist them with abatement programs and complaint investigations. HAMN Network Configuration How Do We Measure Air Quality? Table 9 The network data is used to provide HAMN members and the MOE with accurate air quality information. The continuous monitoring sites in the network include instruments that measure ambient levels of gaseous and particulate air pollutants, and in some cases, meteorological parameters. The data signals from these analyzers and sensors must be averaged, digitized and processed according to detailed MOE guidelines for collecting air quality monitoring data. Figure 16 illustrates the real-time movement of data to both industry members and MOE servers. Telemetry System Data that is received by the HAMN operated servers is utilized for troubleshooting and rectifying network anomalies, generating reports, implementing QA/QC protocols and notifying MOE and industry personnel of AAQC exceedances and/or unusual air quality events. The MOE database provides for real-time oversight of network operations to ensure compliance with defined protocols and provides immediate access to daily pollutant trends for tracking of abatement program initiatives (Figure 16). 19

20 Modem Technical Support Audit Group Abatement Officers Provincial Central Data Base Public Phone Lines Ministry of the Environment Office Regional Database Servers Modem MOE Alerts Rotek Environmental Office Industry Database Servers Real Time Data Modem Air Monitoring Station Figure 16 20
21 Appendix 5 Ministry of the Environment (MOE) Role in HAMN In April of 2003 the MOE launched a new initiative called Industrial Source Emissions Monitoring (SEM). This program requires that companies in Ontario assume the responsibility for monitoring air quality near their facilities. The objectives of the air quality monitoring program near industrial point sources include the following: To assist in the prevention of possible adverse effects due to air emissions from an industrial facility. To demonstrate compliance with provincial regulatory air quality limits as set out in Regulation 419, Regulation 337 or in other regulatory instruments such as Orders and Certificates of Approval. To demonstrate conformance with Schedule 1, 2 and/or 3 standards set out in Regulation 419 and listed in the document SUMMARY of STANDARDS and GUIDELINES to support Ontario Regulation 419: Air Pollution Local Air Quality, and Ambient Air Quality Criteria listed in the document ONTARIO S AMBIENT AIR QUALITY CRITERIA which are developed by the MOE as a component of the MOE standard setting process. These lists are updated periodically. To provide accurate and reliable data in support of air quality modeling calculations. To determine the impact of industrial air emissions on local air quality in adjacent communities and in the regional air shed. To provide accurate and reliable data as part of an integrated air quality managementcontrol system. To determine air quality improvements and trends in conjunction with industrial air emissions abatement programs. To provide data to assess local population and ecosystem exposure to air pollutants. Linkages to the Ministry of the Environment (MOE) The HAMN air-monitoring network is solely funded and operated by 21 industrial members. HAMN has hired two consultants 1) Administrator - to oversee the network operations as per MOE requirements, and a second 2) Service Contractor - to provide the service, repair and maintenance of the monitoring network. Although the network is owned and operated by industry the MOE has made several request of HAMN to ensure credibility of Hamilton air quality data. The following is a list of requirements specified by the MOE: A) Data Access The MOE has full access to all continuous monitoring stations via HAMN telemetry and data acquisition system. MOE can review and assess all raw air quality data collected by HAMN. Data corrections and/or edits are electronically logged and made available to the MOE for review. Data is reviewed by the MOE Air Quality Analyst and forwarded to District abatement staff should further investigation be required. The MOE has full access to all analyser s daily calibration records. MOE can review and verify instrument performance through daily calibration records. MOE will notify HAMN staff of any anomalies. 21
22 B) Notification HAMN to notify the MOE immediately of any exceedances of the air quality guideline or standards. C) Reporting HAMN to provide monthly exceedances summary report. HAMN prepares and submits to the MOE a monthly summary report of all exceedances that occur within the network. HAMN to prepare and provide to the MOE a quarterly summary of all collected and reviewed data. HAMN to prepare and provide to the MOE an annual data summary report. D) Auditing MOE staff will carry out routine auditing of all HAMN air monitoring samplers. MOE audits carried out on continuous analysers are performed with certified calibration test gases. MOE carried out system audits on all non-continuous samplers. A system audit is a performance check of the instrument performance. Duplicate monitoring of MOE/HAMN samplers is carried out to verify system audits and laboratory analysis. E) Communication Two HAMN committees have been established to provide communication between all HAMN members and the MOE. i. HAMN steering Committee The HAMN steering committee members include 10 HAMN members, HAMN Administrator, MOE District abatement staff, and MOE Technical support staff. ii. HAMN Technical sub-working group. This working group deals with day-to-day operation of the network. MOE technical support staff, service contractor and HAMN administrator meet bimonthly. On occasion MOE district abatement staff may be called in to discuss specific abatement issues. F) Service Contractor Performance Audit Review HAMN carries out a yearly review of the service contractor s performance. Performance assessment criteria are determined by the MOE Operations Manual for Air Quality Monitoring in Ontario (March 2008). A copy has been provided to all HAMN members. 22
23 Ministry of the Environment (MOE) Audit Program / HAMN Performance The MOE performs regular audits of activities and processes related to the collection of air quality data under the SEM program. The audit program provides an indication of the effectiveness of quality control activities used by station operators and data management staff. Performance audits are independent evaluations of data quality produced by the analyzers, and are performed in addition to the normal quality control activities. In addition to auditing analyzer and sampler performance, quality control activities of the operator, siting criteria, assessment of the complete sampling system, and completeness and quality of the site logging information is also verified by MOE staff and is incorporated in their audit reports. The MOE uses a conformance/non-conformance limit of ±10% of the test gas value or sampler air flow rate standard. Non-conformance with this criterion requires immediate and/or quick corrective action by station operators and data management individuals if data correction/editing are required. In such instances, a follow-up audit by MOE staff is required to ensure that appropriate corrective actions have been taken in a timely manner. For continuously monitored parameters (such as SO 2 or TRS) acquired with a telemetry system, a systems audit starting from the analyzer through to the operator s central computer is undertaken periodically. For non-continuously measured parameters (such as TSP and PM 10 ), in addition to auditing sampler performance, MOE staff audit sample handling and submission protocols and procedures. The MOE s Laboratory Services Branch also participates in these audit activities with respect to the use and performance of private laboratories. As described above the Ministry of the Environment carries out a QA/QC function in ensuring quality of data. The QA/QC program is made-up of two parts: 1) Auditing field samplers to ensure sampling equipment is being maintained and operated as per MOE Operations Manual for Air Quality Monitoring in Ontario, March ) Auditing contract laboratories to ensure analyses are carried out as per MOE Standard Operating Procedures. Ministry of the Environment Provincial Audit Record In 2008 there were a total of 105 individual Provincial audits of SEM continuous and non-continuous air monitoring equipment controlled, serviced and maintained by Rotek Environmental Inc. Of the 105 audits, 100 were certified by the MOE as being acceptable, a 95.2% audit success rate. Number of Provincial Audits Provincial Audit Record Rotek Environmental Inc. Audit Criteria +/- 10% >10 % Absolute Difference from MOE Audit Standard Figure 17 23

24 Appendix 6 HAMN Structure Working Committees: 1) HAMN Steering Committee - a management group comprising of 10 industry members, the Clean Air Hamilton Chair and a representative from the MOE of the Environment. The mandate of this committee is to ensure that both the Ministry and the industrial partners needs are met with regards to their SEM responsibilities. 2) HAMN Technical Working Group - a technical working group to deal with day-to-day issues related to the operation of the air-monitoring network. These committees will provide a continuous line of communication among the Industrial partners, air monitoring network contractor, Clean Air Hamilton, and the MOE. In February, 2003, HAMN acquired the services of an administrator to oversee the SEM project and ensure compliance with MOE requirements and protocols. Technical Working Group Capital Reserve Fund Enhancement / Survey Fund Reporting Feedback Provide Direction Audit Figure 18 24
25 Contacts HAMN Administrator Neil Buonocore HAMN Administrator Hamilton Air Monitoring Network 1227 Barton St East P.O Box Hamilton, ON L8H 2V0 Phone HAMN@cogeco.ca HAMN Steering Committee, Chair Dr. B.E. McCarry Department of Chemistry McMaster University Hamilton, ON, Canada L8S 4M1 Phone Extension Fax mccarry@mcmaster.ca Dr. Brian McCarry, McMaster University, is the Chair of the HAMN Steering Committee. Dr. McCarry is also the Chair of Clean Air Hamilton. Clean Air Hamilton was formed in October, 1998, to promote and support improvements to air quality in the City of Hamilton by reducing emissions that affect human and environmental health. HAMN will continue to provide data in support of Clean Air Hamilton. Network Monitoring and Service Contractor Rotek Environmental Inc. 42 Keefer Court, Unit 2 Hamilton, ON L8E 4V4 Phone Fax rotek@rotekinc.com Web
Table of Contents Listing of Figures and Tables Executive Summary Hamilton Air Monitoring Network Overview 5
 Annual Air Quality Report 2009 Table of Contents Table of Contents... 2 Listing of Figures and Tables... 3 Section 1 Overview Executive Summary... 4 Hamilton Air Monitoring Network Overview 5 HAMN Participating
Hamilton Air Monitoring Network Annual. Air Quality Monitoring Report. Prepared by: Rotek Environmental
 Hamilton Air Monitoring Network 2016 Annual Air Quality Monitoring Report Prepared by: Rotek Environmental Table of Contents Listing of Figures and Tables... 2 Section 1 Overview Executive Summary... 4
PRODUCTS OF COMBUSTION
 PRODUCTS OF COMBUSTION Some of the fuel (hydrocarbon) may not completely burn during combustion and therefore is released into the atmosphere along with the products. The products that are formed during
MacAleese Lane Air Quality Report Monitoring Program
 MacAleese Lane Air Quality Report 2009 Monitoring Program Department of Environment April 2010 MacAleese Lane Air Quality Report 2009 Monitoring Program Introduction In February of 2009, the New Brunswick
Air and Dust Monitoring Summary Report
 Toronto Transit Commission Air and Dust Monitoring Summary Report Monitoring Period: 1 February 28 February 2014 Air quality monitoring is currently ongoing as part of the dust control program associated
Clean Air Hamilton Report. Hamilton Air Quality Health Assessment, 2002
 Slide 1 Annual Progress Report 24/25 Presentation to Planning & Economic Development Committee Brian McCarry, CAH Chair June 6, 26 Slide 2 Clean Air Hamilton Initiated as implementation committee to act
Pi)P rryps nkii^w^ 1995 AIR QUALITY DATA SUMMARY CITY OF NANTICOKE OCTOBER Ministry of. Ont3riO. and Energy
P rryps nkii^w^ 1995 AIR QUALITY DATA SUMMARY CITY OF NANTICOKE OCTOBER Ministry of. Ont3riO. and Energy") Pi)P rryps nkii^w^ 1995 AIR QUALITY DATA SUMMARY CITY OF NANTICOKE OCTOBER 1996 Ont3riO Ministry of and Energy ISSN 1192-3644 1995 AIR QUALITY DATA SUMMARY CITY OF NANTICOKE NOVEMBER 1996 Cade publication
Pi)P rryps nkii^w^ 1995 AIR QUALITY DATA SUMMARY CITY OF NANTICOKE OCTOBER 1996 Ont3riO Ministry of and Energy ISSN 1192-3644 1995 AIR QUALITY DATA SUMMARY CITY OF NANTICOKE NOVEMBER 1996 Cade publication
Air Quality Monitoring
 Air Quality Monitoring in the vicinity of a CNRL well blowout February 25, 2010 to March 9, 2010 Summary report Overview All monitoring sites were downwind of the Canadian Natural Resources Limited (CNRL)
Annual. Ambient Air Monitoring Report. Goldcorp Canada Ltd. Porcupine Gold Mines Hollinger Open Pit
 Annual 2017 Ambient Air Monitoring Report Goldcorp Canada Ltd. Porcupine Gold Mines Hollinger Open Pit Report prepared by Rotek Environmental Inc., 15 Keefer Court, Hamilton Ontario, L8E 4V4, 905 573 9533
2012 Sulfur Dioxide Summary
 2012 Sulfur Dioxide Summary New Jersey Department of Environmental Protection NATURE AND SOURCES Sulfur dioxide (SO 2 ) is a heavy, colorless gas with a suffocating odor that easily dissolves in water
Clean Air Act of 1970
 Clean Air Act of 1970 Set National Ambient Air Quality Standards (NAAQS), to protect public health and welfare Set New Source Performance Standards (NSPS), that strictly regulated emissions of a new source
2016 Nitrogen Dioxide Summary
 2016 Nitrogen Dioxide Summary New Jersey Department of Environmental Protection SOURCES Nitrogen dioxide (NO2) is a reddish-brown highly reactive gas that is formed in the air through the oxidation of
Delta Air Quality Monitoring Study June 2004 March 2006
 Delta Air Quality Monitoring Study June 2004 March 2006 Air Quality Policy and Management Division Policy and Planning Department Greater Vancouver Regional District: August, 2006 Table of Contents Executive
2005 Environmental Survey
 25 Environmental Survey December 26 Reported by Ed Cocchiarella Chair, HIEA Technical Committee Bill Gair Chair, HIEA Communications Committee Page 1 of 22 1. Table of Contents 1. Table of Contents...
2004 Environmental Survey
 24 Environmental Survey February, 26 Reported by Ed Cocchiarella Chair, HIEA Technical Committee Bill Gair Chair, HIEA Communications Committee Page 1 of 22 1. Table of Contents 1. TABLE OF CONTENTS...2
2010 Sulfur Dioxide Summary
 2010 Sulfur Dioxide Summary New Jersey Department of Environmental Protection NATURE AND SOURCES Sulfur dioxide (SO 2 ) is a heavy, colorless gas with a suffocating odor that easily dissolves in water
Spokane Regional Clean Air Agency Air Quality Report - January 2012
 Spokane Regional Clean Air Agency Air Quality Report - January 2012 Air quality in January varied as weather systems moved through the region at regular intervals. Storms on January 5, 10 and 14 helped
i y''\i> ^--icxb 1993 AIR QUALITY DATA SUMMARY CITY OF NANTICOKE NOVEMBER 1994 Ministry of Ontario Environment and Energy
 i y''\i> ^--icxb 1993 AIR QUALITY DATA SUMMARY CITY OF NANTICOKE NOVEMBER 1994 Ontario Ministry of Environment and Energy ISSN 1192-3644 1993 AIR QUALITY DATA SUMMARY CITY OF NANTICOKE NOVEMBER 1994 Cette
CHAPTER 2 - Air Quality Trends and Comparisons
 CHAPTER 2 - Air Quality Trends and Comparisons Particulate Sampling Total Suspended Particulate Matter With the monitoring for PM 2.5 particulate matter being labor intensive, DEP reduced the number of
Ambient Air Monitoring. Wexford. 10 th March st March 2006
 Ambient Air Monitoring In Wexford 10 th March 2005 31 st March 2006 Contents Summary....... 3 Introduction........ 4 Time Period........ 5 Siting......... 5 Monitoring Methods....... 6 Results.........
Introduction. Fluvial Geomorphology Hydrogeology. to minimize the consumption of paper resources.
 Duffins Creek and Carruthers Creek State of the Watershed Reports Air Quality June 2002 Other topics in this series for both the Duffins Creek and the Carruthers Creek include: Introduction Study Area
2006 Sulfur Dioxide Summary
 2006 Sulfur Dioxide Summary New Jersey Department of Environmental Protection NATURE AND SOURCES Sulfur dioxide (SO 2 ) is a heavy, colorless gas with a suffocating odor that easily dissolves in water
Ambient Air Monitoring
 Ambient Air Monitoring At Shannon, Co. Clare 15 th March 2011 18 th July 2012 Contents Summary........ 3 Introduction........ 4 Time Period........ 5 Siting......... 5 Monitoring Methods....... 6 Results.........
Air and Dust Monitoring Summary Report
 Toronto Transit Commission Air and Dust Monitoring Summary Report Monitoring Period: 1 May 31 May 2015 Air quality monitoring is currently ongoing as part of the dust control program associated with the
Transfield Services Limited
 Eastlink Ambient Air Quality Monitoring NATA Accreditation No: 14184 Eastlink Ambient Air Quality Monitoring System Report 1 st June 2010 30 th June 2010 Report issue date: 15 th July 2010 Maintenance
Atholville Air Quality Report Mobile Air Quality Monitoring Program
 Atholville Air Quality Report 2011 Mobile Air Quality Monitoring Program Department of Environment and Local Government June 2012 1.0 Executive Summary The AV Cell Pulp Mill operates two air quality monitoring
GE 2211 Environmental Science and Engineering Unit III Air Pollution. M. Subramanian
 GE 2211 Environmental Science and Engineering Unit III Air Pollution M. Subramanian Assistant Professor Department of Chemical Engineering Sri Sivasubramaniya Nadar College of Engineering Kalavakkam 603
SUBJECT: Background Ambient Air Quality for Gardiner Expressway and Lakeshore Boulevard Reconfiguration
 MEMO TO: FROM: Jeffrey Dea Project Manager, City of Toronto Hong Liu, Ravi Mahabir CC: n/a DATE: August 22 nd, 2013 SUBJECT: Background Ambient Air Quality for Gardiner Expressway and Lakeshore Boulevard
Ambient Air Monitoring. Bray. 21st October th May 2006
 Ambient Air Monitoring In Bray 21st October 2005 10th May 2006 Contents Summary....... 3 Introduction........ 4 Time Period........ 5 Siting......... 5 Monitoring Methods....... 6 Results......... 8 Carbon
RESEARCH, TESTING AND DEVELOPMENT SUSTAINABILITY DEPARTMENT EZAMOKUHLE AIR QUALITY MONTHLY REPORT FEBRUARY 2017
 EXECUTIVE SUMMARY RESEARCH, TESTING AND DEVELOPMENT SUSTAINABILITY DEPARTMENT EZAMOKUHLE AIR QUALITY MONTHLY REPORT FEBRUARY 2017 This monthly report covers the ambient air quality data as monitored at
The Threat of Air Pollution
 Chapter 13: Air Pollution The Atmosphere: An Introduction to Meteorology, 12 th Lutgens Tarbuck Lectures by: Heather Gallacher, Cleveland State University The Threat of Air Pollution The Threat of Air
Ambient Air Quality Monitoring Update, Kirby Misperton A Wellsite, KM8 Production Well
 Ambient Air Quality Monitoring Update, Kirby Misperton A Wellsite, KM8 Production Well. Prepared for: Third Energy UK Gas Ltd. Document Control Page Client Third Energy UK Gas Ltd. Document Title Ambient
Air Pollution Sources Overview. Amy Roberts, Division Manager January 24, 2019
 Air Pollution Sources Overview Amy Roberts, Division Manager January 24, 2019 Types of Air Pollutants Criteria Pollutants Particulate Matter Nitrogen Dioxide Ozone Carbon Monoxide Lead Sulfur Dioxide Air
Report to the Canadian Council of Ministers of the Environment: An Update in Support of the Canada-wide Standards for Particulate Matter and Ozone
 Report to the Canadian Council of Ministers of the Environment: An Update in Support of the Canada-wide Standards for Particulate Matter and Ozone Prepared by the Joint Action Implementation Coordinating
Major Air Pollutants
 Major Air Pollutants 1 Particulate Matter Particulate refers to all substances that are not gases. It can be suspended droplets / solid particles / mixture of two. Size: 100 µm to 0.1 µm and less. Particulates
Lecture 4 Air Pollution: Particulates METR113/ENVS113 SPRING 2011 MARCH 15, 2011
 Lecture 4 Air Pollution: Particulates METR113/ENVS113 SPRING 2011 MARCH 15, 2011 Reading (Books on Course Reserve) Jacobson, Chapter 5, Chapter 8.1.9 Turco, Chapter 6.5, Chapter 9.4 Web links in following
Ambient Air Monitoring
 Ambient Air Monitoring At Newbridge, Co. Kildare 1 st October 2009 24 th May 2010 Contents Summary........ 3 Introduction........ 4 Time Period........ 5 Siting......... 5 Monitoring Methods....... 6 Results.........
SHUDDA GAALI. #StopSmokyVehicles. Assessing the Air Quality of Mangaluru City. December 2016
 SHUDDA GAALI #StopSmokyVehicles Assessing the Air Quality of Mangaluru City December 2016 An Initiative taken by APD Foundation in association with St. George s Homeopathy, Padil, Mangaluru 1. AIR POLLUTION:
10. Air Pollution. Air pollution. policy issue indicator assessment. - - urban air quality exceedances for particulates
 Air pollution 73 1. Air Pollution policy issue indicator assessment human health: protecting the population against pollution exposures urban air quality exceedances for ground-level ozone - - urban air
Copper Cliff Smelter Complex
 December 2013 Toxic Reduction Plan Summaries Copper Cliff Smelter Complex Carbon monoxide Sulphur dioxide Particulate Matter (TSP, PM10, PM2.5) Nitrogen oxides VOCs Toxic Substance Reduction Plan Summaries
2015 Sulfur Dioxide Summary
 2015 Sulfur Dioxide Summary New Jersey Department of Environmental Protection SOURCES Sulfur dioxide (SO2) is a heavy, colorless gas with a suffocating odor that easily dissolves in water to form sulfuric
2012 Nitrogen Dioxide Summary
 2012 Nitrogen Dioxide Summary New Jersey Department of Environmental Protection NATURE AND SOURCES Nitrogen Dioxide (NO 2 ) is a reddishbrown, highly reactive gas that is formed in the air through the
Air Quality Monitoring in the vicinity of Gatwick Airport: a proposal for future air quality reporting to the GP Sub Committee.
 Air Quality Monitoring in the vicinity of Gatwick Airport: a proposal for future air quality reporting to the GP Sub Committee. 1. The purpose of this paper is to outline the proposed future format of
Fraser Valley Regional District Highlights of Air Quality and Emissions Trends ( )
") Fraser Valley Regional District Highlights of Air Quality and Emissions Trends (199-213) May 215 Table of Contents List of Figures... 2 Purpose... 3 Summary... 3 Background... 3 Criteria Air Contaminants...
Fraser Valley Regional District Highlights of Air Quality and Emissions Trends (199-213) May 215 Table of Contents List of Figures... 2 Purpose... 3 Summary... 3 Background... 3 Criteria Air Contaminants...
Cumulative Health Impact Assessment of Air Quality in Wards 30 and 32
 STAFF REPORT ACTION REQUIRED Cumulative Health Impact Assessment of Air Quality in Wards 30 and 32 Date: February 10, 2012 To: From: Board of Health Medical Officer of Health Wards: 5, 6, 30, and 32 Reference
Northwest Territories Air Quality Report
 Northwest Territories Air Quality Report 2014 Table of Contents Introduction... 1 Operations (Network)... 2 Developments in 2014... 6 Future Plans... 7 NWT Air Quality Standards... 8 Yellowknife Air Quality...
Example Airshed. Sample 2018 Annual Ambient Air Quality Monitoring Report
 Example Airshed Sample 2018 Annual Ambient Air Quality Monitoring Report 29 March 2019 DISCLAIMER: This sample annual report is provided as guidance only. The structure, look and layout of monthly and
What we do. About our facility. About Weir. Why what we do is important
 What we do About Weir About our facility Why what we do is important Weir Canada has been operating in Metro Vancouver since 2013 when we acquired the long established R. Wales Company. We are a leading
Criteria Pollutants. Sulfur Dioxide (SO 2 ) Nitrogen Oxides (NOx)
 Nitrogen Oxides (NOx)") 1) Sulfur dioxide 2) Nitrogen oxides 3) Carbon monoxide 4) Ozone 5) Particulates 6) Lead Criteria Pollutants Sulfur Dioxide (SO 2 ) SO 2 is a colorless gas that is formed from the combustion of sulfur-containing
1) Sulfur dioxide 2) Nitrogen oxides 3) Carbon monoxide 4) Ozone 5) Particulates 6) Lead Criteria Pollutants Sulfur Dioxide (SO 2 ) SO 2 is a colorless gas that is formed from the combustion of sulfur-containing
Changes to Air Quality
 Changes to Air Quality Identifying how the Detroit River International Crossing (DRIC) study alternatives may change air quality is an important consideration in the DRIC Environmental Assessment. Air
Draft for comments only Not to be cited as East African Standard
 Air quality Specification EAST AFRICAN STANDARD EAST AFRICAN COMMUNITY CD/T/66:2010 ICS 87.040 EAC 2010 First Edition 2010 Foreword Development of the East African Standards has been necessitated by the
Clean Air Hamilton. Initiated as implementation committee to act on recommendations in 1997 HAQI Reports. Community-based initiatives directed at:
 AIR QUALITY PROGRESS REPORT 2010 Presentation to HIEA Community Advisory Panel Brian McCarry Chair, Clean Air Hamilton September 8, 2011 Clean Air Hamilton Initiated as implementation committee to act
WestConnex M4-M5 Link Ambient air quality monitoring results
 WestConnex M4-M5 Link Ambient air quality monitoring results June 2017 CONTENTS 1 Introduction: Understanding local air quality... 4 2 Monitoring air quality... 4 3 Monitoring methodology... 5 4 Results...
Spokane Regional Clean Air Agency Air Quality Report - September 2011
 Spokane Regional Clean Air Agency Air Quality Report - September 211 An atmospheric high pressure ridge brought exceptionally warm, sunny and dry weather, light winds and marginal to poor ventilation to
Beachville, Oxford County Particulate Matter Sampling. Contact information:
 Beachville, Oxford County Particulate Matter Sampling Requestor: Request prepared by: Date: 26-Apr-16 Peter Heywood, Manager, Health Protection, Oxford County Public Health James Johnson MPH, Environmental
GLNG PROJECT - ENVIRONMENTAL IMPACT STATEMENT
 6 J:\Jobs\42626220\07 Deliverables\EIS\FINAL for Public Release\6. Values and Management of Impacts\6-8 Air Quality\06 08 Air Quality (Section 6.8) FINAL PUBLIC track.doc GLNG Project - Environmental Impact
2011 Particulate Summary
 2011 Particulate Summary New Jersey Department of Environmental Protection NATURE AND SOURCES Particulate air pollution is a complex mixture of organic and inorganic substances present in the atmosphere
CHAPTER 11. Air Quality and the Transportation Plan
 Chapter 11. Air Quality and the Transportation Plan 159 CHAPTER 11. Air Quality and the Transportation Plan Background Air quality in Anchorage is subject to national ambient air quality standards established
CONSTRUCTION AIR MONITORING SUMMARY REPORT
 CONSTRUCTION AIR MONITORING SUMMARY REPORT MAY 1-31, 2018 VIRGINIA AVENUE TUNNEL RECONSTRUCTION PROJECT WASHINGTON, DC Prepared for: CSX Transportation Prepared by: GHD, Inc. May 2018 1 P age VIRGINIA
Air Quality Monitoring Update
 Air Quality Monitoring Update Background Giant Mine s Air Quality Monitoring Program provides data to ensure that remediation activities at Giant Mine do not cause adverse effects to people or the environment.
Jennings O Donovan & Partners Consulting Engineers Sligo
 8.0 AIR QUALITY 8.1 INTRODUCTION 8.1.1 Background Despite the ongoing deterioration in air quality on a national level due to the reliance on fossil fuel generated energy, Ireland as a whole is relatively
Investigation of Fine Particulate Matter Characteristics and Sources in Edmonton, Alberta
 Investigation of Fine Particulate Matter Characteristics and Sources in Edmonton, Alberta Executive Summary Warren B. Kindzierski, Ph.D., P.Eng. Md. Aynul Bari, Dr.-Ing. 19 November 2015 Executive Summary
Particulate Matter in the Atmosphere
 Particulate Matter in the Atmosphere This monograph, one in a series of single issue documents dealing with Lambton County environment, has been prepared by the Sarnia-Lambton Environmental Association
FABRICATION AND TESTING OF AUTOMOBILE POLLUTANTS ABSORBERS
 International Journal of Mechanical Engineering and Technology (IJMET) Volume 8, Issue 5, May 217, pp. 3 35, Article ID: IJMET_8_5_32 Available online at http://www.iaeme.com/ijmet/issues.asp?jtype=ijmet&vtype=8&itype=5
Internet Publication Plan. For the proposed public website for Metro Vancouver s Waste-to- Energy Facility
 Internet Publication Plan For the proposed public website for Metro Vancouver s Waste-to- Energy Facility June 15, 2017 1.0 Project Description This Internet Publication Plan describes the proposed public
Proposed Guidelines for the Reduction of Nitrogen Oxide Emissions from Natural Gas fuelled Stationary Combustion Turbines
 Proposed Guidelines for the Reduction of Nitrogen Oxide Emissions from Natural Gas fuelled Stationary Combustion Turbines Environment and Climate Change Canada May 2016 Table of Contents 1. Foreword...
Air Quality Monitoring Results 2011
 Air Quality Monitoring Results 2011 HIGHLIGHTS Continuing air quality improvement trends Province-wide achievement of Canada-wide standards Lower benzene levels in Saint John Special Project: Mobile air
12. EMISSIONS OF SULPHUR DIOXIDE
 Air Air quality is to a great extent influenced by combustion of fossil fuels, evaporation of volatile organic compounds and their photochemical reaction with other pollutants in the atmosphere. Pollutants
Ambient Air Monitoring. Kilkenny. 29 th April 2005 to 25 th October 2005
 Ambient Air Monitoring In Kilkenny 29 th April 2005 to 25 th October 2005 Contents Summary........ 3 Introduction........ 4 TimePeriod........ 5 Siting......... 5 Monitoring Methods....... 6 Results.........
Going One Step Beyond in North Denver
 Going One Step Beyond in North Denver A Neighborhood Scale Air Pollution Modeling Assessment Part I : Predicted Mobile Emissions in 2035 Michael Ogletree Denver Environmental Health Purpose To compare
Air quality in the vicinity of a governmental school in Kuwait
 Air Pollution XVI 237 Air quality in the vicinity of a governmental school in Kuwait E. Al-Bassam 1, V. Popov 2 & A. Khan 1 1 Environment and Urban Development Division, Kuwait Institute for Scientific
Ambient Air Quality Monitoring
 Ambient Air Quality Monitoring Ambient Air Quality Division Air Quality and Noise Management Bureau Pollution Control Department 7/31/2012 2:09 PM 1 Carbon Monoxide (CO) Nitrogen Dioxide (NO 2 ) Ozone
Hamilton Works 2016 Annual Toxic Substances Reduction Report (O. Reg. 455/09)
") Hamilton Works 2016 Annual Toxic Substances Reduction Report (O. Reg. 455/09) Issued June 1, 2017 Basic Facility Information Section 1 Facility Information Owner U. S. Steel Canada Inc. Facility name Hamilton
Hamilton Works 2016 Annual Toxic Substances Reduction Report (O. Reg. 455/09) Issued June 1, 2017 Basic Facility Information Section 1 Facility Information Owner U. S. Steel Canada Inc. Facility name Hamilton
APPENDIX 3B AIR QUALITY MONITORING DATA
 APPENDIX 3B AIR QUALITY MONITORING DATA 2017 Annual Review Wilpinjong Coal Mine Appendix 3B Air Quality Monitoring Data Summary of Annual Average Dust Deposition EPL 12425 ID No. 3 4-6 - 9 10 11 12 26
Copper Cliff Nickel Refinery Complex
 December 2013 Toxic Reduction Plan Summaries Copper Cliff Nickel Refinery Complex Carbon monoxide Iron pentacarbonyl Particulate matter (TSP, PM10, PM2.5) Nitrogen oxides Sulphur dioxide Toxic Substance
1. The layer that contains most of the mass of the atmosphere is the. A. Stratosphere B. Troposphere C. Mesosphere D. Exosphere
 1. The layer that contains most of the mass of the atmosphere is the A. Stratosphere B. Troposphere C. Mesosphere D. Exosphere 2. Which of the following is a secondary pollutant? A. H 2 SO 4 B. O 3 C.
Twomile Ecological Restoration Project Air Quality Report Anna Payne, Mi-Wok District Fuels Specialists August 2011
 Twomile Ecological Restoration Project Air Quality Report Anna Payne, Mi-Wok District Fuels Specialists August 2011 The National Environmental Policy Act (NEPA), the Federal Clean Air Act, and California
The Evolution of Air Emissions Inventories in Ontario, Canada
 The Evolution of Air Emissions Inventories in Ontario, Canada John Georgakopoulos, Peter Wong and Nicholas Ting Ontario Ministry of the Environment, Environmental Monitoring and Reporting Branch, 125 Resources
Air Quality Statistics
 Manual on the Basic Set of Environment Statistics of the FDES 2013 Air Quality Statistics Topic 1.3.1 of the Basic Set of Environment Statistics of the FDES 2013 Álvaro Shee Smith (ashee@mma.gob.cl) Ministry
Frumkin, 2e Part Three: Environmental Health on the Regional Scale. Chapter 12: Air Pollution
 Frumkin, 2e Part Three: Environmental Health on the Regional Scale Chapter 12: Air Pollution History of Air Pollution Since human beings discovered fire, they began to pollute the air. At first, air pollution
Exceedance of air quality standards
 Air quality in Europe (and particularly in the large urban areas) has improved in recent decades. However, it is estimated that in nearly all EU urban citizens were exposed to air pollution levels exceeding
February/March 2015 Air Quality Report Burma Road Site
 February/March 2015 Air Quality Report Burma Road Site Attached is a technical summary of air quality data for February/March 2015 at the Burma Road cleanup site submitted by PPG Industries air monitoring
Ministry for the Environment. GEMS Air Monitoring Program Annual Report 2002
 Ministry for the Environment GEMS Air Monitoring Program Annual Report 22 Prepared for Ministry for the Environment By Laboratory Services - Air Quality Department March 23 AQ4 GEMS AIR MONITORING PROGRAM
Statistics for Quality Assurance of Ambient Air Monitoring Data
 Statistics for Quality Assurance of Ambient Air Monitoring Data Prepared by Will Shuart, M.S. For the Mid-Atlantic Regional Air Management Association And the U.S. Environmental Protection Agency With
RULES OF TENNESSEE DEPARTMENT OF ENVIRONMENT AND CONSERVATION BUREAU OF ENVIRONMENT DIVISION OF AIR POLLUTION CONTROL
 RULES OF TENNESSEE DEPARTMENT OF ENVIRONMENT AND CONSERVATION BUREAU OF ENVIRONMENT DIVISION OF AIR POLLUTION CONTROL CHAPTER 1200-3-15 EMERGENCY EPISODE PLAN TABLE OF CONTENTS 1200-3-15-.01 Purpose 1200-3-15-.03
Spokane Regional Clean Air Agency Air Quality Report - July 2014
 Spokane Regional Clean Air Agency Air Quality Report - July 2014 July and August are the hottest and driest months in the Pacific Northwest and, in addition to September, are the most active in terms of
January 2019 Our Ref: RE: Air Quality Impact Assessment - Major Mackenzie Drive EA, Highway 400 to Jane Street
 January 2019 Our Ref: 476323 RE: Air Quality Impact Assessment - Major Mackenzie Drive EA, Highway 400 to Jane Street As a supplementary document to the Air Quality Impact Assessment for the Major Mackenzie
CANADA-WIDE STANDARDS FOR PM & OZONE STATUS OF JURISDICTIONAL IMPLEMENTATION ACTIVITIES MANITOBA
 CANADA-WIDE STANDARDS FOR PM & OZONE STATUS OF JURISDICTIONAL IMPLEMENTATION ACTIVITIES MANITOBA I. INTRODUCTION Manitoba has only one Census Metropolitan Area (CMA) (i.e., Winnipeg with 6% of Manitoba
Northwest Territories Air Quality Report 2012
 Northwest Territories Air Quality Report 212 TABLE OF CONTENTS Introduction...3 Operations (Network...4 Developments in 212...8 Future Plans...9 NWT Air Quality Standards...1 Yellowknife Air Quality...12
2010 AIR POLLUTION CONTROL
 1 AIR POLLUTION CONTROL Monitoring Report for Lake and Geauga Counties Lake County General Health District 33 Mill Street Painesville, Ohio 4477 Table of Contents INTRODUCTION... 1 STATE AND FEDERAL AIR
Introduction. Facts. Key Words. Sulphur Dioxide (SO 2 ), Air Quality In Lambton County:
, Air Quality In Lambton County:") onitoring Air Quality in Lambton County This monograph, one in a series of single issue documents dealing with Lambton County environment, has been prepared by the Sarnia-Lambton Environmental Association
onitoring Air Quality in Lambton County This monograph, one in a series of single issue documents dealing with Lambton County environment, has been prepared by the Sarnia-Lambton Environmental Association
2016 Environment Management System & Community Engagement Report
 2016 Environment Management System & Community Engagement Report March 28, 2017 3 Table of Contents Summary 1. Background 2. Communications and Community Engagement 3. Community Air Quality Monitoring
Excerpt of Thermal Power Guidelines for New Plants
 Excerpt of Thermal Power Guidelines for New Plants The following is an excerpt of the Thermal Power guidelines for New Plants, a complete version of which is found in the Pollution Prevention and Abatement
QUARTERLY REPORT JAN-MAR
 QUARTERLY REPORT JAN-MAR 17 01 INTRODUCTION The Environment Agency - Abu Dhabi (EAD) publishes quarterly reports to present the status of air quality during three-month periods as it is monitored around
Cockburn Cement Limited. Summary of stack emission and ground level concentration data. September 2010
 Cockburn Cement Limited Summary of stack emission and ground level concentration data September 2010 THIS REPORT CONTAINS INFORMATION EXTRACTED FROM THE KATESTONE ENVIRONMENTAL AIR QUALITY IMPACT ASSESSMENT
WestConnex M4-M5 Link Ambient air quality monitoring results
 WestConnex M4-M5 Link Ambient air quality monitoring results July 2017 CONTENTS 1 Introduction: Understanding local air quality... 4 2 Monitoring air quality... 4 3 Monitoring methodology... 5 4 Results...
BOUNDARY AIR MONITORING PLAN POT 1881 REVISION 0
 POT 1881 REVISION 0 BOUNDARY AIR MONITORING PLAN Port of Townsville Limited, on behalf of Glencore, Northern Stevedoring Services, South 32 and Flinders TBSH Pty Ltd. POT 1881 CONTENTS 1 Introduction...
FACILITY PROFILE. New Brunswick Power Corporation for the Belledune Thermal Generating Station
 FACILITY PROFILE New Brunswick Power Corporation for the Belledune Thermal Generating Station Prepared by: Industrial Processes Section, Impact Management Branch Department of Environment and Local Government
Ambient Air Quality Monitoring Baseline Report, Kirby Misperton A Wellsite, KM8 Production Well
 Ambient Air Quality Monitoring Baseline Report, Kirby Misperton A Wellsite, KM8 Production Well. Prepared for: Third Energy UK Gas Ltd. Document Control Page Client Third Energy UK Gas Ltd. Document Title
2016 Particulate Matter Summary
 216 Particulate Matter Summary New Jersey Department of Environmental Protection SOURCES Particulate air pollution is a complex mixture of organic and inorganic substances in the atmosphere, present as