PEO Report No Evaluation Study on Rajiv Gandhi National Drinking Water Mission (RGNDWM)
|
|
|
- Merilyn Hawkins
- 6 years ago
- Views:
Transcription

1
2
 Programme")
3 PEO Report No. 213 Evaluation Study on Rajiv Gandhi National Drinking Water Mission (RGNDWM) Programme Evaluation Organisation Planning Commission Government of India New Delhi November, 2010
4
5 Foreword The Central Government introduced a variety of policies and programs throughout the Five Year Plans to address the issue of drinking water. The first ever national water supply and sanitation program was introduced during as part of the Government health plan. The states gradually built up the Public Health Engineering Department (PHED) to tackle the problem of rural water supply and sanitation. In spite of this, it was found during the mid-1960s that majority of the schemes were being implemented in the easily accessible villages, neglecting remote villages with severe water scarcity. The Central Government requested the States to identify these problem villages and make special plan for them. The first major push to rural water supply came with the Accelerated Rural Water Supply Programme (ARWSP) in the 1970s, which gave full grant to the State Governments for implementing water supply schemes in problem villages. By March 1981, the coverage of rural water supply was 30.8 per cent. Following the International Drinking Water Supply & Sanitation Decade (IDWSSD ), the second major push came with the launching of the National Drinking Water Mission (NDWM) that was later renamed as Rajiv Gandhi National Drinking Water Mission (RGNDWM). The Mission issued comprehensive guidelines for ARWSP (1986), helped formulate National Water Policies (1987 and 2002) and introduced the sector Reform Project (SRP) in The focus of the RGNDWM was to adopt a community based demand-driven approach instead of the hitherto government forced supply driven approach. In doing so, the projects under RGNDWM are basically oriented towards community participation with a part (minimum of 10%) of the capital cost required to be borne by the community themselves. The balance amount is contributed by the Central Government. In order to accomplish the envisaged objective of any scheme/programme, it is essential to put in place a mechanism for regular monitoring and evaluation at recurrently close intervals. In keeping with the importance of the mission, a comprehensive evaluation study of RGNDWM was initiated by the Programme Evaluation Organization. Among the 5 selected states, Himachal Pradesh stands out as unique in the sense that almost all women (96%) have asserted their increased participation in the community activities. As regards the program's impact on children, an overwhelming majority of women(89%) have reported that on account of improved water supply(easier access and adequate availability), children have now more time set apart for study and
6

7 play, earlier devoted to helping them collect water. Overall, an overwhelming majority (96%) of the households have reported increased usage of water. Government accords great importance to the objective of measuring outcomes so as to ensure that policies serve the purposes for which they were adopted. The role of the Programme Evaluation Organisation (PEO) is crucial in undertaking systematic studies to assess the degree of the effectiveness of programmes, primarily as an input to future policy. Evidence of sub-optimality suggests the need to draw lessons from observed weaknesses and redesign programmes accordingly. The Planning Commission proposes to strengthen this aspect of its activity in the years ahead. November 18, 2010
8
9 CONTENTS Executive Summary 1. Introduction Background Rajiv Gandhi National Drinking Water Mission Critical Issues Objectives of the Study Methodology Sampling Plan Information Gathering Training of Research Team Members Scheme of Data Analysis Computation of Sustainability Index Summary of Fieldwork Physical & Financial Progress Physical Progress Financial Progress Respondents Profile Household Survey Respondents Profile Household Survey Access to Safe Drinking Water Access to Safe Drinking Water Parameters of Access to Drinking Water Moving towards Tapped Water Supply Alternate Sources of Drinking Water Water Quality Water Quality Operation & Maintenance Functional Water Sources Responsibility of O&M Role of GPs in O&M of Water Supply System Problems faced by Gram Panchayats Water Tariff Water Tariff Setting-up Water Tariff Responsibility, Basis & Community Consultation Adequacy of Water Tariff in Meeting the O&M Cost... 40
10 9. Community Participation/Existence of VWSC Community Participation/Existence of VWSC Knowledge, Practice and IEC on Hygiene & Sanitation Exposure to Awareness Campaigns Details of Awareness Campaigns Source of Information on Safe Drinking Water Training of VWSC Members/Teachers on Hygiene Education Awareness about Diseases Caused by Unhygienic Conditions Availability of Toilets Practice of Open Defecation Garbage Collection & Disposal in Habitations Cleanliness around the Water Sources Program Benefits/Impact on Rural Population Increased Availability of Water Increased Functional Water Sources/Reduced Breakdowns Improvement in Environmental Sanitation Reduction in Water Borne Diseases Improvement in Women s Conditions Utilization of Time Saved Improvement in Overall Health Status Overall Performance of Water Sources Sustainability Composite Sustainability Index Aspects-wise Overall Sustainability Index Rain Water Harvesting Structure Major Findings Status of Fully Covered Habitations Access to Safe Drinking Water Water Quality Operation & Maintenance Water Tariff Community Participation/Existence of VWSC Knowledge, Practice and IEC on Hygiene & Sanitation Program Benefits/Impact on Rural Population Sustainability Recommendations Project Team... 76
11 Preface The national goal of achieving universal access of the mammoth rural population to adequate potable drinking water at a convenient location at all times is a daunting task. The major challenge is the availability of drinking water, both in term of adequacy and quality on a sustainable basis. The Government has undertaken various programs since independence to provide safe drinking water to the rural masses. Taking into account the magnitude of the possibilities, the Central Government, in an effort to deal the issues in a mission mode, launched in 1986, National Drinking Water Mission, later renamed as Rajiv Gandhi National Drinking Water Mission (RGNDWM) in The Government is committed to ensure that the village communities have access to safe and reliable water supply and it is evident from the fact that since the beginning of the planned era of development, huge investment of about Rs. 72,600 crore has been made in the rural water supply sector under both State and Central Plans up to In view of the importance of the Mission, the Programme Evaluation Organisation (PEO) of Planning Commission was entrusted to conduct an evaluation study on RGNDWM to assess the processes involved during implementation and the overall impact of the mission of the rural population. Government accords great importance to the objective of measuring outcomes so as to ensure that policies are producing the desired results. The PEO provides a key input into this process by undertaking systematic evaluation studies, primarily to draw lessons that can be applied to ensure effectiveness of the future policy and programs. The present evaluation study covered 240 habitations spread over 10 sample districts across five geographically representative study states and looked at the extent of coverage, access and the overall impact of the Mission on the rural habitations, especially on women. The supply of safe drinking water and provision of sanitation are the two most important contributing factors for improving the health of the people in the country. The main findings of this evaluation study on the basis of drawn samples are: 93% of the rural population at present has access to safe drinking water in the covered states. 66% of the households having access to safe drinking water source are getting round the year supply of drinking water. It is encouraging to note that an overwhelming majority of the households (93%) have reported their satisfaction with the water quality. 70% of the handpumps and 91% of the tapped water supply sources in the sample villages were functional as reported by the respondents during the field investigation. 87% of the households have reported to be paying the water charges on a regular basis and 95% of the households have expressed their satisfaction with regard to
12 the water charges paid by them vis-a-vis the quantity/quality received by them in the covered states. Most of the households mentioned about non-existence of Village Water and Sanitation Committee (VWSC) in their area. 74% of the households have reported that the programme has a positive impact in terms of environmental sanitation. 75% respondents have conveyed that the workload on women has reduced drastically due to the implementation of the programme. 89% of the women have also reported that the children are getting more time for studying instead of helping them in collecting water from the natural sources. The study also brought some important suggestions for better functioning of the programme. These are: The Village Water and Sanitation Committees (VWSCs) are required to be revitalized and made functional. The PRI members should be provided adequate training for their active involvement in the implementation of the Programme. Awareness programmes with regard to the Mission should be organised on regular basis in the remote villages for its success. The study received constant support and encouragement from Honourable Deputy Chairman, Planning Commission and Member-Secretary, Planning Commission. The study was outsourced to M/s AMS Consulting Pvt. Ltd. Lucknow. I extend my thanks to the Director and other associates of the Institute for conducting the field study and preparing the study report. The study was designed and conducted under the direction of Dr. R.C. Dey, Director, PEO with the assistance of Ms. Krishna Veni Motha, the then Consultant, Shri L.N. Meena and Shri Vipin Kumar, Economic Officers of PEO. The report is finalized and brought to the present shape under my supervision. The help and co-ordination received from all concerned for preparation of the report is gratefully acknowledged. New Delhi Dated: November, 2010 (Ratna A. Jena) Adviser (PEO)
13 List of Tables Table-3.1 : Comparative Habitation Coverage 2003 Vs Table-4.1 : Gender Profile Table-4.2 : Educational Profile of the Household Survey Respondents Table-5.1 : State-wise Access to Safe/Unsafe Drinking Water Sources Pre-2003 & Present Status Table-5.2 : Access to Safe/Unsafe Drinking Water Sources in Least & Most Affected Areas Pre-2003 & Present Status Table-5.3 : % Households Receiving Safe and Round-the-Year Supply of Water Table-5.4 : % Households Receiving Safe, Round-the-Year and Sufficient Quantity of Water Table-5.5 : % Households having Access to Drinking Water Sources within or beyond 1.6 kms Table-5.6 : Average Time Spent per day by Households in Collecting Drinking Water 22 (Minutes)... Table-5.7 : % Households Reporting No Discrimination in Access to Drinking Water Source Table-5.8 : State-wise Break-up of Safe Water Sources Pre-2003 & Present Status Table-5.9 : % Households having Access to Safe/Unsafe Alternate Water Sources Table-6.1 : % Households Satisfied with the Water Quality of Main Source Table-6.2 : % Households Satisfied with the Water Quality of Alternate Source Table-6.3 : Gram Panchayats Reporting the Provision of Field Testing Kit Table-6.4 : Testing of Water Sources in Habitations by Technical Personal Table-6.5 : Efforts made by GP/VWSC to Maintain Water Quality of Sources Table-6.6 : Training received by Grassroot Workers in GP Table-6.7 : Training received by Women in GP Table-7.1 : Responsibility of O&M Households Views Table-7.2 : Households Willing to Pay for O&M Table-7.3 : Capability of GPs to take-up O&M Table-7.4 : Formal Handing Over of O&M to GPs Table-7.5 : Responsibility of O&M Present Status Table-8.1 : Tap Connections in GPs Table-8.2 : Households Paying Water Charges Regularly Table-8.3 : Average Monthly Charges per Household Table-8.4 : Average Installation Charge per Household... 39
14 Table-8.5 : Households Saying Water Charges Affordable Table-8.6 : Households Satisfied with Water Charges Table-8.7 : GPs where Community was Consulted on Water Tariff Table-9.1 : Awareness about Existence of Any Group in Village/Habitation Table-9.2 : Households Reporting Membership Table-9.3 : Member Households Participating in Meetings Table-9.4 : Women s Representation in Committee/Group Table-9.5 : Gram Panchayats having VWSC Table-10.1 : Gram Panchayats, Habitations and Households Reporting Campaigns on Water, Sanitation & Hygiene Table-10.2 : % Population in GP Attending Campaign Table-10.3 : IPC on Safe Drinking Water Table-10.4 : Households visits by ASHA/AWW/Others in the past One Month for Water Sanitation & Hygiene Info Table-10.5 : Main Source of Information on Personal & Household Hygiene Table-10.6 : Training on Hygiene Education Table-10.7 : Awareness about Diseases Caused by Unhygienic Conditions Table-10.8 : Details of Diseases due to Unhygienic Conditions As Reported by Households Table-10.9 : Availability of Toilets in Households Table-10.10: Habitations Free from Open Defecation Table-10.11: Existence of Functional Mechanism for Garbage Collection & Disposal Table-10.12: Cleanliness around the Water Sources Table-10.13: Responsibility of Cleaning the Water Sources in Habitations Table-11.1 : Water Usage at Household Table-11.2 : Improvement in Environmental Sanitation Table-11.3 : Reduced Workload of Women Table-11.4 : Women Experiencing Reduced Fatigue Table-11.5 : Increased Women s Participation in Community Activities Table-11.6 : Utilization of Time Saved in Various Activities Table-11.7 : Improvement in Overall Health Status of the Family Table-12.1 : GPs Reporting Rain Water Harvesting Structure Table-12.2 : Habitations Reporting Rain Water Harvesting Structure... 62
15 List of Charts Chart-3.1 : Proportion of Fully Covered Habitations (2003 Vs 2009) Chart-4.1 : Social Caste-wise Profile Chart-4.2 : Type of House Chart-5.1 : Access to Safe Water Sources Comparison of Pre-2003 & Present Status. 18 Chart-5.2 : Access to Safe Water Sources in Least/Most Affected Areas Pre-2003 & Present Status Chart-5.3 : Access to Safe, Round-the-Year & Sufficient Water Supply By State Chart-5.4 : Comparison of Fully Covered Status State-level Data Vs Hhd Survey Chart-5.5 : Access to Tap Water Comparison of Pre-2003 & Present Status Chart-5.6 : Reasons for Using Alternate Sources Chart-6.1 : % Households Satisfied with Water Quality Chart-6.2 : Provision of Field Testing Kit Chart-6.3 : Testing of Water Sources Chart-7.1 : Breakdowns of Tapped Supply in Past One Year Chart-7.2 : Responsibility of Repairs Chart-10.1 : Use of Various Media in Campaign (44 GPs) Chart-10.2 : Diseases from Unhygienic Conditions Chart-10.3 : Platforms & Drains around Water Sources Chart-11.1 : Utilization of Time Saved Chart-11.2 : Overall Performance of Water Sources As Reported by Households.. 56 Chart-12.1 : State-wise Composite Sustainability Index Chart-12.2 : State-wise Sustainability Index Technological Aspects Chart-12.3 : State-wise Sustainability Index Community & Social Aspects Chart-12.4 : State-wise Sustainability Index Financial Aspects Chart-12.5 : State-wise Sustainability Index Water Quality Chart-12.6 : State-wise Sustainability Index Training Chart-12.7 : Aspects -wise Overall Sustainability Index... 61
16 Executive Summary 1. Background Meeting the drinking water needs of 700 million rural population settled in about 1.42 million habitations spread over 15 diverse ecological regions can be a daunting task. The major challenge in the Rural Water Supply sector is the availability of drinking water, both in term of adequacy and quality on a sustainable basis. Despite collective effort of the State and Central Governments and huge investment of about Rs 72,600 crore in the rural water supply sector, the national goal of providing adequate potable drinking water to the rural community at a convenient location at all times is yet to be achieved. 2. Study Objectives i. Assess the extent of coverage and access to improved services in the rural areas; ii. Assess the institutional arrangements placed by the State Governments for implementation and performance of the mission; iii. Evaluate the overall impact of the mission on the rural habitations, especially on women in terms of access to improved water services and awareness; iv. Identify the measures adopted for ensuring the sustainability of the surface water and ground water sources and constraints there-upon; v. Assess the role of the stakeholders at various levels in creating awareness about water and sanitation among the beneficiaries; and vi. Document the major achievements in rural water services under Evaluation Study on Rajiv Gandhi National Drinking Water Mission (RGNDWM). 3. Sampling Plan Sampling of the 5 study states and 10 districts was done by the Planning Commission. Two blocks in each sample district were selected based on the largest number of completed schemes. In each block, 3 Gram Panchayats and from each Gram Panchayat, 4 habitations were selected. For the purpose of impact assessment, 6 households were selected from each sample habitation giving adequate representation to the various socio-economic categories. Thus, a total of 1440 households were covered from 240 habitations in 60 Gram Panchayats spread over 20 blocks of the 10 sample districts across 5 study states. The study schedules for various stakeholders containing a judicious mix of questions seeking quantitative and qualitative information were developed and supplied by the Planning Commission. 4. Major Findings Status of Fully Covered Habitations: As per the official records, between the period 2003 and 2009, there has been a significant increase in the proportion of fully i
17 covered (FC) habitations in all the 5 study states (14 to 62 percentage points). Presently, the fully covered habitations in these states are found to be in the range of 75% to 95%. Access to Safe Drinking Water There has been a tremendous improvement in the rural populations access to safe drinking water sources between the pre-2003 and the present period across all the 5 states. Overall, 5 states combined, over nine-tenth (93%) of the rural population at present has access to safe drinking water sources; the improvement of 32 percentage points is a reflection of the commendable progress made under the Mission. With the advent of the Mission, the situation in the most affected areas has improved to a point where the proportions of the households in least and most affected areas having access to safe drinking water are quite comparable (92% and 95%, respectively). Safe and Round-the-year Availability : Overall, around two-third (66%) of the households having access to safe drinking water sources are getting round-the-year supply of drinking water. Among the 5 states, Assam stands out as the best performing State with nearly four-fifth (76%) of the households receiving round-the-year supply of water from safe sources. On the other hand, West Bengal is found to be the worst performing, where two-fifth (42%) of the households have reported that they are deprived of this facility. Safe, Round-the-Year and Sufficiency : Overall, only three-fifth (63%) of the households has reported to be receiving sufficient quantity of water from safe sources on round-the-year basis. Among the 5 states, Assam stands out as the best performing State where this was reported by three-fourth (76%) of the households. On the other hand, Karnataka was found to be the worst performing State (46%). It has been found that although the proportion of households having access to safe water is quite high (85% to 100%), the proportion reporting safe, round-the-year and sufficient water supply is much smaller (54% to 76%). Moving towards Tapped Water Supply : Compared to their status prior to 2003 and present (2009), the proportion of households having access to tap water has improved quite significantly in all the 5 states (from 24% to 71%), with a significant decline in the proportion of households dependent on hand-pump/tube-bore wells. Water Quality Satisfaction with the Water Quality: It is encouraging to note that overall, an overwhelming majority of the households (93%) have reported to be satisfied with the water quality. Among the 5 states, water quality is a major issue only in the State of Rajasthan, as reported by half the households (50%) surveyed in the State. There is not much difference between the least affected and most affected districts in terms of water quality as perceived by the households. ii
18 Water Testing : It is disheartening to note that out of the 63 sample Gram Panchayats, only 18 have reported about being provided with the field-testing kit. Surprisingly, none of the 14 sample Gram Panchayats of West Bengal and only 1 Gram Panchayat in Assam has reported affirmatively in this regard. Ironically, the proportion of Gram Panchayats (GPs) provided with the field testing kits is much smaller for the most affected districts as compared to the least affected ones (23% vs 33%). Further, four-fifth (79%) of the sample habitations have reported in negative about the testing of water sources in their villages. Trainings on Water Quality Monitoring and Surveillance : The Pradhans of only 23 out of the 63 sample Gram Panchayats (GPs) affirmed about the provision of training to grassroot workers. Among the 5 states, Karnataka stands outs with all the 12 sample Gram Panchayats (GPs) reporting the provision of training to grassroot workers. Gender-wise, it emerged that in a large majority of the Gram Panchayats (50 out of 63), no woman has received any training. Operation & Maintenance (O&M) Functional Water Sources : Over two-third (70%) of the hand-pumps and overwhelming majority (91%) of the tapped water supply sources were functional as reported by the respondents of the habitations survey. The major reasons for the defunct hand-pumps were cited as ground water depletion and lack of proper maintenance. Responsibility of Operation & Maintenance (O&M) : Overall, only a small proportion (5%) of the households was of the view that Operation and Maintenance (O&M) should be the responsibility of the community. Among the 5 states, Himachal Pradesh stands out with the proportion of such households being the highest (12%). When probed about the existence of any committee in their village/habitation that is responsible for maintenance of water sources, almost all the households (99%) responded in negative. The proportion of households willing to pay for the operation & maintenance of the water supply system was found to be very small (8%). While prevailing poverty was cited as one of the major reasons, a majority of the community members considered Operation and Maintenance (O&M) as the responsibility of the Gram Panchayats (GPs). Role of Gram Panchayats (GPs) in Operation & Maintenance (O&M) of Water Supply System : Over half of the Gram Panchayats have expressed their inability to take the responsibility of Operation and Maintenance (O&M). In a large majority of the Gram Panchayats (50 out of 63), formal handing over of Operation and Maintenance (O&M) of the assets created under the Mission has not been done. iii
19 Water Tariff Close to nine-tenth (87%) of these households have reported to be paying water charges on a regular basis. Almost all (95%) the households have expressed satisfaction with regard to the water charges paid by them vis-a-vis the quantity/quality of water supply received by them. The average amount of monthly water charges per household is found to be lowest (Rs /- in Himachal Pradesh and highest (Rs /-) in Assam, with no variations in the water charges among the households belonging to the different social categories. Further, an overwhelming majority (88%) of the households having tap connections had paid installation charges. This was lowest (Rs /- per household) in Himachal Pradesh and highest (Rs /- per month per household) in West Bengal. It may be highlighted that the user charges for Public Stand Post (PSP) were collected only in the State of Karnataka, as reported by the village Pradhans of the 12 sample Gram Panchayats. According to them, the average monthly amount of water charges per household was Rs. 10/- for all sections of the society. Community Participation/Existence of Village Water and Sanitation Committee (VWSC) It is disheartening to note that less than 1% of the households mentioned about the existence of village water and sanitation committee (VWSC) in their areas. When discussed with the Pradhans, it emerged that VWSCs were existing in only one-fifth (13 out of 63) of the sample Gram Panchayats. Among the 5 states, Karnataka stands out where the presence of VWSC was reported by half the sample Gram Panchayats. While VWSC meetings were reportedly conducted only in 9 out of the 13 Gram Panchayats (GPs), participation of women and scheduled caste community members in the VWSC meetings was reported in only 7 out of the 13 Gram Panchayats (GPs). Further, in only 6 out of the 13 Gram Panchayats (GPs), all VWSC members have reportedly received training. Information, Education and Communication (IEC) on Hygiene & Sanitation At the household level, barring Himachal Pradesh, the situation in the other 4 states is pathetic, with their proportion responding in affirmation about any IEC campaign ranging between 0% and 8%. In the near absence of IEC activities, it is no surprise that open defecation is so widely prevalent in most (80%) of the sample habitations. iv
20 Program Benefits/Impact on Rural Population Increased Availability of Water/Reduced Breakdowns: Increased availability and consequently, increased water usage by the rural households have been found to be the biggest program benefits. Overall, an overwhelming majority (96%) of the households have reported increased usage of water. Further, four-fifth (80%) of habitations mentioned that the number of water sources in functional condition has significantly increased in the last few years, while 57% of them mentioned about noticeable decrease in the frequency of the supply system breakdowns. Improved Environmental Sanitation & Reduction in Water Borne Diseases: Overall, three-fourth (74%) of the household survey respondents felt that the Program has had a positive impact in terms of environmental sanitation. This was most prominent in the State of Himachal Pradesh (95%). This was corroborated by threefourth (75%) of the habitation survey respondents. Improvement in Women s Conditions : Overall, a significant three-fourth (75%) of the respondents have reported in affirmation about reduction in their workload. Due to reduced workload, there has been a significant reduction in fatigue experienced by women. Consequently, women have now more time to engage themselves in various community activities. Further, an overwhelming majority of women (89%) have reported that children have now more time for studying and playing, instead of helping them collect water. Utilization of Time Saved : People are now able to spend time in more productive activities instead of spending excessive time in collecting water, with a significant amount of opportunity cost associated with it. People are now utilizing the time saved for income generating activities (agriculture, cattle rearing, etc.). Sustainability In order to calculate the Sustainability Index, a total of 29 parameters under 5 broad aspects, namely, technology aspects, community and social aspects, financial aspects, water quality aspects and training aspects were identified. For each of these 29 parameters, the responses from the households were quantified on a scale of 1 to 4 and State-wise averages were computed for each of them. Sustainability index of 76%-100% was considered highly satisfactory, 51%-75% considered as satisfactory, 26%-50% considered as poor and 0%-25% was considered as very poor. Composite Sustainability Index : Overall (all states and aspects combined) sustainability index works out to 54%, which is only marginally above the range of Poor. While West Bengal and Rajasthan have performed poorly (49% & 46%, v
21 respectively), it was satisfactory for Himachal Pradesh, Assam and Karnataka (58%, 52% and 66%, respectively). Technological Aspects : The overall (all 5 states combined) sustainability index in respect of the technology issues is found to be 71%, which is satisfactory. While it is highly satisfactory for Karnataka (78%), it is satisfactory in case of the other 4 states (65% to 74%). Community & Social Aspects : Overall (all 5 states combined) sustainability index is found to be 63%, which is satisfactory. Performance of all the 5 states is found to be satisfactory, with Rajasthan scoring lowest (55%) and Karnataka scoring the highest (74%). Financial Aspects : Findings on sustainability index with respect to financial aspects shows that overall situation is very poor (23%). State-wise, the performance of Rajasthan, West Bengal and Assam is found to be very poor (9%, 15% and 19%, respectively), while it was poor for Himachal Pradesh and Karnataka was found to be poor (34% and 37%, respectively). Water Quality Aspects : In terms of water quality, the sustainability index of Karnataka and Himachal Pradesh is found to be highly satisfactory (94% and 93%, respectively), while the other 3 states have fared satisfactorily in this regard (69% to 71%). The overall (all 5 states combined) sustainability index is also found to be highly satisfactory (80%). Training Aspects : The overall situation (all 5 states combined) presents a poor picture with a sustainability index of only 30%, implying that the provision of training to community members, especially the women has not been given adequate and much needed attention. Evidently, the poor performance of the states with respect to financial aspects and training of community members has had an adverse impact on the overall composite sustainability index and it has barely managed to be in the satisfactory range (54%). A comparison of overall sustainability index with respect to each of the 5 broad aspects for most affected and least affected sample districts shows any noticeable variations only in the case of water quality aspect (76% and 84%, respectively). As regards the other four broad aspects, the values of sustainability indices are quite comparable. Installation of Rain Water Harvesting Structures : The study has shown that rain water harvesting structures have been installed only in less than two-fifth (36%) of the sample Gram Panchayats (GPs). Surprisingly, none of the Gram Panchayats (GPs) in West Bengal and Assam have reported about installing such structures. vi
22 Recommendations 1. In the light of the fact that in most cases, the Village Water and Sanitation Committees (VWSCs) are non-functional, the first step would therefore be to revitalize these committees and build the capacity of their members. Only then, the goals and objectives of the Mission can be realized. 2. In the light of the study revealing a near total absence of community involvement (what to talk of the involvement of women), it becomes crucial to engage specialist agencies for capacity building of VWSC members. Only then, the needs and aspirations of the rural poor can be fulfilled. 3. It would be worthwhile to take-up focused and sustained IEC campaigns to educate the communities on the various aspects and issues related to drinking water, sanitation and hygiene. This would also motivate the communities, especially the women for their active involvement in all aspects of the Mission, including its operation & maintenance. For the purpose, experienced professional agencies may be hired to develop appropriate and effective IEC tools. 4. There is an urgent need to organize relevant training programs for the village level PRI members so as to motivate them for their active involvement in all aspects of the Mission. For the purpose, professional training agencies may be hired. 5. The program managers may consider a separate and adequate budgetary provision, besides deputing a team of dedicated staff for ensuring timely repairs and preventive maintenance of the assets created under the project. 6. In view of less than two-fifth (36%) of the sample Gram Panchayats (GPs) having installed rainwater-harvesting structures, there is an urgent need for the renewed impetus in taking-up this important water conservation measure in a serious manner. 7. In order to ensure effectiveness and long-term sustainability of the rural water supply schemes under the Mission, it is imperative to design State-specific plans of action keeping in mind the needs and aspirations of the rural populations. * * * vii
23 Chapter - 1 Introduction 1.1 Background In India, although the provision of rural water supply (RWS) is primarily the responsibility of the respective State Governments, the Central Government contributes a significant part of the program funds for this sector. Throughout the Five Year Plans, the Central Government introduced a variety of policies and programs to address the issue of drinking water. The first national water supply and sanitation program was introduced during as part of the Government s health plan. The states gradually built up the Public Health Engineering Department (PHED) to tackle the problem of rural water supply and sanitation. In spite of this, it was found during the mid-1960s that majority of the schemes were being implemented in the easily accessible villages neglecting remote villages with severe water scarcity. The Central Government requested the states to identify these problem villages and make special plans for them. The first major push to rural water supply came with the Accelerated Rural Water Supply Program (ARWSP) in the 1970s, which gave full grant to the State governments for implementing water supply schemes in problem villages. By March 1981, the coverage of rural water supply was 30.8 per cent. Following the International Drinking Water Supply & Sanitation Decade (IDWSSD) [ ], the second major push came by establishing the National Drinking Water Mission (NDWM), later renamed as the Rajiv Gandhi National Drinking Water Mission (RGNDWM). The Mission issued comprehensive guidelines for ARWSP (1986), helped formulate National Water Policies (1987 and 2002) and introduced the Sector Reform Project (SRP) in With the introduction of the Sector Reform Project (SRP), it became the world s largest, Government sponsored demand based and participatory drinking water supply program, which was first implemented in 67 districts of 26 states in India on a pilot basis. Community participation was sought through 10 per cent contribution to the total installation cost and full responsibility for operation & maintenance. Significant investments were made in building community capacity, and in providing information, education and communication (IEC). While there remained much to be learnt from the infirmities of the SRP, it was scaled up in the form of Swajaldhara in December 2002 with the objective of covering the entire country by the end of the Tenth Five Year Plan. The various drinking water supply programs & policies at a glance in chronological order is presented in the following table. 1
24 Drinking Water Supply Programs & Policies at a Glance 1949 The Environment Hygiene Committee (1949) recommends the provision of safe water supply to cover 90 per cent of India s population in a timeframe of 40 years The Constitution of India confers ownership of all water resources to the government, specifying it as a state subject, giving citizens the right to potable water National Rural Drinking Water Supply program launched with technical support from UNICEF and Rs crore is spent during this phase, with 1.2 million bore wells being dug and 17,000 piped water supply schemes being provided Introduction of the Accelerated Rural Water Supply Program (ARWSP) by the Government of India to assist states and union territories to accelerate the pace of coverage of drinking water supply India as a party to the International Drinking Water Supply and Sanitation Decade ( ) declaration sets up a national level Apex Committee to define policies to achieve the goal of providing safe water to all villages The National Drinking Water Mission (NDWM) is formed Drafting of the first National Water Policy by the Ministry of Water Resources NDWM is renamed the Rajiv Gandhi National Drinking Water Mission (RGNDWM) The 73rd Constitutional Amendment assigns Panchayati Raj Institutions (PRIs) the responsibility of providing drinking water For ensuring sustainability of the systems, steps are initiated to institutionalize community participation in the implementation of rural drinking water supply schemes through sector reform. Sector reform ushers in a paradigm shift from the Government-oriented supply-driven approach to the People-oriented demand-responsive approach. The role of the government is envisaged to change from that of service provider to facilitator. Under reform, 90 per cent of the infrastructure is funded by the government, with the community contributing 10 per cent of the remaining infrastructure cost and 100 per cent of operation and maintenance costs. Sector reforms projects were introduced in 67 districts across the country on pilot basis. Total Sanitation Campaign (TSC) as a part of reform principles initiated in 1999 to ensure sanitation facilities in rural areas with broader goal to eradicate the practice of open defecation. As part of the program, a nominal subsidy in the form of incentive is given to rural poor households for construction of toilets. TSC gives strong emphasis on Information, Education and Communication, Capacity Building and Hygiene Education for effective behavior change with involvement of PRIs, CBOs, and NGOs Contd... 2
25 Drinking Water Supply Programs & Policies at a Glance (Contd...) Nationwide scaling up of sector reform in the form of Swajaldhara. The National Water Policy is revised, according priority to serving villages that did not have adequate sources of safe water and to improve the level of 2002 service for villages classified as only partially covered. India commits to the Millennium Development Goals to halve by 2015, from 1990 levels, the proportion of people without sustainable access to safe drinking water and basic sanitation All drinking water programs are brought under the umbrella of the RGNDWM. The Government of India launches the Bharat Nirman Program for overall development of rural areas by strengthening housing, roads, electricity, telephone, irrigation and drinking water infrastructure. The target is to 2005 provide drinking water to 55,069 uncovered habitations; those affected by poor water quality and slipped back habitations based on 2003 survey, within five years. Pattern of funding under the Swajaldhara Scheme changes from the previous 90:10 central-community share to 50:50 centre-state share. Community contribution is now optional. The approach paper for the 11th Five Year Plan calls for a comprehensive approach which encompasses individual health care, public health, 2007 sanitation, clean drinking water, access to food and knowledge about hygiene and feeding practice. It also states the need to upscale more schemes related to community management of water reducing the maintenance burden and responsibility of the state. It is envisaged to provide clean drinking water for all by 2009 and ensure that there are no slip-backs by the end of the 11th Plan. Source: Khurana, Indira & Sen Romit, Drinking Water Quality in Rural India : Issues & Approaches (Water Aid) 1.2 Rajiv Gandhi National Drinking Water Mission The focus of the Rajiv Gandhi National Drinking Water Mission (RGNDWM) was to adopt a community-based demand-driven approach instead of the hitherto government forced supply driven approach. In doing so, the projects under RGNDWM are basically community participation oriented in nature with a part (minimum of 10% of the proposal) of the capital cost required to be borne by the community themselves. The balance amount is contributed by the Government of India. As per the guidelines, the implementing agencies for the program may be decided by the respective State Governments. The implementation should be entrusted to one single Department in the State, with a view to better implementation, monitoring of the progress and the like. If the program has to be implemented through more than one Department, one of the Departments should be designated as the Nodal Department for 3
26 co-coordinating the Rural Water Supply Programs and sending consolidated progress reports to the Central Government. The Panchayati Raj Institutions (PRIs) are also supposed to be involved in the implementation of schemes particularly in the selection of the location of stand-posts, spot sources, operation and maintenance, fixing of water tariff, etc. The Population Census data indicate that in 2001, about 78 percent of the rural population had access to a safe source of drinking water, up from 56 percent in The Rajiv Gandhi National Drinking Water Mission (RGNDWM) had set a target of extending access to safe drinking water for 100 percent of the rural population by Although this target has not been fully achieved, the expansion of coverage attained during the 1990s, as reflected in the Census Data, shows the objective of 100 percent safe water access should not be difficult to achieve in the next five years or so. Indeed, the Eleventh Five Year Plan ( to ) foresees the provision of safe drinking water to all rural habitations. 1.3 Critical Issues Availability of and access to safe potable water have been an area of deep concern mainly due to the multifarious challenges these pose in managing and ensuring a sustainable supply for the fast growing population. Rural India has more than 700 million people residing in about 1.42 million habitations spread over 15 diverse ecological regions. Meeting the drinking water needs of such a large population can be a daunting task. The non-uniformity in level of awareness, socio-economic development, education, poverty, practices & rituals and water availability add to the complexity of the task. In many parts of rural India, a crisis of drinking water has assumed such proportions that it has led to large scale out-migration, water riots, inter-state disputes over water sharing and conflict between rural and urban consumers. The major issues in the Rural Water Supply sector are lack of sustainability of drinking water sources and systems. As a consequence, availability of drinking water, both in term of adequacy and quality on a sustainable basis has become a major challenge. Water quality has become a major issue as ground water table goes down further. The levels of contaminants, such as, fluoride (66 million people across 17 States are estimated to be at risk), arsenic (nearly 13.8 million people in 75 blocks are reported at risk), varying iron levels, presence of nitrates and heavy metals, bacteriological contamination and salinity and man-made chemical pollutants, such as, pesticides and insecticides are high and still rising. The health burden of poor water quality is enormous. It is estimated that around 37.7 million Indians are affected by waterborne diseases annually, 1.5 million children are estimated to die of diarrhea alone and 73 million working days are lost due to waterborne disease each year. According to official statistics, the proportion of fully covered habitations reached 97 percent by April 2006 (Economic Survey, Government of India, ), up from about 75 percent in This, however, does not take into account the slippages that have taken place habitations once fully covered have later slipped into partially covered or not covered status for various reasons (water sources going dry or getting 4
27 quality affected; systems working below capacity due to poor operation and maintenance; increase in population in the habitations resulting in lower per capita availability; and so on). Indeed, the preliminary results of the Habitation Survey (2003) provide indications of significant slippage and give the impression that coverage has not been increasing much. Despite collective effort of the State and Central Governments and huge investment of about Rs 72,600 crore in the rural water supply sector, under both State and Central Plans up to 2009 since the beginning of the planned era of development, the national goal of providing adequate potable drinking water to the rural community at a convenient location at all times is yet to be achieved. In other words, reliable, sustainable and affordable service is still lagging. It may also be highlighted that traditionally, rural water supply in India has followed a supply-driven approach with access to safe water being considered a social good. Supply-driven programs incur large institutional costs, substantially raising the cost of service provision. Consequently, it has resulted as a hindrance to the development of more efficient and lower cost options for service delivery and also denying opportunity to the users to exercise their options as consumers to demand better service delivery. The demand-responsive approach on the other hand, is based on the principles of community participation and decentralization of powers for implementing and operating drinking water supply schemes with the government playing the role of a facilitator. Demand-driven programs are found to have relatively low institutional cost and other advantages, including better Operation and Maintenance (O&M) cost recovery. 1.4 Objectives of the Study In order to accomplish the envisaged objectives of any scheme/program, it is essential to institutionalize a mechanism for regular monitoring and evaluation from time-to-time. Regular monitoring and in-depth evaluation provides valuable insights on how well we have done in the past and to report to stakeholders the return on their investment and to underpin political support for continued investment. Besides, the lessons learnt can be applied in improving the program by incorporating vital information into planning, resource allocation and prioritizing future programs & activities. In the light of the above and keeping in view the importance of the mission, a comprehensive Evaluation Study of the Rajiv Gandhi National Drinking Water Mission (RGNDWM) was aptly initiated by Programme Evaluation Organisation (PEO), Planning Commission, Government of India. AMS Consulting (P) Limited was commissioned for this study. The reference period of the study was to The specific objectives of the study were to: 1. Assess the extent of coverage and access to improved services in the rural areas; 2. Assess the institutional arrangements placed by the State Governments for implementation and performance of the mission; 5
28 3. Evaluate the overall impact of the mission on the rural habitations, especially on women in terms of access to improved water services and awareness; 4. Identify the measures adopted for ensuring the sustainability of the surface water and ground water sources and constraints there-upon; 5. Assess the role of the stakeholders at various levels in creating awareness about water and sanitation among the beneficiaries; and 6. Document the major achievements in view of the interventions in rural water services under RGNDWM. 6
29 Chapter - 2 Methodology 2.1 Sampling Plan Sampling of States & Districts Sampling of the 5 study states and 10 districts was done by the Planning Commission. As mentioned in the Terms of Reference, one State each was selected from the five geographical zones of the country. Additionally, it was endeavored to ensure that the sample included due representation of the DDP areas, quality affected and hilly areas. The detailed State-wise sample for the study is presented hereunder. Sl.No. Zone State Selection Criteria 1 East West Bengal Plain Area 2 West Rajasthan Quality Affected 3 North Himachal Pradesh Hilly Area 4 South Karnataka Desert Development Program 5 North-East Assam North-East Region Within each of the five states, a total of two districts were selected with one district having the highest number of quality affected habitations and the second district with the least or no quality affected habitations. The details of the sample districts are presented hereunder Sl. No. State District Selection Criteria 1. West Bengal 1. Bankura Quality Affected 2. Howrah Least Affected 2. Rajasthan 3. Barmer Quality Affected 4. Dholpur Least Affected 3. Himachal Pradesh 5. Bilaspur Quality Affected 6. Kullu Least Affected 4. Karnataka 7. Kolar Quality Affected 8. Shimoga Least Affected 5. Assam 9. Nagoan Quality Affected 10. Guwahati Least Affected 7
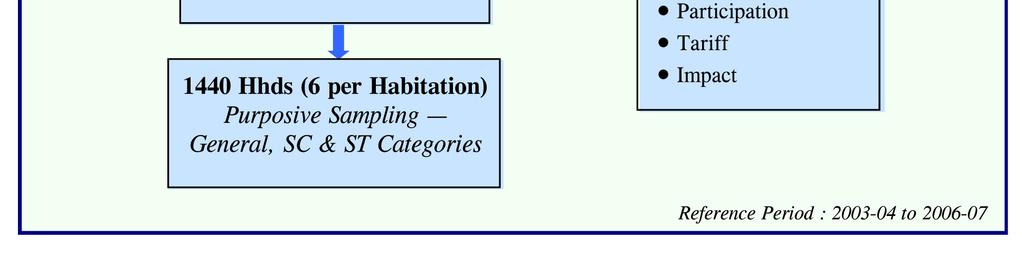
30 Sampling of Blocks Two blocks in each of the two sample districts were selected. For the purpose, the AMS Consultants visited the office of the concerned implementing Agency of the sample districts and collected the detailed list of the drinking water supply schemes under Rajiv Gandhi National Drinking Water Mission (RGNDWM), which were completed during the reference period of the past 4 years ( to ). In the next step, the completed schemes were arranged block-wise and subsequently, 2 blocks having the largest number of completed schemes were selected. Due care was taken to ensure that the 2 sample blocks were representative with regard to the diverse geographical conditions of the district and quality affected areas therein. Sampling of Gram Panchayats & Habitations After having selected the sample blocks, drinking water schemes were arranged Gram Panchayat-wise and subsequently, 3 Gram Panchayats having the largest number of completed schemes were selected. Similar to the sampling of blocks, care was taken to ensure that the 3 sample Gram Panchayats were representative with regard to the diverse geographical conditions of the sample block and quality affected areas therein. Then, from each of the sample Gram Panchayat, 4 habitations were selected. As per the ToR, one habitation each was to be selected from among the (a) Fully Covered, (b) Partially Covered, (c) Not Covered, and (d) Quality affected habitations. It may be mentioned that only those habitations were selected where the drinking water supply schemes had been completed and drinking water was being supplied to the people. Further, sampling of Gram Panchayats and habitations was finalized after discussions and consultations with the concerned officials of the sample blocks. Sampling of Households For the purpose of impact assessment, 6 households were selected from each of the 48 habitations using the stratified purposive sampling method giving adequate representation to the various socio-economic categories. Accordingly, four households from general category, one household from SC category and one household from ST Category were selected. In case of any shortfall in the required number of sample households in any stratum/category, the same was compensated from the remaining strata/ categories. Thus, a total of 1440 households were selected from 240 habitations in 60 Gram Panchayats spread over 20 blocks of the 10 sample districts across 5 study states. From each of the households selected for the study, in-depth interviews (IDIs) were conducted with the female member of the household, since in the rural community, it is usually the women who are the mainly responsible to make arrangements for meeting the daily requirement of drinking water in the households. In case a woman member was not available at the time of interview, IDI was then conducted with the head of the household. 8
31 2.2 Information Gathering Quantitative methods are enormously useful in impact assessment of development projects. Nonetheless, they have some important limitations in the sense that they fail to provide an adequate understanding of the mechanism instigating a series of events that ultimately result in the observed impact of the program. They fail to provide an answer to why and how the program has or has not been able to achieve its desired goals and objectives, thus limiting the scope for any corrective measures. Such limitations can be overcome by incorporating qualitative approaches that would supplement, improve and complement the quantitative data. Qualitative methods provide an in-depth understanding of the needs, behaviors, aspirations and perceptions of the community for whom the development programs are intended, besides assessing the implementers' perspectives, that is, their limitations, problems and bottlenecks in program implementation. Accordingly, the study schedules for various stakeholders developed and supplied by the Planning Commission contained a judicious mix of questions seeking quantitative and qualitative information. Besides information gathering using the aforementioned schedules, efforts were also made to conduct physical observation/verification during the transect walk through the sample Gram Panchayats/habitations. This helped us in understanding the various features within the selected villages, such as, the status of drinking water points vis-à-vis the standard of cleanliness/hygiene around these points, drainage facilities, etc. Further, we focused our attention on areas of our concern by interacting directly with the members of the community (including those accompanying us, as well as those who we met during the transect walk). In doing so, our focus was on collecting vital information regarding various habitations within the village, the residents and their specific concerns pertaining to the availability of safe drinking water and more importantly, on the aspect of quality. A schematic diagram of the study design comprising of the study sample and the key issues covered is presented ahead. 9

32 10
33 2.3 Training of Research Team Members During the 2-day in-house classroom-training program, the research team members were rigorously trained on the implementation process and various other aspects of the Rajiv Gandhi National Drinking Water Mission (RGNDWM). Further, they were also trained on the technique of conducting in-depth interviews (IDIs) and focus group discussions (FGDs), besides orienting them on the sample study sites and the different stakeholders to be interviewed. On the third day, the research team members were taken for field-testing of the study instruments. This was followed by a question-answer session that allowed them to clear doubts, if any, in their minds with regard to the study instruments or otherwise. The entire training exercise (including the field visit) was conducted under the guidance of the Planning Commission officials 2.4 Scheme of Data Analysis While quantitative data was analyzed using standard statistical software, qualitative information gathered through in-depth interviews of implementers (State, district & block-level) and focus group discussions with the community was analyzed in a systematic and methodological manner, scrutinizing the textual information for its primary as well as latent content. The following procedure was adopted for the content analysis of the qualitative data Free Listing : The responses to a particular question were listed to obtain the range of responses for all open-ended questions. The responses that were considered irrelevant under a specific question were moved under the appropriate question. During this process, the important statements or quotable quotes with their reference were extracted for use in the report as reference material. Coding : In the final screening, for every open-ended question, responses were coded according to the domains. Some responses could be placed under more than one domain as a range of views was stated in a single sentence. After careful scrutiny, the responses found to be completely irrelevant were discarded. Summarizing : Similar information sought from different stakeholders was triangulated to arrive at a conclusion with greater degree of accuracy, as also from the viewpoint of reliability and validity. The results were then summarized for each of the issues. 2.5 Computation of Sustainability Index One of the prime objectives of the study was to assess the sustainability of water sources in the habitations. In order to calculate the Sustainability Index, a total of 29 parameters under 5 broad aspects, namely, technology aspects, community and social aspects, financial aspects, water quality aspects and training aspects were identified as detailed in the following table. 11
34 Technology Aspect 1. Functionality of Source 2. No. of functional points increased 3. Year round functionality of source 4. Break down frequency 5. Time taken for repairs 6. Availability of equipment/space 7. Technical skills of community Community & Social Aspect 8. Ownership of water sources 9. Choice of technology 10. Access to all groups 11. Usage of sources 12. Operation and Maintenance (O&M) measures taken 13. Community willingness to take Operation and Maintenance (O&M) 14. Care of sources by women 15. Satisfaction with water services Financial Aspect 16. Community contribution 17. Availability of funds 18. Entity setting-up water tariff charges 19. Affordability of water charges 20. Whether community consulted in tariff-setting 21. Flexibility in user payment 22. Provision of subsidized tariff for poor (SC/ST) Water Quality Aspect 23. Acceptability of quality 24. No. of sources with acceptable quality 25. Access to safe water 26. Source reliability Training Aspect 27. Category of personnel trained 28. Gender-wise training 29. Preference for women in training of hand-pumps repair For each of the aforementioned 29 parameters, the responses from the households were quantified on a scale of 1 to 4 and State-wise averages were computed for each of them. This allowed us to identify the critical sustainability parameters that were relatively strong or weak in each of the sample states. 12
35 2.6 Summary of Field Work The quantum of fieldwork done toward the RGNDWM evaluation study is summarized hereunder Activity Total Conducted Community Level In-depth Interview with Village Pradhan/Secretary (GP Schedule) 60 In-depth Interview VWSC member (Habitation Schedule) 240 In-depth Interview with Women beneficiaries (Household Schedule) 1440 Focus Group Discussion 240 Implementing Agency Level In-depth Interview with Chief Engineer (State Schedule) 5 In-depth Interview with Executive Engineer (District Schedule) 10 In-depth Interview with Asst. Executive Engineer (Block Schedule) 20 13
36 Chapter - 3 Physical & Financial Progress As already mentioned in the Methodology section, a total of 5 states, one each from the five zones of the country were selected for the purpose of the study. Based on the information received from the State officials, details of physical and financial progress is presented ahead. 3.1 Physical Progress Assessment of physical progress of the 5 study states was made in respect of the coverage status, particularly the proportion of fully covered habitations. Accordingly, during our visit to the study states and discussion with the State officials, data on habitation coverage was collected from them. Fully Covered Habitations The criteria for a habitation to be considered as Fully Covered are (a) 40 litres of safe drinking water per capita per day (lpcd) and additional 30 lpcd for cattle in the Desert Development Program Areas;(b) one hand pump or stand post for every 250 persons; and (c) the water source should exist within the habitation or within a distance of 1.6 km. in the plains and within 100 metres elevation in the hilly areas. Drinking water is defined as safe if it is free from bacteria contamination, chemical contamination viz. fluoride, iron, arsenic, nitrate, brackishness in excess or beyond permissible limits. Based on the Habitation Survey-2003 and the data collected from the State officials, a comparative analysis of the total number of habitations and the proportion of them that are fully covered (FC) is presented in the following table. States Table-3.1 : Comparative Habitation Coverage 2003 Vs 2009 Habitation Coverage (2003) Habitation Coverage (2009) Fully % Total Fully Covered (Percenta Habitatio Covered Total Habitatio n % (Percenta ge) ge) n Karnataka % % Himachal % % Rajasthan % % Assam % % West Bengal % % As can be seen from the chart alongside, between the period 2003 and 2009, all the 5 states have registered a good physical progress in terms of increased level of fully covered (FC) habitations. Among the 5 states, the proportion of fully covered habitations in the states of Rajasthan and Assam is found to be quite impressive, with an increase of 62 and 51 percentage points, respectively. 14
37 Chart-3.1 : Proportion of Fully Covered Habitations (2003 Vs 2009) 93% 95% 75% 85% 69% 83% 52% 37% 33% 34% Karnataka Himachal Rajasthan Assam W. Bengal Financial Progress Based on the financial data received from the study states, the State-wise analysis of the proportion of funds utilized is presented in the following table. States Released (Rs. in lakhs) Fund Utilization (%) Utilized Utilized (Rs. in % lakhs) Karnataka * - (6 Years to ) Himachal Pradesh * * - Rajasthan % (6 Years to ) Assam % (6 Years to ) West Bengal % (3 Years to ) *Figures Not Available As can be seen, while the financial progress of Rajasthan is over 90%, it is close to 100% for the State of Assam. However, the performance of the State of West Bengal has not been as good. The 3-year average of the proportion of funds utilized for this State is found to be less than four-fifth (78%). 15
38 Chapter 4 Respondents Profile Household Survey 4.1 Respondents Profile Household Survey Access to drinking water has special implications for women and children. The responsibility for fetching water for household needs, sometimes over long distances, is invariably assigned to women or girls. Accordingly, during the household survey, from each sample household, a woman respondent was purposively selected for administering the questionnaire. In case, a woman respondent was not available at the time of survey, the questionnaire was administered to the male respondent. Table-4.1 : Gender Profile Category n Female Male Karnataka % 4.2% Himachal % 32.3% Rajasthan % 24.4% Assam % 1.4% West Bengal % 14.6% Overall % 15.4% Gender-wise profile of the respondents presented in the table alongside shows that overall, an overwhelming majority (85%) of the respondents were females. Among the 5 states, Karnataka and Assam stand out where almost all (96% and 99%, respectively) respondents were females. Equitable access to safe drinking water to all sections of the society is acknowledged as important development goal of the RGNDWM. Accordingly, care was taken to ensure that all sections of the soceity had due representation while selecting the households in each of the sample habitations. The social caste-wise analysis of respondents presented in the chart alongside corroborates our efforts in this regard. Chart-4.1 : Social Caste-wise Profile (n=1440) OBC (16%) General (54%) SC (26%) Chart-4.2 : Type of House (n=1440) ST (5%) During the household survey, information was also recorded with respect to the type of housing of the respondents. The analysis is presented in the chart alongside. As quite expected, especially in the context of rural settings, nearly half (47%) of the sample households were kuchcha. The proportion of pucca households stood at less than one-third (29%). Semi- Pucca (24%) Kachcha (47%) Pucca (29%) 16
39 The analysis of the educational profile of the household survey respondents presented in the following shows that overall, two-fifth (41%) of the respondents were illiterate. Among the 5 states, the situation in Rajasthan is particularly distressing where threefourth (75%) respondents were illiterate. Further, less than one-third (30%) of the respondents had the education level of upper primary or above. Table-4.2 : Educational Profile of the Household Survey Respondents Category n Illiterate Up to Primary Upper Primary High- School Higher Secondary & Above Karnataka % 12.5% 15.7% 21.3% 10.1% Himachal Pradesh % 56.6% 9.0% 4.5% 0% Rajasthan % 23.3% 1.4% 0.6% 0% Assam % 20.2% 30.3% 13.6% 7.3% West Bengal % 31.4% 23.8% 8.0% 4.6% Overall % 28.9% 16.0% 9.6% 4.3% 17
40 Chapter 5 Access to Safe Drinking Water 5.1 Access to Safe Drinking Water The household survey data was analyzed for access to safe drinking water sources and a comparison was made between the pre-2003 and the present status. The State-wise and overall findings are presented in the following table Table-5.1 : State-wise Access to Safe/Unsafe Drinking Water Sources Pre-2003 & Present Status (n=1440) Cate- Karnataka Himachal Rajasthan Assam West Bengal Overall gory Pre 2003 As on Date Pre 2003 As on Date Pre 2003 As on Date Pre 2003 As on Date Pre 2003 As on Date Pre 2003 As on Date Safe 69.1% 85.4% 55.6% 100% 9.0% 91.0% 84.0% 93.1% 85.8% 97.6% 60.7% 93.4% Unsafe 30.9% 17.8% 44.4% 0% 91.0% 9.0% 16.0% 2.3% 14.2% 5.9% 39.3% 6.6% Safe Sources : Tap (PWS, MWS and GLR) and Hand-pumps/Bore-Tube Wells Unsafe Sources: Open Wells and Traditional Water Bodies (Ponds, Lakes, Rivers, Springs, etc.) As can be seen, there has been a tremendous improvement in the rural populations access to safe drinking water sources between the pre-2003 and the present period across all the 5 states. The improvement in this regard is found to be phenomenal in the case of Rajasthan where currently over nine-tenth (91%) of the rural households have access to safe drinking water sources as compared to less than one-tenth (9%) of them prior to During the same period, Himachal Pradesh has also registered an equally impressive improvement; currently all the households (100%) have access to safe drinking water sources as compared to less than three-fifth (56%) prior to Overall, 5 states combined, over nine-tenth (93%) of the rural population at present has access to safe drinking water sources; the improvement of 32 percentage points is a reflection of the commendable progress made under the Mission. A graphical representation of the comparative analysis of pre-2003 and present status with regard to the percentage of households having access to safe drinking water sources is presented in the following chart Chart-5.1 : Access to Safe Water Sources Comparison of Pre-2003 & Present Status 69% 85% 56% 100% 91% 84% 93% 86% 98% 61% 93% 9% Karnataka Himichal Pradesh Rajasthan Assam West Bengal Overall Pre 2003 Present 18
41 A similar analysis of household data with regard to the least and most affected districts of the 5 states was conducted and the overall findings are presented in the following table. Table-5.2 : Access to Safe/Unsafe Drinking Water Sources in Least & Most Affected Areas Pre-2003 & Present Status Category Least Affected (n=720) Most Affected (n=720) Pre 2003 As on Date Pre 2003 As on Date Safe Sources 71.4% 91.8% 50.1% 95.0% Unsafe Sources 28.6% 8.2% 49.9% 5.0% As quite expected, compared to the households (71%) of the least affected districts, a much smaller proportion of the households (50%) in most affected districts had access to safe drinking water sources prior to With the advent of the Mission, the situation in the most affected areas has improved to a point where the proportions of the households in least affected and most affected areas having access to safe drinking water are quite comparable (92% and 95%, respectively), as shown in the chart alongside. Chart-5.2 : Access to Safe Water Sources in Least/Most Affected Areas Pre-2003 & Present Status 71% 92% Least Affected Pre % 95% Most Affected As on Date 5.2 Parameters of Access to Drinking Water In order to assess the issue of access to drinking water in a holistic manner, efforts were made to elicit information from the respondents of the household survey on the following 5 key parameters. Safe and Round-the-year Availability Safe, Round-the-Year and Sufficiency Distance of Water Source Time Spent in Collecting Water Social Inclusion It may be highlighted that the first 3 are the defining parameters of the fully covered status of a habitation. Accordingly, these are discussed first. Safe and Round-the-year Availability The household survey findings with regard to the availability of water from safe sources on round-the-year basis, are presented in the following table 19
42 Table-5.3 : % Households Receiving Safe and Round-the-Year Supply of Water State No. of Households % Households Receiving Safe & Round-the-Year Supply Karnataka % Himachal Pradesh % Rajasthan % Assam % West Bengal % Overall % As can be seen, overall, around two-third (66%) of the households having access to safe drinking water sources are getting round-the-year supply of drinking water. Among the 5 states, Assam stands out as the best performing State with nearly four-fifth (76%) of the households are receiving round-the-year supply of water from safe sources. On the other hand, West Bengal is found to be the worst performing where two-fifth (42%) of the households have reported that they are deprived of this facility. Safe, Round-the-Year and Sufficiency Analysis of the household survey data for the proportion of households receiving safe, round-the-year and sufficient quantity of water is presented in the following table Table-5.4 : % Households Receiving Safe, Round-the-Year and Sufficient Quantity of Water State No. of % Households Receiving Safe, Round-the- Households Year and Sufficient Quantity of Water Karnataka % Himachal Pradesh % Rajasthan % Assam % West Bengal % Overall % As can be seen, overall, only three-fifth (63%) of the households has reported to be receiving sufficient quantity of water from safe sources on round-the-year basis. Among the 5 states, Assam stands out as the best performing State where this was reported by three-fourth (76%) of the households. On the other hand, Karnataka was found to be the worst performing State where close to half the households (46%) have reported that they were not receiving round-the-year supply of sufficient quantity of water from safe sources. State-wise comparative analysis of households reporting safe, safe & round-the-year and safe, round-the-year and sufficient supply of drinking water is presented in the following chart. 20
43 Chart-5.3 : Access to Safe, Round-the-Year & Sufficient Water Supply By State 85% 59% 54% 100% 66% 65% 91% 71% 66% 93% 76% 76% 98% 58% 55% 93% 66% 63% Karnataka Himachal Rajasthan Assam West Bengal Overall Safe Safe & Round-the-Year Safe, Round-the-Year & Sufficient As can be seen, although the proportion of households having access to safe water is quite high (ranging from 85% to 100%), the proportion of households reporting safe, round-the-year supply and sufficient water supply is much smaller; the difference being as high as 43 percentage points in the case of West Bengal. Distance of Water Source Under RGNDWM, one of the norms for a habitation to be considered as Fully Covered is the availability of water source within the habitation or within a radius of 1.6 kms in plains and 100 meter in hilly areas. Accordingly, data was analyzed for households (having access to safe as well as unsafe water) having access to main water source within or beyond the 1.6 kms. (except Himachal Pradesh, where the criteria was within or beyond 100 meters due to the State being hilly). The findings are presented in the following table Table-5.5 : % Households having Access to Drinking Water Sources within or beyond 1.6 kms State No. of % Households Meeting the Households Fully Covered Norm Karnataka % Himachal Pradesh* % Rajasthan % Assam % West Bengal % Overall % * Distance of main water source; in case of Himachal, it is within 100 m elevation difference As can be seen, overall, all 5 states combined, almost all the households having access to safe drinking water have reported that the main source of water was located within 1.6 kms. from their homes. As regards the households who were dependent on the unsafe drinking water sources have also reported that the main water source was located within this distance. As regards the hilly State of Himachal Pradesh, all the households surveyed have reported that the main safe source of water was located within 1.6 km or within 100 m elevation difference. 21
44 In view of all the sample households across the 5 states reporting access to safe source of water within the stipulated norm, it can be safely deduced that the proportion of households reporting access to safe, round-the-year and sufficient water supply (Table- 5.4) represent the proportion of fully covered habitations in the respective study states. The following chart presents a State-wise comparison between the proportion of fully covered habitations based on the data received from the State officials and the proportion of households reporting access to safe, round-the-year and sufficient water supply within the stipulated distance/elevation norms. Chart-5.4 : Comparison of Fully Covered Status State-level Data Vs Household Survey 93% 54% 75% 65% 95% 66% 85% 76% 83% 55% Karnataka Himachal Rajasthan Assam West Bengal % Habitations Fully Covered (State-level Data 2009) % Households Reporting Access to Safe, Round-the-Year & Sufficient Supply As is evident from the chart, there are significant differentials between the fully covered status based on the State-level data and the findings of the household survey. The difference is quite prominent in the State of Karnataka, Rajasthan and West Bengal (39, 29, and 28 percentage points, respectively). Time Spent in Collecting Water Access to drinking water has implications not only for health status and human development parameters but also for opportunities depending upon the opportunity cost of time. This has special implications for women and children. The responsibility for fetching water for household needs, sometimes over long distances in rural areas, is invariably assigned to women or girls, who dropout of school to attend to these chores. Hence, the ready availability of safe drinking water lays the foundation for improvement in literacy and health indicators in communities. The household survey findings on the average time spent per day by the households in collecting water is presented in the following table Table-5.6 : Average Time Spent per day by Households in Collecting Drinking Water (Minutes) (Safe: n=1345; Unsafe: n=95) Karnataka Himachal Rajasthan Assam West Bengal Overall Safe Unsafe Safe Unsafe Safe Unsafe Safe Unsafe Safe Unsafe Safe Unsafe As can be seen, overall, the average daily time spent by the households in collecting drinking water (from safe sources) is 52 minutes. Considering the numerous constraints 22
, the average time of 52 minutes per day spent by the households is not much and the situation can be considered as quite satisfactory.")

45 in the rural areas (frequent power cuts for long hours and low voltage, low water pressure, lack of proper maintenance of equipment, less than adequate number of sources, etc.), the average time of 52 minutes per day spent by the households is not much and the situation can be considered as quite satisfactory. Water Collection from Distant Sources District Shimoga, Block Shikaripura, GP Sunandakoppa, Habitation-Tadasanahalli Unreliability leading to Overcrowding District Kolar, Block Srinivasapura, GP & Habitation Masthenahalli Social Inclusion The respondents of the household survey were asked about any discrimination in access to drinking water sources so as to assess whether or not there is any social exclusion based on caste, class, gender or income in terms of access. The findings are presented in the following table Table-5.7: % Households Reporting No Discrimination in Access to Drinking Water Source (Safe: n=1345; Unsafe: n=95) Avg. Karnataka Himachal Rajasthan Assam West Bengal Overall Time Safe Unsafe Safe Unsafe Safe Unsafe Safe Unsafe Safe Unsafe Safe Unsafe No 94.2% 97.6% 100% 100% 100% 100% 100% 100% % 98.8% 98.9% Yes 5.8% 2.4% 0% 0% 0% 0% 0% 0% 0.4% 0% 1.2% 1.1% It is indeed heartening to note that almost all the households across all the 5 states have reported that there is no discrimination whatsoever, with regard to access to drinking water sources. The overall situation with regard to the aforementioned 5 key parameters of access to drinking water is summarized in the following table. Particulars % Households % households with access to safe and round-the-year supply 65.9% % households with access to safe, round-the-year and sufficient supply 63.2% % households with access to safe, round-the-year and sufficient supply within 1.6 kms 63.2% Average time spent per day by households in collecting drinking water (Minutes) 52 % households reporting no discrimination in access to drinking water source 98.8% 5.3 Moving towards Tapped Water Supply 23
46 Further analysis of the household survey data with regard to the access to the main source of safe drinking water (that is tap or hand-pump/bore-tube wells) prior to 2003 and as on date was conducted and the findings are presented in the following table Table-5.8 : State-wise Break-up of Safe Water Sources Pre-2003 & Present Status (n=1440) Category Karnataka Himachal Rajasthan Assam West Bengal Overall Pre As on Pre As on Pre As on Pre As on Pre As on Pre As on 2003 Date 2003 Date 2003 Date 2003 Date 2003 Date 2003 Date Tap 54.9% 84.4% 52.4% 100% 1.0% 34.7% 2.1% 53.1% 6.9% 81.6% 23.5% 70.8% Hand Pump 14.2% 1.0% 3.1% 0% 8.0% 56.3% 81.9% 40.0% 78.8% 16.0% 37.2% 22.8% As can be seen, compared to their status prior to 2003, the proportion of households having access to tap water currently has improved quite significantly in all the 5 states. Overall, it has increased from 24% to 71% between the period prior to 2003 and as on date. During the same period, the proportion of households depending on hand-pump/ tube-bore wells has gone down, except in the State of Rajasthan. A closer scrutiny has revealed that in the case of this State, prior to 2003, 80% in Barmer district (most affected) and 84% households in Dholpur district (least affected) were receiving drinking water from open wells. Currently, the situation has changed to a point where only 8% households in Barmer and 6% households in Dholpur are using open well water, while the majority has now access to hand-pump or tap water provided under the Mission. A graphical presentation of the changing scenario in terms of improved access of the rural households to the tapped water supply between the period prior to 2003 and as on date in the various states is presented in the following chart. Chart-5.5 : Access to Tap Water Comparison of Pre-2003 & Present Status 55% 84% 52% 100% 1% 35% 2% 53% 7% 82% 24% 71% Karnataka Himichal Pradesh Rajasthan Assam West Bengal Overall Pre 2003 Present As can be seen, there has been a drastic change, especially in the case of Rajasthan, Assam and West Bengal where the proportion of the households in 2003 having access 24
47 to piped water supply was next to nothing (1%, 2% and 7%, respectively). Currently, these states have registered a significant improvement, with a substantial increase in the proportion of households having access to piped water supply (35, 53 and 82 percentage points). Among the 5 states, Himachal Pradesh and Karnataka standout with cent percent households and over four-fifth (84%) households having access to piped water supply. Overall, all the 5 states combined, there has been an improvement from 24% prior to 2003 to the present level of 71% of the rural households having access to piped water supply. The overall situation with regard to the key parameters of access to tapped drinking water is summarized in the following table. Particulars % Households % households receiving sufficient quantity of tapped water for all purposes 86% % households reporting round-the year availability of tapped water 66% % households reporting regular timing of tapped water supply 85% % households reporting convenience about the timing of tapped water supply 90% % households reporting that tapped water is sufficient even for cattle 45% % households reporting adequate pressure in the tapped water supply 59% 5.4 Alternate Sources of Drinking Water As already detailed in Table-5.4, there are only 63% households that have access to safe, round-the-year and sufficient quantity of water. This implies that out of the total 1440 households, there are close to two-fifth (37%) households that have either sufficiency problem or round-the-year availability problem or both the problems. These are the households that have to depend on alternate sources of drinking water. The following table presents an analysis of the households accessing an alternate source, in terms of whether their alternate source is safe or unsafe. Table-5.9: % Households having Access to Safe/Unsafe Alternate Water Sources (n=533) Category Karnataka Himachal Rajasthan Assam West Bengal Overall Safe 81.9% 17.9% 59.1% 91.5% 87.0% 69.6% Unsafe 18.1% 92.1% 40.9% 8.5% 13.0% 30.4% As can be seen, the alternate drinking water sources for over two-third (70%) of the households are reported to be safe, that is, for around one-third of the households (30%), the alternate drinking water source is unsafe. State-wise, an overwhelming majority of the households (82% to 92%) in the states of Karnataka, Assam and West Bengal have access to safe alternate sources, while in the case of Rajasthan, the alternate sources of water was unsafe ( open wells and taanka ), as reported by a significant twofifth (41%) of the households. 25
48 Most (92%) of households in Himachal Pradesh have reported their alternate source of water as springs, considered as unsafe by us. However, during discussions, it emerged that especially in summer, these households were taking water from springs as it was much cooler and better than the warm piped water supply. It may be mentioned that despite 100% households receiving sufficient quantity and 95% households receiving round-the-year supply from the main sources (tapped), almost all the households access water from springs for the aforementioned reasons. The key parameters of access with regard to the households accessing water from alternate sources are presented in the following table. Particulars % Hhds % hhds who reported to be receiving sufficient quantity from the alternate source 85% % hhds stating the alternate source to be within 1.6 kms 97% Average time spent per day by households in collecting water (minutes) 144 As can be seen, although alternate sources are located within the statutory distance of 1.6 kms from their homes for almost all the households (97%), average time spent per trip in collecting water from the alternate sources is found to be nearly three times as compared to that of the main source (144 minutes for alternate & 52 minutes for main sources). During the household survey, the respondents were also asked about the reasons for using alternate sources. The overall (5 states combined) findings are presented in the chart alongside. Evidently, a large majority of the households (64%) have reported to be using alternate sources when their main sources of water have dried up, while onefourth (26%) of them are doing so due to non-availability of water at their main sources because of technical fault in the supply system. Further, one-tenth (10%) of them have also reported that at times, due to poor quality of water at main sources, they have to rely on the alternate water sources. Chart-5.6 : Reasons for Using Alternate Sources No Supply due to Technical Fault (26%) Main Source Dries Up (64%) Poor Water Quality (10%) 26
49 Chapter 6 Water Quality 6.1 Water Quality Satisfaction with the Water Quality Rajiv Gandhi National Drinking Water Mission envisages provision of adequate and contamination-free drinking water on a sustainable basis to the rural population. Accordingly, during the household survey, information was elicited with regard to satisfaction with the water quality of the main water sources. The findings are presented in the following table Table-6.1 : % Households Satisfied with the Water Quality of Main Source (n=1440) Quality Karnataka Himachal Rajasthan Assam West Bengal Overall Satisfactory 96.9% 100% 50.5% 88.9% 84.5% 84.2% Unsatisfactory 3.1% 0% 49.5% 11.1% 15.5% 15.8% It is encouraging to note that overall, an overwhelming majority of the households (93%) have reported to be satisfied with the water quality. Among the 5 states, water quality is a major issue only in the State of Rajasthan, as reported by half the households (50%) surveyed in the State. Further analysis has revealed that almost all these households belonged to the most affected district Barmer. It may be highlighted that overall, around four-fifth (78%) of the households in the 5 most affected districts have reported that the water quality of their main sources was satisfactory. With 90% households in the least affected districts satisfied with the water quality of the main sources, there is not much difference between the least and most affected districts in terms of water quality as perceived by the households. Chart-6.1 : % Households Satisfied with Water Quality 78% Most Affected 90% Least Affected During the discussions with the respondents of the household survey as well as with the focus group participants, the major quality problems reported in some of the states are presented hereunder Major Water Quality Problems of Main Sources as Reported by the Households Red color of water (reported mainly in West Bengal and Assam) Bad taste/salinity (reported mainly in Rajasthan and Karnataka) Dirt Particles (reported mainly in Karnataka, Assam and West Bengal) 27
50 The water that is supplied under the Scheme..., that is very saline. For this, nothing has been done. People in the village do not use this water for drinking or cooking. FGD Participants, Dist.-Barmer, Block-Sindari, Rajasthan Water is dirty and its color is brownish. We leave water in the bucket for few hours so that dirt settles down and then we use it. For drinking purpose, we take water from open well. FGD Participants, Dist.-Bankura, Block-Bankura-2, West Bengal In the village, there is this problem of red color and bad smell. Mostly people avoid this water and take water from other sources. FGD Participants, Dist.-Nagaon, Block-Koliobar, Rajasthan A similar analysis with regard to satisfaction with the quality of water was also conducted for the alternate sources. The findings are presented in the following table Table-6.2 : % Households Satisfied with the Water Quality of Alternate Source (n=1440) Quality Karnataka Himachal Rajasthan Assam West Bengal Overall Satisfactory 91.2% 98.5% 43.8% 49.1% 72.5% 71.0% Unsatisfactory 8.8% 1.5% % 27.5% 29.0% As can be seen, overall, 71% of the households have reported the water quality from the alternate sources to be satisfactory. Among the 5 states, water quality of the alternate sources is found to be a major issue in the states of Rajasthan and Assam where majority of the respondents (56% and 51%, respectively) have reported dissatisfaction. As regards the major quality problems in different states, the details are presented hereunder Major Water Quality Problems of Alternate Sources as Reported by the Households Red color of water (reported mainly in West Bengal, Assam and Karnataka) Bad taste (reported mainly in Rajasthan, West Bengal and Karnataka ) Dirt Particles (reported mainly in Karnataka, Assam and West Bengal) Provision of Water Testing Kits to Gram Panchayats National Rural Water Quality Monitoring & Surveillance Program, the Village Water & Sanitation Committee (VWSC) in each Gram Panchayats is required to identify and test all sources of drinking water in their respective areas. For the purpose, the Gram Panchayts are provided with Field Testing Kits. During our interaction with the Pradhans of the sample Gram Panchayats, they were asked about provision of these kits. The findings are presented in the following table Table-6.3 : Gram Panchayats Reporting the Provision of Field Testing Kit (n=63) Provision of Kits Karnataka Himachal Rajasthan Assam West Bengal Overall Yes (29%) No (71%) 28
51 It is disheartening to note that out of the 63 sample Gram Panchayats, only 18 have reported about being provided with the field-testing kit. Surprisingly, none of the 14 sample Gram Panchayats of West Bengal and only 1 Gram Panchayat in Assam has reported affirmatively in this regard. Ironically, as shown in the chart alongside, the proportion of Gram Panchayats (Gram Panchayats (GPs)) provided with the field testing kits is much smaller for the most affected districts as compared to the least affected ones (23% vs 33%). When the issue was probed from the respondents of the habitation survey, the overall situation was found to be much worse; with Chart-6.2 : Provision of Field Testing Kit Gram Panchayats Affirming 23% Most Affected (n=33) only 8% of the 240 habitations reporting the provision of field testing kits in their areas. Once again, the trend was same, with the proportion of respondents in most affected districts responding in affirmation about the provision of field testing kit being much smaller (5%) than that of those in the least affected districts (8%). Testing of Water Sources by Technical Person During the habitation survey, the respondents were asked if the water sources in their areas have been tested by a technical person. The findings are presented in the following table Table-6.4 : Testing of Water Sources in Habitations by Technical Personal (n=240 Habitations) Water Karnataka Himachal Rajasthan Assam West Overall Testing Bengal Yes 33% 32% 15% 17% 8% 21% No 67% 68% 85% 83% 92% 79% 33% Least Affected (n=30) Habitations Affirming 5% 8% Most Affected (n=120) Least Affected (n=120) Once again, the results are disheartening. Overall, the respondents in four-fifth (79%) of the habitations have reported in negative about the testing of water sources. Further analysis has revealed that even in the case of most affected districts, water sources have not been tested in three-fourth (76%) of the 120 habitations, as reported by the respondents of the habitation survey. Chart-6.3 : Testing of Water Sources (n=240 Habitations) 21% Most Affected 15% Least Affected 29
 in Gram Panchayats are playing a proactive role.")

52 Field Testing Kit provided to Gram Panchayats Efforts made by Gram Panchayat/VWSC to Maintain Water Quality of Sources In order to ensure contamination free water supply in adequate quantity on round-theyear basis, it is highly desirable that Village Water & Sanitation Committees (VWSC) in Gram Panchayats are playing a proactive role. In this context, during the habitation survey, the respondents were asked if any efforts were made by the Gram Panchayats/VWSC with regard to maintaining the water quality of sources in their habitations. The findings are presented in the following table Table-6.5: Efforts made by GP/VWSC to Maintain Water Quality of Sources (n=240 Habs) Water Testing Karnataka Himachal Rajasthan Assam West Bengal Overall Yes 17% 4% 0% 0% 4% 5% No 83% 96% 100% 100% 96% 95% As is evident, overall (5 states combined), respondents of only a miniscule proportion (5%) of the 240 sample habitations have reported affirmatively about Gram Panchayat/VWSC making any effort to maintain water quality of sources in their areas. The situation was found to be more or less same in both the most affected as well as the least affected districts (4% and 6%, respectively). When probed about the efforts made, a number of responses were received from the 12 habitations. The details are presented hereunder Efforts made by Gram Panchayat/VWSC to Maintain Water Quality of Sources (n=12 Habs) Details No. of Habitations (State) Water sources are regularly monitored by Gram Panchayats (GPs) 7 (Karnataka-6, West Bengal-1) Water sample sent by Gram Panchayats (GPs) for analysis 1 (Karnataka) Bleaching powder treatment of wells 2 (Karnataka-1, Himachal-1) Cleaning is done around water source 1 (Himachal Pradesh) Hand-pumps with poor quality water replaced with new ones 1 (West Bengal) 30
Raiiv Gand~i. Ivaluation ~tudy on National Drinking Water Mission (RGNDWM)
") Raiiv Gand~i Ivaluation ~tudy on National Drinking Water Mission (RGNDWM) PEO Report No. 210 Evaluation Study on Rajiv Gandhi National Drinking Water Mission (RGNDWM) Programme Evaluation Organisation
Raiiv Gand~i Ivaluation ~tudy on National Drinking Water Mission (RGNDWM) PEO Report No. 210 Evaluation Study on Rajiv Gandhi National Drinking Water Mission (RGNDWM) Programme Evaluation Organisation
Institutional Change : Scaling Up Rural Water Supply Program
 Institutional Change : Scaling Up Rural Water Supply Program Indian Experience Presentation at Water Week by Rakesh Behari, Joint Secretary, Govt. of India Indian Scenario State subject devolved to Panchayati
S K Tripathi and Bharat Lal, Department of Drinking Water Supply, Government of India
 27th WEDC Conference Lusaka, Zambia, 2001 PEOPLE AND SYSTEMS FOR WATER, SANITATION AND HEALTH Community participation in rural water supply Indian initiative S K Tripathi and Bharat Lal, Department of
PROJECT INFORMATION DOCUMENT (PID) CONCEPT STAGE Report No.: AB2796 Project Name. Andhra Pradesh Rural Water Supply & Sanitation Project Region
 CONCEPT STAGE Report No.: AB2796 Project Name. Andhra Pradesh Rural Water Supply & Sanitation Project Region") Public Disclosure Authorized Public Disclosure Authorized Public Disclosure Authorized Public Disclosure Authorized PROJECT INFORMATION DOCUMENT (PID) CONCEPT STAGE Report No.: AB2796 Project Name Andhra
Public Disclosure Authorized Public Disclosure Authorized Public Disclosure Authorized Public Disclosure Authorized PROJECT INFORMATION DOCUMENT (PID) CONCEPT STAGE Report No.: AB2796 Project Name Andhra
Uttarakhand Rural Water Supply and Sanitation Sector Program. Arun Dobhal Swajal, Uttarakhand
 Uttarakhand Rural Water Supply and Sanitation Sector Program Arun Dobhal Swajal, Uttarakhand Past Scenario in the WATSAN Sector in Uttarakhand Build-forget-rebuild syndrome in WATSAN sector. Inadequate
Press Information Bureau Government of India Ministry of Drinking Water & Sanitation 31-December :45 IST
 1 of 8 02/01/2015 12:33 PM Press Information Bureau Government of India Ministry of Drinking Water & Sanitation 31-December-2014 12:45 IST Nationwide Monitoring of use of Toilets will be launched from
Integrated Domestic Water Management. Workshop Date: 5 th June Venue: TARA Gram Orcha
 Integrated Domestic Water Management Workshop Date: 5 th June Venue: TARA Gram Orcha INTRODUCTION Water forms the very basis of life It covers 71% - Earth's surface 3 % - fresh water 69 % - in glaciers
INNOVATIONS IN DEVELOPMENT
 Public Disclosure Authorized Public Disclosure Authorized Public Disclosure Authorized Public Disclosure Authorized INNOVATIONS IN DEVELOPMENT Metering and Billing Water Use in Rural Punjab Punjab Rural
PROJECT INFORMATION DOCUMENT (PID) CONCEPT STAGE
 CONCEPT STAGE") Public Disclosure Authorized Public Disclosure Authorized Public Disclosure Authorized Public Disclosure Authorized Project Name Region Country Sector(s) Theme(s) Lending Instrument Project ID Borrower(s)
Public Disclosure Authorized Public Disclosure Authorized Public Disclosure Authorized Public Disclosure Authorized Project Name Region Country Sector(s) Theme(s) Lending Instrument Project ID Borrower(s)
Community Contracting in Rural Water and Sanitation Swajal, Uttar Pradesh and Uttaranchal
 Community Contracting in Rural Water and Sanitation Swajal, Uttar Pradesh and Uttaranchal Background Many areas of Uttar Pradesh suffer from water scarcity. The rural water supply system includes traditional
Safe Water Network is recognized as a National Key Resource Center by the Ministry of Drinking Water and Sanitation KNOWLEDGE PARTNER GRANT PARTNER
 Safe Water Network is recognized as a National Key Resource Center by the Ministry of Drinking Water and Sanitation KNOWLEDGE PARTNER GRANT PARTNER 1 Dream of Har Ghar Jal will be realized by 2030:
Twelfth Five Year Plan Report of the Working Group on. Rural Domestic Water and Sanitation
 Twelfth Five Year Plan 2012-2017 Report of the Working Group on Rural Domestic Water and Sanitation Ministry of Drinking Water and Sanitation Government of India September 2011 0 CONTENTS Executive Summary
Paper 5. System of Monitoring and Evaluation. The World Bank. Public Disclosure Authorized. Public Disclosure Authorized. Public Disclosure Authorized
 44794 Paper 5 The World Bank Policy Paper extracted from the World Bank Study on Review of Effectiveness of Rural Water Supply Schemes in India, June 2008 June 2008 Monitoring and evaluation (M&E) are
KR Sriram Principal Director of Audit Economic & Service Ministries
 KR Sriram Principal Director of Audit Economic & Service Ministries Total Annual Precipitation Average Annual Potential Average Annual Utilisable Water (a) Surface Water (b) Ground Water Net Annual Ground
Talking toilets: evaluating software and hardware oriented rural sanitation approaches in northern India
 36th WEDC International Conference, Nakuru, Kenya, 2013 DELIVERING WATER, SANITATION AND HYGIENE SERVICES IN AN UNCERTAIN ENVIRONMENT Talking toilets: evaluating software and hardware oriented rural sanitation
Can WASH Services be improved by TAPping? Insights from WASHCost (India) Project 1
 Project 1") IRC Symposium 2010 Pumps, Pipes and Promises Can WASH Services be improved by TAPping? Insights from WASHCost (India) Project 1 MV.Ramachandrudu and M.Snehalatha Abstract WASHCost (India) Project researches
IRC Symposium 2010 Pumps, Pipes and Promises Can WASH Services be improved by TAPping? Insights from WASHCost (India) Project 1 MV.Ramachandrudu and M.Snehalatha Abstract WASHCost (India) Project researches
Guidelines for engagement of SWACHCHHATA DOOT UNDER TOTAL SANITATION CAMPAIGN (TSC) (2011)
 (2011)") Guidelines for engagement of SWACHCHHATA DOOT UNDER TOTAL SANITATION CAMPAIGN (TSC) (2011) Government of India Ministry of Drinking Water & Sanitation Central Rural Sanitation Programme Contents 1. BACKGROUND:...
Guidelines for engagement of SWACHCHHATA DOOT UNDER TOTAL SANITATION CAMPAIGN (TSC) (2011) Government of India Ministry of Drinking Water & Sanitation Central Rural Sanitation Programme Contents 1. BACKGROUND:...
Swachh Bharat Mission (SBM)
") Flagship Program September 2015 Swachh Bharat Mission (SBM) Swachh Bharat Mission (SBM) was launched on 2 October, 2014. Key aim of the mission is to achieve universal sanitation coverage and also to put
Flagship Program September 2015 Swachh Bharat Mission (SBM) Swachh Bharat Mission (SBM) was launched on 2 October, 2014. Key aim of the mission is to achieve universal sanitation coverage and also to put
RURAL WATER SUPPLY AND SANITATION DEPARTMENT
 RURAL WATER SUPPLY AND SANITATION DEPARTMENT Rural Water Supply General Rural Water Supply and Sanitation Department is the nodal agency in the State for providing drinking water and sanitation facilities
THE SDS G20 INITIATIVE The Alexandria Meeting 1-2 December 2004
 THE SDS G20 INITIATIVE The Alexandria Meeting 1-2 December 2004 A Commitment to Provision of Safe Drinking Water and Sanitation (SDS) to all by 2025 Prof John Okedi Background to the Communiqué The G20
COMMUNITY WATER SUPPLY & SANITATION PROJECT SRI LANKA
 COMMUNITY WATER SUPPLY & SANITATION PROJECT SRI LANKA Sri Lanka PROFILE OF SRI LANKA Sri Lanka : An island nation Land Area : 64,740 sq km Total population : 20.9 million Rural population : 16.4 million
India's Total Sanitation Campaign: Half full, half empty
 India's Total Sanitation Campaign: Half full, half empty By Indira Khurana, Richard Mahapatra and Romit Sen A soon-to-be released WaterAid India review of India's Total Sanitation Campaign in five states
India - Cost Effectiveness of Rural Water Schemes. Smita Misra Sr. Economist, SASSD
 India - Cost Effectiveness of Rural Water Schemes Smita Misra Sr. Economist, SASSD 1 Context and Design of the Study 2 Service Delivery, Coping Cost & Affordability 3 Cost of Schemes 4 Subsidies Conclusionfor
2011 OU International Water Conference Role of Advocacy and Capacity Building to Achieve Rural Drinking Water Quality Monitoring and Surveillance
 2011 OU International Water Conference Role of Advocacy and Capacity Building to Achieve Rural Drinking Water Quality Monitoring and Surveillance A.N. Singh, Director Communication &Capacity Development
THE SDS G20 INITIATIVE A Commitment to Provision of Safe Drinking Water and Sanitation (SDS) to all by 2025
 to all by 2025") Leader s Summit on Access to Safe Drinking Water and Sanitation: Towards an L20? December 1-2, 2004 Alexandria Commissioned Briefing Notes for the CIGI/CFGS L20 Project L20 THE SDS G20 INITIATIVE A Commitment
Leader s Summit on Access to Safe Drinking Water and Sanitation: Towards an L20? December 1-2, 2004 Alexandria Commissioned Briefing Notes for the CIGI/CFGS L20 Project L20 THE SDS G20 INITIATIVE A Commitment
& SANITATION PROJECT SRI LANKA
 2nd COMMUNITY WATER SUPPLY & SANITATION PROJECT SRI LANKA W. Piyasena Director General Rural Water Supply & Sanitation Division National Project Director nd Community Water Supply & Sanitation Project
SACHETANA PLUS: FLUORIDE MITIGATION PROJECT
 SACHETANA PLUS: FLUORIDE MITIGATION PROJECT 1. BACKGROUND: BAIF Institute for Rural Development, Karnataka (BIRD-K), a nonprofit organisation based in Tumkur District started a programme on fluoride mitigation
Shi Malin, China W WATER PROVISION: MALIN
 26th WEDC Conference Dhaka, Bangladesh, 2000 WATER, SANITATION AND HYGIENE: CHALLENGES OF THE MILLENNIUM Rural water supply and sanitation in China Shi Malin, China THE MAJORITY OF the Chinese population
Participatory rural planning processes
 Rural Transport Training Materials Module 2: Planning, Design, Appraisal and Implementation Participatory rural planning processes Session 2.1 Part 1 Presentation 2.1a The Training Modules Module1. Policies
HUDCO AWARDS FOR BEST PRACTICES TO IMPROVE THE LIVING ENVIRONMENT
 HUDCO AWARDS FOR BEST PRACTICES TO IMPROVE THE LIVING ENVIRONMENT A COMPENDIUM OF THE AWARD WINNING AND OTHER ENTRIES RECEIVED FOR THE HUDCO BEST PRACTICES AWARD FOR THE YEAR 2014-15 2014-15 A HUDCO HSMI
Communication Plan. West Bengal Piped Water Supply Project (Purulia) Joint Project of. Public Health Engineering Department, (PHED)
 Joint Project of. Public Health Engineering Department, (PHED)") Communication Plan West Bengal Piped Water Supply Project (Purulia) Joint Project of Public Health Engineering Department, (PHED) Government of West Bengal And Japan International Cooperation Agency (JICA)
Communication Plan West Bengal Piped Water Supply Project (Purulia) Joint Project of Public Health Engineering Department, (PHED) Government of West Bengal And Japan International Cooperation Agency (JICA)
Flagship Program. August Pradhan Mantri Gram Sadak Yojana (PMGSY)
") Flagship Program August 2015 Pradhan Mantri Gram Sadak Yojana (PMGSY) Pradhan Mantri Gram Sadak Yojana (PMGSY) was launched on 25 th December 2000. It is a 100% Centrally Sponsored Scheme (CSS), with the
Flagship Program August 2015 Pradhan Mantri Gram Sadak Yojana (PMGSY) Pradhan Mantri Gram Sadak Yojana (PMGSY) was launched on 25 th December 2000. It is a 100% Centrally Sponsored Scheme (CSS), with the
Rural Water Conservation Programmes in Hilly Region of Uttarakhand (India) - An Evaluative Study
 - An Evaluative Study") Journal of Alternative Perspectives in the Social Sciences (2016) Volume 7 No 4, 587-592 Rural Water Conservation Programmes in Hilly Region of Uttarakhand (India) - An Evaluative Study Dr. Deepak Paliwal
Journal of Alternative Perspectives in the Social Sciences (2016) Volume 7 No 4, 587-592 Rural Water Conservation Programmes in Hilly Region of Uttarakhand (India) - An Evaluative Study Dr. Deepak Paliwal
Journey from fringe to centre asserting rights and dignity: experiences of WASH intervention in India
 36th WEDC International Conference, Nakuru, Kenya, 2013 DELIVERING WATER, SANITATION AND HYGIENE SERVICES IN AN UNCERTAIN ENVIRONMENT Journey from fringe to centre asserting rights and dignity: experiences
IMPACT ASSESSMENT OF NIRMAL GRAM PURASKAR AWARDED PANCHAYATS FINAL REPORT
 IMPACT ASSESSMENT OF NIRMAL GRAM PURASKAR AWARDED PANCHAYATS FINAL REPORT VOLUME-I: MAIN REPORT VOLUME-II: ANNEX Prepared for By August 2008 ABBREVIATIONS BC CBO GoI GP IEC IHHL NGO NGP OBC O&M ODF PHC
OPM India. In summary
 OPM India In summary About Oxford Policy Management s In summary series Our In summary publications aim to give an introduction to a key area of our expertise and the capabilities we offer in supporting
Talking toilets: evaluating software and hardware oriented rural sanitation approaches in northern India
 Loughborough University Institutional Repository Talking toilets: evaluating software and hardware oriented rural sanitation approaches in northern India This item was submitted to Loughborough University's
IMPROVING WATERSHED MANAGEMENT PRACTICES IN NORTHERN INDIA AN ECONOMIC WIN WIN FOR SUSTAINABLE AGRICULTURE AND RAINWATER HARVESTING
 IMPROVING WATERSHED MANAGEMENT PRACTICES IN NORTHERN INDIA AN ECONOMIC WIN WIN FOR SUSTAINABLE AGRICULTURE AND RAINWATER HARVESTING ACCESS TO WATER AND INCREASED BIOMASS PRODUCTIVITY IS A KEY ECONOMIC
Strategic Plan Department of Drinking Water and Sanitation Rural Drinking Water
 Draft 301110 Formatted: Justified Strategic Plan 2010-2022 Department of Drinking Water and Sanitation Rural Drinking Water Department of Drinking Water and Sanitation Ministry of Rural Development Government
Brief description, overall objective and project objectives with indicators
 India: Rural water supply, Rajasthan Ex post evaluation report OECD sector BMZ project ID 1993 65 420 Project executing agency Consultant Year of ex post evaluation 1402000 / Water supply, sanitation und
SECTOR ASSESSMENT (SUMMARY): WATER SUPPLY AND OTHER MUNICIPAL INFRASTRUCTURE AND SERVICES
: WATER SUPPLY AND OTHER MUNICIPAL INFRASTRUCTURE AND SERVICES") Jaffna and Kilinochchi Water Supply and Sanitation Project (RRP SRI 37378) SECTOR ASSESSMENT (SUMMARY): WATER SUPPLY AND OTHER MUNICIPAL INFRASTRUCTURE AND SERVICES A. Sector Road Map 1. Sector Performance,
Jaffna and Kilinochchi Water Supply and Sanitation Project (RRP SRI 37378) SECTOR ASSESSMENT (SUMMARY): WATER SUPPLY AND OTHER MUNICIPAL INFRASTRUCTURE AND SERVICES A. Sector Road Map 1. Sector Performance,
RAJIV GANDHI NATIONAL DRINKING WATER MISSION
 RAJIV GANDHI NATIONAL DRINKING WATER MISSION NATIONAL RURAL WATER SUPPLY PROGRAMME Movement towards ensuring people s drinking water security in rural India Framework for Implementation 2008-2012 Department
NREGA: A Component of Full Employment Strategy in India. Prof. Indira Hirway Center For Development Alternatives Ahmedabad
 NREGA: A Component of Full Employment Strategy in India Prof. Indira Hirway Center For Development Alternatives Ahmedabad This Paper This paper argues that NREGA could be an important first step of a full
Village Water Safety and Security (VWSS) Campaign
 Campaign") Village Water Safety and Security (VWSS) Campaign 1.0 Background (A joint initiative in WATSAN Sector by NTPC Ltd. and PanchyatSamity, Mouda) NTPC, the largest power Company in India, is implementing 2320
Village Water Safety and Security (VWSS) Campaign 1.0 Background (A joint initiative in WATSAN Sector by NTPC Ltd. and PanchyatSamity, Mouda) NTPC, the largest power Company in India, is implementing 2320
HEALTH AND POPULATION b) Water Supply and Sanitation
 Water Supply and Sanitation") HEALTH AND POPULATION b) Water Supply and Sanitation Demand driven approaches Project quality and sustainability are improved by including men and women Water Supply and Sanitation projects are increasingly
HEALTH AND POPULATION b) Water Supply and Sanitation Demand driven approaches Project quality and sustainability are improved by including men and women Water Supply and Sanitation projects are increasingly
The Liberia COUNTRY BRIEF
 The Liberia COUNTRY BRIEF The Country Briefs were prepared by governments ahead of the SWA 2019 Sector Ministers Meeting. They are a snap-shot of the country s current state in terms of water, sanitation
Gender and social inclusive WASH planning and policy in Nepal
 38th WEDC International Conference, Loughborough University, UK, 2015 WATER, SANITATION AND HYGIENE SERVICES BEYOND 2015: IMPROVING ACCESS AND SUSTAINABILITY Gender and social inclusive WASH planning and
Climate Change Adaptation in Rural Areas of India - CCA RAI
 Vulnerability Assessments Climate Change Adaptation in Rural Areas of India - CCA RAI The work on climate change assessments was realised under the Indo- German cooperation project Climate Change Adaptation
Programming Guide for Strategy Papers
 EUROPEAN COMMISSION Programming Guide for Strategy Papers Programming Fiche Urban development Date: November 2008 Programming guidelines The programming exercise will serve to assess whether and in what
Towards Nirmal Bihar
 Contents Background Situation Analysis Effort made Key results/ achievement Future plan Towards Nirmal Bihar (An agenda of Mission Manav Vikas) Moving from contracting mode to community empowerment- An
Deploying Digital Technologies to Improve Potable Water Delivery to the Urban Poor
 The profound demographic and economic transformation brought by urbanization are reshaping the world and how it works, demanding a paradigm shift where research, policies, and practice reflect a new urban
Incentivising Sustainability Through Performance Awards
 Government of Punjab Pakistan Sustainable Rural Water Supplies Incentivising Sustainability Through Performance Awards Housing Urban Development & Public Health Engineering Department Sequence of Presentation
Creating Demand for Sanitation in Rural Haryana at Scale. Dr. Puran Singh State Project Coordinator NBA Development & Panchayats Department, Haryana
 Creating Demand for Sanitation in Rural Haryana at Scale Dr. Puran Singh State Project Coordinator NBA Development & Panchayats Department, Haryana Haryana : A place where hundred years old tradition has
PEO Study No.122 EVALUATION OF RURAL ELECTRIFICATION PROGRAMME - VOLUME - I The Study
 PEO Study No.122 EVALUATION OF RURAL ELECTRIFICATION PROGRAMME - VOLUME - I - 1982 1. The Study Rural Electrification, aimed at bringing about a rural urban continuum by bridging the gulf between them,
MONITORING AND EVALUATION OF MICRO PROJECTS ESTABLISHED FOR TRIBAL DEVELOPMENT IN ORISSA
 Indian Journal of Millennium Development Studies: An International Journal Volume 10 Number 1 January-June 2015; pp. 119-127 MONITORING AND EVALUATION OF MICRO PROJECTS ESTABLISHED FOR TRIBAL DEVELOPMENT
Disaster Management in Agriculture
 Disaster Management in Agriculture Disaster Management in Agriculture Introduction Human vulnerability to disasters is an age-old phenomenon. Disasters play havoc with people s lives. Their aftermath results
Measuring factors that predict if WASH services are sustainable
 Measuring factors that predict if WASH services are sustainable An initiative to monitor sustainability factors in towns in Ethiopia for the ONEWASH Plus Programme has completed its first round of data
RURAL WATER SUPPLY IN CHINA
 RURAL WATER SUPPLY RURAL WATER SUPPLY IN CHINA MINISTRY OF WATER RESOURCES, PEOPLE'S REPUBLIC OF CHINA Ministry of Water Resources, People s Republic of China Address: No. 2, Lane 2, Baiguang Road, Xicheng
The Laos COUNTRY BRIEF
 The Laos COUNTRY BRIEF The Country Briefs were prepared by governments ahead of the SWA 2019 Sector Ministers Meeting. They are a snap-shot of the country s current state in terms of water, sanitation
PROJECT REPORT STRENGTHENING WATER AND SANITATION SITUATION. Initiated by MEDICARE HEALTH SERVICES SOCIETY
 PROJECT REPORT On STRENGTHENING WATER AND SANITATION SITUATION Initiated by ( A Charitable Society registered under The Societies Registration Act 1860) (Address- D 35/77, Jangambadi, Varanasi, Uttar Pradesh,
Community Driven Environmental Health Project (CDEHP) Khyber Pakhtunkhwa Province, Pakistan. Research Analysis
 Khyber Pakhtunkhwa Province, Pakistan. Research Analysis") Community Driven Environmental Health Project (CDEHP) Khyber Pakhtunkhwa Province, Pakistan An Australian aid initiative implemented by International Rescue Committee on behalf of the Australian Government
Community Driven Environmental Health Project (CDEHP) Khyber Pakhtunkhwa Province, Pakistan An Australian aid initiative implemented by International Rescue Committee on behalf of the Australian Government
Role Name Affiliation Principal Investigator Dr. C.P. Mishra Professor Department of Community Medicine
 NHPP29 - National Rural Water Supply and Sanitation Programme Quadrant I Personal details: Role Name Affiliation Principal Investigator Dr. C.P. Mishra Professor Department of Community Medicine Banaras
Paradigm Shifts Total Sanitation in South Asia
 Paradigm Shifts Total Sanitation in South Asia Soma Ghosh Moulik Water and Sanitation Program-South Asia Water Week 2007 : Session 9 Washington DC, February 28, 2007 This presentation highlights : Paradigm
5.0 SUMMARY. 5.1 Introduction:
 5.0 SUMMARY 5.1 Introduction: Even after 61 years of democratic governance where the marginalised sections of the society are being given reservations for their development, women have been excluded through
VISION IAS
 VISION IAS www.visionias.in Sanitation Meaning: Sanitation is the hygienic means of promoting health through prevention of human contact with the hazards of wastes as well as the treatment and proper disposal
CHAPTER-6 EMERGING TRENDS OF CORPORATE SOCIAL RESPONSIBILITY 6.2 CSR LEVEL AND TREND AT NATIONAL LEVEL 6.3 CSR TREND IN KARNATAKA (STUDY SITES)
") CHAPTER-6 EMERGING TRENDS OF CORPORATE SOCIAL RESPONSIBILITY CHAPTER AT GLANCE 6.1 INTRODUCTION 6.2 CSR LEVEL AND TREND AT NATIONAL LEVEL 6.3 CSR TREND IN KARNATAKA (STUDY SITES) 6.1 Introduction The Indian
CHAPTER-6 EMERGING TRENDS OF CORPORATE SOCIAL RESPONSIBILITY CHAPTER AT GLANCE 6.1 INTRODUCTION 6.2 CSR LEVEL AND TREND AT NATIONAL LEVEL 6.3 CSR TREND IN KARNATAKA (STUDY SITES) 6.1 Introduction The Indian
6c. BASIC AMENITIES IN TAMILNADU
 6c. BASIC AMENITIES IN TAMILNADU The availability of basic amenities such as housing, drinking water, electricity and sanitation facilities indicates the quality of life of the people. Even after 50 years
PROJECT INFORMATION DOCUMENT (PID) CONCEPT STAGE
 CONCEPT STAGE") Public Disclosure Authorized Public Disclosure Authorized Public Disclosure Authorized Public Disclosure Authorized Project Name Region Country Sector(s) Lending Instrument Project ID Borrower(s) Implementing
Public Disclosure Authorized Public Disclosure Authorized Public Disclosure Authorized Public Disclosure Authorized Project Name Region Country Sector(s) Lending Instrument Project ID Borrower(s) Implementing
Government of Uganda, United Nations Development Programme (UNDP) And World Bank
 And World Bank") Government of Uganda, United Nations Development Programme (UNDP) And World Bank Brief description Project title: The Poverty and Social Impact Analysis (PSIA) of the Proposed National Land Use Policy
Government of Uganda, United Nations Development Programme (UNDP) And World Bank Brief description Project title: The Poverty and Social Impact Analysis (PSIA) of the Proposed National Land Use Policy
H.P. STATE SOCIAL AUDIT UNIT, Block No. 27, SDA Complex, Kasumpati, Shimla-9
 H.P. STATE SOCIAL AUDIT UNIT, Block No. 27, SDA Complex, Kasumpati, Shimla-9 email: sau.himachal@gmail.com Terms of Reference DISTRICT RESOURCE PERSONS ON SOCIAL AUDIT Date of issue: 10 th August, 2016
Impact Assessment of Pradhan Mantri Gram Sadak Yojana (PMGSY)
") Impact Assessment of Pradhan Mantri Gram Sadak Yojana (PMGSY) correlation between road improvements and GDP per capita growth is extensive. Executiive Summary Rural roads provide basic inputs for all-round
Impact Assessment of Pradhan Mantri Gram Sadak Yojana (PMGSY) correlation between road improvements and GDP per capita growth is extensive. Executiive Summary Rural roads provide basic inputs for all-round
Government of Andhra Pradesh
 EXPRESSION OF INTEREST Government of Andhra Pradesh Rural Water Supply and Sanitation Department Swachh Bharat Mission (Gramin), Andhra Pradesh Date of Issue: 15 May 2015 Closing Date: 31 May 2015 Expression
SECTOR ASSESSMENT (SUMMARY): WATER SUPPLY AND OTHER MUNICIPAL INFRASTRUCTURE AND SERVICES
: WATER SUPPLY AND OTHER MUNICIPAL INFRASTRUCTURE AND SERVICES") Additional Financing for Melamchi Water Supply Project (RRP NEP 31624) SECTOR ASSESSMENT (SUMMARY): WATER SUPPLY AND OTHER MUNICIPAL INFRASTRUCTURE AND SERVICES Sector Road Map 1. Sector Performance, Problems,
Additional Financing for Melamchi Water Supply Project (RRP NEP 31624) SECTOR ASSESSMENT (SUMMARY): WATER SUPPLY AND OTHER MUNICIPAL INFRASTRUCTURE AND SERVICES Sector Road Map 1. Sector Performance, Problems,
Unstructured Post Construction Support under Structured Local Governance: Evidences from Rural Drinking Water Service Delivery- Kerala, India
 Unstructured Post Construction Support under Structured Local Governance: Evidences from Rural Drinking Water Service Delivery- Kerala, India V. Kurian Baby*and P.K. Kurian** 16 th September 2016, Athens
BURKINA FASO UNITE- PROGRES - JUSTICE
 BURKINA FASO UNITE- PROGRES - JUSTICE STATEMENT TO THE SECOND HIGH-LEVEL MEETING SANITATION AND WATER FOR ALL: A GLOBAL ACTION FRAMEWORK Introduction Access to adequate sanitation and clean water forms
SECTOR ASSESSMENT (SUMMARY): WATER SUPPLY AND OTHER MUNICIPAL INFRASTRUCTURE AND SERVICES (WATER AND WASTEWATER)
: WATER SUPPLY AND OTHER MUNICIPAL INFRASTRUCTURE AND SERVICES (WATER AND WASTEWATER)") Greater Colombo Water and Wastewater Management Improvement Investment Program (RRP SRI 45148) SECTOR ASSESSMENT (SUMMARY): WATER SUPPLY AND OTHER MUNICIPAL INFRASTRUCTURE AND SERVICES (WATER AND WASTEWATER)
Greater Colombo Water and Wastewater Management Improvement Investment Program (RRP SRI 45148) SECTOR ASSESSMENT (SUMMARY): WATER SUPPLY AND OTHER MUNICIPAL INFRASTRUCTURE AND SERVICES (WATER AND WASTEWATER)
SECTOR ASSESSMENT: WATER SUPPLY AND OTHER MUNICIPAL INFRASTRUCTURE AND SERVICES. 1. Sector Performance, Problems, and Opportunities
 Dhaka Environmentally Sustainable Water Supply Project (RRP BAN 42173) SECTOR ASSESSMENT: WATER SUPPLY AND OTHER MUNICIPAL INFRASTRUCTURE AND SERVICES Sector Road Map 1. Sector Performance, Problems, and
5 CBS programme planning and implementation
 5 CBS programme planning and implementation The profile of each CBS (Community-Based Sanitation) programme has to be country, site and situation specific. Nevertheless, in this chapter we will introduce
Summary of the Consultation Process
 Summary of the Consultation Process 1. The Process Consultations with various tiers of government, civil society, donors and the private sector have been an integral part of the CAS formulation process.
COMMUNITY PARTICIPATION IN ENVIRONMENTAL MANAGEMENT: ROLE OF WOMEN
 COMMUNITY PARTICIPATION IN ENVIRONMENTAL MANAGEMENT: ROLE OF WOMEN Dr Ragini Sahai Associate Professor, Department of Applied Science & Humanities, Galgotia College of Engineering & Technolgy (Dr APJ AKTU)
A STUDY OF THE LOK KARYA KSHETRAS ' OF THE BHARAT SEVAK SAMAJ, 1960
 PEO Study No.37 A STUDY OF THE LOK KARYA KSHETRAS ' OF THE BHARAT SEVAK SAMAJ, 1960 1. The Study Govt. of India had been giving grants to Bharat Sevak Samaj, a non-political Voluntary Organisation for
Guntur is the fourth largest city in the
 Realising DReAMS for South and Southeast Asian Local Authorities DReAMS - Development of Resources and Access to Municipal Services A European Union funded action with project contract no. ASIE/2009/217461
Corporate Social Responsibility Policy of SAIPL for
 Considered and approved by CSR Committee in its meeting held on 11 th September, 2017 for recommendation to the Board Considered and approved by Board in its meeting held on 13 th September, 2017 Corporate
Rural piped water supply in Bangladesh: myth or reality
 Loughborough University Institutional Repository Rural piped water supply in Bangladesh: myth or reality This item was submitted to Loughborough University's Institutional Repository by the/an author.
A SCORECARD FOR MEASURING THE PERFORMANCE OF WASTEWATER MANAGEMENT SERVICES IN THE STATE OF MADHYA-PRADESH, INDIA
 A SCORECARD FOR MEASURING THE PERFORMANCE OF WASTEWATER MANAGEMENT SERVICES IN THE STATE OF MADHYA-PRADESH, INDIA AMIT VISHWAKARMA *Assistant Professor, Department of Civil Engineering, University institute
Solar Based. Drinking Water Supply System
 Detail Project Reports on Solar Based Prepared by Drinking Water Supply System APS Infratech Services Pvt. Ltd. (An ISO 9001:2015 Certified Company) Plot No.-307, Indira Gandhi Housing Colony, Sisupalgarh,
Hygiene promotion How effective is it? How much does it cost?
 WASHCost Fast Facts WASHCost Infosheet 5 June 2013 Hygiene promotion How effective is it? How much does it cost? Hygiene promotion is a public health care intervention aimed at behaviour change that can
RURAL DEVELOPMENT IN INDIA. Dr Shikha Tripathi
 RURAL DEVELOPMENT IN INDIA Dr Shikha Tripathi INDIA- THE HARD FACTS.. India - the home of more than ONE BILLION people has the largest number of POOR in the world has the largest number of illiterates
South Asia Sanitation Conference III, New Delhi, November 2008
 South Asia Sanitation Conference III, New Delhi, November 2008 SUSTAINING SANITATION BEYOND PROJECTS Developing Enabling Environments for Sustaining and Scaling up Sanitation Improvements By Shrikant Baldi,
USAID FROM THE AMERICAN PEOPLE
 USAID FROM THE AMERICAN PEOPLE I. Executive Summary USAID Water and Development Country Plan for South Sudan In alignment with the Global Water Strategy and the USAID Agency Plan, USAID/South Sudan is
UNICEF Lao PDR TERMS OF REFERENCE FOR SERVICES CONTRACT
 UNICEF Lao PDR TERMS OF REFERENCE FOR SERVICES CONTRACT Title: International Individual Consultancy for WASH District-Level Bottleneck Analysis Requesting Section: WASH Start and end dates: January to
Rural Drinking Water Situation: Challenges and Opportunities in West Bengal
 Rural Drinking Water Situation: Challenges and Opportunities in West Bengal ABSTRACT S.N. Dave, shdave@unicef.org United Nations Children s Fund, Kolkata, India A. Shunmuga Sundarraj, arunassundarraj@gmail.com
Corporate Social Responsibility Policy of SAIPL for
 Considered and approved by CSR Committee in its meeting held on 25/04/2016 for recommendation to the Board Considered and approved by Board in its meeting held on 19/05/2016 Corporate Social Responsibility
Provision of drinking water and sanitation in rural areas: success stories of PPCPs
 Loughborough University Institutional Repository Provision of drinking water and sanitation in rural areas: success stories of PPCPs This item was submitted to Loughborough University's Institutional Repository
L/C/TF Number(s) Closing Date (Original) Total Project Cost (USD) IDA Nov ,000,000.00
 Closing Date (Original) Total Project Cost (USD) IDA Nov ,000,000.00") Public Disclosure Authorized Independent Evaluation Group (IEG) 1. Project Data Report Number : ICRR0021262 Public Disclosure Authorized Public Disclosure Authorized Project ID P101650 Country India Project
Public Disclosure Authorized Independent Evaluation Group (IEG) 1. Project Data Report Number : ICRR0021262 Public Disclosure Authorized Public Disclosure Authorized Project ID P101650 Country India Project
Chapter 3. Decentralisation in Water Supply and Sanitation Sector
 Decentralisation in Water Supply and Sanitation Sector Decentralisation in Water Supply and Sanitation Services 3.1. Introduction Water supply and sanitation sector has been given enormous emphasis in
National Agriculture Technology Project (N A T P)
") National Agriculture Technology Project (N A T P) This project was launched by the ICAR on June 30, 1998, with the support of the World Bank to strengthen and complement the existing resources and to argument
National Agriculture Technology Project (N A T P) This project was launched by the ICAR on June 30, 1998, with the support of the World Bank to strengthen and complement the existing resources and to argument
Community Based Rural Water Supply Schemes in Post Conflict Areas in Sri Lanka
 Sharing Experiences in Implementing Community Based Rural Water Supply Schemes in Post Conflict Areas in Sri Lanka I.V.W.Ediriweera, Assistant General Manager, National Water Supply and Drainage Board,
CHANGE MANAGEMENT INITIATIVE
 CHANGE MANAGEMENT INITIATIVE Origins: Faced with a growing water crisis and a problem of identity within the water sector, the Tamil Nadu Water Supply and Drainage (TWAD) Board initiated a unique process
Providing Water and Sanitation in Uganda by Quentin Wodon
 Providing Water and Sanitation in Uganda by Quentin Wodon This brief is part of a series of seven briefs/case studies on increasing the impact of Rotary. If Rotary is to have a larger impact globally,