Measurements and Modeling to Support Science/Policy Scenarios for Differential Effects of Particle Components
|
|
|
- Norman Leonard
- 6 years ago
- Views:
Transcription
1 Measurements and Modeling to Support Science/Policy Scenarios for Differential Effects of Particle Components Ted Russell* Georgia Tech *And a huge cast of others who have contributed This study was supported by the U.S. EPA under Grants RD , RD , RD , RD and RD , Southern Company, Georgia Power and others. This support should not construe endorsement.
2 Acknowledgements Funding US EPA Southern Company/Georgia Power NASA Gyeongsangnam do Province Government of Korea The Georgia Tech Emory Air Quality and Health Group

 S ij (x,t) Atmospheric Processing")
 S ij HE HE(x,t) D k (t)")
3 Linking Health Impacts to Air Quality and Sources Air Quality Measurement and Modeling S j C i Exposure Assessment E j (t) S ij (x,t) Atmospheric Processing Chemistry C i (x,t) X k (t) C i HE E k (t) S ij HE HE(x,t) D k (t) Epidemiologic Analysis

4 Presentation Focus: Concentrations and Source Impacts Air Quality Measurement Model C i (x,t) S ij (x,t) X How well do our current monitoring networks, instrumentation and models support air quality management accounting for differential PM species toxicities? Regulatory frameworks (JB Scenarios) Health studies
5 Initial Thoughts Measurements have spatial, temporal and compositional limitations Can not measure source impacts
 do? What might we able to do if asked? What is likely out of the question in the near term? What are the uncertainties?")
6 Questions Measurements of the composition and modeling of the source impacts are central to developing the foundation for policies that account for the potential differential impacts of particle components What can we (currently) do? What might we able to do if asked? What is likely out of the question in the near term? What are the uncertainties? Are they big?
7 Measurements We can measure anything,* But We can t measure everything Monitoring is a different issue *By anything, I mean likely important species component(s) of PM, of various sizes. As always, there a few qualifications we can discuss
8 Monitoring: What you currently get PM 2.5 mass: wealth of data Daily, hourly (could go finer) Filter, TEOM, BAMS Composition (usually every 3 rd or 6 th day) 24 hr (usually) Metals (XRF) Ng m 3 level depending upon species, can go lower (ICP MS) Major ions (IC) Sub μg m 3 level Elemental and organic carbon (EC/OC) (TOR) Sub μg m 3 level What is measured is operationally defined Gases: O 3, NO x,2, CO, SO 2 (useful and important)

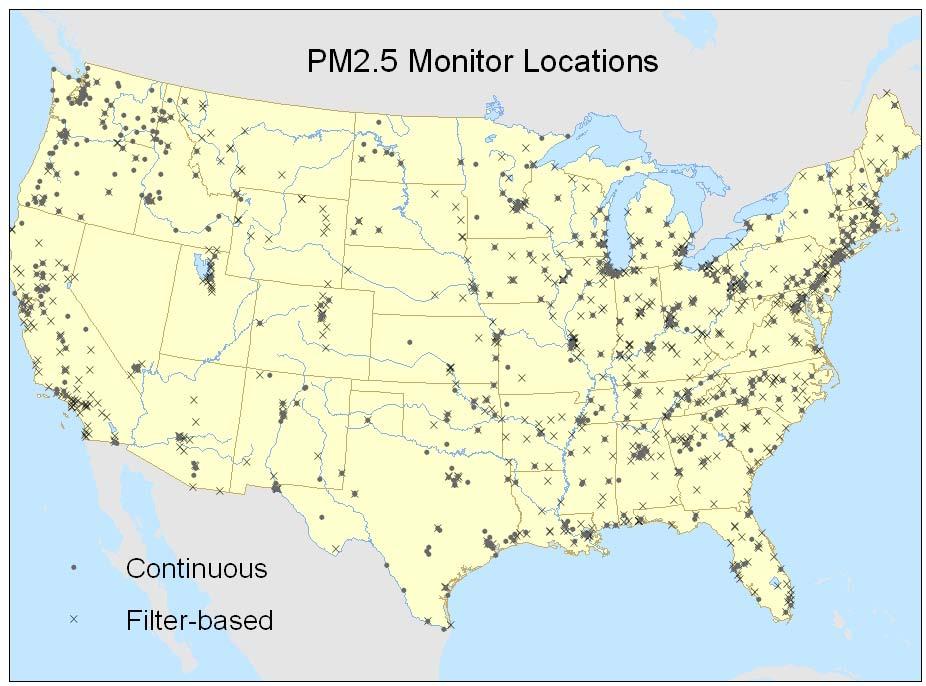

9 PM Monitors
10 What more could you want? Similar compositional detail more than every 3 rd /6 th day Composition at shorter time scales More constituents for reasonable cost Can we really use this right now in health studies? We don t seem to be using the hourly mass measurements much. Detailed organic speciation Maybe something between OC and total detail will do? Metal oxidation state Might this be important? More size resolution With corresponding chemical composition???? More spatial coverage Of all of the above
 Supersite Review Evaluated both commercial and")


11 You can have it! PM instruments reviewed in Chow et al., (2008) Supersite Review Evaluated both commercial and research instruments: More available now Continuous Element Continuous Mass Sizing and Mass/Comp Integrated Mass/Composition Continuous Carbon Single Particle Continuous Ion Particle # /Size Chow et al., (2008) JAWMA, 58:2
12 First: How well do the current routine measurements support potential regulatory scenarios? Current mass standard: Well supported Speciation measurements also provide support for attainment modeling and management Scenario A (specific species found to have increased toxicity) If it is a currently measured species (specific metals, ionic compounds), well supported. Specific organics: poor support Scenario B (PM from specific sources have increased toxicity) Weak support (no current method to directly measure a source contribution). Provides data that can be used to estimate source impacts Significant uncertainties (discussed under modeling) Scenario C (some component(s) exacerbate toxicity by interactions) Poorly supported (acidity not measured, physico chemical interactions likely complex I have my doubts about this scenario being viable Scenario D (some species have minimal toxicity) Solid support as the likely species involved would be readily identified Exception: some fraction of OC Scenario E (everything) Strong support, except for carbonaceous fraction Measurements readily upgraded for a variety of species if needed.
13 Temporally Extended Composition Measurements*(similar compositional detail) Insight can be gained from SEARCH** Great data set being used for Epi studies Limited geographically Same methods (filter based), just everyday Cost goes up and better ways for EC/OC and ions Metals? Shorter time scales (plus everyday) Semi continuous EC/OC: Sunset, optical Semi continuous ionic: PILS, vaporization, Metals are tougher (but oh so important) Can be done for limited sets of metals (SEAS, PILS) *Great reference: JAWMA, (2008) 58:2 Supersite Issue ** Hansen, Edgerton et al., JAWMA articles
14 Organic Aerosol (OA) Composition Currently get limited information on carbonaceous composition from routine monitors EC/OC operationally defined (e.g., TOR vs. TOT) GC MS analysis of filters can provide concentrations of a range of individual OC s Need to have targets Expensive More limited OA composition possible and informative Aerosol mass spectrometry, FTIR to give more limited info. Structural information, HOA, OOA Water soluble OA and some components (PILS+sensors) Provides information on source impacts
15 Size, but no composition Important if ultrafine particle number is linked to health effects Size distributions readily measured Additional separation to get mass of finer PM size range Size distribution Mix of optical and mobility analyzers can go down to nm levels. Molecular clusters Level of detail achievable beyond what is likely usable in most health studies or health based NAAQS analyses
16 Size and Composition Impactors can provide size and composition for a limited set of compounds Metals Ions Some OC components Man power intensive Aerosol mass spectrometry Some significant limitations and expensive* Lower size range cut off Not species composition *but getting cheaper
17 Satellite Retrievals Satellite data can provide broad spatial coverage Growing availability of satellite retrievals, e.g., Aerosol Optical Depth (AOD) AOD related to light extinction, which is related to particulate loading Dimensionless measure of light extinction over the entire vertical column of air through the atmosphere Satellites MODIS (Moderate resolution Imaging Spectroradiometer 550 nm) Polar orbiting satellite (Terra), Frequency: 1 2 days, Resolution: 10 km MISR (Multi angle Imaging Spectroradiometer 558 nm) Also aboard Terra, 4 7 days, 17.6 km GOES (Geostationary Operational Environmental Satellite 550 nm) Geostationary orbit, ~15min, 4 km Linked to mass, but little compositional information. Can fill in spatial gaps (Koutrakis and coworkers, Paciorek &cw) Utilization of retrievals (Liu et al., 2004, 2009) Add AOD in Land Use regression modeling
. Lower correlation with observations r = 0.70 GOES AOD is not the strongest predictor of PM2.")
18 Annual average predicted PM2.5 on days when AOD is retrieved (sample size = 2,570). High correlation with observations r = Annual average predicted PM2.5 on days when AOD is not retrieved (same model form but without AOD, N = 7,009 ). Lower correlation with observations r = 0.70 GOES AOD is not the strongest predictor of PM2.5 in this case, but it stratifies PM2.5 concentrations into two different spatial patterns. 18 Liu, Y; Paciorek, CJ; Koutrakis, P (2009) Env. Helth Persp., 117:
19 Measurement Information: Identifying Key Needs What additional measurements would be most valuable to conducting health studies?
 Objectives To characterize air pollutant exposure measurement error due to instrument precision and spatial variability To assess the impact of these measurement errors on a timeseries")
20 Effect of Errors on Health Associations (Goldman et al., subm.) Objectives To characterize air pollutant exposure measurement error due to instrument precision and spatial variability To assess the impact of these measurement errors on a timeseries epidemiologic study Approach Use observations from monitors in Atlanta to estimate types of errors involved and simulate their effects on health association (RR) results Develop modified semi variograms describing variations between observed concentrations at one location and concentrations a distance away Atlanta Monitoring Network (Routine, SEARCH, ASACA)
21 Change in Risk Ratio per IQR due to Error Introduction (CVD and CO, 99 04) CO risk ratio per IQR Risk Ratio % bias to null 34% bias to null hr max. CO, central monitor Instrument error added Instrument + spatial error added Goldman et al., show the results for multiple pollutants, type of error added
22 Reducing Error Increased spatial information reduces error more than improved instrumental accuracy But it would take a lot of additional monitors Lamp post problem Does not address: What species might be more valuable Importance of frequency Models can help fill in spatial and temporal gaps But introduce an additional uncertainty
23 Measurements: Summary Routine networks Mass Significant compositional information (Scenarios A, D, E) Individual OC s missing (Poor support for some of A, B, E) Non routine measurements can provide great wealth of information Need to think what is most usable, biggest bang for buck Measurement technology can and will respond to health results Chicken and egg problem Key weaknesses OC composition Spatial coverage (satellites can help fill in gaps, but limted) Models can assist Possibly: UFP characterization May not be measuring the primary actor(s) (Weakens Scenarios A support) Need to relate PM to sources and potential enabling (Scenarios B,C) Models provide key
24 Roles Health Air Quality Modeling Source impacts (getting to Scenario B) Fill in spatial/temporal gaps in measured concentrations Estimate unmeasured concentrations Management/Regulation Source impacts (Scenario B) Control strategy determination (all Scenarios) Science

25 Traditional Approach in Health Assessment Health endpoints Sulfate Sulfate SDK FTM TUC JST μ g / m 3 YG Statistical Analysis Association 01/01/04 01/08/04 01/15/04 01/22/0 4 01/29/0 4 02/05/04 02/12 /0 4 02/19 /0 4 02/26 /0 4 03/04 /0 4 03/11 /0 4 03/18/04 03/25/04 04/01/0 4 04/08/0 4 04/15/0 4 04/22/0 4 04/29/0 4
26 Model Enhanced Analyses Data Health Endpoints Air Quality Model(s) Concentration Fields: C(x,t) and Source Impacts: S(x,t) Statistical Analysis Association between Concentrations or Source Impact and Health Endpoints
27 Types of Air Quality Models Empirical: Driven by observed concentration data Regression (e.g., LUR) Receptor (e.g., CMB, PMF, UNMIX) (Chemical) Transport: First principles, driven by estimated emissions, meteorology, chemistry Gaussian plume (AERMOD) Grid (CMAQ, CAMx)
")
28 Source Apportionment (SA) Modeling: Emprical vs. Emissions Based Models Source-compositions Emissions Inventory Chemistry Meteorology c i fijs j + e = i Source Impacts Empirical or Receptor (monitor) Air Quality Receptor Model: CMB, PMF, UNMIX Emissions-based Model (3D Air-quality Model): CMAQ, CAMX, AERMOD
29 Fractional Source Impacts Fractional Source Impacts SOC decreases in winter SOC AMMONIUM NITRATE SULFATE Coal Combustion Biomass burning Road dust Diesel vehicle Gasoline vehicle EBSP Summer MBSP Summer EBSP Winter MBSP Winter
30 Regression Models Improved estimates of concentrations in space/time Land use regression (LUR) C*(x,t)=f(C obs (x,t),additional information) Use multiple observations to develop spatially varying fields (C(x,t)) C(x i,t) = β 0 + Σβ 1ij *C(x j mon,t) + Σβ 2j *VMT ij + Σβ 3ij *LU j + β 4j *E j (t) + e ij Often based on saturation monitoring to provide additional detail Can integrate satellite retrievals Source apportionment Blanchard et al. SOA/POA estimation OC = a + b*ec + c*co + d*o 3 + e*lag(o 3 ) + f*so 4 + g*no 3 POC = b*ec + c*co SOC = d*o 3 + e*lag(o 3 ) + f*so 4 + g*no 3
31 Issues: Empirical Models Uncertainties (in rough order of importance) Observational network limitations Scarcity (spatially limited, temporal limitations on species) How well monitor(s) represents population exposure Capturing microenvironments (e.g., near source) Regression (LUR or other) can help fill Species captured/identified Limited quantification of components» Little organic speciation, metal oxidation state May not be observing the most important components Source apportionment of observed concentrations PM (or OC) from which sources have health effect(s)? For Regression Techniques Extrapolating model to other locations and times Within area extrapolation included Collecting added observations Monitor accuracy
32 Source Based AQMs (e.g., CMAQ) Air Quality Goals Air Quality/Health Impacts Controls Chemistry Pollutant Distributions Air Quality Model Emissions Meteorology
33 CMAQ Results Found little variation in daily fractional impact of sources to PM Fractional Source Contributions to Primary PM2.5 Epidemiologic analyses depends on variability Less impact on regulatory application 100% 80% 60% 40% 20% 0% Fraction of PM by source JULY JANUARY LDGV HDDV SDUST BURN Coal Lack of fractional impact variation tied to lack of variation in input emissions and meteorology

34 CMAQ Biases CMAQ (and other AQMs) have known biases OC: Low Incomplete knowledge of secondary organic aerosol (SOA) formation Crustals: High Effective emission estimates Corrected using MATS for regulatory applications Species specific adjustments RCFM: Reconstructed fine mass MATS: Model Attainment Test Software
35 Issues with Source based Air Quality for Identifying/Regulating PM Differential Toxicity Concerns (decreasing order of importance) Significant biases in OC Related to lack of understanding of secondary organic aerosol formation Hot area, research models show marked improvements For regulatory application, bias corrected using MATS adjustment Estimating uncertainties in source impacts and simulated concentrations Emissions uncertainties Can deal with these Spatial variation of inputs Temporal variation of inputs Emissions Same temporal distribution (almost) every day in every location Meteorology Scale (e.g., CMAQ at 4 km resolution) Apply fine scale model
36 Improving Source Apportionment Results and Uncertainty Estimation Various source apportionment techniques (receptor and source based) quantify source impacts Results can differ significantly Even between similar receptor modeling approaches Uncertainties poorly characterized Some methods provide a measure of uncertainty (untested) Address using ensembling of model results Combine the results of 5 different source apportionment results to develop an ensemble average for each day of a two one month periods (winter and summer) Receptor based: PMF, and three flavors of CMB (Regular: RG, Molecular marker: MM and LGO (integrates gaseous species info)) Source based: CMAQ
37 Re estimation of Impact and Uncertainty Initial and revised estimates of uncertainty and ensemble source impact for diesel vehicles on PM2.5 Fractional Diesel Source impact on PM 2.5 Fractional Source Impact Ensemble Results for DV on 7/12/01 Initial Ensemble Updated Ensemble CMB-RG CMB-LGO PMF CMB-MM CMAQ Ensemble Revised uncertainties in each method about 25-40% of fractional estimate Ensemble about 15%
38 Integrated Indicators for Health Association Analysis and Regulatory App. Develop integrated indicator for Epi analysis Integrated Mobile Source Indicator: IMSI=f(NO 2, CO, EC) Scenario B Stronger correlation than other measures Potential for regulatory application (Scenario B)? Indicators & Circulatory Outcomes RR IMSI_2 PMF MOBILE PMF DIESEL EC
39 Evolving Approach: Statistical Data Model Blending Given the issues with using different types of SA models and data directly, greater data model blending has been suggested Observed Concentrations Emissions Air Quality Model(s) Simulated Concentrations C i (x,t), S j (x,t) Feedback to modify emissions Likely best approach Can use C i (x,t) or S j (x,t) in health analyses Still need to quantify uncertainties
40 Where I think we can/will be in 5 10 years? Knowledge of pollutant health effects will support: Probably: Mix of A (e.g., specific metals, maybe a class of organics) and B (e.g., primary EC and OC from IC engines) Primary EC/OC from a source not directly measurable Potentially: D (e.g., sea salt PM being relatively non toxic) Doubts about: C (role of acids in the environment as enablers not evident, being able to show enabling gases) E, but rather unlikely to be there Measurement and modeling capabilities will support: Current approach Scenarios A, D B and C problematic
41 Problem with Scenario B What if we determine that PM from a source (e.g., diesels) has increased toxicity? We can not directly measure source impacts so: Measurement would be operationally defined (if definable) Possibly identify one or more surrogates that are measurable California links DPM to NOx, others to EC, could use combination (IMSI) Model estimation would introduce non trivial uncertainties And require significant attention to what modeling approach is viable NAAQS on source PM presents multiple complexities Have to identify indicator(s)
42 Summary PM Measurements Growing wealth of information on mass and some composition from routine networks Spatial limitations OC speciation Temporal limitations can readily be addressed using semi continuous monitors Instruments available to provide added detail OC Structural information Indication of primary versus secondary Specific species more resource intensive Temporal limitations readily addressed using semicontinuous monitors for EC/OC, ionics, metals more limited Size Measurement capabilities can readily support most aspects of JB scenarios A, D, E B and C largely excluded Air quality modeling Identify source impacts Partial support of JB Scenario B Central to air quality management Provide additional temporal, spatial and compositional information Introduce uncertainties Source apportionment adds % to initial uncertainty at receptor Is it better to just use observed concentrations directly?» Use multipollutant indicators
Chemical composition and source apportionment of PM 1.0, PM 2.5 and PM in the roadside environment of Hong Kong
 Chemical composition and source apportionment of PM 1.0, PM 2.5 and PM 10-2.5 in the roadside environment of Hong Kong Dr. Cheng Yan Department of Environmental Science and Technology School of Human Settlements
Particulate Matter Science for Policy Makers: A. Ambient PM 2.5 EXECUTIVE SUMMARY MASS AND COMPOSITION RESPONSES TO CHANGING EMISSIONS
 Particulate Matter Science for Policy Makers: A NARSTO Assessment was commissioned by NARSTO, a cooperative public-private sector organization of Canada, Mexico and the United States. It is a concise and
OC/EC Aerosol Measurements
 OC/EC Aerosol Measurements Importance for National and International Policy An International Workshop for the Development of Research Strategies for Sampling and Analysis of Organic and Elemental Carbon
Policies for Addressing PM2.5 Precursor Emissions. Rich Damberg EPA Office of Air Quality Planning and Standards June 20, 2007
 Policies for Addressing PM2.5 Precursor Emissions Rich Damberg EPA Office of Air Quality Planning and Standards June 20, 2007 1 Overview Sources of direct PM2.5 and SO2 must be evaluated for control measures
SEARCH & VISTAS Special Studies. RPO National Technical Meeting St. Louis, MO November 5, 2003
 SEARCH & VISTAS Special Studies RPO National Technical Meeting St. Louis, MO November 5, 2003 Outline SEARCH Overview Data Quality for Continuous PM Carbon Collaboration NH 3 Measurements Biomass Emissions
Where There s Smoke There s Haze: Estimating the Contribution of Fire Types to PM2.5 and Haze
 Where There s Smoke There s Haze: Estimating the Contribution of Fire Types to PM2.5 and Haze Bret A. Schichtel (NPS), William C. Malm (NPS), Jeffrey L. Collett, Jr. (CSU), Amy P. Sullivan (CSU), Amanda
Combustion Aerosol Emission Measurements
 Combustion Aerosol Emission Measurements Lisa Graham Senior Chemist 1 Overview With the objective of highlighting sources of discrepancies and uncertainties Combustion sources of aerosols Characteristics
Application of PMF analysis for assessing the intra and inter-city variability of emission source chemical profiles
 Application of PMF analysis for assessing the intra and inter-city variability of emission source chemical profiles E. Diapouli, M. Manousakas and K. Eleftheriadis Environmental Radioactivity Laboratory
Fine Particulate Matter in the San Joaquin Valley: Introduction to Sources, Atmospheric Chemistry, and Transport
 Fine Particulate Matter in the San Joaquin Valley: Introduction to Sources, Atmospheric Chemistry, and Transport Michael Kleeman Civil and Environmental Engineering, UC Davis Health Effects of Airborne
SOURCE APPORTIONMENT OF PM2.5 AEROSOL MASS AT GWANGJU, KOREA DURING ASIAN DUST AND BIOMASS BURNING EPISODIC PERIODS IN 2001
 SOURCE APPORTIONMENT OF PM2.5 AEROSOL MASS AT GWANGJU, KOREA DURING ASIAN DUST AND BIOMASS BURNING EPISODIC PERIODS IN 2001 HanLim Lee, Kyung W. Kim, Young J. Kim* ADvanced Environmental Monitoring Research
EPA Regional Modeling for National Rules (and Beyond) CAIR/ CAMR / BART
 CAIR/ CAMR / BART") EPA Regional Modeling for National Rules (and Beyond) CAIR/ CAMR / BART 1 Emissions & Modeling Contacts Pat Dolwick Meteorology and Episodic Ozone Modeling Brian Timin Speciated Modeled Attainment Test
EPA Regional Modeling for National Rules (and Beyond) CAIR/ CAMR / BART 1 Emissions & Modeling Contacts Pat Dolwick Meteorology and Episodic Ozone Modeling Brian Timin Speciated Modeled Attainment Test
APPLICATION OF AN ENSEMBLE-TRAINED SOURCE LOUIS MIDWEST SUPERSITE
 APPLICATION OF AN ENSEMBLE-TRAINED SOURCE APPORTIOMENT METHOD TO SPECIATED PM 2.5 DATA AT THE ST. LOUIS MIDWEST SUPERSITE A Thesis Presented to The Academic Faculty by Marissa L. Maier In Partial Fulfillment
Air pollution health impact assessment: PM 2.5 exposures, sources and components
 Assessing the Climate and Health Co-Benefits of Clean Cooking Global Alliance for Clean Cookstoves / Environmental Defense Fund July 16th 17th 2015 Washington D.C. Air pollution health impact assessment:
Final Ozone/PM2.5/Regional Haze Modeling Guidance Summary. AWMA Annual Conference Brian Timin June 28, 2007
 Final Ozone/PM2.5/Regional Haze Modeling Guidance Summary AWMA Annual Conference Brian Timin June 28, 2007 Ozone/PM2.5/Regional Haze Modeling Guidance Guidance on the use of Models and Other Analyses for
PMF modeling for WRAP COHA
 PMF modeling for WRAP COHA Introduction In order to identify the sources of aerosols in the western United States, Positive Matrix Factorization (PMF) receptor model is applied to the 24-hr integrated
Air Pollution and Acute Respiratory Infections among
 Air Pollution and Acute Respiratory Infections among Children 0 4 Years of Age: an 18 Year Time Series Study Society of Toxicology Occupational and Public Health Specialty Sections October 30, 2015 Lyndsey
O3/PM2.5/Regional Haze Modeling Guidance Summary. Brian Timin EPA/OAQPS Western Met, Emissions, and AQ Modeling Workshop June 22, 2011
 O3/PM2.5/Regional Haze Modeling Guidance Summary Brian Timin EPA/OAQPS Western Met, Emissions, and AQ Modeling Workshop June 22, 2011 1 Ozone/PM2.5/Regional Haze Modeling Guidance Guidance on the use of
Using satellites to improve our understanding on air pollution
 Using satellites to improve our understanding on air pollution CESAM & Dep. Environment and Planning 28-11-2011, Workshop on Space Technologies & Synergies with Technological Poles, IT, Aveiro, Portugal
Enhanced Air Pollution Health Effects Studies Using Source-oriented Chemical Transport Models
 Enhanced Air Pollution Health Effects Studies Using Source-oriented Chemical Transport Models Jianlin Hu, Nanjing University of Information Science & Technology Michael J. Kleeman, Bart Ostro, University
The Need for More Extensive Air Quality Monitoring to Resolve the Air Quality Health Issue
 The Need for More Extensive Air Quality Monitoring to Resolve the Air Quality Health Issue Ronald E. Wyzga, Sc.D. Senior Technical Executive May 13, 2010 Xi an, China Current Regulatory Monitoring USEPA,
Chemical Speciation of Ultrafine Particulate Matter
 Chemical Speciation of Ultrafine Particulate Matter James J. Schauer, Ph.D., PE Associate Professor Overview Big Picture Comments Sampling and Analysis Considerations Examples California Ambient Data DOE
Source Apportionment of Daily Fine Particulate Matter at Jefferson Street, Atlanta, GA, during Summer and Winter
 Journal of the Air & Waste Management Association ISSN: 1096-2247 (Print) 2162-2906 (Online) Journal homepage: http://www.tandfonline.com/loi/uawm20 Source Apportionment of Daily Fine Particulate Matter
PM2.5 Implementation Rule- Modeling Summary. Brian Timin EPA/OAQPS June 20, 2007
 PM2.5 Implementation Rule- Modeling Summary Brian Timin EPA/OAQPS Timin.brian@epa.gov June 20, 2007 Attainment Demonstrations CAA Section 172(c) requires States with a nonattainment area to submit an attainment
Source Apportionment of PM 2.5 at Three Urban Sites Along Utah s Wasatch Front
 Source Apportionment of PM 2.5 at Three Urban Sites Along Utah s Wasatch Front Robert Kotchenruther, Ph.D. EPA Region 10 October 6, 2011 Motivation for this analysis: Utah and Idaho share a PM2.5 nonattainment
Comparing Multipollutant Emissions-Based Mobile Source Indicators to Other Single Pollutant and Multipollutant Indicators in Different Urban Areas
 Int. J. Environ. Res. Public Health 2014, 11, 11727-11752; doi:10.3390/ijerph111111727 OPEN ACCESS Article International Journal of Environmental Research and Public Health ISSN 1660-4601 www.mdpi.com/journal/ijerph
URBAN VS. RURAL AIR POLLUTION IN NORTHERN VIETNAM
 ASAAQ 25, 27-29 April 25, San Francisco, lifornia USA URBAN S. RURAL AIR POLLUTION IN NORTHERN IETNAM P. D. Hien*,. T. Bac, N.T.H. Thinh, D. T. Lam ietnam Atomic Energy Commission, 59 Ly Thuong iet, Hanoi,
NEW Atmospheric Science
 NEW Atmospheric Science Jeffrey R. Brook Environment and Climate Change Canada University of Toronto British Columbia Lung Association 2018 Air Quality and Health Workshop The Future of Air Quality Management
SOURCE ALLOCATION AND VISIBILITY IMPAIRMENT IN TWO CLASS I AREAS WITH POSITIVE MATRIX FACTORIZATION
 SOURCE ALLOCATION AND VISIBILITY IMPAIRMENT IN TWO CLASS I AREAS WITH POSITIVE MATRIX FACTORIZATION Keith A. Rose Senior Environmental Scientist U.S. Environmental Protection Agency, Region 1 Rose.Keith@epa.gov
EVE 402/502 Air Pollution Generation and Control. Background. Background. 1. Introduction to Particulate Matter 2. Real (old) data in Atlanta
 data in Atlanta") EVE 42/2 Air Pollution Generation and Control 1. Introduction to Particulate Matter 2. Real (old) data in Atlanta Background What is PM 2.? Solid (or liquid) particles with aerodynamic diameters < 2. mm
EVE 42/2 Air Pollution Generation and Control 1. Introduction to Particulate Matter 2. Real (old) data in Atlanta Background What is PM 2.? Solid (or liquid) particles with aerodynamic diameters < 2. mm
A comparative study on multi-model numerical simulation of black carbon in East Asia
 A comparative study on multi-model numerical simulation of black carbon in East Asia Zifa Wang, Hajime Akimoto and Greg Carmichael, Xiaole Pan, Xueshun Chen, Jianqi Hao(IAP/CAS), Wei Wang (CMEMC), and
IS IT OR IS IT SMOKE? Beyond visual observation we cannot differentiate between smoke and any other organic aerosol.
 IS IT ------------ OR IS IT SMOKE? Beyond visual observation we cannot differentiate between smoke and any other organic aerosol. WHY DO WE NEED TO APPORTION ORGANIC AERSOLS PM2.5 STANDARD REGIONAL HAZE
Is there need to collect routine ammonia/ammonium measurements in ambient air monitoring networks?
 Is there need to collect routine ammonia/ammonium measurements in ambient air monitoring networks? Perspectives of a Data Analyst from a Small State Air Pollution Regulatory program Is there need to collect
Model Evaluation and SIP Modeling
 Model Evaluation and SIP Modeling Joseph Cassmassi South Coast Air Quality Management District Satellite and Above-Boundary Layer Observations for Air Quality Management Workshop Boulder, CO May 9, 2011
Investigation of Fine Particulate Matter Characteristics and Sources in Edmonton, Alberta
 Investigation of Fine Particulate Matter Characteristics and Sources in Edmonton, Alberta Executive Summary Warren B. Kindzierski, Ph.D., P.Eng. Md. Aynul Bari, Dr.-Ing. 19 November 2015 Executive Summary
Current Issues in Aerosol Science: Recent Progress and New Challenges Urs Baltensperger Laboratory of Atmospheric Chemistry Paul Scherrer Institute,
 Current Issues in Aerosol Science: Recent Progress and New Challenges Urs Baltensperger Laboratory of Atmospheric Chemistry Paul Scherrer Institute, 5232 Villigen PSI, Switzerland Int. Workshop on Changing
SOURCE ALLOCATION AND VISIBILITY IMPAIRMENT IN TWO CLASS I AREAS WITH POSITIVE MATRIX FACTORIZATION
 SOURCE ALLOCATION AND VISIBILITY IMPAIRMENT IN TWO CLASS I AREAS WITH POSITIVE MATRIX FACTORIZATION Keith A. Rose Senior Environmental Scientist U.S. Environmental Protection Agency, Region 1 June 13,
Development of a 2007-Based Air Quality Modeling Platform
 Development of a 2007-Based Air Quality Modeling Platform US EPA Office of Air Quality Planning and Standards Heather Simon, Sharon Phillips, Norm Possiel 1 NEI Other EI Data Regulatory Modeling Platform
OPERATIONAL EVALUATION AND MODEL RESPONSE COMPARISON OF CAMX AND CMAQ FOR OZONE AND PM2.5
 OPERATIONAL EVALUATION AND MODEL RESPONSE COMPARISON OF CAMX AND CMAQ FOR OZONE AND PM2.5 Kirk Baker*, Sharon Phillips, Brian Timin U.S. Environmental Protection Agency, Research Triangle Park, NC 1. INTRODUCTION
Transport of aerosols: Regional and global implications for air quality (, weather, and climate)
") Transport of aerosols: Regional and global implications for air quality (, weather, and climate) Mian Chin, Hongbin Yu, Thomas Diehl NASA Goddard Space Flight Center, U.S.A. Long-range transport of aerosols:
Transport of aerosols: Regional and global implications for air quality (, weather, and climate) Mian Chin, Hongbin Yu, Thomas Diehl NASA Goddard Space Flight Center, U.S.A. Long-range transport of aerosols:
Assessment of aerosol fields over East Asia modeled by CESM with MOSAIC
 Assessment of aerosol fields over East Asia modeled by CESM with MOSAIC Zheng Lu, Xiaohong Liu University of Wyoming Tianyi Fan Beijing Normal University Rahul A. Zaveri, Balwinder Singh, Richard Easter,
Comparisons of CMAQ and AURAMS modeling runs over coastal British Columbia
 Comparisons of CMAQ and AURAMS modeling runs over coastal British Columbia Robert Nissen Environment Canada Contact: robert.nissen@ec.gc.ca Collaborators: NW-AIRQUEST Meeting, Seattle, February 2, 2012
PM2.5 NAAQS Implementation & Permitting in Georgia
 PM2.5 NAAQS Implementation & Permitting in Georgia Georgia Environmental Conference Jekyll Island, Georgia August 25, 2016 Brad James, P.E. Overview Current UFP Regulation (as PM 2.5 ) PM 2.5 NAAQS SIP
Traffic-Related Air Pollution: A Moving Target
 Traffic-Related Air Pollution: A Moving Target Jeffrey R. Brook Environment and Climate Change Canada University of Toronto Health Effects Institute 2018 Annual Conference Chicago A Target that moves in
Sensitivity of air quality simulations in the Lower Fraser Valley of British Columbia to model parameterizations and emission sources
 Sensitivity of air quality simulations in the Lower Fraser Valley of British Columbia to model parameterizations and emission sources Robert Nissen, Paul Makar, Andrew Teakles, Junhua Zhang, Qiong Zheng,
High time resolution measurements of PM 2.5 and PM 10 using X-ray fluorescence. David Green Cambridge Particle Meeting 23 rd June 2017
 High time resolution measurements of PM 2.5 and PM 10 using X-ray fluorescence David Green Cambridge Particle Meeting 23 rd June 2017 Contents 1. Why is this method useful? 2. How does it work? 3. Did
CHAPTER 6: SPECIAL MONITORING STUDIES & DATA ANALYSES ASSOCIATED WITH THE IMPROVE PROGRAM
 CHAPTER 6: SPECIAL MONITORING STUDIES & DATA ANALYSES ASSOCIATED WITH THE IMPROVE PROGRAM The results of four special studies conducted in association with the IMPROVE program are summarized here. The
EXPERIENCE OF SOURCE APPORTIONMENT STUDY IN INDIA
 INTERNATIONAL WORKSHOP ON VEHICULAR AIR POLLUTION AND ITS IMPACT ON HUMAN HEALTH: NEW DELHI, SEPTEMBER 01 02, 2011 EXPERIENCE OF SOURCE APPORTIONMENT STUDY IN INDIA Dr. Prashant Gargava Senior Environmental
Recent Source Apportionment Analyses and Understanding Differences in STN and IMPROVE Data
 Recent Source Apportionment Analyses and Understanding Differences in STN and IMPROVE Data Eugene Kim and Philip K. Hopke Center for Air Resources Engineering and Science Clarkson University MARAMA/NESCAUM
Optimizing the Design of Air Pollution Control Measures to Improve Human Health
 Optimizing the Design of Air Pollution Control Measures to Improve Human Health James J. Schauer, PhD, PE, MBA Professor Impacts of Air Pollution Human Health Acute and Chronic impacts Human Welfare Visibility
Contribution of Solid Fuel Burning to PM 2.5 in Residential Areas of Ireland
 Contribution of Solid Fuel Burning to PM 2.5 in Residential Areas of Ireland Ian O Connor, Eoin McGillicuddy, Jovanna Arndt, Stig Hellebust, Paul Buckley, Robert Healy, John Sodeau, John Wenger University
Top-down constraints to aerosol emissions from open biomass burning: the role of gasparticle partitioning and secondary organic aerosol formation
 Top-down constraints to aerosol emissions from open biomass burning: the role of gasparticle partitioning and secondary organic aerosol formation Igor B. Konovalov 1, Matthias Beekmann 2, Evgeny V. Berezin
Reporter:Qian Wang
 A discussion on the paper Formation mechanism and source apportionment of water-soluble organic carbon in PM 1, PM 2.5 and PM 10 in Beijing during haze episodes Reporter:Qian Wang 2 0 1 8. 9. 28 C O N
Understanding of the Heavily Episodes Using the
 Understanding of the Heavily Episodes Using the MM5-Model-3/CMAQ in Handan city, China Fenfen Zhang ab1, Litao Wang* ab, Zhe Wei ab, Pu Zhang ab, Jing Yang ab, Xiujuan Zhao ab a Department of Environmental
Evaluation of PM 2.5 in the MERRA Aerosol Reanalysis
 Evaluation of PM 2.5 in the MERRA Aerosol Reanalysis Arlindo da Silva (1) Arlindo.daSilva@nasa.gov Virginie Buchard-Marchant (1,2), Pete Colarco, Ravi Govindaradju (1,3) et al. (1) Global Modeling and
4/17/2018. Robert Kotchenruther EPA Region
 Using Source Apportionment from Positive Matrix Factorization Receptor Modeling to Apportion the Carbon component of and Anthropogenic Light Extinction at Class One Areas. Robert Kotchenruther EPA Region
J. Sciare, and LSCE-CAE team. Laboratoire des Sciences du Climat et de l'environnement (LSCE) Mix unit CNRS-CEA, Gif-sur-Yvette, France
 Mix unit CNRS-CEA, Gif-sur-Yvette, France") J. Sciare, and LSCE-CAE team Laboratoire des Sciences du Climat et de l'environnement (LSCE) Mix unit CNRS-CEA, Gif-sur-Yvette, France PRESENTATION + Domestic wood burning in France + New techniques to
J. Sciare, and LSCE-CAE team Laboratoire des Sciences du Climat et de l'environnement (LSCE) Mix unit CNRS-CEA, Gif-sur-Yvette, France PRESENTATION + Domestic wood burning in France + New techniques to
Links between global-scale emission estimates and national emission inventories
 Links between global-scale emission estimates and national emission inventories STEVEN J. SMITH Joint Global Change Research Institute College Park, MD Expert Meeting on Short-Lived Climate Forcers Geneva,
TPM11 - Session 4. PRA2. Asian Air Pollution - NAATS and Action Plan
 TPM11 - Session 4 PRA2. Asian Air Pollution - NAATS and Action Plan NAATS and Action Plan - PRA of Asian Air Pollution- 2014. 11. 12 Joonyoung Ahn 1, Akinori Takami 2, Fan Meng 3 1 Atmospheric Chemistry
Nested Global/Regional Modeling of Background Ozone Over the US
 Nested Global/Regional Modeling of Background Ozone Over the US Chris Emery ENVIRON International Corporation, Novato, CA WESTAR Western Ozone Transport Conference October 10-12, 2012 Template Introduction
Three Dimensional Air Quality System (3D-AQS)
") Three Dimensional Air Quality System (3D-AQS) American Geophysical Union 2007 Fall Meeting San Francisco, California December 7, 2007 Jill Engel-Cox Battelle Memorial Institute engelcoxj@battelle.org,
Three Dimensional Air Quality System (3D-AQS) American Geophysical Union 2007 Fall Meeting San Francisco, California December 7, 2007 Jill Engel-Cox Battelle Memorial Institute engelcoxj@battelle.org,
Aerosol from biomass burning and mineral aerosols. 1. What are aerosols from biomass burning?
 Lectures 40-41. Global change due to anthropogenic aerosols: Aerosol from biomass burning and mineral aerosols. Objectives: 1. What are aerosols from biomass burning? 2. What is mineral aerosol? 3. Direct
Satellite Products, the AQAST process, and EPA/OAQPS Air Quality Management Needs
 Satellite Products, the AQAST process, and EPA/OAQPS Air Quality Management Needs Rich Scheffe, Kirk Baker, Carey Jang, Pat Dolwick, James Kelly, Norm Possiel, Venkatesh Rao, Heather Simon (ack: J. Szykman,
CHAPTER 2 - Air Quality Trends and Comparisons
 CHAPTER 2 - Air Quality Trends and Comparisons Particulate Sampling Total Suspended Particulate Matter With the monitoring for PM 2.5 particulate matter being labor intensive, DEP reduced the number of
The Denver Air Toxics Assessments
 Denver Department of Environmental Health Environmental Quality Division The Denver Air Toxics Assessments Sabrina Williams Gregg Thomas City and County of Denver Department of Environmental Health Background
Anthropogenic Influence on Decadal Aerosol Trends and Aerosol-Cloud Interactions Over the Western North Atlantic Ocean
 Anthropogenic Influence on Decadal Aerosol Trends and Aerosol-Cloud Interactions Over the Western North Atlantic Ocean Andrew Jongeward* and Zhanqing Li Dept. of Atmospheric and Oceanic Science (AOSC)
NOAA Fire Emissions Product: The Blended Global Biomass Burning Emissions Product from MODIS and Geostationary Satellites (GBBEPx)
") 3 rd IBBI Workshop 23-26 April 2014 Schloss Ringberg, Bavaria, Germany NOAA Fire Emissions Product: The Blended Global Biomass Burning Emissions Product from MODIS and Geostationary Satellites (GBBEPx)
3 rd IBBI Workshop 23-26 April 2014 Schloss Ringberg, Bavaria, Germany NOAA Fire Emissions Product: The Blended Global Biomass Burning Emissions Product from MODIS and Geostationary Satellites (GBBEPx)
Models are an Integral Part of ABC Studies
 Models are an Integral Part of ABC Studies Field experiment planning Provide 4-Dimensional context of the observations Facilitate the integration of the different measurement platforms Evaluate processes
Earth Science Serving Society: Observations, Health, and Air Quality
 Earth Science Serving Society: Observations, Health, and Air Quality GEO User Interface Committee UIC Meeting: Health Break-out Group August 1-3, 2007 Lawrence Friedl & John Haynes Program Managers Applied
The importance of grid and domain size. Comparing 12 km Grid to Counties
 Setting up Regional Air Quality Models Modeling Domain Boundary Conditions Grid Structure Meteorological Model Pre processing/post processing Emissions Inventory 29 The Modeling Domain The size and nature
THE USE OF HUMAN OBSERVED VISUAL RANGE TO ESTIMATE AMBENT ATMOSPHERIC MASS CONCENTRATIONS
 THE USE OF HUMAN OBSERVED VISUAL RANGE TO ESTIMATE AMBENT ATMOSPHERIC MASS CONCENTRATIONS William C. Malm Colorado State University Bret Schichtel National Park Service Jenny Hand Colorado State University
Preparation of Fine Particulate Emission Inventories. Student Manual
 United States Air Pollution Training Institute (APTI) June 2004 Environmental Protection Mail Drop E14301 Agency Research Triangle Park, NC 27711 Air Preparation of Fine Particulate Emission Inventories
Urban Particulate Pollution Source Apportionment
 Simple Interactive Models for Better Air Quality Urban Particulate Pollution Source Apportionment Part 1. Definition, Methodology, and Resources Dr. Sarath Guttikunda January, 2009 Source Apportionment
CAMS AEROSOL UPDATES
 CAMS AEROSOL UPDATES Angela Benedetti Contributors: Samuel Remy (LMD), Alessio Bozzo (ECMWF), Graham Mann (University of Leeds), Sandip Dhomse (University of Leeds), Luke Jones (ECMWF), and Miha Razinger
Ultrafine Particulate Matter Emissions Inventory Prepared for the San Francisco Bay Area
 Ultrafine Particulate Matter Emissions Inventory Prepared for the San Francisco Bay Area Introduction Ultrafine particulate matter (UFP) refers to particles with aerodynamic diameter less than 0.1 micrometer
Hear perspective and receive input for plan from all affected stakeholders and subject matter experts Provide committee members with resources to
 1 January 11, 2017 Hear perspective and receive input for plan from all affected stakeholders and subject matter experts Provide committee members with resources to reach out to constituents that you represent
Evaluation of PM2.5 in Chicago by Chemical Mass Balance and Positive Matrix Factorization models
 Evaluation of PM2.5 in Chicago by Chemical Mass Balance and Positive Matrix Factorization models P. Scheff 1 & M. Rizzo 2 1 University of Illinois at Chicago 2 U.S. Environmental Protection Agency Region
J. Vira, E. Rodriguez, G. de Leeuw, M. Sofiev International Workshop on Air Quality Forecasting Research December 2012 Geneve Switzerland
 Regional-scale particulate matter emission estimates using satellite observations and variational inversion J. Vira, E. Rodriguez, G. de Leeuw, M. Sofiev International Workshop on Air Quality Forecasting
AIR STRATEGY ASSESSMENT PROGRAM: AN INTEGRATED SCREENING TOOL FOR AIR QUALITY PLANNING
 AIR STRATEGY ASSESSMENT PROGRAM: AN INTEGRATED SCREENING TOOL FOR AIR QUALITY PLANNING Darryl A. Weatherhead *, Bryan Hubbell, Dan Loughlin, Sarah Mazur, and David Misenheimer U.S. Environmental Protection
Near-Road Air Quality Monitoring and Modeling: Towards a Mechanistic Understanding
 Near-Road Air Quality Monitoring and Modeling: Towards a Mechanistic Understanding K. Max Zhang Energy and the Environment Research Laboratory Sibley School of Mechanical and Aerospace Engineering Outline
Optical properties of light absorbing organic aerosols(brown carbon) in North Nanjing. Reporter: Bao Mengying
 in North Nanjing. Reporter: Bao Mengying") Optical properties of light absorbing organic aerosols(brown carbon) in North Nanjing Reporter: Bao Mengying 2017.12.08 Outline Current work 1 2 3 4 Background Experiment Results and discussion Conclusion
Optical properties of light absorbing organic aerosols(brown carbon) in North Nanjing Reporter: Bao Mengying 2017.12.08 Outline Current work 1 2 3 4 Background Experiment Results and discussion Conclusion
WestJumpAQMS Progress Report 2008 Base Case and Preliminary Source Apportionment Modeling
 WestJumpAQMS Progress Report 2008 Base Case and Preliminary Source Apportionment Modeling ENVIRON International Corporation Alpine Geophysics, LLC UNC Institute for the Environment Template June 20, 2013
NETL AIR QUALITY RESEARCH PROGRAM
 Environmental & Water Resources 03/2004 NETL AIR QUALITY RESEARCH PROGRAM Identifying the Atmospheric Behavior and Implications of Coal Plant Emissions CONTACT POINTS William W. Aljoe Project Manager National
Jeff Johnston Manager, Science & Engineering Section Air Quality Program. Atmospheric Sciences 212 November 16, 2009
 Jeff Johnston Manager, Science & Engineering Section Air Quality Program Atmospheric Sciences 212 November 16, 2009 Motor vehicle emission check program Air monitoring Agricultural burning Burn bans (residential
Preparation of Fine Particulate Emissions Inventories. Lesson 1 Introduction to Fine Particles (PM 2.5 )
") Preparation of Fine Particulate Emissions Inventories Lesson 1 Introduction to Fine Particles (PM 2.5 ) What will We Discuss in Lesson 1? After this lesson, participants will be able to describe: the general
Preparation of Fine Particulate Emissions Inventories Lesson 1 Introduction to Fine Particles (PM 2.5 ) What will We Discuss in Lesson 1? After this lesson, participants will be able to describe: the general
NATURAL AND TRANSBOUNDARY INFLUENCES ON PARTICULATE MATTER IN THE UNITED STATES: IMPLICATIONS FOR THE EPA REGIONAL HAZE RULE. Rokjin J.
 NATURAL AND TRANSBOUNDARY INFLUENCES ON PARTICULATE MATTER IN THE UNITED STATES: IMPLICATIONS FOR THE EPA REGIONAL HAZE RULE Rokjin J. Park ACCESS VII, September 5, 2003 EPA REGIONAL HAZE RULE Federal
Variational aerosol emission inversion in regional scale using MODIS observations
 Variational aerosol emission inversion in regional scale using MODIS observations M. Sofiev, J. Vira, E. Rodriguez, G. de Leeuw Workshop on parameter estimation and inverse modelling for atmospheric composition,
APPENDIX AVAILABLE ON THE HEI WEB SITE
 APPENDIX AVAILABLE ON THE HEI WEB SITE Research Report 177 National Particle Component Toxicity (NPACT) Initiative: Integrated Epidemiologic and Toxicologic Studies of the Health Effects of Particulate
IDENTIFYING SOURCE CONTRIBUTIONS TO VISIBILITY IMPAIRMENT USING REGIONAL MODELING TOOLS
 Point Reyes NP IDENTIFYING SOURCE CONTRIBUTIONS TO VISIBILITY IMPAIRMENT USING REGIONAL MODELING TOOLS Ralph Morris and Ou Nopmongcol Ramboll Environ November 16, 2017 1 IMPORTANCE OF SOURCE CONTRIBUTIONS
Research Progress of Black Carbon Geochemistry Soot and char in the environment
 Workshop on black carbon Research Progress of Black Carbon Geochemistry Soot and char in the environment Yongming Han ( 韩永明 ) (Y.M. Han, yongming@ieecas.cn) Institute of Earth Environment, Chinese Academy
A Method for Airborne Measurements of Water-Soluble Organic Carbon: PILS-TOC results from the NOAA WP-3D during ICARTT
 A Method for Airborne Measurements of Water-Soluble Organic Carbon: PILS-TOC results from the NOAA WP-3D during ICARTT Amy P. Sullivan, R.E. Peltier, R.J. Weber Georgia Institute of Technology C.A. Brock,
6.0 STATE AND CLASS I AREA SUMMARIES
 6.0 STATE AND CLASS I AREA SUMMARIES As described in Section 2.0, each state is required to submit progress reports at interim points between submittals of Regional Haze Rule (RHR) State Implementation
6.0 STATE AND CLASS I AREA SUMMARIES
 6.0 STATE AND CLASS I AREA SUMMARIES As described in Section 2.0, each state is required to submit progress reports at interim points between submittals of Regional Haze Rule (RHR) State Implementation
8-Hour Ozone and PM 2.5 Modeling to Support the Georgia SIP
 8-Hour Ozone and PM 2.5 Modeling to Support the Georgia SIP Amit Marmur, James Boylan, Maudood Khan, and Daniel Cohan Background: Attainment Status in Georgia Certain regions in Georgia are in non-attainment
Source Contributions to Ambient PM 10 and Implications for Mitigation- a Case Study. Shanju Xie, Tom Clarkson and Neil Gimson ABSTRACT
 Source Contributions to Ambient PM 10 and Implications for Mitigation- a Case Study Shanju Xie, Tom Clarkson and Neil Gimson ABSTRACT This report presents estimates of PM 10 source contributions and analysis
WRAP Regional Haze Analysis & Technical Support System
 WRAP Regional Haze Analysis & Technical Support System IMPROVE Steering Committee Meeting September 27, 2006 Technical Analysis Status Report WRAP 2003-08 Strategic Plan identifies Fall 2006 to complete
SENSITIVITY ASSESSMENT OF OZONE AND FINE PARTICULATE MATTER TO EMISSIONS UNDER INFLUENCE OF FUTURE CLIMATE AND EMISSIONS CHANGES
 SENSITIVITY ASSESSMENT OF OZONE AND FINE PARTICULATE MATTER TO EMISSIONS UNDER INFLUENCE OF FUTURE CLIMATE AND EMISSIONS CHANGES Kasemsan Manomaiphiboon, Armistead G. Russell, Sergey Nepelenok, Sun-Kyoung
Emerging Continuous PM Measurement Technologies
 Emerging Continuous PM Measurement Technologies George Allen AWMA-OS Real-time PM Monitoring Workshop Toronto, ON October 20, 2011 Scope: New continuous aerosol methods suitable for routine network operation
Emissions Modeling For Photochemical Modelers. Mark Janssen LADCO Photochemical Modelers Training August 3-4 th 2010
 Emissions Modeling For Photochemical Modelers Mark Janssen LADCO Photochemical Modelers Training August 3-4 th 2010 Overview Emissions Modeling (EM) Issues Every Photochemical Modeler Needs To understand
PM 2.5. an overview of composition, sources & health effects. Mathew Heal School of Chemistry, University of Edinburgh
 PM 2.5 an overview of composition, sources & health effects Mathew Heal School of Chemistry, University of Edinburgh Scottish Air Quality Database and Website Annual Seminar, 18 th March 2013 SNIFFER report:
The Air Pollution Knowledge Assessment (APnA) City Program
 City Program") The Air Pollution Knowledge Assessment (APnA) City Program 1 APnA Cities (2017) Agra, Amritsar, Bengaluru, Bhopal, Bhubaneswar, Chandigarh, Chennai, Coimbatore, Dehradun, Indore, Jaipur, Kanpur, Kochi,
The Air Pollution Knowledge Assessment (APnA) City Program 1 APnA Cities (2017) Agra, Amritsar, Bengaluru, Bhopal, Bhubaneswar, Chandigarh, Chennai, Coimbatore, Dehradun, Indore, Jaipur, Kanpur, Kochi,