NARRATIVE DESCRIPTION OF HISTORICAL DISSOLVED OXYGEN IMPROVEMENTS IN NY/NJ HARBOR RELATED TO PREVIOUS NUTRIENT REDUCTION ACTIVITIES
|
|
|
- Ronald Carter
- 6 years ago
- Views:
Transcription

1 USEPA REGION 2 NY/NJ HARBOR ESTUARY PROGRAM NARRATIVE DESCRIPTION OF HISTORICAL DISSOLVED OXYGEN IMPROVEMENTS IN NY/NJ HARBOR RELATED TO PREVIOUS NUTRIENT REDUCTION ACTIVITIES Prepared by: HydroQual, Inc MacArthur Boulevard Mahwah, New Jersey September 2010 HRFO NEIW.006
2 CONTENTS Section Page INTRODUCTION DISSOLVED OXYGEN IMPROVEMENTS NYCDEP HARBOR SURVEY Inner Harbor Lower New York Bay/Raritan Bay NJHDG MONITORING MERI SEASONAL MONITORING INTERSTATE SANITATION COMMISSION CONTINUOUS MONITORING MANAGEMENT ACTIONS PRODUCING DISSOLVED OXYGEN IMPROVEMENTS HISTORICAL PROBLEM DEVELOPMENT HISTORY OF REGULATORY ACTIONS, FACILITY CONSTRUCTION, AND MANAGEMENT Regulatory Actions, Facility Construction, and Management Before The Clean Water Act Regulatory Actions, Facility Construction, and Management After The Clean Water Act REFERENCES ATTACHMENT 1 ATTACHMENT 2 ATTACHMENT 3 ATTACHMENT 4 YCDEP HARBOR SURVEY DATA DISPLAYS NJHDG DATA DISPLAYS MERI DATA DISPLAYS INTERSTATE SANITATION DISSOLVED OXYGEN FROM REMOTE SENSORS DISPLAYS i
3 INTRODUCTION Improvements in dissolved oxygen concentrations in the NY/NJ Harbor have been ongoing for a number of years, independent of a TMDL for nitrogen and carbon loadings. Both historical improvements in dissolved oxygen and the management actions producing those improvements are described herein for the NY/NJ Harbor Estuary. 1.0 DISSOLVED OXYGEN IMPROVEMENTS Previous dissolved oxygen improvements throughout the NY/NJ Harbor have been documented by several on-going long-term monitoring programs. These programs include: New York City Department of Environmental Protection (NYCDEP) Harbor Survey New Jersey Harbor Dischargers Group (NJHDG) Monitoring Meadowlands Environmental Research Institute (MERI) Seasonal Monitoring (formerly known as Hackensack Meadowlands Development Commission Seasonal Monitoring) In addition, a previous program operated by the Interstate Sanitation Commission (now Interstate Environmental Commission) measured dissolved oxygen with continuous monitors deployed at up to eight Harbor locations during 1973 to Each of these programs is described below. Also described are the measured trends in dissolved oxygen. 1.1 NYCDEP Harbor Survey The City of New York has been collecting water quality data in New York Harbor since Data collection has been the responsibility of the NYCDEP Marine Sciences Section (MSS) for the past 22 years. The Survey currently consists of 62 stations; 35 stations located throughout the open waters of the Harbor, and more than 27 stations located in smaller tributaries within the City which vary from year to year. 20 water quality parameters are now measured. Dating back to 1909, the Metropolitan Sewerage Commission was responsible for dissolved oxygen monitoring. In an August 1912 Report of the Metropolitan Sewerage Commission (available at Present Sanitary Condition of New York Harbor and the Degree of Cleanness Which Is Necessary and Sufficient for the Water, dissolved oxygen measurements for summers 1909 and 1911 are reported as a percentage of saturation. 2,670 analyses for dissolved oxygen were conducted: 800 in 1909 and the remainder in was a worse year than In 1911, dry summer 1
4 weather dissolved oxygen was 64%-89% of saturation at the Narrows, 51%-64% of saturation at the mouth of the Hudson, and 50%-64% at the mouth of the East River. In 1909, dry summer weather dissolved oxygen was 60%-80% of saturation in Newark Bay; 0%-40% of saturation for the Passaic River; and the oxygen in the Arthur Kill was generally half gone. Since 1909, the City reports that Harbor water quality has improved dramatically (see Summer average dissolved oxygen levels in both surface and bottom waters of the Inner Harbor have increased from less than 4 mg/l in the mid-1970s to above 5 mg/l beginning in the early 1990s (NYCDEP, 2002). In addition, summer average bottom water dissolved oxygen levels have increased from long-term ( ) averages of 2 mg/l (range from 1 to 4 mg/l) to near 5 mg/l in the mid- to late-1990s (Brosnan and O Shea, 1996a). The 2008 New York Harbor Water Quality Report includes presentations of dissolved oxygen trends from 1986 to 2008 for major Harbor areas including the Inner Harbor and Lower New York Bay/Raritan Bay. These presentations are included here as Attachment 1 and are described below Inner Harbor The Inner Harbor includes the Hudson River from the NYC-Westchester County line, through the Battery to the Verrazano Narrows; the Lower East River to the Battery; and the Kill van Kull and Arthur Kill. Results from 13 Harbor Survey stations in these waters were combined as June-September averages for the trend reporting purposes shown in Attachment 1. Average June-September near surface dissolved oxygen values in the Inner Harbor have been on the rise since the late 1980 s as shown in Attachment 1. Similarly, June-September average near bottom dissolved oxygen has increased from near 3 mg/l in 1970 to 6.6 mg/l in The June-September averages show an increase between 0.4 and 1.3 mg/l for each decade. The City also reports that there is very little inter-annual chlorophyll-a variability in the Inner Harbor. June-September chlorophyll-a averages were fairly constant since Chlorophyll-a is an indicator of phytoplankton biomass. In marine waters, phytoplankton use of the available nitrogen often causes dissolved oxygen depletion. The constant chlorophyll-a levels in the Inner Harbor suggest that nitrogen management in these waters was not likely to be largely responsible for the increasing dissolved oxygen trend. Despite the sustained increasing trend in June-September average dissolved oxygen in the Inner Harbor, water quality standards are not yet fully attained. For example, during June September 2008, dissolved oxygen measurements were below 4 mg/l once at Mt. St. Vincent in the Hudson River near the Westchester County line and three times at Tottenville in the Arthur Kill near the confluence with Raritan Bay. 2
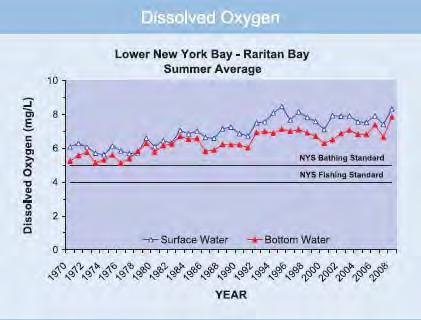
5 1.1.2 Lower New York Bay/Raritan Bay There are five Harbor Survey monitoring stations located between Coney Island in Brooklyn; Staten Island, New York; Middlesex and Monmouth Counties in New Jersey; and Sandy Hook. These five stations represent the Lower New York Bay and Raritan Bay. Since 1970 June-September average dissolved oxygen concentrations have increased 2.6 mg/l, from 5.2 to 7.8 mg/l, for bottom waters as shown in Attachment 1. In 2008, however, discrete measurements included five readings within the 4.1 to 4.9 mg/l range. Average June-September chlorophyll-a measurements peaked in 1995 around 30 ug/l and have declined since to June-September 2008 average levels of 10 ug/l. 1.2 NJHDG Monitoring In 2003, NJHDG began a long-term water quality monitoring program for the waters in the New Jersey portion of the NY/NJ Harbor Estuary. Thirty-three locations are monitored weekly from May to September and twice per month from October through April. While most stations are sampled at mid-depth, deep-water sites are sampled at two discrete depths (1 meter below the surface and meter above the bottom substrate). Displays of dissolved oxygen results for the years 2004 through 2008 of dissolved oxygen compliance with standards have been prepared by NJHDG (see Water Quality Report) and are included here as Attachment 2. The display in Attachment 2 documents year to year variation in dissolved oxygen concentrations across the 5 years considered. In general, dissolved oxygen levels were better in 2006 and 2007 than in 2004, 2005, or 2008 in terms of standards attainment. 1.3 MERI Seasonal Monitoring The New Jersey Meadowlands Commission has monitored water quality in the Hackensack River since Four times each year (spring, summer, winter, and fall), samples are collected at 5 sites on the Hackensack River and at 9 sites tributary to the Hackensack River. In 2005, MERI prepared an analysis of the dissolved oxygen monitoring data collected between 1993 and 2005 (see The MERI analysis pooled the data from the 5 Hackensack River stations from all four seasons to calculate River-wide, across-season, averaged dissolved oxygen concentrations. MERI reports an increasing trend in Hackensack River-wide, across-season, annual average dissolved oxygen concentrations between 1993 and The increasing trend is reported by MERI as a slope of 20% when averaged dissolved oxygen concentration is plotted vs. year of measurement. Over 12 years, the trend predicts an increase in averaged dissolved oxygen of 2.3 mg/l. 3
6 The MERI trend analysis is include here in Attachment 3. There are clear outlying averaged dissolved oxygen measurements from the MERI trend analysis. Further, inspection of discrete data collected seasonally at the 5 individual MERI Hackensack River stations shows relatively little change in dissolved oxygen at individual stations between 1998 and 2010 as shown in the Attachment 3 displays downloaded from the Vista Data Vision program available on the MERI website. One exception is perhaps seasonal station 5, South Hackensack River, for which dissolved oxygen minima have been increasing between 2006 and Station minima for the years 1998 to 2010 range between 0.9 and 2.4 mg/l. The downloaded graphics are included in Attachment 3. The graphics in Attachment 3 also include displays of the seasonal measurements of BOD and nitrogen at the five Hackensack River stations. Largely, these measurements are not suggestive of declining nutrient concentrations. Seasonal station 5, South Hackensack River, shows somewhat of a decline in seasonal ammonia nitrogen concentrations with increases in nitrate nitrogen concentrations from 1998 through Interstate Sanitation Commission Continuous Monitoring A discontinued program operated by the Interstate Sanitation Commission (now Interstate Environmental Commission) measured dissolved oxygen with continuous remote monitors deployed at up to eight Harbor locations during 1973 to The stations of greatest interest for current TMDL efforts in HEP waters include: the Arthur Kill near the confluence with the Rahway River (also near a Consolidated Edison Generating Station); the Raritan River at the Victory Bridge near Perth Amboy, NJ; the Arthur Kill near the Outerbridge Crossing in Staten Island, NY; the Narrows at the Southern end of the Upper Bay near Fort Wadsworth in Staten Island, NY; the Kill van Kull near U.S. Gypsum Company on Staten Island, NY; and the Hudson River above the NYC line near the Consolidated Edison Generating Station in Yonkers, NY. The remote monitors included both monitors owned by the Interstate Sanitation Commission and monitors leased from EPA. Water was pumped to the monitoring units from five feet below the water surface. Readings were taken hourly (i.e., 24 readings per day). Once an hour, each remote unit telemetered data to a central receiver at the Commission s office. This data set is very valuable in terms of its high frequency nature. A modern version of such a time intensive and continuous data set would be useful for assessing compliance with today s dissolved oxygen standards which involve 24-hr averaged dissolved oxygen. Graphs are available for several of the stations which show monthly minima, monthly maxima, and monthly averages for the period of record. Dotted lines are used on the graphs to identify months for which ten days or less of data were collected. These graphs are included in Attachment 4. For the Arthur Kill near the confluence with the Rahway River location, measured dissolved oxygen monthly minima did not show improvement from 1974 to The 4
7 same is essentially true for the Kill van Kull near U.S. Gypsum. Monthly minima in the Kill van Kull were essentially the same for 1973 to 1977 with some small improvements from 1978 to For the Raritan River near the Victory Bridge, monthly minima were more severe in 1973 and 1974 than in 1975 to Unfortunately, the data record at this location doesn t go beyond There is a similar finding at the Narrows. The worst monthly minima occurred in 1974 with some improvement in monthly minima for 1975 to The Narrows data record ended in While the graphs presented in Attachment 4 are useful for assessing trends at a given station as described above for a limited temporal window, they are also collectively important for illustrating that dissolved oxygen minima in NY/NJ Harbor were frequently measured at or near 0 mg/l, anoxia. That doesn t happen as often today as evidenced by information presented in Attachments 1 to 3. The diagrams in all the attachments taken together evidence that Harbor dissolved oxygen has improved since the 1970s. It is unlikely that the statement,.... during the summer months District waters are grossly deficient in dissolved oxygen., from page 2 of the 1977 Report of the Interstate Sanitation Commission, would be made today regarding the Harbor. Page 1 of the 1981 Report of the Interstate Sanitation Commission states that compared to seven years ago, area waters are greatly improved, particularly with respect to the presence of dissolved oxygen. Page 2 of the 1982 Report of the Interstate Sanitation Commission reads, A comparison of 1982 and 1977 dissolved oxygen data, during the critical summer months, showed a significant improvement in water quality over the past five years. 2.0 MANAGEMENT ACTIONS PRODUCING DISSOLVED OXYGEN IMPROVEMENTS Infrastructure improvements and the capture and treatment of virtually all dry-weather sewage are the primary reasons for water quality improvement in the NY/NJ Harbor over the past century. (see The history of these improvements is presented below. 2.1 Historical Problem Development For more than 300 years, NY/NJ Harbor and the New York metropolitan area have been the center of urban development, transportation, manufacturing, and commerce. As a result New York City and the metropolitan area have undergone rapid population growth. Associated with this population growth have been the problems of waste water disposal and water pollution. The issues of waste disposal and water pollution were first noted in lower Manhattan during the time of the early European settlement. The first efforts to remedy these problems began in 1696 with the construction of a sewer and wastewater collection system. Additional sewer systems were constructed in lower and central Manhattan between 1830 and While the sewer systems helped address the issue of waste disposal, they did not address the issue of water pollution, since the Harbor received untreated wastewater from the sewers. According to Soper 1930, as early as 5
8 1914, the Metropolitan Sewerage Commission had a plan to discharge sewage from the lower East River and Jamaica Bay from an ocean island. By the 1920s New York City discharged approximately 600 mgd of raw sewage into the Harbor (Brosnan and O Shea 1996b). In addition, the Harbor also received raw sewage from New Jersey communities. These pollutant discharges had a deleterious effect on water quality and the natural resources of NY/NJ Harbor. The waters of NY/NJ Harbor once supported a large and diverse community of fish, shellfish, and shorebirds. However, these resources began to decline as a result of pollution and habitat loss. Most notable was the loss of a commercially-viable oyster industry. In the 1800s oyster beds were harvested in Raritan Bay, the Kill Van Kull, Jamaica Bay, Newark Bay, and the Shrewsbury River. Seed beds and habitat were disrupted by dredging, disposal of dredge spoils, construction materials, and cellar dirt. Bacterial contamination also resulted in the closure of many oyster beds by the early 1920s (Franz, 1982). Commercial fish landings also appear to have suffered from longterm pollution and habitat loss. Combined landings of important estuarine and anadromous species such as shad, alewife, striped bass, sturgeon, American oyster, hard clam, and bay scallop have declined 90 percent over the past century (McHugh et al., 1990). 2.2 History of Regulatory Actions, Facility Construction, and Management The passage of the Clean Water Act in 1972 was an important milestone for the protection of the NY/NJ Harbor and other waterways throughout the United States. Highlights of the history of regulatory actions, facility construction, and management activities in the NY/NJ Harbor are presented in the context of before and after the Clean Water Act Regulatory Actions, Facility Construction, and Management Before the Clean Water Act Legislative and regulatory efforts to quantify, control, and reduce pollutant inputs into NY/NJ Harbor have been taking place for almost a century. The first of these efforts took place in 1906, with the New York State legislature directing the City of New York to form the Metropolitan Sewerage Commission of New York. The Commission was charged with the dual tasks of investigating the extent of water pollution in the Harbor and formulating a plan to improve sanitary conditions in the City. Besides initiating routine water pollution surveys in 1909 (which represent the longest historical record in the United States), the Commission recommended upgrades in wastewater treatment, including construction of new wastewater treatment facilities. Construction of the first of these modern treatment facilities began in 1935 at Coney Island. Three additional facilities, which discharged to the East River, entered into construction in Other communities within the region also constructed modern treatment plants at that time. 6
9 They included the Passaic Valley (New Jersey) and the Yonkers (New York) primary wastewater treatment plants in 1924 and 1933, respectively. In 1936, the Interstate Sanitation Commission was formed by a compact between the States of New York and New Jersey for the abatement of existing water pollution and the control of future water pollution in the tidal waters of the New York Metropolitan area. Federal funding for water pollution control was provided via the Federal Water Pollution Control Act and its amendments in 1948 and Beginning in 1956, the Construction Grants Program provided municipalities with funding for the construction of wastewater treatment facilities. With the passage of the 1965 Federal Water Pollution Control Act, federal funding was also provided for technical assistance in monitoring and analysis in support of water quality management issues. Between the late 1950 s and early 1970 s, initial efforts to numerically model water quality in NY/NJ Harbor were undertaken by Donald O Connor (1962, 1966) and O Connor and Mancini (1972). The resulting numerical model was used to make projections of expected changes in dissolved oxygen levels in the Upper Bay, the North River, and the East River resulting from various load reductions in BOD discharges from the Passaic Valley (New Jersey), Newtown Creek, and the yet to be constructed North River water pollution control facilities (WPCPs). The authors concluded that regional planning and wastewater treatment was required in order to achieve water quality goals for NY/NJ Harbor Regulatory Actions, Facility Construction, and Management After the Clean Water Act With the passage of the 1972 Clean Water Act (CWA), the Construction Grants Program continued funding for construction of municipal WPCPs. According to the 1973 Report of the Interstate Sanitation Commission, some examples of construction projects from 1973 include: the Rahway Valley Sewerage Authority plant in Middlesex County NJ was upgraded from primary treatment to secondary treatment at a cost of $16,000,000 and the Yonkers plant in Westchester County NY was being upgraded from primary treatment to secondary treatment at an estimated cost of $55,000,000 (the 1974 report notes the cost at $100 million). The 1972 CWA also provided funding to conduct regional analysis of pollutant inputs and pollutant load reductions required to address water quality problems. These areawide studies were known as 208 studies. O Connor and Mueller (1984) reported on the area-wide 208 study conducted for NY/NJ Harbor sponsored by the U.S. Environmental Protection Agency (USEPA) and administered by the New York City Department of Water Resources. The NYC 208 study was initiated in 1975 to assess the seasonal impact of continuous (domestic and industrial sources) and intermittent discharges, the latter including combined sewer overflows (CSOs) and separately-sewered stormwater sources. 7
10 With the advent of (at the time) modern computers and newer mathematical modeling techniques, the earlier analytical solution models of the Harbor were replaced with a higher spatial resolution finite-difference model of the Harbor. While the importance of density-driven circulation and vertical stratification in the Harbor had previously been recognized, early Harbor models did not address this physical phenomenon. However, the advent of the NYC 208 model, which included vertical segmentation in the Hudson River and Upper Bay portions of the Harbor, provided a first attempt to consider the effects of density-driven circulation and vertical stratification on water quality and, in particular, dissolved oxygen. The calibrated/validated NYC 208 model was used to develop a loading component analysis of the DO-deficit in the NY/NJ Harbor. The NYC 208 study loading component analysis indicated that the NY and NJ WPCPs and untreated municipal sewage were responsible for approximately 55% of the maximum DO-deficit at that time. The remaining deficit was divided between SOD (approximately 15%) and other sources (30%). The model had indicated that if an 85% removal of BOD at the WPCPs could be achieved, the New York State Department of Environmental Conservation (NYSDEC) standard for dissolved oxygen (never less than 5 mg/l) could be achieved. The NYC 208 model represented one of the first cases of the application of a credible, density-driven estuarine model to project water quality response to the control of continuous and intermittent wastewater sources. Driven by the regulatory controls of the 1972 CWA, and supported by model projections developed during the NYC 208 study, New York City and New Jersey communities began to upgrade WPCPs to full secondary treatment in the 1970s and 1980s. For example, as reported by the 1977 report of the Interstate Sanitation Commission, work was essentially completed on the upgrading and expansion of the former Middlesex County Utilities Authority primary plant in Middlesex County, NJ. The then new 120 MGD secondary treatment Middlesex County plant was scheduled to go on line in November In October 1981, as reported in the 1981 Report of the Interstate Sanitation Commission, the Passaic Valley Sewerage Commissioners placed their then new secondary waste treatment system into operation. Completion of the North River WPCP in 1986 ended the discharge of 170 mgd of raw sewage to the Hudson River from Manhattan. The discharge of 40 mgd of raw sewage to the lower East River from Brooklyn was eliminated with the construction of the Red Hook WPCP in One of the key findings of the NYC 208 study was the deleterious impact on water quality of the discharge of CSOs in a number of New York City tributaries (e.g., Flushing Creek and Flushing Bay and Newtown Creek in the East River, and Paerdegat Basin, Thruston Basin, and Fresh Creek in Jamaica Bay, etc.). However, with New York City s fiscal crisis of the mid- to late-1970s, efforts to correct these problems were deferred in favor of eliminating the discharge of raw sewerage to the waters of the Harbor. In 1982, a Water Quality Steering Committee formed. The Committee was formed to determine whether any excess assimilative capacity existed in the Harbor based on the 8
11 then applicable dissolved oxygen standards. The Committee s purpose was to provide a basis for EPA and the States of NY and NJ to evaluate applications for permit modifications under Section 301(h) of the Clean Water Act. In 1984, the National Estuary Program (NEP) was established. Since 1988, the NY/NJ Harbor NEP has been receiving funding coordinated through EPA Region 2. The NY/NJ Harbor Estuary Program (HEP) developed and continues to update a Comprehensive Conservation and Management Plan (CCMP) for NY/NJ Harbor which sets targets and goals for the management of the Harbor. With the recovery of New York City from its earlier financial problems, work proceeded on completing upgrades to full secondary treatment at 13 of the City s 14 WPCPs. This work was completed in 1993 and ensured that the wastewater collected in the total sewered area of the City of about 2,000 square miles would be provided with treatment before being discharged to the Harbor. Work then began on the fourteenth NYC facility not yet operating at secondary treatment in 1993, the Newtown Creek WPCP. As a result of the completion of the secondary treatment upgrade of the 14 NYC WPCPs, the NYC discharge of raw sewage to the Harbor had been reduced from 1,070 mgd in 1936 to less than 1 mgd by 1993 (Brosnan and O Shea, 1996b). Associated with this reduction in raw sewage discharge and upgrades in treatment at all of the NJ and NY Harbor WPCPs, the loading of BOD to Harbor waters decreased almost three-fold from the highest levels observed in the mid-sixties (Suskowski, 1990). All of these upgrades in wastewater capture and treatment have resulted in significant improvements in water quality throughout the Harbor as described in Section 1.1. However, water quality, in particular dissolved oxygen, had not improved everywhere within the Harbor. For example, the urban tributaries and embayments of the East River (the Bronx River, Flushing Bay, Newtown Creek, etc.) and Jamaica Bay (Paerdegat Basin, Fresh Creek, Hendrix Creek, Shellbank Basin, etc.) continued to demonstrate poor water quality and often failed to meet NYSDEC water quality standards for dissolved oxygen. These problems appeared to be related to episodic pollutants inputs from wet weather combined sewer overflows. NYCDEP provided funding during the mid- to late 1990s to develop facility plans for abating CSO discharges (Apicella et al, 1988, Apicella et al. 1993, Apicella et al., 1996, Apicella, 2001, HydroQual, 1990, 1991). In addition, water quality problems continued in the western portion of Long Island Sound and the Grassy Bay section of Jamaica Bay. In particular these waterbodies failed to meet NYSDEC water quality standards for dissolved oxygen. However, nutrient enrichment, and not simply anthropogenic inputs of organic carbon, appeared to be the more important factor contributing to the contravention of the dissolved oxygen standards. In order to investigate the relationship between nutrient inputs, primary production, and dissolved oxygen in these waterbodies, more comprehensive modeling frameworks were developed. The first of these mathematical models, LIS 3.0, was developed for the USEPA Long Island Sound Study Office (HydroQual, 1996). The LIS 3.0 model was used by the States of New York and Connecticut to conduct a nitrogen 9
12 TMDL, in order to improve dissolved oxygen standards attainment for the Sound (NYSDEC and CTDEP, 2000). The LIS3.0 model set the stage for the development of the System Wide Eutrophication Model (SWEM), beginning in the early 1990s. SWEM is currently being applied by the USEPA Region 2 NY/NJ Harbor Estuary Program (HEP) and the States of NY and NJ to develop nitrogen and carbon TMDL plans for improved Harbor dissolved oxygen standards attainment, particularly in the Hackensack, Passaic, Raritan, and Hudson Rivers; the Newark, Raritan, and Upper Bays; and the Arthur Kill. In November 2000, EPA issued the final guidance document, Ambient Aquatic Life Water Quality Criteria for Dissolved Oxygen (Saltwater): Cape Cod to Cape Hatteras. The federally endorsed dissolved oxygen criteria are exposure duration based and consider 24-hr averages for the protection of juvenile and adult survival of marine organisms, larval recruitment of marine organisms, and growth of marine organisms. The 2000 marine dissolved oxygen criteria represented a significant difference from the never less than dissolved oxygen standards in effect in the Harbor at that time and still in effect in significant portions of the NY/NJ Harbor today. The current nitrogen and carbon TMDL efforts in NY/NJ Harbor are attempting to maximize Harbor compliance with the federal criteria. Engineering studies and capital improvement projects supporting the maintenance and upkeep at all of the Harbor s WPCPs have been and continue to be a continuous major effort in the region. Costs of individual engineering studies and capital improvement projects are now often in the multi-millions of dollars range. Cost for these engineering studies and capital improvement projects ongoing simultaneously throughout the Harbor in any given year now total in the multi-billions of dollars range. The annual reports of the Interstate Environmental Commission (former Sanitation Commission) serve as a good source of documentation for the engineering studies and capital improvement projects. 10
13 3.0 REFERENCES Apicella, G., Urban Runoff, Wetlands and Waterfowl Effects on Water Quality in Alley Creek and Little Neck Bay. TMDL Science Issues Conference, St. Louis, Missouri, March 4-7, Apicella, G., J. Roswell and H.P. Moutal, Achieving water quality through CSO control - Flushing Bay, New York City. Presented at the 60th Annual New York Water Pollution Control Association Meeting, New York City, January 10-13, Apicella, G., F.E. Schuepfer, J. Zuccagnino and V. DeSantis, Water-quality modeling of combined sewer overflow effects on Newtown Creek. Water Environment Research 68(6): Brosnan, T.M. and M.L. O Shea, 1996a. Long-term improvements in water quality due to sewage abatment in the Lower Hudson River. Estuaries 19(4): Brosnan, T.M. and M.L. O Shea, 1996b. Sewage abatement and coliform bacteria trends in the lower Hudson-Raritan Estuary since passage of the Clean Water Act. Water Environment Research 68(1): Franz, D.R., A historical perspective on molluscs in Lower New York Harbor, with emphasis on oysters. In Ecological stress and the New York Bight: Science and management, ed. G.F. Mayer, pp Esturarine Research Foundation, Columbia, SC. HydroQual, Inc., New York City Phase II City-wide combined sewer overflow study of Jamaica Bay and 26 th Ward Tributaries. Task Report: Computer Modeling 26 th Ward Tributaries. Prepared for NYCDEP under subcontract to O Brien and Gere Engineers, Inc. Mahwah, NJ. HydroQual, Inc., Task 4.3 Modeling of loads and Task 4.4 Modeling of water quality Report. Prepared for NYCDEP under subcontract to Hazen and Sawyer PC Engineers. Mahwah, NJ. HydroQual, Inc., Water quality modeling analysis of hypoxia in Long Island Sound using LIS 3.0. Prepared for the Management Committee of the Long Island Sound Estuary Study and the New England Interstate Water Pollution Control Commission. Mahwah, New Jersey. McHugh, J.L., R.R. Young, and W.M. Wise, Historical trends in the abundance and distribution of living marine resources in the system. In Cleaning up our coastal waters: An unfinished agenda, ed. K. Bricke and R.V. Thomann, pp Presented at the March 12-14, 1990 regional conference co-sponsored by Manhattan College and the Management Conferences for the Long Island Sound Study, The New York-New Jersey Harbor Estuary Program, and the New York Bight Restoration Plan. New York City Department of Environmental Protection, New York Harbor water quality report. NYCDEP, Bureau of Wastewater Pollution Control, Marine Sciences Section, Wards Island, NY. New York State Department of Environmental Conservation (NYSDEC) and Connecticut Department of Environmental Protection (CTDEP), A total maximum daily load analysis to achieve water quality standards for dissolved oxygen in Long Island Sound. NYSDEC, Albany, NY. CTDEP, Hartford CN. 11
14 O Connor, D.J., Organic Pollution of New York Harbor - Theoretical Considerations. Journal WPCF, 34(9): O Connor, D.J., An analysis of the dissolved oxygen distribution in the East River. Journal WPCF, 38(11): O Connor, D.J. and J.L. Mancini, Water quality analysis of the New York Harbor complex. Journal WPCF, 44(11): O Connor, D.J. and J.A. Mueller, Water quality analysis of the New York Harbor complex. Jour. Environ. Engr. Div., ASCE, 110(6): Suskowski, D.J., Conditions in the New York/New Jersey Harbor Estuary. In Cleaning up our coastal waters: An unfinished agenda, ed. K. Bricke and R.V. Thomann, pp Presented at the March 12-14, 1990 regional conference cosponsored by Manhattan College and the Management Conferences for the Long Island Sound Study, The New York-New Jersey Harbor Estuary Program, and the New York Bight Restoration Plan. 12
15 ATTACHMENT 1 NYCDEP HARBOR SURVEY DATA DISPLAYS


16

17
18 ATTACHMENT 2 NJHDG DATA DISPLAYS
19 Figure 18. % DO samples below Standards Passaic River Figure 19. % DO samples below Standards Hackensack & Hudson Rivers Figure 20. % DO samples below Standards Newark Bay & Arthur Kill Figure 21. % DO samples below Standards Raritan River & Bay Note: Site 13 No DO measurements in summer 2005 due to equipment problems Site 1 bridge closed for construction Jul 2007-Mar 2009 No data for summer 2008
20 ATTACHMENT 3 MERI DATA DISPLAYS

21 MERI» Seasonal Water Quality Monitoring Program Page 1 of 9 8/6/2010 About Meri Scientific Data Laboratory Library GIS The scientific arm of the New Jersey Meadowlands Commission. Seasonal Water Quality Monitoring Program Participants: MERI The New Jersey Meadowlands Commission has monitored the quality of water within the Meadowlands District since Four times each year (spring, summer, fall and winter) samples are collected at 14 sites on the Hackensack River and its tributaries. Analyses are conducted in the Meadowlands Environmental Research Institute laboratory, certified by the state of New Jersey. These efforts provide a general assessment of overall water quality in the Meadowlands, identify any large-scale, long-term trends in water quality, and detect any acute water quality problems. NJMC-MERI Seasonal Water Quality Monitoring Data Thirteen year ( ) dissolved oxygen trend in the Hackensack River Historical USGS Chlorophyll data All content MERI : Meadowlands Environmental Research Institute Site Designed by BK Top
 dissolved oxygen trend in the Hackensack River Dissolved Oxygen in the Hackensack River: 2005 Update The Meadowlands Environmental Research")

22 EMS Page 1 of 1 8/6/2010 Thirteen year ( ) dissolved oxygen trend in the Hackensack River Dissolved Oxygen in the Hackensack River: 2005 Update The Meadowlands Environmental Research Institute has completed its monitoring of the surface water of the Hackensack River for All five sites were sampled once during each season. An additional data point representing the 2005 yearly average is depicted in the chart above. The average concentration for 2005 was 5% below the prior year's average. The long term trend for dissolved oxygen continues to be positive. The value of 7.2 for 2005 was above the running average, which continues to be well above criteria and stress levels. As in 1993 and 1998, an extremely dry summer was encountered, diminishing DO levels. As in prior years, oxygen rebounded with the resumption of normal precipitation in the fall. Notes: 1 NJDEP criteria SE-2 (NJAC 7:9B) allows for secondary contact recreation and maintenance, migration and propagation of biota. 2 Ambient Aquatic Life Water Quality Criteria for Dissolved Oxygen, USEPA, November 2000.
23 Vista Data Vision - Web Map Page 1 of 1 8/6/2010 Locaton of EMS Stations & Seasonal Water Quality Stations: Seasonal Stations Select Seasonal Stations 6 Copyright Vista Engineering Last Reload Time: 13:53:31
 - N.")
24 Vista Data Vision - Vista Engineering Page 1 of 1 8/6/2010 Seasonal - (1) - N. Hackensack: Water Quality
 - N.")
25 Vista Data Vision - Vista Engineering Page 1 of 1 8/6/2010 Seasonal - (1) - N. Hackensack: Water Quality
26 Vista Data Vision - Vista Engineering Page 1 of 1 8/6/2010 Seasonal - (1) - N. Hackensack: Water Quality

27 Vista Data Vision - Vista Engineering Page 1 of 1 8/6/2010 Seasonal - (2) - Turnpike HR: Water Quality
28 Vista Data Vision - Vista Engineering Page 1 of 1 8/6/2010 Seasonal - (2) - Turnpike HR: Water Quality
29 Vista Data Vision - Vista Engineering Page 1 of 1 8/6/2010 Seasonal - (2) - Turnpike HR: Water Quality
30 Vista Data Vision - Vista Engineering Page 1 of 1 8/6/2010 Seasonal - (3) - Route 3 HR: Water Quality

31 Vista Data Vision - Vista Engineering Page 1 of 1 8/6/2010 Seasonal - (3) - Route 3 HR: Water Quality

32 Vista Data Vision - Vista Engineering Page 1 of 1 8/6/2010 Seasonal - (3) - Route 3 HR: Water Quality
33 Vista Data Vision - Vista Engineering Page 1 of 1 8/6/2010 Seasonal - (4) - Amtrack Bridge: Water Quality

34 Vista Data Vision - Vista Engineering Page 1 of 1 8/6/2010 Seasonal - (4) - Amtrack Bridge: Water Quality
35 Vista Data Vision - Vista Engineering Page 1 of 1 8/6/2010 Seasonal - (4) - Amtrack Bridge: Water Quality
 - S.")
36 Vista Data Vision - Vista Engineering Page 1 of 1 8/6/2010 Seasonal - (5) - S. Hackensack: Water Quality
37 Vista Data Vision - Vista Engineering Page 1 of 1 8/6/2010 Seasonal - (5) - S. Hackensack: Water Quality
38 Vista Data Vision - Vista Engineering Page 1 of 1 8/6/2010 Seasonal - (5) - S. Hackensack: Water Quality
39 ATTACHMENT 4 INTERSTATE SANITATION DISSOLVED OXYGEN FROM REMOTE SENSORS DISPLAYS


40

41
42
43

44
45
46
47

48

49
Water Quality Modeling in New York/New Jersey Harbor: A Historical Perspective on the Present Robin Landeck Miller and James J.
 Water Quality Modeling in New York/New Jersey Harbor: A Historical Perspective on the Present Robin Landeck Miller and James J. Fitzpatrick As HydroQual celebrates its 25 th Anniversary as a corporation
MANAGEMENT OF NUTRIENTS AND ORGANIC ENRICHMENT
 MANAGEMENT OF NUTRIENTS AND ORGANIC ENRICHMENT PROBLEMS Potential damage to living marine resources caused by low dissolved oxygen and other eutrophic effects Noxious water quality conditions Novel algal
Hudson Raritan Estuary Comprehensive Restoration Plan and Feasibility Study
 Restoring America s Estuaries 5 th National Conference on Coastal and Estuarine Habitat Restoration 16 November 2010 Hudson Raritan Estuary Comprehensive Restoration Plan and Feasibility Study Lisa Baron
New York - New Jersey Harbor Estuary Program
 New York - New Jersey Harbor Estuary Program The Status of Shellfish Beds in the NY-NJ Harbor Estuary Final: November 26, 2002 By Cathy Yuhas, NJ Sea Grant College Extension Program/NY-NJ Harbor Estuary
Citizen Science Monitoring for Pathogen Indicators Along the NJ Raritan Bayshore. A Final Report for the NY-NJ Harbor & Estuary Program
 Citizen Science Monitoring for Pathogen Indicators Along the NJ Raritan Bayshore A Final Report for the NY-NJ Harbor & Estuary Program Prepared by: Meredith Comi, NY/NJ Baykeeper Restoration Program Director
Long Island Sound Nitrogen Reduction Strategy Overview Public Webinar November 8, 2017
 Long Island Sound Nitrogen Reduction Strategy Overview Public Webinar November 8, 2017 Photo Credit: CTDEEP/Hammonasset Beach State Park, CT Presentation Overview Nitrogen strategy overview Outline technical
NEW YORK / NEW JERSEY HARBOR DEEPENING PROJECT
 NEW YORK / NEW JERSEY HARBOR DEEPENING PROJECT Using Synergy to Successfully Execute A Mega Water Resource Project Joseph J. Seebode Deputy District Engineer U.S. Army Corps of Engineers New York District
Long Island s. Environmental Issues. Environmental Issues. Environmental Setting. Environmental Setting. Suburbia and the Environment
 Environmental Issues Long Island s Environmental Issues Copyright 2011 AFG 1 agricultural land air pollution aquifers automobile barrier islands biozones fisheries groundwater recharge invasive species
INTERSTATE ENVIRONMENTAL COMMISSION New York New Jersey Connecticut ANNUAL REPORT
 INTERSTATE ENVIRONMENTAL COMMISSION New York New Jersey Connecticut ANNUAL REPORT 2011 THE INTERSTATE ENVIRONMENTAL DISTRICT Classification of Waters Yellow Watermarks: Boundary Points Solid Black Lines:
HYPOXIA IN FAR WESTERN LONG ISLAND SOUND AND UPPER EAST RIVER
 HYPOXIA IN FAR WESTERN LONG ISLAND SOUND AND UPPER EAST RIVER 2014 NEW ENGLAND INTERSTATE WATER POLLUTION CONTROL COMMISSION INTERSTATE ENVIRONMENTAL COMMISSION DISTRICT Overview of IEC District s Monitoring
The summertime subpycnocline dissolved oxygen budget in the western Long Island Sound. Grant McCardell and James O Donnell
 The summertime subpycnocline dissolved oxygen budget in the western Long Island Sound Grant McCardell and James O Donnell MAPBOM 2013 Overview WLIS hypoxia SWEM model Data-based transport estimates WLIS
Eutrophication and the Saltwater Hudson River
 Eutrophication and the Saltwater Hudson River Part 1: Primary Production and Eutrophication in the Hudson Since the Industrial Revolution, the Hudson River has had problems with pollution, yet the challenges
National Estuary Program Activities in the Barnegat Bay. Jim Vasslides Barnegat Bay Partnership Ocean County College Toms River, New Jersey
 National Estuary Program Activities in the Barnegat Bay Jim Vasslides Barnegat Bay Partnership Ocean County College Toms River, New Jersey The Barnegat Bay NEP 1987: Barnegat Bay Study Act (Chapter 387)
Oyster Restoration Feasibility Study
 Oyster Restoration Feasibility Study Project Summary 2010 Hudson River Foundation, NY/NJ Baykeeper, U.S Army Corps of Engineers, Port Authority of New York/New Jersey, The Urban Assembly New York Harbor
Chapter Seven: Factors Affecting the Impact of Nutrient Enrichment on the Lower Estuary
 Chapter Seven: Factors Affecting the Impact of Nutrient Enrichment on the Lower Estuary As presented in Chapter Six, the water quality data for the upper stations of the tidal freshwater Potomac Estuary
WILLAMETTE RIVER AND COLUMBIA RIVER WASTE LOAD ALLOCATION MODEL
 WILLAMETTE RIVER AND COLUMBIA RIVER WASTE LOAD ALLOCATION MODEL Christopher J. Berger, Research Associate, Department of Civil and Environmental Engineering, Portland State University, Portland, Oregon
GUIDELINES FOR STORMWATER BACTERIA REDUCTIONS THROUGH BMP IMPLEMENTATION NY/NJ HARBOR TMDL DEVELOPMENT
 GUIDELINES FOR STORMWATER BACTERIA REDUCTIONS THROUGH BMP IMPLEMENTATION NY/NJ HARBOR TMDL DEVELOPMENT Elevated bacteria in stormwater runoff in urban areas are well documented by many researchers. Monitoring
Real time Water Quality Monitoring
 Real time Water Quality Monitoring Robert Schuster New Jersey Department of Environmental Protection Water Monitoring and Standards Bureau of Marine Water Monitoring Presented at NJWMCC Meeting September
PROTECTING OUR WATERWAYS: STORMWATER POLLUTION REDUCTION EFFORTS
 PROTECTING OUR WATERWAYS: STORMWATER POLLUTION REDUCTION EFFORTS Public Information Meeting ~ May 2, 2018 Public Works Stormwater Management Division OVERVIEW Surface Water Quality Protection Municipal
South Venice Water Quality
 SARASOTA COUNTY South Venice Water Quality Summary of Data Collected in Support of the South Venice Civic Association Water Quality Task Force Sarasota County Water Resources 8//24 Introduction The South
739 Hastings Street Traverse City, MI Phone: (231) Fax: (231)
 Fax: (231)") 739 Hastings Street Traverse City, MI 49686 Phone: (231) 941-2230 Fax: (231) 941-2240 www.glec.com To: From: Theresa Portante-Lyle, NEIWPCC (tportante-lyle@neiwpcc.org) Mick DeGraeve, GLEC Date: July 25,
739 Hastings Street Traverse City, MI 49686 Phone: (231) 941-2230 Fax: (231) 941-2240 www.glec.com To: From: Theresa Portante-Lyle, NEIWPCC (tportante-lyle@neiwpcc.org) Mick DeGraeve, GLEC Date: July 25,
HUDSON RARITAN ESTUARY ECOSYSTEM RESTORATION FEASIBILITY STUDY
 HUDSON RARITAN ESTUARY ECOSYSTEM RESTORATION FEASIBILITY STUDY 237 237 237 217 217 217 200 200 200 80 119 27 252 174.59 1 255 0 163 131 239 110 Public Information Meeting 255 0 163 132 65 135 255 0 163
Appendix A. Water Quality Town of Greenwich
 Appendix A Quality Town of Town of Drainage Manual [This page left intentionally blank] Bodies Town of Horseneck Brook-01 Byram River- 01 Putnam Lake Reservoir () Inner - Indian Harbor (upper), Inner -
Background (cont.) Measuring Pollutant Loads. Nonpoint source Nitrogen is discrete and generated by a vast array of sources, including:
 Measuring Pollutant Loads. Nonpoint source Nitrogen is discrete and generated by a vast array of sources, including:") Suffolk County North Shore Embayments Watershed Management Plan EEA PUBLIC SUMMARY DOCUMENT Inc. December 2007 Purpose Background The Suffolk County North Shore Embayments Watershed Management Plan (herein
Suffolk County North Shore Embayments Watershed Management Plan EEA PUBLIC SUMMARY DOCUMENT Inc. December 2007 Purpose Background The Suffolk County North Shore Embayments Watershed Management Plan (herein
Dead-Zones and Coastal Eutrophication: Case- Study of Chesapeake Bay W. M. Kemp University of Maryland CES Horn Point Laboratory Cambridge, MD
 Dead-Zones and Coastal Eutrophication: Case- Study of Chesapeake Bay W. M. Kemp University of Maryland CES Horn Point Laboratory Cambridge, MD Presentation to COSEE Trends Orientation at UMCES HPL 4 August
Biscayne Bay. A Jewel in Jeopardy? Stephen Blair 1 and Sarah Bellmund 2
 Biscayne Bay A Jewel in Jeopardy? Stephen Blair 1 and Sarah Bellmund 2 1 Department of Regulatory and Economic Resources; Division of Environmental Resources Management (DERM), Miami, FL 2 National Park
Food Chains, Food Webs, and Bioaccumulation Background
 Food Chains, Food Webs, and Bioaccumulation Background Introduction Every living organism needs energy to sustain life. Organisms within a community depend on one another for food to create energy. This
Clean Water Act: A Summary of the Law
 Order Code RL30030 Clean Water Act: A Summary of the Law Updated March 17, 2008 Claudia Copeland Specialist in Resource and Environmental Policy Resources, Science, and Industry Division Clean Water Act:
SWEM QUESTIONS FOR MODEL WORKSHOP
 SWEM QUESTIONS FOR MODEL WORKSHOP A. Management Overview What is the purpose (i.e., heuristic or predictive?) of the model as a management tool? In principle, SWEM is meant to be a predictive tool, although
Maine Department of Environmental Protection Program Guidance on Combined Sewer Overflow Facility Plans
 Maine State Library Maine State Documents Land and Water Quality Documents Environmental Protection 9-1-1994 Maine Department of Environmental Protection Program Guidance on Combined Sewer Overflow Facility
MARYLAND DEPARTMENT OF THE ENVIRONMENT 1800 Washington Boulevard Baltimore MD
 MARYLAND DEPARTMENT OF THE ENVIRONMENT 1800 Washington Boulevard Baltimore MD 21230 410-537-3000 1-800-633-6101 Martin O Malley Governor Anthony G. Brown Lieutenant Governor November 6, 2009 Shari T. Wilson
Use of Vollenweider-OECD Modeling to Evaluate Aquatic Ecosystem Functioning
 R. Anne Jones 1 and G. Fred Lee 1 Use of Vollenweider-OECD Modeling to Evaluate Aquatic Ecosystem Functioning REFERENCE: Jones, R. A. and Lee, G. F., Use of Vollenweider-OECD Modeling to Evaluate Aquatic
Clean Water Act: A Summary of the Law
 Claudia Copeland Specialist in Resources and Environmental Policy October 30, 2014 Congressional Research Service 7-5700 www.crs.gov RL30030 Summary The principal law governing pollution of the nation
The Port of New York and New Jersey. The Environment
 The Environment The An Important Environment Resource for Our Region As the premier cargo center on the eastern seaboard, the Port of New York and New Jersey connects our region to both the international
EFFLUENT DOMINATED WATER BODIES, THEIR RECLAMATION AND REUSE TO ACHIEVE SUSTAINABILITY
 EFFLUENT DOMINATED WATER BODIES, THEIR RECLAMATION AND REUSE TO ACHIEVE SUSTAINABILITY Chapter 9 Vladimir Novotny DEFINITION Effluent dominated water body Predominantly contains waste water effluents during
Barnegat Bay-Little Egg Harbor: Ecosystem Condition. Michael J. Kennish Institute of Marine and Coastal Sciences Rutgers University
 Barnegat Bay-Little Egg Harbor: Ecosystem Condition Michael J. Kennish Institute of Marine and Coastal Sciences Rutgers University Coastal Lagoons Barnegat Bay- Little Egg Harbor ANTHROPOGENIC EFFECTS*
Linda Cooper, Eno River State Park, Durham, NC
 Linda Cooper, Eno River State Park, Durham, NC 2 Rivers and Streams All 50 states, 2 interstate river commissions, American Samoa, Guam, Puerto Rico, the District of Columbia (collectively referred to
Excerpts on the Clean Water Act The History of the Clean Water Act
 Excerpts on the Clean Water Act The History of the Clean Water Act From: http://www.nrdc.org/water/pollution/hcwa.asp Highly successful in protecting our nation's waters, this landmark law itself needs
Wastewater Treatment & Reclamation
 Wastewater Treatment & Reclamation BACKGROUND Of the pollution sources to Sarasota Bay (wastewater, stormwater, and atmospheric), wastewater contains the highest concentrations of nitrogen. In the Bay
South Carolina Water Quality Standards. Heather Preston DHEC Bureau of Water October 14, 2008
 South Carolina Water Quality Standards Heather Preston DHEC Bureau of Water October 14, 2008 The Water Quality Standards 303 (c) of the Clean Water Act requires all states to have water quality standards
COMMUNITY WATER QUALITY MONITORING RESULTS MOHAWK RIVER % of Mohawk River samples failed. 48% WATERSHED SHAPSHOT
 COMMUNITY WATER QUALITY MONITORING RESULTS MOHAWK RIVER 215 216 As measured against the Environmental Protection Agency s recommended Beach Action Value for safe swimming: 37% of Mohawk River samples failed.
WASTEWATER TREATMENT REQUIREMENTS
 WASTEWATER TREATMENT REQUIREMENTS To avoid local objections, a sewage treatment plant site should be as far as practical from any populated area or any area that will develop within a reasonable period
Abstract. Introduction
 Effects of Residence Time and Depth on Wet Detention System Performance Harvey H. Harper, Ph.D., P.E. Environmental Research & Design, Inc. 3419 Trentwood Blvd., Suite 12 Orlando, FL 32812 Abstract Wet
Distributions of Chromophoric Dissolved Organic Matter in New York Harbor
 Distributions of Chromophoric Dissolved Organic Matter in New York Harbor Alan F. Blumberg Department of Civil, Environmental and Ocean Engineering Stevens Institute of Technology Castle Point on Hudson
Eutrophication: Tracing Nutrient Pollution Back to Penns Creek
 Eutrophication: Tracing Nutrient Pollution Back to Penns Creek Nutrients are substances that life depends on for growth and reproduction. However, when these nutrients enter our planets waterways in excess,
Details of DO Criteria. Peter Tango EPA Chesapeake Bay Program Office March 16, 2011
 Details of DO Criteria Peter Tango USGS@ EPA Chesapeake Bay Program Office March 16, 2011 Umbrella Criteria Action Team Walter Boynton Jeni Keisman Tish Robertson Elgin Perry Claire Buchanan Matt Hall
Factsheet: Town of Deep River Water Quality and Stormwater Summary
 79 Elm Street Hartford, CT 06106-5127 www.ct.gov/deep Affirmative Action/Equal Opportunity Employer Factsheet: Town of Deep River Water Quality and Stormwater Summary This document was created for each
CAPE COD. Regional Wastewater Management Plan Overview
 CAPE COD Regional Wastewater Management Plan Overview JANUARY 2013 Table of Contents OVERVIEW...1 THE PROBLEM...2 SHARED RESOURCES AND A SHARED PROBLEM...3 PRINCIPLES OF THE CAPE COD REGIONAL WASTEWATER
Guadalupe River watershed a long time ago. (photo courtesy of Aquarena Springs)
") Guadalupe River watershed a long time ago (photo courtesy of Aquarena Springs) The Texas General Land Office George P. Bush, Commissioner Jason Pinchback Manager, Coastal Resources This presentation is
Guadalupe River watershed a long time ago (photo courtesy of Aquarena Springs) The Texas General Land Office George P. Bush, Commissioner Jason Pinchback Manager, Coastal Resources This presentation is
6. Pollutant Sources in
 6. Pollutant Sources in 45 6. Pollutant Sources in the Plum Creek Watershed The LDC analysis for Plum Creek indicates that both point and nonpoint sources contribute pollutants in the watershed. Identifying
LAKE TARPON WATER QUALITY MANAGEMENT PLAN SCOPE OF WORK
 LAKE TARPON WATER QUALITY MANAGEMENT PLAN SCOPE OF WORK Project Background Lake Tarpon With a surface area of approximately four square miles and a watershed of approximately 52 square miles, Lake Tarpon,
Eight Characterizing Trends in the Barnegat Bay Watershed, Ocean County, New Jersey
 Eight Characterizing Trends in the Barnegat Bay Watershed, Ocean County, New Jersey Gail P. Carter New Jersey Department of Environmental Protection Division of Science and Research, CN049 Trenton, New
Coastal Ecosystems: Saving Chesapeake Bay. Note the highest pigment concentrations (red) in coastal regions, especially estuaries
 in coastal regions, especially estuaries") Coastal Ecosystems: Saving Chesapeake Bay Note the highest pigment concentrations (red) in coastal regions, especially estuaries Coastal Ecosystems: human impacts Humans severely impact the coastal zone
Coastal Ecosystems: Saving Chesapeake Bay Note the highest pigment concentrations (red) in coastal regions, especially estuaries Coastal Ecosystems: human impacts Humans severely impact the coastal zone
Municipal Stormwater Management Planning
 Municipal Stormwater Management Planning Christopher C. Obropta, Ph.D., P.E. Water Resources Extension Specialist with Rutgers Cooperative Extension Assistant Professor with Department of Environmental
Management of Aging Wastewater Infrastructure -- Challenges and Strategies --
 Management of Aging Wastewater Infrastructure -- Challenges and Strategies -- Jerry N. Johnson, General Manager District of Columbia Water and Sewer Authority Washington, D.C. Overview of the Aging Situation
Impacts of ocean acidification on marine life in Long Island Sound. Christopher J. Gobler, PhD
 Impacts of ocean acidification on marine life in Long Island Sound Christopher J. Gobler, PhD Ocean acidification Lower ph, acidification Calcifying shellfish potentially vulnerable to ocean acidification
Mystic River Watershed. Baseline Index Report
 Mystic River Watershed Baseline Index Report 2001 2007 ABR049 ABR028 MIB001 Mill Brook WIB001 ABR006 UPL001 MYR071 MEB001 ALB006 Alewife Brook MAR036 Map of watershed with Mystic Monitoring Network baseline
DATE: NOVEMBER 14, 2012 MILLER RE: JOB , PROJECT , FINAL TECHNICAL REPORT TOX DEVELOPMENT FILE: NEIW
 MEMORANDUM TO: SUSY KING ROSELLA O CONNOR ROBERT NYMAN DATE: NOVEMBER 14, 2012 FROM: ROBIN LANDECK MILLER RE: JOB 0274-001, PROJECT 2010-51, FINAL TECHNICAL REPORT TOX DEVELOPMENT XICS TMDL FILE: NEIW
Modeling Eutrophication Processes in the Delaware Estuary to Link Watershed Efforts to Control Nutrient Impacts
 Modeling Eutrophication Processes in the Delaware Estuary to Link Watershed Efforts to Control Nutrient Impacts Delaware Watershed Research Conference Philadelphia, PA November 8, 2017 Principal Investigators:
PHASE 1 OF THE CONSENT DECREE/ WET WEATHER IMPROVEMENT PROGRAM ACCOMPLISHMENTS THROUGH 2017
 PHASE 1 OF THE CONSENT DECREE/ WET WEATHER IMPROVEMENT PROGRAM ACCOMPLISHMENTS THROUGH 2017 MSD is delivering Phase 1 is under the original cost estimate Improving Trends in Water Quality MSDGC has completed
Milwaukee Metropolitan Sewerage District Conveyance and Treatment System. MACRO made available by
 Milwaukee Metropolitan Sewerage District Conveyance and Treatment System MACRO made available by Eric Loucks,, CDM MMSD Collection System Operations MMSD operates an extensive system of sanitary sewers
Water Quality Study In the Streams of Flint Creek and Flint River Watersheds For TMDL Development
 Water Quality Study In the Streams of Flint Creek and Flint River Watersheds For TMDL Development Idris Abdi Doctoral Dissertation Presentation Major Advisor: Dr. Teferi Tsegaye April 18, 2005 Alabama
YIR01WQ2 Total oxygen in river stations by river size
 YIR01WQ2 Total oxygen in river stations by river size Figure 1 Annual average dissolved oxygen concentrations (mg O 2 /l) at stations in different sized rivers between 1993 and 1998 11.0 mg O2/l 10.5 10.0
Long Island: Water Resources. Water Sayings. Water Issues. Water Quality Issues specific to LI Coastal Areas. Agriculture and Water Regulation
 Water Sayings Long Island: Water Resources Copyright 2011 AFG 1 All living things need water to survive after air. Water, water everywhere but not a drop to drink. The quality of water is just as important
(1)(A)Inventory of the following existing natural resources on the USFSP Campus or within the context area adjacent to the University.
(A)Inventory of the following existing natural resources on the USFSP Campus or within the context area adjacent to the University.") 13. 6C-21.208 CONSERVATION ELEMENT Information Sources George F. Young, Interview notes, June 2002 Sasaki Associates, Inc., interview notes, April, 2000 Interviews between DRMP Staff and USF Staff, May,
13. 6C-21.208 CONSERVATION ELEMENT Information Sources George F. Young, Interview notes, June 2002 Sasaki Associates, Inc., interview notes, April, 2000 Interviews between DRMP Staff and USF Staff, May,
Monitoring Plan. March Prepared by: Phil Trowbridge NHEP Coastal Scientist New Hampshire Department of Environmental Services
 Monitoring Plan March 2003 Prepared by: Phil Trowbridge NHEP Coastal Scientist New Hampshire Department of Environmental Services This document was funded in part by the U.S. Environmental Protection Agency
R. E. Speece Vanderbilt University David Clidence President of ECO2
 R. E. Speece Vanderbilt University David Clidence President of ECO2 COMPANY PROFILE Headquartered in Indianapolis, IN Founded in 2002 Longest Operating System 15 years 70+ Installations Dr. Richard Speece
Executive Summary. 7 December, 2017 Report No.17-07
 Executive Summary The purpose of the 2017 Technical Report for the Delaware Estuary and Basin (TREB) is to assess the overall environmental condition of the watershed by examining the status and trends
Jordan River Total Maximum Daily Load Study. Presented By: James Harris Utah Division of Water Quality
 Jordan River Total Maximum Daily Load Study Presented By: James Harris Utah Division of Water Quality Jordan River Watershed TMDL Study Area No Introduction Necessary A Few Things to Point Out... Lower
Newtown Creek Superfund Citizens Advisory Group Newtown Creek Combined Sewer Overflow Long Term Control Plan
 Newtown Creek Superfund Citizens Advisory Group Newtown Creek Combined Sewer Overflow Long Term Control Plan Location: McCarren Park Community Center Date: July 25, 2017 Agenda 1 Topic Welcome; Recap of
Grants Pass Water Quality Monitoring
 Grants Pass Water Quality Monitoring 2003-2005 Rogue Valley Council of Governments April 2005 Rogue Valley Council of Governments Natural Resources Department 155 North First Street Central Point, Oregon
IMPLEMENTATION POLICIES AND PROCEDURES: PHASE I TMDLs FOR TOXIC POLLUTANTS IN THE DELAWARE RIVER ESTUARY
 IMPLEMENTATION POLICIES AND PROCEDURES: PHASE I TMDLs FOR TOXIC POLLUTANTS IN THE DELAWARE RIVER ESTUARY Basis and Background Document DELAWARE RIVER BASIN COMMISSION WEST TRENTON, NEW JERSEY MAY 1995
Dissolved Oxygen in the Clyde
 Dissolved Oxygen in the Clyde OceanMet Unit, Marine Science SEPA Ted Schlicke Introduction Description of Clyde estuary Factors affecting Dissolved Oxygen (DO) in water Data analysis- 40 years and >30k
Hydrology and Water Quality. Water. Water 9/13/2016. Molecular Water a great solvent. Molecular Water
 Hydrology and Water Quality Water Molecular Water Exists as an equilibrium But equilibrium altered by what is dissolved in it Water Molecular Water a great solvent In reality, water in the environment
Proposed Wastewater Nitrogen Management Bylaw for Wareham, MA
 Proposed Wastewater Nitrogen Management Bylaw for Wareham, MA Presentation to Town Meeting Dr. Joe Costa Buzzards Bay National Estuary Program April 30, 2007 Wareham s Watersheds The Problem with Nitrogen
Decision Rationale. Total Maximum Daily Load for Phosphorus for the Sassafras River, Cecil and Kent Counties, Maryland 4/1/2002
 Decision Rationale I. Introduction Total Maximum Daily Load for Phosphorus for the Sassafras River, Cecil and Kent Counties, Maryland 4/1/2002 The Clean Water Act (CWA) requires a Total Maximum Daily Load
What Are Environmental (Instream) Flows?
 Flows?") 1 What Are Environmental (Instream) Flows? Sustainable water management requires that both human needs and the needs of aquatic and riparian ecosystems be fulfilled. Dams and diversion of water for municipal
1 What Are Environmental (Instream) Flows? Sustainable water management requires that both human needs and the needs of aquatic and riparian ecosystems be fulfilled. Dams and diversion of water for municipal
Lower Passaic River Restoration Project and Newark Bay Study. Community Involvement Plan. June 2006
 Lower Passaic River Restoration Project and Newark Bay Study Community Involvement Plan June 2006 PREPARED BY: Malcolm Pirnie, Inc. 104 Corporate Park Drive White Plains, NY 10602 FOR: US Environmental
2010 Use Assessment Methodology August 31, 2010
 North Carolina Division of Water Quality 2010 Use Assessment Methodology August 31, 2010 Page 1 of 14 Table of Contents Purpose... 3 Assessment Units and Water Quality Classifications... 3 Data Window/Assessment
Protecting Utah s Water Resources. Nutrient Issues
 Protecting Utah s Water Resources Nutrient Issues Nutrient Issues Questions What are they? Why are they important? Nationally Locally What are the impact on my community Costs Timing What are Nutrients?
MUSCONETCONG SEWERAGE AUTHORITY MORRIS COUNTY, NJ WASTEWATER MANAGEMENT PLAN
 MUSCONETCONG SEWERAGE AUTHORITY MORRIS COUNTY, NJ WASTEWATER MANAGEMENT PLAN SUSSEX COUNTY WATER QUALITY MANAGEMENT PLAN UPPER RARITAN WATER QUALITY MANAGEMENT PLAN UPPER DELAWARE WATER QUALITY MANAGEMENT
New York State Department of Environmental Conservation
 May 2012 New York State Department of Environmental Conservation Award Submission for Environmental Excellence Awards Port Washington Water Pollution Control District (PWWPCD) Submitted by D&B Engineers
Nitrogen Cycling, Primary Production, and Water Quality in the New River Estuary. Defense Coastal/Estuarine Research Program (DCERP)
") Nitrogen Cycling, Primary Production, and Water Quality in the New River Estuary Defense Coastal/Estuarine Research Program (DCERP) Introduction: A key theme of the ongoing DCERP program is monitoring
Nitrogen Cycling, Primary Production, and Water Quality in the New River Estuary Defense Coastal/Estuarine Research Program (DCERP) Introduction: A key theme of the ongoing DCERP program is monitoring
A GIS APPROACH TO HABITAT RESTORATION SITE SELECTION AND PRIORITIZATION IN THE NEW YORK-NEW JERSEY HARBOR ESTUARY
 A GIS APPROACH TO HABITAT RESTORATION SITE SELECTION AND PRIORITIZATION IN THE NEW YORK-NEW JERSEY HARBOR ESTUARY Written by: Kelly Kunert Date: Approved: Dr. William Kirby-Smith, Advisor Dr. Larry Crowder,
North Dakota s Nutrient Reduction Strategy. Presented to the 2016 ND Water Quality Monitoring Conference March 4, 2016
 North Dakota s Nutrient Reduction Strategy Presented to the 2016 ND Water Quality Monitoring Conference March 4, 2016 Nutrients Nutrients, in appropriate amounts, are essential to the growth and health
LAVACA BASIN SUMMARY REPORT
 LAVACA BASIN SUMMARY REPORT July, 2002 Lavaca-Navidad River Authority PO Box 429 Edna, Texas 77957 Paul Price Associates, Inc. 3006 Bee Caves Road, Suite D-230 Austin, Texas 78746 Prepared in cooperation
The importance of ecosystem valuation in multi-functional infrastructure asset management
 The importance of ecosystem valuation in multi-functional infrastructure asset management Franco Montalto, PhD Assistant Professor Drexel University Dept. of Civil, Architectural, & Environmental Engineering
Appendix H: Construction Impacts H-5 Dredged Materials Management Alternatives Analysis
 Appendix H: Construction Impacts H-5 Dredged Materials Management Alternatives Analysis Dredged Material Management Alternatives Analysis A. INTRODUCTION The Tappan Zee Hudson River Crossing Project proposes
Restoration and Protection of the Water Resources of the Greenwood Lake Watershed in New Jersey
 Restoration and Protection of the Water Resources of the Greenwood Lake Watershed in New Jersey Greenwood Lake Commission Bi-state commission that was formed in 2001 for the express purpose of improving
Bronx River Pollutant Loading Model Summary
 Bronx River Pollutant Loading Model Summary Section of River Located in Bronx County Table of Contents Drainage Areas...2 Data Sets Used for Analysis...2 Land Use Statistics...3 Model Calculations...3
WRIA 1 Long Term Monitoring Program Strategy for Implementation
 1 2 3 4 5 6 7 8 9 10 11 12 13 14 15 16 17 18 19 20 21 22 23 24 25 26 27 28 29 30 31 32 33 34 35 36 WRIA 1 Long Term Monitoring Program Strategy for Implementation Section 1- Introduction The June 2005
Finding Data Gaps: Compiling and Interpreting Existing Data
 Finding Data Gaps: Compiling and Interpreting Existing Data Christopher C. Obropta Extension Specialist in Water Resources 732-932 932-4917 www.water.rutgers.edu Defining Scope of Planning Effort Ensures
MURPHY DRAIN CATCHMENT
 The RVCA produces individual reports for 16 catchments in the Lower Rideau subwatershed. Using data collected and analysed by the RVCA through its watershed monitoring and land cover classification programs,
Water Resources Baseline Assessment Report. Prepared in Support of the Regional Plan for Sustainable Development
 Water Resources Baseline Assessment Report Prepared in Support of the Regional Plan for Sustainable Development September 2013 Prepared for NJ Future by Daniel J. Van Abs, PhD, PP/AICP Rutgers The State
Cultural accelerated by anthropogenic activities
 EUTROPHICATION IMPLICATIONS OF N & P Intent of this lecture? Link our discussions of terrestrial N & P dynamics with its influences on receiving water bodies How the relative amounts of N & P can influence
PLEASE do not reuse without permission from NYCDEP. [Please notify Pinar Balci and Alan Cohn
 PLEASE do not reuse without permission from NYCDEP. [Please notify Pinar Balci (PBalci@dep.nyc.gov) and Alan Cohn (AlanC@dep.nyc.gov) if you intend to use any of these slides, and indicate where and when
Read: Case Study: America s First River : A Success Story Summarize the story of the Hudson River and PCB s:
 Botkin & Keller: Environmental Science: Earth as a Living Planet- 8th Ed. APES- Chapter #19- Water Pollution and Treatment- Guided Reading Name: Brandon Tran Learning Objectives: Degradation of our surface-water
Coastal acidification monitoring as part of the monitoring network in Casco Bay
 Coastal acidification monitoring as part of the monitoring network in Casco Bay National Estuary Program Tech Transfer meeting Boston, MA November 3, 2017 Matthew Liebman, US EPA Region 1 Curtis Bohlen,
How has the Hudson River watershed changed since the arrival of Europeans? Manhattan Island in 1609 and 2009; Mannahatta Project
 How has the Hudson River watershed changed since the arrival of Europeans? Manhattan Island in 1609 and 2009; Mannahatta Project Predict what you think happened to each of these land use types between
5.5 NAVIGABLE WATERWAYS AND COASTAL ZONE
 5.5 NAVIGABLE WATERWAYS AND COASTAL ZONE This section discusses the effect of the Proposed Action on navigable waterways, and the Proposed Action s consistency with coastal zone policies. 5.5.1 Navigable