PRELIMINARY DRAINAGE REPORT FOR THE EDI MASTER PLAN
|
|
|
- Brooke Rosamond Rogers
- 5 years ago
- Views:
Transcription
1 PRELIMINARY DRAINAGE REPORT FOR THE EDI MASTER PLAN April 5, 2015 Wayne W. Chang, MS, PE Chang Civil Engineering Hydrology Hydraulics Sedimentation P.O. Box 9496 Rancho Santa Fe, CA (858) FOR REVIEW ONLY
2 TABLE OF CONTENTS Introduction...1 Hydrologic Analyses...2 Conclusion...3 APPENDIX A. 100-Year Rational Method Analyses MAP POCKET Overall Site Plan Rational Method Work Maps FOR REVIEW ONLY

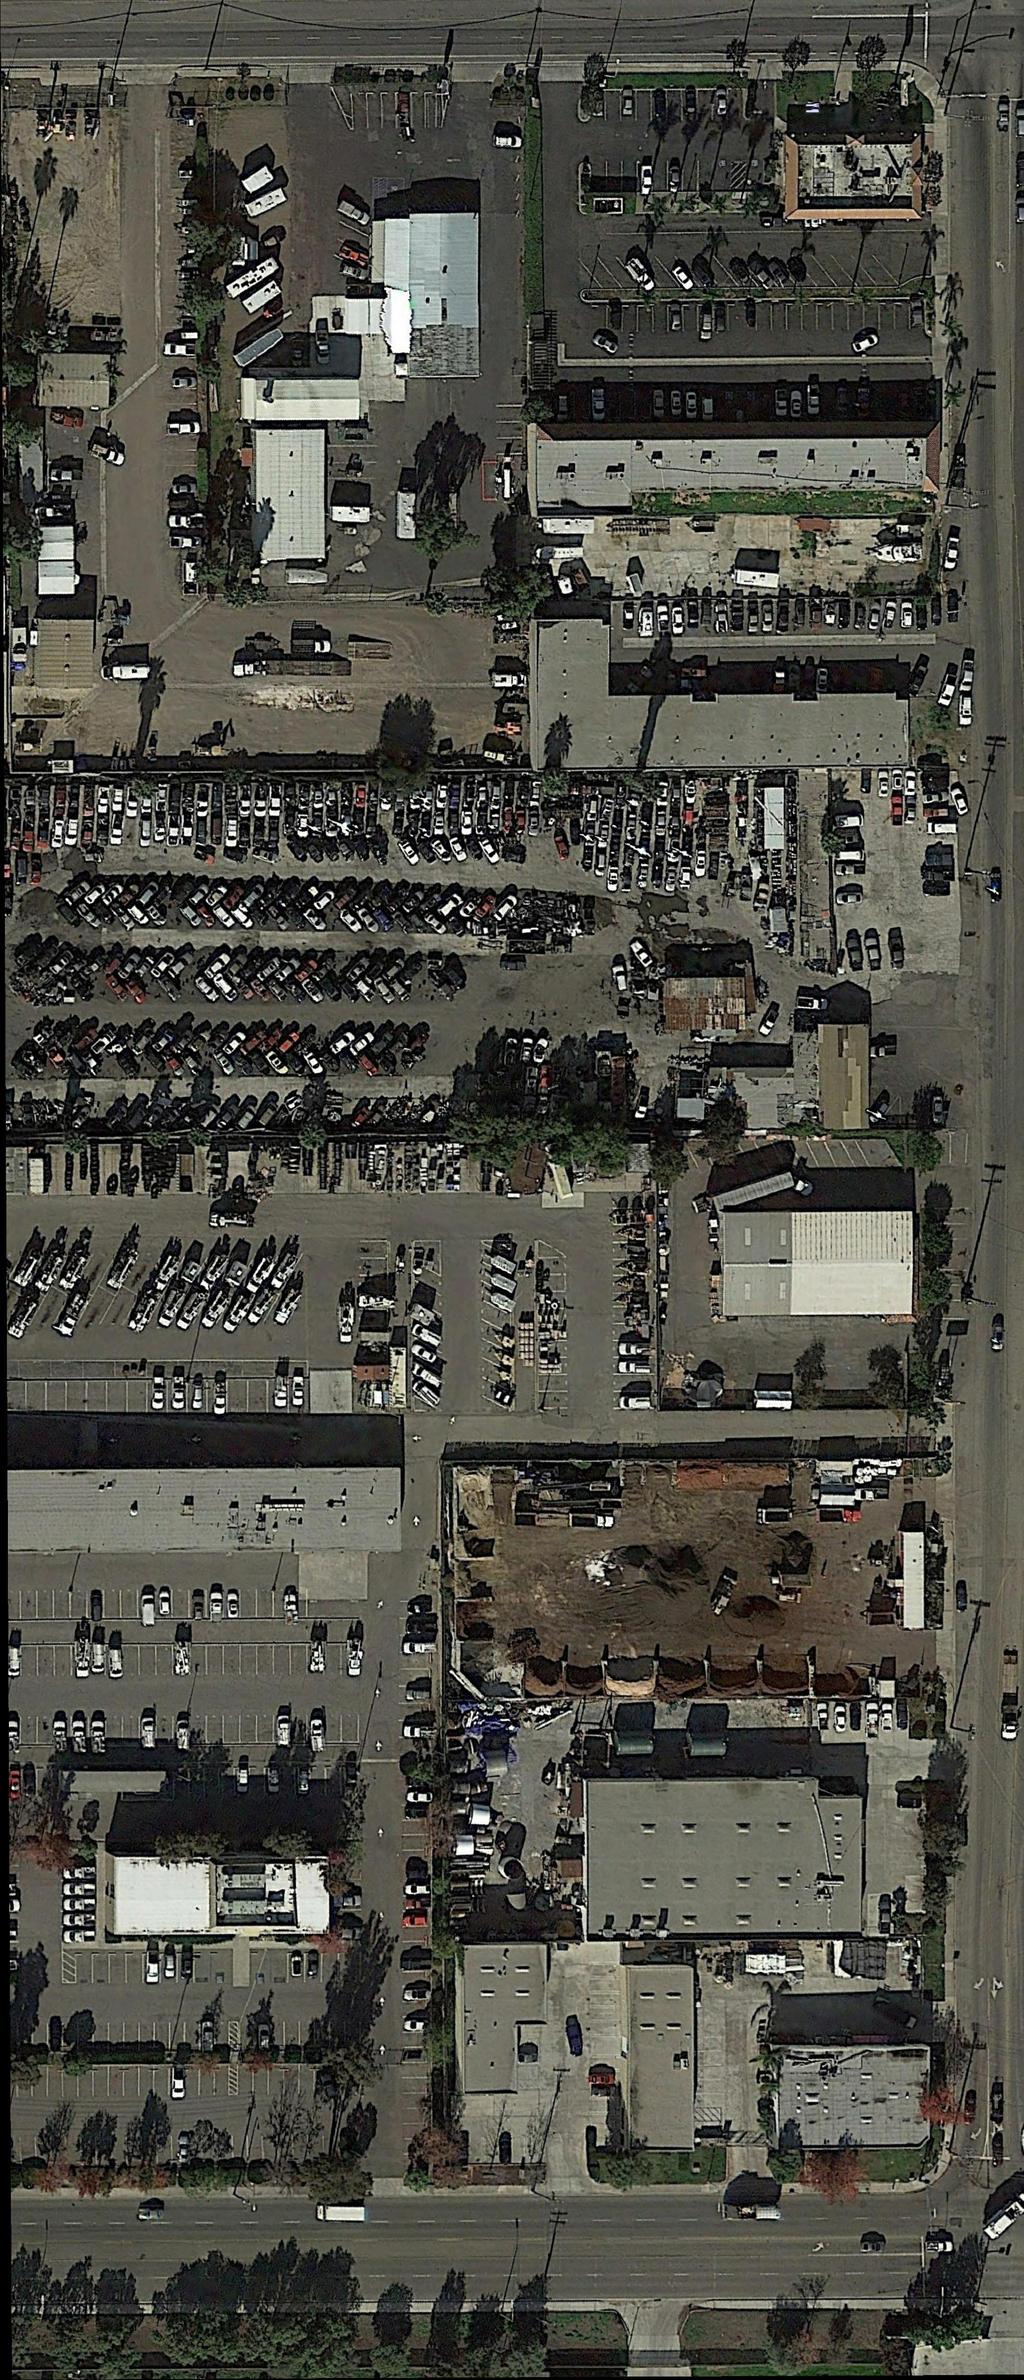
3 INTRODUCTION Escondido Disposal, Inc. operates the Escondido Resource Recovery transfer station at W. Washington Avenue in the city of Escondido (see the Vicinity Map). The overall site also contains adjacent office, industrial, and warehouse buildings and is immediately north of W. Washington Avenue, immediately south of W. Mission Avenue, and approximately mid-block between Metcalf Street and Rock Springs Road. The entire site is currently developed with the industrial and associated uses. EDI proposes to redevelop the site under the EDI Master Plan (see the Site Plan in the map pocket). The Site Plan shows that some of the existing buildings will remain, but will be subject to renovation, while other buildings will be demolished and replaced. In addition, the remainder of the site will be completely revised with new parking spaces, drive aisles, and landscaping. Vicinity Map Under existing pre-project conditions, the northerly site runoff is tributary to a storm drain system approximately mid-way up the site that extends west to Metcalf Street. There is an offsite area to the east that is tributary to the northerly half of the site. The off-site runoff is conveyed through the site with the northerly on-site runoff to the existing storm drain system. The southerly site runoff is tributary to an existing storm drain system in West Washington 1
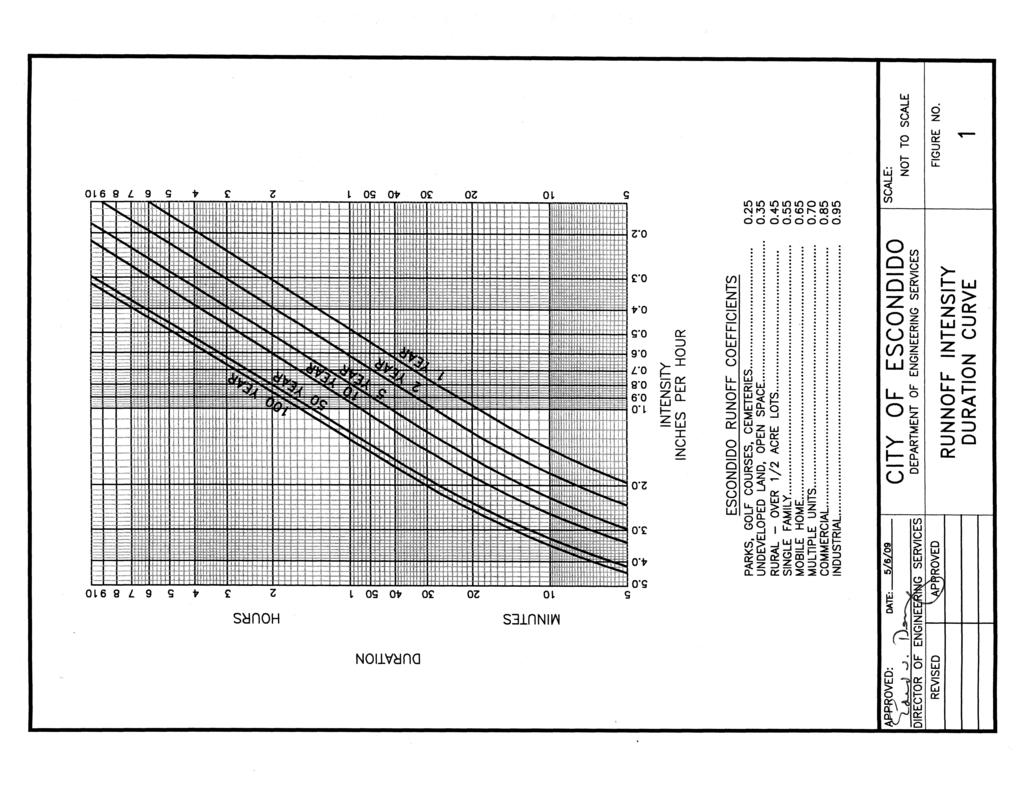
4 Avenue. The two storm drain systems confluence at the intersection of Metcalf Street and West Washington Avenue. Under proposed post-project conditions, the entire on- and tributary off-site runoff will directed towards West Washington Avenue where it will be conveyed towards the storm drain confluence location. An additional storm drain will be constructed in West Washington Avenue from the site to the confluence location to handle the added runoff at the south end of the site. This report contains preliminary existing and proposed condition hydrologic analyses for the EDI Master Plan entitlement. The intent of this report is merely to demonstrate feasibility of the proposed drainage improvements. HYDROLOGIC ANALYSES Hydrologic analyses were performed to determine the 100-year flow rates associated with ultimate redevelopment pursuant to the EDI Master Plan. The preliminary grading and drainage plan (Site Grading Plan) was prepared by Cherry Engineering. The backup data and results are included in Appendix A. The Drainage Design Standards from the County of Escondido s May 6, 2009, Design Standards and Standard Drawings (Standards), were followed for the analyses. The rational method is specified in the Standards and the input parameters are summarized as follows (the supporting data is included in Appendix A): Intensity-Duration: The 100-year intensity-duration curve from Figure 2 of the Standards was used. The 100-year analysis will yield slightly more conservative results than the City s typical 50-year design criteria. The difference between the 50- and 100-year flow rates is small, so the 100-year was chosen because it is the more common standard. Drainage areas: The existing condition on-site drainage areas were delineated from the 1- foot contour interval topographic mapping prepared for the project. The proposed condition on-site drainage areas were delineated from Cherry Engineering s grading plan. The off-site drainage area was delineated from the City of Escondido s 2-foot contour interval topographic mapping and Google Earth. A site investigation was performed to assist in delineating the drainage basin boundaries. The overall existing and proposed condition drainage basin boundaries at the site were set equal to allow a comparison of results. The overall on-site boundaries do not include two portions of the existing buildings because these portions will be unchanged under existing and proposed conditions. The two portions are identified on the proposed condition work map as Existing Building to Remain. For the proposed condition analysis, an additional off-site area was modeled to determine the flow rate within the proposed pipe that extends from the site to the receiving storm drain system. Runoff coefficients: The runoff coefficients were selected based on Figure 1 in the Standards. An industrial land use was assumed for the pre- and post-project conditions (C=0.95). Note that the rational method output identifies the land use for the drainage subareas as commercial. The software does not include an industrial category. Although the land use is labeled commercial, the runoff coefficient was entered as 0.95, which is associated with Escondido s industrial land use. 2
5 Flow lengths and elevations: The flow lengths and elevations within were based on the existing topographic mapping and grading plan, as appropriate. Since all of the initial subareas are relatively small, the initial time of concentration was set to 10 minutes, which is the minimum time per the City of Escondido Standards. In order to verify this, the time of concentration for the longest flow path (Node 20 to 22 under existing conditions) was calculated and confirmed to be less than 10 minutes. The 100-year rational method results are included in Appendix A. The analyses were performed using the CivilDesign Rational Method Hydrology Program. The City of Escondido 100-year intensity-duration curve was entered into the program. The results indicate that the existing condition 100-year runoff from the northerly and southerly portions of the site are 34.7 (at Node 14) and 17.6 cfs (at Node 22), respectively, or 52.3 cfs total. The proposed condition 100-year runoff at the southerly end of the site is 51.0 cfs (at Node 36) and 1.3 cfs (at Node 52) or 52.3 cfs total. Therefore, the project will not increase the runoff. This is expected since the land use is not changing. The preliminary grading plan shows that the project will increase the landscaping from 31,280 square feet to 61,271 square feet. Therefore, the overall runoff will actually be slightly less after redevelopment. CONCLUSION The hydrologic analyses show that the project will not increase the 100-year flow rate. The proposed flows are of a magnitude that can be conveyed by typical storm drain facilities, so a drainage system is feasible. Under proposed conditions, the entire on- and off-site runoff will be conveyed towards the south side of the site. Consequently, an additional off-site storm drain system shall be constructed in West Washington Street from the site towards the existing storm drain confluence at Metcalf Street and West Washington Street. This will collect the additional runoff and cause the on-site and off-site runoff to be conveyed to the same location as under existing conditions. The proposed condition results include the off-site area need to assess the off-site storm drain. The analyses in this report are preliminary and for entitlement purposes only. More detailed analyses will be required for final engineering. 3
6 APPENDIX A 100-YEAR RATIONAL METHOD
7
8 Exist Node Tc for longest initial subarea under either existing or proposed conditions is less than 10 minutes, so use 10 minutes.
9 UNIVERSAL RATIONAL METHOD HYDROLOGY PROGRAM CIVILCADD/CIVILDESIGN Engineering Software, (c) Version 7.1 Rational Hydrology Study Date: 04/05/ EDI Master Plan Existing Conditions 100-Year Flow Rate ********* Hydrology Study Control Information ********** Program License Serial Number Rational hydrology study storm event year is Number of [time,intensity] data pairs = 4 No. Time - Intensity (In.) (In.) (In.) (In.) English Input Units Used English Output Units Used: Area = acres, Distance = feet, Flow q = ft^3/s, Pipe diam. = inches Runoff coefficient method used: Runoff coefficient 'C' value calculated for the equation Q=KCIA [K=unit constant(1 if English Units, 1/360 if SI Units), I=rainfall intensity, A=area]; by the following method: Manual entry of 'C' values Rational Hydrology Method used: The rational hydrology method is used where the area of each subarea in a stream, subarea 'C' value, and rainfall intensity for each subarea is used to determine the subarea flow rate q, of which values are summed for total Q Stream flow confluence option used: Stream flow confluence method of 2-5 streams: Note: in all cases, if the time of concentration or TC of all streams are identical, then q = sum of stream flows Variables p=peak; i=intensity; Fm=loss rate; a=area; 1...n flows q = flow rate, t = time in minutes Peak flow qp is a function of time, TC: usual case q1>q2 and t1>t2 then qp = q1 + q2*(i1/i2), tp=t1 some cases q1>q2 and t1<t2 then qp = q2 + q1*(t2/t1), tp=t2 2
10 Process from Point/Station to Point/Station **** INITIAL AREA EVALUATION **** Initial subarea data: Equations shown use english units, converted if necessary to (SI) Initial area flow distance = (Ft.) Top (of initial area) elevation = (Ft.) Bottom (of initial area) elevation = (Ft.) Difference in elevation = (Ft.) Slope = s(%)= 1.55 Manual entry of initial area time of concentration, TC Initial area time of concentration = min. Rainfall intensity = 3.450(In/Hr) for a year storm Effective runoff coefficient used for area (Q=KCIA) is C = Subarea runoff = (CFS) Total initial stream area = 6.580(Ac.) Process from Point/Station to Point/Station **** IMPROVED CHANNEL TRAVEL TIME **** Upstream point elevation = (Ft.) Downstream point elevation = (Ft.) Channel length thru subarea = (Ft.) Channel base width = 0.000(Ft.) Slope or 'Z' of left channel bank = Slope or 'Z' of right channel bank = Estimated mean flow rate at midpoint of channel = (CFS) Manning's 'N' = Maximum depth of channel = 4.000(Ft.) Flow(q) thru subarea = (CFS) Depth of flow = 0.457(Ft.), Average velocity = 2.749(Ft/s) Channel flow top width = (Ft.) Flow Velocity = 2.75(Ft/s) Travel time = 2.75 min. Time of concentration = min. Critical depth = 0.459(Ft.) Adding area flow to channel Rainfall intensity = 3.195(In/Hr) for a year storm Subarea runoff = (CFS) for 4.320(Ac.) Total runoff = (CFS) Total area = (Ac.) Process from Point/Station to Point/Station **** INITIAL AREA EVALUATION **** 3
11 Initial subarea data: Equations shown use english units, converted if necessary to (SI) Initial area flow distance = (Ft.) Top (of initial area) elevation = (Ft.) Bottom (of initial area) elevation = (Ft.) Difference in elevation = 9.800(Ft.) Slope = s(%)= 0.98 Manual entry of initial area time of concentration, TC Initial area time of concentration = min. Rainfall intensity = 3.450(In/Hr) for a year storm Effective runoff coefficient used for area (Q=KCIA) is C = Subarea runoff = (CFS) Total initial stream area = 5.380(Ac.) End of computations, total study area = (Ac.) 4
12 UNIVERSAL RATIONAL METHOD HYDROLOGY PROGRAM CIVILCADD/CIVILDESIGN Engineering Software, (c) Version 7.1 Rational Hydrology Study Date: 04/07/ EDI Master Plan Proposed Conditions 100-Year Flow Rate ********* Hydrology Study Control Information ********** Program License Serial Number Rational hydrology study storm event year is Number of [time,intensity] data pairs = 4 No. Time - Intensity (In.) (In.) (In.) (In.) English Input Units Used English Output Units Used: Area = acres, Distance = feet, Flow q = ft^3/s, Pipe diam. = inches Runoff coefficient method used: Runoff coefficient 'C' value calculated for the equation Q=KCIA [K=unit constant(1 if English Units, 1/360 if SI Units), I=rainfall intensity, A=area]; by the following method: Manual entry of 'C' values Rational Hydrology Method used: The rational hydrology method is used where the area of each subarea in a stream, subarea 'C' value, and rainfall intensity for each subarea is used to determine the subarea flow rate q, of which values are summed for total Q Stream flow confluence option used: Stream flow confluence method of 2-5 streams: Note: in all cases, if the time of concentration or TC of all streams are identical, then q = sum of stream flows Variables p=peak; i=intensity; Fm=loss rate; a=area; 1...n flows q = flow rate, t = time in minutes Peak flow qp is a function of time, TC: usual case q1>q2 and t1>t2 then qp = q1 + q2*(i1/i2), tp=t1 some cases q1>q2 and t1<t2 then qp = q2 + q1*(t2/t1), tp=t2 Process from Point/Station to Point/Station **** INITIAL AREA EVALUATION **** 1
13 Initial subarea data: Equations shown use english units, converted if necessary to (SI) Initial area flow distance = (Ft.) Top (of initial area) elevation = (Ft.) Bottom (of initial area) elevation = (Ft.) Difference in elevation = (Ft.) Slope = s(%)= 1.55 Manual entry of initial area time of concentration, TC Initial area time of concentration = min. Rainfall intensity = 3.450(In/Hr) for a year storm Effective runoff coefficient used for area (Q=KCIA) is C = Subarea runoff = (CFS) Total initial stream area = 6.580(Ac.) Process from Point/Station to Point/Station **** SUBAREA FLOW ADDITION **** Time of concentration = min. Rainfall intensity = 3.450(In/Hr) for a year storm Subarea runoff = 4.523(CFS) for 1.380(Ac.) Total runoff = (CFS) Total area = 7.960(Ac.) Process from Point/Station to Point/Station **** PIPEFLOW TRAVEL TIME (Program estimated size) **** Upstream point/station elevation = (Ft.) Downstream point/station elevation = (Ft.) Pipe length = (Ft.) Manning's N = No. of pipes = 1 Required pipe flow = (CFS) Nearest computed pipe diameter = 30.00(In.) Calculated individual pipe flow = (CFS) Normal flow depth in pipe = 20.58(In.) Flow top width inside pipe = 27.85(In.) Critical Depth = 20.88(In.) Pipe flow velocity = 7.27(Ft/s) Travel time through pipe = 1.13 min. Time of concentration (TC) = min. Process from Point/Station to Point/Station **** SUBAREA FLOW ADDITION **** Time of concentration = min. Rainfall intensity = 3.345(In/Hr) for a year storm Subarea runoff = 7.849(CFS) for 2.470(Ac.) Total runoff = (CFS) Total area = (Ac.) Process from Point/Station to Point/Station **** SUBAREA FLOW ADDITION **** 2
14 Time of concentration = min. Rainfall intensity = 3.345(In/Hr) for a year storm Subarea runoff = 1.398(CFS) for 0.440(Ac.) Total runoff = (CFS) Total area = (Ac.) Process from Point/Station to Point/Station **** PIPEFLOW TRAVEL TIME (Program estimated size) **** Upstream point/station elevation = (Ft.) Downstream point/station elevation = (Ft.) Pipe length = (Ft.) Manning's N = No. of pipes = 1 Required pipe flow = (CFS) Nearest computed pipe diameter = 33.00(In.) Calculated individual pipe flow = (CFS) Normal flow depth in pipe = 25.50(In.) Flow top width inside pipe = 27.66(In.) Critical Depth = 23.74(In.) Pipe flow velocity = 7.17(Ft/s) Travel time through pipe = 0.84 min. Time of concentration (TC) = min. Process from Point/Station to Point/Station **** CONFLUENCE OF MINOR STREAMS **** Along Main Stream number: 1 in normal stream number 1 Stream flow area = (Ac.) Runoff from this stream = (CFS) Time of concentration = min. Rainfall intensity = 3.267(In/Hr) Process from Point/Station to Point/Station **** INITIAL AREA EVALUATION **** Initial subarea data: Equations shown use english units, converted if necessary to (SI) Initial area flow distance = (Ft.) Top (of initial area) elevation = (Ft.) Bottom (of initial area) elevation = (Ft.) Difference in elevation = 4.200(Ft.) Slope = s(%)= 2.02 Manual entry of initial area time of concentration, TC Initial area time of concentration = min. Rainfall intensity = 3.450(In/Hr) for a year storm Effective runoff coefficient used for area (Q=KCIA) is C = Subarea runoff = 1.639(CFS) Total initial stream area = 0.500(Ac.) Process from Point/Station to Point/Station **** PIPEFLOW TRAVEL TIME (Program estimated size) **** 3
15 Upstream point/station elevation = (Ft.) Downstream point/station elevation = (Ft.) Pipe length = (Ft.) Manning's N = No. of pipes = 1 Required pipe flow = 1.639(CFS) Nearest computed pipe diameter = 12.00(In.) Calculated individual pipe flow = 1.639(CFS) Normal flow depth in pipe = 6.29(In.) Flow top width inside pipe = 11.99(In.) Critical Depth = 6.53(In.) Pipe flow velocity = 3.93(Ft/s) Travel time through pipe = 1.47 min. Time of concentration (TC) = min. Process from Point/Station to Point/Station **** SUBAREA FLOW ADDITION **** Time of concentration = min. Rainfall intensity = 3.314(In/Hr) for a year storm Subarea runoff = 1.228(CFS) for 0.390(Ac.) Total runoff = 2.866(CFS) Total area = 0.890(Ac.) Process from Point/Station to Point/Station **** SUBAREA FLOW ADDITION **** Time of concentration = min. Rainfall intensity = 3.314(In/Hr) for a year storm Subarea runoff = 0.346(CFS) for 0.110(Ac.) Total runoff = 3.213(CFS) Total area = 1.000(Ac.) Process from Point/Station to Point/Station **** PIPEFLOW TRAVEL TIME (Program estimated size) **** Upstream point/station elevation = (Ft.) Downstream point/station elevation = (Ft.) Pipe length = 53.00(Ft.) Manning's N = No. of pipes = 1 Required pipe flow = 3.213(CFS) Nearest computed pipe diameter = 12.00(In.) Calculated individual pipe flow = 3.213(CFS) Normal flow depth in pipe = 6.69(In.) Flow top width inside pipe = 11.92(In.) Critical Depth = 9.22(In.) Pipe flow velocity = 7.13(Ft/s) Travel time through pipe = 0.12 min. Time of concentration (TC) = min. Process from Point/Station to Point/Station **** CONFLUENCE OF MINOR STREAMS **** Along Main Stream number: 1 in normal stream number 2 Stream flow area = 1.000(Ac.) 4
16 Runoff from this stream = 3.213(CFS) Time of concentration = min. Rainfall intensity = 3.302(In/Hr) Summary of stream data: Stream Flow rate TC Rainfall Intensity No. (CFS) (min) (In/Hr) Qmax(1) = * * ) * * 3.213) + = Qmax(2) = * * ) * * 3.213) + = Total of 2 streams to confluence: Flow rates before confluence point: Maximum flow rates at confluence using above data: Area of streams before confluence: Results of confluence: Total flow rate = (CFS) Time of concentration = min. Effective stream area after confluence = (Ac.) Process from Point/Station to Point/Station **** PIPEFLOW TRAVEL TIME (Program estimated size) **** Upstream point/station elevation = (Ft.) Downstream point/station elevation = (Ft.) Pipe length = (Ft.) Manning's N = No. of pipes = 1 Required pipe flow = (CFS) Nearest computed pipe diameter = 33.00(In.) Calculated individual pipe flow = (CFS) Normal flow depth in pipe = 28.03(In.) Flow top width inside pipe = 23.60(In.) Critical Depth = 24.78(In.) Pipe flow velocity = 7.16(Ft/s) Travel time through pipe = 0.66 min. Time of concentration (TC) = min. Process from Point/Station to Point/Station **** SUBAREA FLOW ADDITION **** Time of concentration = min. Rainfall intensity = 3.205(In/Hr) for a year storm Subarea runoff = 0.761(CFS) for 0.250(Ac.) Total runoff = (CFS) Total area = (Ac.) 5
17 Process from Point/Station to Point/Station **** PIPEFLOW TRAVEL TIME (Program estimated size) **** Upstream point/station elevation = (Ft.) Downstream point/station elevation = (Ft.) Pipe length = 15.00(Ft.) Manning's N = No. of pipes = 1 Required pipe flow = (CFS) Nearest computed pipe diameter = 33.00(In.) Calculated individual pipe flow = (CFS) Normal flow depth in pipe = 27.56(In.) Flow top width inside pipe = 24.48(In.) Critical Depth = 25.03(In.) Pipe flow velocity = 7.41(Ft/s) Travel time through pipe = 0.03 min. Time of concentration (TC) = min. Process from Point/Station to Point/Station **** CONFLUENCE OF MINOR STREAMS **** Along Main Stream number: 1 in normal stream number 1 Stream flow area = (Ac.) Runoff from this stream = (CFS) Time of concentration = min. Rainfall intensity = 3.202(In/Hr) Process from Point/Station to Point/Station **** INITIAL AREA EVALUATION **** Initial subarea data: Equations shown use english units, converted if necessary to (SI) Initial area flow distance = (Ft.) Top (of initial area) elevation = (Ft.) Bottom (of initial area) elevation = (Ft.) Difference in elevation = 3.700(Ft.) Slope = s(%)= 2.09 Manual entry of initial area time of concentration, TC Initial area time of concentration = min. Rainfall intensity = 3.450(In/Hr) for a year storm Effective runoff coefficient used for area (Q=KCIA) is C = Subarea runoff = 2.163(CFS) Total initial stream area = 0.660(Ac.) Process from Point/Station to Point/Station **** PIPEFLOW TRAVEL TIME (Program estimated size) **** Upstream point/station elevation = (Ft.) Downstream point/station elevation = (Ft.) Pipe length = (Ft.) Manning's N = No. of pipes = 1 Required pipe flow = 2.163(CFS) Nearest computed pipe diameter = 12.00(In.) Calculated individual pipe flow = 2.163(CFS) Normal flow depth in pipe = 8.57(In.) 6
18 Flow top width inside pipe = 10.85(In.) Critical Depth = 7.55(In.) Pipe flow velocity = 3.61(Ft/s) Travel time through pipe = 0.83 min. Time of concentration (TC) = min. Process from Point/Station to Point/Station **** SUBAREA FLOW ADDITION **** Time of concentration = min. Rainfall intensity = 3.373(In/Hr) for a year storm Subarea runoff = 0.096(CFS) for 0.030(Ac.) Total runoff = 2.259(CFS) Total area = 0.690(Ac.) Process from Point/Station to Point/Station **** PIPEFLOW TRAVEL TIME (Program estimated size) **** Upstream point/station elevation = (Ft.) Downstream point/station elevation = (Ft.) Pipe length = (Ft.) Manning's N = No. of pipes = 1 Required pipe flow = 2.259(CFS) Nearest computed pipe diameter = 12.00(In.) Calculated individual pipe flow = 2.259(CFS) Normal flow depth in pipe = 8.30(In.) Flow top width inside pipe = 11.09(In.) Critical Depth = 7.72(In.) Pipe flow velocity = 3.90(Ft/s) Travel time through pipe = 0.72 min. Time of concentration (TC) = min. Process from Point/Station to Point/Station **** SUBAREA FLOW ADDITION **** Time of concentration = min. Rainfall intensity = 3.305(In/Hr) for a year storm Subarea runoff = 9.672(CFS) for 3.080(Ac.) Total runoff = (CFS) Total area = 3.770(Ac.) Process from Point/Station to Point/Station **** PIPEFLOW TRAVEL TIME (Program estimated size) **** Upstream point/station elevation = (Ft.) Downstream point/station elevation = (Ft.) Pipe length = (Ft.) Manning's N = No. of pipes = 1 Required pipe flow = (CFS) Nearest computed pipe diameter = 18.00(In.) Calculated individual pipe flow = (CFS) Normal flow depth in pipe = 13.03(In.) Flow top width inside pipe = 16.09(In.) Critical Depth = 15.74(In.) 7
19 Pipe flow velocity = 8.70(Ft/s) Travel time through pipe = 0.48 min. Time of concentration (TC) = min. Process from Point/Station to Point/Station **** CONFLUENCE OF MINOR STREAMS **** Along Main Stream number: 1 in normal stream number 2 Stream flow area = 3.770(Ac.) Runoff from this stream = (CFS) Time of concentration = min. Rainfall intensity = 3.261(In/Hr) Summary of stream data: Stream Flow rate TC Rainfall Intensity No. (CFS) (min) (In/Hr) Qmax(1) = * * ) * * ) + = Qmax(2) = * * ) * * ) + = Total of 2 streams to confluence: Flow rates before confluence point: Maximum flow rates at confluence using above data: Area of streams before confluence: Results of confluence: Total flow rate = (CFS) Time of concentration = min. Effective stream area after confluence = (Ac.) Process from Point/Station to Point/Station **** PIPEFLOW TRAVEL TIME (Program estimated size) **** Upstream point/station elevation = (Ft.) Downstream point/station elevation = (Ft.) Pipe length = (Ft.) Manning's N = No. of pipes = 1 Required pipe flow = (CFS) Nearest computed pipe diameter = 36.00(In.) Calculated individual pipe flow = (CFS) Normal flow depth in pipe = 29.91(In.) Flow top width inside pipe = 27.00(In.) Critical Depth = 27.87(In.) Pipe flow velocity = 8.12(Ft/s) Travel time through pipe = 0.41 min. Time of concentration (TC) = min. 8
20 Process from Point/Station to Point/Station **** CONFLUENCE OF MAIN STREAMS **** The following data inside Main Stream is listed: In Main Stream number: 1 Stream flow area = (Ac.) Runoff from this stream = (CFS) Time of concentration = min. Rainfall intensity = 3.164(In/Hr) Program is now starting with Main Stream No. 2 Process from Point/Station to Point/Station **** INITIAL AREA EVALUATION **** Initial subarea data: Equations shown use english units, converted if necessary to (SI) Initial area flow distance = (Ft.) Top (of initial area) elevation = (Ft.) Bottom (of initial area) elevation = (Ft.) Difference in elevation = 3.000(Ft.) Slope = s(%)= 2.03 Manual entry of initial area time of concentration, TC Initial area time of concentration = min. Rainfall intensity = 3.450(In/Hr) for a year storm Effective runoff coefficient used for area (Q=KCIA) is C = Subarea runoff = 1.278(CFS) Total initial stream area = 0.390(Ac.) Process from Point/Station to Point/Station **** CONFLUENCE OF MINOR STREAMS **** Along Main Stream number: 2 in normal stream number 1 Stream flow area = 0.390(Ac.) Runoff from this stream = 1.278(CFS) Time of concentration = min. Rainfall intensity = 3.450(In/Hr) Process from Point/Station to Point/Station **** INITIAL AREA EVALUATION **** Initial subarea data: Equations shown use english units, converted if necessary to (SI) Initial area flow distance = (Ft.) Top (of initial area) elevation = (Ft.) Bottom (of initial area) elevation = (Ft.) Difference in elevation = 9.500(Ft.) Slope = s(%)= 0.95 Manual entry of initial area time of concentration, TC Initial area time of concentration = min. Rainfall intensity = 3.450(In/Hr) for a year storm Effective runoff coefficient used for area (Q=KCIA) is C =
21 Subarea runoff = (CFS) Total initial stream area = 4.910(Ac.) Process from Point/Station to Point/Station **** CONFLUENCE OF MINOR STREAMS **** Along Main Stream number: 2 in normal stream number 2 Stream flow area = 4.910(Ac.) Runoff from this stream = (CFS) Time of concentration = min. Rainfall intensity = 3.450(In/Hr) Summary of stream data: Stream Flow rate TC Rainfall Intensity No. (CFS) (min) (In/Hr) Qmax(1) = * * 1.278) * * ) + = Qmax(2) = * * 1.278) * * ) + = Total of 2 streams to confluence: Flow rates before confluence point: Maximum flow rates at confluence using above data: Area of streams before confluence: Results of confluence: Total flow rate = (CFS) Time of concentration = min. Effective stream area after confluence = 5.300(Ac.) Process from Point/Station to Point/Station **** STREET FLOW TRAVEL TIME + SUBAREA FLOW ADDITION **** Top of street segment elevation = (Ft.) End of street segment elevation = (Ft.) Length of street segment = (Ft.) Height of curb above gutter flowline = 6.0(In.) Width of half street (curb to crown) = (Ft.) Distance from crown to crossfall grade break = (Ft.) Slope from gutter to grade break (v/hz) = Slope from grade break to crown (v/hz) = Street flow is on [1] side(s) of the street Distance from curb to property line = (Ft.) Slope from curb to property line (v/hz) = Gutter width = 1.500(Ft.) Gutter hike from flowline = 1.500(In.) Manning's N in gutter = Manning's N from gutter to grade break =
22 Manning's N from grade break to crown = Estimated mean flow rate at midpoint of street = (CFS) Depth of flow = 0.596(Ft.), Average velocity = 2.783(Ft/s) Warning: depth of flow exceeds top of curb Distance that curb overflow reaches into property = 4.81(Ft.) Streetflow hydraulics at midpoint of street travel: Halfstreet flow width = (Ft.) Flow velocity = 2.78(Ft/s) Travel time = 2.80 min. TC = min. Adding area flow to street Rainfall intensity = 3.190(In/Hr) for a year storm Subarea runoff = 1.758(CFS) for 0.580(Ac.) Total runoff = (CFS) Total area = 5.880(Ac.) Street flow at end of street = (CFS) Half street flow at end of street = (CFS) Depth of flow = 0.604(Ft.), Average velocity = 2.805(Ft/s) Warning: depth of flow exceeds top of curb Distance that curb overflow reaches into property = 5.20(Ft.) Flow width (from curb towards crown)= (Ft.) Process from Point/Station to Point/Station **** PIPEFLOW TRAVEL TIME (User specified size) **** Upstream point/station elevation = (Ft.) Downstream point/station elevation = (Ft.) Pipe length = (Ft.) Manning's N = No. of pipes = 1 Required pipe flow = (CFS) Given pipe size = 24.00(In.) Calculated individual pipe flow = (CFS) Normal flow depth in pipe = 18.75(In.) Flow top width inside pipe = 19.84(In.) Critical Depth = 18.88(In.) Pipe flow velocity = 7.27(Ft/s) Travel time through pipe = 0.26 min. Time of concentration (TC) = min. Process from Point/Station to Point/Station **** CONFLUENCE OF MAIN STREAMS **** The following data inside Main Stream is listed: In Main Stream number: 2 Stream flow area = 5.880(Ac.) Runoff from this stream = (CFS) Time of concentration = min. Rainfall intensity = 3.166(In/Hr) Summary of stream data: Stream Flow rate TC Rainfall Intensity No. (CFS) (min) (In/Hr) Qmax(1) = * * ) + 11
23 0.999 * * ) + = Qmax(2) = * * ) * * ) + = Total of 2 main streams to confluence: Flow rates before confluence point: Maximum flow rates at confluence using above data: Area of streams before confluence: Results of confluence: Total flow rate = (CFS) Time of concentration = min. Effective stream area after confluence = (Ac.) Process from Point/Station to Point/Station **** PIPEFLOW TRAVEL TIME (Program estimated size) **** Upstream point/station elevation = (Ft.) Downstream point/station elevation = (Ft.) Pipe length = (Ft.) Manning's N = No. of pipes = 1 Required pipe flow = (CFS) Nearest computed pipe diameter = 39.00(In.) Calculated individual pipe flow = (CFS) Normal flow depth in pipe = 30.28(In.) Flow top width inside pipe = 32.50(In.) Critical Depth = 31.90(In.) Pipe flow velocity = 10.15(Ft/s) Travel time through pipe = 0.19 min. Time of concentration (TC) = min. End of computations, total study area = (Ac.) 12
24 FF FF FF FF FF
25
26
RATIONAL METHOD INPUT PARAMETERS
 RATIONAL METHOD INPUT PARAMETERS TIME OF CONCENTRATION Study Area Rational Method Nodes Upper Elevation, ft Lower Elevation, ft Flow Length, mi Tc, min Quarry Phase 1 10 12 352.2 221 0.014 0.17 Quarry
Appendix H Amanda Estates Drainage Study
 Appendix H Amanda Estates Drainage Study Hunsaker & Associates 2015 Contents 1 Scope... 1 2 Existing Conditions... 1 3 Project Description... 3 4 Methodology... 5 4.1 Hydrology... 5 4.2 Hydraulics...
HYDROLOGY STUDY PREPARED FOR: MARKHAM PERRIS LLC 302 WEST FIFTH STREET, SUITE 103 SAN PEDRO, CA (310) FOR THE PROJECT:
 FOR THE PROJECT:") HYDROLOGY STUDY PREPARED FOR: MARKHAM PERRIS LLC 302 WEST FIFTH STREET, SUITE 103 SAN PEDRO, CA 90731 (310) 241-2992 FOR THE PROJECT: PERRIS VALLEY COMMERCE CENTER BUILDING PERRIS, CALIFORNIA PROJECT NUMBER:
HYDROLOGY STUDY PREPARED FOR: MARKHAM PERRIS LLC 302 WEST FIFTH STREET, SUITE 103 SAN PEDRO, CA 90731 (310) 241-2992 FOR THE PROJECT: PERRIS VALLEY COMMERCE CENTER BUILDING PERRIS, CALIFORNIA PROJECT NUMBER:
City Plaza Residential (TPM ) Preliminary Hydrology Report
 Preliminary Hydrology Report") Hydrology Study City Plaza Residential (TPM 2016-127) Preliminary Hydrology Report Orange, Orange County, California Prepared For: Greenlaw Partners 18301 Von Karman Avenue, Suite 250 Irvine, CA 92612
Hydrology Study City Plaza Residential (TPM 2016-127) Preliminary Hydrology Report Orange, Orange County, California Prepared For: Greenlaw Partners 18301 Von Karman Avenue, Suite 250 Irvine, CA 92612
Introduction to Storm Sewer Design
 A SunCam online continuing education course Introduction to Storm Sewer Design by David F. Carter Introduction Storm sewer systems are vital in collection and conveyance of stormwater from the upstream
PRELIMINARY HYDROLOGY STUDY
 PRELIMINARY HYDROLOGY STUDY FOR Tentative Tract Map West Side of Loma Alta Drive City of Oceanside, CA Prepared For: EMERALD HILLS LLC 4272 Dogwood Avenue Seal Beach, CA 90740 Contact: Mr. Jimmy Chen Ph:
PRELIMINARY DRAINAGE STUDY. Del Prado 2329 CENTRE CITY PARKWAY ESCONDIDO, CALIFORNIA
 PRELIMINARY DRAINAGE STUDY FOR Del Prado 2329 CENTRE CITY PARKWAY ESCONDIDO, CALIFORNIA OWNER: Touchstone Communities 12700 Stowe Drive, Suite 130 Poway, CA 92064 858-586-0414 ENGINEER: MASSON & ASSOCIATES,
PRELIMINARY DRAINAGE STUDY
 PRELIMINARY DRAINAGE STUDY For 34 th & J Residences 3402 J St. San Diego, CA 92102 A.P.N 545-250-08 Prepared By: Kenneth J. Discenza, P.E. Site Design Associates, Inc. 1016 Broadway, Suite A El Cajon,
FORT COLLINS STORMWATER CRITERIA MANUAL Hydrology Standards (Ch. 5) 1.0 Overview
 1.0 Overview") Chapter 5: Hydrology Standards Contents 1.0 Overview... 1 1.1 Storm Runoff Determination... 1 1.2 Design Storm Frequencies... 1 1.3 Water Quality Storm Provisions... 2 1.4 Design Storm Return Periods...
Chapter 5: Hydrology Standards Contents 1.0 Overview... 1 1.1 Storm Runoff Determination... 1 1.2 Design Storm Frequencies... 1 1.3 Water Quality Storm Provisions... 2 1.4 Design Storm Return Periods...
RE: Final Drainage Letter: Northwest Aurora Alley Improvements 2016
 April 12, 2016 Mr. Craig Perl, P.E. Senior Engineer City of Aurora Public Works Department 15151 E. Alameda Parkway Aurora, CO 80012 RE: Final Drainage Letter: Northwest Aurora Alley Improvements 2016
DIVISION 5 STORM DRAINAGE CRITERIA
 DIVISION 5 STORM DRAINAGE CRITERIA Section 5.01 GENERAL The following storm drainage design criteria shall apply to all storm drainage designs in the City. Additional design criteria are specified in the
Chapter 4. Drainage Report and Construction Drawing Submittal Requirements
 4.0 Introduction The requirements presented in this section shall be used to aid the design engineer or applicant in the preparation of drainage reports, drainage studies, and construction drawings for
APPENDIX C PRELIMINARY HYDROLOGY AND WATER QUALITY STUDY (BWE 2017)
") UC San Diego Voigt Parking Structure Draft Initial Study and Mitigated Negative Declaration October 2017 APPENDIX C PRELIMINARY HYDROLOGY AND WATER QUALITY STUDY (BWE 2017) UC San Diego Voigt Parking Structure
UC San Diego Voigt Parking Structure Draft Initial Study and Mitigated Negative Declaration October 2017 APPENDIX C PRELIMINARY HYDROLOGY AND WATER QUALITY STUDY (BWE 2017) UC San Diego Voigt Parking Structure
RETENTION BASIN EXAMPLE
 -7 Given: Total Tributary Area = 7.5 ac o Tributary Area within Existing R/W = 5.8 ac o Tributary Area, Impervious, Outside of R/W = 0.0 ac o Tributary Area, Pervious, Outside of R/W = 1.7 ac o Tributary
Technical Memorandum
 Tucson Office 3031 West Ina Road Tucson, AZ 85741 Tel 520.297.7723 Fax 520.297.7724 www.tetratech.com Technical Memorandum To: Kathy Arnold From: Greg Hemmen, P.E. Company: Rosemont Copper Company Date:
APPENDIX F RATIONAL METHOD
 7-F-1 APPENDIX F RATIONAL METHOD 1.0 Introduction One of the most commonly used procedures for calculating peak flows from small drainages less than 200 acres is the Rational Method. This method is most
Contents. Drainage Analysis: Hunters Trace, Westpointe, and Hunters Creek
 Drainage Analysis: Hunters Trace, Westpointe, and Hunters Creek Contents SITE LOCATION / DESCRIPTION... 3 WESTPOINTE STORMWATER MANAGEMENT PLAN... 3 THE ENCLAVE AT WESTPOINTE DETENTION POND... 3 Table
3.3 Acceptable Downstream Conditions
 iswm TM Criteria Manual - = Not typically used or able to meet design criterion. 1 = The application and performance of proprietary commercial devices and systems must be provided by the manufacturer and
Learn how to design inlet grates, detention basins, channels, and riprap using the FHWA Hydraulic Toolbox and WMS
 v. 11.0 WMS 11.0 Tutorial Learn how to design inlet grates, detention basins, channels, and riprap using the FHWA Hydraulic Toolbox and WMS Objectives Learn how to use several Hydraulic Toolbox calculators
Applying the Water Quality Volume
 Applying the Water Quality Volume Justin Reinhart, PE Division of Surface Water Northeast Ohio Stormwater Training Council Cleveland, Ohio & Richfield, Ohio July 12, 2018 July 25, 2018 Post-Construction
APPENDIX F HYDROLOGY REPORT
 APPENDIX F HYDROLOGY REPORT UCSD LONG RANGE DEVELOPMENT PLAN HYDROLOGY STUDY MAY 2004 PREPARED FOR: UNIVERSITY OF CALIFORNIA, SAN DIEGO 10280 NORTH TORREY PINES ROAD, SUITE 340 LA JOLLA, CA 92093-0965
PART 3 STORM WATER TECHNICAL MANUAL
 PART 3 STORM WATER TECHNICAL MANUAL A. INTRODUCTION The Storm Water Technical Manual contains requirements for land development and construction activities, as well as design criteria and guidelines for
Hydrology Study. Ascension Heights Subdivision Ascension Drive at Bel Aire Road San Mateo, California (Unincorporated)
") Hydrology Study Ascension Heights Subdivision Ascension Drive at Bel Aire Road San Mateo, California (Unincorporated) Prepared for San Mateo Real Estate & Construction March 9, 21 Rev. 1 11-8-211 Rev.
Hydrology Study Ascension Heights Subdivision Ascension Drive at Bel Aire Road San Mateo, California (Unincorporated) Prepared for San Mateo Real Estate & Construction March 9, 21 Rev. 1 11-8-211 Rev.
HYDROLOGIC-HYDRAULIC STUDY ISABELLA OCEAN RESIDENCES ISLA VERDE, CAROLINA, PR
 HYDROLOGIC-HYDRAULIC STUDY ISABELLA OCEAN RESIDENCES ISLA VERDE, CAROLINA, PR 1 INTRODUCTION 1.1 Project Description and Location Isabella Ocean Residences is a residential development to be constructed
ZONING ORDINANCE FOR THE ZONED UNINCORPORATED AREAS ARTICLE 1500 OF PUTNAM COUNTY, WEST VIRGINIA Page 149 ARTICLE 1500 DRAINAGE AND STORM SEWERS
 OF PUTNAM COUNTY, WEST VIRGINIA Page 149 ARTICLE 1500 DRAINAGE AND STORM SEWERS 1500.01 GENERAL REQUIREMENTS 1500.02 NATURE OF STORM WATER FACILITIES 1500.03 DRAINAGE EASEMENTS 1500.04 STORM WATER MANAGEMENT
PART V - STORM DRAIN DESIGN CRITERIA
 PART V - STORM DRAIN DESIGN CRITERIA A. Hydrology Studies and Hydraulic Analyses 1. Drainage area master plans and calculations are to be submitted with all subdivision improvement plans, permit improvement
PART V - STORM DRAIN DESIGN CRITERIA
 PART V - STORM DRAIN DESIGN CRITERIA A. Hydrology Studies and Hydraulic Analyses 1. Drainage area master plans and calculations are to be submitted with all subdivision improvement plans, permit improvement
HYDROLOGY STUDY LA MIRADA BOULEVARD La Mirada, California
 HYDROLOGY STUDY 12000 LA MIRADA BOULEVARD La Mirada, California TTM 73119 Prepared for: The Olson Company 3010 Old Ranch Parkway, Suite 100 Seal Beach, CA 90740 Contact: Mr. Aaron Orenstein (562) 370-9531
CHECKLIST FOR STREETS, INLETS, AND STORM SEWER DESIGN
 CHECKLIST FOR STREETS, INLETS, I. STREET CLASSIFICATION AND DESIGN CRITERIA A. Determine drainage classification for the roadway section using Table 7-1 or Table 7-2. B. Determine the allowable flow depth
DICKINSON BAYOU WATERSHED STEERING COMMITTEE FINAL MEMBER CRITERIA COMPARISON
 DICKINSON BAYOU WATERSHED STEERING COMMITTEE FINAL MEMBER CRITERIA COMPARISON May 25, 2006 INTRODUCTION The Dickinson Bayou Watershed covers approximately 95.5 square miles and stretches from western Brazoria
Appendix L. Drainage Report
 Appendix L Drainage Report 2nd Street and Pacific Coast Highway Retail Project City of Long Beach County of Los Angeles, CA DRAINAGE REPORT April 5, 2017 DRAINAGE REPORT For: 2nd Street and Pacific Coast
APPENDIX J-3. Orcem Stormwater Management and Treatment Facilities Design Summary
 APPENDIX J-3 Orcem Stormwater Management and Treatment Facilities Design Summary Stormwater Management & Treatment Facilities Design Summary INTRODUCTION KPFF Consulting Engineers has compiled this report
January 20, Nate Hatleback Project Manager, City of Thornton Development Engineering 9500 Civic Center Drive Thornton, CO (303)
") January 20, 2017 Nate Hatleback Project Manager, City of Thornton Development Engineering 9500 Civic Center Drive Thornton, CO 80229 (303) 538-7694 RE: Riverdale Five Retail Drainage Conformance Letter
January 20, 2017 Nate Hatleback Project Manager, City of Thornton Development Engineering 9500 Civic Center Drive Thornton, CO 80229 (303) 538-7694 RE: Riverdale Five Retail Drainage Conformance Letter
Preliminary Stormwater Quality Mitigation Report
 Preliminary Stormwater Quality Mitigation Report MGA Chatsworth Campus 20000 Prairie Street Chatsworth, CA TUSTIN 17782 17th Street Suite 200 Tustin, CA 92780-1947 714.665.4500 Fax 714.665.4501 LOS ANGELES
December 6, Nate Hatleback Project Manager City of Thornton 9500 Civic Center Drive Thornton, CO 80229
 December 6, 2016 Nate Hatleback Project Manager City of Thornton 9500 Civic Center Drive Thornton, CO 80229 RE: Drainage Conformance Letter Hilton Garden Inn @ The Grove The Grove Filing No 1, lot 5E Thornton,
CONSTRUCTION PLAN CHECKLIST
 CONSTRUCTION PLAN CHECKLIST The design engineer is responsible for ensuring that plans submitted for city review are in accordance with this checklist. It is requested that the executed checklist be submitted
Drainage Analysis. Appendix E
 Drainage Analysis Appendix E The existing and proposed storm drainage systems have been modeled with Bentley CivilStorm V8 computer modeling software. The peak stormwater discharge was determined for
INITIAL INFLOW DESIGN FLOOD CONTROL SYSTEM PLAN PLANT MCMANUS ASH POND A (AP-1) 40 CFR
 40 CFR") INITIAL INFLOW DESIGN FLOOD CONTROL SYSTEM PLAN PLANT MCMANUS ASH POND A (AP-1) 40 CFR 257.82 EPA s Disposal of Coal Combustion Residuals from Electric Utilities Final Rule (40 C.F.R. Part 257 and Part
INITIAL INFLOW DESIGN FLOOD CONTROL SYSTEM PLAN PLANT MCMANUS ASH POND A (AP-1) 40 CFR 257.82 EPA s Disposal of Coal Combustion Residuals from Electric Utilities Final Rule (40 C.F.R. Part 257 and Part
LAKE COUNTY HYDROLOGY DESIGN STANDARDS
 LAKE COUNTY HYDROLOGY DESIGN STANDARDS Lake County Department of Public Works Water Resources Division 255 N. Forbes Street Lakeport, CA 95453 (707)263-2341 Adopted June 22, 1999 These Standards provide
Appendix B Stormwater Site Plan Submittal Requirements Checklist
 Stormwater Site Plan Submittal Requirements Checklist The Submittal Requirements Checklist is intended to aid the design engineer in preparing a Stormwater Site Plan. All items included in the following
TABLE OF CONTENTS PART III - MINIMUM DESIGN STANDARDS Section 105 DRAINAGE SYSTEM DESIGN SPECIFICATIONS AND SCOPE 105.1
 TABLE OF CONTENTS PART III - MINIMUM DESIGN STANDARDS Section 105 DRAINAGE SYSTEM DESIGN SECTION TITLE PAGE 105.1. SPECIFICATIONS AND SCOPE 105.1 105.2. METHODS OF ANALYSIS 105.1 105.2.1. Rational Method
LIST OF TABLES... ii LIST OF FIGURES... iii LIST OF APPENDICES... iv. Section 1 - Introduction Purpose of Study... 1
 Preliminary Hydrologic Analysis for Alberhill Villages April 2015 TABLE OF CONTENTS Section Name Page Number LIST OF TABLES... ii LIST OF FIGURES... iii LIST OF APPENDICES... iv Section 1 - Introduction...
THE CROSSROADS IN WINCHESTER 4. DRAINAGE PLAN. 4. Drainage Plan. a. Drainage Plan Description
 THE CROSSROADS IN WINCHESTER 4. DRAINAGE PLAN 4. Drainage Plan a. Drainage Plan Description The Specific Plan area drains naturally into two separate watersheds: approximately 6 percent of the Specific
Summary of Detention Pond Calculation Canyon Estates American Canyon, California
 July 15, 2015 Bellecci & Associates, Inc Summary of Detention Pond Calculation Canyon Estates American Canyon, California 1. Methodology: Method: Unit Hydrograph Software: Bentley Pond Pack Version 8i
Chapter 7. Street Drainage. 7.0 Introduction. 7.1 Function of Streets in the Drainage System. 7.2 Street Classification
 7. Introduction This chapter summarizes methods to evaluate runoff conveyance in various street cross sections and curb types in the Town of Castle Rock and identifies acceptable upper limits of street
Section 600 Runoff Table of Contents
 Section 600 Runoff Table of Contents 601 INTRODUCTION...600-1 602 RATIONAL METHOD...600-1 602.1 Rational Method Formula...600-2 602.2 Time of Concentration...600-2 602.3 Intensity...600-4 602.4 Runoff
Chapter 6. Hydrology. 6.0 Introduction. 6.1 Design Rainfall
 6.0 Introduction This chapter summarizes methodology for determining rainfall and runoff information for the design of stormwater management facilities in the City. The methodology is based on the procedures
INFLOW DESIGN FLOOD CONTROL SYSTEM PLAN PLANT GREENE COUNTY ASH POND ALABMA POWER COMPANY
 INFLOW DESIGN FLOOD CONTROL SYSTEM PLAN PLANT GREENE COUNTY ASH POND ALABMA POWER COMPANY Section 257.82 of EPA s regulations requires the owner or operator of an existing or new CCR surface impoundment
Subject: Mt. San Antonio College- Measure RR Updated Hydrology Study
 To: Cc: Mike Klein Mt. San Antonio College Sidney Lindmark, AICP Mt SAC Environmental Consultant From: Alysen Weiland, PE - Psomas Date: May 6, 2016 Subject: Mt. San Antonio College- Measure RR Updated
SECTION 4 STORM DRAINAGE
 4.01 GENERAL SECTION 4 STORM DRAINAGE These standards shall provide minimum requirements for the design of Storm Drainage and related appurtenances within the City of West Sacramento rights of way and
HYDROLOGY CHECKLIST FOR LAND DISTURBANCE PERMITS
 HYDROLOGY CHECKLIST FOR LAND DISTURBANCE PERMITS Project Name: Project Number: Reviewed By: Date: Telephone: Email: Address all items marked with an X Minimum Submittal Requirements 1. Conceptual Review
CUYAHOGA COUNTY ENGINEER
 CUYAHOGA COUNTY ENGINEER DRAINAGE MANUAL Supplement to O.D.O.T. LOCATION and DESIGN MANUAL, Volume 2, Drainage Design, Section 1000 and 1100 May 28, 2010 Revisions to the July 29, 2009 edition are noted
Appendix E.2 Preliminary Hydrology Report
 Appendix E.2 Preliminary Hydrology Report PRELIMINARY HYDROLOGY STUDY HARVARD WESTLAKE SCHOOL PARKING STRUCTURE 3700 Coldwater Canyon North Hollywood, CA 91604 KPFF Job # 109046 August 12, 2013 CLIENT:
Preliminary Drainage Analysis
 Preliminary Drainage Analysis Tanimura and Antle Employee Housing Town of Spreckels County of Monterey, California LIB150205 May 29, 2015 Prepared For: Tanimura and Antle Produce Prepared By: 9699 Blue
100-yr Design Runoff (cfs) Basin ID 103b A a B B C Totals
 Basin ID 103b A a B B C Totals") PROPOSED DEVELOPMENT The drainage for this site has been designed to be less than the maximum allowable runoff from each basin as stated in the Overall Rigden Farm drainage plan. Table 1 compares the actual
PROPOSED DEVELOPMENT The drainage for this site has been designed to be less than the maximum allowable runoff from each basin as stated in the Overall Rigden Farm drainage plan. Table 1 compares the actual
Hydrology Study. For Bella Terrazza Portion of Lot 1, Block 39, Subdivision of S Tract, Rancho El Cajon El Cajon, CA 92021
 Hydrology Study For Bella Terrazza Portion of Lot 1, Block 39, Subdivision of S Tract, Rancho El Cajon El Cajon, CA 92021 Prepared for Daryl Priest - Priest Development Corporation 124 West Main Street,
HY-12 User Manual. Aquaveo. Contents
 Y-12 User Manual Aquaveo Contents Overview...2 Watershed Parameters...3 Channel Parameters...3 Storm Drain Parameters...3 Design of new systems...4 Analysis of existing systems...4 Steady flow...4 ydrographic
Astra Engineering LLC
 Astra Engineering LLC!"#$#% &'( ) *) ) *)* +## ) ',#$$+-."$% "#"-",-/$+ 0 ) )1'(0 23** ) 243 5*6 78947)3 9**!:;24?)3* 973''!"$#%=4? *9> %-2/- 2+ @:* 3*$/A 2 32 @3*49 13* 32 3-3*-* 2!!2 3*!*!2
November 21, City of Thornton 9500 Civic Center Drive Thornton, CO (303) RE: Maverik Thornton, CO - Drainage Report
 RE: Maverik Thornton, CO - Drainage Report") November 21, 2016 City of Thornton 9500 Civic Center Drive Thornton, CO 80229 (303) 538-7295 RE: Maverik Thornton, CO - Drainage Report As per your request, we are submitting to you the drainage report
November 21, 2016 City of Thornton 9500 Civic Center Drive Thornton, CO 80229 (303) 538-7295 RE: Maverik Thornton, CO - Drainage Report As per your request, we are submitting to you the drainage report
DESIGN DEVELOPMENT HYDROLOGY REPORT & LOW IMPACT DEVELOPMENT PLAN (LID PLAN)
") DESIGN DEVELOPMENT HYDROLOGY REPORT & LOW IMPACT DEVELOPMENT PLAN ( PLAN) ALAMITOS BEACH CONCESSION BUILDING 780 E. SHORELINE DRIVE LONG BEACH, CALIFORNIA Prepared For: Long Beach Public Works 333 W. Ocean
DESIGN DEVELOPMENT HYDROLOGY REPORT & LOW IMPACT DEVELOPMENT PLAN ( PLAN) ALAMITOS BEACH CONCESSION BUILDING 780 E. SHORELINE DRIVE LONG BEACH, CALIFORNIA Prepared For: Long Beach Public Works 333 W. Ocean
APPENDIX G HYDRAULIC GRADE LINE
 Storm Drainage 13-G-1 APPENDIX G HYDRAULIC GRADE LINE 1.0 Introduction The hydraulic grade line is used to aid the designer in determining the acceptability of a proposed or evaluation of an existing storm
Appendix G Preliminary Hydrology Study
 Appendix G Preliminary Hydrology Study Preliminary Hydrology Study VESTING TTM 72608 Long Beach, CA Prepared for: The Long Beach Project, LLC 888 San Clemente, Suite 100 New Port Beach, CA May 28, 2014
Sump Pumps Office procedures for the Drainage & Grading section
 County of Los Angeles Department of Public Works Building and Safety Division Grading and Drainage Section Sump Pumps Office procedures for the Drainage & Grading section Introduction This manual provides
Storm Sewer Design. Bob Pitt University of Alabama and Shirley Clark Penn State Harrisburg
 Storm Sewer Design Bob Pitt University of Alabama and Shirley Clark Penn State Harrisburg Major floods are dramatic and water flow routes must be recognized when minor drainage systems fail. These types
WMS 8.4 Tutorial Storm Drain Modeling Storm Drain: Hydrographic Design Learn how to run sub-basin hydrographs through a storm drain network
 v. 8.4 WMS 8.4 Tutorial Storm Drain Modeling Storm Drain: Hydrographic Design Learn how to run sub-basin hydrographs through a storm drain network Objectives Build a rational method model and compute sub-basin
STORM DRAINAGE DESIGN MANUAL
 Appendix I STORM DRAINAGE DESIGN MANUAL by: SUNGATE DESIGN GROUP, P.A. GEN ERAL DESIGN STAN DARDS AN D POLICIES 1. STREET AND LOCAL DRAINAGE Discharge estimates for specified design storms shall be calculated
Prepared for: City of Jeffersonville. November Prepared by
 JEFFERSONVILLE STORMWATER MASTER PLAN HYDRAULICS APPENDIX JEFFERSONVILLE, INDIANA Prepared for: City of Jeffersonville November 2011 Prepared by Christopher B. Burke Engineering, Ltd. 115 W. Washington
PRELIMINARY DRAINAGE REPORT NEWCASTLE FIRE STATION OLD STATE HIGHWAY
 PRELIMINARY DRAINAGE REPORT FOR THE NEWCASTLE FIRE STATION OLD STATE HIGHWAY PREPARED FOR THE NEWCASTLE FIRE PROTECTION DISTRICT JULY 2014 BY ROSEVILLE DESIGN GROUP, INC. ROSEVILLE DESIGN GROUP, Inc Established
WMS 9.1 Tutorial Storm Drain Modeling Storm Drain: Hydrographic Design Learn how to run sub-basin hydrographs through a storm drain network
 v. 9.1 WMS 9.1 Tutorial Storm Drain Modeling Storm Drain: Hydrographic Design Learn how to run sub-basin hydrographs through a storm drain network Objectives Build a rational method model and compute sub-basin
Report. Inflow Design Flood Control System Plan St. Clair Power Plant St. Clair, Michigan. DTE Energy Company One Energy Plaza, Detroit, MI
 Report Inflow Design Flood Control System Plan St. Clair Power Plant St. Clair, Michigan DTE Energy Company One Energy Plaza, Detroit, MI October 14, 2016 NTH Project No. 62-160047-04 NTH Consultants,
DRAINAGE SUBMITTAL CHECKLIST
 Project Name: Firm Name: Map ID: Engineer: Address: City: State: Zip: Phone Number: Fax Number: Property Owner: Address: City: State: Zip: Reviewed By: Date Received: Date Accepted for Review: The following
SAN GORGONIO PASS CAMPUS - PHASE I
 SAN GORGONIO PASS CAMPUS - PHASE I Banning, CA DRAINAGE STUDY June 16, 2010 Reference 106-195 PREPARED BY: Encompass Associates, Inc. 5699 Cousins Place Rancho Cucamonga, CA 91737 909-684-0093 Fax-909-586-6979
Stormwater Management Studies PDS Engineering Services Division ES Policy # 3-01
 Stormwater Management Studies PDS Engineering Services Division Revised Date: 2/28/08 INTRODUCTION The City of Overland Park requires submission of a stormwater management study as part of the development
INFLOW DESIGN FLOOD CONTROL SYSTEM PLAN 40 C.F.R. Part PLANT MCINTOSH ASH POND 1 GEORGIA POWER COMPANY
 INFLOW DESIGN FLOOD CONTROL SYSTEM PLAN 40 C.F.R. Part 257.82 PLANT MCINTOSH ASH POND 1 GEORGIA POWER COMPANY EPA s Disposal of Coal Combustion Residuals from Electric Utilities Final Rule (40 C.F.R. Part
SECTION IV WATERSHED TECHNICAL ANALYSIS
 A. Watershed Modeling SECTION IV WATERSHED TECHNICAL ANALYSIS An initial step in the preparation of this stormwater management plan was the selection of a stormwater simulation model to be utilized. It
Municipal Stormwater Ordinances Summary Table
 APPENDIX F Municipal Ordinances Summary Table Municipality Abington Bryn Athyn Borough Hatboro Borough Ordinance, SALDO Runoff equals pre post Erosion Sediment Control Water Quality Requirements Any which
A Stormwater Management Plan and Sediment Control Plan are required for all proposed developments within the City of Richmond.
 Engineering Page 3-1 3.0 STORM DRAINAGE 3.1 GENERAL Good drainage is vital to flat urban areas such as Lulu Island. It is essential that every storm sewer must be designed accurately minimizing conflicts
INFLOW DESIGN FLOOD CONTROL SYSTEM PLAN PLANT GASTON GYPSUM POND ALABAMA POWER COMPANY
 INFLOW DESIGN FLOOD CONTROL SYSTEM PLAN PLANT GASTON GYPSUM POND ALABAMA POWER COMPANY Section 257.82 of EPA s regulations requires the owner or operator of an existing or new CCR surface impoundment or
STORM DRAINS AND IRRIGATION
 TABLE OF CONTENTS PART III - MINIMUM DESIGN STANDARDS Section 105 STORM DRAINS AND IRRIGATION 105.1. STORM DRAINS... 105.1 105.2. METHODS OF ANALYSIS... 105.1 105.2.1. Rational Method... 105.1 105.2.2.
SAW MILL RIVER DAYLIGHTING ANALYSIS AT RIVER PARK CENTER
 SAW MILL RIVER DAYLIGHTING ANALYSIS AT RIVER PARK CENTER Prepared for: Struever Fidelco Cappelli LLC McLaren Project No. 6 August 28 TABLE OF CONTENTS. INTRODUCTION 2. SAW MILL RIVER: FEMA STUDY... 2..
4.2 Cherry Creek & Stillhouse Branch
 Section 4 Withlacoochee Basin 4.2 Cherry Creek & Stillhouse Branch 4.2.1 Introduction The information presented in this sub-basin plan for Cherry Creek and Stillhouse Branch is intended to provide the
Storm Sewers, Page 2
 Storm Sewers storm sewer systems are dendritic systems used to collect and direct stormwater runoff storm sewer systems are integral components of any urban infrastructure curbs, gutters and storm inlets
SUBDIVISION CHECKLIST. Subdivision Name. Prior To Review. Preliminary plan approved by Planning Commission / Council as required.
 SUBDIVISION CHECKLIST Subdivision Name Account Number Review Engineer Prior To Review Preliminary plan approved by Planning Commission / Council as required. Review fee paid. Statement of Responsibility
Module 3: Rainfall and Hydrology for Construction Site Erosion Control
 Module 3: Rainfall and Hydrology for Construction Site Erosion Control Robert Pitt Department of Civil, Construction, and Environmental Engineering University of Alabama Tuscaloosa, AL Rainfall and Hydrology
ENGN.4010 ENGINEERING CAPSTONE DESIGN Watershed Analysis. CiA
 RATIONAL METHOD Q CiA Where: Q = Maximum Rate of Runoff (cfs) C = Runoff Coefficient i = Average Rainfall Intensity (in/hr) A = Drainage Area (in acres) RATIONAL METHOD Assumptions and Limitations: Watershed
Learning objectives. Upon successful completion of this lecture, the participants will be able to describe:
 Solomon Seyoum Learning objectives Upon successful completion of this lecture, the participants will be able to describe: The different approaches for estimating peak runoff for urban drainage network
Report. Inflow Design Flood Control System Plan Belle River Power Plant East China, Michigan. DTE Energy Company One Energy Plaza, Detroit, MI
 Report Inflow Design Flood Control System Plan Belle River Power Plant East China, Michigan DTE Energy Company One Energy Plaza, Detroit, MI October 14, 2016 NTH Project No. 62-160047-04 NTH Consultants,
The site slopes generally from the southwest to northeast at approximately 3.7 percent.
 March 3, 2017 Nate Hatleback Project Manager, City of Thornton Development Engineering 9500 Civic Center Drive Thornton, CO 80229 (303) 538-7694 RE: Riverdale Five Retail Drainage Conformance Letter Dear
4.1 Browns Canal Introduction Sub-basin Information
 Section 4 Withlacoochee Basin 4.1 Browns Canal 4.1.1 Introduction The information presented in this sub-basin plan for Browns Canal is intended to provide the reader with information necessary to understand
Chapter H. Introduction to Surface Water Hydrology and Drainage for Engineering Purposes
 Chapter H. Introduction to Surface Water Hydrology and Drainage for Engineering Purposes As seen in Figure H.1, hydrology is a complex science that deals with the movement of water between various stages
a. Title of Report Example: Final Hydrologic and Hydraulic Drainage Report For Tract #### (or Planning and Zoning Permit ##-###-###)
") CITY OF OXNARD ENGINEERING DIVISION REQUIRED FORMAT AND CONTENTS HYDROLOGIC AND HYDRAULIC DRAINAGE REPORTS This report will provide a basis for design of the drainage system for the subject project. The
CITY OF OXNARD ENGINEERING DIVISION REQUIRED FORMAT AND CONTENTS HYDROLOGIC AND HYDRAULIC DRAINAGE REPORTS This report will provide a basis for design of the drainage system for the subject project. The
Stormwater Local Design Manual For Houston County, Georgia
 Stormwater Local Design Manual For Houston County, Georgia Adopted November 15, 2005 TABLE OF CONTENTS 1. FORWARD... 1 2. GENERAL LEVEL OF SERVICE STANDARDS... 2 2.1. DETENTION REQUIREMENTS... 2 2.1.1.
Stream Reaches and Hydrologic Units
 Chapter United States 6 Department of Agriculture Natural Resources Conservation Service Chapter 6 Stream Reaches and Hydrologic Units Rain clouds Cloud formation Precipitation Surface runoff Evaporation
Dawson County Public Works 25 Justice Way, Suite 2232, Dawsonville, GA (706) x 42228
 x 42228") Dawson County Public Works 25 Justice Way, Suite 2232, Dawsonville, GA 30534 (706) 344-3500 x 42228 DAWSON COUNTY STORM WATER REVIEW CHECKLIST Project Name: Property Address: Engineer: Fax #/Email: Date:
Dawson County Public Works 25 Justice Way, Suite 2232, Dawsonville, GA 30534 (706) 344-3500 x 42228 DAWSON COUNTY STORM WATER REVIEW CHECKLIST Project Name: Property Address: Engineer: Fax #/Email: Date:
TOWN OF MANCHESTER PLANNING AND ZONING COMMISSION Subdivision Application Minimum Submission Requirements
 TOWN OF MANCHESTER PLANNING AND ZONING COMMISSION Subdivision Application Minimum Submission Requirements This checklist is to be completed and submitted with all Subdivision Applications. The Town reserves
CHELTENHAM TOWNSHIP Chapter 290: WATERSHED STORMWATER MANAGEMENT Article IV: Stormwater Management
 CHELTENHAM TOWNSHIP Chapter 290: WATERSHED STORMWATER MANAGEMENT Article IV: Stormwater Management Online ECode Available on Cheltenham Township Website at: http://ecode360.com/14477578 For all regulated
INFLOW DESIGN FLOOD CONTROL SYSTEM PLAN PLANT BARRY ASH POND ALABAMA POWER COMPANY
 INFLOW DESIGN FLOOD CONTROL SYSTEM PLAN PLANT BARRY ASH POND ALABAMA POWER COMPANY Section 257.82 of EPA s regulations requires the owner or operator of an existing or new CCR surface impoundment or any
Storm Water System Improvements
 IV Storm Water System Improvements A. General The purpose of this Section is to establish standard principles and practices for the design and construction of storm drainage facilities within the City
PRIVATE STORM DRAINAGE FACILITIES REQUIREMENTS
 PRIVATE STORM DRAINAGE FACILITIES REQUIREMENTS 39 AUGUST 2005 TABLE OF CONTENTS PRIVATE STORM DRAINAGE FACILITIES REQUIREMENTS PAGE SECTION 1 DESIGN CRITERIA 41 SECTION 2 SUBMITTAL 44 SECTION 3 STRUCTURES
3.0 Planning and Submittal Requirements
 October 2003, Revised February 2005 Chapter 3.0, Planning and Submittal Requirements Page 1 3.0 Planning and Submittal Requirements 3.1 Drainage Studies and Drawings The City of Greenwood Village (Village)