For more details on Poverty Status in Afghanistan Disclaimer Acknowledgements:
|
|
|
- Nora Pierce
- 6 years ago
- Views:
Transcription

1
2
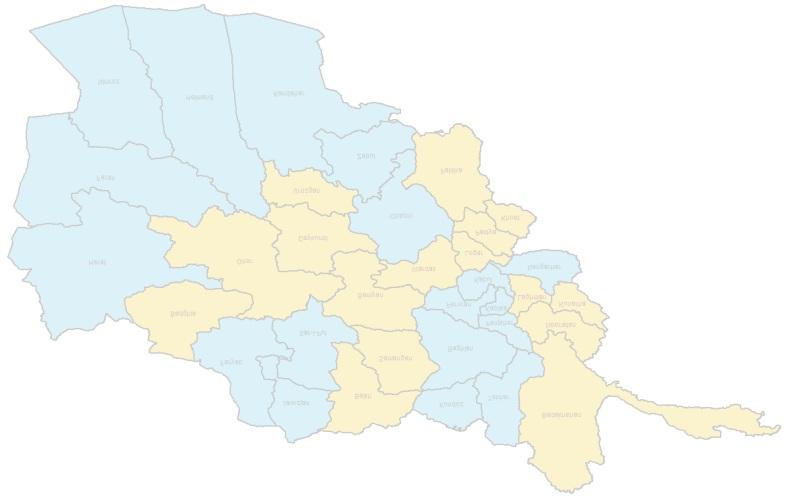
3 Introduction The availability of statistics on development indicators is key to monitoring the impact of development interventions and progress towards implementation of the Afghanistan National Development Strategy (ANDS). The following briefs provide a summary of selected social and economic measures of individual and household wellbeing for each province of Afghanistan, and are based on the latest nationally representative household data from the National Risk and Vulnerability Assessment (NRVA) 2007/08. These provincial briefs are a joint effort of the Ministry of Economy and the World Bank, and build on the earlier collaboration in producing the Poverty Status in Afghanistan: A Profile based on National Risk and Vulnerability Assessment (NRVA 2007/08). The selection of the indicators has been based on: the analytical work from the Poverty Status report, the monitoring needs of the Ministry of Economy, and on continuing analysis to better understand the sources of sub-national differences in wellbeing. These briefs provide statistics on 39 socio-economic indicators encompassing several dimensions of wellbeing, including poverty and inequality, food security, labor market outcomes, sectoral distribution of employment, gender, education, health, and access to services and infrastructure. This compendium of key indicators aims to serve three main purposes. First, it provides a snap-shot of the development performance of each province and benchmarks it to that of other provinces and of nation as whole. This comparative perspective is provided with a view to assist policy makers and other development actors in their efforts to improve development effectiveness, particularly by providing evidence to prioritize and better target interventions at the provincial level. Second, by unbundling variations in development outcomes at the sub-national level, these provincial briefs complement and enrich the aggregate description of well being presented in the Poverty Status report. Third, these indicators are expected to provide provincial baselines to be updated by future rounds of the NRVA, in addition to serving as a reference for measures obtained from other data sources. The statistics presented in the provincial briefs highlight that development outcomes in Afghanistan vary significantly from province to province. The prevalence of poverty, for example, varies from 9 percent in province to 76 percent in ; a considerably large spread around the national average of 36 percent. School enrollment rates among children aged 6-12 are the highest in with over two thirds of the children enrolled in schools, while has one of the lowest enrollment rates with an estimated 2 percent of its children enrolled in schools. Access to key services such as electricity and safe drinking water also shows a high degree of variation across provinces. For example, 85 percent of households in have access to electricity compared to less than 4 percent in and. Also, has relatively better access to safe drinking water (56 percent of households), while,, and lag behind other provinces with less than 10 percent of their households accessing some safe source of drinking water. Similarly large provincial disparities are found in other social and economic domains including health, gender, food security, and employment. Another key theme which emerges from the provincial statistics is that the performance on different indicators vary significantly within each province. Provinces that perform well on one dimension of development are not necessarily equally well off on other dimensions. For example, province which features favorably on the indicators of poverty and inequality is among the worse off provinces in terms of school enrollment, child immunization, and access to safe drinking water. Only 4 percent of children (age 6-12) in are enrolled in schools and i
4 less than 1 percent of its children aged months have had full immunization. On the contrary, which is the second poorest province in Afghanistan has one of the highest immunization rates in the country, with 82 percent of its children aged months fully immunized. Similarly, Badakhsan the second poorest province in terms of calorie deficiency rate stands among the top performing provinces in terms of girls to boys enrollment ratio, while on other measures of development such as child immunization, literacy rate and under-employment rates, its achievements are closer to the national average. A key implication of this variation of the indicators within provinces is that it is not sufficient to focus on poverty alone (or any single indicator) to understand the developmental needs of a particular province. It is important to recognize that performing well in one dimension does not necessarily mean good performance in other dimensions. An examination of these briefs also reveals that the co-variation of the indicators across the provinces provides potentially useful policy insights. Consider for example that Badakshan and are two of the bottom five provinces in terms of the prevalence of poverty ( has the worst poverty rate overall). Poverty is an aggregate measure of food and nonfood consumption, and so it is natural to assume that it is highly correlated with low levels of food consumption. In the case of Badakshan, this is certainly true Badakshan has the second highest rate of calorie deficiency (i.e. the proportion of people consuming less than 2100 calories per day). In the case of, this assumption is inaccurate despite being the poorest province, the proportion of its population consuming less than 2100 calories per day is exactly equal to the national average. One part of the explanation to this difference can be seen from the inequality indicator. Badakshan has both a high level of poverty and the highest level of inequality. This means that the poor in Badakshan are worse off on average than the poor in, and also means that calorie deprivation is much more severe in Badakshan. As another example, consider and again, Badakshan, both of which have some of the highest poverty rates in Afghanstan. The inequality indicator though, reveals that has the lowest level of inequality in the country, while Badakshan has the highest. When designing poverty-alleviation policies a standard concern is to make sure that the benefits reach the poor and do not leak off and benefit the relatively better off individuals in the province. Or, in other words, poverty programs aim to both maximize benefit coverage to the poor, and minimize leakage of the benefits to the non poor. Because of their high rates of poverty, both Badakshan and merit particular focus for poverty-alleviation programs. But, the design of these policies should be attentive to the differences in the level of inequality. For Badakshan, the combination of the high poverty rate and the highest inequality rate means that many people in the province are poor, but there are also many people with consumption levels significantly above the poverty line, and the program design needs to be attentive to the concern of benefit leakage. In contrast, the combination in of the high poverty rate and the lowest inequality rate means that most everyone is either poor or nearly poor, and it is reasonable to expect that leakage of program benefits will be of relatively less concern than in Badakshan. These few examples above are meant not as specific policy advice, but rather as illustrative descriptions of the sort of input we hope these briefs can provide to the policy dialogue. We certainly hope that in some instances, the indicators presented in these provincial briefs can also help inform the design of specific programs. The following parts of the document are organized into two main sections. The next section presents provincial briefs for all 34 provinces, arranged in alphabetical order by province name. Each brief has provincial and the corresponding national estimates for 39 indicators. Each brief also presents graphical comparison of provincial performance vis-à-vis other provinces (as well as nation) on eight indicators including poverty rate, calorie deficiency, inequality of consumption, girls to boys ratio, literacy rate, full immunization rate, and access to safe drinking water. In each ii
5 figure, the vertical line marks the national average for that indicator. Similarly, in each figure, good outcomes are on top and bad outcomes are on the bottom, allowing the reader to readily identify how well a particular province is performing (as marked in orange) by how far it is from the top of the figure. All estimates except those related to area and population are based on the survey data from NRVA The estimates for provincial population (overall and rural) are for the year and are based on the most recent statistics from the Central Statistics Organization, Government of Afghanistan. The second section presents a glossary of indicators which gives a short definition of each indicator. For more details on Poverty Status in Afghanistan, see: Islamic Republic of Afghanistan, Ministry of Economy, and the World Bank, Economic Policy and Poverty Sector. Poverty Status in Afghanistan: A Profile Based on the National Risk and Vulnerability Assessment (NRVA) 2007/08. : July / /AFPovertyReport.pdf (English) / / PovertyStatusAfghanistan_Dari.pdf (Dari) Acknowledgements: These provincial briefs are a joint effort of the Government of Afghanistan, Ministry of Economy and the World Bank. The briefs are a product of the World Bank s Economic Sector Work for Poverty Assessment which is led by Dean Jolliffe with a core team consisting of Abdul Malik, Silvia Redaelli and Andy Kotikula from the Economic Policy and Poverty Team of South Asia Region (SASEP), World Bank. Ismail Rahimi, Director General of Policy of ANDS M&E at Ministry of Economy, was a vital team member in preparing these briefs, and also organized and chaired the Poverty Analysis and Policy Committee (PAPC). The team gratefully acknowledges financial support from AusAID to produce these reports as an intermediate step towards understanding the determinants of sub-national variation in access to services. The team received input on the indicators used in these briefs from members of the PAPC, which includes GoA representatives from Central Statistics Organization (CSO), Ministry of Economy (MoEc), Ministry of Rural Rehabilitation and Development (MRRD), Ministry of Finance (MoF), Ministry of Labor, Social Affairs, Martyrs and Disabled (MOLSAMD), as well as representatives from the European Union (EU), UK Department for International Development (DfID), World Food Programme (WFP), Asian Development Bank (ADB), United Nations Assistance Mission in Afghanistan (UNAMA), and Japan International Cooperation Agency (JICA). The team thanks for their support and guidance His Excellency, Abdul Hadi Arghandiwal, Minister of Economy, Nicholas Krafft, World Bank Country Director for Afghanistan, and Josephine Bassinette, Lead Operations Officer. The team also thanks Mr. Nabi Sroosh, Mr. Fardeen Sediqi and all other members of the General Directorate of Policy and ANDS M&E for their support in the development of these briefs. We also note that without the dedication of staff from CSO and MRRD, and funding from EU, WFP, DfID, ADB, and WB to collect the NRVA 2007/08 data, this report would not have been possible. Disclaimer All rights reserved. The findings, interpretation, and conclusions expressed herein are those of the authors and do not necessarily reflect the views of the Board of Executive Directors of the World Bank or the governments they represent. Copying and / or formatting portions or all of this work without prior permission may be in violation of applicable law. The World Bank encourages dissemination of its work and will normally grant permission promptly. Any queries in this regard should be addressed to the Office of the Publisher, World Bank, 1818 H. Street NW, Washington, DC 20433, pubrights@worldbank.org. iii

6 Foreword On behalf of the Citizens of the Islamic Republic of Afghanistan, it is a pleasure to present these Provincial Briefs based on the National Risk and Vulnerability Assessment (NRVA) 2007/08. These briefs are a follow up to the Poverty Status report, released July 2010 as a joint effort of the Ministry of Economy and the World Bank. The monitoring of indicators, both at the national and provincial level, is a key input to assessing progress towards the goals described in the Afghanistan National Development Strategy (ANDS). Additionally, the indicators can also help guide the development of well-targeted policy by identifying specific areas of need for each province. In this way, these briefs enhance our ability to make evidence-based decisions enabling our line Ministries to improve the pro-poor focus of their programs. The Ministry of Economy of the Islamic Republic of Afghanistan and the World Bank wish to take this opportunity to express appreciation to the international community partners working towards the reconstruction and development of Afghanistan. In particular, we wish to thank the European Union (EU), UK Department for International Development (DfID), World Food Programme (WFP), United Nations Assistance Mission in Afghanistan (UNAMA) and others for their financial and technical support to the NRVA and in turn, the development of these briefs. We look forward to continuing our collaborative work with our distinguished partners in the future. Abdul Hadi Arghandiwal & Nicholas Krafft Minister of Economy World Bank Country Director for Afghanistan iv
7
8 at a Glance National Area and Population Area (sq km, '000) Population (millions) Rural population (%) Poverty and Inequality Poverty rate (%) Depth of poverty Average consumption of the poor as % of poverty line Per capita monthly total consumption (Afs) Inequality Gini coefficient of per capita total consumption Poverty Rate (%) Calorie Deficiency Rate (%) Food Security Calorie deficiency (% consuming less than 2100 calories per day) Depth of calorie deficiency Inadequate dietary diversity (% ) Protein deficiency (% consuming less than 50g of protein per day) Labor Market Age dependency ratio Participation rate (%) Employment population ratio (%) Unemployment rate (%) Underemployment rate (%) Literate labor force (%) Child labor (% of children age 6-15 engaged in work) Inequality: Gini of consumption Under employment Rate (%) Source: NRVA
9 at a Glance National Sectors of Employment Agriculture (%) Manufacturing, construction, mining and quarrying (%) Services (%) Public administration/government (%) Gender Female literacy rate age 16 and older (%) Female share in active population (%) Girls to boys enrollment ratio age Ratio of fully immunized girls to boys age months Education Literacy rate age16 and older (%) Girls to Boys Enrollment Ratio Age 6 12 years Literacy Rate (%) Age 16 years and Above Enrollment rate age 6-12 (%) Average years of schooling age18 and above Health Full immunization rate among children age months (%) Children age months with no vaccination (%) Access to skilled antenatal care during pregnancy (% ) Births attended by skilled attendants (% ) Percent of households having persons with mild disability Access to Services and Infrastructure Safe drinking water (% of households) Sanitary toilet (% of households) Electricity (% of households) Average distance to nearest drivable road (km) Full Immunization Rate (%) Age months Access to Safe Drinking Water (% of households) Source: NRVA
10 at a Glance National Area and Population Area (sq km, '000) Population (millions) Rural population (%) Poverty and Inequality Poverty rate (%) Depth of poverty Average consumption of the poor as % of poverty line Per capita monthly total consumption (Afs) Inequality Gini coefficient of per capita total consumption Poverty Rate (%) Calorie Deficiency Rate (%) Food Security Calorie deficiency (% consuming less than 2100 calories per day) Depth of calorie deficiency Inadequate dietary diversity (% ) Protein deficiency (% consuming less than 50g of protein per day) Labor Market Age dependency ratio Participation rate (%) Employment population ratio (%) Unemployment rate (%) Underemployment rate (%) Literate labor force (%) Child labor (% of children age 6-15 engaged in work) Inequality: Gini of consumption Under employment Rate (%) Source: NRVA
11 at a Glance National Sectors of Employment Agriculture (%) Manufacturing, construction, mining and quarrying (%) Services (%) Public administration/government (%) Gender Female literacy rate age 16 and older (%) Female share in active population (%) Girls to boys enrollment ratio age Ratio of fully immunized girls to boys age months 0.95 Education Literacy rate age16 and older (%) Girls to Boys Enrollment Ratio Age 6 12 years Literacy Rate (%) Age 16 years and Above Enrollment rate age 6-12 (%) Average years of schooling age18 and above Health Full immunization rate among children age months (%) Children age months with no vaccination (%) Access to skilled antenatal care during pregnancy (% ) Births attended by skilled attendants (% ) Percent of households having persons with mild disability Access to Services and Infrastructure Safe drinking water (% of households) Sanitary toilet (% of households) Electricity (% of households) Average distance to nearest drivable road (km) Full Immunization Rate (%) Age months Access to Safe Drinking Water (% of households) Source: NRVA
12 at a Glance National Area and Population Area (sq km, '000) Population (millions) Rural population (%) Poverty and Inequality Poverty rate (%) Depth of poverty Average consumption of the poor as % of poverty line Per capita monthly total consumption (Afs) Inequality Gini coefficient of per capita total consumption Poverty Rate (%) Calorie Deficiency Rate (%) Food Security Calorie deficiency (% consuming less than 2100 calories per day) Depth of calorie deficiency Inadequate dietary diversity (% ) Protein deficiency (% consuming less than 50g of protein per day) Labor Market Age dependency ratio Participation rate (%) Employment population ratio (%) Unemployment rate (%) Underemployment rate (%) Literate labor force (%) Child labor (% of children age 6-15 engaged in work) Inequality: Gini of consumption Under employment Rate (%) Source: NRVA
13 at a Glance National Sectors of Employment Agriculture (%) Manufacturing, construction, mining and quarrying (%) Services (%) Public administration/government (%) Gender Female literacy rate age 16 and older (%) Female share in active population (%) Girls to boys enrollment ratio age Ratio of fully immunized girls to boys age months Education Literacy rate age16 and older (%) Girls to Boys Enrollment Ratio Age 6 12 years Literacy Rate (%) Age 16 years and Above Enrollment rate age 6-12 (%) Average years of schooling age18 and above Health Full immunization rate among children age months (%) Children age months with no vaccination (%) Access to skilled antenatal care during pregnancy (% ) Births attended by skilled attendants (% ) Percent of households having persons with mild disability Access to Services and Infrastructure Safe drinking water (% of households) Sanitary toilet (% of households) Electricity (% of households) Average distance to nearest drivable road (km) Full Immunization Rate (%) Age months Access to Safe Drinking Water (% of households) Source: NRVA
14 at a Glance National Area and Population Area (sq km, '000) Population (millions) Rural population (%) Poverty and Inequality Poverty rate (%) Depth of poverty Average consumption of the poor as % of poverty line Per capita monthly total consumption (Afs) Inequality Gini coefficient of per capita total consumption Poverty Rate (%) Calorie Deficiency Rate (%) Food Security Calorie deficiency (% consuming less than 2100 calories per day) Depth of calorie deficiency Inadequate dietary diversity (% ) Protein deficiency (% consuming less than 50g of protein per day) Labor Market Age dependency ratio Participation rate (%) Employment population ratio (%) Unemployment rate (%) Underemployment rate (%) Literate labor force (%) Child labor (% of children age 6-15 engaged in work) Inequality: Gini of consumption Under employment Rate (%) Source: NRVA
15 at a Glance National Sectors of Employment Agriculture (%) Manufacturing, construction, mining and quarrying (%) Services (%) Public administration/government (%) Gender Female literacy rate age 16 and older (%) Female share in active population (%) Girls to boys enrollment ratio age Ratio of fully immunized girls to boys age months Education Literacy rate age16 and older (%) Girls to Boys Enrollment Ratio Age 6 12 years Literacy Rate (%) Age 16 years and Above Enrollment rate age 6-12 (%) Average years of schooling age18 and above Health Full immunization rate among children age months (%) Children age months with no vaccination (%) Access to skilled antenatal care during pregnancy (% ) Births attended by skilled attendants (% ) Percent of households having persons with mild disability Access to Services and Infrastructure Safe drinking water (% of households) Sanitary toilet (% of households) Electricity (% of households) Average distance to nearest drivable road (km) Full Immunization Rate (%) Age months Access to Safe Drinking Water (% of households) Source: NRVA
16 at a Glance National Area and Population Area (sq km, '000) Population (millions) Rural population (%) Poverty and Inequality Poverty rate (%) Depth of poverty Average consumption of the poor as % of poverty line Per capita monthly total consumption (Afs) Inequality Gini coefficient of per capita total consumption Poverty Rate (%) Calorie Deficiency Rate (%) Food Security Calorie deficiency (% consuming less than 2100 calories per day) Depth of calorie deficiency Inadequate dietary diversity (% ) Protein deficiency (% consuming less than 50g of protein per day) Labor Market Age dependency ratio Participation rate (%) Employment population ratio (%) Unemployment rate (%) Underemployment rate (%) Literate labor force (%) Child labor (% of children age 6-15 engaged in work) Inequality: Gini of consumption Under employment Rate (%) Source: NRVA
17 at a Glance National Sectors of Employment Agriculture (%) Manufacturing, construction, mining and quarrying (%) Services (%) Public administration/government (%) Gender Female literacy rate age 16 and older (%) Female share in active population (%) Girls to boys enrollment ratio age Ratio of fully immunized girls to boys age months Education Literacy rate age16 and older (%) Girls to Boys Enrollment Ratio Age 6 12 years Literacy Rate (%) Age 16 years and Above Enrollment rate age 6-12 (%) Average years of schooling age18 and above Health Full immunization rate among children age months (%) Children age months with no vaccination (%) Access to skilled antenatal care during pregnancy (% ) Births attended by skilled attendants (% ) Percent of households having persons with mild disability Access to Services and Infrastructure Safe drinking water (% of households) Sanitary toilet (% of households) Electricity (% of households) Average distance to nearest drivable road (km) Full Immunization Rate (%) Age months Access to Safe Drinking Water (% of households) Source: NRVA
18 at a Glance National Area and Population Area (sq km, '000) Population (millions) Rural population (%) Poverty and Inequality Poverty rate (%) Depth of poverty Average consumption of the poor as % of poverty line Per capita monthly total consumption (Afs) Inequality Gini coefficient of per capita total consumption Poverty Rate (%) Calorie Deficiency Rate (%) Food Security Calorie deficiency (% consuming less than 2100 calories per day) Depth of calorie deficiency Inadequate dietary diversity (% ) Protein deficiency (% consuming less than 50g of protein per day) Labor Market Age dependency ratio Participation rate (%) Employment population ratio (%) Unemployment rate (%) Underemployment rate (%) Literate labor force (%) Child labor (% of children age 6-15 engaged in work) Inequality: Gini of consumption Under employment Rate (%) Source: NRVA
19 at a Glance National Sectors of Employment Agriculture (%) Manufacturing, construction, mining and quarrying (%) Services (%) Public administration/government (%) Gender Female literacy rate age 16 and older (%) Female share in active population (%) Girls to boys enrollment ratio age Ratio of fully immunized girls to boys age months Education Literacy rate age16 and older (%) Girls to Boys Enrollment Ratio Age 6 12 years Literacy Rate (%) Age 16 years and Above Enrollment rate age 6-12 (%) Average years of schooling age18 and above Health Full immunization rate among children age months (%) Children age months with no vaccination (%) Access to skilled antenatal care during pregnancy (% ) Births attended by skilled attendants (% ) Percent of households having persons with mild disability Access to Services and Infrastructure Safe drinking water (% of households) Sanitary toilet (% of households) Electricity (% of households) Average distance to nearest drivable road (km) Full Immunization Rate (%) Age months Access to Safe Drinking Water (% of households) Source: NRVA
20 at a Glance National Area and Population Area (sq km, '000) Population (millions) Rural population (%) Poverty and Inequality Poverty rate (%) Depth of poverty Average consumption of the poor as % of poverty line Per capita monthly total consumption (Afs) Inequality Gini coefficient of per capita total consumption Poverty Rate (%) Calorie Deficiency Rate (%) Food Security Calorie deficiency (% consuming less than 2100 calories per day) Depth of calorie deficiency Inadequate dietary diversity (% ) Protein deficiency (% consuming less than 50g of protein per day) Labor Market Age dependency ratio Participation rate (%) Employment population ratio (%) Unemployment rate (%) Underemployment rate (%) Literate labor force (%) Child labor (% of children age 6-15 engaged in work) Inequality: Gini of consumption Under employment Rate (%) Source: NRVA
21 at a Glance National Sectors of Employment Agriculture (%) Manufacturing, construction, mining and quarrying (%) Services (%) Public administration/government (%) Gender Female literacy rate age 16 and older (%) Female share in active population (%) Girls to boys enrollment ratio age Ratio of fully immunized girls to boys age months Education Literacy rate age16 and older (%) Girls to Boys Enrollment Ratio Age 6 12 years Literacy Rate (%) Age 16 years and Above Enrollment rate age 6-12 (%) Average years of schooling age18 and above Health Full immunization rate among children age months (%) Children age months with no vaccination (%) Access to skilled antenatal care during pregnancy (% ) Births attended by skilled attendants (% ) Percent of households having persons with mild disability Access to Services and Infrastructure Safe drinking water (% of households) Sanitary toilet (% of households) Electricity (% of households) Average distance to nearest drivable road (km) Full Immunization Rate (%) Age months Access to Safe Drinking Water (% of households) Source: NRVA
22 at a Glance National Area and Population Area (sq km, '000) Population (millions) Rural population (%) Poverty and Inequality Poverty rate (%) Depth of poverty Average consumption of the poor as % of poverty line Per capita monthly total consumption (Afs) Inequality Gini coefficient of per capita total consumption Poverty Rate (%) Calorie Deficiency Rate (%) Food Security Calorie deficiency (% consuming less than 2100 calories per day) Depth of calorie deficiency Inadequate dietary diversity (% ) Protein deficiency (% consuming less than 50g of protein per day) Labor Market Age dependency ratio Participation rate (%) Employment population ratio (%) Unemployment rate (%) Underemployment rate (%) Literate labor force (%) Child labor (% of children age 6-15 engaged in work) Inequality: Gini of consumption Under employment Rate (%) Source: NRVA
23 at a Glance National Sectors of Employment Agriculture (%) Manufacturing, construction, mining and quarrying (%) Services (%) Public administration/government (%) Gender Female literacy rate age 16 and older (%) Female share in active population (%) Girls to boys enrollment ratio age Ratio of fully immunized girls to boys age months Education Literacy rate age16 and older (%) Girls to Boys Enrollment Ratio Age 6 12 years Literacy Rate (%) Age 16 years and Above Enrollment rate age 6-12 (%) Average years of schooling age18 and above Health Full immunization rate among children age months (%) Children age months with no vaccination (%) Access to skilled antenatal care during pregnancy (% ) Births attended by skilled attendants (% ) Percent of households having persons with mild disability Access to Services and Infrastructure Safe drinking water (% of households) Sanitary toilet (% of households) Electricity (% of households) Average distance to nearest drivable road (km) Full Immunization Rate (%) Age months Access to Safe Drinking Water (% of households) Source: NRVA
24 at a Glance National Area and Population Area (sq km, '000) Population (millions) Rural population (%) Poverty and Inequality Poverty rate (%) Depth of poverty Average consumption of the poor as % of poverty line Per capita monthly total consumption (Afs) Inequality Gini coefficient of per capita total consumption Poverty Rate (%) Calorie Deficiency Rate (%) Food Security Calorie deficiency (% consuming less than 2100 calories per day) Depth of calorie deficiency Inadequate dietary diversity (% ) Protein deficiency (% consuming less than 50g of protein per day) Labor Market Age dependency ratio Participation rate (%) Employment population ratio (%) Unemployment rate (%) Underemployment rate (%) Literate labor force (%) Child labor (% of children age 6-15 engaged in work) Inequality: Gini of consumption Under employment Rate (%) Source: NRVA
25 at a Glance National Sectors of Employment Agriculture (%) Manufacturing, construction, mining and quarrying (%) Services (%) Public administration/government (%) Gender Female literacy rate age 16 and older (%) Female share in active population (%) Girls to boys enrollment ratio age Ratio of fully immunized girls to boys age months Education Literacy rate age16 and older (%) Girls to Boys Enrollment Ratio Age 6 12 years Literacy Rate (%) Age 16 years and Above Enrollment rate age 6-12 (%) Average years of schooling age18 and above Health Full immunization rate among children age months (%) Children age months with no vaccination (%) Access to skilled antenatal care during pregnancy (% ) Births attended by skilled attendants (% ) Percent of households having persons with mild disability Access to Services and Infrastructure Safe drinking water (% of households) Sanitary toilet (% of households) Electricity (% of households) Average distance to nearest drivable road (km) Full Immunization Rate (%) Age months Access to Safe Drinking Water (% of households) Source: NRVA
26 at a Glance National Area and Population Area (sq km, '000) Population (millions) Rural population (%) Poverty and Inequality Poverty rate (%) Depth of poverty Average consumption of the poor as % of poverty line Per capita monthly total consumption (Afs) Inequality Gini coefficient of per capita total consumption Poverty Rate (%) Calorie Deficiency Rate (%) Food Security Calorie deficiency (% consuming less than 2100 calories per day) Depth of calorie deficiency Inadequate dietary diversity (% ) Protein deficiency (% consuming less than 50g of protein per day) Labor Market Age dependency ratio Participation rate (%) Employment population ratio (%) Unemployment rate (%) Underemployment rate (%) Literate labor force (%) Child labor (% of children age 6-15 engaged in work) Inequality: Gini of consumption Under employment Rate (%) Source: NRVA
27 at a Glance National Sectors of Employment Agriculture (%) Manufacturing, construction, mining and quarrying (%) Services (%) Public administration/government (%) Gender Female literacy rate age 16 and older (%) Female share in active population (%) Girls to boys enrollment ratio age Ratio of fully immunized girls to boys age months Education Literacy rate age16 and older (%) Girls to Boys Enrollment Ratio Age 6 12 years Literacy Rate (%) Age 16 years and Above Enrollment rate age 6-12 (%) Average years of schooling age18 and above Health Full immunization rate among children age months (%) Children age months with no vaccination (%) Access to skilled antenatal care during pregnancy (% ) Births attended by skilled attendants (% ) Percent of households having persons with mild disability Access to Services and Infrastructure Safe drinking water (% of households) Sanitary toilet (% of households) Electricity (% of households) Average distance to nearest drivable road (km) Full Immunization Rate (%) Age months Access to Safe Drinking Water (% of households) Source: NRVA
28 at a Glance National Area and Population Area (sq km, '000) Population (millions) Rural population (%) Poverty and Inequality Poverty rate (%) Depth of poverty Average consumption of the poor as % of poverty line Per capita monthly total consumption (Afs) Inequality Gini coefficient of per capita total consumption Poverty Rate (%) Calorie Deficiency Rate (%) Food Security Calorie deficiency (% consuming less than 2100 calories per day) Depth of calorie deficiency Inadequate dietary diversity (% ) Protein deficiency (% consuming less than 50g of protein per day) Labor Market Age dependency ratio Participation rate (%) Employment population ratio (%) Unemployment rate (%) Underemployment rate (%) Literate labor force (%) Child labor (% of children age 6-15 engaged in work) Inequality: Gini of consumption Under employment Rate (%) Source: NRVA
29 at a Glance National Sectors of Employment Agriculture (%) Manufacturing, construction, mining and quarrying (%) Services (%) Public administration/government (%) Gender Female literacy rate age 16 and older (%) Female share in active population (%) Girls to boys enrollment ratio age Ratio of fully immunized girls to boys age months 0.95 Education Literacy rate age16 and older (%) Girls to Boys Enrollment Ratio Age 6 12 years Literacy Rate (%) Age 16 years and Above Enrollment rate age 6-12 (%) Average years of schooling age18 and above Health Full immunization rate among children age months (%) Children age months with no vaccination (%) Access to skilled antenatal care during pregnancy (% ) Births attended by skilled attendants (% ) Percent of households having persons with mild disability Access to Services and Infrastructure Safe drinking water (% of households) Sanitary toilet (% of households) Electricity (% of households) Average distance to nearest drivable road (km) Full Immunization Rate (%) Age months Access to Safe Drinking Water (% of households) Source: NRVA
30 at a Glance National Area and Population Area (sq km, '000) Population (millions) Rural population (%) Poverty and Inequality Poverty rate (%) Depth of poverty Average consumption of the poor as % of poverty line Per capita monthly total consumption (Afs) Inequality Gini coefficient of per capita total consumption Poverty Rate (%) Calorie Deficiency Rate (%) Food Security Calorie deficiency (% consuming less than 2100 calories per day) Depth of calorie deficiency Inadequate dietary diversity (% ) Protein deficiency (% consuming less than 50g of protein per day) Labor Market Age dependency ratio Participation rate (%) Employment population ratio (%) Unemployment rate (%) Underemployment rate (%) Literate labor force (%) Child labor (% of children age 6-15 engaged in work) Inequality: Gini of consumption Under employment Rate (%) Source: NRVA
31 at a Glance National Sectors of Employment Agriculture (%) Manufacturing, construction, mining and quarrying (%) Services (%) Public administration/government (%) Gender Female literacy rate age 16 and older (%) Female share in active population (%) Girls to boys enrollment ratio age Ratio of fully immunized girls to boys age months Education Literacy rate age16 and older (%) Girls to Boys Enrollment Ratio Age 6 12 years Literacy Rate (%) Age 16 years and Above Enrollment rate age 6-12 (%) Average years of schooling age18 and above Health Full immunization rate among children age months (%) Children age months with no vaccination (%) Access to skilled antenatal care during pregnancy (% ) Births attended by skilled attendants (% ) Percent of households having persons with mild disability Access to Services and Infrastructure Safe drinking water (% of households) Sanitary toilet (% of households) Electricity (% of households) Average distance to nearest drivable road (km) Full Immunization Rate (%) Age months Access to Safe Drinking Water (% of households) Source: NRVA
32 at a Glance National Area and Population Area (sq km, '000) Population (millions) Rural population (%) Poverty and Inequality Poverty rate (%) Depth of poverty Average consumption of the poor as % of poverty line Per capita monthly total consumption (Afs) Inequality Gini coefficient of per capita total consumption Poverty Rate (%) Calorie Deficiency Rate (% ) Food Security Calorie deficiency (% consuming less than 2100 calories per day) Depth of calorie deficiency Inadequate dietary diversity (% ) Protein deficiency (% consuming less than 50g of protein per day) Labor Market Age dependency ratio Participation rate (%) Employment population ratio (%) Unemployment rate (%) Underemployment rate (%) Literate labor force (%) Child labor (% of children age 6-15 engaged in work) Inequality: Gini of consumption Under employment Rate (%) Source: NRVA
33 at a Glance National Sectors of Employment Agriculture (%) Manufacturing, construction, mining and quarrying (%) Services (%) Public administration/government (%) Gender Female literacy rate age 16 and older (%) Female share in active population (%) Girls to boys enrollment ratio age Ratio of fully immunized girls to boys age months Education Literacy rate age16 and older (%) Girls to Boys Enrollment Ratio Age 6 12 years Literacy Rate (%) Age 16 years and Above Enrollment rate age 6-12 (%) Average years of schooling age18 and above Health Full immunization rate among children age months (%) Children age months with no vaccination (%) Access to skilled antenatal care during pregnancy (% ) Births attended by skilled attendants (% ) Percent of households having persons with mild disability Access to Services and Infrastructure Safe drinking water (% of households) Sanitary toilet (% of households) Electricity (% of households) Average distance to nearest drivable road (km) Full Immunization Rate (%) Age months Access to Safe Drinking Water (% of households) Source: NRVA
34 at a Glance National Area and Population Area (sq km, '000) Population (millions) Rural population (%) Poverty and Inequality Poverty rate (%) Depth of poverty Average consumption of the poor as % of poverty line Per capita monthly total consumption (Afs) Inequality Gini coefficient of per capita total consumption Poverty Rate (%) Calorie Deficiency Rate (%) Food Security Calorie deficiency (% consuming less than 2100 calories per day) Depth of calorie deficiency Inadequate dietary diversity (% ) Protein deficiency (% consuming less than 50g of protein per day) Labor Market Age dependency ratio Participation rate (%) Employment population ratio (%) Unemployment rate (%) Underemployment rate (%) Literate labor force (%) Child labor (% of children age 6-15 engaged in work) Inequality: Gini of consumption Under employment Rate (%) Source: NRVA
35 at a Glance National Sectors of Employment Agriculture (%) Manufacturing, construction, mining and quarrying (%) Services (%) Public administration/government (%) Gender Female literacy rate age 16 and older (%) Female share in active population (%) Girls to boys enrollment ratio age Ratio of fully immunized girls to boys age months Education Literacy rate age16 and older (%) Girls to Boys Enrollment Ratio Age 6 12 years Literacy Rate (%) Age 16 years and Above Enrollment rate age 6-12 (%) Average years of schooling age18 and above Health Full immunization rate among children age months (%) Children age months with no vaccination (%) Access to skilled antenatal care during pregnancy (% ) Births attended by skilled attendants (% ) Percent of households having persons with mild disability Access to Services and Infrastructure Safe drinking water (% of households) Sanitary toilet (% of households) Electricity (% of households) Average distance to nearest drivable road (km) Full Immunization Rate (%) Age months Access to Safe Drinking Water (% of households) Source: NRVA
36 at a Glance National Area and Population Area (sq km, '000) Population (millions) Rural population (%) Poverty and Inequality Poverty rate (%) Depth of poverty Average consumption of the poor as % of poverty line Per capita monthly total consumption (Afs) Inequality Gini coefficient of per capita total consumption Poverty Rate (%) Calorie Deficiency Rate (%) Food Security Calorie deficiency (% consuming less than 2100 calories per day) Depth of calorie deficiency Inadequate dietary diversity (% ) Protein deficiency (% consuming less than 50g of protein per day) Labor Market Age dependency ratio Participation rate (%) Employment population ratio (%) Unemployment rate (%) Underemployment rate (%) Literate labor force (%) Child labor (% of children age 6-15 engaged in work) Inequality: Gini of consumption Under employment Rate (%) Source: NRVA
37 at a Glance National Sectors of Employment Agriculture (%) Manufacturing, construction, mining and quarrying (%) Services (%) Public administration/government (%) Gender Female literacy rate age 16 and older (%) Female share in active population (%) Girls to boys enrollment ratio age Ratio of fully immunized girls to boys age months Education Literacy rate age16 and older (%) Girls to Boys Enrollment Ratio Age 6 12 years Literacy Rate (%) Age 16 years and Above Enrollment rate age 6-12 (%) Average years of schooling age18 and above Health Full immunization rate among children age months (%) Children age months with no vaccination (%) Access to skilled antenatal care during pregnancy (% ) Births attended by skilled attendants (% ) Percent of households having persons with mild disability Access to Services and Infrastructure Safe drinking water (% of households) Sanitary toilet (% of households) Electricity (% of households) Average distance to nearest drivable road (km) Full Immunization Rate (%) Age months Access to Safe Drinking Water (% of households) Source: NRVA
38 at a Glance National Area and Population Area (sq km, '000) Population (millions) Rural population (%) Poverty and Inequality Poverty rate (%) Depth of poverty Average consumption of the poor as % of poverty line Per capita monthly total consumption (Afs) Inequality Gini coefficient of per capita total consumption Poverty Rate (%) Calorie Deficiency Rate (%) Food Security Calorie deficiency (% consuming less than 2100 calories per day) Depth of calorie deficiency Inadequate dietary diversity (% ) Protein deficiency (% consuming less than 50g of protein per day) Labor Market Age dependency ratio Participation rate (%) Employment population ratio (%) Unemployment rate (%) Underemployment rate (%) Literate labor force (%) Child labor (% of children age 6-15 engaged in work) Inequality: Gini of consumption Under employment Rate (%) Source: NRVA
39 at a Glance National Sectors of Employment Agriculture (%) Manufacturing, construction, mining and quarrying (%) Services (%) Public administration/government (%) Gender Female literacy rate age 16 and older (%) Female share in active population (%) Girls to boys enrollment ratio age Ratio of fully immunized girls to boys age months 0.95 Education Literacy rate age16 and older (%) Girls to Boys Enrollment Ratio Age 6 12 years Literacy Rate (%) Age 16 years and Above Enrollment rate age 6-12 (%) Average years of schooling age18 and above Health Full immunization rate among children age months (%) Children age months with no vaccination (%) Access to skilled antenatal care during pregnancy (% ) Births attended by skilled attendants (% ) Percent of households having persons with mild disability Access to Services and Infrastructure Safe drinking water (% of households) Sanitary toilet (% of households) Electricity (% of households) Average distance to nearest drivable road (km) Full Immunization Rate (%) Age months Access to Safe Drinking Water (% of households) Source: NRVA
40 at a Glance National Area and Population Area (sq km, '000) Population (millions) Rural population (%) Poverty and Inequality Poverty rate (%) Depth of poverty Average consumption of the poor as % of poverty line Per capita monthly total consumption (Afs) Inequality Gini coefficient of per capita total consumption Poverty Rate (%) Calorie Deficiency Rate (%) Food Security Calorie deficiency (% consuming less than 2100 calories per day) Depth of calorie deficiency Inadequate dietary diversity (% ) Protein deficiency (% consuming less than 50g of protein per day) Labor Market Age dependency ratio Participation rate (%) Employment population ratio (%) Unemployment rate (%) Underemployment rate (%) Literate labor force (%) Child labor (% of children age 6-15 engaged in work) Inequality: Gini of consumption Under employment Rate (%) Source: NRVA
41 at a Glance National Sectors of Employment Agriculture (%) Manufacturing, construction, mining and quarrying (%) Services (%) Public administration/government (%) Gender Female literacy rate age 16 and older (%) Female share in active population (%) Girls to boys enrollment ratio age Ratio of fully immunized girls to boys age months Education Literacy rate age16 and older (%) Girls to Boys Enrollment Ratio Age 6 12 years Literacy Rate (%) Age 16 years and Above Enrollment rate age 6-12 (%) Average years of schooling age18 and above Health Full immunization rate among children age months (%) Children age months with no vaccination (%) Access to skilled antenatal care during pregnancy (% ) Births attended by skilled attendants (% ) Percent of households having persons with mild disability Access to Services and Infrastructure Safe drinking water (% of households) Sanitary toilet (% of households) Electricity (% of households) Average distance to nearest drivable road (km) Full Immunization Rate (%) Age months Access to Safe Drinking Water (% of households) Source: NRVA
42 at a Glance National Area and Population Area (sq km, '000) Population (millions) Rural population (%) Poverty and Inequality Poverty rate (%) Depth of poverty Average consumption of the poor as % of poverty line Per capita monthly total consumption (Afs) Inequality Gini coefficient of per capita total consumption Poverty Rate (%) Calorie Deficiency Rate (%) Food Security Calorie deficiency (% consuming less than 2100 calories per day) Depth of calorie deficiency Inadequate dietary diversity (% ) Protein deficiency (% consuming less than 50g of protein per day) Labor Market Age dependency ratio Participation rate (%) Employment population ratio (%) Unemployment rate (%) Underemployment rate (%) Literate labor force (%) Child labor (% of children age 6-15 engaged in work) Inequality: Gini of consumption Under employment Rate (%) Source: NRVA
43 at a Glance National Sectors of Employment Agriculture (%) Manufacturing, construction, mining and quarrying (%) Services (%) Public administration/government (%) Gender Female literacy rate age 16 and older (%) Female share in active population (%) Girls to boys enrollment ratio age Ratio of fully immunized girls to boys age months Education Literacy rate age16 and older (%) Girls to Boys Enrollment Ratio Age 6 12 years Literacy Rate (%) Age 16 years and Above Enrollment rate age 6-12 (%) Average years of schooling age18 and above Health Full immunization rate among children age months (%) Children age months with no vaccination (%) Access to skilled antenatal care during pregnancy (% ) Births attended by skilled attendants (% ) Percent of households having persons with mild disability Access to Services and Infrastructure Safe drinking water (% of households) Sanitary toilet (% of households) Electricity (% of households) Average distance to nearest drivable road (km) Full Immunization Rate (%) Age months Access to Safe Drinking Water (% of households) Source: NRVA
44 at a Glance National Area and Population Area (sq km, '000) Population (millions) Rural population (%) Poverty and Inequality Poverty rate (%) Depth of poverty Average consumption of the poor as % of poverty line Per capita monthly total consumption (Afs) Inequality Gini coefficient of per capita total consumption Poverty Rate (%) Calorie Deficiency Rate (%) Food Security Calorie deficiency (% consuming less than 2100 calories per day) Depth of calorie deficiency Inadequate dietary diversity (% ) Protein deficiency (% consuming less than 50g of protein per day) Labor Market Age dependency ratio Participation rate (%) Employment population ratio (%) Unemployment rate (%) Underemployment rate (%) Literate labor force (%) Child labor (% of children age 6-15 engaged in work) Inequality: Gini of consumption Under employment Rate (%) Source: NRVA
45 at a Glance National Sectors of Employment Agriculture (%) Manufacturing, construction, mining and quarrying (%) Services (%) Public administration/government (%) Gender Female literacy rate age 16 and older (%) Female share in active population (%) Girls to boys enrollment ratio age Ratio of fully immunized girls to boys age months Education Literacy rate age16 and older (%) Girls to Boys Enrollment Ratio Age 6 12 years Literacy Rate (%) Age 16 years and Above Enrollment rate age 6-12 (%) Average years of schooling age18 and above Health Full immunization rate among children age months (%) Children age months with no vaccination (%) Access to skilled antenatal care during pregnancy (% ) Births attended by skilled attendants (% ) Percent of households having persons with mild disability Access to Services and Infrastructure Safe drinking water (% of households) Sanitary toilet (% of households) Electricity (% of households) Average distance to nearest drivable road (km) Full Immunization Rate (%) Age months Access to Safe Drinking Water (% of households) Source: NRVA
46 at a Glance National Area and Population Area (sq km, '000) Population (millions) Rural population (%) Poverty and Inequality Poverty rate (%) Depth of poverty Average consumption of the poor as % of poverty line Per capita monthly total consumption (Afs) Inequality Gini coefficient of per capita total consumption Poverty Rate (%) Calorie Deficiency Rate (%) Food Security Calorie deficiency (% consuming less than 2100 calories per day) Depth of calorie deficiency Inadequate dietary diversity (% ) Protein deficiency (% consuming less than 50g of protein per day) Labor Market Age dependency ratio Participation rate (%) Employment population ratio (%) Unemployment rate (%) Underemployment rate (%) Literate labor force (%) Child labor (% of children age 6-15 engaged in work) Inequality: Gini of consumption Under employment Rate (%) Source: NRVA
47 at a Glance National Sectors of Employment Agriculture (%) Manufacturing, construction, mining and quarrying (%) Services (%) Public administration/government (%) Gender Female literacy rate age 16 and older (%) Female share in active population (%) Girls to boys enrollment ratio age Ratio of fully immunized girls to boys age months Education Literacy rate age16 and older (%) Girls to Boys Enrollment Ratio Age 6 12 years Literacy Rate (%) Age 16 years and Above Enrollment rate age 6-12 (%) Average years of schooling age18 and above Health Full immunization rate among children age months (%) Children age months with no vaccination (%) Access to skilled antenatal care during pregnancy (% ) Births attended by skilled attendants (% ) Percent of households having persons with mild disability Access to Services and Infrastructure Safe drinking water (% of households) Sanitary toilet (% of households) Electricity (% of households) Average distance to nearest drivable road (km) Full Immunization Rate (%) Age months Access to Safe Drinking Water (% of households) Source: NRVA
48 at a Glance National Area and Population Area (sq km, '000) Population (millions) Rural population (%) Poverty and Inequality Poverty rate (%) Depth of poverty Average consumption of the poor as % of poverty line Per capita monthly total consumption (Afs) Inequality Gini coefficient of per capita total consumption Poverty Rate (%) Calorie Deficiency Rate (%) Food Security Calorie deficiency (% consuming less than 2100 calories per day) Depth of calorie deficiency Inadequate dietary diversity (% ) Protein deficiency (% consuming less than 50g of protein per day) Labor Market Age dependency ratio Participation rate (%) Employment population ratio (%) Unemployment rate (%) Underemployment rate (%) Literate labor force (%) Child labor (% of children age 6-15 engaged in work) Inequality: Gini of consumption Under employment Rate (%) Source: NRVA
49 at a Glance National Sectors of Employment Agriculture (%) Manufacturing, construction, mining and quarrying (%) Services (%) Public administration/government (%) Gender Female literacy rate age 16 and older (%) Female share in active population (%) Girls to boys enrollment ratio age Ratio of fully immunized girls to boys age months Education Literacy rate age16 and older (%) Girls to Boys Enrollment Ratio Age 6 12 years Literacy Rate (%) Age 16 years and Above Enrollment rate age 6-12 (%) Average years of schooling age18 and above Health Full immunization rate among children age months (%) Children age months with no vaccination (%) Access to skilled antenatal care during pregnancy (% ) Births attended by skilled attendants (% ) Percent of households having persons with mild disability Access to Services and Infrastructure Safe drinking water (% of households) Sanitary toilet (% of households) Electricity (% of households) Average distance to nearest drivable road (km) Full Immunization Rate (%) Age months Access to Safe Drinking Water (% of households) Source: NRVA
50 at a Glance National Area and Population Area (sq km, '000) Population (millions) Rural population (%) Poverty and Inequality Poverty rate (%) Depth of poverty Average consumption of the poor as % of poverty line Per capita monthly total consumption (Afs) Inequality Gini coefficient of per capita total consumption Poverty Rate (%) Calorie Deficiency Rate (%) Food Security Calorie deficiency (% consuming less than 2100 calories per day) Depth of calorie deficiency Inadequate dietary diversity (% ) Protein deficiency (% consuming less than 50g of protein per day) Labor Market Age dependency ratio Participation rate (%) Employment population ratio (%) Unemployment rate (%) Underemployment rate (%) Literate labor force (%) Child labor (% of children age 6-15 engaged in work) Inequality: Gini of consumption Under employment Rate (%) Source: NRVA
51 at a Glance National Sectors of Employment Agriculture (%) Manufacturing, construction, mining and quarrying (%) Services (%) Public administration/government (%) Gender Female literacy rate age 16 and older (%) Female share in active population (%) Girls to boys enrollment ratio age Ratio of fully immunized girls to boys age months Education Literacy rate age16 and older (%) Girls to Boys Enrollment Ratio Age 6 12 years Literacy Rate (%) Age 16 years and Above Enrollment rate age 6-12 (%) Average years of schooling age18 and above Health Full immunization rate among children age months (%) Children age months with no vaccination (%) Access to skilled antenatal care during pregnancy (% ) Births attended by skilled attendants (% ) Percent of households having persons with mild disability Access to Services and Infrastructure Safe drinking water (% of households) Sanitary toilet (% of households) Electricity (% of households) Average distance to nearest drivable road (km) Full Immunization Rate (%) Age months Access to Safe Drinking Water (% of households) Source: NRVA
52 at a Glance National Area and Population Area (sq km, '000) Population (millions) Rural population (%) Poverty and Inequality Poverty rate (%) Depth of poverty Average consumption of the poor as % of poverty line Per capita monthly total consumption (Afs) Inequality Gini coefficient of per capita total consumption Poverty Rate (%) Calorie Deficiency Rate (%) Food Security Calorie deficiency (% consuming less than 2100 calories per day) Depth of calorie deficiency Inadequate dietary diversity (% ) Protein deficiency (% consuming less than 50g of protein per day) Labor Market Age dependency ratio Participation rate (%) Employment population ratio (%) Unemployment rate (%) Underemployment rate (%) Literate labor force (%) Child labor (% of children age 6-15 engaged in work) Inequality: Gini of consumption Under employment Rate (%) Source: NRVA
53 at a Glance National Sectors of Employment Agriculture (%) Manufacturing, construction, mining and quarrying (%) Services (%) Public administration/government (%) Gender Female literacy rate age 16 and older (%) Female share in active population (%) Girls to boys enrollment ratio age Ratio of fully immunized girls to boys age months Education Literacy rate age16 and older (%) Girls to Boys Enrollment Ratio Age 6 12 years Literacy Rate (%) Age 16 years and Above Enrollment rate age 6-12 (%) Average years of schooling age18 and above Health Full immunization rate among children age months (%) Children age months with no vaccination (%) Access to skilled antenatal care during pregnancy (% ) Births attended by skilled attendants (% ) Percent of households having persons with mild disability Access to Services and Infrastructure Safe drinking water (% of households) Sanitary toilet (% of households) Electricity (% of households) Average distance to nearest drivable road (km) Full Immunization Rate (%) Age months Access to Safe Drinking Water (% of households) Source: NRVA
54 at a Glance National Area and Population Area (sq km, '000) Population (millions) Rural population (%) Poverty and Inequality Poverty rate (%) Depth of poverty Average consumption of the poor as % of poverty line Per capita monthly total consumption (Afs) Inequality Gini coefficient of per capita total consumption Poverty Rate (%) Calorie Deficiency Rate (%) Food Security Calorie deficiency (% consuming less than 2100 calories per day) Depth of calorie deficiency Inadequate dietary diversity (% ) Protein deficiency (% consuming less than 50g of protein per day) Labor Market Age dependency ratio Participation rate (%) Employment population ratio (%) Unemployment rate (%) Underemployment rate (%) Literate labor force (%) Child labor (% of children age 6-15 engaged in work) Inequality: Gini of consumption Under employment Rate (%) Source: NRVA
55 at a Glance National Sectors of Employment Agriculture (%) Manufacturing, construction, mining and quarrying (%) Services (%) Public administration/government (%) Gender Female literacy rate age 16 and older (%) Female share in active population (%) Girls to boys enrollment ratio age Ratio of fully immunized girls to boys age months 0.95 Education Literacy rate age16 and older (%) Girls to Boys Enrollment Ratio Age 6 12 years Literacy Rate (%) Age 16 years and Above Enrollment rate age 6-12 (%) Average years of schooling age18 and above Health Full immunization rate among children age months (%) Children age months with no vaccination (%) Access to skilled antenatal care during pregnancy (% ) Births attended by skilled attendants (% ) Percent of households having persons with mild disability Access to Services and Infrastructure Safe drinking water (% of households) Sanitary toilet (% of households) Electricity (% of households) Average distance to nearest drivable road (km) Full Immunization Rate (%) Age months Access to Safe Drinking Water (% of households) Source: NRVA
56 at a Glance National Area and Population Area (sq km, '000) Population (millions) Rural population (%) Poverty and Inequality Poverty rate (%) Depth of poverty Average consumption of the poor as % of poverty line Per capita monthly total consumption (Afs) Inequality Gini coefficient of per capita total consumption Poverty Rate (%) Calorie Deficiency Rate (%) Food Security Calorie deficiency (% consuming less than 2100 calories per day) Depth of calorie deficiency Inadequate dietary diversity (% ) Protein deficiency (% consuming less than 50g of protein per day) Labor Market Age dependency ratio Participation rate (%) Employment population ratio (%) Unemployment rate (%) Underemployment rate (%) Literate labor force (%) Child labor (% of children age 6-15 engaged in work) Inequality: Gini of consumption Under employment Rate (%) Source: NRVA
57 at a Glance National Sectors of Employment Agriculture (%) Manufacturing, construction, mining and quarrying (%) Services (%) Public administration/government (%) Gender Female literacy rate age 16 and older (%) Female share in active population (%) Girls to boys enrollment ratio age Ratio of fully immunized girls to boys age months Education Literacy rate age16 and older (%) Girls to Boys Enrollment Ratio Age 6 12 years Literacy Rate (%) Age 16 years and Above Enrollment rate age 6-12 (%) Average years of schooling age18 and above Health Full immunization rate among children age months (%) Children age months with no vaccination (%) Access to skilled antenatal care during pregnancy (% ) Births attended by skilled attendants (% ) Percent of households having persons with mild disability Access to Services and Infrastructure Safe drinking water (% of households) Sanitary toilet (% of households) Electricity (% of households) Average distance to nearest drivable road (km) Full Immunization Rate (%) Age months Access to Safe Drinking Water (% of households) Source: NRVA
58 at a Glance National Area and Population Area (sq km, '000) Population (millions) Rural population (%) Poverty and Inequality Poverty rate (%) Depth of poverty Average consumption of the poor as % of poverty line Per capita monthly total consumption (Afs) Inequality Gini coefficient of per capita total consumption Poverty Rate (%) Calorie Deficiency Rate (%) Food Security Calorie deficiency (% consuming less than 2100 calories per day) Depth of calorie deficiency Inadequate dietary diversity (% ) Protein deficiency (% consuming less than 50g of protein per day) Labor Market Age dependency ratio Participation rate (%) Employment population ratio (%) Unemployment rate (%) Underemployment rate (%) Literate labor force (%) Child labor (% of children age 6-15 engaged in work) Inequality: Gini of consumption Under employment Rate (%) Source: NRVA
59 at a Glance National Sectors of Employment Agriculture (%) Manufacturing, construction, mining and quarrying (%) Services (%) Public administration/government (%) Gender Female literacy rate age 16 and older (%) Female share in active population (%) Girls to boys enrollment ratio age Ratio of fully immunized girls to boys age months Education Literacy rate age16 and older (%) Girls to Boys Enrollment Ratio Age 6 12 years Literacy Rate (%) Age 16 years and Above Enrollment rate age 6-12 (%) Average years of schooling age18 and above Health Full immunization rate among children age months (%) Children age months with no vaccination (%) Access to skilled antenatal care during pregnancy (% ) Births attended by skilled attendants (% ) Percent of households having persons with mild disability Access to Services and Infrastructure Safe drinking water (% of households) Sanitary toilet (% of households) Electricity (% of households) Average distance to nearest drivable road (km) Full Immunization Rate (%) Age months Access to Safe Drinking Water (% of households) Source: NRVA
60 at a Glance National Area and Population Area (sq km, '000) Population (millions) Rural population (%) Poverty and Inequality Poverty rate (%) Depth of poverty Average consumption of the poor as % of poverty line Per capita monthly total consumption (Afs) Inequality Gini coefficient of per capita total consumption Poverty Rate (%) Calorie Deficiency Rate (%) Food Security Calorie deficiency (% consuming less than 2100 calories per day) Depth of calorie deficiency Inadequate dietary diversity (% ) Protein deficiency (% consuming less than 50g of protein per day) Labor Market Age dependency ratio Participation rate (%) Employment population ratio (%) Unemployment rate (%) Underemployment rate (%) Literate labor force (%) Child labor (% of children age 6-15 engaged in work) Inequality: Gini of consumption Under employment Rate (%) Source: NRVA
61 at a Glance National Sectors of Employment Agriculture (%) Manufacturing, construction, mining and quarrying (%) Services (%) Public administration/government (%) Gender Female literacy rate age 16 and older (%) Female share in active population (%) Girls to boys enrollment ratio age Ratio of fully immunized girls to boys age months 0.95 Education Literacy rate age16 and older (%) Girls to Boys Enrollment Ratio Age 6 12 years Literacy Rate (%) Age 16 years and Above Enrollment rate age 6-12 (%) Average years of schooling age18 and above Health Full immunization rate among children age months (%) Children age months with no vaccination (%) Access to skilled antenatal care during pregnancy (% ) Births attended by skilled attendants (% ) Percent of households having persons with mild disability Access to Services and Infrastructure Safe drinking water (% of households) Sanitary toilet (% of households) Electricity (% of households) Average distance to nearest drivable road (km) Full Immunization Rate (%) Age months Access to Safe Drinking Water (% of households) Source: NRVA
62 at a Glance National Area and Population Area (sq km, '000) Population (millions) Rural population (%) Poverty and Inequality Poverty rate (%) Depth of poverty Average consumption of the poor as % of poverty line Per capita monthly total consumption (Afs) Inequality Gini coefficient of per capita total consumption Poverty Rate (%) Calorie Deficiency Rate (%) Food Security Calorie deficiency (% consuming less than 2100 calories per day) Depth of calorie deficiency Inadequate dietary diversity (% ) Protein deficiency (% consuming less than 50g of protein per day) Labor Market Age dependency ratio Participation rate (%) Employment population ratio (%) Unemployment rate (%) Underemployment rate (%) Literate labor force (%) Child labor (% of children age 6-15 engaged in work) Inequality: Gini of consumption Under employment Rate (%) Source: NRVA
63 at a Glance National Sectors of Employment Agriculture (%) Manufacturing, construction, mining and quarrying (%) Services (%) Public administration/government (%) Gender Female literacy rate age 16 and older (%) Female share in active population (%) Girls to boys enrollment ratio age Ratio of fully immunized girls to boys age months Education Literacy rate age16 and older (%) Girls to Boys Enrollment Ratio Age 6 12 years Literacy Rate (%) Age 16 years and Above Enrollment rate age 6-12 (%) Average years of schooling age18 and above Health Full immunization rate among children age months (%) Children age months with no vaccination (%) Access to skilled antenatal care during pregnancy (% ) Births attended by skilled attendants (% ) Percent of households having persons with mild disability Access to Services and Infrastructure Safe drinking water (% of households) Sanitary toilet (% of households) Electricity (% of households) Average distance to nearest drivable road (km) Full Immunization Rate (%) Age months Access to Safe Drinking Water (% of households) Source: NRVA
64 at a Glance National Area and Population Area (sq km, '000) Population (millions) Rural population (%) Poverty and Inequality Poverty rate (%) Depth of poverty Average consumption of the poor as % of poverty line Per capita monthly total consumption (Afs) Inequality Gini coefficient of per capita total consumption Poverty Rate (%) Calorie Deficiency Rate (%) Food Security Calorie deficiency (% consuming less than 2100 calories per day) Depth of calorie deficiency Inadequate dietary diversity (% ) Protein deficiency (% consuming less than 50g of protein per day) Labor Market Age dependency ratio Participation rate (%) Employment population ratio (%) Unemployment rate (%) Underemployment rate (%) Literate labor force (%) Child labor (% of children age 6-15 engaged in work) Inequality: Gini of consumption Under employment Rate (%) Source: NRVA
65 at a Glance National Sectors of Employment Agriculture (%) Manufacturing, construction, mining and quarrying (%) Services (%) Public administration/government (%) Gender Female literacy rate age 16 and older (%) Female share in active population (%) Girls to boys enrollment ratio age Ratio of fully immunized girls to boys age months Education Literacy rate age16 and older (%) Girls to Boys Enrollment Ratio Age 6 12 years Literacy Rate (%) Age 16 years and Above Enrollment rate age 6-12 (%) Average years of schooling age18 and above Health Full immunization rate among children age months (%) Children age months with no vaccination (%) Access to skilled antenatal care during pregnancy (% ) Births attended by skilled attendants (% ) Percent of households having persons with mild disability Access to Services and Infrastructure Safe drinking water (% of households) Sanitary toilet (% of households) Electricity (% of households) Average distance to nearest drivable road (km) Full Immunization Rate (%) Age months Access to Safe Drinking Water (% of households) Source: NRVA
66 Sar-I-Pul at a Glance Sar-I-Pul National Area and Population Area (sq km, '000) Population (millions) Rural population (%) Poverty and Inequality Poverty rate (%) Depth of poverty Average consumption of the poor as % of poverty line Per capita monthly total consumption (Afs) Inequality Gini coefficient of per capita total consumption Poverty Rate (%) Calorie Deficiency Rate (%) Food Security Calorie deficiency (% consuming less than 2100 calories per day) Depth of calorie deficiency Inadequate dietary diversity (% ) Protein deficiency (% consuming less than 50g of protein per day) Labor Market Age dependency ratio Participation rate (%) Employment population ratio (%) Unemployment rate (%) Underemployment rate (%) Literate labor force (%) Child labor (% of children age 6-15 engaged in work) Inequality: Gini of consumption Under employment Rate (%) Source: NRVA
67 Sar-I-Pul at a Glance Sar-I-Pul National Sectors of Employment Agriculture (%) Manufacturing, construction, mining and quarrying (%) Services (%) Public administration/government (%) Gender Female literacy rate age 16 and older (%) Female share in active population (%) Girls to boys enrollment ratio age Ratio of fully immunized girls to boys age months Education Literacy rate age16 and older (%) Girls to Boys Enrollment Ratio Age 6 12 years Literacy Rate (%) Age 16 years and Above Enrollment rate age 6-12 (%) Average years of schooling age18 and above Health Full immunization rate among children age months (%) Children age months with no vaccination (%) Access to skilled antenatal care during pregnancy (% ) Births attended by skilled attendants (% ) Percent of households having persons with mild disability Access to Services and Infrastructure Safe drinking water (% of households) Sanitary toilet (% of households) Electricity (% of households) Average distance to nearest drivable road (km) Full Immunization Rate (%) Age months Access to Safe Drinking Water (% of households) Source: NRVA
68 at a Glance National Area and Population Area (sq km, '000) Population (millions) Rural population (%) Poverty and Inequality Poverty rate (%) Depth of poverty Average consumption of the poor as % of poverty line Per capita monthly total consumption (Afs) Inequality Gini coefficient of per capita total consumption Poverty Rate (%) Calorie Deficiency Rate (%) Food Security Calorie deficiency (% consuming less than 2100 calories per day) Depth of calorie deficiency Inadequate dietary diversity (% ) Protein deficiency (% consuming less than 50g of protein per day) Labor Market Age dependency ratio Participation rate (%) Employment population ratio (%) Unemployment rate (%) Underemployment rate (%) Literate labor force (%) Child labor (% of children age 6-15 engaged in work) Inequality: Gini of consumption Under employment Rate (%) Source: NRVA
69 at a Glance National Sectors of Employment Agriculture (%) Manufacturing, construction, mining and quarrying (%) Services (%) Public administration/government (%) Gender Female literacy rate age 16 and older (%) Female share in active population (%) Girls to boys enrollment ratio age Ratio of fully immunized girls to boys age months Education Literacy rate age16 and older (%) Girls to Boys Enrollment Ratio Age 6 12 years Literacy Rate (%) Age 16 years and Above Enrollment rate age 6-12 (%) Average years of schooling age18 and above Health Full immunization rate among children age months (%) Children age months with no vaccination (%) Access to skilled antenatal care during pregnancy (% ) Births attended by skilled attendants (% ) Percent of households having persons with mild disability Access to Services and Infrastructure Safe drinking water (% of households) Sanitary toilet (% of households) Electricity (% of households) Average distance to nearest drivable road (km) Full Immunization Rate (%) Age months Access to Safe Drinking Water (% of households) Source: NRVA
70 at a Glance National Area and Population Area (sq km, '000) Population (millions) Rural population (%) Poverty and Inequality Poverty rate (%) Depth of poverty Average consumption of the poor as % of poverty line Per capita monthly total consumption (Afs) Inequality Gini coefficient of per capita total consumption Poverty Rate (%) Calorie Deficiency Rate (%) Food Security Calorie deficiency (% consuming less than 2100 calories per day) Depth of calorie deficiency Inadequate dietary diversity (% ) Protein deficiency (% consuming less than 50g of protein per day) Labor Market Age dependency ratio Participation rate (%) Employment population ratio (%) Unemployment rate (%) Underemployment rate (%) Literate labor force (%) Child labor (% of children age 6-15 engaged in work) Inequality: Gini of consumption Under employment Rate (%) Source: NRVA
71 at a Glance National Sectors of Employment Agriculture (%) Manufacturing, construction, mining and quarrying (%) Services (%) Public administration/government (%) Gender Female literacy rate age 16 and older (%) Female share in active population (%) Girls to boys enrollment ratio age Ratio of fully immunized girls to boys age months 0.95 Education Literacy rate age16 and older (%) Girls to Boys Enrollment Ratio Age 6 12 years Literacy Rate (%) Age 16 years and Above Enrollment rate age 6-12 (%) Average years of schooling age18 and above Health Full immunization rate among children age months (%) Children age months with no vaccination (%) Access to skilled antenatal care during pregnancy (% ) Births attended by skilled attendants (% ) Percent of households having persons with mild disability Access to Services and Infrastructure Safe drinking water (% of households) Sanitary toilet (% of households) Electricity (% of households) Average distance to nearest drivable road (km) Full Immunization Rate (%) Age months Access to Safe Drinking Water (% of households) Source: NRVA
72 at a Glance National Area and Population Area (sq km, '000) Population (millions) Rural population (%) Poverty and Inequality Poverty rate (%) Depth of poverty Average consumption of the poor as % of poverty line Per capita monthly total consumption (Afs) Inequality Gini coefficient of per capita total consumption Poverty Rate (%) Calorie Deficiency Rate (%) Food Security Calorie deficiency (% consuming less than 2100 calories per day) Depth of calorie deficiency Inadequate dietary diversity (% ) Protein deficiency (% consuming less than 50g of protein per day) Labor Market Age dependency ratio Participation rate (%) Employment population ratio (%) Unemployment rate (%) Underemployment rate (%) Literate labor force (%) Child labor (% of children age 6-15 engaged in work) Inequality: Gini of consumption Under employment Rate (%) Source: NRVA
73 at a Glance National Sectors of Employment Agriculture (%) Manufacturing, construction, mining and quarrying (%) Services (%) Public administration/government (%) Gender Female literacy rate age 16 and older (%) Female share in active population (%) Girls to boys enrollment ratio age Ratio of fully immunized girls to boys age months Education Literacy rate age16 and older (%) Girls to Boys Enrollment Ratio Age 6 12 years Literacy Rate (%) Age 16 years and Above Enrollment rate age 6-12 (%) Average years of schooling age18 and above Health Full immunization rate among children age months (%) Children age months with no vaccination (%) Access to skilled antenatal care during pregnancy (% ) Births attended by skilled attendants (% ) Percent of households having persons with mild disability Access to Services and Infrastructure Safe drinking water (% of households) Sanitary toilet (% of households) Electricity (% of households) Average distance to nearest drivable road (km) Full Immunization Rate (%) Age months Access to Safe Drinking Water (% of households) Source: NRVA
74 at a Glance National Area and Population Area (sq km, '000) Population (millions) Rural population (%) Poverty and Inequality Poverty rate (%) Depth of poverty Average consumption of the poor as % of poverty line Per capita monthly total consumption (Afs) Inequality Gini coefficient of per capita total consumption Poverty Rate (%) Calorie Deficiency Rate (%) Food Security Calorie deficiency (% consuming less than 2100 calories per day) Depth of calorie deficiency Inadequate dietary diversity (% ) Protein deficiency (% consuming less than 50g of protein per day) Labor Market Age dependency ratio Participation rate (%) Employment population ratio (%) Unemployment rate (%) Underemployment rate (%) Literate labor force (%) Child labor (% of children age 6-15 engaged in work) Inequality: Gini of consumption Under employment Rate (%) Source: NRVA
75 at a Glance National Sectors of Employment Agriculture (%) Manufacturing, construction, mining and quarrying (%) Services (%) Public administration/government (%) Gender Female literacy rate age 16 and older (%) Female share in active population (%) Girls to boys enrollment ratio age Ratio of fully immunized girls to boys age months 0.95 Education Literacy rate age16 and older (%) Girls to Boys Enrollment Ratio Age 6 12 years Literacy Rate (%) Age 16 years and Above Enrollment rate age 6-12 (%) Average years of schooling age18 and above Health Full immunization rate among children age months (%) Children age months with no vaccination (%) Access to skilled antenatal care during pregnancy (% ) Births attended by skilled attendants (% ) Percent of households having persons with mild disability Access to Services and Infrastructure Safe drinking water (% of households) Sanitary toilet (% of households) Electricity (% of households) Average distance to nearest drivable road (km) Full Immunization Rate (%) Age months Access to Safe Drinking Water (% of households) Source: NRVA
76

77 Glossary of Indicators Poverty and Inequality Poverty rate (%) Poverty rate (or poverty head count rate) refers to the percentage of population living below the official poverty line. Depth of poverty Depth of poverty, also known as poverty gap, is the average shortfall of per capita consumption from the poverty line, shown as the percent of the poverty line. In calculating the depth of poverty, the shortfall of nonpoor is treated as zero. Average Consumption of the poor as percent of poverty line This self explanatory measure shows the average consumption of the poor as percentage of the poverty line. This measure is obtained by subtracting the ratio of poverty gap to poverty rate from 1. Per capita monthly total consumption Per capita monthly total consumption is the value of food and non-food items consumed by a household in a month (including the use value of durable goods and housing) divided by the household size. Inequality Gini Coefficient of per capita total consumption Gini coefficient measures the deviation of a given distribution of per capita consumption from a perfectly equal distribution. The value of Gini coefficient ranges from 0 to 1; 0 represents perfect equality while 1 implies complete inequality. Food Security Calorie deficiency (% consuming less than 2100 calories per day) Calorie deficiency rate refers to the percentage of population whose daily calorie intake is less than 2100 calories. Depth of calorie deficiency Depth of calorie deficiency is the mean shortfall of daily per capita calorie intake from the minimum threshold of 2100 calories. In calculating the measure, the shortfall of those whose daily calorie intake is equal to or above 2100 calories is treated as zero. Inadequate dietary diversity (%) Inadequate dietary diversity refers to the percentage of population whose food consumption scores are 42 and below. This measure aggregates the population that falls under the categories of borderline and poor food consumption. Protein Deficiency (% consuming less than 50g of protein per day) This measure refers to the percentage of population whose daily consumption of protein is less than 50 grams per day. Labor Market Age dependency ratio Age dependency ratio is the ratio of dependents (population younger than 15 and older than 64) to the population ages Participation rate Participation rate is the proportion of adult population (16 and older) that is economically active i.e. either employed or unemployed during the reference period (30 days prior to the survey date) Employment-population ratio Employment to population ratio is the proportion of working-age population (ages 16 and older) that is employed. 69
Launch Ceremony 2 nd Edition of the Provincial Briefs Report. Kabul, June 10 th Ministry of Economy Conference Hall
 Launch Ceremony 2 nd Edition of the Provincial Briefs Report Kabul, June 10 th Ministry of Economy Conference Hall 2 Motivation i. Availability of statistics is key to monitoring impact of development
IDA16 Results Measurement System
 IDA16 Results Measurement System A I IDA16 Results Measurement System International Development Association THE WORLD BANK S FUND FOR THE POOREST B I IDA16 Results Measurement System What is the Results
Excellencies, Ministers Distinguished Delegates and Representatives of International Organizations, Ladies and Gentlemen,
 2012 Sanitation and Water for All (SWA) High Level Meeting, 20 April 2012, Washington DC Lao PDR Statement of Commitment Mobilizing Political Prioritization for WASH: Excellency Prof. Dr. Eksavang Vongvichit,
TERMS OF REFERENCE - LRPS
 TERMS OF REFERENCE - LRPS-2017-9131824 UNICEF Mozambique Purpose of the Assignment: Institutional consultancy to develop and implement a Communication for Development Capacity Building Training package
Public Disclosure Authorized. Public Disclosure Authorized. Public Disclosure Authorized. Public Disclosure Authorized. Report No.
 Public Disclosure Authorized Public Disclosure Authorized Public Disclosure Authorized Public Disclosure Authorized Project Name Region Africa Sector Project ID Borrower(s) Implementing Agency Environment
AF Rural Enterprise Development Program Region
 PROJECT INFORMATION DOCUMENT (PID) CONCEPT STAGE Report No.: AB4057 Project Name AF Rural Enterprise Development Program Region South Asia Sector Crops (20%);Other social services (20%);Micro- and SME
Terms of Reference for a Gender Analysis
 Terms of Reference for a Gender Analysis 1. BACKGROUND The European Commission defines a gender analysis as the study of differences in the conditions, needs, participation rates, access to resources and
SAFANSI: The South Asia Food and Nutrition Security Initiative
 Public Disclosure Authorized Achieving Results through Partnerships SAFANSI: The South Asia Food and Nutrition Security Initiative Public Disclosure Authorized Public Disclosure Authorized highlights Public
Terms of Reference for the Outcome Evaluation of Achieving the MDGs and Reducing Human Poverty Programme
 Terms of Reference for the Outcome Evaluation of Achieving the MDGs and Reducing Human Poverty Programme Introduction The United Nations Development Programme (UNDP) will undertake outcome evaluation to
HUMAN DEVELOPMENT TOWARDS BRIDGING INEQUALITIES (HDBI) PROJECT
 PROJECT") HUMAN DEVELOPMENT TOWARDS BRIDGING INEQUALITIES (HDBI) PROJECT PROJECT PROPOSAL 1. Proposal submitted by: Government of NCT of Delhi 2. Title of the Proposal: Human Development in Delhi: Status, Analysis
HUMAN DEVELOPMENT TOWARDS BRIDGING INEQUALITIES (HDBI) PROJECT PROJECT PROPOSAL 1. Proposal submitted by: Government of NCT of Delhi 2. Title of the Proposal: Human Development in Delhi: Status, Analysis
The Laos COUNTRY BRIEF
 The Laos COUNTRY BRIEF The Country Briefs were prepared by governments ahead of the SWA 2019 Sector Ministers Meeting. They are a snap-shot of the country s current state in terms of water, sanitation
The Eswatini COUNTRY BRIEF
 The Eswatini COUNTRY BRIEF The Country Briefs were prepared by governments ahead of the SWA 2019 Sector Ministers Meeting. They are a snap-shot of the country s current state in terms of water, sanitation
(3 rd version to be launched in 2013)
") 2013 (3 rd version to be launched in 2013) Message of the President of the Republic Indonesia (extracted from the 2009 FSVA) Food is a basic human necessity, therefore the fulfillment is not only to satisfy
2013 (3 rd version to be launched in 2013) Message of the President of the Republic Indonesia (extracted from the 2009 FSVA) Food is a basic human necessity, therefore the fulfillment is not only to satisfy
UNFPA Asia and the Pacific Regional Office
 We are pleased to announce the following vacancy: JID 1606 Communications and Advocacy Consultant CLOSING DATE: DUTY STATION: DURATION: ORGANIZATION UNIT: Hiring Office: Purpose of consultancy: Sunday,
The office hopes that the data contained in this part of the Statistical Report will be utilized by all data users for various development planning.
 FOREWORD Statistical data that reflect the socio-economic and demographic conditions of the residents of a country are useful for designing and preparation of development plans as well as for monitoring
COUNTRY REPORT SRI LANKA
 SOUTH ASIA CONFERENCE ON SANITATION SACOSAN IV 2011 COUNTRY REPORT SRI LANKA Colombo, Sri Lanka April 2011 1 SOUTH ASIA CONFERENCE ON SANITATION SACOSAN IV COUNTRY REPORT SRI LANKA Abstract: This report
NATIONAL INDIVIDUAL CONSULTANCY
 1 NATIONAL INDIVIDUAL CONSULTANCY National Consultant to develop a Rwanda National Youth Report Job Title: Category: Duty Station: Type of contract: Expected starting date: Duration of assignment: National
The Liberia COUNTRY BRIEF
 The Liberia COUNTRY BRIEF The Country Briefs were prepared by governments ahead of the SWA 2019 Sector Ministers Meeting. They are a snap-shot of the country s current state in terms of water, sanitation
AFGHANISTAN PROGRAMME PLAN Concern s programme areas in Afghanistan are in Takhar and Badakshan provinces.
 AFGHANISTAN PROGRAMME PLAN 2012 1. Introduction Concern s programme areas in Afghanistan are in Takhar and Badakshan provinces. Overall the number of direct beneficiaries of the country programme will
ZAMBIA: POLICY DECISIONS RELATING TO GREEN GROWTH AND POVERTY. WAVES 2nd NCA Policy Forum The Hague, Netherlands
 ZAMBIA: POLICY DECISIONS RELATING TO GREEN GROWTH AND POVERTY WAVES 2nd NCA Policy Forum The Hague, Netherlands Ministry of National Development Planning November 2017 Presentation Outline Background Poverty
China s Poverty Reduction: Achivements, Explanation, Chanllenges and Strategies
 China s Poverty Reduction: Achivements, Explanation, Chanllenges and Strategies Xiaojun He Deputy Direcotor-General,IPRCC Hexiaojun@iprcc.org.cn 1 Outline Achievement on Rural Poverty Reduction Explanation
Ex post evaluation Zambia
 Ex post evaluation Zambia Sector: Drinking water, sanitation and waste water (CRS code 14030) Programme/Project: Rural water supply, North-Western province BMZ No. 2000 66 407* and 2002 70 256 (AM) Implementing
Education. Thailand: Challenges and Options for 2011 and Beyond. Towards a Growth-Sustaining Education Sector. Education and Growth in Thailand
 Thailand: Challenges and Options for 2011 and Beyond Education Towards a Growth-Sustaining Education Sector Continued economic growth in Thailand will be determined by increased productivity which in turn
Boosting Family Planning within the Sustainable Development Goals Framework: A Way Forward for Sindh, Pakistan
 Boosting Family Planning within the Sustainable Development Goals Framework: A Way Forward for Sindh, Pakistan POLICY Brief November 2016 Introduction Investing in family planning (FP) is critical, not
Results Framework. Quick Guide
 Results Framework 2013 2016 Quick Guide Background and Purpose The Asian Development Bank (ADB) corporate results framework is a management tool that helps ADB monitor and improve its performance to achieve
IPC Chronic Food Insecurity Situation in 10
 IPC Chronic Food Insecurity Situation in 10. districts of Bangladesh - December 2015-2018/20 IPC Government Partners of the Analysis: Other IPC National Partners of the Analysis: IPC Global Partners and
SECTOR ASSESSMENT: WATER SUPPLY AND OTHER MUNICIPAL INFRASTRUCTURE AND SERVICES. 1. Sector Performance, Problems, and Opportunities
 Dhaka Environmentally Sustainable Water Supply Project (RRP BAN 42173) SECTOR ASSESSMENT: WATER SUPPLY AND OTHER MUNICIPAL INFRASTRUCTURE AND SERVICES Sector Road Map 1. Sector Performance, Problems, and
TECHNICAL ASSISTANCE
 TECHNICAL ASSISTANCE Additional Financing of Food and Nutrition Social Welfare Project (RRP MON 42322) A. Introduction 1. Background. The Government of Mongolia requested the Asian Development Bank (ADB)
Partnerships for Development - Food Security
 Agenda and work programme 24. Given the national situation and priorities, the ACC Network thematic group in Vietnam focuses its activities on food security. These activities naturally have a strong relationship
FOOD SECURITY MONITORING, TAJIKISTAN
 Fighting Hunger Worldwide BULLETIN July 2017 ISSUE 19 Tajikistan Food Security Monitoring FOOD SECURITY MONITORING, TAJIKISTAN July 2017 - ISSUE 19 Fighting Hunger Worldwide BULLETIN July 2017 ISSUE 19
Chronic Hunger Falling, But One in Nine People Still Affected
 Chronic Hunger Falling, But One in Nine People Still Affected Gaelle Gourmelon December 1, 2014 A lthough the proportion of people experiencing chronic hunger is decreasing globally, one in nine individuals
CBMS Database. CBMS Network Coordinating Team June 2007
 CBMS Database CBMS Network Coordinating Team June 2007 1 Outline of Presentation CBMS Network: Background CBMS Databases Future Directions 2 CBMS Network The Network aims to: provide a good information
Food Security and Hunger in South Asia REPORT. Hughes Hall, Cambridge 27 th February seminar on
 seminar on Food Security and Hunger in South Asia Hughes Hall, Cambridge 27 th February 2010 REPORT Young boy harvesting wheat in Afghanistan Contents 1 Seminar objectives and participants... 2 2 Programme...
South Asian forum on the Sustainable Development Goals - New Delhi India Empowering people and ensuring inclusiveness and equality
 South Asian forum on the Sustainable Development Goals - New Delhi India Empowering people and ensuring inclusiveness and equality Thilini Mendis Department of National Planning Ministry of National Policies
The views of the European Anti Poverty Network EAPN
 Cohesion policy and cities: the urban contribution to growth and jobs in the regions Commission staff working paper The views of the European Anti Poverty Network EAPN 17 February 2006 The European Commission
Assessing Poverty in Kenya
 Findings reports on ongoing operational, economic and sector work carried out by the World Bank and its member governments in the Africa Region. It is published periodically by the Africa Technical Department
PROJECT INFORMATION DOCUMENT (PID) ADDITIONAL FINANCING Report No.: PIDA Project Name. Parent Project Name. Region Country Sector(s) Theme(s)
 ADDITIONAL FINANCING Report No.: PIDA Project Name. Parent Project Name. Region Country Sector(s) Theme(s)") Public Disclosure Authorized Public Disclosure Authorized Public Disclosure Authorized Public Disclosure Authorized Project Name Parent Project Name Region Country Sector(s) Theme(s) Lending Instrument
Public Disclosure Authorized Public Disclosure Authorized Public Disclosure Authorized Public Disclosure Authorized Project Name Parent Project Name Region Country Sector(s) Theme(s) Lending Instrument
The Afghanistan COUNTRY BRIEF
 The Afghanistan COUNTRY BRIEF The Country Briefs were prepared by governments ahead of the SWA 2019 Sector Ministers Meeting. They are a snap-shot of the country s current state in terms of water, sanitation
DIAKONIA TERMS OF REFERENCE FOR BASELINE SURVEY CONSULTANCY PROCUREMENT REFERENCE NUMBER: DK/CONS/09/001/2015
 1. Over View of Diakonia Work in Uganda Diakonia is a Christian development organization working together with local partners for sustainable change for the most vulnerable people of the world. Diakonia
LINKING NUTRITION TO AGRICULTURE AND SOCIAL PROTECTION TO IMPROVE FOOD AND NUTRITION SECURITY Evidence from IFPRI Research in Bangladesh
 LINKING NUTRITION TO AGRICULTURE AND SOCIAL PROTECTION TO IMPROVE FOOD AND NUTRITION SECURITY Evidence from IFPRI Research in Bangladesh Presented by: Akhter Ahmed Country Representative for Bangladesh
Project Name. PROJECT INFORMATION DOCUMENT (PID) APPRAISAL STAGE Report No.: AB6411 Additional Financing to the Poverty Alleviation Fund II
 APPRAISAL STAGE Report No.: AB6411 Additional Financing to the Poverty Alleviation Fund II") Project Name Region Sector PROJECT INFORMATION DOCUMENT (PID) APPRAISAL STAGE Report No.: AB6411 Additional Financing to the Poverty Alleviation Fund II Project ID Borrower(s) Implementing Agency Environment
Project Name Region Sector PROJECT INFORMATION DOCUMENT (PID) APPRAISAL STAGE Report No.: AB6411 Additional Financing to the Poverty Alleviation Fund II Project ID Borrower(s) Implementing Agency Environment
The Tanzania COUNTRY BRIEF
 The Tanzania COUNTRY BRIEF The Country Briefs were prepared by governments ahead of the SWA 2019 Sector Ministers Meeting. They are a snap-shot of the country s current state in terms of water, sanitation
REGIONAL TRAINING COURSE. Child Poverty and Disparity Measurement and Analysis March Cairo, Egypt
 REGIONAL TRAINING COURSE Child Poverty and Disparity Measurement and Analysis 9-14 March 2013 Cairo, Egypt Background The Middle East and North Africa (MENA) is a complex and diverse region that is experiencing
Aga Khan Foundation, Afghanistan Job Opportunities : Labour market assessment of vocational training and employment pathways for adolescent girls
 Aga Khan Foundation, Afghanistan Job Opportunities Position Title : Labour market assessment of vocational training and employment pathways for adolescent girls Duty Station : Kabul Announcing Date : March
People s Republic of China: Research on Innovative Mechanism for Open Agricultural Investment
 Technical Assistance Report Project Number: 50005-001 Policy and Advisory Technical Assistance (PATA) October 2016 People s Republic of China: Research on Innovative Mechanism for Open Agricultural Investment
Burundi ND-GAIN. Highlights
 1 Notre Dame Global Adaptation Index country study series Burundi ND-GAIN Notre Dame Global Adaptation Index Report Date: January, 2015 Highlights Burundi's low ND-GAIN score reflects the nation's standing
Lao People s Democratic Republic: Support for the Human Resource Development Strategy
 Technical Assistance Report Project Number: 46068 Policy and Advisory Technical Assistance (PATA) December 2012 Lao People s Democratic Republic: Support for the Human Resource Development Strategy The
Re advertised. Request for Proposal (RFP) No. UNFPA/KBL/15/03
 No. UNFPA/KBL/15/03") United Nations Population Fund (UNFPA) Address, Kabul, Jalal Abad Road, UNOCA Compound Tel: + Fax: +729261314 Website: http://afghanistan.unfpa.org Date: 23/07/2015 Re advertised Dear Sir/Madam, Request
United Nations Population Fund (UNFPA) Address, Kabul, Jalal Abad Road, UNOCA Compound Tel: + Fax: +729261314 Website: http://afghanistan.unfpa.org Date: 23/07/2015 Re advertised Dear Sir/Madam, Request
Small Businesses a Way Out of Poverty
 The advantage of economic growth is not that wealth increases happiness, but that it increases the range of human choice. These words were written in 1955 by Arthur Lewis, a Caribbean scholar and Nobel
Amman Declaration on the Opportunities and Challenges of Civic Engagement in Socio-Economic Policies in the Arab region
 Amman Declaration on the Opportunities and Challenges of Civic Engagement in Socio-Economic Policies in the Arab region I. Background 1. Many countries are increasingly seeking the participation of the
ADB / PARIS21 High Level Forum on Statistical Capacity Building for ASEAN Countries
 ADB / PARIS21 High Level Forum on Statistical Capacity Building for ASEAN Countries EDSA Shangri-la Hotel 7-9 November 2002 The views expressed in this paper are the views of the authors and do not necessarily
SELECTING GLOBALLY ACCEPTED BUT LOCALLY AVAILABLE SUSTAINABLE DEVELOPMENT INDICATORS PURSUANT TO PHILIPPINE NATIONAL DEVELOPMENT PRIORITIES
 International Journal of Science, Environment and Technology, Vol. 4, No 2, 2015, 452 458 ISSN 2278-3687 (O) 2277-663X (P) SELECTING GLOBALLY ACCEPTED BUT LOCALLY AVAILABLE SUSTAINABLE DEVELOPMENT INDICATORS
Current Status of Economic Statistics in Cambodia
 The 12 th East Asian Statistical Conference, 13-15 November 2008 Tokyo, Japan Topic 2: Economic Statistics including Economic Census and Business Registers I. Introduction Current Status of Economic Statistics
Technical Assistance Report. People s Republic of Bangladesh: Support to Primary Education Development
 Technical Assistance Report Project Number: 42122-015 Capacity Development Technical Assistance (CDTA) December 2016 People s Republic of Bangladesh: Support to Primary Education Development This The views
Enhancing decent employment opportunities for women and marginalised groups in growth sectors
 Enhancing decent employment opportunities for women and marginalised groups in growth sectors Expert Group Meeting on Strategies for Eradicating Poverty to Achieve Sustainable Development for All Hosted
Country statements. (1) Strategies for leaving no one behind in the implementation of the 2030 Agenda for Sustainable Development
 Strategies for leaving no one behind in the implementation of the 2030 Agenda for Sustainable Development") Country statements (1) Strategies for leaving no one behind in the implementation of the 2030 Agenda for Sustainable Development Sri Lanka is expected to prepare a holistic policy framework on the implementation
Country statements (1) Strategies for leaving no one behind in the implementation of the 2030 Agenda for Sustainable Development Sri Lanka is expected to prepare a holistic policy framework on the implementation
Concept Note Investment in skills and labour force for human development 2017 Round Table Implementation Meeting (RTIM) Pre-consultation
 Pre-consultation") Concept Note Investment in skills and labour force for human development 2017 Round Table Implementation Meeting (RTIM) Pre-consultation 1. Background 13 October 2017, Crowne Plaza Hotel Vientiane The
Concept Note Investment in skills and labour force for human development 2017 Round Table Implementation Meeting (RTIM) Pre-consultation 1. Background 13 October 2017, Crowne Plaza Hotel Vientiane The
SOCIAL STATISTICS OF MONGOLIA
 Working Meeting of the Technical Advisory Group on Social Statistics Bangkok, 29-30 September 2011 SOCIAL STATISTICS OF MONGOLIA D. Oyunchimeg, Director of PSSD of NSO CONTENTS National statistical system
High-level Meeting on. Sharing of Best Practices on Innovation in Public Administration in the Mediterranean Region
 FIFTH GLOBAL FORUM ON REINVENTING GOVERNMENT Quality and Innovation in the Government of the 21 Century High-level Meeting on Sharing of Best Practices on Innovation in Public Administration in the Mediterranean
Final Evaluation of the Programme for Improvement of Irrigation Systems in Kabul, Bamyan and Kapisa Provinces. Project evaluation series
 OFFICE OF EVALUATION Project evaluation series Final Evaluation of the Programme for Improvement of Irrigation Systems in Kabul, Bamyan and Kapisa Provinces ANNEXES April 2017 Annexes Annex 1. Terms of
UNDP Country Programme for Malaysia,
 UNDP Country Programme for Malaysia, 2013-2015 Contents Page I. Situation Analysis 2 II. Past cooperation and lessons learned 3 III. Proposed programme 4 IV. Programme management, monitoring and evaluation
Social Protection in Khyber Pakhtunkhwa
 Social Protection in Khyber Pakhtunkhwa Policy Brief by Sustainable Development Policy Institute 12 th November 2013 1 1. Background Khyber Pakhtunkhwa province represents some of Pakistan s hardest hit
CPD Summary Results Matrix Summary Results Matrix: Governments of Guyana/Suriname UNICEF Country Programme,
 CPD Summary Results Matrix Summary Results Matrix: Governments of / UNICEF Country Programme, 2012 2016 Millennium Declaration:Section III: Development and Poverty Eradication; Section V: Human rights,
Short-Term Gender and Social Inclusion Consultant, Myanmar
 Short-Term Gender and Social Inclusion Consultant, Myanmar TITLE REMUNERATION DURATION LOCATION REPORT TO Gender and Social Inclusion Consultant, Myanmar Daily Consultancy Rate 15 days Myanmar Program
Sustainable Water and Sanitation Services and Poverty Reduction. Sergio Feld, Ph.D. Policy Advisor - Environment UNDP Regional Centre in Bangkok
 Sustainable Water and Sanitation Services and Poverty Reduction Sergio Feld, Ph.D. Policy Advisor - Environment UNDP Regional Centre in Bangkok Capacity Building Workshop on Partnerships for Improving
UZBEKISTAN ETF COUNTRY PLAN Summary. 1. Socio-economic background
 UZBEKISTAN ETF COUNTRY PLAN 2009 Summary In the planning period 2009-2011, ETF activities will focus on supporting the government of Uzbekistan in the identification of priorities in the area of VET, capacity
PROJECT INFORMATION DOCUMENT (PID) CONCEPT STAGE
 CONCEPT STAGE") Public Disclosure Authorized Public Disclosure Authorized Public Disclosure Authorized Public Disclosure Authorized Project Name Region Country Sector(s) Theme(s) Lending Instrument Project ID Borrower(s)
Public Disclosure Authorized Public Disclosure Authorized Public Disclosure Authorized Public Disclosure Authorized Project Name Region Country Sector(s) Theme(s) Lending Instrument Project ID Borrower(s)
Food Security Information for Action. Food Security Concepts and Frameworks. Lesson 1. What is Food Security? Learner s Notes
 Food Security Information for Action Food Security Concepts and Frameworks Lesson 1 What is Food Security? Learner s Notes This course is funded by the European Union and developed by the Food and Agriculture
the implementation of thematic reviews for selected building blocks of the national education, training and employment strategies.
 KYRGYZSTAN ETF COUNTRY PLAN 2009 Summary The overall objective of ETF support to Kyrgyzstan for the period 2009 to 2011 is to (i) assist national stakeholders in their efforts to enhance human capital
Terminal Evaluation. 1. Outline of the Project Country: Islamic Republic of Afghanistan
 Terminal Evaluation 1. Outline of the Project Country: Islamic Republic of Afghanistan Project Name: The Improvement of Rice-Based Agriculture in Nangarhar Province Sector: Agriculture Development Cooperation
Ministerial Declaration
 Ministerial Declaration to Get every one in the picture in Asia and the Pacific * We, the ministers and representatives of members and associate members of the United Nations Economic and Social Commission
TIPS BASELINES AND TARGETS ABOUT TIPS
 NUMBER 8 2 ND EDITION, 2010 PERFORMANCE MONITORING & EVALUATION TIPS BASELINES AND TARGETS ABOUT TIPS These TIPS provide practical advice and suggestions to USAID managers on issues related to performance
Gender Equality and Energy M01: Overview of Gender Equality and Energy Issues
 Presentation Script Overview Welcome to the e-module on Gender and Energy. This is the Third Module of the e-course on Gender Equality and Development. We will begin our discussion with an overview of
Influencing Policy and Practice in Afghanistan
 Influencing Policy and Practice in Afghanistan Introduction The Leveraging Agriculture for Nutrition in South Asia (LANSA) research programme consortium aims to enhance the impact of agriculture on maternal
Integrated strategies that prioritize disadvantaged groups are essential to ensure that no one is left behind, accelerating progress towards UHC and
 42 Integrated strategies that prioritize disadvantaged groups are essential to ensure that no one is left behind, accelerating progress towards UHC and the SDGs. Health Systems Introduction 1. Partnering
Proposed Results-Based Loan Republic of Indonesia: Integrated Participatory Development and Management of Irrigation Program
 Initial Poverty and Social Analysis Project Number: 43220 May 2016 Proposed Results-Based Loan Republic of Indonesia: Integrated Participatory Development and Management of Irrigation Program The views
Maternal off-farm wage employment and primary school enrolment: Evidence from a natural quasi-experiment in Senegal.
 Maternal off-farm wage employment and primary school enrolment: Evidence from a natural quasi-experiment in Senegal. MIET MAERTENS & ELLEN VERHOFSTADT Division of Agricultural and Food Economics, Department
SECTOR ASSESSMENT (SUMMARY): SANITATION
: SANITATION") Metropolitan Sanitation Management Investment Project (RRP INO 43251-025) SECTOR ASSESSMENT (SUMMARY): SANITATION Sector Road Map 1. Sector Performance, Problems, and Opportunities 1. Improved access to
Metropolitan Sanitation Management Investment Project (RRP INO 43251-025) SECTOR ASSESSMENT (SUMMARY): SANITATION Sector Road Map 1. Sector Performance, Problems, and Opportunities 1. Improved access to
Indonesia-Lombok Poverty Alleviation and... Environmental Infrastructure Project
 Public Disclosure Authorized Public Disclosure Authorized Public Disclosure Authorized Public Disclosure Authorized Project Name Region Sector Project ID Borrower(s) Implementing Agency Regional Dev. &
Report and Recommendation of the President to the Board of Directors
 Report and Recommendation of the President to the Board of Directors Strengthening Water Management and Irrigation Systems Rehabilitation Project Project Number: 42080 Supplementary Appendix J Gender Action
Draft Wrap-Up Remarks, HLPF Week One. H.E. Ms. Marie Chatardová, President of ECOSOC. Conference room 4 Friday 13 July :30 pm
 1 Draft Wrap-Up Remarks, HLPF Week One H.E. Ms. Marie Chatardová, President of ECOSOC Conference room 4 Friday 13 July 2018 6:30 pm Under-Secretary-General for Economic and Social Affairs, Excellencies,
Islamic Republic of Afghanistan
 Islamic Republic of Afghanistan Afghanistan National Disaster Management Authority (ANDMA) Director General Dr. Mohammad Daim Kakar Expert Group Meeting, India, New Delhi Date:16-April-2014, 1 Background
Development plans of Viet Nam: Achievements, challenges and orientation to successful SDGs
 Development plans of Viet Nam: Achievements, challenges and orientation to successful SDGs Prof. Dr. Nguyen The Chinh General Director of ISPONRE-Vietnam Contents Sustainable Development Framework Achieving
IFRC nutrition-sensitive interventions in the Asia-Pacific region
 IFRC nutrition-sensitive interventions in the Asia-Pacific region Henrique G. Hedler, Intern at the IFRC Asia Pacific, KL MSc student in Food Security at the University of Edinburgh Introduction PART 1:
FATA Development Network Profile
 Profile FDN Coordination office; Aiming change for tomorrow (ACT) House no 310, street 16, G-10/2, Islamabad Phone: 051-2152206-8 Email: info@act-international.org Website: www.act-international.org FDN
Tajikistan experience in mainstreaming climate resilience into development planning PPCR programmatic approach
 Tajikistan experience in mainstreaming climate resilience into development planning PPCR programmatic approach Adaptation Futures 2016 Rotterdam, the Netherlands, May 10-13, 2016 Jamshed Hasanov PPCR Secretariat
IND: Energy Efficiency Enhancement Project in Assam
 Initial Poverty and Social Assessment Project Number: 41614 July 2008 IND: Energy Efficiency Enhancement Project in Assam An initial poverty and social assessment (IPSA) is prepared in the early stage
Improved Sanitation in South Asia
 Improved Sanitation in South Asia Accelerating Achievement of the Millennium Development Goals Atsushi Kaneko Asian Development Bank 17 February 2012 Outline 1. Assessment of Status: Access to Improved
MINIMIZING DISPARITIES BY CHANGING PUBLIC ATTITUDES AND PERCEPTIONS, AND BY IMPROVING EDUCATION AND PUBLIC AWARENESS
 MINIMIZING DISPARITIES BY CHANGING PUBLIC ATTITUDES AND PERCEPTIONS, AND BY IMPROVING EDUCATION AND PUBLIC AWARENESS Ying Chen Institute of World Economics and Politics, Chinese Academy of Social Sciences,
CENTRAL STATISTICAL OFFICE DATA/INFORMATION DISSEMINATION AND ACCESS POLICY
 CENTRAL STATISTICAL OFFICE DATA/INFORMATION DISSEMINATION AND ACCESS POLICY MAY 2013 1 P a g e MISSION AND GOAL To provide for a comprehensive National Statistical Database yielding timely, relevant and
Assessing Nepal s national sanitation policy
 31st WEDC International Conference, Kampala, Uganda, 2005 MAXIMIZING THE BENEFITS FROM WATER AND ENVIRONMENTAL SANITATION Assessing Nepal s national sanitation policy Guna Raj Shrestha, Nepal, Kevin Tayler,
MAINSTREAMING POVERTY REDUCTION STRATEGIES WITHIN THE MILLENIUM DEVELOPMENT GOALS (MDGs( MDGs): THE ROLE OF PUBLIC ADMINISTRATION
: THE ROLE OF PUBLIC ADMINISTRATION") COMMITTEE OF EXPERTS ON PUBLIC ADMINISTRATION Second Session New York, 7-11 April 2003 MAINSTREAMING POVERTY REDUCTION STRATEGIES WITHIN THE MILLENIUM DEVELOPMENT GOALS (MDGs( MDGs): THE ROLE OF PUBLIC
COMMITTEE OF EXPERTS ON PUBLIC ADMINISTRATION Second Session New York, 7-11 April 2003 MAINSTREAMING POVERTY REDUCTION STRATEGIES WITHIN THE MILLENIUM DEVELOPMENT GOALS (MDGs( MDGs): THE ROLE OF PUBLIC
Introduction. World Day Against Child Labour 12 June 2007 represents a significant landmark in this global effort.
 Introduction The World Day Against Child Labour (WDACL), 12 June 2007, is on elimination of child labour in agriculture, especially the worst forms. Worldwide, agriculture is the sector where by far the
The Human Capital Project: Frequently Asked Questions
 The Human Capital Project: Frequently Asked Questions 1. What is human capital and why does it matter? Human capital consists of the knowledge, skills, and health that people accumulate throughout their
UNICEF Lao PDR TERMS OF REFERENCE FOR SERVICES CONTRACT
 UNICEF Lao PDR TERMS OF REFERENCE FOR SERVICES CONTRACT Title: International Individual Consultancy for WASH District-Level Bottleneck Analysis Requesting Section: WASH Start and end dates: January to
SDGs Development in Myanmar
 SDGs Development in Myanmar Than Zaw Deputy Director General Central Statistical Organization Ministry of Planning and Finance Bangkok, Thailand 26 th ~ 27 th March, 2018 Prioritizing and Planning the
Chronic Food Insecurity Situation Overview of 15 selected provinces of Luzon and Mindanao (February, 2016)
") Chronic Food Insecurity Situation Overview of 15 selected provinces of Luzon and Mindanao (February, 2016) Key Highlights The 2 nd round of IPC Chronic Food Insecurity (CFI) analysis covers 15 provinces,
Chronic Food Insecurity Situation Overview of 15 selected provinces of Luzon and Mindanao (February, 2016) Key Highlights The 2 nd round of IPC Chronic Food Insecurity (CFI) analysis covers 15 provinces,
REPUBLIC OF MACEDONIA Ministry of Foreign Affairs
 REPUBLIC OF MACEDONIA Ministry of Foreign Affairs INTRODUCTORY SPEECH BY MR. LJUPCO MESHKOV, MINISTER OF LABOR AND SOCIAL POLICY IN THE GOVERNMENT OF THE REPUBLIC OF MACEDONIA, AT THE 37 TH SESSION OF
Malawi Ending Hunger and Undernutrition: Challenges and Opportunities
 Malawi Ending Hunger and Undernutrition: Challenges and Opportunities Dr. Alexander Kalimbira Associate Professor of Human Nutrition and Head, Department of Human Nutrition and Health, LUANAR Roundtable