SOUTHWESTERN MINNESOTA FARM BUSINESS MANAGEMENT ASSOCIATION ANNUAL REPORT
|
|
|
- Leslie Morrison
- 6 years ago
- Views:
Transcription


1 SOUTHWESTERN MINNESOTA FARM BUSINESS MANAGEMENT ASSOCIATION 2012 ANNUAL REPORT Staff Paper P13-2 Department of Applied Economics University of Minnesota Saint Paul, MN March 2013 In Cooperation with: Center for Farm Financial Management Department of Applied Economics University of Minnesota Extension College of Food, Agricultural and Natural Resource Sciences University of Minnesota
2 SOUTHWEST MINNESOTA FARM BUSINESS MANAGEMENT ASSOCIATION Kittson Roseau Marshall Lake of the Woods Koochiching Pennington Polk Red Lake Beltrami Cook Clearwater Itasca St. Louis Lake Norman Mahnomen Clay Becker Hubbard Cass Wilkin Otter Tail Wadena Crow Wing Aitkin Carlton Todd Morrison Grant Douglas Benton Big Stone Stevens Pope Stearns Sherburne Isanti Traverse Swift Anoka Wright Meeker Chippewa Hennepin Lac Oui Parle Yellow Medicine Renville McLeod Carver Dakota Scott Sibley Lincoln Lyon Redwood Goodhue Nicollet Le Sueur Rice Wabasha Brown Pipestone Kandiyohi Murray Cottonwood Watonwan Blue Ear th Mille Lacs Kanabec Waseca Steele Chisago Washington Ramsey Pine Dodge Olmsted Winona Rock Nobles Jackson Mar tin Faribault Freeborn Mower Fillmore Houston

3 Executive Summary 2012 Annual Report of the Southwestern Minnesota Farm Business Management Association by Dale W. Nordquist, Donald L. Nitchie, James N. Kurtz, Garen J. Paulson, Janet M. Froslan, John L. Woodford, Tonya L. Knorr and Ian V. Sandager Average net farm income was $377,071 for the 110 farms included in this 2012 annual report of the Southwestern Minnesota Farm Business Management Association. Inflation adjusted profits were up 10% from earnings reported in Very strong prices for corn and soybeans offset lower corn yields that resulted from dry growing conditions in many counties of Southwest Minnesota. Highlights of association financial results for 2012: Median net farm income, or the income earned by the middle farm, was $294,840, substantially lower than the average. This indicates that the average is skewed by high profits of the most profitable farms. This is consistent with most recent years with the exception of 2009, when losses suffered by large livestock farms reversed this relationship. As is the case every year, incomes varied widely across the entire group. The average net farm income for the most profitable 20% of the farms was $895,799 while the least profitable 20% earned $99,444. Average gross cash income was up 16% from 2011 while cash expenses increased by 18%. Much of the increased net farm income resulted from the increased value of crop inventories held at the end of the year. Entire report is available at: i

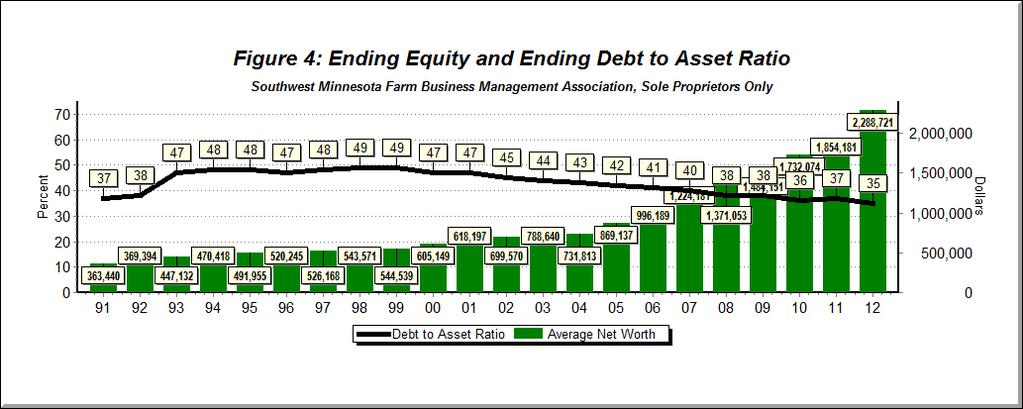
4 Crop sales accounted for 53% of gross income while livestock sales were 38% (Figure 2). Crop sales accounted for a much greater portion of sales than in previous years due primarily to high crop prices. Government payments accounted for 2% if gross cash income and 6% of net farm income. Government payments increased slightly due to an increase in the average acres farmed. The average operation farmed 886 crop acres compared to 791 in Rates of return were again very strong, though slightly lower than earned in Average rate of return on assets (ROA) was 14% (assets valued at adjusted cost or book value), down from 16% in 2011 (Figure 3). Rate of return on equity (ROE) averaged 19%, down from 21% in The average farm reported net worth growth of $471,988. Net worth growth from earnings (farm and non-farm) averaged $282,564. The remainder resulted from changes in asset values. The debt-to-asset ratio of the average sole proprietor farm improved from 37% to 35% (Figure 4). Crops Corn yields averaged 162 bushels per acre, down 10 bushels from the average of the last 10 years. Soybeans yields averaged 47 bushels, right on the association ten year average (Figure 5). Drought conditions gradually developed across the area as the 2012 growing season progressed. The June 5 Drought Monitor showed virtually no abnormally dry areas in Southwest Minnesota. By September most of the area was in moderate to severe drought. Yet the area escaped the severe yield reductions that impacted much of the Midwest. The Midwest drought coupled with already tight supply conditions sent corn and soybean prices to record levels. The average price received for corn was $6.27 per bushel compared to $5.29 in Soybeans averaged $13.07 per bushel, up from $ ii
5 iii
6 iv
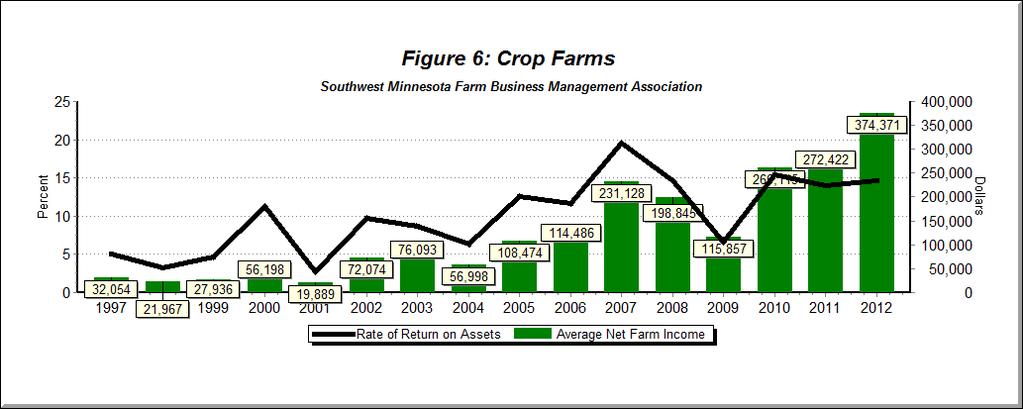
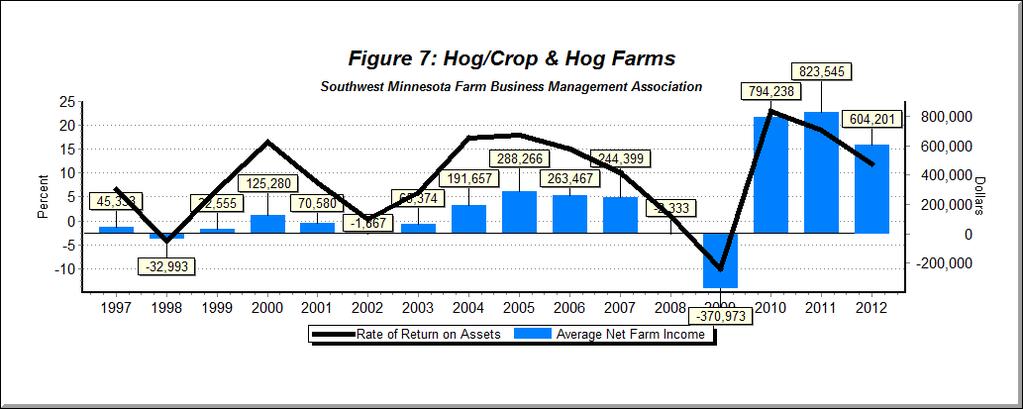
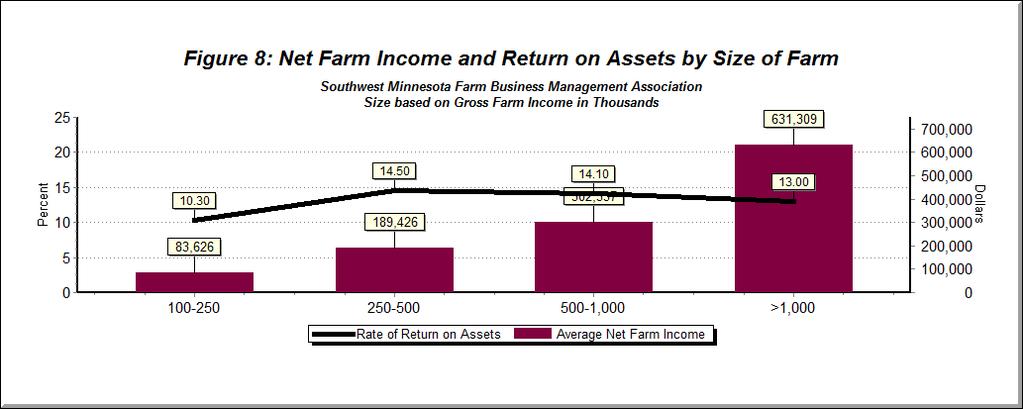
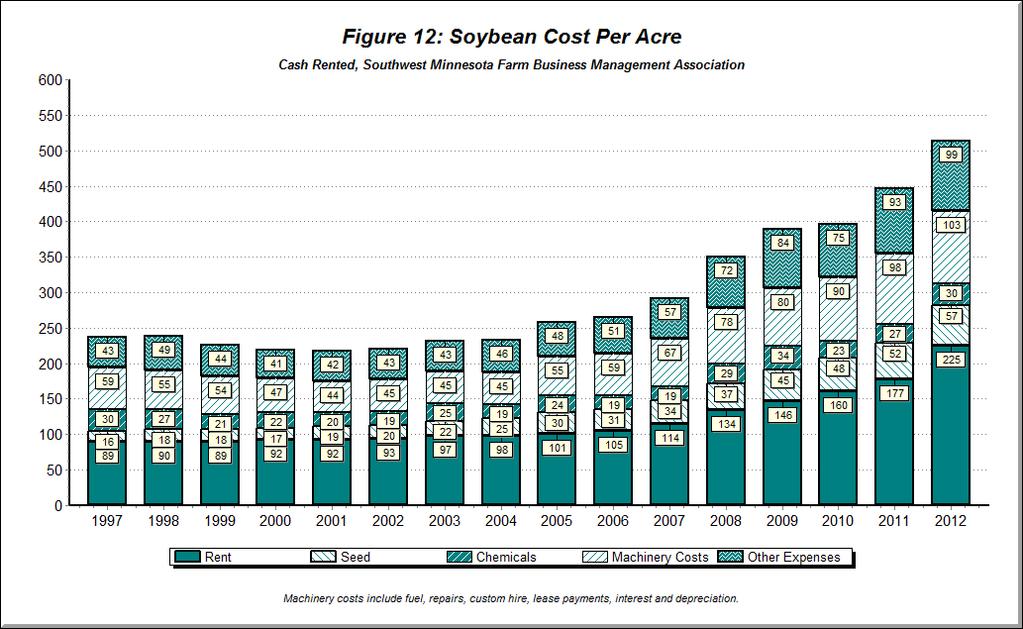
7 The cost to raise an acre of corn (with land rent) increased by 16% while soybean costs increased by 15%. The cost to produce a bushel of corn increased by almost a dollar per bushel, from $3.74 in 2011 to $4.72 in Soybean costs per bushel increased by almost two dollars, from $9.86 to $11.75 per bushel. These costs include a charge for unpaid labor and management, but do not include a charge for equity capital. Cash rental rates increased by 22% on corn and soybean ground. Type of Farm Crop farms were very profitable, with an average net farm income of $374,371 and an average ROA of 15.0 % (Figure 6). Record prices for corn and soybeans more than offset decreased corn yields and substantial increases in costs of production. Even with very high feed prices, hog farms were profitable in 2012, though not as profitable as in the two previous years. Specialized hog farms and hog/crop farms (those farms with over 70% of gross income from sale of hogs or a combination of hogs and crops) earned an average net farm income of $604,201 and an ROA of 12% (Figure 7). There were not enough beef or dairy farms in the group to summarize these farms by type. Size of Farm Net incomes generally increased with farm size when measured based on gross farm income (Figure 8). Yet, except for the smallest farms, rates of return on assets were not correlated with farm size. Mid-sized farms, those that grossed between $250,000 and $500,000, were most profitable with and ROA of 14.5%, but there was likely no statistical difference between these and the returns of larger farms. The smaller farms, those that grossed between $100,000 and $250,000, were profitable but not as profitable, with an ROA of 10.3%. The report provides additional information on whole farm financial performance as well as detailed information on crop and livestock enterprise profitability. The report also includes whole-farm financial condition and performance by business size, type of farm, debt-to-asset ratio, and age of operator. v
8
9 2012 Annual Report Southwestern Minnesota Farm Business Management Association by by Dale W. Nordquist, Donald L. Nitchie, James N. Kurtz, Garen J. Paulson, Janet M. Froslan, John L. Woodford, Tonya L. Knorr and Ian V. Sandager 1 This report summarizes the individual farm records of the members of the Southwestern Minnesota Farm Business Management Association for Whole-farm information and enterprise costs and returns are reported. The year-end analysis of the individual farms was performed by the Association fieldmen using the FINPACK software from the Center for Farm Financial Management. The individual analyses were summarized at the Department of Applied Economics using RankEm Central. In addition to the average of all farms, the averages for the high and low income groups are also presented. The tables are divided into four major groups: whole-farm information, crop enterprises, livestock enterprises, and summary information. The summary information includes whole farm historical trends and information by farm size, type of farm, debt to asset ratio, and operator age. Of the 122 farms in the Southwestern Association, the data for 110 farms are included in this report. The rest were omitted because the records were incomplete at the time that this report was prepared. In addition to this report, members receive an annual farm business analysis; on-farm instructional visits; end-of-year income tax planning and preparation; periodic meetings, tours, and seminars; a monthly newsletter; and other managerial and educational assistance. Each farmer pays an annual fee which covers the majority of the cost, with the balance defrayed by University of Minnesota Extension and research programs of the University of Minnesota. 1 Nordquist is Extension Economist Center for Farm Financial Management (CFFM), University of Minnesota, Twin Cities; Nitchie is Regional Extension Educator--Farm Management and Fieldmen for the Association; Kurtz, Paulson, Froslan, Woodford, Knorr and Sandager are financial analysts for the Association. Special thanks to Rann Loppnow, Software Development, CFFM; Eliza Herman, Program Associate, CFFM; and Barb Lenning, Southwest Research and Outreach Center. 1
10 Southwestern Minnesota Farm Business Management Association Distribution of Membership Number of Number of Farm Records County Units Submitted Cottonwood Jackson Lyon 4 2 Martin 3 2 Murray Nobles Pipestone Redwood 7 7 Rock 6 6 Watonwan 9 7 Others TOTAL Officers and Directors Brian Ling, President Mike Metz, Vice President Kerry Tutt, Secretary-Treasurer The directors of the Southwestern Minnesota Farm Business Management Association for 2012/2013 are: Mark Christensen, Chad Diemer, Bob Hartman, Brent Pohlman, Mike Sandager, and Matt Wolle. 2 Records were also submitted from members in Faribault, Lac Qui Parle, McLeod, Mower, Wabasha and Yellow Medicine counties. 2
11 Southwestern Minnesota Farm Business Management Association Table of Contents Page Whole-Farm Reports Financial Summary... 8 Financial Standards Measures... 9 Farm Income Statement Profitability Measures Liquidity & Repayment Capacity Measures Balance Sheet at Cost Values Balance Sheet at Market Values Statement of Cash Flows Crop Production and Marketing Summary Household and Personal Expenses Operator and Labor Information Nonfarm Summary Crop Reports Corn Soybeans Corn Silage Hay, Alfalfa Pasture CRP Livestock Reports Hogs, Farrow to Finish Hogs, Weaning to Finish Hogs, Weaning to Finish, Contract Grower Beef Cow-Calf Beef Finishing Summary Reports Financial Summary of the Whole-Farm Analysis by Years Financial Summary -- by Gross Farm Income Financial Summary -- Farm Type Financial Summary -- by Debt to Asset Ratio Financial Summary -- by Age of Operator Appendices Appendix I -- Whole Farm Analysis Procedures and Measures Appendix II -- Crop Enterprise Analysis Procedures and Measures Appendix III -- Livestock Enterprise Analysis Procedures and Measures Appendix IV -- Prices Used in the Analysis Report
12 4
13 Whole-Farm Reports The whole-farm reports summarize the financial performance of member farms in Each table (except for the balance sheets) includes the average of the 110 farms included in the report and the average 20 percent of the farms with the lowest and highest profits (base on Net Farm Income). In a change from previous years, the balance sheet reports include all farms, including partnerships and corporations. Appendix I provides detail on how the whole-farm measures are calculated. Below is a short summary of the whole farm reports. Financial Summary The Financial Summary report provides a summary of the key financial measures and ratios included on the other detailed whole farm reports. Financial Standards Measures The Farm Financial Standards Council recommends that farms use these sixteen measures as standard measures of farm financial performance. They are sometimes called the Sweet 16. Many are repeated from the Profitability, Liquidity, and Balance Sheet tables. For a complete description, see the Financial Guidelines for Agricultural Producers at Farm Income Statement The Income Statement calculates the accrual Net Farm Income generated by the average farm for year Net Farm Income represents the return to the operator's and family's unpaid labor, management, and equity capital (net worth). It is the amount the farm contributed to owner family living, income taxes, and net worth growth. However, it does not include any asset appreciation, debt forgiveness or asset repossessions. Profitability Measures The profitability measures are calculated based on both the cost value of assets and the market value. When calculated based on the market value of assets, the profitability measures can be compared to interest rates and returns available on alternative investments. When based on cost values, the returns more closely estimate the actual returns from the actual investment. (Cost values do not reflect the tax basis of farm assets. Instead, a method of calculating depreciation is used that estimates economic depreciation over the useful life of the assets.) The Rate of Return on Assets (ROA) can be thought of as the interest rate earned by all investment in farm assets. Rate of Return on Equity (ROE) is the rate earned on the operator s equity or net worth in the farm business. If ROE is higher than ROA, borrowed funds more than paid for their cost in interest expense. Operating Profit Margin measures efficiency in farm operations. The higher the margin, the more of the farm income remained in pockets of the farm operator. Asset Turnover Rate measures efficiency in use of capital. Again, the higher the better. Farms with high investment in fixed assets will generally have a lower turnover rate than those who lease a major share of their capital. 5
14 Liquidity and Repayment Capacity Measures Liquidity reflects the ability of the farm to meet its financial obligations on time. Current Ratio is current farm assets divided by current farm liabilities. Working Capital is current farm assets minus current farm liabilities. Businesses with more working capital are generally in a better position to overcome short-term financial downturns or production problems. Working Capital to Gross Income measures liquidity relative to business size. Repayment capacity measures the ability of the business to meet debt payments and replace capital assets. Term Debt Coverage Ratio measures the ability of the business to meet its scheduled debt payments. A term debt coverage ratio greater than 1.0 indicates that the business produced more than enough earnings to meet its scheduled debt payments. Replacement Coverage Ratio adds the need for capital replacement. A replacement coverage ratio greater than 1.0 indicates that the business produced more than enough earnings to meet its payments and replace its depreciable assets. Balance Sheets Balance sheet reports are included for both the cost and market value of assets. Current assets are identical in both tables, with crop and livestock inventories generally valued at market value. This conforms to the methodology recommended by the Farm Financial Standards Council. Intermediate and long term assets are shown at depreciated value using estimated economic depreciation, not tax, on the cost-based table. On the market table, they are valued at estimated market value. Liabilities are the same on the cost and market tables except for the inclusion of Deferred Liabilities on the market statements. Deferred liabilities are the estimated taxes that would be paid if assets were liquidated at their market values. Net Worth Change on the cost value table is the amount of earned net worth growth or loss for the year. Net worth change on the market value table includes both earned growth and changes in the market valuation of capital assets. Statement of Cash Flows The Statement of Cash Flows displays the sources and uses of cash for the year. Cash From Operating Activities includes sources and uses of cash related to normal farm operations. Cash From Investing Activities reflect cash used to buy and sell capital assets. Cash From Financing Activities includes sources and uses of borrowed funds as well as cash from nonfarm activities. Crop Production and Marketing This table reports farm size in acres farmed, average crop yields for major commodities, and average crop sales prices for the calendar year. Yields and prices are reported for the average of all farms for more commodities than those included in the High and Low columns because a minimum of five farms are required to report the yield or price for any group. 6
15 Household and Personal Expenses This table reports family living and other non-farm expenditures. Only sole proprietors who keep detailed family living records are included. Operator and Labor Information All previous tables report results per farm, regardless of the number of families or operators involved in the operation. This report repeats several measures from previous tables on a Per Operator basis. It also summarizes estimated labor hours used and labor performance. Nonfarm Summary This table summarizes nonfarm earnings for the average farm and details nonfarm assets and liabilities. 7
16 Financial Summary Southwest Minnesota Farm Business Management Association (Farms Sorted By Net Farm Income) Avg. Of All Farms Low 20% High 20% Number of farms Income Statement Gross cash farm income 1,332, ,646 3,365,702 Total cash farm expense 1,057, ,293 2,935,605 Net cash farm income 275, , ,097 Inventory change 157,209 5, ,920 Depreciation -66,085-34, ,017 Net farm income from operations 366,624 99, ,000 Gain or loss on capital sales 10, ,798 Average net farm income 377,071 99, ,799 Median net farm income 294, , ,837 Profitability (cost) Rate of return on assets 13.9 % 8.5 % 16.3 % Rate of return on equity 18.6 % 10.9 % 22.2 % Operating profit margin 30.2 % 19.7 % 31.9 % Asset turnover rate 46.0 % 43.3 % 51.2 % Liquidity & Repayment (end of year) Current assets 1,136, ,649 2,739,613 Current liabilities 364, , ,662 Current ratio Working capital 771, ,138 1,837,950 Working capital to gross inc 52.0 % 51.6 % 47.2 % Term debt coverage ratio Replacement coverage ratio Solvency (end of year at market) Number of farms Total farm assets 3,491,321 1,224,170 6,533,202 Total farm liabilities 1,284, ,859 2,503,262 Total assets 3,799,785 1,421,440 6,803,770 Total liabilities 1,361, ,050 2,611,433 Net worth 2,437, ,390 4,192,338 Net worth change 471,988 98, ,366 Farm debt to asset ratio 37 % 40 % 38 % Total debt to asset ratio 36 % 39 % 38 % Nonfarm Information Net nonfarm income 30,841 39,142 17,123 Farms reporting living expenses Total family living expense 73,904 67,444 62,025 Total living, invest, cap. purch 135, , ,902 Crop Acres Total acres owned Total crop acres ,868 Total crop acres owned Total crop acres cash rented ,480 Total crop acres share rented Annual Report 8 Copyright (c) , Univ of Minnesota
17 Financial Standards Measures Southwest Minnesota Farm Business Management Association (Farms Sorted By Net Farm Income) Avg. Of All Farms Low 20% High 20% Number of farms Liquidity Current ratio Working capital 771, ,138 1,837,950 Working capital to gross inc 52.0 % 51.6 % 47.2 % Solvency (market) Farm debt to asset ratio 37 % 40 % 38 % Farm equity to asset ratio 63 % 60 % 62 % Farm debt to equity ratio Profitability (cost) Rate of return on farm assets 13.9 % 8.5 % 16.3 % Rate of return on farm equity 18.6 % 10.9 % 22.2 % Operating profit margin 30.2 % 19.7 % 31.9 % Net farm income 377,071 99, ,799 EBIDTA 459, ,683 1,025,309 Repayment Capacity Capital debt repayment capacity 370, , ,907 Capital debt repayment margin 290,734 74, ,593 Replacement margin 261,156 58, ,727 Term debt coverage ratio Replacement coverage ratio Efficiency Asset turnover rate (cost) 46.0 % 43.3 % 51.2 % Operating expense ratio 69.1 % 63.1 % 73.7 % Depreciation expense ratio 4.5 % 8.7 % 3.0 % Interest expense ratio 1.8 % 3.3 % 1.2 % Net farm income ratio 25.4 % 25.0 % 23.0 % 2012 Annual Report 9 Copyright (c) , Univ of Minnesota
18 Farm Income Statement Southwest Minnesota Farm Business Management Association (Farms Sorted By Net Farm Income) Avg. Of All Farms Low 20% High 20% Number of farms Cash Farm Income Beans, Navy Corn 436, ,458 1,012,484 Corn Silage 5,616 2,722 20,254 Hay, Alfalfa 49,164 2, ,131 Hay, Mixed 377 1,424 - Oats Peas, Processing 517-2,585 Soybeans 207,306 99, ,494 Soybeans Seed Stover Sugar Beets 1, Sweet Corn, Processing 1,192-2,520 Wheat, Spring ,005 Wheat, Winter Miscellaneous crop income 18, ,652 Beef Cow-Calf, Beef Calves 2,032 3,178 3,489 Beef Backgrounding 600-3,000 Beef Finishing 28, ,855 Dairy, Milk 70,052 11, ,718 Dairy, Dairy Calves Dairy Replacement Heifers 5,162-11,800 Dairy Finishing 9,295 24,795 - Hogs, Farrow To Finish, Raised Ho 17,669 5,157 70,435 Hogs, Feeder Pig Prod, Feeder Pig Hogs, Finish Feeder Pigs 8, Sheep, Market Lamb Prod, Mkt Lamb 1,890-6,157 Sheep, Market Lamb Prod, Wool Hogs, Weaning to Finish 346,948-1,210,176 Cull breeding livestock 4,428 1,336 6,074 Misc. livestock income Direct, CCP & ACRE pymts 14,961 6,939 27,742 CRP payments Livestock govt payments ,051 Other government payments 4,370 3,441 5,357 Custom work income 47,118 18, ,819 Patronage dividends, cash 5,664 1,417 12,702 Crop insurance income 10,978 10,330 9,223 Property insurance income 1, ,631 Contract livestock income 16,792 18,133 5,762 Other farm income 11,111 3,128 17,849 Gross Cash Farm Income 1,332, ,646 3,365, Annual Report Copyright (c) , University of Minnesota 10
19 Farm Income Statement (Continued) Southwest Minnesota Farm Business Management Association (Farms Sorted By Net Farm Income) Avg. Of All Farms Low 20% High 20% Number of farms Cash Farm Expense Seed 81,740 35, ,482 Fertilizer 86,605 39, ,474 Crop chemicals 26,383 12,921 49,424 Crop insurance 14,904 7,407 27,255 Drying expense 1, ,761 Storage Irrigation energy Packaging and supplies ,992 Crop miscellaneous 1, ,834 Consultants 1, ,869 Feeder livestock purchase 102,788 4, ,093 Purchased feed 329,518 17,621 1,204,243 Breeding fees 1, ,463 Veterinary 11,509 1,617 35,768 Supplies 5,455 2,384 9,856 DHIA Contract production exp. 8,286-1,162 Livestock leases 4,016-20,081 Interest 27,141 13,272 50,998 CCC buyback 15,513 1,301 69,245 Fuel & oil 36,128 14,408 74,306 Repairs 42,441 20,226 64,580 Custom hire 14,987 5,762 46,339 Hired labor 34,851 8,917 96,602 Land rent 138,278 59, ,395 Machinery leases 8, ,631 Building leases 21,214 2,059 95,142 Real estate taxes 5,911 1,744 8,636 Farm insurance 9,973 4,615 18,909 Utilities 9,843 6,287 12,914 Hauling and trucking 1,661 1,308 1,175 Marketing 3, ,278 Dues & professional fees 3,288 2,226 4,831 Miscellaneous 5,908 3,141 15,330 Total cash expense 1,057, ,293 2,935,605 Net cash farm income 275, , ,097 Inventory Changes Prepaids and supplies 12,564 4,607 40,147 Accounts receivable 2,642-1,014-3,310 Hedging accounts 19,588-3, ,418 Other current assets Crops and feed 113,980 3, ,260 Market livestock 7,415 3,139 34,929 Breeding livestock ,321-1,857 Other assets 8, ,947 Accounts payable -7, ,291 Accrued interest ,706 Total inventory change 157,209 5, ,920 Net operating profit 432, , ,017 Depreciation Machinery and equipment -45,730-22,827-87,571 Titled vehicles -3,639-2,844-8,077 Buildings and improvements -16,716-8,711-19,369 Total depreciation -66,085-34, ,017 Net farm income from operations 366,624 99, ,000 Gain or loss on capital sales 10, ,798 Net farm income 377,071 99, , Annual Report Copyright (c) , University of Minnesota 11
20 Profitability Measures Southwest Minnesota Farm Business Management Association (Farms Sorted By Net Farm Income) Avg. Of All Farms Low 20% High 20% Number of farms Profitability (assets valued at cost) Net farm income from operations 366,624 99, ,000 Rate of return on assets 13.9 % 8.5 % 16.3 % Rate of return on equity 18.6 % 10.9 % 22.2 % Operating profit margin 30.2 % 19.7 % 31.9 % Asset turnover rate 46.0 % 43.3 % 51.2 % Farm interest expense 26,468 13,281 48,292 Value of operator lbr and mgmt. 75,374 38, ,029 Return on farm assets 317,718 73, ,263 Average farm assets 2,286, ,265 4,703,883 Return on farm equity 291,250 60, ,971 Average farm equity 1,565, ,006 3,231,362 Value of farm production 1,052, ,862 2,407,752 Avg. Of All Farms Low 20% High 20% Number of farms Profitability (assets valued at market) Net farm income from operations 548, ,222 1,032,863 Rate of return on assets 15.8 % 9.1 % 16.2 % Rate of return on equity 23.9 % 13.3 % 24.7 % Operating profit margin 47.5 % 28.0 % 39.0 % Asset turnover rate 33.3 % 32.7 % 41.5 % Farm interest expense 26,468 13,281 48,292 Value of operator lbr and mgmt. 75,374 38, ,029 Return on farm assets 499, , ,126 Average farm assets 3,158,408 1,147,005 5,806,038 Return on farm equity 473,054 91, ,834 Average farm equity 1,983, ,835 3,608,797 Value of farm production 1,052, ,862 2,407, Annual Report Copyright (c) , Univ of Minnesota 12
21 Liquidity & Repayment Capacity Measures Southwest Minnesota Farm Business Management Association (Farms Sorted By Net Farm Income) Avg. Of All Farms Low 20% High 20% Number of farms Liquidity Current ratio Working capital 771, ,138 1,837,950 Working capital to gross inc 52.0 % 51.6 % 47.2 % Current assets 1,136, ,649 2,739,613 Current liabilities 364, , ,662 Gross revenues (accrual) 1,483, ,195 3,895,088 Repayment capacity Net farm income from operations 366,624 99, ,000 Depreciation 66,085 34, ,017 Personal income 30,841 39,142 17,123 Family living/owner withdrawals -89,387-54, ,167 Payments on personal debt -2,570-4, Income taxes paid -21,791-11,693-29,798 Interest on term debt 21,118 8,595 41,910 Capital debt repayment capacity 370, , ,907 Scheduled term debt payments -80,187-36, ,314 Capital debt repayment margin 290,734 74, ,593 Cash replacement allowance -29,578-15,857-42,866 Replacement margin 261,156 58, ,727 Term debt coverage ratio Replacement coverage ratio Annual Report Copyright (c) , Univ of Minnesota 13
22 Balance Sheet at Cost Values Southwest Minnesota Farm Business Management Association (Farms Sorted By Net Farm Income) Avg. Of All Farms Low 20% High 20% Number of farms Beginning Ending Beginning Ending Beginning Ending Assets Current Farm Assets Cash and checking balance 74,594 75,204 41,254 49, , ,425 Prepaid expenses & supplies 119, ,122 54,338 58, , ,201 Growing crops Accounts receivable 31,516 34,159 2,649 1, ,707 97,396 Hedging accounts 15,799 14,378 1,196 1,072 71,701 58,038 Crops held for sale or feed 567, , , ,140 1,174,411 1,423,338 Crops under government loan 42,606 64,857 6,338 10, , ,038 Market livestock held for sale 148, ,453 28,428 31, , ,175 Other current assets Total current farm assets 999,418 1,136, , ,649 2,358,547 2,739,613 Intermediate Farm Assets Breeding livestock 6,221 9,671 3,991 9,135 6,886 17,080 Machinery and equipment 361, , , , , ,919 Titled vehicles 18,058 21,629 11,863 15,769 32,705 35,839 Other intermediate assets 58,148 67,650 3,539 3, , ,638 Total intermediate farm assets 443, , , , ,626 1,083,476 Long Term Farm Assets Farm land 388, , , , , ,141 Buildings and improvements 245, , , , , ,206 Other long-term assets 49,701 51,579 11,757 10, , ,437 Total long-term farm assets 684, , , ,129 1,068,711 1,426,783 Total Farm Assets 2,127,454 2,475, , ,019 4,300,884 5,249,872 Total Nonfarm Assets 219, , , , , ,710 Total Assets 2,346,665 2,722, ,149 1,088,319 4,443,785 5,455,581 Liabilities Current Farm Liabilities Accrued interest 7,452 6,794 3,966 3,974 13,428 10,793 Accounts payable 18,280 25,794 8,652 7,848 54,424 79,716 Current notes 224, ,552 87,405 85, , ,292 Government crop loans 19,584 19,323 2,132 3,054 78,243 81,774 Principal due on term debt 59,069 57,281 27,766 32,818 90,405 96,088 Total current farm liabilities 328, , , , , ,662 Total intermediate farm liabs 99, ,639 53,483 55, , ,539 Total long term farm liabilities 266, , , , , ,598 Total farm liabilities 694, , , ,138 1,405,233 1,682,799 Total nonfarm liabilities 54,847 65,505 58,375 65,169 67,862 94,061 Total liabilities 749, , , ,307 1,473,095 1,776,860 Net worth (farm and nonfarm) 1,597,503 1,880, , ,012 2,970,690 3,678,721 Net worth change 282,564 67, ,031 Percent net worth change 18 % 11 % 24 % Ratio Analysis Current farm liabilities / assets 33 % 32 % 40 % 39 % 31 % 33 % Intermediate farm liab. / assets 22 % 19 % 26 % 23 % 24 % 17 % Long term farm liab. / assets 39 % 38 % 38 % 43 % 44 % 42 % Total debt to asset ratio 32 % 31 % 36 % 37 % 33 % 33 % 2012 Annual Report Copyright (c) , Univ of Minnesota 14
23 Balance Sheet at Market Values Southwest Minnesota Farm Business Management Association (Farms Sorted By Net Farm Income) Avg. Of All Farms Low 20% High 20% Number of farms Beginning Ending Beginning Ending Beginning Ending Assets Current Farm Assets Cash and checking balance 74,594 75,204 41,254 49, , ,425 Prepaid expenses & supplies 119, ,122 54,338 58, , ,201 Growing crops Accounts receivable 31,516 34,159 2,649 1, ,707 97,396 Hedging accounts 15,799 14,378 1,196 1,072 71,701 58,038 Crops held for sale or feed 567, , , ,140 1,174,411 1,423,338 Crops under government loan 42,606 64,857 6,338 10, , ,038 Market livestock held for sale 148, ,453 28,428 31, , ,175 Other current assets Total current farm assets 999,418 1,136, , ,649 2,358,547 2,739,613 Intermediate Farm Assets Breeding livestock 36,753 37,334 13,787 18,653 46,098 35,122 Machinery and equipment 530, , , , ,548 1,073,392 Titled vehicles 28,124 32,665 15,457 20,298 44,470 50,572 Other intermediate assets 60,623 69,125 3,743 4, , ,155 Total intermediate farm assets 656, , , ,124 1,172,135 1,416,241 Long Term Farm Assets Farm land 786,433 1,109, , ,608 1,040,041 1,613,223 Buildings and improvements 354, , , , , ,369 Other long-term assets 59,005 70,024 11,677 10, , ,756 Total long-term farm assets 1,199,550 1,593, , ,398 1,691,183 2,377,348 Total Farm Assets 2,855,041 3,491,321 1,071,133 1,224,170 5,221,865 6,533,202 Total Nonfarm Assets 271, , , , , ,569 Total Assets 3,126,049 3,799,785 1,256,950 1,421,440 5,408,304 6,803,770 Liabilities Current Farm Liabilities Accrued interest 7,452 6,794 3,966 3,974 13,428 10,793 Accounts payable 18,280 25,794 8,652 7,848 54,424 79,716 Current notes 224, ,552 87,405 85, , ,292 Government crop loans 19,584 19,323 2,132 3,054 78,243 81,774 Principal due on term debt 59,069 57,281 27,766 32,818 90,405 96,088 Total current farm liabilities 328, , , , , ,662 Total intermediate farm liabs 99, ,639 53,483 55, , ,539 Total long term farm liabilities 266, , , , , ,598 Total farm liabilities 694, , , ,138 1,405,233 1,682,799 Total nonfarm liabilities 54,847 65,505 58,375 65,169 67,862 94,061 Total liabs excluding deferreds 749, , , ,307 1,473,095 1,776,860 Total deferred liabilities 410, , , , , ,572 Total liabilities 1,160,069 1,361, , ,050 2,110,332 2,611,433 Retained earnings 1,597,503 1,880, , ,012 2,970,690 3,678,721 Market valuation equity 368, , , , , ,617 Net worth (farm and nonfarm) 1,965,979 2,437, , ,390 3,297,971 4,192,338 Net worth excluding deferreds 2,376,887 2,957, ,901 1,020,133 3,935,208 5,026,910 Net worth change 471,988 98, ,366 Percent net worth change 24 % 13 % 27 % Ratio Analysis Current farm liabilities / assets 33 % 32 % 40 % 39 % 31 % 33 % Intermediate farm liab. / assets 15 % 13 % 17 % 15 % 18 % 13 % Long term farm liab. / assets 22 % 19 % 25 % 28 % 28 % 25 % Total debt to asset ratio 37 % 36 % 39 % 39 % 39 % 38 % Debt to assets excl deferreds 24 % 22 % 28 % 28 % 27 % 26 % 2012 Annual Report 15 Copyright (c) , Univ of Minnesota
24 Statement Of Cash Flows Southwest Minnesota Farm Business Management Association (Farms Sorted By Net Farm Income) Avg. Of All Farms Low 20% High 20% Number of farms Beginning cash (farm & nonfarm) 86,575 45, ,800 Cash Provided By Operating Activities Gross cash farm income 1,332, ,646 3,365,702 Total cash farm expense -1,057, ,293-2,935,605 Net cash from hedging transactions 21,009-3, ,081 Cash provided by operating 296, , ,178 Cash Provided By Investing Activities Sale of breeding livestock 7,040 1,045 32,355 Sale of machinery & equipment 9,808 7,127 16,166 Sale of titled vehicles 602 1,554 - Sale of farm land 4, Sale of farm buildings Sale of other farm assets 2,547-2,495 Sale of nonfarm assets 3,358 1,598 - Purchase of breeding livestock -4,759-7,394-12,820 Purchase of machinery & equip. -114,603-49, ,505 Purchase of titled vehicles -7,800-8,366-11,211 Purchase of farm land -93,160-35, ,477 Purchase of farm buildings -64,661-36,586-68,062 Purchase of other farm assets -5, ,962 Purchase of nonfarm assets -29,430-14,861-59,440 Cash provided by investing -292, , ,349 Cash Provided By Financing Activities Money borrowed 647, ,190 1,784,914 Principal payments -571, ,396-1,524,724 Personal income 30,841 39,142 17,123 Family living/owner withdrawals -89,351-54, ,167 Income and social security tax -21,791-11,693-29,798 Capital contributions 1,005-5,023 Capital distributions -7, Dividends paid Cash gifts and inheritances 2,541 2,928 4,103 Gifts given Other cash flows Cash provided by financing -9,038 23,870 84,107 Net change in cash balance -4,894 8,185-46,064 Ending cash (farm & nonfarm) 81,681 54, , Annual Report Copyright (c) , Univ of Minnesota 16
25 Crop Production and Marketing Summary Southwest Minnesota Farm Business Management Association (Farms Sorted By Net Farm Income) Avg. Of All Farms Low 20% High 20% Number of farms Acreage Summary Total acres owned Total crop acres ,868 Crop acres owned Crop acres cash rented ,480 Crop acres share rented Total pasture acres Percent crop acres owned 23 % 17 % 15 % Mach invest/crop acre cost Mach invest/crop acre market Average Price Received (Cash Sales Only) Soybeans per bushel Corn per bushel Hay, Alfalfa per ton Hay, Grass per ton Corn Silage per ton Wheat, Spring per bushel Average Yield Per Acre Corn (bushel) Soybeans (bushel) Hay, Alfalfa (ton) Corn Silage (ton) Hay, Grass (ton) Wheat, Spring (bushel) Sweet Corn, Processing (ton) Annual Report Copyright (c) , University of Minnesota 17
26 Household and Personal Expenses Southwest Minnesota Farm Business Management Association (Farms Sorted By Net Farm Income) Avg. Of All Farms Low 20% High 20% Number of farms Average family size Family Living Expenses Food and meals expense 9,077 7,699 9,280 Medical care 7,580 12,736 5,308 Health insurance 5,884 7,214 2,791 Cash donations 4,877 2,959 2,976 Household supplies 9,018 7,078 12,670 Clothing 3,706 2,602 4,602 Personal care 2, Child / Dependent care Alimony and child support Gifts 2,927 1,156 2,320 Education 1,916 3,531 1,334 Recreation 5,453 2,474 5,062 Utilities (household share) 3,260 3,812 2,760 Personal vehicle operating exp 5,123 5,757 3,179 Household real estate taxes Dwelling rent Household repairs 2,785 1,647 2,629 Personal interest 1,809 2,970 1,165 Disability / Long term care ins Life insurance payments 2,815 1,816 2,529 Personal property insurance Miscellaneous 2,907 1, Total cash family living expense 72,918 66,958 62,025 Family living from the farm Total family living 73,904 67,444 62,025 Other Nonfarm Expenditures Income taxes 28,949 14,277 34,476 Furnishing & appliance purchases 1, ,646 Nonfarm vehicle purchases 7,487 8,237 2,794 Nonfarm real estate purchases 5,691 7,633 - Other nonfarm capital purchases 19,983 1,056 49,677 Nonfarm savings & investments ,469 11,285 Total other nonfarm expenditures 62,487 33,921 99,877 Total cash family living investment & nonfarm capital purch 135, , , Annual Report Copyright (c) , Univ of Minnesota 18
27 Operator and Labor Information Southwest Minnesota Farm Business Management Association (Farms Sorted By Net Farm Income) Avg. Of All Farms Low 20% High 20% Number of farms Operator Information Average number of operators Average age of operators Average number of years farming Results Per Operator Working capital 652, ,219 1,304,352 Total assets (market) 3,215,203 1,359,638 4,828,482 Total liabilities 1,152, ,787 1,853,275 Net worth (market) 2,062, ,852 2,975,207 Net worth excl deferred liabs 2,502, ,780 3,567,485 Gross farm income 1,255, ,926 2,764,256 Total farm expense 945, ,211 2,152,514 Net farm income from operations 310,220 94, ,742 Net nonfarm income 26,096 37,440 12,152 Family living & tax withdrawals 94,073 63, ,330 Total acres owned Total crop acres ,325.5 Crop acres owned Crop acres cash rented ,050.0 Crop acres share rented Total pasture acres Labor Analysis Number of farms Total unpaid labor hours 2,109 1,473 2,750 Total hired labor hours 2, ,182 Total labor hours per farm 4,517 1,939 9,932 Unpaid hours per operator 1,782 1,409 1,952 Value of farm production / hour Net farm income / unpaid hour Average hourly hired labor wage Partnerships & LLCs Number of farms 12-6 Number of operators Owner withdrawals per farm Withdrawals per operator Corporations Number of farms Number of operators Annual Report Copyright (c) , Univ of Minnesota 19
28 Nonfarm Summary Southwest Minnesota Farm Business Management Association (Farms Sorted By Net Farm Income) Avg. Of All Farms Low 20% High 20% Number of farms Nonfarm Income Personal wages & salary 16,265 23,018 8,637 Net nonfarm business income 2,510 3, Personal rental income 4, ,144 Personal interest income ,198 Personal cash dividends Tax refunds 910 2,094 1,153 Other nonfarm income 6,058 9,971 2,993 Total nonfarm income 30,841 39,142 17,123 Gifts and inheritances 2,541 2,928 4,103 Nonfarm Assets (market) Checking & savings 6,477 4, Stocks & bonds 39,588 5,127 22,959 Other current assets 2, ,387 Furniture & appliances 10,869 11,544 8,457 Nonfarm vehicles 19,976 18,369 15,031 Cash value of life ins. 13,003 6,153 9,612 Retirement accounts 70,842 41, ,143 Other intermediate assets 18,490 3,703 2,608 Nonfarm real estate 84,089 66,000 52,095 Personal bus. investment 6,473-18,182 Other long term assets 36,504 39,254 38,786 Total nonfarm assets 308, , ,569 Nonfarm Liabilities Accrued interest Accounts payable 38,462 17,333 81,614 Current notes Princ due on term debt 1,439 2, Total current liabilities 40,293 19,778 83,273 Intermediate liabilities 4,870 8,647 9,619 Long term liabilities 20,342 36,743 1,170 Total nonfarm liabilities 65,505 65,169 94,061 Nonfarm net worth 242, , ,507 Nonfarm debt to asset ratio 21 % 33 % 35 % 2012 Annual Report Copyright (c) , Univ of Minnesota 20
29 Crop Reports The Crop Enterprise Analysis tables show the average physical production, gross return, direct costs, overhead costs, and net returns per acre. There are potentially three tables for each crop depending on the farmer's tenure on the land: owned land, cash rented land, and share rented land. Farms are classified into low 20% or high 20% on the basis of net return per acre. The classification is done separately for each table. Gross Return Per Acre includes the value of the crop produced plus any other income directly associated with production of the crop, including hedging gains or loses, crop insurance proceeds and any disaster payments that might have been received. It does not include direct, counter-cyclical and ACRE government payments (see Net Return With Government Payments). The Value Per Unit is assigned by the producer. For cash crops, the value is based on the actual sales price for production sold or contracted before year-end and the inventory value for crops still in inventory at year-end. The local harvest-time price is used for forages and other feed crops. Net Return Per Acre is the amount contributed toward operator labor, management, and equity capital. Any wages and benefits paid to the operator are removed from labor costs (and added to Labor and Management Charge) so that all farms are on equal footing. Land costs include land rent on the rented land pages but only actual interest paid and real estate taxes on owned land. For this reason, net returns from owned and rented land should not be compared. Net Return With Government Payments is the net return per acre after decoupled government payments such as direct, counter-cyclical, and ACRE payments have been added. These payments are generally allocated evenly per acre across all crops except vegetables and pasture. Net Return Over Labor and Management is the return, including government payments, remaining after compensating the operator for unpaid labor and management. This is the per acre return to equity capital. Cost of Production shows the average cost per unit produced in each cost category. Total Direct and Overhead Expense per Unit is the breakeven price needed to cover cash costs and depreciation. Less Government and Other Income is the breakeven price if government payments and any miscellaneous income are used to offset some expenses. With Labor and Management is the breakeven price to provide a labor and management return for the operator(s). Machinery Cost Per Acre includes fuel and oil, repairs, custom hire, machinery lease payments, machinery depreciation, and interest on intermediate debt. 21
30 Crop Enterprise Analysis Southwest Minnesota Farm Business Management Association (Farms Sorted By Net Return) Corn on Owned Land Avg. Of All Farms Low 20% High 20% Number of fields Number of farms Acres Yield per acre (bu.) Operators share of yield % Value per bu Total product return per acre 1, , Hedging gains/losses per acre Crop insurance per acre Other crop income per acre Gross return per acre 1, , Direct Expenses Seed Fertilizer Crop chemicals Crop insurance Drying expense Fuel & oil Repairs Custom hire Hired labor Machinery leases Utilities Hauling and trucking Marketing Operating interest Miscellaneous Total direct expenses per acre Return over direct exp per acre Overhead Expenses Hired labor Machinery leases Building leases RE & pers. property taxes Farm insurance Utilities Dues & professional fees Interest Mach & bldg depreciation Miscellaneous Total overhead expenses per acre Total dir & ovhd expenses per acre Net return per acre Government payments Net return with govt pmts Labor & management charge Net return over lbr & mgt Cost of Production Total direct expense per bu Total dir & ovhd exp per bu Less govt & other income With labor & management Net value per unit Machinery cost per acre Est. labor hours per acre Annual Report Copyright (c) , Univ of Minnesota 22
31 Crop Enterprise Analysis Southwest Minnesota Farm Business Management Association (Farms Sorted By Net Return) Corn on Cash Rent Avg. Of All Farms Low 20% High 20% Number of fields Number of farms Acres Yield per acre (bu.) Operators share of yield % Value per bu Other product return per acre Total product return per acre 1, , Hedging gains/losses per acre Crop insurance per acre Other crop income per acre Gross return per acre 1, , Direct Expenses Seed Fertilizer Crop chemicals Crop insurance Drying expense Storage Fuel & oil Repairs Custom hire Hired labor Land rent Machinery leases Hauling and trucking Marketing Operating interest Miscellaneous Total direct expenses per acre Return over direct exp per acre Overhead Expenses Hired labor Machinery leases Building leases Farm insurance Utilities Dues & professional fees Interest Mach & bldg depreciation Miscellaneous Total overhead expenses per acre Total dir & ovhd expenses per acre Net return per acre Government payments Net return with govt pmts Labor & management charge Net return over lbr & mgt Cost of Production Total direct expense per bu Total dir & ovhd exp per bu Less govt & other income With labor & management Net value per unit Machinery cost per acre Est. labor hours per acre Annual Report Copyright (c) , Univ of Minnesota 23
32 Crop Enterprise Analysis Southwest Minnesota Farm Business Management Association (Farms Sorted By Net Return) Corn on Share Rent Avg. Of All Farms Number of fields 31 Number of farms 18 Acres Yield per acre (bu.) Operators share of yield % Value per bu Total product return per acre Crop insurance per acre 3.28 Other crop income per acre 3.06 Gross return per acre Direct Expenses Seed Fertilizer Crop chemicals Crop insurance Drying expense 1.82 Fuel & oil Repairs Custom hire 8.77 Hauling and trucking 1.79 Marketing 1.42 Operating interest 4.88 Miscellaneous 1.51 Total direct expenses per acre Return over direct exp per acre Overhead Expenses Hired labor 8.48 Machinery leases 5.09 Building leases 0.79 Farm insurance 5.27 Utilities 3.39 Dues & professional fees 2.51 Interest 3.69 Mach & bldg depreciation Miscellaneous 2.50 Total overhead expenses per acre Total dir & ovhd expenses per acre Net return per acre Government payments Net return with govt pmts Labor & management charge Net return over lbr & mgt Cost of Production Total direct expense per bu Total dir & ovhd exp per bu Less govt & other income 4.12 With labor & management 4.89 Net value per unit 6.74 Machinery cost per acre Est. labor hours per acre Annual Report Copyright (c) , Univ of Minnesota 24
33 25
34 Crop Enterprise Analysis Southwest Minnesota Farm Business Management Association (Farms Sorted By Net Return) Soybeans on Owned Land Avg. Of All Farms Low 20% High 20% Number of fields Number of farms Acres Yield per acre (bu.) Operators share of yield % Value per bu Total product return per acre Hedging gains/losses per acre Crop insurance per acre Other crop income per acre Gross return per acre Direct Expenses Seed Fertilizer Crop chemicals Crop insurance Irrigation energy Fuel & oil Repairs Custom hire Hauling and trucking Marketing Operating interest Miscellaneous Total direct expenses per acre Return over direct exp per acre Overhead Expenses Hired labor Machinery leases Building leases RE & pers. property taxes Farm insurance Utilities Dues & professional fees Interest Mach & bldg depreciation Miscellaneous Total overhead expenses per acre Total dir & ovhd expenses per acre Net return per acre Government payments Net return with govt pmts Labor & management charge Net return over lbr & mgt Cost of Production Total direct expense per bu Total dir & ovhd exp per bu Less govt & other income With labor & management Net value per unit Machinery cost per acre Est. labor hours per acre Annual Report Copyright (c) , Univ of Minnesota 26
35 Crop Enterprise Analysis Southwest Minnesota Farm Business Management Association (Farms Sorted By Net Return) Soybeans on Cash Rent Avg. Of All Farms Low 20% High 20% Number of fields Number of farms Acres Yield per acre (bu.) Operators share of yield % Value per bu Total product return per acre Hedging gains/losses per acre Crop insurance per acre Other crop income per acre Gross return per acre Direct Expenses Seed Fertilizer Crop chemicals Crop insurance Fuel & oil Repairs Custom hire Hired labor Land rent Machinery leases Hauling and trucking Marketing Operating interest Miscellaneous Total direct expenses per acre Return over direct exp per acre Overhead Expenses Hired labor Machinery leases Building leases Farm insurance Utilities Dues & professional fees Interest Mach & bldg depreciation Miscellaneous Total overhead expenses per acre Total dir & ovhd expenses per acre Net return per acre Government payments Net return with govt pmts Labor & management charge Net return over lbr & mgt Cost of Production Total direct expense per bu Total dir & ovhd exp per bu Less govt & other income With labor & management Net value per unit Machinery cost per acre Est. labor hours per acre Annual Report 27 Copyright (c) , Univ of Minnesota
36 Crop Enterprise Analysis Southwest Minnesota Farm Business Management Association (Farms Sorted By Net Return) Soybeans on Share Rent Avg. Of All Farms High 20% Number of fields 35 7 Number of farms 21 5 Acres Yield per acre (bu.) Operators share of yield % Value per bu Total product return per acre Hedging gains/losses per acre Crop insurance per acre Other crop income per acre Gross return per acre Direct Expenses Seed Fertilizer Crop chemicals Crop insurance Storage Irrigation energy Fuel & oil Repairs Custom hire Hauling and trucking Operating interest Miscellaneous Total direct expenses per acre Return over direct exp per acre Overhead Expenses Hired labor Machinery leases Building leases Farm insurance Utilities Dues & professional fees Interest Mach & bldg depreciation Miscellaneous Total overhead expenses per acre Total dir & ovhd expenses per acre Net return per acre Government payments Net return with govt pmts Labor & management charge Net return over lbr & mgt Cost of Production Total direct expense per bu Total dir & ovhd exp per bu Less govt & other income With labor & management Net value per unit Machinery cost per acre Est. labor hours per acre Annual Report Copyright (c) , Univ of Minnesota 28
37 29
FARM BUSINESS MANAGEMENT
 FARM BUSINESS MANAGEMENT 2009 Annual Report Central and West Central Minnesota April, 2010 A Management Education Program Minnesota State Colleges and Universities Ridgewater College VISIT OUR WEBSITE
The entire report is available at:
 2005 Annual Report Staff Paper P06-5 Department of Applied Economics University of Minnesota St. Paul, MN 55108 March 2006 The University of Minnesota is committed to the policy that all persons shall
The entire report is available at:
 The University of Minnesota is committed to the policy that all persons shall have equal access to its programs, facilities, and employment without regard to race, color, creed, religion, national origin,
The entire report is available at:
 The University of Minnesota is committed to the policy that all persons shall have equal access to its programs, facilities, and employment without regard to race, color, creed, religion, national origin,
2015 Michigan Dairy Farm Business Analysis Summary. Eric Wittenberg And Christopher Wolf. Staff Paper November, 2016
 2015 Michigan Dairy Farm Business Analysis Summary Eric Wittenberg And Christopher Wolf Staff Paper 2016-01 November, 2016 Department of Agricultural, Food, and Resource Economics MICHIGAN STATE UNIVERSITY
2008 Michigan Cash Grain Farm Business Analysis Summary. Eric Wittenberg And Stephen Harsh. Staff Paper November, 2009
 2008 Michigan Cash Grain Farm Business Analysis Summary Eric Wittenberg And Stephen Harsh Staff Paper 2009-11 November, 2009 Department of Agricultural, Food, and Resource Economics MICHIGAN STATE UNIVERSITY
2011 Michigan Cash Grain Farm Business Analysis Summary. Eric Wittenberg And Christopher A. Wolf. Staff Paper October, 2012
 2011 Michigan Cash Grain Farm Business Analysis Summary Eric Wittenberg And Christopher A. Wolf Staff Paper 2012-09 October, 2012 Department of Agricultural, Food, and Resource Economics MICHIGAN STATE
2014 Michigan Cash Grain Farm Business Analysis Summary. Eric Wittenberg And Christopher A. Wolf. Staff Paper December, 2015
 2014 Michigan Cash Grain Farm Business Analysis Summary Eric Wittenberg And Christopher A. Wolf Staff Paper 2015-07 December, 2015 Department of Agricultural, Food, and Resource Economics MICHIGAN STATE
2009 Michigan Dairy Farm Business Analysis Summary. Eric Wittenberg And Christopher Wolf. Staff Paper December, 2010
 2009 Michigan Dairy Farm Business Analysis Summary Eric Wittenberg And Christopher Wolf Staff Paper 2010-04 December, 2010 Department of Agricultural, Food, and Resource Economics MICHIGAN STATE UNIVERSITY
2015 Michigan Cash Grain Farm Business Analysis Summary. Eric Wittenberg And Christopher A. Wolf. Staff Paper November, 2016
 2015 Michigan Cash Grain Farm Business Analysis Summary Eric Wittenberg And Christopher A. Wolf Staff Paper 2016-02 November, 2016 Department of Agricultural, Food, and Resource Economics MICHIGAN STATE
2014 Michigan Dairy Farm Business Analysis Summary. Eric Wittenberg And Christopher Wolf. Staff Paper December, 2015
 2014 Michigan Dairy Farm Business Analysis Summary Eric Wittenberg And Christopher Wolf Staff Paper 2015-08 December, 2015 Department of Agricultural, Food, and Resource Economics MICHIGAN STATE UNIVERSITY
2007 Michigan Cash Grain Farm Business Analysis Summary. Eric Wittenberg And Stephen Harsh. Staff Paper December, 2008
 2007 Michigan Cash Grain Farm Business Analysis Summary Eric Wittenberg And Stephen Harsh Staff Paper 2008-07 December, 2008 Department of Agricultural, Food, and Resource Economics MICHIGAN STATE UNIVERSITY
2004 Michigan Dairy Farm Business Analysis Summary. Eric Wittenberg Christopher Wolf. Staff Paper September 2005
 Staff Paper 2004 Michigan Dairy Farm Business Analysis Summary Eric Wittenberg Christopher Wolf Staff Paper 2005-10 September 2005 Department of Agricultural Economics MICHIGAN STATE UNIVERSITY East Lansing,
2007 Michigan Dairy Farm Business Analysis Summary. Eric Wittenberg And Christopher Wolf. Staff Paper December, 2008
 2007 Michigan Dairy Farm Business Analysis Summary Eric Wittenberg And Christopher Wolf Staff Paper 2008-04 December, 2008 Department of Agricultural, Food, and Resource Economics MICHIGAN STATE UNIVERSITY
The entire report is available at:
 The University of Minnesota is committed to the policy that all persons shall have equal access to its programs, facilities, and employment without regard to race, color, creed, religion, national origin,
Appendix I Whole Farm Analysis Procedures and Measures
 Appendix I Whole Farm Analysis Procedures and Measures The whole-farm reports (except for the balance sheets) include the same number of farms, which were all of the farms whose records were judged to
2006 Michigan Dairy Grazing Farm Business Analysis Summary. Eric Wittenberg And Christopher Wolf. Staff Paper November, 2007
 2006 Michigan Dairy Grazing Farm Business Analysis Summary Eric Wittenberg And Christopher Wolf Staff Paper 2007-09 November, 2007 Department of Agricultural Economics MICHIGAN STATE UNIVERSITY East Lansing,
2007 Michigan Dairy Grazing Farm Business Analysis Summary. Eric Wittenberg And Christopher Wolf. Staff Paper December, 2008
 2007 Michigan Dairy Grazing Farm Business Analysis Summary Eric Wittenberg And Christopher Wolf Staff Paper 2008-5 December, 2008 Department of Agricultural, Food, and Resource Economics MICHIGAN STATE
Nicollet. Brown. Blue Earth. March TH 14 West Interregional Corridor: North Mankato to New Ulm
 15 Nicollet 111 12 99 15 Brown 14 23 Minnes 68 ota Rive r Blue Earth March 2003 TH 14 West Interregional Corridor: North Mankato to New Ulm 169 S.P. XXXX-XX Kittson Roseau Lake of the Woods Marshall Pennington
2017 Waste Pesticide Collection Program Legislative Report
 2017 Waste Pesticide Collection Program Legislative Report Stan Kaminski, 651-201-6562 625 Robert St. N., St. Paul, MN 55155 www.mda.state.mn.us March 15, 2018 1 Table of Contents Executive Summary...
North Dakota Farm Bureau North Dakota Farmers Union Monsanto 1 Star in Star Partner Program
 North Dakota Department of Career and Technical Education Mr. Wayne Kutzer, State Director Board Members Mr. Darrel Remington, Chairperson Mr. Jeffrey Lind, Vice Chairperson Ms. Maren Daley Mr. Brian Duchscherer
Grain Production Projections
 n N r JOO..; f Grain Production Projections by County and District, Minnesota, 1980 and 1985 Michael Martin Reynold Dahl Station Bulletin 518-1977 Agricultural Experiment Station University of Minnesota
2017 Ohio Farm Business Summary
 OHIO STATE UNIVERSITY EXTENSION 2017 Ohio Farm Business Summary Crop Enterprise Analysis with Benchmark Reports farmprofitability.osu.edu Our Thanks To: The professionals who worked with farms and completed
2009 Organic Farm Performance
 This document is made available electronically by the Minnesota Legislative Reference Library as part of an ongoing digital archiving project. http://www.leg.state.mn.us/lrl/lrl.asp 2009 Organic Farm Performance
1995 Annual Report. Southeastern Minnesota Farm Business \ Management Association COOPERATING AGENCIES:
 1995 Annual Report Southeastern Minnesota Farm Business \ Management Association COOPERATING AGENCIES: University of Minnesota, Institute of Agriculture, Forestry, and Home Economics County Extension Services
Basin Electric Power Cooperative CHS Foundation North Dakota Farm Bureau North Dakota Farmers Union
 North Dakota Department of Career and Technical Education Mr. Wayne Kutzer, State Director Board Members Mr. Darrel Remington, Chairperson Mr. Jeffrey Lind, Vice Chairperson Ms. Maren Daley Mr. Brian Duchscherer
2016 ANNUAL REPORT Western North Dakota
 2016 ANNUAL REPORT Western North Dakota North Dakota Farm and Ranch Business Management Education www.ndfarmmanagement.com Cover photo courtesy of Lynsey Aberle, Norwich, ND North Dakota Department of
Survey Results of Nitrogen Fertilizer BMPs on Minnesota s 2013 Corn Acres
 Survey Results of Nitrogen Fertilizer BMPs on Minnesota s 2013 Corn Acres Minnesota Department of Agriculture USDA, NASS, Minnesota Field Office December 2015 625 Robert Street North St. Paul, MN 55155-2538
Report on Minnesota Farm Finances. April, 2010
 2009 Report on Minnesota Farm Finances April, 2010 Acknowledgements: Contributing Minnesota producers Minnesota State Colleges and Universities Farm Business Management Education Program Southwestern Minnesota
North Dakota Farm Bureau North Dakota Farmers Union
 North Dakota Department of Career and Technical Education Mr. Wayne Kutzer, State Director Board Members Mr. Darrel Remington, Chairperson Mr. Jeffrey Lind, Vice Chairperson Ms. Maren Daley Mr. Brian Duchscherer
2006 Iowa Farm Costs. and Returns File C1-10. Ag Decision Maker. Definition of Terms Used
 2006 Iowa Farm Costs Ag Decision Maker and Returns File C1-10 The farm record data utilized in this report were obtained from the Iowa Farm Business Associations. The average of all farms in each table
2013 ANNUAL REPORT Region 2
 2013 ANNUAL REPORT Region 2 North Dakota Farm and Ranch Business Management Education Regional Reporting Areas www.ndfarmmanagement.com North Dakota Department of Career and Technical Education Mr. Wayne
Report on Minnesota Farm Finances. August, 2009
 2008 Report on Minnesota Farm Finances August, 2009 Acknowledgements: Contributing Minnesota producers Minnesota State Colleges and Universities Farm Business Management Education Program Southwestern
2014 ANNUAL REPORT South Central North Dakota
 2014 ANNUAL REPORT South Central North Dakota North Dakota Farm and Ranch Business Management Education www.ndfarmmanagement.com North Dakota Department of Career and Technical Education Mr. Wayne Kutzer,
2014 ANNUAL REPORT North Central North Dakota
 2014 ANNUAL REPORT North Central North Dakota North Dakota Farm and Ranch Business Management Education www.ndfarmmanagement.com North Dakota Department of Career and Technical Education Mr. Wayne Kutzer,
2017 ANNUAL REPORT South Central North Dakota
 2017 ANNUAL REPORT South Central North Dakota North Dakota Farm and Ranch Business Management Education www.ndfarmmanagement.com North Dakota Department of Career and Technical Education Mr. Wayde Sick,
Report on 2015 SCORE Programs. A summary of recycling and waste management in Minnesota
 Report on 2015 SCORE Programs A summary of recycling and waste management in Minnesota April 2017 Legislative charge In 1989, the Legislature adopted comprehensive waste reduction and recycling legislation
State Farm Business Management Program Database. Crop Farm Sort
 Minnesota State Colleges and Universities State Farm Business Management Program Database - 2015 Financial Summary by Gross Farm Income Financial Summary by Crop Acres Financial Standards Measures by Gross
2016 ANNUAL REPORT South Central North Dakota
 2016 ANNUAL REPORT South Central North Dakota North Dakota Farm and Ranch Business Management Education www.ndfarmmanagement.com North Dakota Department of Career and Technical Education Mr. Wayne Kutzer,
THE BENEFITS OF FINANCIAL BENCHMARKING TO FARMERS IN THE UNITED STATES
 THE BENEFITS OF FINANCIAL BENCHMARKING TO FARMERS IN THE UNITED STATES Robert Craven, Dale Nordquist and Kevin Klair Center for Farm Financial Management, University of Minnesota Abstract Benchmarking
2013 Ohio Farm Business Analysis
 2013 Ohio Farm Business Analysis Dairy Enterprise Analysis Summary Including Benchmark Reports For information on participating in the Ohio Farm Business Analysis program analyzing your farm s 2014 performance,
2012 ANNUAL REPORT State Averages
 2012 ANNUAL REPORT State Averages North Dakota Farm and Ranch Business Management Education Regional Reporting Areas www.ndfarmmanagement.com North Dakota Department of Career and Technical Education Mr.
Cash Flow and Enterprise Information - step two for your 2016 farm analysis
 1 of 24 Name Address County Phone Email Year Born Year Started Farming Cash Flow and Enterprise Information - step two for your 2016 farm analysis Now that you have a beginning and an ending balance sheet,
Crop Farm Sort
 Farm Business Management Program Database - 2017 Financial Summary by Gross Farm Income & Crop Acres Corn & Soybean Enterprise Data Selected Precision Technology and Tillage Data April, 2018 Average Dollars
MINNESOTA STATE SECTION NOTICE TO BIDDERS AFFIRMATIVE ACTION CERTIFICATE OF COMPLIANCE
 NOTICE TO BIDDERS AFFIRMATIVE ACTION CERTIFICATE OF COMPLIANCE Minnesota State intends to carry out its responsibility for requiring affirmative action by its CONTRACTORS. a. Covered Contracts and CONTRACTORS.
ANALYSIS OF PUBLIC SERVICE ENTERPRISES
 ANALYSIS OF Name of County Pop. TABLE 4 ANALYSIS OF HEALTH SERVICES ENTERPRISE OPERATIONS NON Principal BECKER 30,646 NURSING HOME [3] 2,638,520 2,477,880 160,640 12,501 --- 173,141 --- --- --- --- 37,664
Minnesota Transportation Maps
 Minnesota Transportation Maps MN Official Highway Map Front SLOW DOWNLOAD): http://www.dot.state.mn.us/statemap/2017/map-front.pdf MN Official Highway Map Back SLOW DOWNLOAD): http://www.dot.state.mn.us/statemap/2017/map-back.pdf
STATE OF MINNESOTA. Office of the State Auditor. Rebecca Otto State Auditor TAX INCREMENT FINANCING LEGISLATIVE REPORT
 STATE OF MINNESOTA Office of the State Auditor Rebecca Otto State Auditor TAX INCREMENT FINANCING LEGISLATIVE REPORT TIF Reports for the Year Ended December 31, 2015 TIF Audits Concluded for the Year Ended
2017 FINBIN Report on Minnesota Farm Finances
 Acknowledgements: Contributing Minnesota producers Minnesota Farm Business Management Education, Minnesota State Southwestern Minnesota Farm Business Management Association Thank you to Brittni Lamoreux
A Protocol for Identifying Suitable Testing & Deployment Sites of Poplar Energy Production Systems in the Midwest, USA
 A Protocol for Identifying Suitable Testing & Deployment Sites of Poplar Energy Production Systems in the Midwest, USA Ronald S. Zalesny Jr. 1, Deahn M. Donner 1, David R. Coyle 2, William L. Headlee 3,
2014 ANNUAL REPORT State Averages
 2014 ANNUAL REPORT State Averages North Dakota Farm and Ranch Business Management Education www.ndfarmmanagement.com North Dakota Department of Career and Technical Education Mr. Wayne Kutzer, State Director
Agriculture & Business Management Notes...
 Agriculture & Business Management Notes... SPA Standardized Performance Analysis For Cow/Calf Producers -- A Worksheet Approach -- Cow/calf producers have been challenged to be lower cost producers, to
The sales price for Pasture equivalents is zero. Check the feed prices on the last section of the Budgets.
 File: M&m FINFLO 2006 Warning The sales price for Pasture equivalents is zero. Check the feed prices on the last section of the Budgets. Max and Marlene Profit FINLRB: Succession example Anyplace, Eastern
PUBLIC SERVICE ENTERPRISE TABLES
 PUBLIC SERVICE ENTERPRISE TABLES Aitkin Long Lake Conservation Center 775,049 951,195 (176,146) 69,895 2,000 (108,251) --- --- 1,888 --- 37,693 --- --- --- 775,049 951,195 (176,146) 69,895 2,000 (108,251)
STATE OF MINNESOTA Office of the State Auditor
 STATE OF MINNESOTA Office of the State Auditor Patricia Anderson State Auditor TAX INCREMENT FINANCING LEGISLATIVE REPORT TIF Reports For the Year Ended December 31, 2004 TIF Audits Concluded For the Year
~il~~:~~ii~!. ~...~: {(.~i. !!.~I~ji!': i~i( l:;i;!i:i;i;i:::-: :: C: ..::::)~::m~:l::::t:m:;::;;%::;:!;:;:;:j;.:;:;::::;::j::j:j\:;..
~::m~:l::::t:m:;::;;%::;:!;:;:;:j;.:;:;::::;::j::j:j\:;..") May 1983 A.E. Ext. 83-10 ~il~~:~~ii~!. ~...~:..::::)~::m~:l::::t:m:;::;;::;:!;:;:;:j;.:;:;::::;::j::j:j\:;.. ;/::@H::;j'::;{:: ::::;:;:;:;:::;:::::::::::::;: ::::::;:::::;:;:::;:::::;::::: ~ ~::: ~: ~:
May 1983 A.E. Ext. 83-10 ~il~~:~~ii~!. ~...~:..::::)~::m~:l::::t:m:;::;;::;:!;:;:;:j;.:;:;::::;::j::j:j\:;.. ;/::@H::;j'::;{:: ::::;:;:;:;:::;:::::::::::::;: ::::::;:::::;:;:::;:::::;::::: ~ ~::: ~: ~:
PUBLIC SERVICE ENTERPRISES TABLES
 PUBLIC SERVICE ENTERPRISES TABLES Table 3 Analysis of Health Services Enterprise Operations NON Revenues Becker 32,256 Sunnyside Care Center [3] 3,201,349 3,056,793 144,556 13,573 59,498 98,631 --- ---
Analysis of rain samples for Phakopsora pachyrhizi
 Analysis of rain samples for Phakopsora pachyrhizi Les J. Szabo Charlie Barnes USDA ARS Cereal Disease Lab Dept. of Plant Pathology University of Minnesota St. Paul, Minnesota Van Bowersox NADP Illinois
2012 STATE FFA FARM BUSINESS MANAGEMENT TEST PART 2. Financial Statements (FINPACK Balance Sheets found in the resource information)
") 2012 STATE FFA FARM BUSINESS MANAGEMENT TEST PART 2 Financial Statements (FINPACK Balance Sheets found in the resource information) Please use the Market Value when making the calculations for the Zimmerman
2012 STATE FFA FARM BUSINESS MANAGEMENT TEST PART 2 Financial Statements (FINPACK Balance Sheets found in the resource information) Please use the Market Value when making the calculations for the Zimmerman
2016 ANNUAL REPORT State Averages North Dakota Farm and Ranch Business Management Education
 2016 ANNUAL REPORT State Averages North Dakota Farm and Ranch Business Management Education www.ndfarmmanagement.com North Dakota Department of Career and Technical Education Mr. Wayne Kutzer, State Director
PUBLIC SERVICE ENTERPRISE TABLE
 PUBLIC SERVICE ENTERPRISE TABLE Aitkin Long Lake Conservation Center 586,545 804,032 (217,487) 21,145 3,909 (200,251) --- --- --- --- 367,570 --- --- --- 586,545 804,032 (217,487) 21,145 3,909 (200,251)
Report on Minnesota Farm Finances. May, 2017
 2016 Report on Minnesota Farm Finances May, 2017 Acknowledgements: Contributing Minnesota producers Minnesota Farm Business Management Education, Minnesota State Southwestern Minnesota Farm Business Management
PUBLIC SERVICE ENTERPRISE TABLES
 PUBLIC SERVICE ENTERPRISE TABLES Aitkin Revenue Expense Income Revenue Expense Net Income Taxes Long Lake Conservation Center 652,519 886,371 (233,852) 18,439 --- (215,413) --- 1,888 --- --- 9,507 ---
The data for this report were collected by Iowa Farm Business Association consultants and compiled by Iowa State University Extension and Outreach.
 2016 Cash Iowa Rental Farm Rates Costs for Iowa Ag Decision Maker Returns 2015 Survey File C1-10 The farm record data utilized in this report were obtained from the Iowa Farm Business Association. The
2008 Organic Farm Performance in Minnesota
 This document is made available electronically by the Minnesota Legislative Reference Library as part of an ongoing digital archiving project. http://www.leg.state.mn.us/lrl/lrl.asp 2008 Organic Farm Performance
MILK PRODUCTION COSTS in 1998 on Selected WISCONSIN DAIRY FARMS
 MILK PRODUCTION COSTS in 1998 on Selected WISCONSIN DAIRY FARMS by Gary Frank and Jenny Vanderlin 1 July 23, 1999 Introduction Total cost of production per hundredweight equivalent of milk ($14.90) was
Agriculture has historically been an
 Agricultural Economics Report No. 395-S May 1998 Economic Contribution of the Sugarbeet Industry to North Dakota and Minnesota Dean A. Bangsund F. Larry Leistritz Agriculture has historically been an important
2011 STATE FFA FARM BUSINESS MANAGEMENT TEST PART 2. Financial Statements (FINPACK Balance Sheets found in the resource information)
") 2011 STATE FFA FARM BUSINESS MANAGEMENT TEST PART 2 Financial Statements (FINPACK Balance Sheets found in the resource information) Please use the Market Value when making the calculations for the Zimmerman
2011 STATE FFA FARM BUSINESS MANAGEMENT TEST PART 2 Financial Statements (FINPACK Balance Sheets found in the resource information) Please use the Market Value when making the calculations for the Zimmerman
MILK PRODUCTION COSTS and SELECTED FINANCIAL BENCHMARKS FROM 978 WISCONSIN DAIRY FARMS
 1996 1 MILK PRODUCTION COSTS and SELECTED FINANCIAL BENCHMARKS FROM 978 WISCONSIN DAIRY FARMS by Gary Frank and Jenny Vanderlin 2 August 27, 1997 Introduction In this study of 1996 records, 978 dairy farms
2007 ORGANIC FARM PERFORMANCE IN MINNESOTA
 2007 ORGANIC FARM PERFORMANCE IN MINNESOTA PROJECT PARTNERS www.mda.state.mn.us 651-201-6012 www.cffm.umn.edu 800-234-1111 Organic Crop Improvement Association Minnesota Chapter #1 www.mnocia.org 218-253-4907
L Kansas State University (I. Department of Agricultural Economi<ii} FARM MANAGEMENT DATA BANK DOCUMENTATION LARRY N. LANGEMEIER--
 FARM MANAGEMENT DATA BANK DOCUMENTATION LARRY N. LANGEMEIER-- April 1990 No. 90-10 Department of Agricultural Economi
FY 2016 DAIRY DEVELOPMENT AND PROFITABILITY ENHANCEMENT LEGISLATIVE REPORT. David Weinand Robert Street North St.
 FY 06 DAIRY DEVELOPMENT AND PROFITABILITY ENHANCEMENT LEGISLATIVE REPORT David Weinand 65-0-6646 65 Robert Street North St. Paul, MN 5555 www.mda.state.mn.us CONTENTS EXECUTIVE SUMMARY.................
2016 Ohio Farm Business Summary
 OHIO STATE UNIVERSITY EXTENSION 2016 Ohio Farm Business Summary Dairy Enterprise Analysis with Benchmark Reports Our Thanks To: The professionals who worked with farms and completed the analyses included
Our Thanks To: The professionals who worked with farms and completed the analyses included in this summary:
 Our Thanks To: The professionals who worked with farms and completed the analyses included in this summary: Christina Benton, Program Assistant, Ohio State University Extension Haley Drake, Program Coordinator,
Economics 330 Fall 2005 Exam 1. Strategic Planning and Budgeting
 Economics 330 Fall 2005 Exam 1 K E Y Strategic Planning and Budgeting Circle the letter of the best answer. You may put a square around the letter of your second choice. If your second choice is right,
3. Dairy Production Data: 3.1. Year-end milk check showing total pounds of milk sold for the year DHIA Herdcode
 Dairy Cash Flow Plan extension.psu.edu Annual Cash Flow Checklist: 1. Historical Financial Data: 1.1. 2015 Income & Expenses Bring print out from computer or paper record book if possible 1.2. 2015 Schedule
Minnesota Logged Area Residue Analysis
 Minnesota Logged Area Residue Analysis Minnesota Department of Natural Resources Division of Forestry Utilization and Marketing Program August 2006 *Corrected April 2007* Project Lead, Chief Report Author
2011 Missouri FBMA Farm Record Analysis Closeout Procedures
 2011 Missouri FBMA Farm Record Analysis Closeout Procedures Dr. Norman Rohrbach Farm Business Management Specialist University of Missouri 116 Gentry Hall Columbia, MO 65211-7040 573-882-7379 INTRODUCTION
Dairy Development and Profitability Enhancement
 FY 03 LEGISLATIVE REPORT Dairy Development and Profitability Enhancement David Weinand, 65-0-6646 65 Robert St. N., St. Paul, MN 5555 www.mda.state.mn.us FY 03 Dairy Development and Profitability Enhancement
Farm Record Analysis. Closeout. Procedures
 2017 Farm Record Analysis Closeout Procedures Dec. 14, 2017 ii Introduction This manual was developed to assist in the standardization of data collection and entry for Farm Business Management Annual Analysis
Minnesota Department of Agriculture USDA, NASS, Minnesota Field Office
 This document is made available electronically by the Minnesota Legislative Reference Library as part of an ongoing digital archiving project. http://www.leg.state.mn.us/lrl/lrl.asp Minnesota Department
Revenue Components. Yield Government Programs Crop Insurance
 Farm Financial Conditions 25th Annual Crop Insurance Conference January 22, 2018 Fargo, ND Andrew Swenson Extension Farm Management Specialist Department of Agribusiness and Applied Economics North Dakota
Evaluating Proposed Stormwater Infiltration Projects in Vulnerable Wellhead Protection Areas. Minnesota Department of Health
 Evaluating Proposed Stormwater Infiltration Projects in Vulnerable Wellhead Protection Areas Minnesota Department of Health Introduction Infiltration is widely promoted because it is a practice with demonstrated
MN EPHT Brownbag Series April 12, Development of Environmental Health Indicators of Climate Change
 MN EPHT Brownbag Series April 12, 2010 Development of Environmental Health Indicators of Climate Change Road Map Background Building Capacity in MN EPH Tracking & Indicators Example Indicators (heat &
Legislative Report March 15, Serving Minnesota Farms, Minnesota Businesses and Minnesota Households
 This document is made available electronically by the Minnesota Legislative Reference Library as part of an ongoing digital archiving project. http://www.leg.state.mn.us/lrl/lrl.asp Waste Pesticide id
HAPPY HOLIDAYS December 2016
 Don Nitchie Tonya Knorr Garen Paulson HAPPY HOLIDAYS December 2016 Inside this newsletter: Educational Activities 1099 & W-2 Reminders Preparing for Your Analysis There s an App for That! Educational Activities
Managing For Today s Cattle Market And Beyond: A Comparative Analysis Of ND - Demo Cow Herd To North Dakota Database
 Managing For Today s Cattle Market And Beyond: A Comparative Analysis Of ND - Demo - 160 Cow Herd To North Dakota Database By Harlan Hughes Extension Livestock Economist Dept of Agricultural Economics
Managing For Today s Cattle Market And Beyond A Comparative Analysis Of Demo Herd 1997 Herd To McKenzie County Database
 Managing For Today s Cattle Market And Beyond A Comparative Analysis Of Demo Herd 1997 Herd To McKenzie County Database By Harlan Hughes Extension Livestock Economist Dept of Agricultural Economics North
Institute of Ag Professionals
 Institute of Ag Professionals Proceedings of the 2012 Crop Pest Management Shortcourse & Minnesota Crop Production Retailers Association Trade Show www.extension.umn.edu/agprofessionals Do not reproduce
Farm Record Analysis. Closeout. Procedures
 2016 Farm Record Analysis Closeout Procedures January 4, 2017 ii Introduction This manual was developed to assist in the standardization of data collection and entry for Farm Business Management Annual
BUSINESS SUMMARY DAIRY FARM NEW YORK SMALL HERD FARMS, 80 COWS OR FEWER 2002 PARTICIPANT COPY OCTOBER 2003 E.B
 OCTOBER 2003 E.B. 2003-18 DAIRY FARM BUSINESS SUMMARY NEW YORK SMALL HERD FARMS, 80 COWS OR FEWER 2002 Wayne A. Knoblauch Linda D. Putnam Mariane Kiraly Jason Karszes PARTICIPANT COPY Department of Applied
A. Circle the best answer. Put a square around your second choice, if you want. If your second choice is correct you get half credit.
 Economics 330 Exam 1 Fall 2007 Farm Budgeting and Planning K E Y A. Circle the best answer. Put a square around your second choice, if you want. If your second choice is correct you get half credit. (4
BUSINESS SUMMARY DAIRY FARM NEW YORK SMALL HERD FARMS, 70 COWS OR FEWER 2000 AUGUST 2001 E.B
 AUGUST 2001 E.B. 2001-10 DAIRY FARM BUSINESS SUMMARY NEW YORK SMALL HERD FARMS, 70 COWS OR FEWER 2000 Wayne A. Knoblauch Linda D. Putnam Mariane Kiraly Jason Karszes Department of Applied Economics and
STATE OF MINNESOTA. Office of the State Auditor. Rebecca Otto State Auditor TAX INCREMENT FINANCING LEGISLATIVE REPORT
 STATE OF MINNESOTA Office of the State Auditor Rebecca Otto State Auditor TAX INCREMENT FINANCING LEGISLATIVE REPORT TIF Reports for the Year Ended December 31, 2011 TIF Audits Concluded for the Year Ended
2015 Missouri FBMA Farm Record Analysis Closeout Procedures
 2015 Missouri FBMA Farm Record Analysis Closeout Procedures Bruce Fowler Farm Business Management Specialist University of Missouri 116 Gentry Hall Columbia, MO 65211-7040 573-882-7379 1 INTRODUCTION This
Report on Minnesota Farm Finances. April, 2015
 2014 Report on Minnesota Farm Finances April, 2015 Acknowledgements: Contributing Minnesota producers Minnesota State Colleges and Universities Farm Business Management Education Program Southwestern Minnesota
Highlights from the 2007 North Dakota Region 4 Averages
 Highlights from the 2007 North Dakota Region 4 Averages Overview for Region 4 The western part of North Dakota had a good year for crop production with an overall increase in yields and increases in prices.
BUSINESS SUMMARY DAIRY FARM NEW YORK SMALL HERD FARMS, 140 COWS OR FEWER, 2013 JULY 2014 E.B
 DAIRY FARM BUSINESS SUMMARY JULY 2014 E.B. 2014-07 NEW YORK SMALL HERD FARMS, 140 COWS OR FEWER, 2013 Wayne A. Knoblauch Cathryn Dymond Jason Karszes Mariane Kiraly Charles H. Dyson School of Applied Economics
2017 Ohio Farm Business Summary
 OHIO STATE UNIVERSITY EXTENSION 2017 Ohio Farm Business Summary Dairy Enterprise Analysis with Benchmark Reports farmprofitability.osu.edu Our Thanks To: The professionals who worked with farms and completed
Economic, Productive & Financial Performance Of Alberta Cow/Calf Operations
 Benchmarks for Cattlemen Economics & Competitiveness Economic, Productive & Financial Performance Of Cow/Calf Operations Southern Fescue land, Mixed land & Moist Mixed land Production Year - 2002 Jan.