ARKLEMS+LAND DATABASE 3.0
|
|
|
- Harold Anderson
- 6 years ago
- Views:
Transcription


1 ARKLEMS+LAND DATABASE 3.0 Measuring Productivity in Unstable and Natural Resource Dependent Economies: ARGENTINA Second World KLEMS Conference Harvard University Cambridge, Massachusetts, August 9-10,
2 THE ARGENTINA PRODUCTIVITY SLOWDOWN Findings of ARKLEMS + LAND Series 3.0 (updating ) Ariel Coremberg ARKLEMS+LAND acoremb@econ.uba.ar Methodological And Empirical Issues for Unstable and Natural Resource Dependent Economies
3 MAIN TOPICS OF RESEARCH Sources of Growth, Productivity and Competitiveness (ARKLEMS+LAND) SNA, I-O Matrix, Regional GDP PPP World Bank Project Natural Resource Sustainability Wealth, National Balance Sheet: Measurement Issues and Vulnerability Analysis of Financial Crisis and Real effects on LAC and Emerging Economies
4 OBJECTIVES AND METHODOLOGY
5 WHY PRODUCTIVITY IS IMPORTANT GROWTH: More Productivity improves the sustainability of Long Run Growth WELFARE: Improvement in Living Standards and Welfare. LABOR MARKET: Moderate distributional conflict. Allows sustainable wage increases without pushing inflation. Measures Labor Skills and Income Distribution. MONETARY POLICY: OUTPUT GAP: It allows to measure the Potential Productive Capacity of a Country, Sector or firm COMPETITIVENESS: Increase Real Exchange Rate without resorting to sudden devaluations.
6 OBJECTIVES IDENTIFICATION OF GROWTH PROFILE OF ARG. METHODOLOGICAL ISSUES KLEMS METHOD. TO INDENTIFY SOURCE OF GROWTH SPECIFIC ISSUES FOR LAC AND ARGENTINA: peak to peak analyses, informal labor, natural resource MACROECONOMIC CONTEXT: 1990 S vs POSTCRISIS 2002 PERIOD CAPITAL, LABOR, HK, NR, SECTORAL ORIGINS OF TFP SIDE ISSUES: LABOR COSTS, OUTPUT GAP
7 METHODS AND SERIES FOR SOURCE OF GROWTH 1 CAPITAL SERVICES BY ASSET TYPE AND INDUSTRY Exhaustive Measurement of Capital Services from more than 80 assets types Testing Functional Shapes of Depreciation (Hulten&Wycof approach) Hedonic Valuation of Capital Stock Testing Alternative Age&Efficiency Profiles and User Costs on Capital Services Revision by Economic and Housing Census 2004, 2010 ICT: price harmonization method (EUKLEMS, Schreyer, Mas & Quesada, etc.) Updating and revision of Supply and Use tables: material, services and energy inputs
8 METHODS AND SERIES FOR SOURCE OF GROWTH 2 Non Observed Economy + Informal L market HUMAN CAPITAL: Gender, Experience, Education and Occupational Categories (reg and non registered employees, informal self-employed, etc. hours worked in more than 70 skills groups: ) LABOR QUALITY INDEX (BLS, Jorgenson-Ho, EUKLEMS) PRODUCTIVE HUMAN CAPITAL (Mulligan-Sala i Martin) WEALTH HUMAN CAPITAL (Jorgenson-Fraumeni Approach) NATURAL RESOURCE : Agricultural Land and Subsoil Assets as wealth and service input Peak to Peak TFP: K, L Utilization in the GDP Cycle
9 METHODS AND SERIES FOR SOURCE OF GROWTH AND WEALTH ANAYSIS 3 TORNQUIST INDEX OUTPUT AND VALUE ADDED PRODUCTIVITY TREATMENT OF CYCLICAL AND RECOVERY EFFECTS ON PRODUCTIVITY PERFORMANCE INDUSTRY ORIGIN OF TFP GROWTH (Jorgenson, Samuels &Stiroh: Domar Weights) SECTORAL PATTERNS OF PRODUCTIVITY PERFORMANCE: shift share analyses of within, between, cross sectoral effects FIRM PRODUCTIVITY DYNAMICS (work in progress with World Bank): within, reallocation, net entry firm effects
10 ARKLEMS+ Stylized facts of Unstable Natural Resource Rich Economies: LAC & AR NR (agricultural land and subsoil assets) Non Observed Economy (NOE) Informal Labor Markets: Occupational Categories Effect of Terms of Trade Effects of Macroeconomic Instability and the crisis over Productivity and Growth. Infrastructures

11 UPDATING 2010
12 Expectations about Economic Policy in the last decades 1990 PROMARKET & CONVERTIBILITY MACRO REGIME Trade Openness: Embodied Tech.+ICT + FDI spillovers Lower RER ICT spillovers & TFP gains in Non-Tradables enough to Sustain Long run GDP growth POST02CRISIS: COMPETITIVE RER REGIME Import Substitution Demand Driven Growth and now Inflation High RER & +TT (Commodities Boom: +China+Dollar Devaluation) Currency Board as Inconsistent Political Economy: not enough flex to external shocks TFP gains in Tradables enough to Sustain Long run GDP growth
13 Agricultural Commodities Prices Multilateral Exchange Rate USA Interest rate ref. (FFER) FFER interest rate USA Multilateral Exchange Rate Energy Agricultural Commodities Metals Source: ARKLEMS, FR, WorldBank
14 Real Income by Ocupational Category ,0% ,0% ,0% Share Regist.Employment Registered Employees Non-Registered Employees Self-employed 70,0% ,0% ,0% Source: ARKLEMS 40,0%
15 REAL EXCHANGE RATE ARGENTINA Bilateral with u$s and Multilateral 2001= ,5 RER bilateral 2 RER MULTILATERAL 1,5 1 0, Source: ARKLEMS based on Central Bank and alternative sources

16
17 Latinamerica GDP Growth (%) Argentina -18,36 Uruguay -17,69 Venezuela -8,12 Paraguay -2,86 Colombia 2,76 Ecuador Latinamerica Bolivia Brasil Perú Chile Méjico 6,83 6,41 7,28 8,76 9,34 9,54 11,
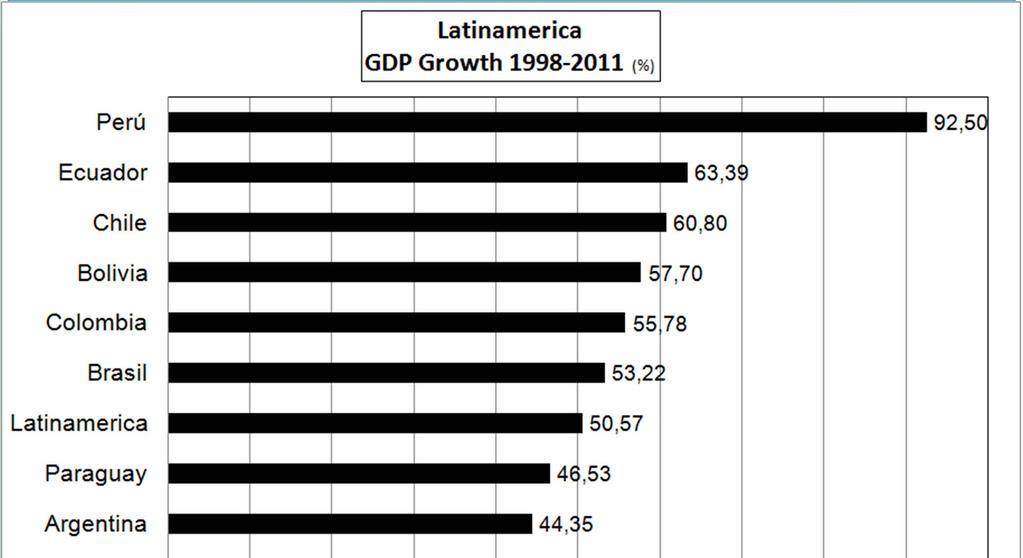
18 Latinamerica GDP Growth (%) Perú Argentina Uruguay 70,7 73,4 76,1 Ecuador Colombia Paraguay Venezuela Bolivia Chile 52,9 51,6 50,8 50,4 47,0 46,8 LatinAmerica Brasil 41,5 40,9 Méjico 23,
19 America Latina Inflation (Average Annual Rate) (%) Venezuela 578,7% Argentina CPI pcies 259,9% Argentina CPI gba Uruguay Paraguay Brasil Bolivia Colombia Ecuador México Chile Perú 117,7% 107,8% 92,9% 74,5% 70,5% 54,4% 46,9% 45,5% 33,3% 27,8% 0% 100% 200% 300% 400% 500% 600% 700%
20 Is the Present Economic Growth Profile based on Commodities Export Boom Sustainable in The Long Run? Is there Enough TFP gains to sustain Demand Driven Growth under inflation and Appreciation of Domestic Currency?
21 ARGENTINEAN SOCIETY HAS NO EXPOST SATISFACTION ON ARGENTINE GROWTH What are the signals from ARKLEMS Measurement of the Growth Profile and Productivity?
22 U2 7,0% SOURCE OF ARGENTINA ECONOMIC GROWTH -Annual Contribution- 6,0% GDP, 5,5% GDP, 5,7% 0,5% 5,0% 1,0% 4,0% 2,8% GDP, 3,3% GDP, 3,5% 3,0% 2,3% GDP, 2,2% 1,7% 1,8% 2,0% 1,4% 1,0% 2,2% 2,4% 1,4% 1,8% 1,7% 0,0% -0,6% -0,2% 0,0% -1,0% Source: ARKLEMS+LAND K input L input Strict TFP GDP
23 Slide 22 U2 Ver si hablar primero de Fuentes del Labor o de GDP Usuario, 11/2/2011
24 3,0% SOURCE OF ARGENTINA CAPITAL SERVICE INPUT CONTRIBUTION -Annual Contribution- 2,5% 2,0% 1,5% 1,5% 1,4% 1,0% 1,1% 1,2% 1,2% 0,5% 0,5% 0,5% 0,0% 0,3% 0,4% 0,4% -0,1% 0,5% 0,4% 0,0% 0,1% -0,5% Source: ARKLEMS+LAND Utilisation effect ICT Non ICT Natural Resource
25 113,0% CAPITAL SERVICE GROWTH BY ASSET TYPE Shares 93,0% 73,0% Residential Structure Public Infraestructure Private Nresidential Structures 53,0% 33,0% Imported Equipment 13,0% Domestic Equipment -7,0% Domestic Equipment Imported Equipment Private Nresidential Structures Public Infraestructure Subsoil Assets Other Agricultural Assets Agricultural Land Residential Structure Source: ARKLEMS+LAND
26 ARGENTINA LABOR INPUT CONTRIBUTION BY COMPONENT -Annual Contribution- 3,0% 2,5% 0,6% 2,0% 0,3% 1,0% 1,5% 0,7% 1,0% 0,8% 1,0% 0,5% 1,9% 0,1% 0,2% 0,5% 0,9% 0,9% 0,6% 0,9% 0,0% -0,2% -0,5% Source: ARKLEMS+LAND Jobs Labour Intensity Labour Composition Change
27 SOURCE OF ARGENTINA ECONOMIC GROWTH -Annual Contribution- 7,0% 6,0% 5,0% 4,0% 3,0% 2,0% Long Run Effects Short Run Cyclical Effects GDP, 5,50% GDP, 5,73% Strict TFP, 0,96% Labour Composition Change 1,1% Labour Intensity 0,5% Utilisation K Effect, 0,3% Jobs 0,9% Productivity Gains Long Run Effects Short Run Cyclical Effects Strict TFP, 0,49% Labour Composition Change 0,7% Labour Intensity 0,3% Utilisation K Effect, 0,4% Jobs 2,0% Productivity Gains 1,0% NonICT Capital 1,4% NonICT Capital 1,5% 0,0% ICT Capital 0,5% ICT Capital 0,5% -1,0% Source: ARKLEMS+LAND
28 115 TOTAL FACTOR PRODUCTIVITY OF ARGENTINA 1993= Strict TFP (adj. by input utilisaton and labour quality) Apparent TFP1 (without any adj.) Source: ARKLEMS+LAND
29 15,0% LABOUR INPUT IN ARGENTINA 1993=100 10,0% 5,0% 0,0% ,0% -10,0% Hours Worked Jobs -15,0% Source: ARKLEMS+LAND
30 130 LABOUR PRODUCTIVITY IN ARGENTINA 1993= Labour Productivity by Hours Worked 80 Labor Productivity by Jobs Source: ARKLEMS+LAND
31 SOURCE OF ARGENTINA s LABOUR PRODUCTIVITY GROWTH -Annual Contributions- 3,0% Labour Productivity, 2,6% 2,5% Labour Productivity, 1,6% 2,0% 1,0% 1,5% Labour Productivity, 1,1% Labour Productivity, 0,6% 1,0% Labour Productivity, 0,9% 1,0% 1,0% 0,5% 0,7% 0,5% 0,6% 0,6% 0,6% 0,9% 0,8% 0,0% -0,5% 0,0% -0,6% -0,2% 0,1% 0,0% -1,0% Capital Intensity Labour Composition Change Source: ARKLEMS+LAND strict TFP (adj. input utilisation and labor quatlity) Labour Productivity L q ARG is the main input that explained Labor Productivity BUT TFP SLOWDOWN: HK COULD BE WASTED
32 12% SOURCE OF ECONOMIC GROWTH -Annual Contributions- 10% 8% 4.0% 6% 4% 2.8% 1.9% 2% 0.5% 0.4% 0.8% 0% -0.8% -0.5% -1.8% -0.3% -2% -4% Argentina* Brasil Chile Mexico China Corea del Sur India Estados Unidos UE Alemania Source: TED database, Argentina (ARKLEMS+LAND) ICT NON ICT Labor Composition TFP
33 REAL EXCHANGE RATE ARGENTINA Bilateral with u$s and Multilateral 2001= ,5 2 RER bilateral RER MULTILATERAL RER Multilateral Labor Productivity Adj. RER Multilateral TFPstrict. Adj. 1,5 1 0, Source: ARKLEMS based on Central Bank and alternative sources
34 LABOR COST IN ARGENTINA W/P Q/L ULC Fuente: ARKLEMS
35 OUTPUT GAP ARGENTINA GDP POTENTIAL GDP EF Source: ARKLEMS 1st draft estimation (93 prices, vol. index Tonquist)
36 GDP GROWTH BY INDUSTRY IN ARGENTINA Annual Growth- Transport, Post&Telecomunications Public Administration Electricity, gas and water supply Other Scies. Education & Health Construction TOTAL Manufacturing Agriculture, forestry and haunting Hotels and Restaurants Trade Business & Real State Activities Finance Services Fishing Minning & Quarrying 0,1% 0,5% 0,5% 2,4% 2,2% 2,1% 1,9% 1,8% 1,8% 1,6% 3,9% 3,6% 3,4% 3,1% 6,5% 0 0,01 0,02 0,03 0,04 0,05 0,06 0,07 Source: ARKLEMS+LAND
37 LABOR INPUT BY INDUSTRY IN ARGENTINA Annual Growth- Public Administration Minning & Quarrying Business & Real State Activities Hotels and Restaurants Education & Health Finance Services Transport, Post & Telecomunications Trade TOTAL Construction Other Scies. Fishing Electricity, gas and water supply Agriculture, forestry and haunting Manufacturing 0,1% 0,0% 0,6% 1,1% 1,9% 1,9% 1,8% 1,7% 1,7% 1,6% 1,6% 3,2% 3,2% 3,1% 3,9% 0,0% 0,5% 1,0% 1,5% 2,0% 2,5% 3,0% 3,5% 4,0% 4,5% Source: ARKLEMS+LAND
38 LABOR PRODUCTIVITY BY INDUSTRY Annual Growth- Transport, Post &Telecommunications 4,6% Electricity, gas and water supply 3,0% Manufacturing Agriculture, forestry&hunting Other Scies. 1,8% 1,7% 2,1% Total Construction 0,7% 0,8% Trade Fishing -0,6% Hotels and restaurants Finance Scies Business&Real State Scies -1,3% -1,3% -1,5% Mining and quarrying -3,1% -0,04-0,03-0,02-0,01 0 0,01 0,02 0,03 0,04 0,05 Source: ARKLEMS+LAND
39 Manufacturing Labor Productivity Growth in Argentina (Average Annual Rate) PLASTIC AND RUBBER PRODUCTS 5,18% PRINTING AND PUBLISHING CHEMICALS OTHER NON METHALLIC MINERAL PRODUCTS FOOD AND BEVERAGE PAPER AND PAPER PRODUCTS LEATHER, FOOTWEAR MANUFACTURE SECTOR MACHINERY AND EQUIPMENT WOOD PRODUCTS MOTOR VEHICLES BASIC AND FABRICATED METALS 3,68% 3,05% 2,37% 2,21% 1,76% 1,53% 1,47% 1,43% 1,24% 0,89% 0,20% COKE, REFINED PETROLEUM, NUCLEAR FUEL TOBACCO METAL PRODUCTS 0,59% 0,78% 0,82% TEXTILES WEARING APPAREL, DRESSING 1,89% 1,92% FURNITURE 3,23% Source: ARKLEMS+LAND 3.0 Database 4% 3% 2% 1% 0% 1% 2% 3% 4% 5% 6%
40
41 0,4% 0,4% 0,3% CAPITAL SERVICES CONTRIBUTION TO AGRICULTURAL OUPUT GROWTH BY TYPE OF ASSET IN ARGENTINA -Annual Average Contribution - 0,10% Farm Tractors and Other Equipment 0,3% Capital Utilisation 0,2% 0,2% 0,26% Livestock 0,1% 0,1% 0,0% -0,1% 0,01% 0,07% -0,03% Land -0,1% Source: ARKLEMS+LAND-AGRIKLEMS-ARGENTINA USDA-ERS BSAS GRAIN EXCHANGE-Ball, Coremberg, Costa
42 TOTAL FACTOR PRODUCTIVITY OF AGRICULTURAL SECTOR IN ARGENTINA AGRICULTURAL SECTOR TOTAL ECONOMY Source: ARKLEMS+LAND-AGRIKLEMS-ARGENTINA USDA-ERS BSAS GRAIN EXCHANGE-Ball, Coremberg, Costa
43 CONCLUSIONS
44 UNSUSTAINABLE GROWTH PROFILE OF ARGENTINE ECONOMY 1 a GROWTH PROFILE BASED ON: ACCUMULATION AND BETTER QUALITY IN INPUTS: NATURAL RESOURCE HUMAN CAPITAL ICT 43
45 UNSUSTAINABLE GROWTH PROFILE OF ARGENTINE ECONOMY 1b BUT THERE STRICT TFP SLOWDOWN LACK OF MACROSPILLOVERS FROM SPECIAL INPUTS (ICT+Natural Resource) PERSISTENT JOB CREATION FROM INFORMAL AND LOWER PRODUCTIVITY SECTOR ONLY SHORT RUN CYCLICAL PRODUCTIVITY GAINS UNSUSTAINABLE GROWTH IN THE LONG RUN 44
46 UNSUSTAINABLE GROWTH PROFILE OF ARGENTINE ECONOMY 2 There are some correlation between RER and Sectoral TFP only during recoveries. Within Productivity gains were insufficient. There was no Structural Bonus and Strategic Complementarities from Dynamic Industries through different macro regimes: Non tradables 90`s & Tradables after 02 45

47 SCENARIO 1: DECOUPLING OLD DILEMMA OF THE ARGENTINEAN ECONOMY Distributional Conflict of Export Led Growth based on Traditional Competitiveness Advantage from Agricultural Sector=wage goods + Brazil Dependence + X diversification Important and Sustainable Within Productivity gains + Coordination and Complementarities is the key variable which allows for an increase in production in both markets: domestic and exports, generating external and social sustainability, without generating inflation
48 SCENARIO 2: RECOUPLING Going on Crisis in Europe + Brazil Devaluation Risk of Dollar Appreciation (length as a function of institutional difficulties in the EU), transitory but dangerous in the short run for AR and LAC Risk of End of Financialization of commodities (+ soft in agriculture), impact in China-India U9 LAC and AR must generate positive external surplus with Shock in X quantities, not Prices: PRODUCTIVITY
49 Slide 47 U9 Ver Grafico con Commodities Usuario, 5/14/2012
50 GROWTH STRATEGIES AFTER GLOBAL FINANCIAL CRISIS Get Prices Right or peaking the leader" is not enough Change focus of Public Policy (Pro-Productivity) tending to increase competitiveness without resorting to a sudden devaluation
51 THANK YOU!!!
WORLD KLEMS AND ASIA KLEMS
 WORLD KLEMS AND ASIA KLEMS By Dale W. Jorgenson Harvard University First Asia KLEMS Conference Asian Development Bank Institute Tokyo, Japan July 27, 2011 http://economics.harvard.edu/faculty/jorgenson/
THE ECONOMIC IMPACT OF INFORMATION TECHNOLOGIES AFTER THE FINANCIAL CRISIS
 THE ECONOMIC IMPACT OF INFORMATION TECHNOLOGIES AFTER THE FINANCIAL CRISIS Dale W. Jorgenson, Harvard University http://economics.harvard.edu/faculty/jorgenson/ Keynote Lecture to the Annual Conference
Improving Productivity & Competitiveness: Role of Labour Management Relations and Transitioning to Formality Presented by Charles Douglas, Ph.D.
 Improving Productivity & Competitiveness: Role of Labour Management Relations and Transitioning to Formality Presented by Charles Douglas, Ph.D. February 24, 2017 1 Theme: Realizing Decent Work under the
Some thoughts on productivity and Greece
 Some thoughts on productivity and Greece Nikos Vettas Professor, Athens University of Economics and Business General Director, IOBE (vettas@iobe.gr, www.iobe.gr, http://www.aueb.gr/users/vettas) Bank of
TREND OF THE TOTAL FACTOR PRODUCTIVITY GROWTH OF THE INDONESIAN ECONOMIC SECTORS
 TREND OF THE TOTAL FACTOR PRODUCTIVITY GROWTH OF THE INDONESIAN ECONOMIC SECTORS MAMAN SETIAWAN 1 CENTER FOR ECONOMICS AND DEVELOPMENT STUDIES UNIVERSITAS PADJADJARAN GUNTUR SUGIYARTO ASIAN DEVELOPMENT
in Korean Industries ( ): Estimates from KIP Database
: Estimates from KIP Database") RIETI/G-COE Hi-Stat International Workshop on Establishing Industrial Productivity Database for China, India, Japan and Korea October 22, 2010, Tokyo The Productivity Performance in Korean Industries (1990-2008):
RIETI/G-COE Hi-Stat International Workshop on Establishing Industrial Productivity Database for China, India, Japan and Korea October 22, 2010, Tokyo The Productivity Performance in Korean Industries (1990-2008):
THE IMPACTS OF CHINESE GROWTH ON LATIN AMERICA. Professor Rhys Jenkins University of East Anglia Norwich, UK
 THE IMPACTS OF CHINESE GROWTH ON LATIN AMERICA Professor Rhys Jenkins University of East Anglia Norwich, UK $ million The Growth of Latin America-China Economic Relations Exports to China 90000 80000 70000
Towards a High Income Economy: Productivity and Human Capital the Malaysian Case. The Third World KLEMS Conference May 2014
 Towards a High Income Economy: Productivity and Human Capital the Malaysian Case The Third World KLEMS Conference 19-20 May 2014 Presentation Outline Introduction Literature Review Methodology Findings
Hak K. Pyo (Seoul National University) Hyunbae Chun (Sogang University) Keun Hee Rhee (Korea Productivity Center)
 Hyunbae Chun (Sogang University) Keun Hee Rhee (Korea Productivity Center)") Korea-Japan Workshop on Productivity Seoul National University, Seoul, Korea December 7, 2012 (Session 3) Hak K. Pyo (Seoul National University) Hyunbae Chun (Sogang University) Keun Hee Rhee (Korea Productivity
Korea-Japan Workshop on Productivity Seoul National University, Seoul, Korea December 7, 2012 (Session 3) Hak K. Pyo (Seoul National University) Hyunbae Chun (Sogang University) Keun Hee Rhee (Korea Productivity
The Real Economy. Chapter-2
 2.1 The Bangladesh economy experienced an impressive growth in FY18, underpinned by strong domestic and external demand, as reflected in buoyant public and private investment and consumption, driven by
EU KLEMS Growth and Productivity Accounts 2013 update1
 EU KLEMS Growth and Productivity Accounts 2013 update1 Description of methodology and country notes for Belgium Prepared by Reitze Gouma and Marcel Timmer (Groningen Growth and Development Centre) Introduction
Trade and productive policies: a Latin American and Caribbean perspective
 Trade and productive policies: a Latin American and Caribbean perspective LAEBA 2005 Second Annual Meeting Latin America and Asia: Strategic Policies for Global Competition José Luis Machinea Executive
Structural Change and Productivity Growth in India and China
 Structural Change and Productivity Growth in India and China JAGANNATH MALLICK School of Economics, University of Hyogo, Japan & JSPS 1 Scheme of Presentation Research Issues and Objectives The patterns
Industrial policy, Structural Change, and Pattern of Industrial Productivity Growth in Taiwan
 Industrial policy, Structural Change, and Pattern of Industrial Productivity Growth in Taiwan Tsu-tan Fu* Department of Economics & Center for Efficiency and Productivity Research Soochow University, Taiwan
PRESS RELEASE. Industrial Production Price Index
 ROMANIA Press Office 16 Libertăţii Avenue, Sector 5, Bucharest Tel/Fax: 318 18 69; Fax: 312 48 75 e-mail: romstat@insse.ro; biroupresa@insse.ro PRESS RELEASE No. 48 of March 4, 2013 Industrial Production
NACE: Statistical Classification of Economic Activities
 NACE: Statistical Classification of Economic Activities NACE Rev.1 : To use until the 2008 operation included Section A Agriculture, hunting and forestry 01 Agriculture, hunting and related service activities
The Economic Performance of Agriculture: A Multilateral Comparison Eldon Ball Economic Research Service USDA
 The Economic Performance of Agriculture: A Multilateral Comparison Eldon Ball Economic Research Service USDA Prepared for Presentation at University of Buenos Aires Buenos Aires, Argentina 11 November
Productivity Growth in India under Different Policy regimes: India KLEMS Research Team
 Productivity Growth in India under Different Policy regimes: 1980-2012 India KLEMS Research Team 3 rd world KLEMS Conference 19-20 May 2014 Tokyo, Japan Does Policy Regimes matter? Post independence and
Labor Productivity in Peru:
 Journal of CENTRUM Cathedra Volume 5, Issue 1, 2012 115-142 JCC Journal of CENTRUM Cathedra Labor Productivity in Peru: 1997-2007 Mario D. Tello Pontificia Universidad Católica del Perú, Lima, Peru Abstract
INDONESIA. Manufacturing: Food & Beverages. Sectoral Activities Department
 INDONESIA Manufacturing: Food & Beverages Key Labour Market Indicators (2009) Economically Active Population Total: 113,740,000 13,000 12,500 12,000 11,500 11,000 10,500 10,000 Fig.1: Employment in Manufacturing
Recent transformations in the Global Economy and its consequences for economic and social development. Joseph E. Stiglitz Cuba December 2016
 Recent transformations in the Global Economy and its consequences for economic and social development Joseph E. Stiglitz Cuba December 2016 Outline The recent evolution of beliefs system about what makes
Economic Growth and Information Technology in the U.S. and Japan
 Economic Growth and Information Technology in the U.S. and Japan Dale W. Jorgenson (Harvard University) Koji Nomura (Keio University) Economic and Social Research Institute, Cabinet Office June 25, 2007,
Mapping Global Value Chains. Sébastien Miroudot Koen De Backer OECD
 Mapping Global Value Chains Sébastien Miroudot Koen De Backer OECD Why mapping GVCs is important. Trade policy. Trade and employment. National competitiveness and growth 4. Moving up the value chain and
Kazuyuki Motohashi RIETI and University of Tokyo
 Assessing Industrial Competitiveness of Japan by Comparing Productivity Levels to China, Korea, Taiwan and US Kazuyuki Motohashi RIETI and University of Tokyo Decline of Japanese growth rate after 1990
China s Outbound Investment: Policies and Experiences
 China s Outbound Investment: Policies and Experiences By Fang Jin Development Research Center of the State Council July 25, 2008 Santiago, Chile Main Contents Facts and Features of China s outbound investment
Jobs Supported by Goods Exports 2016
 Jobs Supported by Goods Exports 2016 In 2016 South Africa exported over R1 trillion worth of goods to the world, and this supported about 1 million jobs, accounting for 6.6 per cent of total employment,
World Manufacturing Production
 World Manufacturing Production Statistics for Quarter IV, 2017 Report on world manufacturing production This report presents the observed growth rates and growth estimates of world manufacturing production
Measuring Productivity at the Industry Level THE INDIA KLEMS DATA BASE. DATA MANUAL 2017 (Version 4)
") Measuring Productivity at the Industry Level THE INDIA KLEMS DATA BASE DATA MANUAL 2017 (Version 4) Deb Kusum Das, Abdul Azeez Erumban, Suresh Aggarwal and Pilu Chandra Das The project is housed at the
Measuring Productivity at the Industry Level THE INDIA KLEMS DATA BASE DATA MANUAL 2017 (Version 4) Deb Kusum Das, Abdul Azeez Erumban, Suresh Aggarwal and Pilu Chandra Das The project is housed at the
Dutch Disease? Firm-level evidence from Indonesia
 Dutch Disease? Firm-level evidence from Indonesia Jim Cust NRGI and OxCarre Tornn Harding NHH Norwegian School of Economics Pierre-Louis Vézina King's College London March 28, 2016 Cust et al. Dutch Disease
TVET REFORM PROJECT DISCUSSION PAPER INDUSTRY SKILLS COUNCILS. July 2010
 TVET REFORM PROJECT DISCUSSION PAPER INDUSTRY SKILLS COUNCILS July 2010 This paper sets out a rationale and proposal for the establishment of a network of Industry Skills Councils (ISC) in Bangladesh.
The Dutch Disease: An Overview
 The Dutch Disease: An Overview Zuzana Brinčíková, Ing. PhD University of Economics in Bratislava, Slovak Republic Abstract The Dutch disease is a negative impact of the increase in foreign income on the
Agricultural Trade, Food Crisis and Food Sovereignty in the Hemisphere. North Carolina State University
 Agricultural Trade, Food Crisis and Food Sovereignty in the Hemisphere Jean-Philippe Gervais Jean Philippe Gervais North Carolina State University Outline Facts (Record prices, supply shocks, increased
CANADA. Sectoral Activities Department. Wholesale & Retail Trade. Fig. 1: Employment by Major Economic Activity ('000s),
,") CANADA Fig. 1: Employment by Major Economic Activity ('000s), 2000-2008 20,000 18,000 16,000 14,000 12,000 10,000 8,000 6,000 4,000 2,000 0 2000 2002 2004 2006 2008 Agriculture, Forestry, Fishing Mining
CANADA Fig. 1: Employment by Major Economic Activity ('000s), 2000-2008 20,000 18,000 16,000 14,000 12,000 10,000 8,000 6,000 4,000 2,000 0 2000 2002 2004 2006 2008 Agriculture, Forestry, Fishing Mining
MEASURING KNOWLEDGE- BASED CAPITAL
 MEASURING KNOWLEDGE- BASED CAPITAL Some findings and open questions Mariagrazia Squicciarini OECD, Directorate for Science, Technology and Industry A Policy Framework for Knowledge-Based Capital OECD MIT
This table has been produced by. The State & Regional Fiscal Studies Unit, University of Missouri-Columbia
 Table B-39 NAICS Component *1987 1988 1989 1990 1991 1992 All industry total 6,076,695 6,398,624 6,540,047 6,638,210 6,627,809 6,828,525 Private industries 5,195,468 5,492,391 5,612,260 5,690,087 5,677,736
Introductory text and technical notes 335. Table 16.1 Average weekly earnings for each industrial sector 337
 Earnings 16 Introductory text and technical notes 335 Table 16.1 Average weekly earnings for each industrial sector 337 Table 16.2 Average hourly earnings for each industrial sector 338 Table 16.3 Table
Economic Outlook Update
 ECONOMIC OUTLOOK December 2015 Economic Outlook Update -February 2017- Table of Contents: 1. Global and Regional economy 2. Domestic Outlook 2.1 Primary Industries 2.2 Secondary Industries 2.3 Tertiary
SOUTH AFRICA ITALY SUMMIT 014
 SOUTH AFRICA ITALY SUMMIT 014 SOUTH AFRICA AND ITALY RELATIONS IN THE CURRENT GEOPOLITICAL AND ECONOMIC SCENARIO PROFESSOR MTHULI NCUBE BLAVATNIK SCHOOL OF GOVERNMENT UNIVERSITY OF OXFORD OCTOBER 2, 2014
MANUFACTURING IN IOWA
 MANUFACTURING IN IOWA NOVEMBER 2011 INSIDE: SECTOR SIZE 2 KEY INDUSTRIES EARNINGS 4 EXPORTS 5 JOB TRENDS 6 GDP TRENDS 7 COUNTY DEPENDENCE 3 8 OVERVIEW Iowa s competitive strengths in manufacturing emerged
PHILIPPINES. Sectoral Activities Department. Agriculture & Fishing. Fig. 1: Employment by Major Economic Activity ('000s),
,") PHILIPPINES 35,000 30,000 25,000 20,000 15,000 10,000 Fig. 1: Employment by Major Economic Activity ('000s), 2001-2008 Agriculture, Hunting and Fishing Mining and Quarrying Electricity, Gas and Water Supply
PHILIPPINES 35,000 30,000 25,000 20,000 15,000 10,000 Fig. 1: Employment by Major Economic Activity ('000s), 2001-2008 Agriculture, Hunting and Fishing Mining and Quarrying Electricity, Gas and Water Supply
U.S.-Asia trade: dynamic general equilibrium linkages Robert Koopman, Marinos Tsigas, Zhi Wang (USITC) and Xin Li (Peking University)
 and Xin Li (Peking University)") The Institute for International Economic G2 at GW The 5th Annual Conference on U.S.-China Economic Relations and China s Economic Development October 12, Lindner Commons, Elliott School of International
The Institute for International Economic G2 at GW The 5th Annual Conference on U.S.-China Economic Relations and China s Economic Development October 12, Lindner Commons, Elliott School of International
Appendix A NAICS Codes and Titles
 Appendix A NAICS Codes and Titles The current analysis of the US economy uses a classification system that is based on the 6-digit North American Industry Classification System (NAICS) introduced in year
Raffles Place, , Singapore. ISO 9001: 2015 Quality Management System Certification
 ISO 9001: 2015 Quality Management System Certification EA Code 1 3 5 7 8 9 10 12 14 15 16 17 18 19 20 22 23 24 25 27 28 29 30 31 32 33 34 35 36 37 38 39 Agriculture, forestry and fishing Food products,
India s Export Performance Analysis An Analysis
 India s Export Performance Analysis An Analysis Rashmi Taneja Assistant Professor, Shri Aurobindo College, University of Delhi, Delhi Abstract Merchandise exports from India have exhibited a perceptible
Other unpublished data from the Central Bureau of Statistics of Namibia were used to make adjustments when necessary.
 Namibia Michael Begg and Lelly Nghixulifwa 1. Introduction This document describes the steps behind the creation of the first Input-Output (I-O) table of Namibia for the Global Trade Analysis Project (GTAP)
The Indonesian Economy in Haryo Aswicahyono and Hal Hill ANU Indonesia Update, September 19-20
 The Indonesian Economy in 2014 Haryo Aswicahyono and Hal Hill ANU Indonesia Update, September 19-20 THREE MAIN MESSAGES 1. THE ECONOMY IS (JUST) HOLDING UP OK SO FAR. 2. BUT THERE ARE VARIOUS FRAGILITIES,
The impact of electricity prices on jobs and investment in the Belgian manufacturing industry
 The impact of electricity prices on jobs and investment in the Belgian manufacturing industry Gert Bijnens, Joep Konings & Stijn Vanormelingen, KU Leuven Press conference, 27 March 218 Belgium is losing
Barriers to EE programs in LAC
 The BIEE Program in Latin America and the Caribbean Andrés Schuschny Ph.D. Natural Resources and Energy Unit Climate change strategies: Contribution of the energy efficiency policies monitoring 29th &
Thursday, 1 October 2015 Delivered by the Division on International Trade in Goods and Services, and Commodities Trade Analysis Branch
 Thursday, 1 October 2015 Delivered by the Division on International Trade in Goods and Services, and Commodities Trade Analysis Branch Tariff (%) Number of Measures in Force Figure 5: Contrasting Trade
Intensity and Use of Energy in Indian Industries and the Contribution of Energy to Growth
 Fifth World KLEMS Conference, June 04-05 2018, Harvard University Intensity and Use of Energy in Indian Industries and the Contribution of Energy to Growth Bishwanath Goldar Suresh Chand Aggarwal Pilu
This table has been produced by. The State & Regional Fiscal Studies Unit, University of Missouri-Columbia
 Table B-39 NAICS Component 1963 1964 1965 1966 1967 1968 1969 1970 1971 All industry total 607,008 650,513 704,697 767,075 811,782 887,569 962,902 1,012,299 1,097,173 Private industries 534,043 572,138
28 th Annual IAEE Interational Conference
 28 th Annual IAEE Interational Conference Impacts of Oil Price Changes on Taiwan s Economy - An Input-Output Study Ji Chou Nai-Fong Kuo Su-Ling Peng Jin-Duan Lai 3-6 June 2005, The Grand Hotel, Taipei
Turkey. Mustafa Acar The original input-output table
 14.12 Turkey Mustafa Acar 14.12.1 The original input-output table The source table for Turkey s input-output (I/O) table is The Input-Output Structure of the Turkish Economy 1990, published by the State
2017: Q3. agriculture, forestry & fisheries
 agriculture, forestry & fisheries PREFACE The agro-processing industry is among the sectors identified by the Industrial Policy Action Plan (IPAP) and the National Development Plan for its potential to
Management and Productivity. Enno Siemsen Wisconsin School of Business Erdman Center for Operations & Technology Management
 Management and Productivity Enno Siemsen Wisconsin School of Business Erdman Center for Operations & Technology Management 1 About Myself Born in Germany Worked for Electronics Manufacturer, Shenzhen,
INTERNATIONAL TRADE REPORT ON ADRIATIC AND IONIAN AREA. STATISTICS DATA Update 2014
 INTERNATIONAL TRADE REPORT ON ADRIATIC AND IONIAN AREA STATISTICS DATA Update 2014 Ancona, May 2015 The aim of this work is to provide a contribution to identify the economic and commercial dimension of
INDUSTRIAL PRODUCTION INDEX
 Manufacturing (2012 = 100) 2015 First Quarter Released Date: June 2015 Table of Contents Introduction... 3 Key Points... 4 Industrial production index for the first quarter of 2015 compared with the first
Norbert J. Ore, CPSM, CPM, MA Chair, ISM Manufacturing Report on Business
 The ISM Reports on Business and the U.S. Economy Norbert J. Ore, CPSM, CPM, MA Chair, ISM Manufacturing Report on Business norjore@gmail.com we ll be talking about... The history and development of the
How do prices of primary energy carriers influence the competitiveness of the Polish economy
 How do prices of primary energy carriers influence the competitiveness of the Polish economy Michał Przybyliński University of Łódź 17 th INFORUM World Conference, Jurmala 2009 Previous research General
Slicing Up Global Value Chains
 Slicing Up Global Value Chains Marcel Timmer a Abdul Azeez Erumban a Bart Los a Robert Stehrer b Gaaitzen de Vries a (a) Groningen Growth and Development Centre, University of Groningen (b) The Vienna
INDONESIA. Sectoral Activities Department. Agriculture. Fig. 1: Employment by Major Economic Activity ('000s)
") INDONESIA 100,000 80,000 60,000 40,000 20,000 2,500,000 2,000,000 1,500,000 1,000,000 500,000 0 0 Fig. 1: Employment by Major Economic Activity ('000s) 2000-2008 2000 2002 2004 2006 2008 Fig. 2: Sectoral
INDONESIA 100,000 80,000 60,000 40,000 20,000 2,500,000 2,000,000 1,500,000 1,000,000 500,000 0 0 Fig. 1: Employment by Major Economic Activity ('000s) 2000-2008 2000 2002 2004 2006 2008 Fig. 2: Sectoral
TECHNICAL NOTES. Producer Price Index Manufacturing (PPI-M)
") TECHNICAL NOTES Producer Price Index Manufacturing (PPI-M) 1. Definition The Producer Price Index (PPI-M) measures changes in the effective prices received by manufacturers for that part of their output
TECHNICAL NOTES Producer Price Index Manufacturing (PPI-M) 1. Definition The Producer Price Index (PPI-M) measures changes in the effective prices received by manufacturers for that part of their output
Life Cycle Assessment (LCA) on economic sectors of Jordan based on I/O analysis with an adapted version of the ecological scarcity method
 on economic sectors of Jordan based on I/O analysis with an adapted version of the ecological scarcity method") based on I/O analysis with an adapted version of the ecological scarcity method by Dr. Fredy Dinkel, Carbotech AG, Switzerland Marc Bachmann, Carbotech AG, Switzerland f.dinkel@carbotech.ch Life Cycle
based on I/O analysis with an adapted version of the ecological scarcity method by Dr. Fredy Dinkel, Carbotech AG, Switzerland Marc Bachmann, Carbotech AG, Switzerland f.dinkel@carbotech.ch Life Cycle
Executive Summary Central region Number of establishments by division of industry manufacturing
 Executive Summary At present the structure of business trade, services and industrial activity, has changed dramatically. There are new kind of business in the economy, including the small scale industries
Chapter 1. The Intertemporal General Equilibrium Model (IGEM) 1.1 Introduction Intertemporal general equilibrium models represent worthwhile
 1.1 Introduction Intertemporal general equilibrium models represent worthwhile") Chapter 1. The Intertemporal General Equilibrium Model (IGEM) 1.1 Introduction Intertemporal general equilibrium models represent worthwhile additions to the portfolio of methodologies for evaluating the
Chapter 1. The Intertemporal General Equilibrium Model (IGEM) 1.1 Introduction Intertemporal general equilibrium models represent worthwhile additions to the portfolio of methodologies for evaluating the
Jaana Korhonen, 3rd International Congress on Planted Forests Porto, Portugal May 18, 2013
 Jaana Korhonen, 3rd International Congress on Planted Forests Porto, Portugal May 18, 2013 Objectives Data Methods Results Conclusions Identify factors that influence investments in forest plantations
UN List of Industrial Products
 UN List of Industrial Products United Nations Statistics Division Workshop on Classifications, Montevideo, Uruguay, 14-18 March 2005 25/04/2005 1 History UN list of industrial products was developed in
MINISTRY OF PLANNING AND INVESTMENT LAO STATISTICS BUREAU
 Workshop on Energy Statistics for ASEAN Countries Kuala Lumpur, Malaysia 21-23 November 2016 Data Collection On Energy Statistics and Using Data to Establish The Supply and Use Table Sypaseut NAVONGSA
OXFORD ECONOMICS. Global Industry Services Overview
 OXFORD ECONOMICS Global Industry Services Overview 2016 ABOUT OXFORD ECONOMICS Oxford Economics is a world leader in global forecasting and quantitative analysis. Our worldwide client base comprises over
The impact of China s WTO accession on patterns of world trade
 Journal of Policy Modeling 25 (2003) 1 41 The impact of China s WTO accession on patterns of world trade Zhi Wang School of Computational Sciences, George Mason University, Room 5141, 1800 M Street NW,
IAF Informative Document for QMS Scopes of Accreditation
 IAF ID 1:2010 International Accreditation Forum, Inc. IAF Informative Document IAF Informative Document for QMS Scopes of Accreditation (IAF ID 1:2010) IAF ID 1:2010 International Accreditation Forum,
Analysis of household final consumption with a focus on the domestic market and the impact on employment
 Analysis of household final consumption with a focus on the domestic market and the impact on employment OCTOBER 2012 Národná banka Slovenska www.nbs.sk Imricha Karvaša 1 813 25 Bratislava milan_gylanik@nbs.sk
REMI Macroeconomic Analysis of the Baja Climate Action Plan
 REMI Macroeconomic Analysis of the Baja Climate Action Plan Dan Wei Price School of Public Policy University of Southern California with members of the microeconomic team 1 Input Data for REMI Analysis
Chapter 23: Classifications
 Chapter 23: Classifications Regrouping and coding of industries (A) and products (P) The classifications of activities and products to be used are NACE Rev. 2 and CPA 2008. The corresponding aggregations
Trade and Employment in the Global Crisis
 Trade and Employment in the Global Crisis Launch June 21, 2010 Marion Jansen (and Erik von Uexkull) ILO Employment Sector / Trade and Employment Program http://www.ilo.org/trade It s a long way from Wall
China. Li Shantong and He Janus Data Source. 2. Sector Classification
 China Li Shantong and He Janus 1 1. Data Source The source of the initial input-output (I-O) table for China is "Input-Output Table of China - 2002 from the Department of National Economy Accounting, State
SEIFSA s submission to NERSA
 PRESENTED BY: Marique Kruger & Dr. Michael Ade EC DIVISION - SEIFSA marique@seifsa.co.za SEIFSA s submission to NERSA Eskom s third MYPD3 RCA for Year 2 (2014/15), Year 3 (2015/16) and Year 4 (2016/17)
Prospects and challenges of agricultural trade between China and Latin America: analysis of problems and opportunities from the Chinese perspective
 Prospects and challenges of agricultural trade between China and Latin America: analysis of problems and opportunities from the Chinese perspective Li Xiande Institute of Agricultural Economics and Development,
Assessing Manufacturing: Output and Labor
 Assessing : Output and Labor The Setup Making It In America Matters 212 NABE Industry Conference Cleveland, OH May 31, 212 William Strauss Senior Economist and Economic Advisor output peaked in December
Mercosur s meat exports to the EU: Assessment of policies affecting trade flows. Ellen Huan-Niemi & Jyrki Niemi MTT Agrifood Research Finland
 Mercosur s meat exports to the EU: Assessment of policies affecting trade flows Ellen Huan-Niemi & Jyrki Niemi MTT Agrifood Research Finland Full members Argentina Brazil Paraquay Uruguay Becoming full
ITU study on Regulatory framework and research on the behavior of consumers of telecommunications services in Latin America
 ITU study on Regulatory framework and research on the behavior of consumers of telecommunications services in Latin America Carmen Prado Wagner Telecommunication Development Bureau (ITU/BDT) prado@itu.int
The Taiwanese Economy
 The Taiwanese Economy A new dynamic after the Economic Crisis March 22, 2012 1 The Taiwanese economy in a few words Important figures TAIWAN, 5 th ECONOMIC POWER IN ASIA A DYNAMIC ECONOMY 2011 GDP Growth:
COMMISSION OF THE EUROPEAN COMMUNITIES COMMISSION STAFF WORKING DOCUMENT. Accompanying the
 EN EN EN COMMISSION OF THE EUROPEAN COMMUNITIES Brussels, 19.06.2008 SEC (2008) 2047 COMMISSION STAFF WORKING DOCUMENT Accompanying the FIFTH PROGRESS REPORT ON ECONOMIC AND SOCIAL COHESION Growing Regions,
COMMISSION OF THE EUROPEAN COMMUNITIES COMMISSION STAFF WORKING DOCUMENT. Accompanying the
 COMMISSION OF THE EUROPEAN COMMUNITIES Brussels, 19.06.2008 SEC (2008) 2047 COMMISSION STAFF WORKING DOCUMENT Accompanying the FIFTH PROGRESS REPORT ON ECONOMIC AND SOCIAL COHESION Growing Regions, growing
Irish Company Expenditure on Carbon Abatement Technologies: An Overview of Project Findings
 Irish Company Expenditure on Carbon Abatement Technologies: An Overview of Project Findings Dr. Bernadette Power, School of Economics, Cork University Business School. Dr Ellen O Connor, School of Accounting
Table 1 shows the general form of China 2010 I-O Table:
 China Liu Yu 1 and Jie Chen The original 2010 Input-Output Table doesn t have multi-product sector. After some adjustments, the data tables are reclassified and re-balanced to provide the matrices required
Development of ecosystem capital accounts. Overview of progress, November ) Input to UN process on SEEA Vol. II
 Input to UN process on SEEA Vol. II") Development of ecosystem capital accounts Overview of progress, November 2012 1) Input to UN process on SEEA Vol. II 2) Data layers and analysis 3) Workshop on policy applications 4) EEA report on Ecosystem
Development of ecosystem capital accounts Overview of progress, November 2012 1) Input to UN process on SEEA Vol. II 2) Data layers and analysis 3) Workshop on policy applications 4) EEA report on Ecosystem
Trade and Technology: Recent Developments and Distributional Effects in Developing Countries
 G24 Special Workshop on Growth and Reducing Inequality Geneva, 5 6 September 2017 Session 2: Trade, technology and labour markets Trade and Technology: Recent Developments and Distributional Effects in
CENSUS OF INDUSTRIAL PRODUCTION
 CENSUS OF INDUSTRIAL PRODUCTION TANZANIA MAINLAND 2013 SUMMARY REPORT Vision To become a one stop centre for official statistics in Tanzania Mission To produce quality official statistics and service that
INDUSTRIAL PRODUCTION INDICES IN JULY Figure 1. Industrial Production Indices (2010 = 100)
") INDUSTRIAL PRODUCTION INDICES IN JULY 2017 1 According to the preliminary data the Industrial Production Index 2, seasonally adjusted 3, increased by 0.2% in July 2017 as compared to June 2017. In July
INDUSTRIAL PRODUCTION INDICES IN JULY 2017 1 According to the preliminary data the Industrial Production Index 2, seasonally adjusted 3, increased by 0.2% in July 2017 as compared to June 2017. In July
The Game of Trading Jobs for Emissions
 The Game of Trading Jobs for Emissions I. Arto, J. M. Rueda-Cantuche, E. Dietzenbacher, V. Andreoni, I. Mongelli, A. Genty and A. Villanueva Groningen, April 24-26, 2012 Joint Research Centre The European
INDIA, BRAZIL AND SOUTH AFRICA: STRATEGIC ECONOMIC OPPORTUNITIES IN THE MAP OF INTERNATIONAL SPECIALIZATION
 www.bndes.gov.br 1 www.bndes.gov.br 2 INDIA, BRAZIL AND SOUTH AFRICA: STRATEGIC ECONOMIC OPPORTUNITIES IN THE MAP OF INTERNATIONAL SPECIALIZATION André Nassif Brazilian Development Bank (BNDES)* Av. República
Bilag 2. Standard industrial groupings for publishing purposes
 Standard industrial groupings for publishing purposes 441 Bilag 2. Industries organized into four groupings Groupings used in published statistics 127-grouping is the most detailed Links to DB07 Standard
The Food vs. Fuel Controversy
 The Food vs. Fuel Controversy Ian Sheldon Andersons Professor of International Trade Ohio State University Great Decisions Program, 2009 sheldon.1@osu.edu http://aede.osu.edu/programs/anderson/trade/ World
An East Asian FTA and Japan s Agricultural Policy: Simulation of a Direct Subsidy
 An East Asian FTA and Japan s Agricultural Policy: Simulation of a Direct Subsidy Tomoyoshi Nakajima Economic Research Institute for Northeast Asia (ERINA) 1. Introduction Traditionally, Japan has assigned
Trade and employment linkages in Indonesian Agriculture
 Trade and employment linkages in Indonesian Agriculture David Vanzetti and Rina Oktaviani 1 Australian National University and Bogor Agricultural University Contributed paper at the 55th AARES Annual Conference,
World Manufacturing Production
 World Manufacturing Production Statistics for Quarter III, 2017 Report on world manufacturing production This report presents the observed growth rates and growth estimates of world manufacturing production
Place-Based versus Place-Neutral Policies for Promoting Regionally Balanced Economic Growth: A Sri Lankan Case using CGE based Simulations
 Place-Based versus Place-Neutral Policies for Promoting Regionally Balanced Economic Growth: A Sri Lankan Case using CGE based Simulations by Deeptha Wijerathna* Department of Accounting, Finance & Economics
INDUSTRIAL PRODUCTION INDICES IN OCTOBER
 INDUSTRIAL PRODUCTION INDICES IN OCTOBER 2017 1 According to the preliminary data the Industrial Production Index 2, seasonally adjusted 3, decreased by 0.6% in October 2017 as compared to September 2017.
CO2 EMISSIONS EMBODIED IN INTERNATIONAL TRADE
 CO2 EMISSIONS EMBODIED IN INTERNATIONAL TRADE Norihiko Yamano OECD Directorate for Science, Technology and Innovation OECD Steel Committee the 82 nd session 23-24 March 2017 Territorial-based CO 2 emissions