Kazuyuki Motohashi RIETI and University of Tokyo
|
|
|
- Verity Wade
- 5 years ago
- Views:
Transcription
1 Assessing Industrial Competitiveness of Japan by Comparing Productivity Levels to China, Korea, Taiwan and US Kazuyuki Motohashi RIETI and University of Tokyo
2 Decline of Japanese growth rate after 1990 s 8% 7% 6% 5% 4% 3% 80 年代の平均 :4.0% 2% 1% 0% 90~2003 年の平均 :1.3% -1% -2%
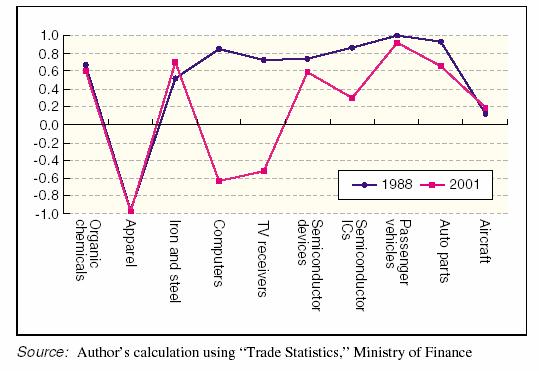
3 Trade Specialization Index (Export-Import)/(Export+Import)
4 Motivation Slowdown of growth rate of Japan after 1990 s: supply-side or demand-side factors? Fading international competitiveness in Japan? Particularly for electronics industries?: catching up of other East Asian economies? Dual economy in Japan? Lower productivity level in services sectors Benchmarking Japanese industries competitiveness by productivity comparison with other East Asian countries as well as US
5 ICPA Project International comparison among Asian countries by RIETI (Research Institute of Economy, Trade and Industry) Productivity growth and level comparison among China, Japan, Korea, Taiwan and US by KLEM framework Network of researchers China: Ren Ruoen (Beihang Univ.) Japan: Kuroda, Shimpo and Kawai (Keio Univ.) Korea: Hak Pyo (Seoul National Univ.) Taiwan: Chi-Yuan Liang (Academia Sinica) US: Jorgenson and Ho (Harvard Univ.)
6 Measuring Productivity by KLEM framework Industry level productivities are derived from comparable input-output tables as well as labor and capital by type (Jorgenson and his groups) IO table: 33 sector use matrix, and industry output and commodity input prices Labor data: hours worked and per hour wages by 18 types (2 sex*3 age*3 education) and 33 sectors Capital data: capital stock and rental service prices by 3 types (only depreciable assets) and 33 sectors
7 Y j Framework for productivity level comparison j j j j j = f ( K, L, E, M, TFP( c)) (1) d logy dc = ( logy X K, L, E, M c)( d log X d c) + logtfp c (2) log TFP c = d logy dc ( logy c)( d log X d c) (3) X K, L, E, M logtfp c = ( log P PX PK, PL, PE, PM Y c)( d log P X d c) d log P Y dc (4) logtfp c = s x PX PK, PL, PE, PM ( d log P X d c) d log P Y dc (5) log TFPUS = Sx(log PX US log PX, JP ) (log PY, US log PY, JP X K, L, E, M, JP ) (6) where S = / 2 *( S + S ) X 1 X, JP X, US
8 Relative input and output prices Output prices: relative basic prices (net subsidy adjustment with producer prices by industry Input prices: Intermediate inputs (E and M): relative purchased prices by commodity Labor input (L): relative per hour wage Capital input (K): relative rental service price
9 Issues for relative output prices P US = P Y orx Y ( orx ), US ejp P ( ), Y ( orx ), JP JP US EPPPs or UVRs EPPPs (Expenditure based PPPs) : starting from official PPPs statistics by OECD, and make adjustments for distribution margins and int l trade UVRs (Unit Value Ratios): comparing per unit price (the value over the quantity) at detail commodity level and aggregated UVRs from GGDC, Groningen Univ. are used in this study Covering non-oecd countries Needs converting to industry level by make matrix, but no significant impacts of such adjustment at 33 sector level
10 Issues for relative input price Intermediate inputs Purchased level relative prices, but not in this study (needs further developments) Labor inputs Comparing per hour wage for matching categories, and Divisia aggregation to industry level Capital inputs Same as labor inputs P P 1 zu = ( ( r(1 π ) + δ π ) + τ ) 1 u k P I annualization _ = i K, US JP annualization _ factor factor US JP P i I, US JP
11 Reservations!! Problems with hours worked -> biases with per hour wage (for example, no hours data for China) Underestimation of capital stock -> overestimation of rental services and TFP levels. E.g. China s investment survey covering only SOEs and collective economies Ad-hoc approach to smooth out asset price movements -> In most cases, no to much biases for factor input growth, but directly leads to miss-measurement of level comparison
12 Results: TFP level in 1995 (Japan=1) Macro Economy Level China Korea Taiwan US Output Price Capital Price Labor Price Energy Price Material Price TFP Manufacturing Sector China Korea Taiwan US Output Price Capital Price Labor Price Energy Price Material Price TFP
13 Results by industry (Manufacturing) 150% 100% 50% 0% -50% -100% Food Textile mill Apparel Lumber Furniture Paper Printing Chemicals Petroleum Leather Stone Primary metal Fabricated metal Machinery Electrical machi Motor Vehicles Transport. Mach. Instruments Rubber Misc manuf. China Korea Taiwan US
14 Results by industry (Non-manufacturing) 150% 100% 50% 0% -50% -100% Agriculture Coal mining Metal Construction Transportation Communication Electrical utilities Gas utilities Trade FIRE Other service China Korea Taiwan US
15 Results levels and growth (economy-wide) China Korea Taiwan US Japan
16 Results levels and growth (manufacturing) China Korea Taiwan US Japan
17 Divergence of Productivity between Japan and US? Macro-level comparison 5 4 (%) TFP Labor non-it IT Capital GDP 0-1 JAPAN US Jorgenson and Motohashi (2005)
18 The Role of IT in Macro-level Productivity Growth JAPAN US IT (%) 1.0 Non-IT TFP Jorgenson and Motohashi (2005)
19 IT network use and firm level productivity 5% 4% 3% 2% 1% 0% Inter-firm Network (Japan) Intra-firm Network (Japan) IT Network (US) IT Network (Japan) (Atrostic, Motohashi and Nguyen 2005)
20 Asian countries catching up: Electronics Industry China Korea Taiwan Japan
21 Assessment: Multinationals in China-1 Mining Food and tabacco Texitile Leather, paper, wood Petrochemical Chemical (exc. Drugs) Drug Primary metals Fabricated metals Machinery Transportation Electrical and electronics Other manufacturing Utilities 0% 10% 20% 30% 40% 50% 60% 70% 80% 90% 100% Foreign Owned HKMT Owned Dom. Privately Owned Dom. Others ( R&D of multinationals in China, RIETI-DP-06-E-005)
22 Assessment: Multinationals in China-2 1.0% 0.9% 0.8% 0.7% 0.6% 0.5% 0.4% 0.3% 0.2% 0.1% 0.0% Foreign owned (joint with doemstic) Wholly foreign owned HKMT owned (joint with domestic) Wholly HKMT owned Domestic privately owned ( R&D of multinationals in China, RIETI-DP-06-E-005)
23 Summary and Implications Productivity levels in manufacturing industries are generally higher in Japan, but a great amount of heterogeneity exists Strong in Electrical machinery, automobiles, instruments But weak in food, lumber and fabricated metals East Asian countries are catching up with Japan, while there is a divergence between Japan-US Difference between Japan and US comes from IT using sectors Growing China: substantial contribution of multinationals, but R&D level relatively low (market driven overseas R&D) Implications for Japan s potential growth (TFP growth) Better use of ICT in economy: growth opportunities (+) Catching up from Korea, Taiwan and China: threat by loosing high productivity growing sector (-), but competitions pushes productivity growth? (+) East Asian countries form a big market: demand size opportunities (+), and effects of globalization (tapping into overseas human resources) (GNP+)
Economic Growth and Information Technology in the U.S. and Japan
 Economic Growth and Information Technology in the U.S. and Japan Dale W. Jorgenson (Harvard University) Koji Nomura (Keio University) Economic and Social Research Institute, Cabinet Office June 25, 2007,
WORLD KLEMS AND ASIA KLEMS
 WORLD KLEMS AND ASIA KLEMS By Dale W. Jorgenson Harvard University First Asia KLEMS Conference Asian Development Bank Institute Tokyo, Japan July 27, 2011 http://economics.harvard.edu/faculty/jorgenson/
THE ECONOMIC IMPACT OF INFORMATION TECHNOLOGIES AFTER THE FINANCIAL CRISIS
 THE ECONOMIC IMPACT OF INFORMATION TECHNOLOGIES AFTER THE FINANCIAL CRISIS Dale W. Jorgenson, Harvard University http://economics.harvard.edu/faculty/jorgenson/ Keynote Lecture to the Annual Conference
Economic Growth in Japan and the United States in the Information Age
 Economic Growth in Japan and the United States in the Information Age Dale W. Jorgenson (Harvard University) & Kazuyuki Motohashi (RIETI and Hitotsubashi University) Sharp contrast of economic growth in
in Korean Industries ( ): Estimates from KIP Database
: Estimates from KIP Database") RIETI/G-COE Hi-Stat International Workshop on Establishing Industrial Productivity Database for China, India, Japan and Korea October 22, 2010, Tokyo The Productivity Performance in Korean Industries (1990-2008):
RIETI/G-COE Hi-Stat International Workshop on Establishing Industrial Productivity Database for China, India, Japan and Korea October 22, 2010, Tokyo The Productivity Performance in Korean Industries (1990-2008):
Towards a High Income Economy: Productivity and Human Capital the Malaysian Case. The Third World KLEMS Conference May 2014
 Towards a High Income Economy: Productivity and Human Capital the Malaysian Case The Third World KLEMS Conference 19-20 May 2014 Presentation Outline Introduction Literature Review Methodology Findings
Turkey. Mustafa Acar The original input-output table
 14.12 Turkey Mustafa Acar 14.12.1 The original input-output table The source table for Turkey s input-output (I/O) table is The Input-Output Structure of the Turkish Economy 1990, published by the State
PRELIMINARY, DO NOT QUOTE WITHOUT THE AUTHOR S PERMISSION. The Implications of China s Pattern of Growth for the Rest of the World. Stephen Tokarick *
 PRELIMINARY, DO NOT QUOTE WITHOUT THE AUTHOR S PERMISSION The Implications of China s Pattern of Growth for the Rest of the World by Stephen Tokarick * April 2017 Abstract Detailed estimates of the pattern
This table has been produced by. The State & Regional Fiscal Studies Unit, University of Missouri-Columbia
 Table B-39 NAICS Component 1963 1964 1965 1966 1967 1968 1969 1970 1971 All industry total 607,008 650,513 704,697 767,075 811,782 887,569 962,902 1,012,299 1,097,173 Private industries 534,043 572,138
Hak K. Pyo (Seoul National University) Hyunbae Chun (Sogang University) Keun Hee Rhee (Korea Productivity Center)
 Hyunbae Chun (Sogang University) Keun Hee Rhee (Korea Productivity Center)") Korea-Japan Workshop on Productivity Seoul National University, Seoul, Korea December 7, 2012 (Session 3) Hak K. Pyo (Seoul National University) Hyunbae Chun (Sogang University) Keun Hee Rhee (Korea Productivity
Korea-Japan Workshop on Productivity Seoul National University, Seoul, Korea December 7, 2012 (Session 3) Hak K. Pyo (Seoul National University) Hyunbae Chun (Sogang University) Keun Hee Rhee (Korea Productivity
This table has been produced by. The State & Regional Fiscal Studies Unit, University of Missouri-Columbia
 Table B-39 NAICS Component *1987 1988 1989 1990 1991 1992 All industry total 6,076,695 6,398,624 6,540,047 6,638,210 6,627,809 6,828,525 Private industries 5,195,468 5,492,391 5,612,260 5,690,087 5,677,736
Journal of Physics: Conference Series. Related content. Recent citations PAPER OPEN ACCESS
 Journal of Physics: Conference Series PAPER OPEN ACCESS An application of input-output analysis in analyzing the impacts of final demands changes on the total outputs of Japanese energy sectors: A further
Policy Simulations with an Integrated Model for Japan and Northeast Asia
 Paper Presented to 2005 IIOA Conference, Beijin, June 27-July 1 Preliminary Policy Simulations with an Integrated Model for Japan and Northeast Asia by S. Shishido, A. Kawakami, M. Kurokawa, A. Movshuk,
CO2 EMISSIONS EMBODIED IN INTERNATIONAL TRADE
 CO2 EMISSIONS EMBODIED IN INTERNATIONAL TRADE Norihiko Yamano OECD Directorate for Science, Technology and Innovation OECD Steel Committee the 82 nd session 23-24 March 2017 Territorial-based CO 2 emissions
World KLEMS initiative
 World KLEMS initiative Marcel Timmer Groningen Growth and Development Centre University of Groningen (presentation at World KLEMS conference, Harvard, 9-10 August, 2012) Extensions and applications World
Chapter 1. The Intertemporal General Equilibrium Model (IGEM) 1.1 Introduction Intertemporal general equilibrium models represent worthwhile
 1.1 Introduction Intertemporal general equilibrium models represent worthwhile") Chapter 1. The Intertemporal General Equilibrium Model (IGEM) 1.1 Introduction Intertemporal general equilibrium models represent worthwhile additions to the portfolio of methodologies for evaluating the
Chapter 1. The Intertemporal General Equilibrium Model (IGEM) 1.1 Introduction Intertemporal general equilibrium models represent worthwhile additions to the portfolio of methodologies for evaluating the
Total Factor Productivity by 72 Industries in Korea and International Comparison ( )
") Total Factor Productivity by 72 Industries in Korea and International Comparison (1970-2005) Hak K. Pyo *, Hyunbae Chun ** and Keun Hee Rhee *** The views expressed herein are those of the authors and
Total Factor Productivity by 72 Industries in Korea and International Comparison (1970-2005) Hak K. Pyo *, Hyunbae Chun ** and Keun Hee Rhee *** The views expressed herein are those of the authors and
Productivity Dynamics: A Comparison of the Manufacturing Sector in Korea and Japan
 Productivity Dynamics: A Comparison of the Manufacturing Sector in Korea and Japan Prepared for the one-day workshop on Intangible Investment, Innovation and Productivity January 27, 2012 National Institute
MEASURING KNOWLEDGE- BASED CAPITAL
 MEASURING KNOWLEDGE- BASED CAPITAL Some findings and open questions Mariagrazia Squicciarini OECD, Directorate for Science, Technology and Industry A Policy Framework for Knowledge-Based Capital OECD MIT
Table 1 shows the general form of China 2010 I-O Table:
 China Liu Yu 1 and Jie Chen The original 2010 Input-Output Table doesn t have multi-product sector. After some adjustments, the data tables are reclassified and re-balanced to provide the matrices required
Productivity in Japan, the US, and the Major EU Economies: Is Japan Falling Behind?
 Productivity in Japan, the US, and the Major EU Economies: Is Japan Falling Behind? Prepared for the BBL Seminar RIETI, Tokyo April 17, 2007 Kyoji Fukao Hitotsubashi University Tsutomu Miyagawa Gakushuin
MINISTRY OF PLANNING AND INVESTMENT LAO STATISTICS BUREAU
 Workshop on Energy Statistics for ASEAN Countries Kuala Lumpur, Malaysia 21-23 November 2016 Data Collection On Energy Statistics and Using Data to Establish The Supply and Use Table Sypaseut NAVONGSA
2017 Asia Petrochemical Industry Conference
 2017 Asia Petrochemical Industry Conference Specialty Chemicals Chemical Committee Meeting May 19, 2017 IHS Markit Chemical Masahiro Yoneyama +81-3-6262-1712 Masahiro.yoneyama@ihsmarkit.com COMMODITY SPECIALTY
International Comparison of Labor Productivity Distribution for Manufacturing and Non-Manufacturing Firms
 Progress of Theoretical Physics Supplement No. 179, 2009 93 International Comparison of Labor Productivity Distribution for Manufacturing and Non-Manufacturing Firms Yuichi Ikeda 1 and Wataru Souma 2 1
U.S.-Asia trade: dynamic general equilibrium linkages Robert Koopman, Marinos Tsigas, Zhi Wang (USITC) and Xin Li (Peking University)
 and Xin Li (Peking University)") The Institute for International Economic G2 at GW The 5th Annual Conference on U.S.-China Economic Relations and China s Economic Development October 12, Lindner Commons, Elliott School of International
The Institute for International Economic G2 at GW The 5th Annual Conference on U.S.-China Economic Relations and China s Economic Development October 12, Lindner Commons, Elliott School of International
Industrial policy, Structural Change, and Pattern of Industrial Productivity Growth in Taiwan
 Industrial policy, Structural Change, and Pattern of Industrial Productivity Growth in Taiwan Tsu-tan Fu* Department of Economics & Center for Efficiency and Productivity Research Soochow University, Taiwan
Physical and Human Capital Deepening and New Trade Patterns in Japan
 RIETI Discussion Paper Series 04-E-002 Physical and Human Capital Deepening and New Trade Patterns in Japan FUKAO Kyoji RIETI The Research Institute of Economy, Trade and Industry http://www.rieti.go.jp/en/
Intangible Investment in Japan, the US and the Major EU Economies: New
 Intangible Investment in Japan, the US and the Major EU Economies: New Eti Estimates t and dcontribution tib ti to Economic Growth Prepared for International Conference by EU Institute in Japan and Bocconi
Reconstructing China's Historical GDP : An International Comparison based on the Maddison Historical Data Project
 Reconstructing China's Historical GDP 1840 1912: An International Comparison based on the Maddison Historical Data Project Ye Ma, Herman de Jong Henan University, University of Groningen Beijing ICP conference
China s Exports: Fragmented, Foreign-Invested, and Environmentally Friendlier?
 China s Exports: Fragmented, Foreign-Invested, and Environmentally Friendlier? Judith M. Dean Brandeis University Mary E. Lovely Syracuse University Preliminary Draft (not for quotation) Prepared for "Foreign
Biased Technical Change Through the Lens of Global Value Chains
 Biased Technical Change Through the Lens of Global Value Chains Marcel Timmer (joint work with Laurie S.M. Reijnders and Xianjia Ye) Groningen Growth and Development Centre, University of Groningen Prepared
Development Centre RESEARCH MEMORANDUM
 University of Groningen Groningen Growth and Development Centre Manufacturing Performance in Indonesia, South Korea and Taiwan before and after the Crisis. An international Perspective, 1980-2000 Research
University of Groningen. Unit labour costs, productivity and international competitiveness Ark, Bart van; Stuivenwold, Edwin; Ypma, Gerard
 University of Groningen Unit labour costs, productivity and international competitiveness Ark, Bart van; Stuivenwold, Edwin; Ypma, Gerard IMPORTANT NOTE: You are advised to consult the publisher's version
Bilateralism and Agricultural Development in Vietnam: Opportunities for Negotiation with Japan and Korea
 Bilateralism and Agricultural Development in Vietnam: Opportunities for Negotiation with Japan and Korea David UC Berkeley MARD Workshop on GLOBALIZATION AND AGRICULTURAL DEVELOPMENT IN VIETNAM 13-14 December
Business-Facts Summary - Construction and Manufacturing NAICS Summary
 - Construction and NAICS Summary Title Page Title Page Data Version: 2018 Feb (Internal) Report Generation Method: Single Analysis Area: 1789 STATE ST, SAN DIEGO, CA, 92101-2530 Reporting Detail: As Selected
Development Centre RESEARCH MEMORANDUM. Losing Ground Japanese Labour Productivity and Unit Labour Costs in Manufacturing in Comparison to the U.S.
 University of Groningen Groningen Growth and Development Centre Losing Ground Japanese Labour Productivity and Unit Labour Costs in Manufacturing in Comparison to the U.S. Research Memorandum GD-64 Robert
Mapping Global Value Chains. Sébastien Miroudot Koen De Backer OECD
 Mapping Global Value Chains Sébastien Miroudot Koen De Backer OECD Why mapping GVCs is important. Trade policy. Trade and employment. National competitiveness and growth 4. Moving up the value chain and
THE EFFECTS OF ENVIRONMENTAL REGULATION AND ENERGY PRICES ON U.S. ECONOMIC PERFORMANCE. A thesis presented. Peter Jensen Wilcoxen
 THE EFFECTS OF ENVIRONMENTAL REGULATION AND ENERGY PRICES ON U.S. ECONOMIC PERFORMANCE A thesis presented by Peter Jensen Wilcoxen to The Department of Economics in partial fulfillment of the requirements
Business-Facts Summary Dublin city, CA ( )
") 3 Digit NAICS Top Ten Summary Healthcare and Social Assistance Ambulatory Health Care Retail Trade Professional, Scientific, and Technical Other (except Public Administration) Retail Trade Retail Trade
3 Digit NAICS Top Ten Summary Healthcare and Social Assistance Ambulatory Health Care Retail Trade Professional, Scientific, and Technical Other (except Public Administration) Retail Trade Retail Trade
Management and Productivity. Enno Siemsen Wisconsin School of Business Erdman Center for Operations & Technology Management
 Management and Productivity Enno Siemsen Wisconsin School of Business Erdman Center for Operations & Technology Management 1 About Myself Born in Germany Worked for Electronics Manufacturer, Shenzhen,
British Columbia s Merchandise Trade with the World
 British Columbia s Merchandise Trade with the World Publication No. 2014-29-E 17 June 2014 Alexandre Gauthier Economics, Resources and International Affairs Division Parliamentary Information and Research
FEDERAL RESERVE statistical release
 FEDERAL RESERVE statistical release G.17 (419) For release at 9:15 a.m. (EST) January 18, 2019 INDUSTRIAL PRODUCTION AND CAPACITY UTILIZATION Industrial production increased 0.3 percent in December after
Information Technology and the World Growth Resurgence Dale W. Jorgenson Harvard University July 19, 2007
 Information Technology and the World Growth Resurgence By Dale W. Jorgenson Harvard University July 19, 2007 http://post.economics.harvard.edu/faculty/jorgenson/ Economic Growth in the Information Age
The Real Economy. Chapter-2
 2.1 The Bangladesh economy experienced an impressive growth in FY18, underpinned by strong domestic and external demand, as reflected in buoyant public and private investment and consumption, driven by
OFFICE OF ECONOMICS WORKING PAPER U.S. International Trade Commission
 No. 2003-05-A OFFICE OF ECONOMICS WORKING PAPER U.S. International Trade Commission TSCAPE: A Time Series of Consistent Accounts for Policy Evaluation Edward J. Balistreri Alan K. Fox Office of Economics
Set up, progress, challenges, and relations with
 China Industrial Productivity (CIP) Database Set up, progress, challenges, and relations with the world KLEMS Harry X. Wu IER, Hitotsubashi University, Tokyo RIETI/Hi-Stat International Workshop Tokyo,
MANUFACTURING IN IOWA
 MANUFACTURING IN IOWA NOVEMBER 2011 INSIDE: SECTOR SIZE 2 KEY INDUSTRIES EARNINGS 4 EXPORTS 5 JOB TRENDS 6 GDP TRENDS 7 COUNTY DEPENDENCE 3 8 OVERVIEW Iowa s competitive strengths in manufacturing emerged
PRESS RELEASE. Industrial Production Price Index
 ROMANIA Press Office 16 Libertăţii Avenue, Sector 5, Bucharest Tel/Fax: 318 18 69; Fax: 312 48 75 e-mail: romstat@insse.ro; biroupresa@insse.ro PRESS RELEASE No. 48 of March 4, 2013 Industrial Production
PHILIPPINES. Sectoral Activities Department. Agriculture & Fishing. Fig. 1: Employment by Major Economic Activity ('000s),
,") PHILIPPINES 35,000 30,000 25,000 20,000 15,000 10,000 Fig. 1: Employment by Major Economic Activity ('000s), 2001-2008 Agriculture, Hunting and Fishing Mining and Quarrying Electricity, Gas and Water Supply
PHILIPPINES 35,000 30,000 25,000 20,000 15,000 10,000 Fig. 1: Employment by Major Economic Activity ('000s), 2001-2008 Agriculture, Hunting and Fishing Mining and Quarrying Electricity, Gas and Water Supply
GLOBAL VALUE CHAINS SELECTED POLICY ISSUES
 GLOBAL VALUE CHAINS SELECTED POLICY ISSUES Workshop Revisiting trade in a globalised world: Global Value Chains and their impact Chengdu 18 October 2011 Koen De Backer, OECD Slicing up firms value chains
The Measurement of Intangible Investment by Industry and Its Role in Productivity Improvements in Japan
 The Measurement of Intangible Investment by Industry and Its Role in Productivity Improvements in Japan Presented at the workshop on Intangible Investment, Innovation, and Productivity at the National
2011 Input-Output Tables for Japan
 2011 Input-Output Tables for Japan Joint Compilation Ministry of Internal Affairs and Communications Cabinet Office Financial Services Agency Ministry of Finance Ministry of Education, Culture, Sports,
World KLEMS initiative: the future
 World KLEMS initiative: the future Marcel Timmer Groningen Growth and Development Centre University of Groningen (presentation at World KLEMS conference, Harvard, 9-10 August, 2012) World KLEMS Aim of
Appendix A NAICS Codes and Titles
 Appendix A NAICS Codes and Titles The current analysis of the US economy uses a classification system that is based on the 6-digit North American Industry Classification System (NAICS) introduced in year
The Bush Record: Jobs -1,634,000 Net Private Sector Jobs Lost In First 3 Years and Eight Months
 Total nonfarm jobs... 131,567 132,388 (821) -0.6% Total private jobs... 109,926 111,560 (1,634) -1.5% Total private production jobs... 89,169 90,716 (1,547) -1.7% Goods-producing... 21,908 24,511 (2,603)
The Carbon Intensity of South Africa s Economy
 The Carbon Intensity of South Africa s Economy Rob Davies Coauthors: Channing Arndt, Konstantin Makrelov, James Thurlow Introduction Other presenters in this session are looking in detail at measures to
Productivity of Large Firms and SMEs of Malaysian Manufacturing
 Productivity of Large Firms and SMEs of Malaysian Manufacturing 135 Productivity of Large Firms and SMEs of Malaysian Manufacturing i Noriyoshi Oguchi 1 Anuar Abdul Karim 2 Nor Aini Amdzah 3 There have
U.S. Productivity and Electronic Business Processes in Manufacturing
 IAOS Satellite Meeting on Statistics for the Information Society August 30 and 31, 2001, Tokyo, Japan U.S. Productivity and Electronic Business Processes in Manufacturing B.K. Atrostic John Gates Senior
Productivity Growth in India under Different Policy regimes: India KLEMS Research Team
 Productivity Growth in India under Different Policy regimes: 1980-2012 India KLEMS Research Team 3 rd world KLEMS Conference 19-20 May 2014 Tokyo, Japan Does Policy Regimes matter? Post independence and
Business-Facts Summary - 3 Digit NAICS Summary
 - 3 Digit NAICS Summary Title Page Title Page Data Version: 2018 Feb (Internal) Report Generation Method: Single Analysis Area: 1789 STATE ST, SAN DIEGO, CA, 92101-2530 Reporting Detail: As Selected Include
Chapter 22 An Economic and Environmental Assessment of FTA in East Asian Region by CGE Approach
 International Workshop on E3 Modeling for Sustainable Low Carbon East Asia Date: 2014, September 21 Venue: Satellite office of Meijo University Chapter 22 An Economic and Environmental Assessment of FTA
Chapter 2. Data and base case considerations 2.1 The data underlying IGEM and its parameter estimates
 Chapter 2. Data and base case considerations 2.1 The data underlying IGEM and its parameter estimates The inter-industry accounts of the system of U.S. national accounts provide the core structure for
The Canada-U.S. Manufacturing Productivity Gap Revisited: New ICOP Results. Research Memorandum GD-51. Bart van Ark, Marcel Timmer and Robert Inklaar
 The Canada-U.S. Manufacturing Productivity Gap Revisited: New ICOP Results Research Memorandum GD-51 Bart van Ark, Marcel Timmer and Robert Inklaar Groningen Growth and Development Centre January 2002
This PDF is a selection from a published volume from the National Bureau of Economic Research
 This PDF is a selection from a published volume from the National Bureau of Economic Research Volume Title: The Industrial Composition of Income and Product Volume Author/Editor: John W. Kendrick, editor
STATE OF HAWAI'I. No. of. Total Average Rep. Units Average Quarterly Quarterly Industry March Employment Wages Wages January February March
 STATE OF HAWAI'I TOTAL, including government 37,439 598,205 6,028,316,620 10,077 596,822 598,744 599,049 TOTAL GOVERNMENT 6 123,628 1,526,182,323 12,345 121,692 123,988 125,205 Federal 1 32,650 483,102,256
STATE OF HAWAI'I. No. of. Total Average Rep. Units Average Quarterly Quarterly Industry September Employment Wages Wages July August September
 STATE OF HAWAI'I TOTAL, including government 37,044 581,957 6,080,565,857 10,448 581,677 578,368 585,826 TOTAL GOVERNMENT 6 118,031 1,532,738,257 12,986 118,907 114,660 120,525 Federal 1 34,864 560,380,978
Kiyoshi Kobayashi (Kyoto University)
") Online Publication Date: 10 March, 2012 Publisher: Asian Economic and Social Society Vietnam Economic Structure Change Based on Input-Output Table (2000-2007) Bui Trinh (National Account Department of
Online Publication Date: 10 March, 2012 Publisher: Asian Economic and Social Society Vietnam Economic Structure Change Based on Input-Output Table (2000-2007) Bui Trinh (National Account Department of
SOUTH AFRICA ITALY SUMMIT 014
 SOUTH AFRICA ITALY SUMMIT 014 SOUTH AFRICA AND ITALY RELATIONS IN THE CURRENT GEOPOLITICAL AND ECONOMIC SCENARIO PROFESSOR MTHULI NCUBE BLAVATNIK SCHOOL OF GOVERNMENT UNIVERSITY OF OXFORD OCTOBER 2, 2014
Who Gained Market Share in Indonesian Manufacturing?
 Who Gained Market Share in Indonesian Manufacturing? Sadayuki Takii and Eric D. Ramstetter ICSEAD and Graduate School of Economics, Kyushu University Working Paper Series Vol. 2008-14 March 2008 The views
Indonesia s Challenges toward Industrial Upgrading
 Indonesia = Japan 2 nd Industrial Dialogue JICA mission @ Bappenas Indonesia s Challenges toward Industrial Upgrading 11 August 2017 Yuri Sato Executive Vice President Institute of Developing Economies
FEDERAL RESERVE statistical release
 FEDERAL RESERVE statistical release G.17 (419) For release at 9:15 a.m. (EDT) August 17, 2017 INDUSTRIAL PRODUCTION AND CAPACITY UTILIZATION Industrial production rose 0.2 percent in July following an
Experience and its Comparison with Korea and China. Research Center for Advanced Science and Technology University of Tokyo
 Measuring E-commerce: E Japanese Experience and its Comparison with Korea and China Kazuyuki Motohashi and Takahiro Kanamori Research Center for Advanced Science and Technology University of Tokyo Outline
Financial Results Meeting: FY Ended March 2013
 Financial Results Meeting: FY Ended March 2013 (April 1, 2012 - March 31, 2013) May 10, 2013 Kintetsu World Express, Inc. 0 Contents Summary of Business Results for FY ended March 31, 2013, and Forecast
Manufacturing in Missouri: Skills-Mismatch Index
 I. Overview..... 2 II...... 2 SIC20 - Food and Kindred Products... 4 SIC21 - Tobacco Products... 5 SIC22 - Textile Mill Products... 6 SIC23 - Apparel and Other Finished Fabric Products... 7 SIC24 - Lumber
Kyosuke Shiotani Economic Statistics Division Research and Statistics Department Bank of Japan
 Kyosuke Shiotani Economic Statistics Division Research and Statistics Department Bank of Japan The views expressed are those of the speaker and should not be attributed to the Bank of Japan. 2 Index I.
Jobs Supported by Goods Exports 2016
 Jobs Supported by Goods Exports 2016 In 2016 South Africa exported over R1 trillion worth of goods to the world, and this supported about 1 million jobs, accounting for 6.6 per cent of total employment,
Who we are and What we do. Corporate Profile of Company Name: DISCO Inc. Established: October 1, 1973 Areas of Business Our Strength Over 40-years of
 International Graduate Recruitment in Japan Changes in Demand: Perspectives of Global Companies DISCO Inc. Global Business Development Isao Ogake Who we are and What we do. Corporate Profile of Company
Costs and Benefits of a Carbon Policy for China
 Costs and Benefits of a Carbon Policy for China Jing Cao Tsinghua University Mun S. Ho, Dale Jorgenson Harvard University Coping with Copenhagen Chinese Challenges in Defining a Climate Policy Oct. 15-16,
Structural Changes of Chinese Economy ---Based on Input-Output Analysis
 Structural Changes of Chinese Economy ---Based on Input-Output Analysis Shantong Li, Jianwu HE Jing WEN Development Research Center of the State Council, PRC Expressions in this report are the author s
THE MACHINERY INDUSTRY OF JAPAN 2008
 00 2009 THE MACHINERY INDUSTRY OF JAPAN 2008 CONTENTS 1. Recent Trends in the Machinery Industry 1-1. Production Trends... 1 1-2. Foreign Trade... 1 2. The Importance of the Machinery Sector in Japanese
Structural Change and Productivity Growth in India and China
 Structural Change and Productivity Growth in India and China JAGANNATH MALLICK School of Economics, University of Hyogo, Japan & JSPS 1 Scheme of Presentation Research Issues and Objectives The patterns
Modeling Multilateral Trade for the CAR Region
 Modeling Multilateral Trade for the CAR Region ADB Working Meeting on Central Asia Almaty, 10-11 June 2005 David Roland-Holst UC Berkeley Contents 1. Motivation 2. Overview of Regional Trade 3. Model and
BUSINESS-FACTS: 2 DIGIT SIC SUMMARY
 Project : South Tulsa BUSINESS-FACTS: 2 DIGIT SUMMARY Prepared For You 1.00 Mile Radius TOT All Industries MAN All Manufacturing ( 20-39) RET All Retailing ( 52-59) 01 Agricultural Production - Crops 02
Summary. Figure 1: Changes in Major Items (Year-on-Year Basis) (Establishments with 10 or more employees) Number of employees (-2.
 (Establishments with 10 or more employees) Number of employees (-2.") Summary 1. Trends in establishments with 10 or more employees The number of establishments decreased for the second consecutive year, and the number of employees decreased for the first time in three years.
Summary 1. Trends in establishments with 10 or more employees The number of establishments decreased for the second consecutive year, and the number of employees decreased for the first time in three years.
6.1 Direct Requirements Coefficients
 Chapter 6 Data Base Summary: Input-Output Multipliers Betina V. Dimaranan and Robert A. McDougall For many purposes it is useful to know the answer to the following question: If the final demand for a
Multi-Product Plants and Product Switching in Japan
 Multi-Product Plants and Product Switching in Japan Andrew B. Bernard Tuck School of Business at Dartmouth, CEPR & NBER Toshihiro Okubo Keio University This Version: July 2013 Abstract This paper explores
28 th Annual IAEE Interational Conference
 28 th Annual IAEE Interational Conference Impacts of Oil Price Changes on Taiwan s Economy - An Input-Output Study Ji Chou Nai-Fong Kuo Su-Ling Peng Jin-Duan Lai 3-6 June 2005, The Grand Hotel, Taipei
2. The Original Input-Output Table
 Azerbaijan Jesper Jensen and David Tarr 1 1. Introduction Azerbaijan is not represented individually in version 6 of the GTAP Data Base. The country is only represented indirectly via the composite region
Measuring Global Value Chains with. (World Input-Output Database)
") This project is funded by the European Commission, Research Directorate General as part of the 7th Framework Programme, Theme 8: Socio-Economic Sciences and Humanities. Grant Agreement no: 225 281 Measuring
This project is funded by the European Commission, Research Directorate General as part of the 7th Framework Programme, Theme 8: Socio-Economic Sciences and Humanities. Grant Agreement no: 225 281 Measuring
China s Manufacturing Development and Its Implications for Korea
 Vol. 8 No. 18 ISSN -2233-9140 China s Manufacturing Development and Its Implications for Korea LEE Hyuntai Associate Research Fellow, China Team, China Economy Department (htlee@kiep.go.kr) CHOI Jangho
China s Manufacturing Development and Korea s Countermeasures
 Vol. 8 No. 18 ISSN -2233-9140 China s Manufacturing Development and Korea s Countermeasures LEE Hyuntai Associate Research Fellow, China Team, China Economy Department (htlee@kiep.go.kr) CHOI Jangho Head
ARKLEMS+LAND DATABASE 3.0
 ARKLEMS+LAND DATABASE 3.0 Measuring Productivity in Unstable and Natural Resource Dependent Economies: ARGENTINA Second World KLEMS Conference Harvard University Cambridge, Massachusetts, August 9-10,
Quarterly Survey of Overseas Subsidiaries (Survey from July to September 2017) ~ Summary of the Results ~
 ~ Summary of the Results ~") Quarterly Survey of Overseas Subsidiaries (Survey from July to September 2017) ~ Summary of the Results ~ December 27, 2017 Research and Statistics Department Ministry of Economy, Trade and Industry 1
Quarterly Survey of Overseas Subsidiaries (Survey from July to September 2017) ~ Summary of the Results ~ December 27, 2017 Research and Statistics Department Ministry of Economy, Trade and Industry 1
A Frontier Approach to Canada-U.S. Multifactor Productivity Performance
 Catalogue no. F0027MIE No. 00 ISSN: 703-0404 ISBN: 0-662-33243- Research Paper A Frontier Approach to Canada-U.S. Multifactor Productivity Performance by Kaïs Dachraoui and Tarek M. Harchaoui Micro-Economic
Slicing Up Global Value Chains
 Slicing Up Global Value Chains Marcel Timmer a Abdul Azeez Erumban a Bart Los a Robert Stehrer b Gaaitzen de Vries a (a) Groningen Growth and Development Centre, University of Groningen (b) The Vienna
11-Years From 2000 to 2011: Despite 30 Million Population Growth, First 11-Yr Job Loss Since 1927-'38
 40% 11-Years From 2000 to 2011: Despite 30 Million Population Growth, First 11-Yr Job Loss Since 1927-'38 % Total US Job Growth/Loss: Eleven Years Ending October Each Year 30% 20% 10% 0% October 2000 to
Balassa (1965) Comparative Advantage by Sector of Industry, Brazil
 Comparative Advantage by Sector of Industry, Brazil") Balassa (1965) Comparative Advantage by Sector of Industry, Brazil 1986-2001 Marc-Andreas Muendler University of California, San Diego August 17, 2007 This report describes the construction of a series
Balassa (1965) Comparative Advantage by Sector of Industry, Brazil 1986-2001 Marc-Andreas Muendler University of California, San Diego August 17, 2007 This report describes the construction of a series
TREND OF THE TOTAL FACTOR PRODUCTIVITY GROWTH OF THE INDONESIAN ECONOMIC SECTORS
 TREND OF THE TOTAL FACTOR PRODUCTIVITY GROWTH OF THE INDONESIAN ECONOMIC SECTORS MAMAN SETIAWAN 1 CENTER FOR ECONOMICS AND DEVELOPMENT STUDIES UNIVERSITAS PADJADJARAN GUNTUR SUGIYARTO ASIAN DEVELOPMENT
FEDERAL RESERVE statistical release '4
 FEDERAL RESERVE statistical release '4 ' c G7 (419) Ror release at 9:15 a.m. (EST) November 30,1995 INDUSTRIAL PRODUCTION AND CAPACITY UTILIZATION (ANNUAL REVISION) The Federal Reserve's index of industrial
Summary. 1. Trends in establishments with 10 or more employees
 Summary 1. Trends in establishments with 10 or more employees The number of establishments increases for the first time in these six years, the number of employees increases for the first time in five