Crop Production Costs For 2017 (& Other Stuff)
|
|
|
- Edith Greene
- 6 years ago
- Views:
Transcription
1 Crop Production Costs For 2017 (& Other Stuff) BASA AGM, Cartwright December 12, Roy Arnott, P.Ag. Farm Management Specialist
2 Planning Should Start with COP s The corner stone of your Production, Management, or Marketing plan should start with calculating Cost of Production (COP). Knowing your COP (per bushel) is the first step in deciding what is a profitable or breakeven price. Cost : Benefit needs to be evaluated for every change to your crop plan.
3


4 Outline: Grain Markets & Yields Fertilizer Costs COP Summary & Analysis AgriInsurance Analysis Fixed Costs Land Equipment MYFARM Calculator *NEW* &Other Tools


5 Grain Market Outlook For 2017?? CAUTION: Objects in the Mirror are Closer Than They Appear!
6 New Crop Prices (Sept. Delivery) December 2015 Canola $10.25 RS Wheat $6.53 Oats - $2.95 Flax - $12.08 Soybeans - $10.02 W Wheat - $5.45 Barley - $4.00 Corn - $4.55 Peas - $8.82 December 2016 Canola $10.75 RS Wheat $6.25 Oats - $3.20 Flax - $12.50 Soybeans - $11.50 W Wheat - $5.00 Barley - $3.50 Corn $4.25 Peas - $7.00
7 RA#5 Yield per Acre $ $11.50 $12.00 $ $10.00 Yield Per Acre $ $8.00 $6.00 $ Per Unit $3.50 $3.20 $4.25 $ $ Canola Wheat Soybeans Barley Oats Corn $0.00 Yield $/unit Manitoba Agriculture
8 $ RA#5 Crop Production Costs ($/Acre) $ $30.00 $ $30.00 $ $ $ $ $30.00 $30.00 $30.00 $30.00 $/Acre $ $ $ $ $ $ $ $ $ $ $ $ $ $ $50.00 $0.00 Canola Wheat Soybeans Barley Oats Corn A. Operating Costs B. Fixed Costs C. Labour
9 $/Acre $160 $140 $120 $100 $80 $60 $40 $20 $0 HRS Wheat Costs ( ) Seed & treatment Fertilizer Chemicals
10 $200 Canola Costs ( ) $150 $/Acre $100 $50 $0 Seed & treatment Fertilizer Chemicals
11 Managing Risk - Fertilizer Pricing Timing of fertilizer purchases has been as important to overall profitability as better than average commodity marketing. Moving forward, we have to treat fertilizer as we treat our commodities.must be strategically purchased in our farm plan.
12 Fall vs. Spring Purchase True or False Fertilizer is always priced lower in the previous fall than in the spring? Almost True but not always. Based on long term data - Roughly 15% increase from fall to spring.
13 $900 Urea Nitrogen Fall vs. Spring Prices ( ) $800 $700 $600 Price ($/MT) $500 $400 $300 $200 $100 $ Previous Fall Spring Previous Fall Trend Spring Trend
14 $1, Fall vs. Spring Prices ( ) $1,400 $1,200 Price ($/MT) $1,000 $800 $600 $400 $200 $ Previous Fall Spring Previous Fall Trend Spring Trend
15 Fertilizer Spring vs. Fall Price Change % Price Change 25.0% 20.0% 15.0% 10.0% 5.0% 13.3% 16.6% 20.7% 17.5% 17.3% 13.1% 0.0% Average Increase Average without 2009 Average without 2008 and
16 $200,000 $180,000 $160,000 $140,000 $120,000 $100,000 $80,000 $60,000 $40,000 $20,000 $0 10 year Total Benefit of Fall Buying Fertilizer Average MB Farm that buys MT & 50 MT $41,600 $144,160 $10,000 $8,985 $21,596 $32,000 Savings Interest Cost Storage $20/MT (160 MT) (50 MT) $22,615 $90,564 Net Savings
17 $/Acre $70 $60 $50 $40 $30 $20 $10 $0 Canola Seed Cost ( )
18 $ RA#5 Crop Marginal Returns ($/Acre) $ $ $/Acre $ $ $ $0.00 -$ Canola Wheat Soybeans Barley Oats Corn Gross Revenue Margin Over Operating Margin Over Operating & Fixed
19 RA#5 Breakeven Yields (per Acre) Yield Per Acre Canola Wheat Soybeans Barley Oats Corn Breakeven Yield Over Operating Costs Breakeven Yield Over Op & Fixed Costs
20 RA#5 Breakeven Price ($/unit) $10.00 $9.00 $8.74 $8.53 $8.00 $7.00 $6.00 $5.87 $5.65 $/Unit $5.00 $5.21 $4.00 $3.43 $3.72 $3.63 $3.00 $2.15 $2.75 $2.54 $2.00 $1.47 $1.00 $0.00 Canola Wheat Soybeans Barley Oats Corn Operating Costs Operating & Fixed Costs
21 RA#5 Breakeven Yields (per Acre) % 120.0% 100.0% 113.2% 100.2% 121.6% 104.1% 108.2% 84.8% 80.0% 60.0% 40.0% 20.0% 0.0% Canola Wheat Soybeans Barley Oats Corn Target or Average Yield as % of B/E Yield
22 $ RA#5 Crop Marginal Returns 'Stress Test' - Price Down 10% & Yield Down 5% ($/Acre) $ $ $ $ $ $ $ $/Acre $ $80.00 $60.00 $ $63.02 $40.00 $20.00 $0.00 Canola Wheat Soybeans Barley Oats Corn Margin Over Operating Costs
23 $60.00 RA#5 Crop Marginal Returns 'Stress Test' - Price Down 10% & Yield Down 5% ($/Acre) $40.00 $42.08 $20.00 $/Acre $0.00 ($20.00) ($4.24) ($20.55) ($6.04) ($6.51) ($40.00) ($60.00) ($80.00) ($62.49) Canola Wheat Soybeans Barley Oats Corn Margin Over Op & Fixed Costs
24 $30.00 RA#5-80% Insured Value AgriInsurance Risk Analysis % $ % 7.00% 6.00% $ % 5.00% $ Per Acre $15.00 $ % 3.39% 2.77% $ % 3.00% 2.00% $ % $5.61 $6.04 $11.88 $7.82 $ % $0.00 Canola Wheat Soybeans Barley Oats Corn 0.00% 80% Insured Value Premium $/Acre Premium % of Insured Value
25 $ RA#5 Costs Not Covered By 80% Insured Value AgriInsurance $ $80.00 $30.00 $30.00 $30.00 $30.00 $30.00 $/Acre $60.00 $40.00 $30.00 $62.76 $71.58 $69.69 $55.80 $60.49 $20.00 $26.95 $0.00 $0.00 $0.00 $0.00 $0.00 $0.00 $0.00 Canola Wheat Soybeans Barley Oats Corn Operating Costs Fixed Costs Labour
26 $ RA#5-80% Insured Value AgriInsurance Risk Analysis % $ $ % 131% 125% 132% 148% 123% 140% 120% $ % $ Per Acre $ $ $ $ % 73% 70% 70% 72% $ % 80% 60% $ $ $ $ $ % $ % $0.00 Canola Wheat Soybeans Barley Oats Corn 0% 80% Insured Value Coverage of Operating Costs Coverage of Total Costs
27 $25.00 RA#5-70% Insured Value AgriInsurance Risk Analysis % 5.95% 6.00% $ % $ Per Acre $15.00 $ % 2.54% $ % 3.00% $ % $3.23 $ % $9.06 $5.13 $ % 2.00% 1.00% $0.00 Canola Wheat Soybeans Barley Oats Corn 0.00% 70% Insured Value Premium $/Acre Premium % of Insured Value
28 $ RA#5 Costs Not Covered By 70% Insured Value AgriInsurance $ $ $30.00 $30.00 $30.00 $30.00 $30.00 $/Acre $80.00 $60.00 $30.00 $40.00 $67.32 $91.67 $98.48 $95.76 $81.56 $ $20.00 $0.00 $0.00 $0.00 $0.00 $0.00 $0.00 $0.00 Canola Wheat Soybeans Barley Oats Corn Operating Costs Fixed Costs Labour
29 $ RA#5-70% Insured Value AgriInsurance Risk Analysis % 140% $ $ % 116% 111% 117% 109% 120% 100% $ $ Per Acre $ $ $ % 64% 62% 62% 63% $ % 80% 60% $ $ $ $ $ % $ % $0.00 Canola Wheat Soybeans Barley Oats Corn 0% 70% Insured Value Coverage of Operating Costs Coverage of Total Costs
30 Fixed Cost Management Gross Revenue = Price x Yield Per Acre Margin Over Operating Cost = Gross Revenue Operating Costs Margin Over Operating 35% Operating Costs 65%
31 Fixed Cost Management Owner Withdrawl 5% Equipment Cost 12% Land Cost 18% Operating Costs 65%
32 Land Buy More, Rent More, or Neither? Land prices in MB have risen significantly over the past number of years. Cash rental rates have also increased. Can we afford to farm land at these rent prices or afford to buy land at these prices? Fast answer is..depends.
33 Cash Rent Based on Gross Revenue Average range of cash rent across western Canada is 18 to 22% of gross revenue = $350 to $450 per acre gross revenues. $63 to $100 per acre cash rent


34 Cash Rent Based on Investment Return on Land Value (Landowner check & balance) Gross Revenue x 5 = $1,750 to $2,250/ac x 6 = $2,100 to $2,700/ac x 8 = $2,800 to $3,600/ac x10 = $3,500 to $4,500/ac Too Cheap Reality? Insanity Do you believe that farmland values are solely based on profitability??
35 Cash Rent Based on Investment Return on Land Value (Landowner check & balance) (cont.) Land market value $2,100 per acre x Long Term Investment Rate (5yr) 2.5 % + Property taxes $12.00 per acre Total Cash Land Rental $64.50 per acre Based on Reality
36 Cash Rent Based on Investment Return on Land Value (Landowner check & balance) (cont.) Land market value $3,600 per acre x Long Term Investment Rate (5yr) 2.5 % + Property taxes $12.00 per acre Total Cash Land Rental $ per acre Based on Reality
37 Land Planning Based on Gross Revenue or Margin Over Operating? What if we have: Flat or falling commodity prices? Increasing interest rates? Increasing production costs? How long can we make decisions on land and equipment based only on gross revenue?? Shrinking Margin Over Operating is going to be a real challenge down the road.
38 Machinery Investment What is Acceptable? (12 to 15% of Gross Revenue/acre) Machinery Investment range for most farms is 50% to 200% of gross revenue ($175 to $700) per acre. Generally, lower investment costs should be accompanied by higher repair costs in your budget. Sprayer, $75 Trucks, Grain Cart, Augers, Harrow, etc., $75 Drill & Planter, $75 4WD Tractor, $100 Combine & Swather, $175
 Use it for: pre season planning; growing season management; & crop marketing before and after the crop is in the bin.")
39 NEW!! MYFARM Crop Management Calculator Cost of Production / Marketing / Management 2017 Crop Year Based on the Crop COP (simple & easy to use) Cash costs on annual basis (bushel, ac & total) Use it for: pre season planning; growing season management; & crop marketing before and after the crop is in the bin.
40 MYFARM Crop Mgmt Calculator Cost of Production: Costs per bushel, per acre, & total farm. Gross revenue estimates. Marketing: Breakeven prices & yields Avg. price sold to date. B/E price on remaining unsold production. Management: Fertilizer, seed and grain storage required. Op. Expense ratio. AgriInsurance values and coverage estimates. Avg. & B/E land and machinery payment per ac What If? Analyzer
41 MYFARM What If? Analyzer What If? Printed: 2 Crop Price (Change %, +/-) 0% Crop Yield (Change %, +/-) 0% Fuel Cost (Change %, +/-) 0% Rese Fertilizer Cost (Change %, +/-) 0% Defau Added Machinery Lease Annual Payment ($) $0 Added Machinery Purchase Annual Payment ($) $0 Acreage Change - Land Purchase (Additional Annual Payment) $0 0 Acres Purchased Acreage Change - Land Sale (Reduced Annual Payment) $0 0 Acres Sold Acreage Change - Land Rental Payments Per Acre (+/-) $0 0 Acres (+/-) Land Rental Rate (Change $/acre, +/-) $0 Hired Labour Cost (Change +/- $) $0 Owner Withdrawl (Change +/- $) $0 Canadian Dollar Exchange Rate - USD (Change $, +/-) $0.00 (0 cent change from current value, affects fertilizer cost and grain mark Calculates the impact of the what if changes on costs, revenues and marginal returns.
42 Reseeding Decision Tool - Canola *** Enter/select changes to items in BLUE only *** Farm Information: MASC - Risk Area RA #2 MASC - Soil Zone E MASC - Individual Productivity Index (IPI) 1.00 MASC AgriInsurance Coverage level 80% Calculated MASC Probable Yield (bu/ac) 34.6 Original Crop Canola Reseeded Crop Canola Estimated Market Price ($/bu) $10.89 Damaged Canola Plant Stand Evaluation: Plants/m 2 Field Sample Plant Counts/m 2 15 * enter up to (5) plant counts in the boxes to the right * leave entries blank if less than (5) counts were taken * 10.8 plants/m 2 = approx. 1 plant/ft 2 Average Plant Count/m Plant Count - Yield Factor 0.75 Estimated Yield (bu/ac) 26.0 Estimated Gross Revenue ($/ac) $282.60
43 Reseeding Decision Tool - Canola Canola Reseeding Evaluation: Reseed Date 1st week June Date - Yield Factor Estimated Reseed Yield (bu/ac) 31.0 Estimated AgriInsurance Reseeding Indemnity ($/ac) $75.36 Estimated Seed Company Reimbursement ($/ac) $0.00 Reseed Seed Costs ($/ac) $60.00 Reseed Machinery Costs ($/ac) $15.00 Estimated Gross Revenue ($/ac) $ (net reseeding indemnity, reimbursements & expenses) Estimated Benefit (Cost) of Reseed Decision ($/ac) $55.35
44 Sclerotinia Treatment Decision Tool *** Enter/select changes to items in BLUE only *** Risk Factor Possible Answers Risk Points Number of Years Since last Canola Crop One to two years 10 Disease Incidence in Last Host Low (1% to 10%) 5 Crop Density Normal 5 Rain in the Last Two Weeks Less than 10 mm (0.4") 0 Weather Forecast Regional Risk for Apothecia Development Variable 10 Low Numbers 10 Estimated Canola Yield 40 bu/ac Estimated Price $10.75 $/bu Estimated Fungicide Cost $21.88 $/acre Estimated Application Cost $8.00 $/acre
45 Sclerotinia Treatment Decision Tool Sclerotinia Treatment Profitability Analysis Low High Potential Infection Range 15% 25% Potential $ Return/acre $2.37 $23.87 Potential Return on Investment 8% 80% Profit Probability 100% Spray Decision - Likely Beneficial to Spray Created and maintained by Manitoba Agriculture Farm Management December, 2017 Roy Arnott Darren Bond Farm Management Specialist Farm Management Specialist
46 Livestock Price Slide Calculator Printed: *** Enter changes to values in BLUE only Input Data: Contracted Price ($ per cwt.) $ Base or Projected Weight (lbs.) 550 Weight Increments (lbs.) 25 Price Slide - Initial (cents per lb.) 10 Price Slide - Increments (cents per lb.) 2 Price Slide Calculation 6 Cent Price Slide 8 Cent Price Slide 10 Cent Price Slide 12 Cent Price Slide 14 Cent Price Slide Weight $/cwt Price/Hd $/cwt Price/Hd $/cwt Price/Hd $/cwt Price/Hd $/cwt Price/Hd 500 $ $ $ $ $ $ $ $ $ $ $ $ $ $ 1, $ $ 1, $ $ 1, $ $ 1, $ $ 1, $ $ 1, $ $ 1, $ $ 1, $ $ 1, $ $ 1, $ $ 1, $ $ 1, $ $ 1, $ $ 1, $ $ 1, $ $ 1, $ $ 1, $ $ 1, $ $ 1, $ $ 1, $ $ 1, $ $ 1, $ $ 1, $ $ 1, $ $ 1, $ $ 1, $ $ 1, $ $ 1, $ $ 1, Current Market Value Price Slide Lbs. Price/cwt. Baseline Market Weight (lbs.) 550 $ Ending Market Weight (lbs.) 650 $ Calculated Current Market Price Slide (cents per lb) 6.62

47
48
49 Farm Software & Worksheets (Crops) agriculture/businessandeconomics/financialmanagement/farmsoftware-andworksheets.html Farm Machinery Custom & Rental Rate Guide Calculator /17 Crop Land Purchase Values 2016 Crop Land Rental Rate Crop Share Lease 2017 FertPlan Grain Bin and Farm Building Rental Cost Planner Grain Drying Cost Calculator Sclerotinia Treatment Decision Tool (Canola and Sunflower versions)
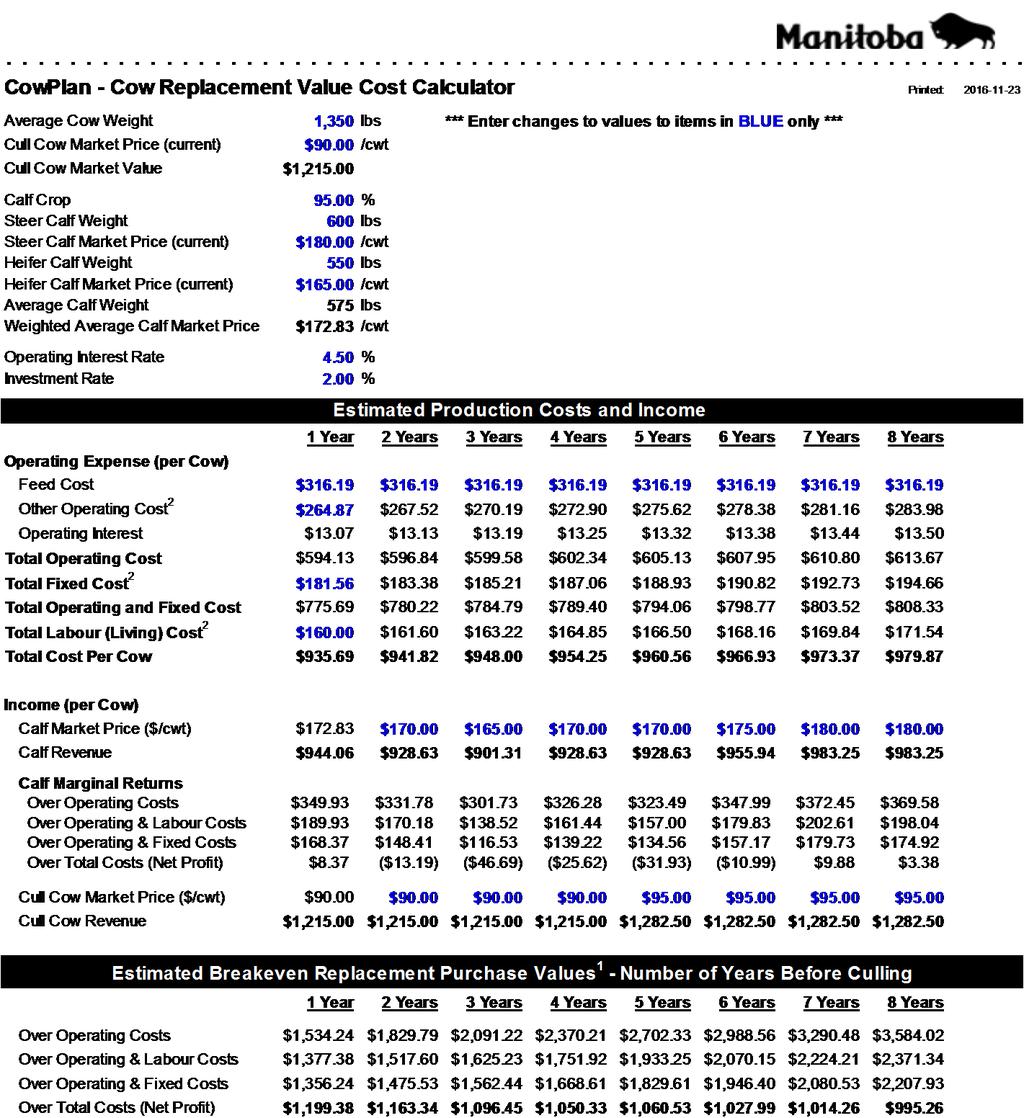
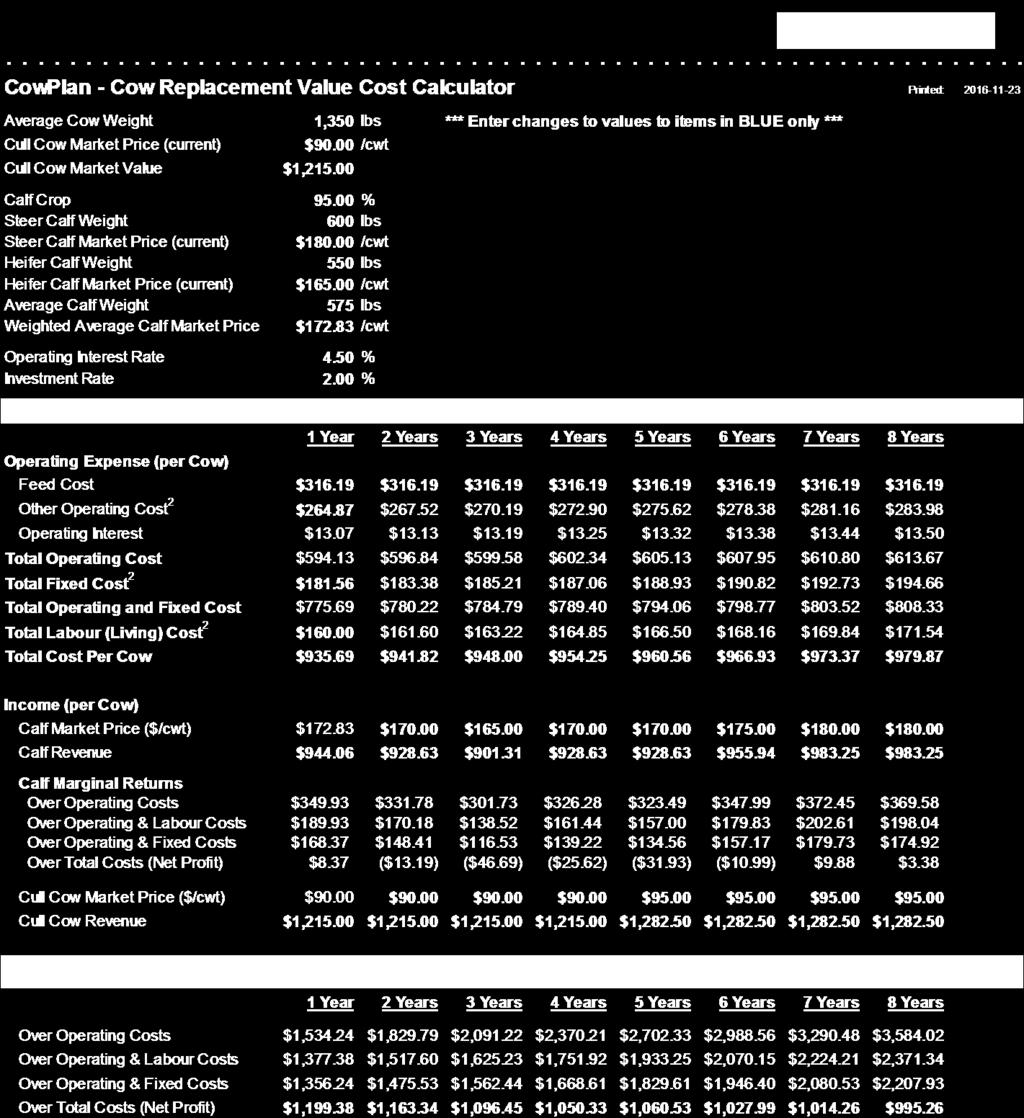
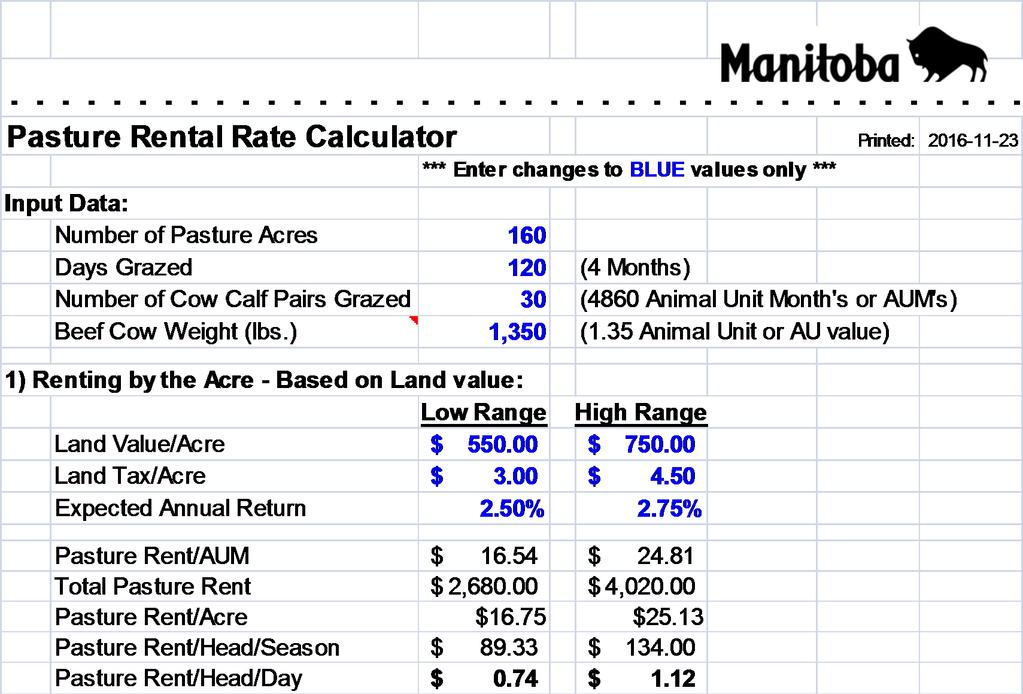
50 Farm Software & Worksheets (Critters) agriculture/businessandeconomics/financialmanagement/farmsoftware-andworksheets.html Price Slide Calculator Calf Creep Feed Calculator Cow Replacement Value Cow Overwinter Cost 2016 Cow Share Lease FeedPlan FencePlan Hay Storage Cost Pasture Rental Rate 2016 Standing Hay Cost

51 Questions? For more information Visit our website: Follow us on View our videos on YouTube: Contact me: Roy Arnott, P.Ag. Killarney GO Office
Agronomics & Economics Crop Management Decisions Need Both!
 Agronomics & Economics Crop Management Decisions Need Both!............................... Roy Arnott, P.Ag. Farm Management Specialist Anastasia Kubinec, M.Sc., P.Ag., CCA Manager - Crops Industry What
Guidelines for Estimating Crop Production Costs. in Manitoba
 Guidelines for Estimating Crop Production Costs in Manitoba ................................................. Guidelines For Estimating Crop Production Costs - 2017 Date: January, 2017 The following budgets
Crop Production Costs
 Guidelines for Estimating Crop Production Costs 2018 in Manitoba ................................................. Guidelines For Estimating Crop Production Costs - 2018 Date: January, 2018 The following
RentPlan Calculating Crop Land Rental Rates
 RentPlan Calculating Crop Land Rental Rates 2019 in Manitoba ................................................ Rentplan Crop Land Rental Rate Calculator Version 1.0 Date: January, 2019 This guide is designed
Special Crop Production Costs
 Guidelines for Estimating Special Crop Production Costs 2018 in Manitoba ................................................. Guidelines For Estimating Special Crop Production Costs - 2018 Date: January,
How does the cost of Corn Silage measure up?
 How does the cost of Corn Silage measure up?............................... Ben Hamm, P.Ag. Farm Management Specialist What we already know Doing your cost of production for your own farm is the starting
CROP PLANNING GUIDE 2018
 Brown Soil Zone Dark Brown Soil Zone Black Soil Zone CROP PLANNING GUIDE 2018 saskatchewan.ca/agriculture Specialty Crops CROP PLANNING GUIDE 2018 Each year, Saskatchewan Agriculture makes available the
CROP PLANNING GUIDE 2017
 Black Soil Zone Brown Soil Zone Dark Brown Soil Zone Specialty Crops CROP PLANNING GUIDE 2017 saskatchewan.ca/agriculture CROP PLANNING GUIDE 2017 Each year, Saskatchewan Agriculture makes available the
TOTAL $ PURCHASED INPUTS PRICE SEED $ LBS $45.00 $45.00 MANURE $ TON $21.60 $21.60 LIVESTOCK FAC & EQUIP $5.00 $5.
 TABLE 6. Wheat, sprinkler-irrigated, budgeted per acre costs and returns for a 1,280 acre farm with above average management, Union County, Planting dates: August 15 - November 15 Harvesting dates: July
The Changing Face Of Manitoba Crop Rotations
 The Changing Face Of Manitoba Crop Rotations Doug Wilcox, Manager, Program Development - Insurance Manitoba Agricultural Services Corporation Presentation to the Manitoba Agronomists Conference U of M,
Economics 330 Fall 2005 Exam 1. Strategic Planning and Budgeting
 Economics 330 Fall 2005 Exam 1 K E Y Strategic Planning and Budgeting Circle the letter of the best answer. You may put a square around the letter of your second choice. If your second choice is right,
Single Year National Avg. Prices Crop Name Units
 Potential Montana Covered Commodities Program Rates Direct National Loan Rates * Target Prices for CCPs: * Payment Crop Year Crop Years Crop Year Crop Years Crop Name Units Rate per Unit 2009 2010-2012
A. Circle the best answer. Put a square around your second choice, if you want. If your second choice is correct you get half credit.
 Economics 330 Exam 1 Fall 2007 Farm Budgeting and Planning K E Y A. Circle the best answer. Put a square around your second choice, if you want. If your second choice is correct you get half credit. (4
Revenue Components. Yield Government Programs Crop Insurance
 Farm Financial Conditions 25th Annual Crop Insurance Conference January 22, 2018 Fargo, ND Andrew Swenson Extension Farm Management Specialist Department of Agribusiness and Applied Economics North Dakota
Guidelines for Estimating. Beef Grassing Costs. in Manitoba
 Guidelines for Estimating Beef Grassing Costs 2016 in Manitoba ................................................. Guidelines For Estimating Beef Grassing Costs Based on a 500 Head (Steers) Date: March,
Methods and Procedures of Estimating Rent for Crop Share, and Flexable Cash Leases.
 Methods and Procedures of Estimating Rent for Crop Share, and Flexable Cash Leases. You are allowed/required to enter information shown in blue text in this spreadsheet. Print All Input and Results Click
Guidelines for Estimating. Bison Cow-Calf Production Costs 2017 in Manitoba
 Guidelines for Estimating Bison Cow-Calf Production Costs 2017 in Manitoba ................................................. Guidelines For Estimating Bison Cow-Calf Production Costs Based on a 100 Head
Highlights from the 2007 North Dakota Region 4 Averages
 Highlights from the 2007 North Dakota Region 4 Averages Overview for Region 4 The western part of North Dakota had a good year for crop production with an overall increase in yields and increases in prices.
ITEM PRICE YIELD TOTAL GROSS RETURNS OAT HAY TONS (IN FIELD) TOTAL PURCHASED PURCHASED INPUTS PRICE QUANTITY INPUTS TOTAL
 TOTAL PURCHASED PURCHASED INPUTS PRICE QUANTITY INPUTS TOTAL") TABLE 4. Alfalfa establishment, flood-irrigated, budgeted per acre costs and returns for a 20 acre part-time farm, San Juan County. Projected 2015 Planting dates: April 15 - June 1 Harvest dates: June
TABLE 4. Alfalfa establishment, flood-irrigated, budgeted per acre costs and returns for a 20 acre part-time farm, San Juan County. Projected 2015 Planting dates: April 15 - June 1 Harvest dates: June
TABLE 1. Basic cost information for Socorro County Projected 2017 BUDGET AREA... SOCORRO COUNTY Projected 2017
 TABLE 1. Basic cost information for Socorro County Projected 2017 BUDGET AREA... SOCORRO COUNTY Projected 2017 FARM SIZE... 200 ACRES Item IRRIGATION TYPE... FLOOD NUMBER OF CROPS... 10 Labor Wage Rate:
Guidelines for Estimating. Beef Cow-Calf Production Costs. in Manitoba
 Guidelines for Estimating Beef Cow-Calf Production Costs 2019 in Manitoba ................................................. Guidelines For Estimating Beef Cow-Calf Production Costs Based on a 150 Head
ORGANIC CROP PLANNING GUIDE 2010 AGRICULTURE FARM MANAGEMENT
 ORGANIC CROP PLANNING GUIDE 2010 BLACK SoiL Zone AGRICULTURE FARM MANAGEMENT ORGANIC CROP PLANNING GUIDE 2010 BLACK SOil ZONe Each year, The Saskatchewan Ministry of Agriculture assembles Crop Planning
AgriProfit$ Economics & Competitiveness Cropping Alternatives
 AgriProfit$ Economics & Competitiveness 2013 Cropping Alternatives Methodology Prepared May 10, 2013 Jason Wood, Economics Branch Disclaimer: The following regional forecasts are based on the most current
ORGANIC CROP PLANNING GUIDE 2010 AGRICULTURE FARM MANAGEMENT
 ORGANIC CROP PLANNING GUIDE 2010 Dark BrOWN SOil ZONe AGRICULTURE FARM MANAGEMENT ORGANIC CROP PLANNING GUIDE 2010 Dark Brown SOil ZONe Each year, The Saskatchewan Ministry of Agriculture assembles Crop
Profitability Outlook. Ag Credit Conference October 29, 2014 Roy Black & Dennis Stein Michigan State University
 Profitability Outlook Ag Credit Conference October 29, 2014 Roy Black & Dennis Stein Michigan State University 1 U.S.- Farm Gross Income, Expense & Net Income $500 $450 $400 $350 $300 Billion $250 $200
OPERATING INPUTS Units Price Quantity $/Acre Wheat Seed Bu./acre $ $ Custom Harvest Acre $ -
 Dryland Wheat Enterprise Budget - Grain and Graze 1000 acres farmed, 160 acres for this budget No Till - Continuous 2008 marketing year price projection Total PRODUCTION Units Price Quantity $/Acre Wheat
Costs to Produce Milk in Illinois 2003
 Costs to Produce Milk in Illinois 2003 University of Illinois Farm Business Management Resources FBM-0160 Costs to Produce Milk in Illinois 2003 Dale H. Lattz Extension Specialist, Farm Management Department
A Tax Incentive for Certified Seed: An Assessment
 A Tax Incentive for Certified Seed: An Assessment Al Mussell, PhD Canada s Independent Agri-Food Think Tank Outline Potential benefits of increased use of certified seed Estimating the tax credit The cost
Organic Crop Planning Guide
 Department of Agricultural Economics Project on Organic Agriculture July 2005 By Shon Ferguson and Simon Weseen Organic Planning Guide BLACK SOIL ZONE The following crop budgets are intended to serve as
CROP PLANNING GUIDE 2018
 Brown Soil Zone Dark Brown Soil Zone Black Soil Zone CROP PLANNING GUIDE 2018 saskatchewan.ca/agriculture Specialty Crops CROP PLANNING GUIDE 2018 Each year, Saskatchewan Agriculture makes available the
Farm Financial Management Workshop
 Farm Financial Management Workshop Next Generation North February 11 2017 John Molenhuis Business Analysis and Cost of Production Specialist Today Farm recordkeeping Ontario Farm Accounting Workbook Cost
CROP PLANNING GUIDE 2017
 Black Soil Zone Brown Soil Zone Dark Brown Soil Zone CROP PLANNING GUIDE 2017 saskatchewan.ca/agriculture Specialty Crops CROP PLANNING GUIDE 2017 Each year, Saskatchewan Agriculture makes available the
Soy Canada SOYBEAN PROCESSING WORKSHOP PRESENTATION NOVEMBER 16, 2017 BRANDON, MANITOBA
 Soy Canada SOYBEAN PROCESSING WORKSHOP PRESENTATION NOVEMBER 16, 2017 BRANDON, MANITOBA Overview 1) Soy Canada & Mandate 2) Soybean Sector Update & Trends 3) Growth in Western Canada 4) Commodity Soybean
Guidelines for Estimating. Beef Cow-Calf Production Costs 2017 in Manitoba
 Guidelines for Estimating Beef Cow-Calf Production Costs 2017 in Manitoba ................................................. Guidelines For Estimating Beef Cow-Calf Production Costs Based on a 150 Head
2018 Crop Outlook. Chris Hurt, Professor, Department of Agricultural Economics. Michael Langemeier, Assoc. Director, Center for Commercial Agriculture
 2018 Crop Outlook Chris Hurt, Professor, Department of Agricultural Economics Michael Langemeier, Assoc. Director, Center for Commercial Agriculture James Mintert, Director, Center for Commercial Agriculture
Flax Straw Biomass Production Costs
 Guidelines for Estimating Flax Straw Biomass Production Costs 2017 in Manitoba .............................................. Guidelines for Estimating Flax Straw Biomass Production Costs Date: January,
Organic. Projected Crop Budgets South Central North Dakota
 Section VI, Region 5 January 2003 Projected 2003 Organic Crop Budgets South Central North Dakota Andrew Swenson, Farm Management Specialist Brad Brummond, Walsh County Extension Agent Ron Haugen, Farm
Guidelines for Estimating. Beef Feedlot Finishing Costs. in Manitoba
 Guidelines for Estimating Beef Feedlot Finishing Costs 2017 in Manitoba .............................................. Guidelines For Estimating Beef Feedlot Finishing Costs For Weight Range of 650-1400
2012 STATE FFA FARM BUSINESS MANAGEMENT TEST PART 2. Financial Statements (FINPACK Balance Sheets found in the resource information)
") 2012 STATE FFA FARM BUSINESS MANAGEMENT TEST PART 2 Financial Statements (FINPACK Balance Sheets found in the resource information) Please use the Market Value when making the calculations for the Zimmerman
2012 STATE FFA FARM BUSINESS MANAGEMENT TEST PART 2 Financial Statements (FINPACK Balance Sheets found in the resource information) Please use the Market Value when making the calculations for the Zimmerman
FARMLAND OWNER ACCOUNT NO INVESTED CASH 7, CASH 0.00 ============ TOTAL CASH EQUIVALENTS 7, FARMLAND OWNER TRUST # ,887.
 CASH STATEMENT FARMLAND OWNER ACCOUNT NO. 999999 BEGINNING BALANCES INVESTED CASH 7,406.11 CASH 0.00 TOTAL CASH EQUIVALENTS 7,406.11 NET FARM CONTRIBUTIONS FARMLAND OWNER TRUST #9999 23,887.34 NON-FARM
Howard County Ag. Day: Beef Cow Economics
 Howard County Ag. Day: Beef Cow Economics Coordinated by: Presented by: October 10, 2013 Big Spring, TX Tommy Yeater, Howard County CEA AG Bill Thompson, Extension Economist, San Angelo, TX Today s Agenda
Grain Profitability Projections
 Grain Profitability Projections 2015-2016 Greg Halich 859-257-8841 Greg.Halich@uky.edu 311 CE Barnhart Dept. Agricultural Economics University of Kentucky Lexington, KY 40546 Corn and Soybean Prices New
 Grain Farm Income and Cash Rent Outlook: 2016 and 2017 Sep 7, 2016 Grain Farm Income and Cash Rent Outlook: 2016 and 2017 Budgets in management section of farmdoc Gary Schnitkey University of Illinois
Organic. Projected 2010
 February 2010 Projected 2010 Organic Crop Budgets South Central North Dakota Andrew Swenson, Farm Management Specialist Ron Haugen, Farm Management Specialist Brad Brummond, Walsh County Extension Agent
Crop Economics Outlook Gary Schnitkey University of Illinois
 Crop Economics Outlook 2014 Gary Schnitkey University of Illinois 2 Presentation Materials Visit the Downloads page at farmdoc.illinois.edu/webinars PDF of slides available now Video available tomorrow
2015 Michigan Dairy Farm Business Analysis Summary. Eric Wittenberg And Christopher Wolf. Staff Paper November, 2016
 2015 Michigan Dairy Farm Business Analysis Summary Eric Wittenberg And Christopher Wolf Staff Paper 2016-01 November, 2016 Department of Agricultural, Food, and Resource Economics MICHIGAN STATE UNIVERSITY
AGRICULTURE Statistics
 Agriculture Statistics Index: http://www.gov.mb.ca/agriculture/market-pricesand-statistics/index.html AGRICULTURE Statistics MANITOBA CROP HIGHLIGHTS 2016 CENSUS OF AGRICULTURE Farm Area: Total farm area
Oat Outlook. Ag Commodity Research & Oatinsight.com Vancouver, Canada
 Oat Outlook Ag Commodity Research & Oatinsight.com Vancouver, Canada Current Situation South American weather & EU debt concerns driving Ag & oat fundamentals Oat prices bucking seasonally higher trends
2011 STATE FFA FARM BUSINESS MANAGEMENT TEST PART 2. Financial Statements (FINPACK Balance Sheets found in the resource information)
") 2011 STATE FFA FARM BUSINESS MANAGEMENT TEST PART 2 Financial Statements (FINPACK Balance Sheets found in the resource information) Please use the Market Value when making the calculations for the Zimmerman
2011 STATE FFA FARM BUSINESS MANAGEMENT TEST PART 2 Financial Statements (FINPACK Balance Sheets found in the resource information) Please use the Market Value when making the calculations for the Zimmerman
Dryland Wheat Enterprise Budget - Grain and Graze 1000 acres farmed, 160 acres for this budget. OSU Name. OKLAHOMA COOPERATIVE Farm Description
 Dryland Wheat Enterprise Budget - Grain and Graze 1000 acres farmed, 160 acres for this budget OSU Name OKLAHOMA COOPERATIVE Farm Description EXTENSION SERVICE Total PRODUCTION Units Price Quantity $/Acre
4 Labor Wage Rate: Equipment operators $/hour $8.55 WATER USE
 TABLE 1. Acreage Summary, Union County, TABLE 2. Basic cost information for Union County, UNION COUNTY 1,280 ACRES Item SPRINKLER BUDGET AREA... FARM SIZE IRRIGATION TYPE NUMBER OF CROPS.. 4 Labor Wage
How Will Farmers Respond to High Fuel and Fertilizer Prices?
 How Will Farmers Respond to High Fuel and Fertilizer Prices? Damona Doye Regents Professor and Extension Economist Oklahoma State University Value of production by commodity Cattle and calves Poultry &
STATEMENT OF FARMING INCOME AND EXPENSES
 STATEMENT OF FARMING INCOME AND EXPENSES - 2012 NAME: Business #: AgriStability #: Commodity Sales and Program Payments Code Amount Other Farming Income Line Amount GRAINS & FORAGES: Program payouts -
International Benchmarks for Wheat Production
 September, 2016 International Benchmarks for Wheat Production Michael Langemeier, Associate Director, Center for Commercial Agriculture Elizabeth Yeager, Department of Agricultural Economics, Kansas State
Using Enterprise Budgets to Compute Crop Breakeven Prices Michael Langemeier, Associate Director, Center for Commercial Agriculture
 June 2017 Using Enterprise Budgets to Compute Crop Breakeven Prices Michael Langemeier, Associate Director, Center for Commercial Agriculture Enterprise budgets provide an estimate of potential revenue,
c) What optimality condition defines the profit maximizing amount of the input to use? (Be brief and to the point.)
 What optimality condition defines the profit maximizing amount of the input to use? (Be brief and to the point.)") AAE 320 Fall 2015 Exam #1 Name: 1) (10 pts.) Based on material covered in class, are these True or False? Mark your answer. a) T F Wisconsin farmers produce more cranberries than any other state b) T F
AAE 320 Fall 2015 Exam #1 Name: 1) (10 pts.) Based on material covered in class, are these True or False? Mark your answer. a) T F Wisconsin farmers produce more cranberries than any other state b) T F
ARC / PLC Program Overview
 ARC / PLC Program Overview 1 The 2014 Farm Bill provides the following: Eliminates DCP and ACRE program Allows for a one-time decision REALLOCATE base acres and/or UPDATE Counter-Cyclical Yields on a farm
USING ENTERPRISE BUDGETS TO IMPROVE CUSTOMER S PROFITS. Kevin Shelley 1 and Matt Hanson 2
 USING ENTERPRISE BUDGETS TO IMPROVE CUSTOMER S PROFITS Introduction Kevin Shelley 1 and Matt Hanson 2 Assisting farmer clients determine their cost of production and per-acre profits is something many
2017 Crop Outlook. Chris Hurt, Professor, Department of Agricultural Economics. Michael Langemeier, Assoc. Director, Center for Commercial Agriculture
 2017 Crop Outlook Chris Hurt, Professor, Department of Agricultural Economics Michael Langemeier, Assoc. Director, Center for Commercial Agriculture James Mintert, Director, Center for Commercial Agriculture
Pasture Production Costs 2017
 Guidelines for Estimating Pasture Production Costs 2017 in Manitoba ................................................. Guidelines For Estimating Improved & Unimproved Pasture Production Costs - 2017 Date:
STATEMENT OF FARMING INCOME AND EXPENSES
 STATEMENT OF FARMING INCOME AND EXPENSES - 2015 NAME: Business #: AgriStability #: Commodity Sales and Program Payments Code Amount Other Farming Income Line Amount GRAINS & FORAGES: Program payouts -
2014 Michigan Dairy Farm Business Analysis Summary. Eric Wittenberg And Christopher Wolf. Staff Paper December, 2015
 2014 Michigan Dairy Farm Business Analysis Summary Eric Wittenberg And Christopher Wolf Staff Paper 2015-08 December, 2015 Department of Agricultural, Food, and Resource Economics MICHIGAN STATE UNIVERSITY
2016 North Idaho Forage & Grazing School: Economics of Grazing Cover Crops
 2016 North Idaho Forage & Grazing School: Economics of Grazing Cover Crops Kate Painter, PhD Extension Educator Boundary County Ponderay, Idaho November 1, 2016 Worldwide glut of wheat is keeping prices
2004 Michigan Dairy Farm Business Analysis Summary. Eric Wittenberg Christopher Wolf. Staff Paper September 2005
 Staff Paper 2004 Michigan Dairy Farm Business Analysis Summary Eric Wittenberg Christopher Wolf Staff Paper 2005-10 September 2005 Department of Agricultural Economics MICHIGAN STATE UNIVERSITY East Lansing,
Kansas Farm Economy Update Land and Leasing
 Kansas Farm Economy Update Land and Leasing Mykel Taylor Kansas State University January 10, 2017 Net Farm and Ranch Income Returns over Total Costs ($/ac) $230,000 $180,000 $130,000 $80,000 $30,000 $(20,000)
Profit from crop & farm analysis
 National Tillage Crops Forum Profit from crop & farm analysis Ciaran Hickey Teagasc, Enniscorthy Outline Why carry out analysis On farm collection of data Machinery Costs calculator/profit monitor data
2009 Michigan Dairy Farm Business Analysis Summary. Eric Wittenberg And Christopher Wolf. Staff Paper December, 2010
 2009 Michigan Dairy Farm Business Analysis Summary Eric Wittenberg And Christopher Wolf Staff Paper 2010-04 December, 2010 Department of Agricultural, Food, and Resource Economics MICHIGAN STATE UNIVERSITY
FAPRI-UMC Report December 8, 2005
 FAPRI-UMC Report 17-05 December 8, 2005 FAPRI 2006 Outlook for Missouri Agriculture Food and Agricultural Policy Research Institute (FAPRI) College of Agriculture, Food and Natural Resources University
Margin = Difference. Navigating Through Financials- Careful Where you Step! Stepping Forward. Revenue $$$ less expenses $$$ Improving Margins
 Navigating Through Financials- Careful Where you Step! Margin = Difference Revenue $$$ less expenses $$$ Improving Margins Revenue Expense Both 1 2014 Margins Improved 2014 Margin Example Improved Margins
2007 Michigan Dairy Farm Business Analysis Summary. Eric Wittenberg And Christopher Wolf. Staff Paper December, 2008
 2007 Michigan Dairy Farm Business Analysis Summary Eric Wittenberg And Christopher Wolf Staff Paper 2008-04 December, 2008 Department of Agricultural, Food, and Resource Economics MICHIGAN STATE UNIVERSITY
Crop Leases in River Valley District 2016 Survey Data from Clay, Cloud, Washington, and Republic Counties
 Crop Leases in River Valley District 2016 Survey Data from Clay, Cloud, Washington, and Republic Counties Kim Kohls K-State Research and Extension Crop Production Agent River Valley District * * * * *
Crop Enterprise Budgets
 Economics 330 Lab 2 Fall 2008 Crop Enterprise Budgets Name The purposes of this lab are: (1) to become familiar with the concepts and organization of a crop enterprise budget (2) to estimate the costs
Guidelines for Estimating. Weaner Pig (Nursery) Costs 2012 in Manitoba
 Costs 2012 in Manitoba") Guidelines for Estimating Weaner Pig (Nursery) Costs 2012 in Manitoba Guidelines For Estimating Weaner Pig (Nursery) Costs 6-23 kg Based on marketing 35,381 pigs Date: October, 2012 This publication is
Guidelines for Estimating Weaner Pig (Nursery) Costs 2012 in Manitoba Guidelines For Estimating Weaner Pig (Nursery) Costs 6-23 kg Based on marketing 35,381 pigs Date: October, 2012 This publication is
World Wheat. Source: US Wheat Associates
 Grain Outlook 2017 2 Wheat 3 World Wheat Source: US Wheat Associates 4 World Wheat Source: US Wheat Associates 5 Source: US Wheat Associates 6 Source: US Wheat Associates 7 Source: US Wheat Associates
Chuck Danehower Extension Specialist Farm Management Danny Morris Extension Specialist Farm Management
 Maximizing Essential Crop Inputs Chuck Danehower Extension Specialist Farm Management cdanehow@utk.edu Danny Morris Extension Specialist Farm Management danhmorr@utk.edu Tennessee State Average Yields
c) What optimality condition defines the profit maximizing amount of the input to use? (Be brief and to the point.)
 What optimality condition defines the profit maximizing amount of the input to use? (Be brief and to the point.)") AAE 320 Spring 2008 Exam #1 Name: 1) (15 pts.) You hire laborers to weed crops on your vegetable farm. The table below reports the boxes of tomatoes yielded in a week with different numbers of laborers
AAE 320 Spring 2008 Exam #1 Name: 1) (15 pts.) You hire laborers to weed crops on your vegetable farm. The table below reports the boxes of tomatoes yielded in a week with different numbers of laborers
FARM BUSINESS MANAGEMENT
 FARM BUSINESS MANAGEMENT 2009 Annual Report Central and West Central Minnesota April, 2010 A Management Education Program Minnesota State Colleges and Universities Ridgewater College VISIT OUR WEBSITE
Custom Rates and Machine Rental Rates Used on Illinois Farms, 1968
 Custom Rates and Machine Rental Rates Used on Illinois Farms, 1968 ", '. r '.,. :. ~ : '~. d' University of Illinois at Urbana-Champaign C,ollege of Agriculture Cooperative Extension Service Circular 1003
Full Season Soybeans Enterprise 1998 Costs and Returns
 Full Season Soybeans Enterprise 1998 Costs and Returns KENTUCKY FARM BUSINESS MANAGEMENT PROGRAM Agricultural Economics Extension No. 2000-08 March 2000 By: WAYLON RAMMING, CARL DILLON, AND GREGG IBENDAHL
Costs to Produce Milk in Illinois 2016
 Costs to Produce Milk in Illinois 2016 Costs to Produce Milk in Illinois 2016 University of Illinois Farm Business Management Resources FBM-0160 Brandy M. Krapf, Dwight D. Raab, and Bradley L. Zwilling
Three factor to consider Market, Market & Market. Some of our agricultural produce is actually utilized on the farm from where they were produced
 Marketing Three factor to consider Market, Market & Market. Some of our agricultural produce is actually utilized on the farm from where they were produced (i.e. hay). However, over 90% of US wheat and
Custom Farm Work Rates
 EC499 (Revised) Custom Farm Work s on North Dakota Farms, 06 Ron Haugen, Farm Management Economist The U.S. Department Agriculture s North Dakota Agricultural Statistics Service, Fargo, in cooperation
Characteristics of Profitable Farms: Is Your Farm One of Them? Gary Schnitkey Dale Lattz
 Characteristics of Profitable Farms: Is Your Farm One of Them? Gary Schnitkey Dale Lattz Questions about the Most Profitable Farms Do the most profitable farms have the higher yields? Do the most profitable
Differences Between High, Medium, and Low Profit Producers: An Analysis of Kansas Farm Management Association Crop Enterprises
 www.agmanager.info Differences Between High, Medium, and Low Profit Producers: An Analysis of 211 213 Kansas Farm Management Association Crop Enterprises May 214 (available at www.agmanager.info) Kevin
Costs to Produce Corn and Soybeans in Illinois 2017
 Costs to Produce Corn and Soybeans in Illinois 2017 Costs to Produce Corn and Soybeans in Illinois 2017 Brandy M. Krapf, Dwight Raab, and Bradley L. Zwilling Illinois FBFM Association and Department of
Economics 230 Lab 4 Section 1 2 Due September 24 Fall 2010 WHOLE FARM BUDGET
 Economics 230 Name Lab 4 Section 1 2 Due September 24 Fall 2010 WHOLE FARM BUDGET The purpose of this lab is to (a) learn how to prepare a whole farm budget for a hypothetical farming situation, and use
SEED $ LBS $ $ HERBICIDE $ ACRE $32.40 $32.40 SUBTOTAL $ $ ACCOMPLISHMENT RATE
 TABLE 6. Alfalfa establishment, flood-irrigated, budgeted per acre costs and returns for a 500 acre farm with Planting dates: September 1 - September 30 SEED $6.00 20 LBS $120.00 $120.00 HERBICIDE $32.40
Economic Research Service The USDA Commodity Costs and Returns (CAR) Estimation Project
 Estimation Project") Economic Research Service The USDA Commodity Costs and Returns (CAR) Estimation Project William D. McBride USDA, ERS Presented at FAO Expert Group Meeting November 28, 2011; Addis Ababa, Ethiopia Outline
Economic Research Service The USDA Commodity Costs and Returns (CAR) Estimation Project William D. McBride USDA, ERS Presented at FAO Expert Group Meeting November 28, 2011; Addis Ababa, Ethiopia Outline
Washington County Agriculture Profile
 Washington County Agriculture Profile Economic Importance Past Trends Futur e Patterns Growth Management Implications Pr epared by: Jack Trzebi at owski W ashington County Farm Management Educator Family
SEED $ LBS $ $ NITROGEN (N) $ LBS $24.75 $24.75 PHOSPHATE (P205) $ LBS $56.00 $56.00 SUBTOTAL $ $260.
 $ LBS $24.75 $24.75 PHOSPHATE (P205) $ LBS $56.00 $56.00 SUBTOTAL $ $260.") TABLE 6. Alfalfa establishment, sprinkler-irrigated, budgeted per acre costs and returns for a 480 acre farm with above average management, Lea County, Planting dates: August 15 - September 1 SEED $6.00
TABLE 6. Alfalfa establishment, sprinkler-irrigated, budgeted per acre costs and returns for a 480 acre farm with above average management, Lea County, Planting dates: August 15 - September 1 SEED $6.00
1998 Double Crop Soybean Costs and Returns
 1998 Double Crop Soybean Costs and Returns KENTUCKY FARM BUSINESS MANAGEMENT PROGRAM Agricultural Economics Extension No. 2000-07 March 2000 By: WAYLON RAMMING, CARL DILLON, AND GREGG IBENDAHL University
Can You Afford That New Equipment?
 Can You Afford That New Equipment? FarmSmart January 2017 John Molenhuis and Dave McLeod, OMAFRA Today Machinery benchmarks Machinery costs Machinery options Machinery cost examples Combine Planter At
2016 Outlook and Crop Comparisons March 2016
 2016 Outlook and Crop Comparisons March 2016 Amanda R. Smith, University of Georgia Nathan B. Smith, Clemson University Row Crops Market Situation 2015 U.S. yields overall were strong and thus production
United States Department of Agriculture. Executive Summary 8:30 AM NOVEMBER 9, 2011
 United States Department of Agriculture National Agricultural Statistics Service NOVEMBER CROP PRODUCTION Executive Summary NOVEMBER 9, 2011 8:30 AM Contents Field Crops Small Grains Update Corn Sugarbeets
ARC / PLC Program Overview
 ARC / PLC Program Overview 1 The 2014 Farm Bill provides the following: Eliminates DCP and ACRE program Allows for a one-time decision REALLOCATE base acres and/or UPDATE Counter-Cyclical Yields on a farm
John Deere s Outlook on Cattle Economics
 John Deere s Outlook on Cattle Economics U.S. Drought having serious impact on livestock Drought impacting large cattle/dairy states Pushing feed prices higher Forced to feed hay earlier, haul water to
Enterprise Diversification to Improve Efficiency and Profitability
 Enterprise Diversification to Improve Efficiency and Profitability Objectives Provide an overview of production diversification Explore the opportunities and challenges in improving diversification Outline
BUDGET AREA... FARM SIZE IRRIGATION TYPE NUMBER OF CROPS.. Item
 TABLE 1. Acreage Summary, Quay County, TABLE 2. Basic cost information for the San Jon-Nara Visa area, Quay County, SAN JON-NARA VISA AREA, QUAY COUNTY 800 ACRES DRYLAND Item BUDGET AREA... FARM SIZE IRRIGATION
Wheat Market Outlook for
 Wheat Market Outlook for 2018-2019 2018 KSU Wheat Schools Ness City & Lenora, Kansas DANIEL O BRIEN EXTENSION AGRICULTURAL ECONOMIST Topics to be discussed.. 1) U.S.-China Trade & Other Key Grain Market
User Manual - Custom Finish Cattle Profit Projection
 User Manual - Custom Finish Cattle Profit Projection The purpose of this decision aid is to help facilitate the organization of custom finish cattle, feeder cattle price, costs and production data to project