Milestone Due Date 1 September 2016 Date submitted 1 September 2016
|
|
|
- Cordelia Copeland
- 6 years ago
- Views:
Transcription

 Develop creative ways to present the analyses that will assist advisors and growers to optimise management strategies and")
 Investigate methods of early prediction of variety performance based on mill data from the first years")
 Identify knowledge gaps that can be addressed in future projects.")
1 SRA Project Code Project Title Key Focus Area in SRA Strategic Plan Research Organisation(s) Chief Investigator(s) Optimising productivity and variety recommendations through analysis of mill data KFA1 Sugar Research Australia Dr Joanne Stringer 1) Identify factors associated with fluctuating productivity at the mill, subdistrict and individual grower level. 2) Develop creative ways to present the analyses that will assist advisors and growers to optimise management strategies and variety choice at the farm level across the crop cycle. Project Objectives 3) Investigate methods of early prediction of variety performance based on mill data from the first years after release. 4) Establish secure data storage protocols and develop automated analysis methods. 5) Identify knowledge gaps that can be addressed in future projects. Milestone Number 6 Milestone Due Date 1 September 2016 Date submitted 1 September 2016 Reason for delay (if relevant) Milestone Payment $26,274 Milestone Title Submit Final Report
2 Success in achieving the objectives SRA measures of success for Key Focus Area (from SRA Strategic Plan) Completely Achieved Partially Achieved Not Achieved - To deliver a world-class variety development program that produces varieties that provides increased cane and sugar yields - Enhance the variety breeding, selection and release program through increased collaboration with growers, millers and productivity services groups in the Herbert - An understanding of soil health issues such as Pachymetra that that may be negatively affecting sugarcane productivity - Provide an understanding of the importance of modern farming systems - To facilitate the practical application of the value chain model to enhance grower, harvester and miller interfaces and improve the adoption of harvesting best-practices - Development of a Decision Support Tool (QCANESelect TM ) to disseminate research findings to end-users to facilitate their uptake by growers and millers.


3 Production peaked in the Herbert River mills in 2005 at 5.5 Mt, and in 2015 was 4.5 Mt. Cane and sugar yields during this period have also been below average, particularly in 2011, and significant areas went from growing cane to other uses. Although some of this regional variation can be explained by extreme weather events or disease incursions, it is important to identify those causes that can be controlled in order to increase production/ profitability for industry. Huge amounts of data are captured annually by Wilmar and HCPSL (Herbert Cane Productivity Services Limited) and this significant investment is under-utilised in decision making. Productivity within a mill region is highly variable and depends on many factors. Development of innovative tools to analyse and summarise mill data by region could be used to identify production units performing below potential and the factors associated with this. Analysis of mill data in the Herbert has successfully identified groups of farms with similar productivity over time and the major factors associated with these groupings. One of the major findings was that those growers who have adopted modern farming systems had significantly higher productivity than those who use traditional practices. The impact of the Pachymetra resistance of previous varieties on yield of the current crop was also significant, suggesting that incorrect variety choice may be a major factor contributing to poor ratooning in the Herbert. In the small-farm-size groups, low and high performing growers had similar proportions of plant, young crops, old crops and old varieties. However, the low and high performing groups varied significantly in terms of new varieties, suggesting that the small-farm-size low-performing group were not adopting the new, more productive varieties to the same extent as the small-farm-size high-performing group. Age of the manager making the business decisions on the farm was also an important factor associated with cane yields. Growers who regularly (five or six years out of six) obtained clean seed had more than 10 % higher yields than growers who never or infrequently obtained clean seed and greater than 6 % higher yields than growers who only obtained clean seed in three or four years out of six. Timing of all operations, including planting, weed and nutrient management and harvesting, engagement with industry organisations and good soils with high CEC, were important factors that discriminated the small-sized low-producing farming enterprises from the small-sized high-producing farming enterprises. Although many factors affecting productivity have been identified in this project, future work should focus on identifying climate zones within the Herbert region to further refine productivity performance groupings (clusters). The climate zones could then be linked to soil type and farming systems information to improve variety recommendations. Previous research identified that selecting harvester ground speed according to crop size is a simple practice change that can result in significant improvement in sustainable productivity for all sectors of the industry, provided that harvester operators are appropriately rewarded. Results of this project suggest that reducing harvesting speeds to 8.5 km/h or less in crops with yields of t/ha and 7 km/h and less in crops of t/ha could lead to improvements in ratoon-crop yields. Using outputs from this project Wilmar, HCPSL and SRA have heavily promoted and invested in harvesting best outcomes in the Herbert. Further work needs to be undertaken to characterise harvesting contractor groups and their clusters so differences between high-and low-performing clusters can be understood. Since project outputs have been widely disseminated to Herbert industry the importance of clean seed and the Pachymetra resistance of previous varieties to yield of the current crop has been highlighted. Many more growers now undertake Pachymetra testing and want to source Pachymetra resistant varieties from HCPSL approved clean seed plots. In the past two years HCPSL have distributed between
4 tonnes of cane as whole stalks and billets out of clean seed plots compared to 200 tonnes previously. This research in this project has allowed HCPSL and SRA to design strategic adoption strategies for targeted audiences. Packages based on individual productivity drivers are being developed for growers whose business enterprise is greater than 175ha. Small farming enterprises with productivity in the t/ha will be involved in group extension activities. This project has resulted in enhancements to QCANESelect TM, which is being widely used by growers, millers, advisors and researchers. The ability to produce reports in QCANESelect TM, especially by soil type and crop class, will enable growers and advisors to evaluate variety and district performance so that better variety recommendations can be made and a range of factors that could be affecting productivity can be analysed. This will improve regional productivity as growers and advisors can base their variety selections or recommendations on the best available data and investigate factors that could be affecting regional productivity. In the past, this data has not been fully utilised and if it was analysed it required advisors many days to collate and produce reports. The data can now be uploaded at the end of each season and a wide range of reports will be immediately available to all users. Approximately 20% of growers in the Herbert participated in a pilot program for the Whole of Farm Planning module in QCANESelect TM. This will assist growers to plan, manage and implement their variety program, minimise the risk of disease and improve productivity. In future projects, further enhancements to QCANESelect TM will include allowing growers to easily complete a whole of farm plan by automated entry of farm data (block, area, variety, crop class etc.) directly from mill data. Many mill regions have also requested that benchmarking individual grower s performance relative to subdistrict and/or mill level by soil type, sub-district, and crop class would be very beneficial. Ratoonability is a feature of varieties that has been identified by growers as having great importance to profitability. In this project several measures of ratoonability, based on the mill data, were examined: loss in area from P crop through to 4 th or 5 th ratoon for a given planting year, actual yield and the rate of loss in yield (TCH, TSH or $/ha relative to mill average) across crops, slope of the regression line of crop class vs cane yield and cumulative cane yield relative to the P crop for the ratoons. All measures have some drawbacks. The best measures are the last two; however, what they suggest as good ratooning varieties does not agree with expert opinion. Future work should consider such factors as time of harvest in the development of a ratooning index.

5 Long-term average cane and sugar yields in Herbert River mill area are 80 and 11 t/ha, respectively (Garside et al., 2014). However, since 2005 cane supply to the mill has declined from 5.5 Mt to 4.2 Mt in Cane and sugar yields during this period have also been below average, particularly in 2011, and some land has gone from growing cane to other uses. Although some of this regional variation can be explained by extreme weather events or disease incursions, it is important to identify those causes that can be controlled in order to increase production/profitability for industry. As part of this process, the Herbert Cane Productivity Services Limited (HCPSL) launched an initiative to increase productivity to 85 t/ha (Target 85) in Garside et al. (2014) identified issues affecting productivity in the Herbert-they examined the impact of varieties, season conditions and crop management on productivity. Water management, and aspects of harvesting and season length were the main factors influencing productivity in the Herbert. This project reports on innovative methods to analyse and summarise mill data to optimise recommendations on variety choice and management practices, delivering increased productivity at the farm, mill and industry level in the Herbert. Selecting the best variety can significantly influence yields for a whole crop cycle but requires growers to consider many complex factors. After a variety has been released, data become available on its performance in different soil types, crop classes and seasons. Development of a Decision Support System (QCANESelect TM ) incorporating mill data can provide growers with up-to-date variety information to assist them to make the complex decisions involved in optimising variety composition on their farm. Objective 1: Identify factors associated with fluctuating productivity at the mill, sub-district and individual grower level. Analysis of productivity data Materials and methods Cluster analyses Rake data from the Herbert River mills for from Wilmar Sugar Australia was used in this project. Exploratory data analyses were undertaken on cane yield versus farm size to identify any potential outliers. Across all years there were only three values of cane yield that were greater 160 t/ha. These very high values were identified as outliers and were removed before any further analyses were conducted. To identify and understand the key factors affecting productivity in the Herbert, an exploratory data mining tool called cluster analysis was used. This method groups a set of objects in such a way that objects in the same group (cluster) are more similar to each other than to those in other groups (Tabachnick and Fidell, 2013). Previous research by Garside (2013) and Larsen (unpublished data) in the Herbert suggests that 25-30% of the variation in cane yield is due to weather. Hence, prior to cluster analyses the effect of season was removed by a fixed effect in the linear mixed model. These analyses were performed using ASReml (Gilmour et al., 1996).
6 Hierarchical agglomerative clustering using Ward s method was undertaken on the rake data (Ward, 1963). Four sets of clustering were undertaken: for cane yield and hectares harvested at the Farm level for sugar yield and hectares harvested at the Farm level for cane yield and hectares harvested at the Farm level for cane yield and hectares harvested at the ABN level These different clustering sets were needed as the factors that were used to relate to the groupings were not across all years. The rake data from contained 1029 unique FarmSplits. Note that in the Herbert a FarmSplit is equivalent to a FarmNo in other mill regions. FarmSplits < 10ha were omitted prior to analyses and a FarmSplit had to have data across all years to enable the major trends to be identified. Hence, if a grower was farming in the early years but not now, or only recently joined the industry, they would not be included. In the second set of clustering undertaken on sugar yield and hectares harvested, 2005 was dropped, as this contained a higher than normal amount of plant crop due to the large expansion in this year. In the final set of clustering undertaken rake data from were analysed. Analyses were undertaken on cane yield and area harvested at the business enterprise or ABN level. All clustering analyses were undertaken using SAS 9.4 (User s Guide, 2013) and R (R Core Team, 2016). Factors associated with clusters The objectives of the study were to identify the factors associated with clusters and then develop different extension programs for farms within the clusters, with the aim of optimising variety recommendations and increasing productivity. Some of the factors associated with the clusters which have been considered are: Districts Demographics Management practices/ farming systems Effect of Pachymetra resistance of previous variety on Pachymetra levels and yield Variety performance and management Clean seed Soil type Timing of all operations Use of new ground Engagement with industry organisations Young family helpers Readily take up new varieties Off farm income Elevation CEC Harvesting speed and pour rate.
7 Most of the data which relate to cluster groupings were made available by HCPSL except for the GPS tracking data and raw CEC data from Wilmar Sugar Australia, kriged CEC data from Dr Rob Bramley, CSIRO, and Pachymetra resistance ratings from SRA. Results Cluster analyses at the farm level Results of the cluster analysis undertaken on rake level data from for cane yield and area harvested are given in Figure 1. The number of clusters that have similar productivity over time is somewhat arbitrary, but with eight clusters there seemed to be quite good differentiation within each group goups are distinguished by a different colour in Figure 1. Each cluster contains a different number of FarmSplits. The highest performing cluster in 2005 (cluster 4) was consistently the highest performing group up to 2013 and similarly for the low performing group (cluster 2). Figure 1: Performance of clusters for cane yield from Herbert River mills from 2005 to 2013 The performance of the eight clusters versus area harvested for cane yield from is given in Figure 2. To maintain confidentiality for the small number of growers who harvest greater than 400 ha per FarmSplit, their performance has been hidden in Figure 2. The different colours in the graph are for the eight clusters. The number of FarmSplits in each cluster is identified in Figure 2. Cluster 1 is the high-performing small-farm-size growers and contained 125 FarmSplits, while Cluster 4 is the poorperforming small-farm-size growers and contained 169 FarmSplits. The FarmSplits circled in dark blue lie just below the HCPSL Target 85. It is possible that with tailored extension practices these FarmSplits could increase productivity to above 85 t/ha.

8 Figure 2: Performance of 8 clusters versus area harvested for cane yield in the Herbert from 2005 to 2013 The performance of the eight clusters versus area harvested for sugar yield from is given in Figure 3. To maintain confidentiality for the small number of growers who harvest greater than 400 ha per FarmSplit, their performance has been hidden in Figure 3. As for Figure 2 the different colours in the graph are for the eight clusters.
9 Figure 3: Performance of eight clusters versus area harvested for sugar yield in the Herbert from 2006 to 2014 In the analysis of data from clusters were needed to obtain good differentiation between the small-sized low-performing group and the small-sized high-performing group. The performance of the 10 clusters versus area harvested for cane yield from is given in Figure 4. To maintain confidentiality for the small number of growers who harvest greater than 400 ha per FarmSplit, their performance has been hidden in Figure 4. As for Figure 2 the different colours in the graph are for the 10 clusters.
.")
10 Figure 4: Performance of 10 clusters versus area harvested for cane yield in the Herbert from 2010 to 2014 Factors associated with clusters Districts Within the Herbert River mills areas there are six districts that tend to reflect different climatic zones to some extent (Garside, 2013). The average cane yield for the six districts from and proportion of total area are given in Figure 5. Approximately 70 % of the area is designated wet and 30 % dry. Figure 5: Average cane yield from 2005 to 2013 and proportion of total area for six Herbert districts
11 Cane yield (t/ha) In Figure 6 the colours in the map and cluster graph correspond, so cluster 1 (royal blue) in both is the small-sized high-performing FarmSplits and cluster 4 (brown) is small-sized low-performing group. Examination of Figure 4 reveals that there is no association between cluster group membership and district. Figure 6: Map of the clusters in relation to cluster grouping Demographics HCPSL has data on the age of the managers of FarmSplits in the Herbert from The data was broken up into ages of < 40, 40-50, 50-60, and > 70. Figure 7 gives the cane yields for the five different age groups together with the proportion of FarmSplits in each group. Highest productivity was noted for managers in the age group and this represents 33 % of the area in the Herbert % 26% 11% 20% 10% < >70 Age of Manager Figure 7: Age categories for managers of FarmSplits and cane yield in the Herbert The proportion of each age group in the eight clusters is given in Figure 8 with Figure 2 positioned in the top right hand corner as a reference.

12 Figure 8: Demographic data (% of cluster in each age group) for each cluster for cane yield from 2005 to 2013 Age of the managers of the FamSplits was an important factor affecting cane yields. In cluster 1 which is the high-performing small-farm-size group, 76 % of the managers of the FarmSplits were younger than 60. In contrast to this was the small-farm-size low-performing cluster 4 which had 62 % younger than 60. Management practices/ farming systems The 863 FarmSplits in the 2014 season were categorised into two groups: 1. MT (modern technology) FarmSplits that have adopted at least 2 out of 3 of the following: matching row spacing with machinery wheel tracks mound or double-disc-opener planting methods zonal tillage. 2. TM (traditional management) FarmSplits that use traditional farming practices. Of the 863 FarmSplits 149 were designated MT and 714 TM. The MT and TM groups were compared for cane yield and sugar yield in plant (P), plough-out replant (RP) in 2013 and first ratoon (1R) in This was done over all districts and by district. Results are given in Table 1 and Table 2.
13 Table 1: Comparisons of users of modern technology (MT) and traditional management (TM) practices in Herbert for cane and sugar yields for plant and plough-out replant in Comparisons were undertaken for the six districts and overall Cane yield (t/ha) Sugar yield (t/ha) District Modern technology (MT) Traditional management (TM) Difference Means significantly different (p < 0.05) Overall Y Abergowrie N Central Herbert Y Ingham Line Y Lower Herbert Y Stone River N Wet Belt N Overall Y Abergowrie N Central Herbert N Ingham Line N Lower Herbert Y Stone River N Wet Belt N Table 2: Comparisons of users of modern technology (MT) and traditional management (TM) practices in Herbert for cane and sugar yields for first ratoon in Comparisons were undertaken for the six districts and overall Cane yield (t/ha) District Modern technology (MT) Traditional management (TM) Difference Means significantly different (p < 0.05) Overall Y Abergowrie N Central Herbert Y Ingham Line Y Lower Herbert N Stone River Y Wet Belt N Sugar yield (t/ha) Overall Y Abergowrie N Central Herbert Y Ingham Line Y Lower Herbert Y Stone River Y Wet Belt N
. This difference was also significant for many of the districts, although not for the Wet Belt (p > 0.05). Effects of previous variety on Pachymetra level Levels of smut susceptible (S) varieties have decreased substantially from 91 % in 2005 to 2 % in 2014.")
14 Over all districts for cane and sugar yield in both P/RP and 1R crops the mean yields for the modern technology adopters were significantly higher compared to the group using traditional management practices (p < 0.05). This difference was also significant for many of the districts, although not for the Wet Belt (p > 0.05). Effects of previous variety on Pachymetra level Levels of smut susceptible (S) varieties have decreased substantially from 91 % in 2005 to 2 % in However, the level of intermediate (I) varieties for Pachymetra has increased dramatically from 4 % in 2005 to 90 % in 2014 (Figure 9). This increase was of major concern and prompted two courses of action: 50 % population of seedlings planted from resistant crosses (RxR) in the SRA breeding program and an updated Pachymetra survey undertaken in the Herbert by HCPSL in Figure 9: Pachymetra ratings for varieties in the Herbert The levels of Pachymetra spores in each of the 26 productivity zones is given in Figure 10. In 51 % of the samples, the Pachymetra levels exceeded the economic threshold of 50,000 spores /kg. In the Fairford-Trebonne (Central Herbert) and Forest Home (Lower Herbert) areas, levels exceeded 100,000 spores/kg and are likely to cause significant yield losses in intermediate varieties. Further details about the Pachymetra survey are given by Holzberger et al. (2016).
. Up to 15 % reduction in cane yield was found if a susceptible variety was planted following a susceptible variety, compared to industry best practice.")
15 Figure 10: Pachymetra survey results in the 26 productivity zone in the Herbert conducted during The survey found that the previous variety grown on a block had a significant effect on ratoon cane yield (Figure 11). Up to 15 % reduction in cane yield was found if a susceptible variety was planted following a susceptible variety, compared to industry best practice. Figure 11: Effect of Pachymetra resistance of the variety in the previous crop on the yield of the current crop. The values are the average of all blocks planted with R, I, S following previous crops of R, I, S averaged over all crop classes
16 Variety performance and management and crop class Another important factor which may discriminate cluster groups is variety performance and proportion of different crop classes. Varieties released prior to 2000 were classified as old. Old and new varieties considered were: Old varieties: Q138, Q157, Q158, Q164, Q174 A, Q186 A New varieties: Q190 A, Q200 A, Q204 A, Q208 A, KQ228 A. Using the results of the second set of clustering (Figure 3) undertaken on sugar yield and area harvested from , cluster groups 1 small-farm-size low-performing group (royal blue) and Cluster 3 small-farm-size high-performing group (green) were compared in terms of: % Plant: including plough out replant (RP) % Young crops: P, 1R, 2R and RP % Old crops: 3R, 4R, 5R and > 5R % New varieties: Q190 A, Q200 A, Q204 A, Q208 A, KQ228 A % Old varieties: Q138, Q157, Q158, Q164, Q174 A, Q186 A. The results are given in Table 3. Table 3: Comparison of small-farm-size high-performing and small-farm-size low-performing cluster based on sugar yield from 2006 to 2014 Comparison Cluster % Plant Small low performing Small high performing % Young crops % old crops % new varieties % old varieties The proportions for clusters 1 and 3 were very similar for plant, young crops, old crops and old varieties. The two clusters varied significantly in terms of proportion of new varieties (p<0.05). Approved seed HCPSL approved seed records from 2009 were made available. FarmSplits were classified on their usage pattern of clean seed over a six-year period: - Never - Infrequent: 1-2 times - Frequent: 3-4 times - Regular: 5-6 times. The cane yields for the four categories are given in Figure 12. Regular users of approved seed have a significantly higher cane yield than those who never use it or use it infrequently (p < 0.05).
 was compared to the small-farm-size low-performing group (cluster 2) in terms of their usage of approved seed (Figure 13).")
17 Figure 12: Average cane yield from for different categories of users of approved seed Using the results of the third set of clustering (Figure 4) undertaken on cane yield and area harvested from , the small-farm-size high-performing FarmSplits (cluster 3) was compared to the small-farm-size low-performing group (cluster 2) in terms of their usage of approved seed (Figure 13). To maintain confidentiality for the small number of growers who harvest greater than 400 ha per FarmSplit, their performance has been hidden in Figure 13. In Figure 13 the cluster graph is included to aid in interpretation. Larger sized growers are clearly the most frequent users of approved seed (clusters 6-9). Overall the smaller growers have poor adoption of approved seed but the small-farm-size highperforming Cluster group 3 has more than double the adoption of approved seed (35 % usage) compared with the small-farm-size low-performing cluster 2 (14 % usage). Figure 13: Clean seed data (% of cluster in each usage group) for each cluster for cane yield from 2010 to 2014
.")
18 Soil types Many markedly different soils are found in the Herbert (Wood et al. 2003). Most of the Herbert has been mapped to a scale of 1:5,000 but 10,000 ha in the Ingham Line area has not been mapped (Figure 14). The Wilmar database contains both the 6 broad soil groupings and a detailed classification that is a combination of the DNR Baker Wilson and Andrew Wood s soil types (Table 4). Figure 14: Soil map of the Herbert showing the area mapped to a scale of 1:5,000
.")
19 Table 4: Broad and detailed soil classifications in the Herbert The results of the cluster analysis and the 40 soils in the combined DNR Barker Wilson and Andrew Wood s classification were overlaid onto the one map. Unfortunately, to obtain the resolution needed to be useful this produced a series of 32 maps for the Herbert district (not given here). However, Andrew Wood s soils are mapped in Figure 15 (Wood et al., 2003). Interpretation of both revealed that cluster membership appears not to be simply due to soil type.

20 Note: from Page 21 of Soil-Specific Management Guidelines for Sugarcane Production (2003) by A. Wood, B. Schroeder and B. Stewart Figure 15: Soil map of the Lower Herbert River However, it is important to examine the various soil types as this may influence where to put our breeding selection trials and, hence, variety recommendations for QCANESelect TM. When deciding where to plant our variety trials we need all major soils types in the Herbert represented. Currently, in QCANESelect TM we use the 6 broad groupings for variety recommendations. However, we may be able to optimise recommendations if more soils are used. Hence, it was important to know from the detailed classification which contained 40 soils if: the soils we group together are well correlated with each other i.e. the various clays recommendations for the combined group are relevant for the individual soils that make up the group some soils would be better grouped with another group if they are better correlated with that group one larger soil group can help us to give better recommendations for another larger soil group.
21 To examine these questions, we used Herbert mill data for sugar yield (TSH) from for the major varieties: Cassius, KQ228 A, Mida A, MQ239 A, Q115, Q117, Q119, Q152, Q157, Q158, Q162, Q164, Q174 A, Q183 A, Q186 A, Q190 A, Q194 A, Q200 A, Q204 A, Q208 A and Q232 A. As there would be low tonnes with some soil types we only used data from soils that represented > 5 % of the 2014 crop based on hectares. The soils in this restricted group represented 72 % of the area of the 2014 crop. We then did a rank correlation on the performance of the soils in the various categories for P-4R crops. To facilitate easier interpretation of the results, a colour coding scheme was used: correlations > 0.6 are green, correlations > 0.4 and < 0.6 are yellow and correlations < 0.4 red. These results are given in Table 5. Table 5: Correlations amongst major soil types for the dominant varieties on DNR Baker Wilson/ Andrew Wood s soils for sugar yield: Hence, three of the clay soils, i.e. Sandy Clay, Clays, Silty Clay, are reasonably correlated with each other so a variety recommended for planting on one of these would be expected to do perform well on another. In addition, Clays, Terrace Silt loams, River Bank Alluvials are moderately correlated with most others so this simplifies the number of soils for variety recommendations. Unknown Sandy and Sandy Clay are poorly correlated. Further work is being done on the soils to explore these correlations. Cluster analyses at the ABN level A technique commonly used in psychology (Toledo Piza et al. 2014) is to characterize contrasting groups and then apply the results to target groups. Hence, the small-sized high-producing group and small-sized low-producing group were characterized according to the following factors: Timeliness of all operations including planting, weed and nutrient management and harvesting. This is a subjective measurement and is difficult to quantify any other way. A team of HCPSL staff were consulted in the development of this data. Use of modern farming systems (consisting of controlled traffic, mound planting and reduced
22 tillage). Growers must undertake 2 out of the 3 practices. HCPSL has Greensheet data on what practices growers are undertaking. Use of ground that had been out of cane production for numerous years due to MIS tree plantations or not been previously under cane. HCPSL has data on what farms were returned from MIS trees. Good soils. This classification is based on Andrew Wood s soil mapping data or the DNR Baker Wilson mapping classifications. Engage with industry organisations (such as HCPSL and SRA). HCPSL maintains a database of which growers it engages with on an annual basis. Young family helpers who are under 40 years old and who work on the farm full time or part time. Age of manager making the business decisions on the farm if greater than 70 years. HCPSL has a database consisting of the age of the farm owner and manager. Readily uptake new varieties in the first 5 years post release. The data used are from the Cane Block Mapping Layer from Wilmar. HCPSL also has a database on the uptake of new varieties through its Approved Seed Plots, plant tissue culture and hot water treatment programs. Off farm income. The top 30 growers in the small-sized high-producing and small-sized low-producing groups were each scored Y or N for each of the factors given above. In the analysis of data from at the ABN level six clusters were needed to obtain good differentiation between the small-farm-size low-performing group and the small-farm-size highperforming group. The performance of the 6 clusters versus area harvested for cane yield from is given in Figure 16. As for Figure 2 the different colours in the graph are for the six clusters. In Figure 16 Cluster 6 (green) is the small-sized high-producing ABNs while Cluster 4 (red) is the smallsized low-producing group. To maintain confidentiality for the small number of growers who harvest greater than 600 ha per ABN, their performance has been hidden in Figure 16. The groups of ABNs from t/ha across all the different sized area harvested will have targeted extension practices ranging from group-based extension activities for Cluster 3 and one-on-one for Clusters 1 and 5. To determine if cluster performance was related to district a map of the clusters was undertaken (Figure 17). Long-term averages in the 6 productivity zones ranges from 72 t/ha in the Wet Belt, 75 t/ha in Stone River and Ingham Line and 82 t/ha in Central Herbert, Lower Herbert and Abergowrie. Although there are more of Cluster 6 in Abergowrie, Lower Herbert and Central Herbert, there are some high producing ABNs in all other productivity zones.

23 Figure 16: Performance of six clusters versus area harvested for cane yield at the ABN level in the Herbert from 2012 to 2015 Figure 17: Map of the clusters in relation to cluster grouping undertaken at the ABN level The 30 top ABNs in cluster 6 and the 30 lowest ABNs in cluster 4 were characterized and the results are given in Table 6.
24 Table 6: Characterization of small sized high producing ABNs and small sized low producing ABNs Small high ABNs Timing Modern Technology New ground Good Soils Engage Young Family helpers Old New varieties Off farm income N Y Small low ABNs N Y Total The factors which are contrasting between clusters 4 and 6 are highlighted in orange and are timing of operations, good soils, engagement with industry organisations and adoption of new varieties. For Cluster 6 the small sized high producing ABNs, many of the farms in the Abergowrie district were high in elevation, although in the Lower Herbert there are many high-producing ABNs low in elevation (Figure 18b). For the small-sized low-producing ABNs there were farms which were both low and high elevation (Figure 18a). Figure 18: Maps of clusters 4 and 6 undertaken at the ABN level in relation to elevation in the landscape
25 Figure 19: Maps of clusters 4 and 6 undertaken at the ABN level in relation to soil type The small-sized high-producing growers are generally found in the pale brown, sandy loam, red loam and silty clay soils, but there are numerous exceptions. These soils are usually well drained and have higher CEC and are located along the Herbert River systems and its tributaries. It is interesting that very few high producing smaller growers are located in the Stone River and Ingham Line areas. This can be attributed the low general soil fertility of these soils and that general farm size being larger in in the Stone River and Ingham Line areas. Small-sized low-producing growers they are generally spread throughout the district and soil type appears to have little influence on productivity with these growers. The main factor driving productivity on these growers appears to be determined by management practices.
26 Figure 20: Maps of clusters 4 and 6 undertaken at the ABN level in relation to CEC in the topsoil Cluster 6, the small-sized high-producing ABNs, are generally found on the higher CEC soils in the Abergowrie and Lower Herbert districts (Figure 20 cluster 6). Generally, the small-sized low-producing ABNs are scattered throughout the district and there is no specific link to CEC in soils (Figure 20 cluster 4). Soil CEC can assist growers in obtaining higher productivity, but improved management practices such as good liming practices, legume fallows, increasing and conservation of organic matter will be able to mitigate some of the issues associated with low CEC soils. Analysis of harvesting speed and pour rate data Introduction Declining ratoon yields in sugar cane have been linked to the introduction of machine harvesting (Anon., 1992). Machine harvesting is a highly complex process with many variables that need to be taken in to account when considering its impact on productivity in the sugarcane industry (Anon., 2014). Selecting harvester ground speed relative to crop size has been identified as an area where simple practice change can result in significant improvement in sustainable productivity for all sectors of the industry (Kroes, 1997). In this exploratory study, cane yield and GPS tracking data enabled us to examine the impact of harvester ground-speed on stool damage resulting in ratoon yield loss for various crop sizes in the Herbert region. Materials and methods Data and definitions Cane yield and harvester GPS tracking data from the Herbert captured between 2012 and 2015 at rake level was used for analysis. Plant and plough-out replant crops have been excluded from the datasets to control for crop age at harvest. For the purposes of measuring yield loss from one ratoon to the next, the data were separated in to 3 seasonal datasets. Each of these datasets contained harvester speed information for the season of interest, and yield information for the season of interest, and the following season. For example, the 2012 dataset contained harvesting speed for the 2012 season, as well as yield information for both the 2012 and 2013 seasons.
27 The difference in yield from one ratoon to the next was measured by taking the harvested yield as a percentage of the yield in the following year. For example, the change in yield from was measured as (2013 yield 2012 yield) x 100. For the remainder of the report, this will be referred to as the following year yield fraction. Data were summarised at the harvesting contract group level for cluster analysis of group performance, and farm level for Cate-Nelson analysis. Cane yield and following year yield fraction were averaged for each group or farm. It has been shown that damage to the stool and subsequent reduction in ratoon yield caused by average ground speed varies depending on the size of the crop harvested (Kroes et al., 1994). To account for the impact of average ground speed in different crop sizes, the data were further broken down into six yield size groups for each season: 1. less than 40 t/ha 2. between 40 and 60 t/ha 3. between 60 and 80 t/ha 4. between 80 and 100 t/ha 5. between 100 and 120 t/ha 6. more than 120 t/ha. These groups were created in consultation with experts in harvesting and agronomy to assist in understanding the impact of ground speed on different crop sizes. Upon review, these groups were further refined to include only the t/ha, t/ha and t/ha groups. This decision was made to reflect the fact that yields below 60 t/ha are likely to be influenced by factors other than harvester speed, and yields of above 120 t/ha are not common in the Herbert region. For data summarised at harvesting contractor group or farm level for cluster and Cate -Nelson analysis, only harvested yields of less than or equal to 100 t/ha were included since average yields at a harvesting contactor group or farm level were rarely over 100 t/ha. A following year yield fraction greater than three standard deviations from the mean was considered an outlier and excluded from analysis. Statistical methods Linear mixed models were used to assess if there was a relationship between following year yield fraction and harvest contractor. Linear mixed models were chosen for their iterative estimation methods that handle unbalanced data well. Simple linear regression was used to assess the relationship between following year yield fraction and average harvester ground speed. Regressions were also performed to further explore this relationship for each yield size group. Cate-Nelson analysis (Cate and Nelson 1971), a technique common in agronomy, was used to explore the impact of different harvester ground speeds on different yield size groups to determine an optimum speed for each yield size to maximise following year yield fraction. The technique was originally used to assess the point at which adding more nitrogen to a crop would cease to have a yield response. This was referred to as the critical point. At this critical point nitrogen
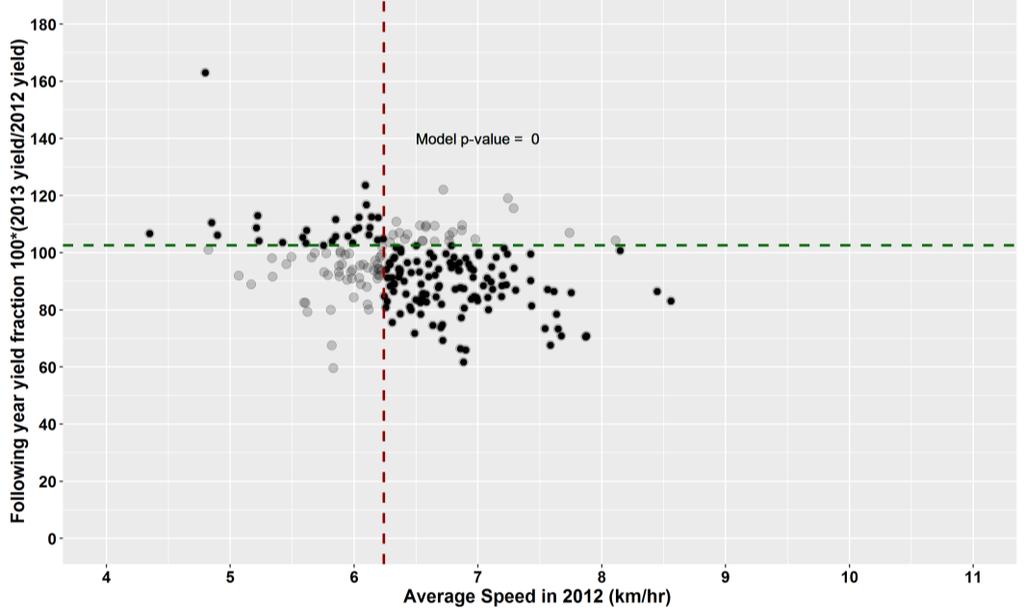
28 use was at its most efficient less nitrogen would generate a lesser yield, while more nitrogen would not likely lead to an increase in yield. Here, I applied the same principle to harvester speed. However, rather than increasing nitrogen and testing for yield response, we are reducing harvester ground speed and testing for an increase in following year yield fraction. The critical point in this case would be the speed at which following year yield fraction is maximised and further reductions in speed would not likely lead to further increase in yield fraction. K-means cluster analysis (Hartigan, 1975) was used to divide the data into clusters of harvesting groups that were similar in terms of following year yield fraction and speed. Results Linear mixed model results The linear mixed model analysis indicated a relationship between following year yield fraction and harvest contracting group in all three seasons (p < 0.001). Notwithstanding the highly significant results of contracting group as a predictor of following year yield fraction, it should be noted that there is a large portion of unexplained variation in following year yield fraction indicated by the models. This suggests there are many other factors affecting following year yield fraction which we have not measured or reported here. These need to be taken into account in future research. Simple Linear regression Given our primary interest in this study is relating to stool damage leading to a reduction in cane yield which has been linked to harvester ground speed (Hurney et al., 2005), average ground speed was selected as the variable of interest in exploring the relationship between contracting group and ratoon yield loss. Results from a simple linear regression indicate a relationship between average ground speed and following year yield fraction in 2012 and 2013 seasons. While the effect of average speed is significant, the R-squared value is low, indicating that average ground is one of many possible predictors of following year yield fraction. Figure 21 shows regression results.

29 Figure 21: Simple linear regression results of speed in current year versus following year yield fraction:

30 Simple linear regressions were performed within these yield size groupings. A stronger relationship between average ground speed and following year yield fraction is seen within yield size groups in 2012 with higher R-squared observed in each yield size group. Similar improvements are seen in 2013 and 2014 when split into yield size groups, albeit with lower coefficient and R-squared values than in Results are given in Figure 22, Figure 23 and Figure 24. Figure 22: Simple linear regression results of speed in 2012 on the following year yield fraction by yield size groups Figure 23: Simple linear regression results of speed in 2013 on the following year yield fraction by yield size groups

31 Figure 24: Simple linear regression results of speed in 2014 on the following year yield fraction by yield size groups Cate-Nelson analysis For the purposes of extension, it was pertinent to recommend a commercially viable ground speed which has potential to maximise the following year yield fraction. Cate-Nelson analysis was found to be a simple and effective method for achieving this. Critical x is the recommended average speed to maximise the following year yield fraction. In this analysis we targeted a ground speed of between 6 and 8 km/h and a following year yield fraction of 100 %. Results from 2012 and 2013 are shown in Figure 25, Figure 26, Figure 27 and Figure 28. No significant models were found for 2014 data and, hence, are not reported here. Cyclone Ita, which occurred in 2014, is likely to have played a part in this. Critical x (critical average speed) is shown in red, critical y in green. The transparent dots are points that do not fit the model. Across the 2 seasons, approximately 80 % of points fit the specified model.

32 Figure 25: t/ha The effect pf average speed in 2012 on following year yield fraction with Cate-Nelson analysis Figure 26: t/ha The effect of average speed in 2012 on following year yield fraction with Cate-Nelson analysis


33 Figure 27: t/ha The effect of average speed in 2013 on following year yield fraction with Cate-Nelson analysis Figure 28: t/ha The effect of average speed in 2013 on following year yield fraction with Cate-Nelson analysis The data indicates significant models (p < 0.05) for t/ha and t/ha and t/ha (3 out of 4) groups. Models results suggest that reducing harvesting speeds to 8.5 km/h or below in crops with yields of t/ha and 7 km/h and below in crops with t/ha could lead to improved following year yield fractions.


34 Cluster analysis K-means cluster analysis was undertaken with a view to indicate contactor groups where extension could be beneficial and as a tool for illustrating where improvements could be made to contractor groups and relevant growers where appropriate. Further work needs to be completed to characterise contractor groups and their clusters so the difference between high- and low-performing clusters can be understood. Plots showing clusters are included for completeness in Figure 29 through to Figure 31. However, no conclusions are made here and will be the subject of future harvesting and extension projects. Figure 29: Contractor groups clustered on 2012 average speed and following year yield fraction Figure 30: Contractor groups clustered on 2013 average speed and following year yield fraction

35 Figure 31: Contractor groups clustered on 2014 average speed and following year yield fraction Discussion In this project, we have analysed and summarised Herbert River mill rake data by using innovative techniques to identify some of the key drivers affecting productivity. The recently conducted Pachymetra survey by HCPSL (Holzberger et al., 2016) showed that the previous variety grown on a block had a significant effect on ratoon cane yield. Attention should be given by Herbert River farmers to the Pachymetra resistance of varieties they select for commercial production, not only taking into account the current crop, but when planning varieties to be grown in their fields into the future. This observation is consistent with known yield effects of the disease (Magarey, 1994) and with the effect varietal resistance on spore populations (Magarey and Mewing, 1994). The majority of the current crops are planted to intermediate varieties (90 %). These intermediate varieties are suffering significant yield losses when they follow susceptible varieties. There is less of an effect if they follow intermediate varieties. The impact of previous crop cycle Pachymetra rating on cane yield highlights the importance of rotating varieties based upon Pachymetra rating to better manage the disease. The data also highlight that the impact is much greater in older ratoons and that Pachymetra may be a major factor contributing to poor ratooning in the Herbert region. Further analyses are being conducted to better understand the impacts of Pachymetra when intermediate varieties such as Q208 A and Q200 A are planted following previous crops of Q208 A or Q200 A. High Pachymetra spore levels have been recorded under some crops of Q208 A and other intermediate varieties in the Herbert and other regions (Holzberger et al., (2016). Growers have reported poor growth when Q208 A is planted following a crop cycle of Q208 A. Analysis of the mill data may allow the effect of previous variety on the current crop to be investigated. Age of the managers of the FarmSplits is also an important factor affecting cane yields. HCPSL is now using demographic data to develop targeted extension strategies in the Herbert region. It has made investments through its Target 85 program into training and additional extension support to those growers under 40 years of age.
36 This study is the first time the industry has been able to quantify the impact of new technologies and farming systems. Data analysis suggest that growers who adopt modern technologies and farming systems have generally seen the benefits from making the change. It also allows HCPSL to target its extension strategies within the region. This study has found that the small farm high performing cluster of FarmSplits had a significantly higher uptake of new varieties compared to the small farm low performing group. This suggests that the small farm low performing group were not adopting the new, more productive varieties to the same extent as the small farm high performing group. Clean (disease-free) seed assists growers to manage systemic diseases, especially ratoon stunting disease, leaf scald and chlorotic streak (Croft et al., 2000). Increasing the adoption of clean seed could significantly increase productivity for the whole region. This was particularly evident in the small size low and small size medium performing clusters who had the lowest adoption of clean seed with % of these clusters never obtaining clean seed. New varieties are distributed from the clean seed plots and these figures would confirm that these lower performing clusters are slower to adopt new varieties. In some cases, small growers access clean seed and new varieties from neighbours, but because this may mean the clean seed is propagated for a number of years on-farm before they obtain the planting material it would be at a higher risk of being re-infected with diseases. This study has identified a number of factors associated with farm performance. Regularly obtaining clean seed, adoption of new varieties, modern farming systems, timeliness of operations and good soils with high CEC were the factors most associated with better farm performance. Some of the factors in this study are clearly interrelated, for example, growers who adopt new varieties usually obtain supplies of these new varieties from the clean seed plots so they are regular users of the clean seed plots. Early adopters of new technologies are often growers who adopt new varieties quicker, obtain clean seed regularly and may also be better at other farm operations such as weed control and timeliness of operations. The study clearly shows that productivity in the Herbert River district can be improved and has highlighted some areas where extension programs could have a big impact. The potential maximum cumulative advantage from all the major controllable factors is estimated to be > 20 t/ha. The harvesting elements of this project have largely been a gateway study for a number of dedicated harvesting and extension projects scheduled to begin in the months following the submission of this report. These projects will examine more closely the relationship between speed and ratoon yield loss and the impact of harvester optimisation on ratoon yield loss as well as cane and sugar loss in the year of harvesting, while controlling for appropriate harvester settings. Preliminary results in this project suggest that reducing harvesting speeds to 8.5 km/h or below in crops with yields of t/ha and 7 km/h and below in crops with t/ha could lead to improvements in ratoon crop yields.
37 Objective 2: Develop creative ways to present the analyses that will assist advisors and growers to optimise management strategies and variety choice at the farm level across the crop cycle. Many changes have been made to QCANESelect TM since the project commenced. Some of the new features include: 1) Enhancements to regional reporting 2) Calculations of weighted relative $/ha and tonnes sugar per hectare to assist with yield scores 3) Whole-of-farm planning. Regional reporting QCANESelect TM has been modified to accept Herbert mill data to the rake level from and to produce reports on productivity by variety, crop class, soil type, productivity zone, year and combinations of these groups. QCANESelect TM could previously provide some productivity reports but these were very limited because it did not have access to full mill data. Because the Herbert, Burdekin and Plane Creek mills use the same data collection system, it was also possible to use the same programming to provide productivity reports for the three Wilmar regions at the same time. Within these groups users can design reports to their own specifications for the following productivity measures: Tonnes cane % tonnes Hectares % hectares Tonnes cane per hectare (TCH) Tonnes sugar per hectare (TSH) $ return per hectare, user can set sugar price, harvesting cost and levies Average sugar (CCS) Seasonal sugar Weekly supply tonnes harvested per week of the season, CCS and mill average CCS for each week for the selected variety Fibre (only available for mills with NIR) Diseases percent of crop planted to susceptible, intermediate and resistant varieties. The ability to produce these reports, especially by soil type and crop class, will enable growers and advisors to evaluate variety and district performance so that better variety recommendations can be made and a range of factors that could be affecting productivity can be analysed. This will improve regional productivity as growers and advisors can base their variety selections or recommendations on the best available data and investigate factors that could be affecting regional productivity. In the past, this data has not been fully utilised and if it was analysed it required advisors many days to collate and produce reports. The data can now be uploaded at the end of each season and a wide range of reports will be immediately available to all users. HCPSL will now be able to use QCANESelect TM to produce their annual mill productivity report saving staff many days of time. The new productivity reports for the Herbert region can be accessed from the QCANESelect TM web site: The reports are accessed from the home page at the regional reporting tab (Figure 32).

38 Figure 32: QCANESelect TM home page The regional reporting page allows users to design their own reports and QCANESelect TM will access the mill data, analyse the data and return a report in a graphical form (Figure 33).
39 Figure 33: QCANESelect TM Regional Reporting page The system also allows users to download the analysed data so that they can use the data to create different reports or in further analyses. A few examples of productivity reports are shown in Figure 34 through to Figure 38. Figure 34 demonstrates how varieties can be compared for productivity on an individual soil type, in this case clay soil, and across crop classes plant to fifth ratoon. From this report growers and advisors can see which variety performs best. In this example Q208 A over the crop cycle is the highest yielding variety. KQ228 A performs well in plant crop, but productivity drops away in later ratoons. A tonnes legend is included below the chart and this is used to represent a level of confidence or caution in the charted data.
40 Figure 34: Productivity report for tonnes sugar/ ha (TSH) for selected varieties for Herbert clay soil for crop classes plant to fifth ratoon (P-5R) in 2014 Figure 35 shows the $/ha for a sugar price of $400 /t, harvest costs of $8.60 /t and industry levies of $1 /t for the same varieties on clay soils. In this report, Q200 A gives a similar $/ha to return as Q208 A. Q200 A has slightly less tonnes sugar/ha than Q208 A but because its CCS is above mill average for the majority of the season (Figure 36), its $/ha returns are similar to Q208 A.

41 Figure 35: Productivity report for $/ha for selected varieties for Herbert clay soil for crop classes plant to fifth ratoon (P-5R) for 2014 Figure 36 shows that growers are aware that Q200 A has excellent late season CCS and the proportion of this variety harvested late in the season is much higher than earlier in the season. Current recommendations for this soil type rank Q200 A lower than would be indicated by this data. Figure 36: Weekly supply of Q200 A and CCS for Q200 A and mill average in the 2014 season
 crops harvested in 2011 after the very wet harvest season in 2010 that prevented all crops from being harvested in that year.")
42 Figure 37 shows that the proportion of the crop harvested in each crop class from The obvious feature of Figure 37 is the standover (SO) crops harvested in 2011 after the very wet harvest season in 2010 that prevented all crops from being harvested in that year. The proportion of crop classes can have a significant influence on regional productivity. Figure 34 shows the fall in productivity with increasing crop class. If the proportion of plant crop and younger ratoons increases, the relative mill productivity should also increase and conversely if the proportion of older ratoons increases productivity will fall. Figure 37 shows that proportion of plant crop in 2011 and 2012 was lower than the average for the 10 years. This would be a carryover from 2010 when many growers were prevented from planting because of the extended period of wet weather during the normal planting season. The proportion of plant crop increased significantly in 2013 and Figure 37: Productivity report for percent hectares of each crop class from 2005 to 2014 Figure 38 provides a graph which shows the proportion of the crop made up by varieties that are susceptible, intermediate and resistant to smut. QCANESelect TM can plot this graph for any of the diseases which have resistance ratings in the SRA SPIDNet plant breeding database. Growers and advisors can monitor the success of programs to replace susceptible varieties, in this case smut susceptible varieties. Changes in the disease risk profile of a region can be monitored with these reports in QCANESelect TM.

43 Figure 38: Percent of crop planted in the Herbert to Smut susceptible, intermediate and susceptible varieties from 2005 to 2014 Yield scores One of the newest features in QCANESelect TM is calculation of weighted relative $/ha and TSH to assist growers and advisors in choosing which variety to plant. Programming of this feature has commenced but not completed. QCANESelect TM has been updated using mill data for the Herbert and Burdekin by soil types for to enable comparison to the current QCANESelect TM yield scores. QCANESelect TM uses yield scores to make recommendations and this is updated annually before the planting season commences. Local industry representatives and SRA staff can now use weighted relative $/ha to assist them in making recommendations on varieties thorough QCANESelect TM yield scores. The benefit of these analyses is that they summarise the mill data across years into one figure for each variety x soil type comparison and will aid in assigning the QCANESelect TM yield scores. By calculating the yield relative to mill average it accounts to some extent for the season and crop class effects. Although the graphs from QCANESelect TM for P-5R for TSH (Figure 34) or $/ha (Figure 35) for each soil type and each year are an excellent way of looking at the performance of varieties we have to summarise the data in the graphs into one Yield Score to be entered into QCANESelect TM to make variety recommendations. The weighted relative $/ha and TSH will help us to give better estimates of Yield Score especially for the varieties with adequate tonnages to give a reliable estimate. Like all mill data the figures need to be interpreted with care when they are based on a small sample or the values are very variable and/ or there are data for limited crop classes, for example, there are some anomalies where there is data for only small samples in one or two crop classes. To aid in interpretation we use the total tonnes and the weighted relative $/ha for each crop class. These analyses were used last year and the updated analyses can be used again to help with QCANESelect TM meetings.
44 The relative $/ha or TSH is calculated for each variety in each soil type and for each crop class relative to mill average for that same comparison. For example, we calculate the values for 2013, 2014 and 2015 and then calculate a weighted average over years. We have used a cube root transformation of the tonnes for each year to weight the averages. This gives the values which have the largest tonnage the highest weight while still giving some weight to lower tonnages in a different season. The relative $/ha were used to assist in assigning QCANESelect TM yield scores for varieties by soil types at the annual QCANESelect TM meetings in the Herbert and Burdekin in 2015 and Whole-of-farm planning An example Whole of Farm (WOF) plan for 'Stephen Adenata Farm number 6249A' is attached in Appendix 1 - Stephen Adenata - whole of far Appendix 1. This is based on real data although the Contact Name and Farm Number are fictitious for privacy reasons. Stephen only has one farm and this is in the Ingham Line district. He wants to plant a variety in his a clay block that is good for mid-season sugar. At the front of the report are graphs to show seasonal CCS, cane yield and sugar yield trends for the Ingham Line district by major varieties for Examination of these trends will assist Stephen in deciding what variety to plant. Q208 A had CCS levels above mill average for most of 2015 season although Q240 A had the highest sugar yield of the selected varieties. Stephen wants a variety that performs in his area as well as a variety that is resistant to smut and resistant/ intermediate to pachymetra root rot. He only recently purchased his farm on which the previous owner originally planted a lot of Q208 A. Stephen wants to change the variety and crop class make-up of his farm but even after selecting Q200 A to plant in his fallow block he has 67 % of Q208 A. The use of QCANESelect TM will assist him to plan, manage and implement his new variety program which will help to minimise the risk of disease and improve his productivity. In the 2016 season approximately 20 % of Herbert growers (by area) were invited to participate in a pilot program for the Whole of Farm Planning module. Many useful comments were obtained from this and due to the enthusiastic response this program will be expanded in 2017.
45 Objective 3: Investigate methods of early prediction of variety performance based on mill data from the first years after release. Ratoonability is a feature of varieties that has been identified by growers as having great importance to profitability. Maintaining acceptable productivity for more ratoon crops can greatly improve a grower s profitability because he can spread the high cost of planting over more years and have less periods of fallow when no income is produced. Several measures of ratoonability, based on the mill data have been considered: 1) Loss in ha from P crop through to 4 th or 5 th ratoon for a given planting year 2) Actual yield and the rate of loss in yield (TCH, TSH or $/ha relative to mill average) across crops 3) Slope of the regression line of crop class vs cane yield 4) Cumulative cane yield relative to the P crop for the ratoons. The benefit of 1 is that it is a measure of the actual decisions made by growers on how long to continue ratooning a variety. The problems with this measure is that it requires many years to obtain data for a variety (perhaps at least 5-6 years) and events such as disease incursions can mean that growers make decisions not on ratoonability but to remove a susceptible variety before the disease causes serious losses. Measure 2 has the benefit that it measures the economic return to the growers over a crop cycle. In discussions with growers they have pointed out that in some cases the mill data for older ratoons is biased because the poor yielding crops have been ploughed out and only the better ratooning (yielding) crops are retained. In an attempt to reduce this bias and to reduce the number of years to obtain an estimate of the ratoon performance of varieties, a model has been produced that measures the rate of decline in yield from first to third ratoon and uses this prediction to model economic returns across a 10-year period. The average $/ha/yr return over 10 years is proposed as a ratooning index for the variety. An example of the output of this model is shown in Figure 39. This model will be discussed with advisors, researchers and industry.

46 Figure 39: Ratooning index and ratooning model for four varieties based on Herbert mill data from A. ratoon index $/ha/year based on a 10-year period. B. Cumulative $/ha for 10-year period. Assumptions used in the model were that the grower ploughs out crop when returns drop below $1500/ha, the field is fallowed and it costs $1500/ha to replant the new crop. Actual average plant and first ratoon crop $/ha returns were used in the model and the predicted returns for 2R and subsequent ratoons were calculated from the rate of decline in yield for each individual variety from 1R to 3R in 2012 to The final two measures of ratooning examined the performance of three new varieties on 3 dominant soil types based on hectares from the 2014 crop which are Clay 47 %, Sandy 17 % and Terrace Loam 17 %. Rake data from were examined to determine suitability. Data from 2010 (very wet/ Cyclone Yasi), 2011 (large standover crop) and combinations < 10 t were not included. Ratooning was defined to be performance over 1R-5R and P crop was not included. As seasonal conditions have a large effect on cane yield, each year was analysed separately for each soil type and crop class effects were predicted as random effects. Crop class was then regressed against predicted cane yields for each soil type and slopes calculated. Values close to zero indicate that ratoons have not declined from 1R. Another measure, which does not assume a constant slope and uses the above data, is to calculate the cumulative cane yield relative to the P crop for 1R to 5R. Higher values indicate better ratooners with a maximum value of five. These results are given in Table 8.
47 Table 7: Slope of regression lines for crop class versus cane yield for major varieties x soils Variety Soil Slope of regression line Q200 A Clay -1.9 Q208 A Clay -2.5 KQ228 A Clay -1.2 Q200 A Sandy -2.2 Q208 A Sandy -1.2 KQ228 A Sandy -0.7 Q200 A Terrace Loam -3.3 Q208 A Terrace Loam -3.3 KQ228 A Terrace Loam -2.5 Table 8: Cumulative cane yield relative to P crop for major varieties x soils Variety Soil Cumulative cane yield relative to P crop Q200 A Clay 4.5 Q208 A Clay 4.1 KQ228 A Clay 4.5 Q200 A Sandy 3.9 Q208 A Sandy 4.4 KQ228 A Sandy 4.9 Q200 A Terrace Loam 4.1 Q208 A Terrace Loam 3.9 KQ228 A Terrace Loam 4.0 Results from Tables 7 and Table 8 suggest that KQ228 A is the best ratooner on all soils. However, this does not reflect what happens in the field. When managed and harvested early to mid-season, KQ228 A ratoons well. Time of harvest has a significant impact on ratoonability of KQ228 A and inflates the yield performance when compared to other varieties that are harvested mid to late in the season (which are subjected to additional crop stresses like drought and an early onset of the wet season). The data indicate that, for Terrace Loams soils, ratooning is generally not as good as on other soil types. The recent HCPSL Pachymetra district survey has found moderate to high levels of disease in this soil type, which is having a significant impact on cane yield and ratoonability. This soil has also been experiencing significant impacts due to YCS for the past four years. Further work needs to be undertaken on these ratooning measures to indicate the reliability of the estimates by weighting the values by hectares harvested or similar values. Once this is done, this information can be incorporated into QCANESelect TM Whole-of-Farm Plan module that growers use to assist them in what variety to plant.
48 Objective 4: Establish secure data storage protocols and develop automated analysis methods. On commencement of the project a Penetration Test conducted by PWC IT Security Consultants validated SRA s IT network security environment. SPIDNet database is held on a secure SRA SQL Server instance. Access to this data is controlled by individual user controls and limited to IT administrative staff and a consultant for the SPIDNet and QCANESelect TM web sites. Sensitive rake level data are not displayed in either web site. Loading of rake data is also restricted to SPIDNet administrators. All data displayed in SPIDNet are aggregated to district and soil type levels individual rake data are not displayed or exportable anywhere in either web site. In future development of a benchmarking module for Farms in QCANESelect TM access will be by secure password and the password is stored in an encrypted fashion using the PBKDF2 encryption approach. The login page uses HTTPS secure sockets for encrypted transmission of user credentials. Objective 5: Identify knowledge gaps that can be addressed in future projects. Although many factors affecting productivity have been identified in this project, future work should focus on identifying climate zones within the Herbert region to further refine productivity performance groupings (clusters). The climate zones could then be linked to soil type and farming systems information to improve variety recommendations. Further work needs to be done on classifying the 10,000 ha of soils in the Ingham Line which represents 15 % of the Herbert area. For this purpose, HCPSL have purchased a DUALEM-421. The Ingham Line area has many soils with sodic issues and other productivity constraints. Knowing where these zones are would allow for improved varietal recommendations, variety trials and remedial strategies such as variable rate lime and gypsum. The Dual EM is the most advanced instrument available and can map depths down to 1, 2 and 4 m through the soil profile and field elevation in one pass. It operates on the principle of electrical inductance created by alternating current and, therefore, has the advantage of not having to physically make contact with the soil, compared to the Veris unit. Given that productivity at times is driven by soil properties at different depths and not simply the top soil, this instrument provides a detailed multi-layer or multi-horizon 3-dimensional view of soil properties and, therefore, allows for improved understanding of the soil property x variety interaction. Knowledge gaps in the harvesting area which were identified during this project that can be addressed in future research include: What are the key factors limiting the reduction of ratoon yield loss in crops greater than 80 t/ha? How does harvester front end setup affect the relationship between speed and ratoon yield loss? What are the key factors causing differences between ratoon following year yield fraction and speed clusters identified in multivariate analysis? Can classification trees or other statistical learning methods provide useful decision support for harvest contractors and growers in selecting harvester settings appropriate to field and crop conditions? Further work needs to be completed to characterise contractor groups and their clusters so difference between high- and low-performing clusters can be understood. The harvester data have been characterized in terms of fan type, chopper configuration, use of GPS guidance and GPS auto steer and make, model and colour of harvester. After completion of the 2016 season, this data will be related to the productivity data clusters and farm performance. In future projects further enhancements to QCANESelect TM include allowing growers to easily complete a whole of farm plan by automated entry of farm data (block, area, variety, crop class etc.) directly from
49 mill data. Discussions with many mill regions have also requested that benchmark individual grower s performance relative to subdistrict and/or mill level by soil type, sub-district, and crop class would be very beneficial. Using the recommendations from the Ratooning Workshop different methods of developing a ratooning index will be investigated. These new measures should consider time of harvest.
50 References Anon (1992), The Contribution of Mechanical Cane Harvesting to the Productivity Plateau. BSES Publication. Anon (2014), SRA Harvest Best Practice Manual, Technical P ISBN: Publication MN Cate, RB, Nelson, LA (1971), A Simple Statistical Procedure for Partitioning Soil Test Correlation Data Into Two Classes, Proceedings of Soil Society of America 35: Croft B, Magarey R, Whittle P (2000). Disease management. In Manual of Cane Growing. (Eds DM Hogarth, PG Allsopp) pp (Bureau of Sugar Experiment Stations: Brisbane). Hartigan, JA (1975), Clustering Algorithms, New York: John Wiley & Sons, Inc. Henderson, R, Kempthorne, O, Searle,SR, von Krosigk,CM (1959). The Estimation of Environmental and Genetic Trends from Records Subject to Culling. Biometrics 15 (2): Holzberger G, Magarey RC, DiBella L, Bull JI, Nielson R (2016) Pachymetra survey in the Herbert River district Proceedings of the Australian Society of Sugar Cane Technologists 38: Garside AL (2013) Review of productivity trends in the Herbert sugarcane growing region. Herbert Cane Productivity Services Limited Publication 1/2013, pp Garside AL, Di Bella LP, Sefton M, Wood AW (2014) Review of productivity trends in the Herbert sugarcane growing region. Proceedings of the Australian Society of Sugar Cane Technologists 8, Gilmour AR, Gogel BJ, Cullis BR, Thompson R (1996) ASReml user guide 3, VSN International Limited, Hemel Hampstead, UK. Hurney, AP, Croft, BJ, Grace, D and Richards, DR (2005) Influence of Harvester Basecutters on Ratooning of Sugarcane. Final Report Project BS81S. Kroes, S (1997), The Optimum Harvester Forward Speed. Proceedings of the Australian Society of Sugar Cane Technoloogists, 19: Kroes, S, Harris, HD (1994), Effects of Basecutter and Crop Parameters on Permissable Cane Harvester Speeds. Conference on Engineering In Agriculture, New Zealand Paper no SEAg 94/052. Magarey RC (1994) Effect of Pachymetra root rot on sugarcane yield. Plant Disease 78, Magarey RC, Mewing CM (1994) Effect of sugarcane cultivars and location on inoculum density of Pachymetra chaunorhiza in Queensland. Plant Disease 78, R Core Team (2016). R: A language and environment for statistical computing. R Foundation for Statistical Computing,Vienna, Austria. URL SAS/STAT 9.4 User s Guide (2013) SAS Institute Inc, Cary, NC, USA.
51 Smith, MA (1992) The effect of harvester settings on cane loss and subsequent ratoon cane yield. BSES Publications Information Circulars IC Tabachnick, BG, Fidell, LS (2013) Using Multivariate Statistics 6th edition, Pearson, Boston. Toledo Piza, CMJ, de Macedo, EC, Miranda, MC, Bueno, OFA (2014) Contrasting group analysis of Brazilian students with dyslexia and good readers using the computerized reading and writing assessment battery, Frontiers in Psychology 5: 837. Ward JH Jr (1963) Hierarchical grouping to optimize an objective function. Journal of the American Statistical Association 58, Wood, A, Schroeder, B and Stewart, B (2003) Soil Specific Management Guidelines for Sugarcane Production: Soil reference booklet for the Herbert. CRC Sugar Technical Publication, Townsville. 92pp. Acknowledgements A large multi-disciplinary team from HCPSL, Wilmar Sugar Australia, Sugar Research Australia, and USQ worked extremely closely for the duration of this project and this includes Lawrence Di Bella, Mike Sefton, Rod Nielson, Peter Larsen, Ian Davies, Raymond De Lai, Jane-Maree Trigger, Heidi Clements, Felicity Atkin, Isaac Asamoah, Phil Patane, Danielle Skocaj, Barry Croft and Bernard Schroeder. I thank them for their enthusiastic support which made this project fun. Phil Lethbridge provided all the SQL programming for collation of the data and made many enhancements to QCANESelect TM. Chris and Stuart Norris from Norris ECT provided interpretation in the results of the GPS tracking data. This project relied heavily on quality data from many organisations and I thank them for providing this. Wilmar Sugar Australia provided the rake data from the Herbert River mills for Most of the data which relate to cluster groupings were made available by HCPSL except for the GPS tracking data and raw CEC data from Wilmar Sugar Australia, kriged CEC data from Dr Rob Bramley, CSIRO, and Pachymetra resistance ratings from SRA. The HCPSL Board, CANEGROWERS Herbert and many growers and harvesting contractors have contributed to this project and their support is greatly acknowledged. The financial support of Sugar Research Australia and Queensland Department of Agriculture and Fisheries to undertake this research is gratefully acknowledged.
, which will lead to optimal variety recommendations Identification")


52 Outputs: Specific outputs from this project include: A consistent and automated approach to the collation, analysis and reporting of annual mill data through the use QCANESelect TM Summary information on relative performance of varieties under similar conditions (soil, crop classes, sub-districts and productivity zones), which will lead to optimal variety recommendations Identification of management practices to improve productivity for groups of farms with similar production trends. Outcomes: This study has identified a number of factors associated with farm performance and these include regularly obtaining clean seed, adoption of new varieties, modern farming systems and the impact of the Pachymetra resistance of previous varieties on yield of the current crop. Project outputs have been widely communicated to the Herbert industry. This has resulted in one of the largest growers in the Herbert adopting wider row spacing from the commencement of the 2016 season and approximately 200 samples have been tested for Pachymetra. Approximately, 67 % of the Pachymetra samples have been greater than the economic threshold. Age of the grower making the business decisions on the farm is also an important factor affecting cane yields. HCPSL is now using demographic data to develop targeted extension strategies in the Herbert region. It has made investments through its Target 85 program into training and additional extension support to those growers under 40 years of age. Some of the factors in this study are clearly interrelated, for example, growers who adopt new varieties usually obtain supplies of these new varieties from the clean seed plots so they are regular users of clean seed. Early adopters of new technologies are often growers who adopt new varieties quicker, obtain clean seed regularly and may also be better at other farm operations such as weed control and timeliness of operations. The study clearly shows that productivity in the Herbert River district can be improved and has highlighted some areas where extension programs could be directed to have a big impact. The potential maximum cumulative advantage from all the major controllable factors is estimated to be > 20 t/ha. This project report is Commercial in Confidence. It contains sensitive grower data which is protected under the Privacy Act 1988 (Cth). Any use or replication of Figures and Tables in this report requires the permission of Wilmar Sugar Australia. An updated IP register which outlines background IP and new IP is attached _Intellectual_ Property_Register.doc

53 The overall aim of the project is to develop a decision support system to optimise variety recommendations and to do this we needed to consult with all sectors of the industry who will be the end users. Over the past two years, growers, millers, advisers and researchers across the industry have been consulted widely on the features they would like in QCANESelect TM and been continually updated on project outputs. The following meetings have been held since the project commenced and many of these have involved SRA Adoption staff: Tully Sugar Limited (TSL) and Tully Cane Productivity Services Limited (TCPSL) June 2014 Wilmar and HCPSL July 2014 Bundaberg Sugar 7 August 2014 MSF, TSL, TCPSL 8 September 2014 HCPSL Board 27 November 2014 Sunshine Sugar 3 February 2015 Wilmar Burdekin 3 March 2015 Review into Northern-Herbert plant breeding program 11 March 2005 Herbert Variety Adoption Committee (VAC) 16 April 2015 Burdekin VAC 23 April 2015 SRA Adoption Team meeting 13 May 2015 Herbert River CANEGROWERS September 2015 TSL 4 January 2016 SRA Adoption Team meeting 1 March 2016 QUT/ SRA Milling workshops 2 March 2016,8 March 2016, 17 March 2016 Herbert River CANEGROWERS, Victoria and Macknade mill management 9-10 March 2016 HCPSL Shed meetings 6-7 April 2016 Herbert industry 11 April 2016 Young Industry participants 20 April 2016 Herbert Walk and Talk day 21 April 2016 Harvesting forums 3-4 May 2016, May 2016 Mostly recently a series of targeted extension meetings were held on 1-4 July 2016 and August 2016 with growers and harvesting contractors from the Herbert. The aim of these meetings were to communicate the outcomes from the project which includes identification of the key drivers of productivity including the effects of harvesting speed and pour rate and enhancements to QCANESelect TM. In these one-on-one meetings with medium-large growers and contractors, individual productivity drivers were discussed. In one such meeting, a large pro-active harvesting contractor and his growers discussed ways to improve productivity for both sectors of the industry. Since there has been widespread communication of project outputs to industry one of the largest growers in the Herbert has adopted wider row spacing from the commencement of the 2016 season and approximately 200 samples have been tested for Pachymetra. Approximately, 67 % of the Pachymetra samples have been had spores numbers higher than the economic threshold of 50,000 spores /kg.

54 This project will result in better variety recommendations. Better selection of varieties will ensure that the Hebert industry grow the largest crops that will make the most efficient use of inputs such as nitrogen. Harvesting best outcomes will result in less sugar being left in the field and a reduction in BOD in runoff. This project used the Herbert as a pilot study to access, analyse and make improved recommendations based on Herbert mill data collected over the last 10 years. Detailed cluster analysis identified adoption of new varieties and modern farming systems, uptake of clean seed and management of Pachymetra, timing of all farm operations as factors associated with productivity in the Herbert regions. HCPSL has developed targeted extension programs using the factors identified and is delivering these programs to show growers the potential benefits they could achieve and encourage them to adopt the practices identified. These targeted extension programs are expected to result in greater grower uptake of the technologies and improved productivity. New improvements to QCANESelect TM using the detailed mill data has allowed better and more specific variety recommendations. Detailed yield and CCS reports are now available for the Herbert for the last 10 years for varieties by soil type, crop class and subdistrict. These reports were used extensively at the Herbert variety adoption committee meeting and made substantial improvements to the variety recommendations that are now available on-line in QCANESelect TM, through SRA variety guides and HCPSL staff one-on-one recommendations. The analyses have been automated in QCANESelect TM and will be updated each year and available immediately as new mill data is available. Improved variety recommendations will lead to improved yields for growers and improved and more reliable cane supply for the mills. A new project funded by SRA, 2016/032, will extend these benefits to all mill areas An ASSCT paper was submitted to the conference in May 2016 and was titled Optimising productivity and variety recommendations through analysis of mill data. A copy is attached as Appendix 2. Appendix 2 - ASSCT paper.pdf An article was written for Milling Matters on Mill Statistics and Varietal Composition and Distribution publications and how the data are accessible via QCANESelect TM. In the article the importance of decision support tools in increasing productivity for growers and millers was highlighted. A press release encouraging growers to use QCANESelect TM was distributed to media outlets.

55 (To be completed by the SRA-RFU Program Manager) Date Due Date Received Date Reviewed 1. Program Manager s Comments 2. Recommendation Page 55 Sugar Research Australia- Research Funding Unit- Research Project Final Report
Grower Update BPS ACTIVITIES PACHYMETRA. Welcome to the Christmas issue of our BPS newsletter.
 Grower Update ISSUE 13 DECEMBER 2013 Welcome to the Christmas issue of our BPS newsletter. We hope you find the articles contained in this issue informative. This issue contains: BPS Activities Pachymetra
Australian Sugar Milling Council submission to the Parliamentary Inquiry into Agricultural Innovation.
 Australian Sugar Milling Council submission to the Parliamentary Inquiry into Agricultural Innovation. The Australian Sugar Milling Council (ASMC) is the peak industry organisation for raw sugar milling
Enterprise GIS for the Sugar Industry. Raymond De Lai and Dr Andrew Wood 2
 Enterprise GIS for the Sugar Industry. Raymond De Lai and Dr Andrew Wood 2 1 Herbert Resource Information Centre, Ingham, Australia; 2 Sucrogen Cane Products, Macknade, Australia rdelai@hinchinbrook.qld.gov.au
Understanding the effect of harvester speed on subsequent ratoon performance in the Burdekin
 Sugar Research Australia Ltd. elibrary Completed projects final reports http://elibrary.sugarresearch.com.au/ Farming Systems and Production Management 2017 Understanding the effect of harvester speed
DEVELOPMENT OF A WEB-BASED DECISION-SUPPORT TOOL AND INFORMATION RESOURCE FOR SUGARCANE VARIETIES IN THE AUSTRALIAN SUGAR INDUSTRY
 DEVELOPMENT OF A WEB-BASED DECISION-SUPPORT TOOL AND INFORMATION RESOURCE FOR SUGARCANE VARIETIES IN THE AUSTRALIAN SUGAR INDUSTRY By D MILLARD 1, B CROFT 2, M COX 3, D PAYNE 4 1 BSES Limited Burdekin,
Assessment of blackcurrant bush size and wood quality to aid with N recommendations
 Assessment of blackcurrant bush size and wood quality to aid with N recommendations MAF Sustainable Farming Fund Project L07/047 By Murray Craighead, Nutrient Solutions Ltd and Geoff Langford, HortResearch
Green cane trash blanket Australia - Trash blanket
 Green cane trash blanket Australia - Trash blanket Elimination of burning as a pre-harvest treatment of sugar cane, and managing the resultant trash as a protective blanket to give multiple on and off-site
THE USE OF GEO-REFERENCED SOIL TEST DATA IN THE HERBERT DISTRICT
 THE USE OF GEO-REFERENCED SOIL TEST DATA IN THE HERBERT DISTRICT By LP DI BELLA 1, RJ COVENTRY 2, M SEFTON 1, PW MOODY 3, M HANKS 4, JK STRINGER 5, RE KERKWYK 1 1 Herbert Cane Productivity Services Ltd.,
Final report- Authors: L.Di Bella, A.Benson, M. Sefton, A.Royle, G.Holzberger and S. Sellick. Report date: 30/12/2013.
 Final report- Better use of sugarcane mill waste streams on farm through education and development of improved farming practices in the Herbert cane growing region. Authors: L.Di Bella, A.Benson, M. Sefton,
SOYBEANS IN THE SUGARCANE CROPPING SYSTEM
 SOYBEANS IN THE SUGARCANE CROPPING SYSTEM Alan Garside 1, Mike Bell 2, Neil Halpin 2, John Berthelsen 1 1 BSES LTD and 2 QDPI & F Sugar Yield Decline Joint Venture The SYDJV was largely funded by SRDC
PERFORMANCE OF VARIETIES N14 AND NCO376 IN THE SOUTH-EAST LOWVELD OF ZIMBABWE
 PERFORMANCE OF VARIETIES AND NCO376 IN THE SOUTH-EAST LOWVELD OF ZIMBABWE M ZHOU Zimbabwe Sugar Association Experiment Station, P/Bag 7006, Chiredzi, Zimbabwe E-mail: 399021@ecoweb.co.zw Abstract Varieties
ISSUE 26 JULY Welcome to the July issue of our BPS newsletter. We hope you find the articles contained in this issue informative.
 Grower Update ISSUE 26 JULY 2017 Welcome to the July issue of our BPS newsletter. We hope you find the articles contained in this issue informative. This issue contains: BPS Activities New Staff Pest and
CANE FARMING CONTRACTS AS A MECHANISM FOR TRANSFER OF TECHNOLOGY BETWEEN MILLERS AND SUGAR CANE GROWERS IN THE KENYA SUGAR INDUSTRY
 CANE FARMNG CONTRACTS AS A MECHANSM FOR TRANSFER OF TECHNOLOGY BETWEEN MLLERS AND SUGAR CANE GROWERS N THE KENYA SUGAR NDUSTRY W.W. Okelo Kenya Sugar Authority, Nairobi NTRODUCTON The overall policy objectives
MOST PROFITABLE USE OF IRRIGATION SUPPLIES: A CASE STUDY OF A BUNDABERG CANE FARM
 MOST PROFITABLE USE OF IRRIGATION SUPPLIES: A CASE STUDY OF A BUNDABERG CANE FARM L.E. BRENNAN 1, S.N. LISSON 1,2, N.G. INMAN-BAMBER 1,2, A.I. LINEDALE 3 1 CRC for Sustainable Sugar Production James Cook
THE ROLE OF WEATHER INFORMATION IN SMALLHOLDER AGRICULTURE: THE CASE OF SUGARCANE FARMERS IN KENYA
 THE ROLE OF WEATHER INFORMATION IN SMALLHOLDER AGRICULTURE: THE CASE OF SUGARCANE FARMERS IN KENYA Presented to THE WEATHER IMPACT SEMINAR At WAGENINGEN, THE NETHERLANDS By BETTY A. MULIANGA, PhD 22 nd
EVALUATION OF MICHIGAN SUGARBEET ADVANCEMENT PROGRAM. March 2001
 EVALUATION OF MICHIGAN SUGARBEET ADVANCEMENT PROGRAM March 2001 An evaluative study conducted in cooperation with Michigan State University Extension The Michigan Agricultural Experiment Station The Michigan
Climate and soils. Temperature. Rainfall. Daylength. Soils
 Climate and soils Based on climate alone, peanuts can be grown from Victoria, through New South Wales to north Queensland, the Northern Territory and Western Australia, and have been grown in all of these
A FINANCIAL ESTIMATION OF THE MILL AREA-SCALE BENEFITS OF VARIETY ADOPTION IN SOUTH AFRICA: A SIMPLISTIC APPROACH
 REFEREED PAPER A FINANCIAL ESTIMATION OF THE MILL AREA-SCALE BENEFITS OF VARIETY ADOPTION IN SOUTH AFRICA: A SIMPLISTIC APPROACH KADWA M 1, RAMBURAN S 2, NICHOLSON RJ 1 AND REDSHAW KA 2 1 South African
FACTORS AFFECTING CROP NEEDS FOR POTASSIUM WESTERN PERSPECTIVE TERRY A. TINDALL AND DALE WESTERMANN MANAGER OF AGRONOMY J.R
 FACTORS AFFECTING CROP NEEDS FOR POTASSIUM WESTERN PERSPECTIVE TERRY A. TINDALL AND DALE WESTERMANN MANAGER OF AGRONOMY J.R. SIMPLOT COMPANY USDA-ARS SOIL SCIENTIST SOIL FACTORS--POTATOES Potassium uptake
Soil Compaction in Sugarcane Fields Induced by Mechanization
 American Journal of Agricultural and Biological Sciences 6 (3): 418-422, 2011 ISSN 1557-4989 2011 Science Publications Soil Compaction in Sugarcane Fields Induced by Mechanization Prathuang Usaborisut
Burdekin Productivity Services 2017 AGM 22/8/2017
 Burdekin Productivity Services 2017 AGM 22/8/2017 Chairman s Report Reporting Period - 1 st April, 2016 31 st March, 2017. Other Directors Bryce Davies, Peter Larsen, Mark Vass, Lee Danello & Ian Davies.
Sustainability Trial in Arable Rotations (STAR project): a long term farming systems study looking at rotation and cultivation practice
: a long term farming systems study looking at rotation and cultivation practice") Aspects of Applied Biology 113, 2011 Making Crop Rotations Fit for the Future Sustainability Trial in Arable Rotations (STAR project): a long term farming systems study looking at rotation and cultivation
Aspects of Applied Biology 113, 2011 Making Crop Rotations Fit for the Future Sustainability Trial in Arable Rotations (STAR project): a long term farming systems study looking at rotation and cultivation
Response of Bannister and Williams oats to sowing date and plant density
 Response of Bannister and Williams oats to sowing date and plant density Georgie Troup 1, Blakely Paynter 1 and Raj Malik 2 Department of Agriculture and Food, Western Australia, 1 Northam and 2 Katanning.
EVALUATION OF THE ILLINOIS SOIL NITROGEN TEST IN THE NORTH CENTRAL REGION i. Abstract. Introduction
 EVALUATION OF THE ILLINOIS SOIL NITROGEN TEST IN THE NORTH CENTRAL REGION i C.A.M. Laboski 1, J.E. Sawyer 2, D.T. Walters 3, L.G. Bundy 1, R.G. Hoeft 4, G.W. Randall 5, and T.W. Andraski 1 1 University
Monitoring and Evaluation Framework
 Monitoring and Evaluation Framework Contact details Sugar Research Australia Limited (SRA) Head Office Mailing Address 50 Meiers Road, Indooroopilly, Queensland, 4068, Australia PO BOX 86, Indooroopilly,
The Potash Development Association Grain Legumes need Potash
 leaflet 18 The Potash Development Association Grain Legumes need Potash Grain legumes in the UK Field beans and peas are the main grain legume crops in the UK with, between them, around 250,000 ha grown.
SUGARCANE VARIETY IMPROVEMENT IN KENYA
 POSTER SUMMARY SUGARCANE VARIETY IMPROVEMENT IN KENYA JAMOZA J E Kenya Sugar Research Foundation (KESREF), PO Box 44-40100, Kisumu, Kenya japhethjamoza@yahoo.com Abstract Sugarcane (Saccharum spp. hybrids)
COTTON AUSTRALIA LIMITED
 UNFCCC Taskforce Department of the Prime Minister and Cabinet One National Circuit Barton ACT 2600 27 April 2015 Dear Taskforce Members, Cotton Australia welcomes the opportunity to make a brief submission
eprofit Monitor Analysis Tillage Farms 2016 Crops Environment & Land Use Programme
 eprofit Monitor Analysis Tillage Farms 2016 Crops Environment & Land Use Programme Printed by Naas Printing Ltd. Contents Foreword 2 Overall performance 3 Rented land 6 Comparison of eprofit Monitor to
EFFECTS OF LIME AND NITROGEN FERTILIZATION ON SOLIDS CONTENT IN GARLIC CLOVES
 EFFECTS OF LIME AND NITROGEN FERTILIZATION ON SOLIDS CONTENT IN GARLIC CLOVES by T. L. Jackson Department of Soil Science Oregon State University September 973 Garlic cloves with low solids* have been
Effects of Machine-Induced Soil Compaction on Growth and Yield of Sugarcane
 American Journal of Agricultural and Biological Sciences 5 (3): 269-273, 2010 ISSN 1557-4989 2010 Science Publications Effects of Machine-Induced Soil Compaction on Growth and Yield of Sugarcane Prathuang
FUNGICIDE SPRAYS TO CONTROL BROWN RUST (PUCCINIA MELANOCEPHALA) GAVE VARIABLE CANE AND SUGAR YIELD RESPONSES IN THE SOUTH-EAST LOWVELD OF ZIMBABWE
 GAVE VARIABLE CANE AND SUGAR YIELD RESPONSES IN THE SOUTH-EAST LOWVELD OF ZIMBABWE") FUNGICIDE SPRAYS TO CONTROL BROWN RUST (PUCCINIA MELANOCEPHALA) GAVE VARIABLE CANE AND SUGAR YIELD RESPONSES IN THE SOUTH-EAST LOWVELD OF ZIMBABWE ZVOUTETE P Zimbabwe Sugar Association Experiment Station,
FUNGICIDE SPRAYS TO CONTROL BROWN RUST (PUCCINIA MELANOCEPHALA) GAVE VARIABLE CANE AND SUGAR YIELD RESPONSES IN THE SOUTH-EAST LOWVELD OF ZIMBABWE ZVOUTETE P Zimbabwe Sugar Association Experiment Station,
ORCHARD GROUNDCOVER MANAGEMENT: LONG-TERM IMPACTS ON FRUIT TREES, SOIL FERTILITY, AND WATER QUALITY
 ORCHARD GROUNDCOVER MANAGEMENT: LONG-TERM IMPACTS ON FRUIT TREES, SOIL FERTILITY, AND WATER QUALITY Ian A. Merwin Department of Horticulture, Cornell University, Ithaca, NY, 14853 Summary Nitrogen (N)
Optimizing Strip-Till and No-Till Systems for Corn in the Biofuel Era
 Optimizing Strip-Till and No-Till Systems for Corn in the Biofuel Era Tony J. Vyn Agronomy Department, Purdue University Abstract: Recent developments in biofuel demand and the rapid adoption of modern
Sunflower in the Central Queensland Farming System
 Sunflower in the Central Queensland Farming System Kevin McCosker 1 & Andrew Farquharson 2 1 Agency for Food & Fibre Sciences, Qld. Dept. Primary Industries, LMB 6, Emerald, Qld., 4720 2 Pioneer Hi-Bred
The Plan would address seasonal planning and ensure that the Mill and growers work each season s production path.
 Cane Supply and Processing Agreement 1. The Tully District has significant potential to grow the area that supplies the mill and sugar per hectare productivity. A whole of district Strategic plan developed
RICE FARMING NOW A REALISTIC OPTION FOR GROWERS IN REGION
 Size: 206.00 sq.cms. RICE FARMING NOW A REALISTIC OPTION FOR GROWERS IN REGION WHILE Mackay s first commercial rice crop is about ready to harvest, Andrew Barfield has trialled different rice varieties
Site-specific crop management (SSCM) for Australian grains: how to begin
 for Australian grains: how to begin") Site-specific crop management (SSCM) for Australian grains: how to begin Brett Whelan Australian Centre for Precision Agriculture, University of Sydney, NSW 2006. Site-specific crop management (SSCM)...
Site-specific crop management (SSCM) for Australian grains: how to begin Brett Whelan Australian Centre for Precision Agriculture, University of Sydney, NSW 2006. Site-specific crop management (SSCM)...
High-Yielding Cane Booklet
 High-Yielding Cane Booklet More information We are committed to providing the Australian sugarcane industry with resources that will help to improve its productivity, profitability and sustainability.
PERFORMANCE EVALUATION OF SASRI VARIETIES N19 AND N25 IN TANZANIA
 PERFORMANCE EVALUATION OF SASRI VARIETIES N19 AND N25 IN TANZANIA CHAMBI JY AND ISA DW Sugarcane Research Institute, PO Box 30031, Kibaha, Tanzania sri@awayafrica.com Abstract SASRI varieties N14, N19,
Soil Compaction in Sugarcane Fields under Mechanized and Labor Farming
 Soil Compaction in Sugarcane Fields under Mechanized and Labor Farming Prathuang USABORISUT Kasetsart University, Kampahaengsaen Campus, Faculty of Engineering at Kamphaengsaen, Department of Agricultural
CONCEPT OF SUSTAINABLE AGRICULTURE
 CONCEPT OF SUSTAINABLE AGRICULTURE Agriculture is the process of producing food, feed, fibre and other desired products by cultivation of certain plants and raising of domesticated animals. Agriculture
ESTIMATING THE FAMILY PERFORMANCE OF SUGARCANE CROSSES USING SMALL PROGENY TEST. Canal Point, FL. 2
 Journal American Society of Sugarcane Technologists, Vol. 23, 2003 ESTIMATING THE FAMILY PERFORMANCE OF SUGARCANE CROSSES USING SMALL PROGENY TEST P.Y.P. Tai 1*, J. M. Shine, Jr. 2, J. D. Miller 1, and
SUGARCANE VARIETY FOCUS
 DR. KENNETH GRAVOIS, SUGARCANE SPECIALIST Varieties, Varieties, Varieties Variety selection is a decision that will affect you for many years because the goal is to maximize profitability in each year
Important Notices. BASIS CPD Points PN/47342/1516/g
 Sugarcane February 2016 Important Notices BASIS CPD Points PN/47342/1516/g This document is produced for information only and not in connection with any specific or proposed offer (the Offer ) of securities
Chapter 9: Adoption and impact of supplemental irrigation in wheat-based systems in Syria
 Chapter 9: Adoption and impact of supplemental irrigation in wheat-based systems in Syria 131 132 Chapter 9: Adoption and impact of supplemental irrigation in wheat-based systems in Syria A. Bader, N.
Growth and yield responses to amending the sugarcane monoculture: Queensland Alliance for Agriculture and Food Innovation, University of
 Growth and yield responses to amending the sugarcane monoculture: interactions between break history and nitrogen fertiliser. 0 M.J. Bell ac and A.L. Garside b Sugar Yield Decline Joint Venture a Queensland
HARVEST HAUL MODEL THE COST OF HARVESTING PADDOCKS OF SUGARCANE ACROSS A SUGAR MILLING REGION By G.R. SANDELL 1 and D.B.
 HARVEST HAUL MODEL THE COST OF HARVESTING PADDOCKS OF SUGARCANE ACROSS A SUGAR MILLING REGION By G.R. SANDELL 1 and D.B. PRESTWIDGE 2 1 BSES Limited, Mackay 2 CSIRO Sustainable Ecosystems, Brisbane gsandell@bses.org.au
3.3.3 Landscape-Directed Soil Sampling
 12 3 Soil Sampling and Analysis 3.1 Principles of Soil Sampling Soil sampling and analysis is the only way to determine the available nutrient status of a field and to receive field-specific fertilizer
Smallholder Timber Production: Example of Teak in Luangprabang
 Smallholder Timber Production: Example of Teak in Luangprabang Mountainous topography, undeveloped infrastructure, limited market demand and relative poverty slows farmers' adoption of new technologies.
Procedures for Tomato Variety Field Trials
 AVRDC The World Vegetable Center AVRDC Publication Number: 11-751 International Cooperators Guide Procedures for Tomato Variety Field Trials Peter Hanson, Li-ju Lin, Gregory C. Luther, Wen-shi Tsai, R.
Soil Management Practices for Sugar Beets Grown on Organic Soils
 Soil Management Practices for Sugar Beets Grown on Organic Soils J. F. DAVIS 2 In 1949 the estimated acreage of sugar beets grown on muck 3 soils in Michigan totaled 7,650 acres 4, representing approximately
Controlled Traffic Farming
 Controlled Traffic Farming - from research to adoption (northern Europe) & future prospects Principles of CTF any system that confines all tracks to least possible area of permanent traffic lanes CTF is
Agriculture related bio-energy production in Wales
 Agriculture related bio-energy production in Wales Dr Rebecca Heaton Senior Renewable Energy Consultant www.adas.co.uk Dedicated energy crops - what are they? The UK Department of Environment Food and
Agricultural Science Past Exam Questions Soil Science Higher Level
 Agricultural Science Past Exam Questions Soil Science Higher Level 2013 Question 2 (a) The table below shows the results of soil tests carried out on samples from three different fields. Field 1. A field
High-Yielding Irrigated Soybean Production North Central USA Soybean Benchmarking Project
 High-Yielding Irrigated Soybean Production North Central USA Soybean Benchmarking Project How Soybean Producers Benefit From Completing & Submitting the Soybean Benchmark Yield-Management Survey Forms
PERFORMANCE OF CHOPPER HARVESTERS AND THEIR EFFECTS ON SOIL AND CROP AT BEAU CHAMP SUGAR ESTATE. V Rivière, C Marot, R Ng Cheong and E Jacquin
 PERFORMANCE OF CHOPPER HARVESTERS AND THEIR EFFECTS ON SOIL AND CROP AT BEAU CHAMP SUGAR ESTATE V Rivière, C Marot, R Ng Cheong and E Jacquin Mauritius Sugar Industry Research Institute ABSTRACT Beau Champ
TAMIL NADU AGRICULTURAL UNIVERSITY
 TAMIL NADU AGRICULTURAL UNIVERSITY KRISHI VIGYAN KENDRA, TINDIVANAM The training components of the SSI programme for Villupuram District has been allotted to this Kendra for imparting SSI nursery technology
Soil Health. Key Messages. Vegetable Industry Development Program. What is Soil Health?
 Vegetable Industry Soil Health What is Soil Health? Soil health refers to the ability of the soil to achieve its full potential and be productive under the intended land use. Healthy soils have favourable
Soil Health. Key Messages. Vegetable Industry Development Program. What is Soil Health?
 Soil Health What is Soil Health? Soil health refers to the ability of the soil to achieve its full potential and be productive under the intended land use. Healthy soils have favourable physical, chemical
AUSTRALIAN CANE FARMERS 2009
 AUSTRALIAN CANE FARMERS 37 SECTION 5 The Association ORGANISATIONAL STRUCTURE Association Ltd Level 16, 97 Creek Street Brisbane QLD 4001 Postal address: GPO Box 608, Brisbane QLD 4001 Phone: 07 3303 2020
AP Environmental Science II. Unit 2-6: Soil, Agriculture, and Land Management
 NOTE/STUDY GUIDE: Unit 2-6, Soil, Agriculture and Land Management AP Environmental Science II, Mr. Doc Miller, M.Ed. North Central High School Name: ID#: NORTH CENTRAL HIGH SCHOOL NOTE & STUDY GUIDE AP
Weed Management in FL Sugarcane Everglades REC, Belle Glade, FL
 Weed Management in FL Sugarcane Everglades REC, Belle Glade, FL Outline General sugarcane information Sugarcane production Planting Harvest Weed management Factors that influence management Chemical Mechanical
AMENDING ACIDIC SOILS FOR SUSTAINABLE WHEAT PRODUCTION
 AMENDING ACIDIC SOILS FOR SUSTAINABLE WHEAT PRODUCTION Paul G. Carter Washington State University, Dayton, WA cart@wsu.edu Gary Wegner Columbia River Carbonates, Spokane, WA soilphguy@gmail.com ABSTRACT
By Richard Marks & Matthew Fotheringham 11/1/2007 TURN THE NEXT LEAF 1
 AUSTRALIAN SUGAR CANE FARMS By Richard Marks & Matthew Fotheringham 11/1/2007 TURN THE NEXT LEAF 1 Introduction We are all here for some sought of farming interest, weather it be small or large. We all
National Environmental Standards for Plantation Forestry. Overview of the regulations
 National Environmental Standards for Plantation Forestry Overview of the regulations New national rules for plantation forestry Plantation forestry is New Zealand s third largest primary sector. It delivers
EFFECTS OF VARIETY, ENVIRONMENT AND MANAGEMENT ON SUGARCANE RATOON YIELD DECLINE
 REFEREED PAPER EFFECTS OF VARIETY, ENVIRONMENT AND MANAGEMENT ON SUGARCANE RATOON YIELD DECLINE RAMBURAN S 1, WETTERGREEN T 1, BERRY SD 1 AND SHONGWE B 2 1 South African Sugarcane Research Institute, P/Bag
Corn and soybean grain yield, phosphorus removal, and soil-test responses to long-term phosphorus fertilization strategies
 2007 Integrated Crop Management Conference - Iowa State University 241 Corn and soybean grain yield, phosphorus removal, and soil-test responses to long-term phosphorus fertilization strategies Antonio
Restoration Opportunities Assessment Methodology (ROAM)
") Restoration Opportunities Assessment Methodology (ROAM) This Presentation Will Cover The global potential for restoration The forest landscape restoration approach Restoration Opportunities Assessment
Restoration Opportunities Assessment Methodology (ROAM) This Presentation Will Cover The global potential for restoration The forest landscape restoration approach Restoration Opportunities Assessment
Deliverable 2 Final Report and Proposed P Soil Test Calibration FDACS Contract
 Deliverable 2 Final Report and Proposed P Soil Test Calibration FDACS Contract 013717 Developing a Calibrated P Fertilizer Recommendation for EAA Sugarcane for Organic Soils: Assessment of Soil-P Extraction
FURTHER EVIDENCE OF THE EFFECTS OF RATOON STUNTING DISEASE ON PRODUCTION UNDER IRRIGATED AND RAINFED CONDITIONS
 FURTHER EVIDENCE OF THE EFFECTS OF RATOON STUNTING DISEASE ON PRODUCTION UNDER IRRIGATED AND RAINFED CONDITIONS RA BAILEY AND GR BECHET South African Sugar Association Experiment Station, P/Bag X02, Mount
THE EFFECT OF RATOON STUNTING DISEASE ON THE YIELD OF SOME SOUTH AFRICAN SUGARCANE VARIETIES UNDER IRRIGATED AND RAINFED CONDITIONS
 THE EFFECT OF RATOON STUNTING DISEASE ON THE YIELD OF SOME SOUTH AFRICAN SUGARCANE VARIETIES UNDER IRRIGATED AND RAINFED CONDITIONS RA BAILEY AND GR BECHET South African SugarAssociation Experiment Station,
14 FARMING PRACTICES Land preparation. - To control the growth of weeds; - To shape the seedbed (into ridges, beds, or mounds).
.") 14 FARMING PRACTICES An enumerator working in farm surveys needs a basic understanding of the agricultural operations done by the farmers during the crop season. It is on these subjects that he will be
14 FARMING PRACTICES An enumerator working in farm surveys needs a basic understanding of the agricultural operations done by the farmers during the crop season. It is on these subjects that he will be
Benchmark Sampling to Monitor Soil Fertility and Assess Field Variability Problem Background and Research
 Benchmark Sampling to Monitor Soil Fertility and Assess Field Variability Doug Keyes, Norwest Labs, Edmonton, AB dougk@norwestlabs.com Grant Gillund, Kenlund Consulting, Smoky Lake, AB ggillund@telusplanet.net
CHARACTERISATION OF CANE VARIETIES BASED ON SUGAR PROCESSING PARAMETERS
 CHARACTERISATION OF CANE VARIETIES BASED ON SUGAR PROCESSING PARAMETERS BARKER B and DAVIS S B Sugar Milling Research Institute, University of KwaZulu-Natal, Durban, 4041, South Africa bbarker@smri.org,
CHIAA RESEARCH REPORT NUMBER 32 RELATIONSHIP OF WEATHER FACTORS AND CROP YIELDS IN ILLINOIS
 CHIAA RESEARCH REPORT NUMBER 32 RELATIONSHIP OF WEATHER FACTORS AND CROP YIELDS IN ILLINOIS by Stanley A. Changnon, Jr. Illinois State Water Survey Urbana, Illinois March 25, 1966 Prepared for Crop-Hail
Managing Soil Fertility. Teagasc Soil Fertility Management Spring 2015
 Managing Soil Fertility Teagasc Soil Fertility Management Spring 2015 Outline Key Questions What s happening to soil fertility? What steps can be followed to manage it? What are the benefits? Is there
ALL-ISLAND JAMAICA CANE FARMER S ASSOCIATION Extension Services
 ALL-ISLAND JAMAICA CANE FARMER S ASSOCIATION Extension Services Report for Month Ended June 2016 Officer...Delroy Umraugh Area: Appleton Weather There was consistent rainfall during the month although
Nitrapyrin with nitrogen can improve yield or quality of wheat, grass pasture, canola or sugarcane in Australia
 Nitrapyrin with nitrogen can improve yield or quality of wheat, grass pasture, canola or sugarcane in Australia G. S. Wells 1 1 Dow AgroSciences Australia Ltd, PO Box 838, Sunbury, Victoria, 3429, www.dowagro.com/en-au/australia,
The Potash Development Association Forage Maize Fertiliser Requirements
 leaflet 17 The Potash Development Association Forage Maize Fertiliser Requirements Why Maize? Maize makes high quality silage for dairy cattle, beef and sheep at less cost than silage made from grass.
Soil structure and Field Traffic Management. Tim Chamen CTF Europe
 Soil structure and Field Traffic Management Tim Chamen CTF Europe What are the physics of a good soil structure? A diverse mix of solids, air and water with a continuous network of pores that allow free
Conservation Tillage Systems for Spring Corn in the Semihumid to Arid Areas of China
 This paper was peer-reviewed for scientific content. Pages 366-370. In: D.E. Stott, R.H. Mohtar and G.C. Steinhardt (eds). 2001. Sustaining the Global Farm. Selected papers from the 10th International
Techniques to improve technological and sanitary quality
 AGTEC-Org AGronomical and TEChnological methods to improve Organic wheat quality A project of the research network Techniques to improve technological and sanitary quality Summary Agronomical ways for
Review of Current Sugarcane Fertilizer Recommendations: A Report from the UF/IFAS Sugarcane Fertilizer Standards Task Force 1
 SL 295 Review of Current Sugarcane Fertilizer Recommendations: A Report from the UF/IFAS Sugarcane Fertilizer Standards Task Force 1 K. T. Morgan, J. M. McCray, R. W. Rice, R. A. Gilbert, and L. E. Baucum
UNIVERSITY OF CAMBRIDGE INTERNATIONAL EXAMINATIONS International General Certificate of Secondary Education
 UNIVERSITY OF CAMBRIDGE INTERNATIONAL EXAMINATIONS International General Certificate of Secondary Education *7124728426* ENVIRONMENTAL MANAGEMENT 0680/43 Alternative to Coursework October/November 2012
African mahogany in northern Australia: some observations (with particular emphasis on small-scale forestry)
") African mahogany in northern Australia: some observations (with particular emphasis on small-scale forestry) Acknowledgements Qld & NT Government forestry researchers, especially Geoff Dickinson, David
African mahogany in northern Australia: some observations (with particular emphasis on small-scale forestry) Acknowledgements Qld & NT Government forestry researchers, especially Geoff Dickinson, David
Unit F: Soil Fertility and Moisture Management. Lesson 3: Applying Fertilizers to Field Crops
 Unit F: Soil Fertility and Moisture Management Lesson 3: Applying Fertilizers to Field Crops 1 Terms Banding Broadcasting Build up Chiseling Deep placement 2 Terms Fertigation Foliar feeding Knifing Luxury
World Crops Research Update - Okra The 2017 Growing Season
 World Crops Research Update - Okra The 2017 Growing Season Vineland is publishing this Research Update which summarizes Vineland s findings on okra production during the 2017 growing season. Temperatures
Information on LULUCF actions by Sweden. First progress report
 Information on LULUCF actions by Sweden First progress report 2016 This information on LULUCF actions by Sweden responds the request set out in article 10 of Decision [529/2013/EU] on Land-Use, Land-Use
Sugar Beets in Seven Michigan Systems of Crop Rotation 1
 Sugar Beets in Seven Michigan Systems of Crop Rotation 1 R. l. COOK, C. E. MILLAR,AND L. S. Robertson 2 At a meeting' of the sugar beet research committee, composed of representatives of beet sugar companies,
Adoption of Soybeans as a Rotation Crop in Far North Queensland
 Adoption of Soybeans as a Rotation Crop in Far North Queensland D. R. Sparkes 1 and C. Charleston 1 1 DPI Sugar Solutions Project. Centre for Wet Tropics Agriculture, Boogan Road South Johnstone 4859 Introduction
Cowdung: soil amendment agent for the sandy upland sugarcane ecology in Nigeria
 Journal of Agricultural Technology 2011 Vol. 7(2): 497-505 Available online http://www.ijat-aatsea.com Journal of Agricultural Technology 2011, Vol.7(2): 497-505 ISSN 1686-9141 Cowdung: soil amendment
Sustainable Pulpwood Supply in India
 Sustainable Pulpwood Supply in India Farm Forestry and Social Forestry Initiatives By Sanjay Singh, CEO, ITC PSPD Presentation Outline India Wood supply scenario Paper Industry in India Tree Improvement
Analysis of chicken litter
 Using chicken litter to fertilise pastures Raw chicken litter can be a valuable resource to optimise pasture production. It is mostly organic matter and supplies nutrients, helps hold moisture, improves
Impact from Pratylenchus thornei, Macalister 2015
 Date: 01.03.2016 Impact from Pratylenchus thornei, Macalister 2015 Author: Brendan Burton and Linda Bailey (Northern Grower Alliance) Kedar Adhikari (Sydney University Narrabri) Take home message 1. Multi
Watercourses and Wetlands and Agricultural Activities
 Watercourses and Wetlands and Agricultural Activities Watercourses and regulated wetlands can be found throughout New Brunswick, including on agricultural lands. The Clean Water Act defines a watercourse
Field assessment, control and identification of common foliage diseases of pine in New Zealand
 Field assessment, control and identification of common foliage diseases of pine in New Zealand Field assessment, control and identification of common foliage diseases of pine in New Zealand Lindsay Bulman
THE PRODUCTIVE POTENTIAL OF ANCIENT OAK-COPPICE WOODLAND IN BRITAIN
 THE PRODUCTIVE POTENTIAL OF ANCIENT OAK-COPPICE WOODLAND IN BRITAIN Daniel J. Franklin THE COPPICE RESOURCE As interest grows across the world in the potential of NTFPs, and the importance of understanding
Code of Practice for Nutrient Management August 2014 Version 1.0
 1 Code of Practice for Nutrient Management August 2014 Version 1.0 2 3 Nutrient Management Code of Practice Contents Introduction Why this Code of Practice 1. Risk management approach to nutrient management
Protocol for Pre-Installation field Measurements for Prospective Living Snow Fence Sites in New York State
 Research Project C-06-09 Designing, Developing and Implementing a Living Snow Fence Program for New York State Task 3-A1 & 3-A2 Protocol for Pre-Installation field Measurements for Prospective Living Snow