Welcome to the Eastern Mountain Region ARMS III Workshop
|
|
|
- Samuel Manning
- 5 years ago
- Views:
Transcription
1 Welcome to the Eastern Mountain Region ARMS III Workshop 1
2 Cell Phone Reminder Please turn off OR place your cell phone on vibrate. 2
3 Welcome & Introductions Mike Meek 3
4 NASDA REMARKS Martha Van Dale NASDA Director, Finance 4
5 EMR Director REMARKS & ARMS III Importance Dave Knopf NASS EMR Director 5
6 ARMS III Cost & Returns Report (Blue Form) QUESTIONNAIRE REVIEW
7 Face Page & Section A Mike Meek
8 Screening The screening phase, ARMS Phase 1, was conducted from May to July
9 Phase I Data 8 items of pre-printed data will be on page 2 and the back pages of the questionnaire. 9
10 Phase I Pre-printed Data Who responded in phase I Mode of response (mail, phone, etc) Completion status Owned Land Land Rented In or Out Total Acres Operated Total Cropland 10
11 11
12 Screening Supplement Form The Screening Supplement Form is necessary when: Changes are made to the target name on the label Uncertainty about whether the operation qualifies for the interview 12
13 AREA FRAME SAMPLES All of the area frame samples selected for the ARMS were identified as farm operators during the June Agricultural Survey conducted in In other words, if they were sampled, there was agriculture of some type listed in the June Area questionnaire. Collect data for the operation as it existed on June 1. 13
14 Area Record Issues May be very small. Most are hay, cattle, horses and/or CRP farms. They count. If they say they don t farm, inquire if they had hay, Conservation Reserve Program (CRP) acres and/or cattle or horses. If the total land varies +/- 10% from the preprinted total land, please make a note
15 AREA RECORD ID begins with a 1 Example:

16
17
18 DCMS CODE IDs METHOD/DCMS CODES 260: Mail, EDR available, Field Follow-Up 420: Not mailed, Field first Contact 685: Coordinated, Field First Contact
 OR")
19 Record Interview Time Using Beginning Time and Ending Time (see last page of questionnaire) OR Total Time.
20 Questions about the Face Page? 20
21 Section A Measure the total land operated Determine the tenure arrangements and whether farmers are renting on a share, cash, flexible, or rent-free basis Account for rent paid & value of land rented from others Account for rent received & value of land rented to others 21

22 Section A: Acres Operated
23 Section A: Cropland

24 Section A: Rented Land 24

25 Section A: Rented Land Items refer to ground rented TO OTHERS Keep an eye on the different market values
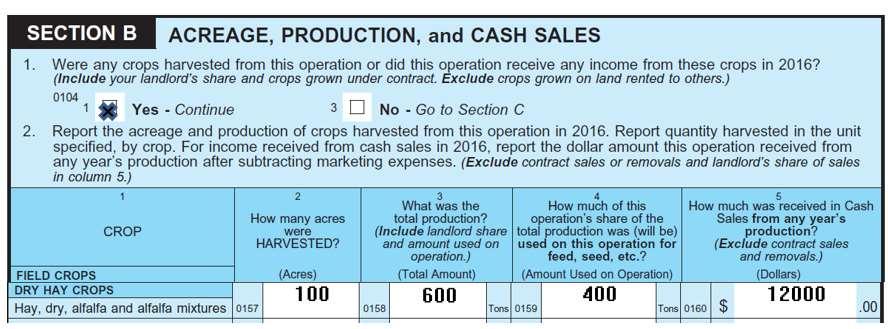
26 Section B Acreage, Production, & Cash Sales Mike Meek
27 Section B Harvested acres Production Used on farm Cash sales 27

28
29
30 Nursery and Greenhouse Crops (items 3-5) Item 3: Human consumption? What s not human consumption? (Flowers, ferns, etc) Item 4: Percent of sales from previous page (code box 189) represented by sales for human consumption Why? We know of shifts to greenhouses for some vegetable production (large for some). How big? What kinds of farms? Item 5: Technology use of tunnels or high hoops 30

31 Seed Technology (item 6): Following Up on ARMS
32 NASS reports on genetically engineered (GE) corn, cotton, and soybeans in Acreage. But herbicide-tolerant GE varieties are also used in alfalfa, canola, and sugar beets. What s more, drought-tolerant GE varieties have been introduced for corn. We aim to track adoption with ARMS. 32

33 Seed Technology: Key points Planted acres, not harvested acres as in item 2. The sum of columns may not equal Planted Acres of a crop. Why? corn seed may be HT and Bt and droughtresistant, while cotton may be HT and Bt. For alfalfa, canola, and sugarbeets, columns 1 and 4 should add to all planted acres. IP seed varieties (col. 5) may be non-ge varieties kept separate and sold as such. That can also be GE versions of specialized varieties, such as high-oil corn, sold as IP. 33
34 Sally planted 500 acres of corn and 300 acres of soybeans last year. Seed Technology Example All of the soybeans were HT varieties, while 400 acres of the corn were HT, and half of those were also drought-tolerant. For the first time this year, Sally also planted 100 acres of non-ge corn, which would be marketed specifically as such, with identity preserved throughout the marketing chain
35 Crop Insurance (Item 7) There was a significant change in crop insurance programs with the 2014 Farm Bill These questions aim to track producer choices, and to tie choices to farm business attributes and other risk management choices. 35
36 Crop Insurance Details Note planted acres in column 1, not harvested. Basics: CAT provides low level of coverage on yield losses at low cost to producers. Exclude. Producers can pay more and buy up to yield or revenue policies. Producers choose a level of yield or revenue coverage. SCO allows for added coverage, for higher premium. 36
37 Crop Insurance Example Pamela farms 400 acres of corn. She purchases a Revenue Protection with Harvest Price Exclusion (RP-HPE) policy with 70% coverage on 300 acres. She also enrolls half of her acreage in SCO x 37
38 Crop Insurance Exercise 2 Andy plants 100 acres of soybeans and 100 acres of corn. He insures all 100 soybean acres with a CAT yield policy in 2016 and all 100 acres of corn with a 75% Revenue Protection policy. Further, due to his participation in another program, he could not enroll any of them in the SCO program x x 38
39 Risk Management: Items 8-10 Risk management strategies followed by farmers Hedging through exchange-traded derivatives--futures contracts and options (on futures). Use of cooperatives (who might in turn hedge through futures). Use of on-farm storage (to provide flexibility in sales). Use of marketing contracts (section E) 39
40 Risk Management: Items 8-10 Items 9 and 10 are straightforward If yes for any commodity, check box. #10) Note: if not used for any commodity, check none. 40

41 Futures and Options 41
42 There are two markets Cash Market (local elevator) Futures Market (on paper) Hedging takes place in the futures market Chicago Mercantile Exchange (CME)
43 Hedging This is basically taking the opposite position (sellers buy and buyers sell) in the cash and futures market. This practice gives some protection to sellers and buyers of grain against uncertainties of an unstable grain market.
44 Options Gives the holder the option of selling or buying a futures contract at a given price. 44
45 Two key points: Items 8-10 refer to production, not to input acquisition, such as a dairy farm or feedlot hedging on corn purchases. Most futures transactions are closed out without delivery. Focus on the quantity of production that s hedged 45
46 If respondent has used futures or options markets for commodities not included in this group Write in the commodity name in the blank space next to Other Enter the quantity hedged as usual 46
47 Cover crops are grown due to Federal & state incentive programs, improving seed availability, & growing interest in soil health. We aim to track where and why cover crops are expanding. Land Use Practices Items Cover crops, double cropping, and conservation tillage affect farm finances and USDA conservation goals. Double cropping (eg, soybeans and winter wheat) varies with weather and commodity prices. Tracking helps USDA understand links between acreage and cropland. 47
48 Land Use Practices Item 13 Conservation tillage helps build soil health and reduce nutrient losses. It s an important target of conservation policy, but adoption varies over time and across regions. No-till: seeds planted directly through residue. Strip-till: discs open a narrow planting strip; little soil disturbance. Others include ridge and mulch till. Conservation tillage leaves at least 30% of crop residue at planting. 48
49 Section C Livestock Mike Meek
50 Section C Inventory- On hand and owned Removals Cash Sales Gain or loss on breeding stock

51 51

52 Section C Example
53 53
54 Sections D-G: Contracts & Accounts Receivable Kimberly McDaniel
55 An agreement What s a Contract? could be oral, but usually written Reached prior to harvest or end of livestock production cycle Sets a commodity, an outlet, and a compensation agreement
56 Purpose of contracts Options other than cash market Ensure supply Reduce risk
57 Section D Other Operations Growing, Feeding, or Raising Livestock for This Operation Used to shift specialized functions Common for Replacement Heifers

58 Section D Example Dairy Heifers These values are zero because the heifers were returned to the dairy and not sold.
59 Section E Marketing Contracts
60 Section E: Marketing Contracts Operator(contractee) Bears majority risk Owns the commodity during production Makes the production decisions Receives majority share of production Contractor Establishes set production Receives commodity after production Processes & markets the commodity
61 Common Commodities for Marketing Milk Cotton Fruit & Nuts Vegetables Feed Grains Cereal Grains Rice Peanuts Potatoes Hay/Silage

62
63 Section F Production Contracts
64 Section F: Production Contracts Operator(contractee) Bears less risk Provides the labor, facilities, & equipment Receives a fee per unit of production Contractor Provides inputs Receives commodity after production Processes & markets the commodity Owns the commodity during production
65 Common Commodities for Production Cattle on Feed Hogs Broilers Turkeys Layers Pullets/Poults Replacement Heifers Strawberries Seed Crops Production Vegetables

66
67 Section E & F What type? 20,000 broilers, fee $0.40/hd 25,000 bu of corn at $3.00/bu 400 steers at $0.95/lbs. 2,500 hogs at $35/animal space 5000 cwt of milk at $17.75/cwt Production Marketing Marketing Production Marketing
68 Section G Accounts Receivable

69 Section G: Accounts Receivable & Deferred Payments Sometimes a deferment used as a strategy
70
71 Section H: Government Payments & Other Farm Related Income
72 Questionnaire changes Government Program Payment questions No questions on 2008 farm bill (old) programs Single question on Agricultural Risk Coverage (ARC) program One question on Margin Protection Program for Dairy Other Farm Related Income questions Total insurance indemnities for the farm business, followed by a breakout of total for federal crop and livestock insurance.
73 Other Farm Related Income This is where these go Custom work Grazing fees Farm real estate sales All other income, including value added products Total insurance indemnity payments (SCO) Sub-question on federal crop and livestock insurance indemnities
74
75 Welcome to the Eastern Mountain Region ARMS III Workshop 75
76 Cell Phone Reminder Please turn off OR place your cell phone on vibrate. 76
77 Section I -- Expenditures Mike Meek
78 Operating Expenses Expenses paid for by the operation during Calendar Year Expenditures for inputs that are normally used up during the year purchased. Major Expenses Feed Livestock purchases Farm Services Labor Rent Fertilizer Chemicals Seeds Fuels Taxes
79 Record only the farm share of all expenses as defined for the targeted operation using total acres operated in Section A. Exclude unrelated expenses. Non-farm business expenses. Household and living expenses. Collect operator dwelling expenses (and assets), if it is owned by the operation. House is recorded as an asset in record books. Deeded as part of the farm.
80 Expense data is collected in great detail. Ensures that no data will be omitted, particularly items not typically found in record books. Interviewer's Manual has a detailed list of what to include and exclude for each item.
81 Marketing and storage expenses, Section I, Item 33 Almost all operations that sell commodities have marketing expenses. Get total quantity and unit sold if operator doesn't know the total marketing charges. If missing, editor should add up the commodity specific charges from income sections. Rent received by operation Cash rent, Item 11, Section A Share rent, Item 12, Section A
82 New questions and re-phrasing for 2016 Item 5 Leasing of livestock (include bees, bulls and dairy cattle) Item 11 Purchased water for irrigation from off-farm suppliers.(including irrigation assessments and fees) Item 17(b) Include $100 participation fee for Margin Protection Program for Dairy,
83 Landlord & Contractor Questions Collect expenses paid by: Operator(s), Landlord(s), and Contractor(s). Most operating expenses have three cells. Landlord Expenses emphasized because ERS calculates Net rent to non-operator landlords. Net rent equals Landlord income less Landlord expenses Contractor Expenses Ask whether operator knows contractor expenses. May know if given a settlement sheet by contractor. If unknown, leave blank and write a note
84 Wages for Individuals and Partnerships Operators organized as individuals or as partnerships do not receive income in the form of wages Instead of wages, they receive the net income generated by the operation
85 Wage Treatment for Corporations and Other Operators organized as a corporation or as Other (Trust, Estate) Operator can receive wages since they are an employee of the corporation or trust
86 Capital Expenditures


87

88

89
90 Capital Expenditures Purchases with multiple year life Placed on operator s depreciation schedule Listed on the operator s Assets page
91 Why do we collect Capital Expenses? Early indicator of financial stress in operation Weights for NASS Prices Paid Indexes ERS publishes capital expenditures in more detail than in the Farm Production Expenditures publication
92
93 Data Relationships
94 When the interview is concluded, ask yourself: Does the whole questionnaire make sense? Does it tell a story? Compare the type of expenses collected with the type of commodities reported for the operation. Evaluate how expenses compare to items in other sections of questionnaire.
95 Seed Fuel Fertilizer Crops Labor Chemicals Rent
96 Feed Veterinarian Expenses Livestock purchases Livestock Repairs Bedding & litter Custom Services
97 Labor Seed Chemicals Fuel Seed Fertilizer Nursery & Greenhouse Fuels Labor Fertilizer Chemicals Utilities Repair
98 Interest expenses reported in Item 18. Debt is expected in Section K.and vice versa. It is possible for a farm to have no end-of-year debt and yet incur interest expenses, if all its loans are production (seasonal) loans, ---- HOWEVER, they would have an entry in question 1 in Section K for production loans taken out and repaid during the year.
99 Real estate taxes (Item 19a) Real estate taxes paid by the operator are expected if land owned was reported in Section A. Real estate taxes paid by the landlord are expected if land rented from others was reported in Section A. Contractor expenses When a production contract exists. Largest are usually feed and livestock purchases.
100 Dairy operations should have milk hauling expenses reported in item 28a (Hauling expenses). If these expenses were netted out of the operator's milk check, add them back to get the "net" figure. If vehicles are owned or leased, registration fees are expected in Item 21 (Vehicle registration and licensing).
101 Expenses and Assets Asset values usually expected in Section J, if Repairs (Items 15-16) or new construction and remodeling (Items 35-36) of buildings, structures, and dwellings (Section J: 1a-1c). Repairs (Item 14) or purchases (Items 37-41) of vehicles and machinery (Section J: 2a-2b).
102 Encourage use of farm records Most accurate data when records are used. Shorter interview time if the records are used. The IRS Schedule F Tax form contains some information but it will be in summary format and you will have to try to split it out for ARMS III. Operators best estimate are acceptable for responses if no farm records are available.
103 Section J & K Assets & Debt Mike Meek
104 Overview Background and data uses Section J: Farm Assets Overview of questionnaire No changes from 2015 Section K: Farm Debt Overview of questions 1-5 New column added to debt table: question 3, column 3. No research questions in 2016
105 Background Why so much detail on a sensitive subject? A complete and accurate financial picture of the agricultural sector requires wealth measurement via the balance sheet. Getting component detail ensures accuracy Provides more detailed picture of the sector balance sheet s strengths and weaknesses Many of the current financial concerns about agriculture involve asset (land values) and debt repayment.
106 Operator Dwelling count or not? Owned by the Farm: Listed as an asset for the farm records or deeded with the farm Asset Value: Record the value of operator dwelling assets only if they are owned by the farm operation House Debt: Only record debt owed on the operator s dwelling if it is owned by the operation (recorded as an asset in Section J, item 1a) Not Owned by the Farm: If farm operator dwelling is not owned by the operation record value and debt in the household section (N)
 is relatively new Important Note: Exclude value reported in 1e")
107 Section J - Question 1 Record market value of assets Item 1e (oil, gas, and mineral rights) is relatively new Important Note: Exclude value reported in 1e from 1f
 Item 2c - If there are loans from Farm Credit System (FCS) in section K, they")
108 Section J Question 2 Item 2a-2b - Make sure the value reflects pricing if goods were sold/traded in marketplace (e.g.: used-market) Item 2c - If there are loans from Farm Credit System (FCS) in section K, they should report a value here (required to purchase FCS stock to get loan)

109 Section J Question 3 It is unlikely Jan. 1 st and Dec. 31 st values will be the same Respondent should consider quantity of each type of item on hand and market prices on each date For 3b and 3c you can cross-check against section C inventory quantities

110 Section J Question 4 Item 4 - Exclude accounts receivable payments from section G

111 Section K Questions 1 and 2 Item 1 if no, then skip to section L because there are no research questions Item 2 - includes lines of credit.

112 Section K Question 3 (Debt Table) Gather as much information as possible Improves imputation Column 2 is new; measures debt at the beginning of year. Verify columns 6 and 7 are consistent and refer to refinance year and term as applicable Column 8 is used to exclude non-farm debt from sector balance sheet Sector accounts use lender codes to report debt owed to lender groupings Individual and others is debt owed to lender codes 3, 4, 8-16, 18, 19 Loan type allows current debt (one year or less) to be compared to current liabilities

113 Section K Questions 4 and 5 Item 4 - Allows value of debt outstanding beyond the 5 loans in the debt table to be captured. Item 5 - The portion of total debt (items 3 and 4) owed for operator s dwelling
114 L: Farm Labor and Management M: Operator and Household Characteristics N: Household Income, Assets, & Debt Kimberly McDaniel
115 Survey Changes for 2016 ARMS Changes Change in hired farm labor questions Change of order in farm organization questions Removed Heath insurance questions Some direct sales details
116 Where are these data published? ERS WEBSITE Farm Household Well-being Topic Page Income and wealth of farm households Farm Household Income Data Product Many tables of statistics on principal farm operator household characteristics by off-farm work status, income and wealth, and more ARMS Query Tool Household income and balance sheet information Print publications ERS reports and other research and policy papers 116
117 Who uses this data? The public; government; industry groups; academics and others. These data help determine rural communities needs. These data are used to evaluate the effects of current and proposed policies that affect farms and rural communities.
118 SECTION L: FARM LABOR AND MANAGEMENT
119 L-Q1: The Family Farm Question This question forms the foundation for whether a farm is counted as a family farm 1. In 2016, did your household and extended family own more than 50% of this operation? Select yes if more than 50% of the assets of this operation are owned by you (the principal operator), members of your household, and/or other persons related to you by blood, marriage, or adoption, including relatives not residing in your household. Consider only farm and ranch assets owned not rented or leased by the operation, and exclude the assets held by non-family landlords and contractors. Note: For 2016 ARMS, all respondents answer the household section (Section N), regardless of the family farm classification 119
120 Section L-Q2: Ownership Question 2: The number of owners Exclude Landlords Question 2a: percent of ownership held by principal operator household Used to develop an estimate of the farm s contribution to the net worth of the farm household as a whole Permits calculating household assets, debt, and net worth 120
121 L Q3-4: Operation Organization Legal Status for tax purposes Family or Individual operation no partners and no shareholders Could be an LLC Legal partnership two or more people Not landlord-tenant C-Corporation Limited liability (could be single-owner LLC) Pay income tax separately from owners S-Corporation (small business corp.) Taxed as a partnership or sole-proprietor Other (estate, trust, co-op, etc.) Q4: Any category may be organized as an LLC under state law 121
122 L5-6: Income to HH Q5: Number of households sharing in income Q6, a, b: If the farm files taxes as a C-Corporation, the household receives compensation as dividends. If not, profit is passed directly to household(s). 6b: What percent of net income (whether profit or loss) were you (the operator) and your household entitled to receive from this operation? Key for calculating household farm income when multiple households share in the farm business income. 122

123 X
124 Key Question: How many operators are there? Q7: Number of operators. Who are operators? People involved in the day to day decisions excluding hired workers unless they are a hired manager or a family member A required question; key aspect of operation; used to edit other items. Q8 is there a spouse; Q9 are they making day-to-day decisions? If a spouse is an operator (Q9), data for that individual are reported in the second column in Q10 Operator Characteristics Year in which operator began to operate ANY farm 124
125 Why do we care about time use? Permits calculating wages for different groups What types of farms are seeing labor costs increase? Are we seeing the effect of running out of farm laborers? What do farmers earn per hour working on the farm? What about working off the farm? Provides insight into the productivity of farms For instance, does increased use of inputs decrease labor costs? Allows detailed calculation of the Cost of Production, which computes the value of farmer s labor on their operation. 125
126 L-Q11: Use of Time Hours working for the farm/ranch in the typical week in four, three-month periods Breakout hours by: a. Principal operator (total/unpaid) b. Spouse (total/unpaid) c. Other operators (total/unpaid) d. Other unpaid e. Other paid Should have hours in at least one quarter Book keeping, form filing, oversight all count! 126
127 Q12-Hired Workers Revised questions (asked first in 2015 ARMS) Q12 - Report the average number of full-time paid hired workers in paid/unpaid categories NOT operators Not making day-to-day decisions on the farm or ranch Exclude custom hire and contract labor Could be full-time or part-time workers IMPORTANT: Full-time means 30 hours/week
128 L-Q13: Part-time Workers Report the TOTAL NUMBER OF HOUR worked EACH WEEK by ALL PART-TIME workers during each three month period? Part time = less than 30 hours/week Still exclude custom hire, contract labor, and unpaid workers Reason? Part of who is required to provide health insurance under the Affordable Care
129 L: Direct Marketing (Local Foods) Direct marketing/local foods defined by the marketing channel Q15: For human consumption AND sold directly to (a) individuals, (b) retail outlets, or (c) institutions Exclude non-edible products or processed products Exclude sales to local businesses who resell across the country Q16: Sales of crops, livestock to 5 different outlets (exclude sales via production contracts) 129
130 SECTIONS M & N: FARM OPERATOR AND HOUSEHOLD CHARACTERISTICS FARM OPERATOR HOUSEHOLD INCOME ASSETS & DEBT
131 M: Operator and Household Characteristics For operator and spouse Spanish, Hispanic, or Latino Origin (separate from race) Race (separate from origin) Education Primary occupation Retired from farming The primary occupation and retirement from farming affect whether we consider the farm a farm business. 131
132 Section N: Household Income, Assets, and Debt Cannot understand the decisions and economic wellbeing of business owners without knowing what other assets, debt, or income they have It s important to get the complete picture 132
133 Examples of users asking questions related to this data recently: Office of Advocacy and Outreach on beginning farmers Dep Secretary on direct marketing Farm Bureau on family farms White house on farm women University researcher on labor use for congressional testimony 133
134 Section N: Household Income, Assets, and Debt ARMS is the only survey that measures poverty for the farm operator population. The vast majority of farms are run by households (98.7% in 2015) In 2016, this section is not skipped by any respondents 134
135 Why does USDA collect household information? To inform policy design and implement better laws regarding farmers and farm households Farm household information used to protect EQIP program from changes To meet Congressional and executive mandates: USDA Release No , May 1993 Secretary requires household income be reported concurrent with farm income. USC, Title 7, Chap 55, Sec 2266 Family Farm Report: The Secretary [of Agriculture]...shall submit to Congress each year a written report containing current information on trends in family farm operations To undergird a robust research agenda Are farm household well-off? How volatile is the household income of farmers? How much is a dollar of farm income worth?
136 Section N Refusal update Increased refusal rates in 2012, 2013 Improved in 2014 and 2015 Remains high across regions and commodity groups We need more responses for household analysis! Estimates of spending Estimates of farm income Low response rates increase uncertainty of our estimates, and make trends and research more difficult 136
137 Components of Household Income Household Income = Farm income + Non-farm Income Farm income On-farm income on-farm expenses Non-farm income Salary and wages Income from other businesses Pensions, transfers, interest, dividends (Household assets and debt are calculated
138 N-Q1: Nonfarm income and farm income from outside the operation (10 sources) a) Off-farm wages, salaries and tips (before withholding) b) Net cash income from operating another farm and ranch (net depreciation) c) Net cash income from operating any other business (net depreciation) d) Net cash income from renting farmland to others (exclude renting of this operation s land) 138
139 e) Interest income f) Dividend income N-Q1: Parts e-j g) Proceeds from the sale of farm and non-farm capital assets (operator s share only) Gain or loss on sale (again, only operator s share) h) Private pensions and private disability payments i) Income from public sources j) Other off-farm sources of income 139
140 N-Q2: Household Spending Categories a-j Food, rent, utilities, transportation, health, insurance, payments to others, mortgage, property taxes, other 140
141 N-Q2: Household Spending On rent (part b), operator dwelling rental payments are included only if the operator lives in a dwelling not owned by the household or the farm business. Similarly, mortgage payments (part h) or property taxes (part i) are only if the dwelling is not owned by the operation Note that health insurance premiums (part e-i) are separate from out of pocket health expenses (part e- ii) 141
142 N-Q3: Off-Farm Assets Value of assets owned by operator and members of the household as of December 31, 2014 Household share, excluding assets of this operation Seven categories: (a) nonretirement financial assets, (b) retirement accounts, (c) operator dwelling (if not owned by operation), (d) other real estate, (e) other businesses not part of this farm, (f) vehicles, (g) other assets 142
143 N-Q4: Off-Farm Debt Value of debt of operator and members of the household as of December 31, 2016 Excluding debt of this operation Five categories: (a) debt associated with dwelling (if not owned by operation), (b) other real estate, (c) businesses, (d) personal loans, (e) other debt Includes debt secured by farm assets but not reported elsewhere as farm debt. Purpose of the asset must not be for the farm business. 143
144 N-Q5-8 Q5: Value of off-farm debt secured by farm assets A portion of what was recorded in Q4 Q6-8: Previous year information Sales Net operating income (farm income) Total off-farm income, including wages, personal, and business income 144

145 X Respondent Name If different from label
146 Any Questions
What are Farm Operations and how are they selected? T O T A L / A R M S I I I S C R E E N I N G A N D F A R M D E F I N I T I O N
 What are Farm Operations and how are they selected? T O T A L / A R M S I I I S C R E E N I N G A N D F A R M D E F I N I T I O N Farms Definition from the Oxford World Dictionary. Noun: An area of land
ARMS 3 Heartland Workshop. Day 2 Wednesday January 31, 2018
 ARMS 3 Heartland Workshop Day 2 Wednesday January 31, 2018 Sections 23-28 Section 23: Organic Agriculture Census Year Section! This section will be used for follow on organic surveys. Please make sure
2016 Agricultural Resource Management Phase III. Great Lakes Region Indiana Michigan Ohio
 2016 Agricultural Resource Management Phase III Great Lakes Region Indiana Michigan Ohio What We Have Collected So Far A. Land in Farm B. Crop Acreage, Production & Cash Sales C. Livestock Inventory, Removed
2014 Michigan Dairy Farm Business Analysis Summary. Eric Wittenberg And Christopher Wolf. Staff Paper December, 2015
 2014 Michigan Dairy Farm Business Analysis Summary Eric Wittenberg And Christopher Wolf Staff Paper 2015-08 December, 2015 Department of Agricultural, Food, and Resource Economics MICHIGAN STATE UNIVERSITY
2011 STATE FFA FARM BUSINESS MANAGEMENT TEST PART 2. Financial Statements (FINPACK Balance Sheets found in the resource information)
") 2011 STATE FFA FARM BUSINESS MANAGEMENT TEST PART 2 Financial Statements (FINPACK Balance Sheets found in the resource information) Please use the Market Value when making the calculations for the Zimmerman
2011 STATE FFA FARM BUSINESS MANAGEMENT TEST PART 2 Financial Statements (FINPACK Balance Sheets found in the resource information) Please use the Market Value when making the calculations for the Zimmerman
2009 Michigan Dairy Farm Business Analysis Summary. Eric Wittenberg And Christopher Wolf. Staff Paper December, 2010
 2009 Michigan Dairy Farm Business Analysis Summary Eric Wittenberg And Christopher Wolf Staff Paper 2010-04 December, 2010 Department of Agricultural, Food, and Resource Economics MICHIGAN STATE UNIVERSITY
2015 Michigan Dairy Farm Business Analysis Summary. Eric Wittenberg And Christopher Wolf. Staff Paper November, 2016
 2015 Michigan Dairy Farm Business Analysis Summary Eric Wittenberg And Christopher Wolf Staff Paper 2016-01 November, 2016 Department of Agricultural, Food, and Resource Economics MICHIGAN STATE UNIVERSITY
2007 Michigan Dairy Grazing Farm Business Analysis Summary. Eric Wittenberg And Christopher Wolf. Staff Paper December, 2008
 2007 Michigan Dairy Grazing Farm Business Analysis Summary Eric Wittenberg And Christopher Wolf Staff Paper 2008-5 December, 2008 Department of Agricultural, Food, and Resource Economics MICHIGAN STATE
2006 Michigan Dairy Grazing Farm Business Analysis Summary. Eric Wittenberg And Christopher Wolf. Staff Paper November, 2007
 2006 Michigan Dairy Grazing Farm Business Analysis Summary Eric Wittenberg And Christopher Wolf Staff Paper 2007-09 November, 2007 Department of Agricultural Economics MICHIGAN STATE UNIVERSITY East Lansing,
Economic Research Service The USDA Commodity Costs and Returns (CAR) Estimation Project
 Estimation Project") Economic Research Service The USDA Commodity Costs and Returns (CAR) Estimation Project William D. McBride USDA, ERS Presented at FAO Expert Group Meeting November 28, 2011; Addis Ababa, Ethiopia Outline
Economic Research Service The USDA Commodity Costs and Returns (CAR) Estimation Project William D. McBride USDA, ERS Presented at FAO Expert Group Meeting November 28, 2011; Addis Ababa, Ethiopia Outline
Contribution of Federal Lands to Wyoming Range Livestock Production, 1992
 B-993 February 1994 0 Contribution of Federal Lands to Wyoming Range Livestock Production, 1992 Brett R. Moline Robert R. Fletcher David T. Taylor Gerald Fink Frank Henderson University of Wyoming, Cooperative
2007 Michigan Dairy Farm Business Analysis Summary. Eric Wittenberg And Christopher Wolf. Staff Paper December, 2008
 2007 Michigan Dairy Farm Business Analysis Summary Eric Wittenberg And Christopher Wolf Staff Paper 2008-04 December, 2008 Department of Agricultural, Food, and Resource Economics MICHIGAN STATE UNIVERSITY
2008 Michigan Cash Grain Farm Business Analysis Summary. Eric Wittenberg And Stephen Harsh. Staff Paper November, 2009
 2008 Michigan Cash Grain Farm Business Analysis Summary Eric Wittenberg And Stephen Harsh Staff Paper 2009-11 November, 2009 Department of Agricultural, Food, and Resource Economics MICHIGAN STATE UNIVERSITY
2015 Michigan Cash Grain Farm Business Analysis Summary. Eric Wittenberg And Christopher A. Wolf. Staff Paper November, 2016
 2015 Michigan Cash Grain Farm Business Analysis Summary Eric Wittenberg And Christopher A. Wolf Staff Paper 2016-02 November, 2016 Department of Agricultural, Food, and Resource Economics MICHIGAN STATE
2004 Michigan Dairy Farm Business Analysis Summary. Eric Wittenberg Christopher Wolf. Staff Paper September 2005
 Staff Paper 2004 Michigan Dairy Farm Business Analysis Summary Eric Wittenberg Christopher Wolf Staff Paper 2005-10 September 2005 Department of Agricultural Economics MICHIGAN STATE UNIVERSITY East Lansing,
2014 Michigan Cash Grain Farm Business Analysis Summary. Eric Wittenberg And Christopher A. Wolf. Staff Paper December, 2015
 2014 Michigan Cash Grain Farm Business Analysis Summary Eric Wittenberg And Christopher A. Wolf Staff Paper 2015-07 December, 2015 Department of Agricultural, Food, and Resource Economics MICHIGAN STATE
NEBRASKA FFA FARM MANAGEMENT CAREER DEVELOPMENT CONTEST 2016 Farm Business Management Practice Contest Examination
 NEBRASKA FFA FARM MANAGEMENT CAREER DEVELOPMENT CONTEST 2016 Farm Business Management Practice Contest Examination 1. A farm business operation which is highly financially leveraged is best described as
Managing For Today s Cattle Market And Beyond: A Comparative Analysis Of ND - Demo Cow Herd To North Dakota Database
 Managing For Today s Cattle Market And Beyond: A Comparative Analysis Of ND - Demo - 160 Cow Herd To North Dakota Database By Harlan Hughes Extension Livestock Economist Dept of Agricultural Economics
Effects of Reducing the Income Cap on Eligibility for Farm Program Payments
 United States Department of Agriculture Economic Research Service Economic Information Bulletin Number 27 Effects of Reducing the Income Cap on Eligibility for Farm Program Payments Ron L. Durst September
2011 Michigan Cash Grain Farm Business Analysis Summary. Eric Wittenberg And Christopher A. Wolf. Staff Paper October, 2012
 2011 Michigan Cash Grain Farm Business Analysis Summary Eric Wittenberg And Christopher A. Wolf Staff Paper 2012-09 October, 2012 Department of Agricultural, Food, and Resource Economics MICHIGAN STATE
Cash Flow and Enterprise Information - step two for your 2016 farm analysis
 1 of 24 Name Address County Phone Email Year Born Year Started Farming Cash Flow and Enterprise Information - step two for your 2016 farm analysis Now that you have a beginning and an ending balance sheet,
Martin and Peg Smith Case
 Martin and Peg Smith Case Introduction The end of another year was quickly approaching. As was typical at this time of the year, Martin and Peg were gathering financial information for their mid-november
FARM BUSINESS MANAGEMENT
 FARM BUSINESS MANAGEMENT 2009 Annual Report Central and West Central Minnesota April, 2010 A Management Education Program Minnesota State Colleges and Universities Ridgewater College VISIT OUR WEBSITE
Planning Work & Interviewing ARMS Phase 3 Workshop January 2018
 Planning Work & Interviewing 2017 ARMS Phase 3 Workshop January 2018 Review the Survey Planning Work Know the ends / outs of the questionnaire Be prepared for a question know the survey purpose be familiar
Appendix I Whole Farm Analysis Procedures and Measures
 Appendix I Whole Farm Analysis Procedures and Measures The whole-farm reports (except for the balance sheets) include the same number of farms, which were all of the farms whose records were judged to
Managing For Today s Cattle Market And Beyond A Comparative Analysis Of Demo Herd 1997 Herd To McKenzie County Database
 Managing For Today s Cattle Market And Beyond A Comparative Analysis Of Demo Herd 1997 Herd To McKenzie County Database By Harlan Hughes Extension Livestock Economist Dept of Agricultural Economics North
2006 Iowa Farm Costs. and Returns File C1-10. Ag Decision Maker. Definition of Terms Used
 2006 Iowa Farm Costs Ag Decision Maker and Returns File C1-10 The farm record data utilized in this report were obtained from the Iowa Farm Business Associations. The average of all farms in each table
Economics 330 Fall 2005 Exam 1. Strategic Planning and Budgeting
 Economics 330 Fall 2005 Exam 1 K E Y Strategic Planning and Budgeting Circle the letter of the best answer. You may put a square around the letter of your second choice. If your second choice is right,
2007 Michigan Cash Grain Farm Business Analysis Summary. Eric Wittenberg And Stephen Harsh. Staff Paper December, 2008
 2007 Michigan Cash Grain Farm Business Analysis Summary Eric Wittenberg And Stephen Harsh Staff Paper 2008-07 December, 2008 Department of Agricultural, Food, and Resource Economics MICHIGAN STATE UNIVERSITY
A. Circle the best answer. Put a square around your second choice, if you want. If your second choice is correct you get half credit.
 Economics 330 Exam 1 Fall 2007 Farm Budgeting and Planning K E Y A. Circle the best answer. Put a square around your second choice, if you want. If your second choice is correct you get half credit. (4
A Decade of Change in Texas Agriculture Highlights and Trends from the Census of Agriculture
 E-590 10/09 A Decade of Change in Texas Agriculture Highlights and Trends from the Census of Agriculture A Decade of Change in Texas Agriculture Highlights and Trends from the Census of Agriculture Authors
2012 STATE FFA FARM BUSINESS MANAGEMENT TEST PART 2. Financial Statements (FINPACK Balance Sheets found in the resource information)
") 2012 STATE FFA FARM BUSINESS MANAGEMENT TEST PART 2 Financial Statements (FINPACK Balance Sheets found in the resource information) Please use the Market Value when making the calculations for the Zimmerman
2012 STATE FFA FARM BUSINESS MANAGEMENT TEST PART 2 Financial Statements (FINPACK Balance Sheets found in the resource information) Please use the Market Value when making the calculations for the Zimmerman
Ohio Farm Financial Conditions and Outlook: Farm Income and Assets, Land Values and Rent, and Farm Financial Stress
 Ohio Farm Financial Conditions and Outlook: Farm Income and Assets, Land Values and Rent, and Farm Financial Stress Ani Katchova Associate Professor Farm Income Enhancement Chair Department of Agricultural,
CRS Report for Congress
 Order Code RS21779 Updated December 13, 2004 CRS Report for Congress Received through the CRS Web Summary Farm Commodity Programs: Direct Payments, Counter-Cyclical Payments, and Marketing Loans Jim Monke
housing construction and related industries, including financial decline, however, was greater in metro areas (-3.8 percent) than in nonmetro
 than in nonmetro") Rural Beginning America Farmers and At Ranchers A Glance At A Glance 29 213 Edition Edition The U.S. economy moved into a recession in late 27, led by declines in housing construction and related industries,
Rural Beginning America Farmers and At Ranchers A Glance At A Glance 29 213 Edition Edition The U.S. economy moved into a recession in late 27, led by declines in housing construction and related industries,
Higher Cropland Value from Farm Program Payments: Who Gains? Real estate accounts for more than three-quarters of total
 26 Economic Research Service/USDA Agricultural Outlook/November 2001 Higher Cropland Value from Farm Program Payments: Who Gains? Real estate accounts for more than three-quarters of total U.S. farm assets.
Agriculture & Business Management Notes...
 Agriculture & Business Management Notes... SPA Standardized Performance Analysis For Cow/Calf Producers -- A Worksheet Approach -- Cow/calf producers have been challenged to be lower cost producers, to
Trends in Agricultural Contracts
 The magazine of food, farm, and resource issues 3rd Quarter 2015 30(3) A publication of the Agricultural & Applied Economics Association Trends in Agricultural Contracts James M. MacDonald JEL Classifications:
APPENDIX A. General Explanation
 APPENDIX A. General Explanation DATA COLLECTION Method of Enumeration As in the previous censuses of the U.S. Virgin Islands, a direct enumeration procedure was used in the 2007 Census of Agriculture.
Contribution of Agribusiness to the Magic Valley Economy, 2010
 CIS 1193 Contribution of Agribusiness to the Magic Valley Economy, 2010 by S. Hines, J. Packham, and G. Taylor Introduction Irrigation has transformed the Magic Valley desert (Cassia, Lincoln, Minidoka,
An Economic Comparison of Organic and Conventional Dairy Production, and Estimations on the Cost of Transitioning to Organic Production
 An Economic Comparison of Organic and Conventional Dairy Production, and Estimations on the Cost of Transitioning to Organic Production Produced by: the Northeast Organic Farming Association of Vermont
Annual Summary Data Kentucky Beef Farms
 Cooperative Extension Service, University of Kentucky College of Agriculture, Food and Environment. Agricultural Economics - Extension No. 2013-13 Kentucky Farm Business Management Program Annual Summary
FAPRI-UMC Report December 8, 2005
 FAPRI-UMC Report 17-05 December 8, 2005 FAPRI 2006 Outlook for Missouri Agriculture Food and Agricultural Policy Research Institute (FAPRI) College of Agriculture, Food and Natural Resources University
THE STRUCTURE OF SOUTH DAKOTA AGRICULTURE:
 THE STRUCTURE OF SOUTH DAKOTA AGRICULTURE: 1935-2012 by Henry Brown, Larry Janssen, Matthew A. Diersen, and Evert Van der Sluis Economics Research Report 2015-1 September 14, 2015 Henry Brown is a Graduate
2008 FARM BILL: WITH FOCUS ON ACRE AND SURE
 2008 FARM BILL: WITH FOCUS ON ACRE AND SURE Carl Zulauf Ag. Economist, Ohio State University Updated: 1 2008 Farm Bill: Big Picture Themes Continued Expansion in Scope of the Bill First livestock title
POTENTIAL CHALLENGES FOR BEGINNING FARMERS AND RANCHERS
 2nd Quarter 2011 26(2) POTENTIAL CHALLENGES FOR BEGINNING FARMERS AND RANCHERS Mary Clare Ahearn JEL Classifications: Q12, Q14, Q14, Q18, R12 Keywords: Beginning Farmer and Rancher, Farm Finances, Access
3. Dairy Production Data: 3.1. Year-end milk check showing total pounds of milk sold for the year DHIA Herdcode
 Dairy Cash Flow Plan extension.psu.edu Annual Cash Flow Checklist: 1. Historical Financial Data: 1.1. 2015 Income & Expenses Bring print out from computer or paper record book if possible 1.2. 2015 Schedule
Farm Financial Outlook
 Farm Financial Outlook Alejandro Plastina, PhD Assistant Professor, Economics NACM Heartland - National Agriculture Retail Credit Exchange Group Ankeny, IA March 2, 2017 Main topics Farm Financial Situation
ARC / PLC Program Overview
 ARC / PLC Program Overview 1 The 2014 Farm Bill provides the following: Eliminates DCP and ACRE program Allows for a one-time decision REALLOCATE base acres and/or UPDATE Counter-Cyclical Yields on a farm
~il~~:~~ii~!. ~...~: {(.~i. !!.~I~ji!': i~i( l:;i;!i:i;i;i:::-: :: C: ..::::)~::m~:l::::t:m:;::;;%::;:!;:;:;:j;.:;:;::::;::j::j:j\:;..
~::m~:l::::t:m:;::;;%::;:!;:;:;:j;.:;:;::::;::j::j:j\:;..") May 1983 A.E. Ext. 83-10 ~il~~:~~ii~!. ~...~:..::::)~::m~:l::::t:m:;::;;::;:!;:;:;:j;.:;:;::::;::j::j:j\:;.. ;/::@H::;j'::;{:: ::::;:;:;:;:::;:::::::::::::;: ::::::;:::::;:;:::;:::::;::::: ~ ~::: ~: ~:
May 1983 A.E. Ext. 83-10 ~il~~:~~ii~!. ~...~:..::::)~::m~:l::::t:m:;::;;::;:!;:;:;:j;.:;:;::::;::j::j:j\:;.. ;/::@H::;j'::;{:: ::::;:;:;:;:::;:::::::::::::;: ::::::;:::::;:;:::;:::::;::::: ~ ~::: ~: ~:
Report on Minnesota Farm Finances. August, 2009
 2008 Report on Minnesota Farm Finances August, 2009 Acknowledgements: Contributing Minnesota producers Minnesota State Colleges and Universities Farm Business Management Education Program Southwestern
Outlook for the 2014 U.S. Farm Economy. Kevin Patrick Farm Economy Branch Resource and Rural Economics Division
 Outlook for the 214 U.S. Farm Economy Kevin Patrick Farm Economy Branch Resource and Rural Economics Division Overview Net farm income in 214 forecast: $95.8 billion Down more than 25% from 213 Net cash
Annual Summary Data Kentucky Beef Farms 2013
 Cooperative Extension Service, University of Kentucky College of Agriculture, Food and Environment. Agricultural Economics - Extension No. 2014-04 Kentucky Farm Business Management Program Annual Summary
The sales price for Pasture equivalents is zero. Check the feed prices on the last section of the Budgets.
 File: M&m FINFLO 2006 Warning The sales price for Pasture equivalents is zero. Check the feed prices on the last section of the Budgets. Max and Marlene Profit FINLRB: Succession example Anyplace, Eastern
User Manual - Custom Finish Cattle Profit Projection
 User Manual - Custom Finish Cattle Profit Projection The purpose of this decision aid is to help facilitate the organization of custom finish cattle, feeder cattle price, costs and production data to project
Purpose and Uses of ARMS Data
 Purpose and Uses of ARMS Data Kevin L. Barnes Director, Western Field Operations USDA NASS James MacDonald USDA Economic Research Service ARMS Phase III National Workshop January 11, 2017 St Louis, Missouri
Report on Minnesota Farm Finances. April, 2010
 2009 Report on Minnesota Farm Finances April, 2010 Acknowledgements: Contributing Minnesota producers Minnesota State Colleges and Universities Farm Business Management Education Program Southwestern Minnesota
Accounting for Agriculture
 International Journal of Recent Research and Review, Vol. II, June 2012 Accounting for Agriculture R. S. Sharma Department of ABST, Assistant Professor, University of Rajasthan, Jaipur, India Email: sharmarss1959@gmail.com
MILK PRODUCTION COSTS in 1998 on Selected WISCONSIN DAIRY FARMS
 MILK PRODUCTION COSTS in 1998 on Selected WISCONSIN DAIRY FARMS by Gary Frank and Jenny Vanderlin 1 July 23, 1999 Introduction Total cost of production per hundredweight equivalent of milk ($14.90) was
The data for this report were collected by Iowa Farm Business Association consultants and compiled by Iowa State University Extension and Outreach.
 2016 Cash Iowa Rental Farm Rates Costs for Iowa Ag Decision Maker Returns 2015 Survey File C1-10 The farm record data utilized in this report were obtained from the Iowa Farm Business Association. The
APPENDIX A. General Explanation
 APPENDIX A. General Explanation DATA COLLECTION Method of Enumeration As in the previous censuses of Guam, a direct enumeration procedure was used in the 2007 Census of Agriculture, and as in the 2002
Jason Henderson Vice President and Branch Executive Federal Reserve Bank of Kansas City Omaha Branch April 25, 2012
 Jason Henderson Vice President and Branch Executive April 25, 2012 The views expressed are those of the author and do not necessarily reflect the opinions of the Federal Reserve Bank of Kansas City or
MILK PRODUCTION COSTS in 2001 on Selected WISCONSIN DAIRY FARMS
 MILK PRODUCTION COSTS in 2001 on Selected WISCONSIN DAIRY FARMS By Gary Frank and Jenny Vanderlin 1 July 22, 2002 Introduction The good news is that higher milk prices in 2001 caused an increased of almost
Contribution of Agribusiness to the Magic Valley Economy, 2013
 BUL 916 Contribution of Agribusiness to the Magic Valley Economy, 2013 Steven Hines University of Idaho Extension, Jerome County Joel Packham UI Extension, Cassia County Carmen Wilmore UI Extension, Lincoln
Wisconsin Agricultural Economics Outlook Forum
 Wisconsin Agricultural Economics Outlook Forum January 21, 2015 Executive Summary Status of the Wisconsin Farm Economy This document was prepared by the Renk Agribusiness Institute in January, 2015. Wisconsin
Appendix B. General Explanation and Report Form
 Appendix B. General Explanation and Report Form DEVELOPMENT OF THE REPORT FORM Planning for the NASS organic production survey began in the fall of 2013. Report form content was developed with individuals
Figure Farm Bill Spending, June 2017 Congressional Budget Office 10-Year Projections
 FARM BILL The farm bill is omnibus, multi-year authorizing legislation that governs an array of agricultural and food programs. It is typically renewed about every five years. The 2014 Farm Bill contains
Focus. Panhandle Model Farms 2016 Case Studies of Texas. High Plains Agriculture. DeDe Jones Steven Klose
 FARM Assistance Focus Panhandle Model Farms 2016 Case Studies of Texas High Plains Agriculture DeDe Jones Steven Klose Farm Assistance Focus 2016-3 November 2016 Department of Agricultural Economics, Texas
U.S. DEPARTMENT OF AGRICULTURE ECONOMIC RESEARCH SERVICE August 1972 FCR-83 cooperating with New Mexico State University COSTS NOV
 U.S. DEPARTMENT OF AGRICULTURE ECONOMIC RESEARCH SERVICE August 1972 FCR-83 cooperating with New Mexico State University COSTS NOV 2 1872 and RETURNS FARM COSTS AND RETURNS STUDIES This report is part
MILK PRODUCTION COSTS in 2000 on Selected WISCONSIN DAIRY FARMS
 MILK PRODUCTION COSTS in 2000 on Selected WISCONSIN DAIRY FARMS By Gary Frank 1 July 27, 2001 Introduction In 2000, the U.S. Average Milk Price ($12.33) was less than the study farms' total economic cost
Funding for Small Acreage Horticultural Producers. Luis A. Ribera Assistant Professor and Extension Economist June 7, 2011
 2008 Farm Bill Programs for Specialty Crops Funding for Small Acreage Horticultural Producers Luis A. Ribera Assistant Professor and Extension Economist June 7, 2011 Presentation Outline The 2008 Farm
2018 Farm Bill- House Proposal
 2018 Farm Bill- House Proposal The text of the legislation, summary materials and supporting documents shared by the House Agriculture Committee can be found here: https://agriculture.house.gov/farmbill/.
Farm Financial Record Keeping Using Quicken for Windows Category List
 Farm Financial Record Keeping Using Quicken for Windows Category List and Expense Categories A list of income and expense categories that can be imported into Quicken financial recordkeeping have been
& Policy Update. October 28, 2016 Volume 16, Issue 10. Edited by Will Snell & Phyllis Mattox. Dairy Market Continues to Struggle
 Graphic owner: UKZN SAEES: school website & Policy Update October 28, 2016 Volume 16, Issue 10 Edited by Will Snell & Phyllis Mattox Dairy Market Continues to Struggle Like many agricultural sectors, 2016
Visit Our Website To Learn More!
 Visit Our Website To Learn More! www.ers.usda.gov You can find additional information about ERS publications, databases, and other products at our website. National Agricultural Library Cataloging Record:
MILK PRODUCTION COSTS in 2008 On Selected WISONSIN DAIRY FARMS
 MILK PRODUCTION COSTS in 2008 On Selected WISONSIN DAIRY FARMS By Ken Bolton and Jenny Vanderlin 1 October 2009 Introduction The Basic Cost of Production increased in 2008 by $0.35/cwt equivalent (CWT
Welcome to Annie's Project
 Welcome to Annie's Project Please help us to better prepare and continue to improve course by completing brief Pre-course Survey. Use the navigator buttons at the bottom of the page to move between pages.
MILK PRODUCTION COSTS and SELECTED FINANCIAL BENCHMARKS FROM 978 WISCONSIN DAIRY FARMS
 1996 1 MILK PRODUCTION COSTS and SELECTED FINANCIAL BENCHMARKS FROM 978 WISCONSIN DAIRY FARMS by Gary Frank and Jenny Vanderlin 2 August 27, 1997 Introduction In this study of 1996 records, 978 dairy farms
USING PRODUCTION COSTS AND BREAKEVEN LEVELS TO DETERMINE INCOME POSSIBILITIES
 USING PRODUCTION COSTS AND BREAKEVEN LEVELS TO DETERMINE INCOME POSSIBILITIES Dale Lattz and Gary Schnitkey Department of Agricultural and Consumer Economics University of Illinois at Urbana-Champaign
The Contributions Approach to Establishing Equitable Pasture Lease Agreements Stocking Rates
 PB 1816-D The Contributions Approach to Establishing Equitable Pasture Lease Agreements This publication provides management information and guidelines for landlords and tenants to follow when negotiating
Ranch Calculator (RanchCalc)
") Oklahoma Cooperative Extension Service Current Report CR-3252 0609 Oklahoma Cooperative Extension Fact Sheets are also available on our website at: facts.okstate.edu Ranch Calculator (RanchCalc) Damona
Oklahoma Cooperative Extension Service Current Report CR-3252 0609 Oklahoma Cooperative Extension Fact Sheets are also available on our website at: facts.okstate.edu Ranch Calculator (RanchCalc) Damona
MILK PRODUCTION COSTS in 2009 on Selected WISONSIN DAIRY FARMS
 MILK PRODUCTION COSTS in 2009 on Selected WISONSIN DAIRY FARMS By Ken Bolton and Jenny Vanderlin 1 Introduction January 2011 The good news is that Wisconsin dairy farmers lowered their basic cost of production
CALCULATED LAND USE VALUES
 Staff Paper SP 2015-08 May 2015 CALCULATED LAND USE VALUES FOR LOUISIANA S AGRICULTURAL AND HORTICULTURAL LAND, 2011-2014 Prepared for The Louisiana Tax Commission Prepared by Dr. Michael Salassi & Dr.
Decisions to be Made
 1 Word of the 2 Decisions to be Made 1. Base Acre Reallocation Decision 2. Payment Yield Update Decision 3. Decision between Price Loss Coverage PLC (price based) Agriculture Risk Coverage ARC (revenue
Devin Murnin. Director of Industry Programs Colorado Cattlemen s Association
 Devin Murnin Director of Industry Programs Colorado Cattlemen s Association Colorado Agriculture Statistics Agriculture Second Largest Contributor to Colorado Economy Approximate Land Area: 66.3 Million
U.S. Farm Income Outlook for 2015
 Randy Schnepf Specialist in Agricultural Policy February 18, 2015 Congressional Research Service 7-5700 www.crs.gov R40152 Summary According to USDA s Economic Research Service (ERS), national net farm
Agriculture & Business Management Notes...
 Agriculture & Business Management Notes... Pasture Leases Quick Notes... A lease is an agreement giving use of an asset to a lessee for a specific period of time at a specified rate without transfer of
e Profit Monitor Notes on Drystock Input Sheets Version 1.0
 e Profit Monitor Notes on Drystock Input Sheets Version 1.0 Farm Details Year End Date Enter the year end date for the year in question e.g. 31/12/2003 for the year 2003 Registered for VAT Enter Yes or
How Will Farmers Respond to High Fuel and Fertilizer Prices?
 How Will Farmers Respond to High Fuel and Fertilizer Prices? Damona Doye Regents Professor and Extension Economist Oklahoma State University Value of production by commodity Cattle and calves Poultry &
U.S. Farm Income Outlook for 2018
 Randy Schnepf Specialist in Agricultural Policy February 27, 2018 Congressional Research Service 7-5700 www.crs.gov R45117 Summary According to USDA s Economic Research Service (ERS), national net farm
Kansas Farm Economy Update Land and Leasing
 Kansas Farm Economy Update Land and Leasing Mykel Taylor Kansas State University January 10, 2017 Net Farm and Ranch Income Returns over Total Costs ($/ac) $230,000 $180,000 $130,000 $80,000 $30,000 $(20,000)
A Study into Dairy Profitability MSC Business Services during
 A Study into Dairy Profitability MSC Business Services during 2006-2009 July 2010 Authors: Michael Evanish, Manager Wayne Brubaker, Consultant Lee Wenger, Consultant Page 1 of 43 Page 2 of 43 Index Part
Farmer-to-Consumer Marketing: The Series
 Farmer-to-Consumer Marketing #2 Production and Marketing Costs Effective Financial Management Strategies for managing production and marketing costs ensure greater profitability and stability, especially
Wheat Enterprises: 1999 Costs and Returns
 Wheat Enterprises: 1999 Costs and Returns KENTUCKY FARM BUSINESS MANAGEMENT PROGRAM Agricultural Economics Extension No. 2001-07 July 2001 By: DAVID L. HEISTERBERG AND RICHARD L. TRIMBLE University of
ARC/PLC Program Overview
 ARC/PLC Program Overview FSA and University of MN Extension Producer Meetings December 2014 January 2015 The 2014 Farm Bill provides the following: Eliminates DCP and ACRE program Allows for a one-time
Characteristics and Production Costs of U.S. Cow-Calf Operations
 United States Department of Agriculture Electronic Report from the Economic Research Service www.ers.usda.gov Statistical Bulletin Number 974-3 November 2001 Characteristics and Production Costs of U.S.
Sustainable Agriculture Research and Education. North Central Region SARE. Sustainable Agriculture Research and Education
 Sustainable Agriculture Research and Education North Central Region SARE Sustainable Agriculture Research and Education Research and Education Program Survey of Farmers and Ranchers North Central Region
Three factor to consider Market, Market & Market. Some of our agricultural produce is actually utilized on the farm from where they were produced
 Marketing Three factor to consider Market, Market & Market. Some of our agricultural produce is actually utilized on the farm from where they were produced (i.e. hay). However, over 90% of US wheat and
Focus. Panhandle Model Farms 2018 Case Studies of Texas. High Plains Agriculture
 FARM Assistance Focus Panhandle Model Farms 2018 Case Studies of Texas High Plains Agriculture DeDe Jones Steven Klose Will Keeling Farm Assistance Focus 2019-1 January 2019 Department of Agricultural
2018 Farm Bill Survey
 2018 Farm Bill Survey In preparation for participating in development of the 2018 Farm Bill, we are surveying producers on key issues that are likely to be considered by Congress during this process. The