Farm Leasing Arrangements. Tim Eggers. Field Agricultural Economist
|
|
|
- Sharlene Harrington
- 5 years ago
- Views:
Transcription
1 Farm Leasing Arrangements Tim Eggers Field Agricultural Economist

2 Farm Leasing Arrangements Charles Brown Field Specialist - Farm Management crbrown@iastate.edu

3 Farm Leasing Arrangements Melissa O Rourke Field Specialist - Farm Management morourke@iastate.edu

4 Farm Leasing Arrangements Shane Ellis Field Specialist - Farm Management shanee@iastate.edu

5 Farm Leasing Arrangements Steve Johnson Field Specialist - Farm Management sdjohns@iastate.edu

6 Farm Leasing Arrangements Kelvin Leibold Field Specialist - Farm Management kleibold@iastate.edu

7 Farm Leasing Arrangements Ryan Drollette Field Specialist - Farm Management drollett@iastate.edu

8 Farm Leasing Arrangements Gary Wright Field Specialist - Farm Management gdwright@iastate.edu
9 Agenda 2015 Farm Leasing Arrangements Follow -up Evaluation Summary Land Values Cash Rental Rates Landlord/Tenant Communication Legal Issues Farm Program Payment Update Costs of Crop Production Calculating a Fair Cash Rental Rate
10 Which of the following would you consider to be your PRIMARY occupation? Answer Response % Non-farming landowner % Active farmer 97 29% Ag lender 24 7% Attorney or Accountant 8 2% Professional farm manager 3 1% Other (please specify) 53 16% Total %
11 Intended changes to lease arrangements based on information presented Apply for the Beginning Farmer Tax Credit or Custom Farming Tax Credit 4% Move from an oral lease to a written lease agreement 9% File and perfect a landlord's lien 3% Increase rent 3% Decrease rent 30% Change type of lease 9% Other 9% Implement conservation strategies 9% No changes will be made 24% N=382 excludes Not Lessors/Not Lessees
12 You answered, we listened Why do you choose to participate in farmland leasing meetings? 1. Gain knowledge on farmland leasing, rental market and trends 2. Improve knowledge for communicating with other parties involved 3. Gain knowledge on leasing practices
13 5. Why did you choose to participate in the Farmland Leasing Arrangements Meeting? # Answer Response % 1 Update on rental market 36 28% 2 Non-farmer education/communication 27 21% 3 General gain of knowledge/information 20 16% 4 Update on lease arrangements/practices 20 16% 5 Update on current issues 13 10% 6 Learn what others are doing 8 6% 7 Speaker/location/topic 5 4% SEE Excel file tab 5_whyparticipate for raw data.
14 You answered, we listened What topics would you want covered at the 2016 Farmland Leasing Meeting? 1. Profitability and cost of production 2. Setting rates and determining what is fair 3. Taking care of the land 4. Types of leases 5. Legal updates negotiations, terminations
15 Have you attended a Farmland Leasing Arrangements Meeting prior to this year? # Answer Response % 1 Yes, multiple times % 2 Yes, once before % 3 No, 2015 was the first time I attended % 4 I don t know/i m not sure. 5 2% Total % ~1,845 participants at Leasing Programs in Survey results from 137 through Qualtrics (33% response rate) and 199 returned from mailed survey (29% response rate) totaled 336 evaluations (~18% of participants).

16 December 2017 Corn Futures Contract 2016 Leasing Meetings

17 November 2017 Soybean Futures Contract 2016 Leasing Meetings
18 2015 Cropland Value by State - Dollars per acre and percent change from
19 AgLetter Federal Reserve Bank of Chicago
20 Realtors Land Institute March 2016 Survey
21 Farmland Value per Acre Land value per acre ($/acre)
22 Farmland Values for Crop Reporting District 1 by Year $ per acre $13,000 $12,000 $11,000 $10,000 $9,000 $8,000 $7,000 $6,000 $5,000 $4,000 $3,000 $2,000 $1,000 $0 High Medium Low $1,720 15%
23 $ per acre $12,000 $11,000 $10,000 $9,000 $8,000 $7,000 $6,000 $5,000 $4,000 $3,000 $2,000 $1,000 $0 Farmland Values for Crop Reporting District 2 by Year High Medium Low $1,856 19%
24 $ per acre $12,000 $11,000 $10,000 $9,000 $8,000 $7,000 $6,000 $5,000 $4,000 $3,000 $2,000 $1,000 $0 Farmland Values for Crop Reporting District 3 by Year High Medium Low $1,300 14%
25 $ per acre $12,000 $11,000 $10,000 $9,000 $8,000 $7,000 $6,000 $5,000 $4,000 $3,000 $2,000 $1,000 $0 Farmland Values for Crop Reporting District 4 by Year High Medium Low $1,388 15%
26 $ per acre $12,000 $11,000 $10,000 $9,000 $8,000 $7,000 $6,000 $5,000 $4,000 $3,000 $2,000 $1,000 $0 Farmland Values for Crop Reporting District 5 by Year High Medium Low $1,372 14%
27 $ per acre $12,000 $11,000 $10,000 $9,000 $8,000 $7,000 $6,000 $5,000 $4,000 $3,000 $2,000 $1,000 $0 Farmland Values for Crop Reporting District 6 by Year High Medium Low $821 9%
28 Farmland Values for Crop Reporting District 7 by Year $ per acre $10,000 $9,000 $8,000 $7,000 $6,000 $5,000 $4,000 $3,000 $2,000 $1,000 $0 High Medium Low $1,159 15%
29 Farmland Values for Crop Reporting District 8 by Year $7,000 $6,000 High Medium Low $ per acre $5,000 $4,000 $3,000 $2,000 $1,000 $0 $394 8%
30 Farmland Values for Crop Reporting District 9 by Year $ per acre $10,000 $9,000 $8,000 $7,000 $6,000 $5,000 $4,000 $3,000 $2,000 $1,000 $0 High Medium Low $322 4%
31 Percent of Sales 90% 80% 70% 60% 50% 40% 30% 20% 10% 0% Iowa Farmland Purchases by Farmers and Investors and Land Values Farmers Investors Average Land Value $10,000 $9,000 $8,000 $7,000 $6,000 $5,000 $4,000 $3,000 $2,000 $1,000 $0 Average Land Value per Acre


32 Iowa Landlords by Ownership Arrangements - % Rented Acres Corporation, 5.3 Other, 3.1 Operator Landlord, 23.2 Trust, 23.9 Total acres rented out in Iowa, 2014: million acres more than 50% of Iowa farmland. Partnership, 14.4 Individual, 37.0 Source: USDA NASS TOTAL
33 District Farmland Values Predictions Increase 5% or more in Five Years Increase 0-5% Stay the same Decrease 0-5% PERCENT Decrease 5-10% Decrease 10% or more Northwest North Central Northeast West Central Central East Central Southwest South Central Southeast STATE
34 % Change in Land Values by District 2014 and 2015 District Average Value 2015 % Change % Change Northwest $9, % -12.3% North Central $7, % -13.1% Northeast $7, % -11.0% West Central $8, % -10.8% Central $8, % -8.0% East Central $8, % -3.4% Southwest $6, % -13.5% South Central $4, % -6.6% Southeast $6, % 3.2% State Avg. $7, % -8.9%

35 Iowa Farmland Value Portal

36 Percent of Farmland Leased or Rented, 2012 Source: USDA NASS 2012 Census of Ag
37 Rent to Owner - Corn $400 $350 $300 $ per Acre $250 $200 $150 $100 $50 Crop Share Cash Rent 30% Flex Rent $0
38 Crop Share vs Cash Rent vs Flex Rent Rent is paid in cash Rent returns change with price and/or yield Owner contributes to costs of crop production Crop Share X X Cash Rent Flex Rent X X X
39 Crop Share Lease Advantages Risks associated with price and yield variations are shared. The owner is more involved in making decisions and marketing the grain during the year. Both parties share the benefits from adoption of yield-increasing technology, or unexpected high yields or prices.
40 Crop Share Lease Advantages The owner receives more information about yields and inputs used each year. A second USDA payment limit is created.
41 Crop Share Lease Disadvantages The landlord and tenant must agree on how production expenses will be shared. Adjustments for sharing costs for storage and drying facilities, herbicides that reduce field work, or fertilizer and pesticide application may have to be made. The cropping plan to be followed and whether or not the farm participates in government programs must be agreed on.
42 Crop Share Lease Disadvantages Added cash rent for the use of buildings and storage facilities may have to be negotiated. If the owner s and tenant s grain is stored in the same bin, marketing decisions have to be made jointly. The landowner may be considered a material participant, and farm income will be subject to self-employment taxation.
43
44 ISU Cash Rent Survey Goal To provide current, accurate, and unbiased information on cash rents in Iowa Started in 1994 by Dr. William Edwards
45 ISU Cash Rent Survey Procedure People who are knowledgeable about rental rates are asked about typical land rental rates in their county Farm operators Landowners Agricultural Lenders Professional farm managers Realtors/Appraisers

46 ISU Cash Rent Survey 1,585 responses in 2016 (1,437 in 2015)
47 Average 2016 Typical Cash Rents for Corn & Soybean Acres
48 State and Crop Reporting District 1 $300 $250 Average Rent by Year $283 $267 $270 $259 $248 $224 $200 $150 $149 $174 $187 $188 State District 1 $
49 State and Crop Reporting District 2 Average Rent by Year $300 $294 $277 $270 $250 $200 $150 $155 $183 $196 $191 $220 State District 2 $254 $243 $
50 State and Crop Reporting District 3 $300 Average Rent by Year $266 $281 $277 $273 $250 $250 $223 $200 $150 $157 $190 $186 $192 State District 3 $
51 State and Crop Reporting District 4 $300 $250 Average Rent by Year $227 $279 $294 $288 $265 $245 $200 $179 $196 $195 State $150 $151 District 4 $
52 State and Crop Reporting District 5 $300 $250 Average Rent by Year $284 $275 $297 $261 $239 $226 $200 $191 $197 $195 $150 $157 State District 5 $
53 State and Crop Reporting District 6 Average Rent by Year $300 $284 $273 $255 $250 $219 $252 $242 $200 $166 $186 $193 $196 State $150 District 6 $
54 State and Crop Reporting District 7 $300 Average Rent by Year $250 $246 $257 $249 $242 $200 $150 $161 $170 $176 $213 State District 7 $220 $100 $
55 State and Crop Reporting District 8 $300 Average Rent by Year $250 $200 $150 $100 $126 $155 $146 $151 $177 $193 $210 $202 State District 8 $187 $
56 State and Crop Reporting District 9 $300 Average Rent by Year $250 $200 $198 $217 $229 $229 $217 $203 $150 $100 $134 $161 $173 $169 State District
57 Gross Revenue to a 50/50 Rotation (Marketing Year Average Price times Crop Reporting District 1 Average Yield) Cash Rent as a % of Gross Revenue $1,000 $900 $800 $825 $880 46% 50% 45% 40% $700 $600 $500 $400 $300 33% $415 $642 27% 23% 30% $582 35% 30% 25% 20% 15% Average 32% $200 10% $100 5% $ %
58 Gross Revenue to a 50/50 Rotation (Marketing Year Average Price times Crop Reporting District 2 Average Yield) Cash Rent as a % of Gross Revenue $1,000 $900 $800 $700 $600 $500 $400 $300 $200 $100 31% $442 $592 31% $789 $820 34% 24% 49% $552 55% 50% 45% 40% 35% 30% 25% 20% 15% 10% 5% Average 34% $ %
59 Gross Revenue to a 50/50 Rotation (Marketing Year Average Price times Crop Reporting District 3 Average Yield) Cash Rent as a % of Gross Revenue $1,000 $900 $800 $700 $600 $500 $400 $300 $200 32% $446 $577 33% $807 $827 32% 24% 49% $563 55% 50% 45% 40% 35% 30% 25% 20% 15% 10% Average 34% $100 5% $ %
60 Gross Revenue to a 50/50 Rotation (Marketing Year Average Price times Crop Reporting District 4 Average Yield) Cash Rent as a % of Gross Revenue $900 $800 $700 $600 $500 $400 $300 $200 $100 36% $386 $618 29% $784 25% $739 38% 48% $595 50% 45% 40% 35% 30% 25% 20% 15% 10% 5% Average 35% $ %
61 Gross Revenue to a 50/50 Rotation (Marketing Year Average Price times Crop Reporting District 5 Average Yield) Cash Rent as a % of Gross Revenue $900 $800 $700 $600 $500 $400 $300 32% $449 23% $600 32% $767 25% $887 31% 48% $590 50% 45% 40% 35% 30% 25% 20% 15% Average 34% $200 10% $100 5% $ %
62 Gross Revenue to a 50/50 Rotation (Marketing Year Average Price times Crop Reporting District 6 Average Yield) Cash Rent as a % of Gross Revenue $900 $800 $700 $600 $500 $400 $300 $200 35% $441 31% $606 $765 26% $832 30% 44% $614 45% 40% 35% 30% 25% 20% 15% 10% Average 33% $100 5% $ %
63 Gross Revenue to a 50/50 Rotation (Marketing Year Average Price times Crop Reporting District 7 Average Yield) $800 $700 $600 $500 $400 $300 $200 $100 30% $413 $541 30% $717 $703 25% Cash Rent as a % of Gross Revenue 35% 43% $582 45% 40% 35% 30% 25% 20% 15% 10% 5% Average 32% $ %
64 Gross Revenue to a 50/50 Rotation (Marketing Year Average Price times Crop Reporting District 8 Average Yield) Cash Rent as a % of Gross Revenue $700 $600 $500 $400 $300 30% $385 34% $457 $539 28% 35% $557 37% $543 40% 35% 30% 25% 20% 15% Average 31% $200 10% $100 5% $ %
65 Gross Revenue to a 50/50 Rotation (Marketing Year Average Price times Crop Reporting District 9 Average Yield) Cash Rent as a % of Gross Revenue $800 $700 $600 $500 $400 $300 $200 30% $412 $765 $585 $593 28% 29% 28% 37% $617 45% 40% 35% 30% 25% 20% 15% 10% Average 31% $100 5% $ %

66 Interactive Decision Tool

67 Interactive Decision Tool

68 Landlord-Tenant Communication: It s a 2-way street Farmland owners need to be open to learning about current farming challenges, conditions, costs of productions Producers need to listen to the interests and goals of farmland owners; and be willing to share information about inputs, yields, and crop plans

69 Communication Methods: Newsletter Facebook, Twitter, blog Phone calls Stop by for a cup of coffee Annual or periodic meetings KEY: Don t limit communication to annual rent payment and rent negotiations.
 is kept confidential.")
70 More farmland owners require written annual report as a lease condition. Owner agrees: Information provided by the Tenant (such as yields, management practices) is kept confidential. Proprietary business information needs to be shared to negotiate lease terms but it is not to be shared in the coffee shop.

71 Winning Communication Strategies: Communicate regularly, not just once a year Producers: Take time to share and education Owners about current trends in agriculture, farm costs Provide regular crop reports during growing season Maintain farm appearance Treat landowners like family with respect and kindness.
72 Communication Process Start early Use data Know your own break evens and overheads Know your own ability to handle burn rate. Separate business from family/friends Understand challenges landowners face with declining revenues Sell your benefits -
73 Communication Based on Facts Yields Prices Government payments Crop insurance Soil maps Fertilizer application records Satellite pictures drainage, other issues
74 When Communication Fails Ask for more time Be aware of your non-verbal communication Focus on what the other person is saying and what they really mean Ask for more information to clarify points. Ask if there are issues that the other party is willing to compromise on or can be negotiated further. Stick to building trust, using tact, and logic Try to understand the other party s perspective new truck May need to bring in a third party - mediator

75 Farm Lease Basics: A Few Pointers Strong preference for written leases Legal issues, including lease termination Communication fundamentals

76 Why should a farm lease be written? Provides more assurance that the parties understand one another. Lease of more than 1 year must be in writing to be enforceable. Lease of 5 years or more must be in writing and recorded at the county recorder s office.

77 Shouldn t a handshake be good enough? Don t rely on selective memory. Be sure that you cover all the provisions that you intend to cover. Define meaning of terms. Put things in writing because you value the relationship... and because you don t want there to be later misunderstandings!


78 A Few Examples.... Fencing Hunting rights Crop residue (stover)

79 Assuring the Rent is Paid How can parties assure one another that the rent will be paid?
 The legal description and parcel number in the lease is accurate.")
80 First Step? -- Use a written lease. And, be sure that: (1) The legal description and parcel number in the lease is accurate. (2) The parties to the lease are properly identified. (3) The lease terms are clear.
 Require irrevocable letter of credit from the Producer/Tenant s lender. Require Landlord s name be included as Payee on checks for crops.")
81 Additional tools to assure rent payment may include: Require all rent paid on March 1. (Reduction for interest paid by the borrower may be a consideration.) Require irrevocable letter of credit from the Producer/Tenant s lender. Require Landlord s name be included as Payee on checks for crops. File and perfect a Landlord Lien this includes recording the lease seek professional legal assistance for this.
 want to make some changes for the next year.")
82 Farm Lease Termination: Does lease termination mean the end of the Owner Tenant relationship? Not necessarily but it means either the Owner (or the Tenant) want to make some changes for the next year. Without written notice of termination, lease automatically renews under the same terms and conditions for the following crop year.
.")
83 Farm Lease Termination: Iowa Code 562.6: Amended in 2016 to clarify that whether the lease is oral or written, the termination notice must be in writing! Notice cannot be contained within the lease it must be a separate written notice. Serve written notice on or before September 1 (this terminates the current least on the following March 1). Serve in person (have them sign the notice and keep a copy); or by Certified US Mail (keep copy of receipt, return receipt optional); or by publication if neither in-person or mail can be accomplished.
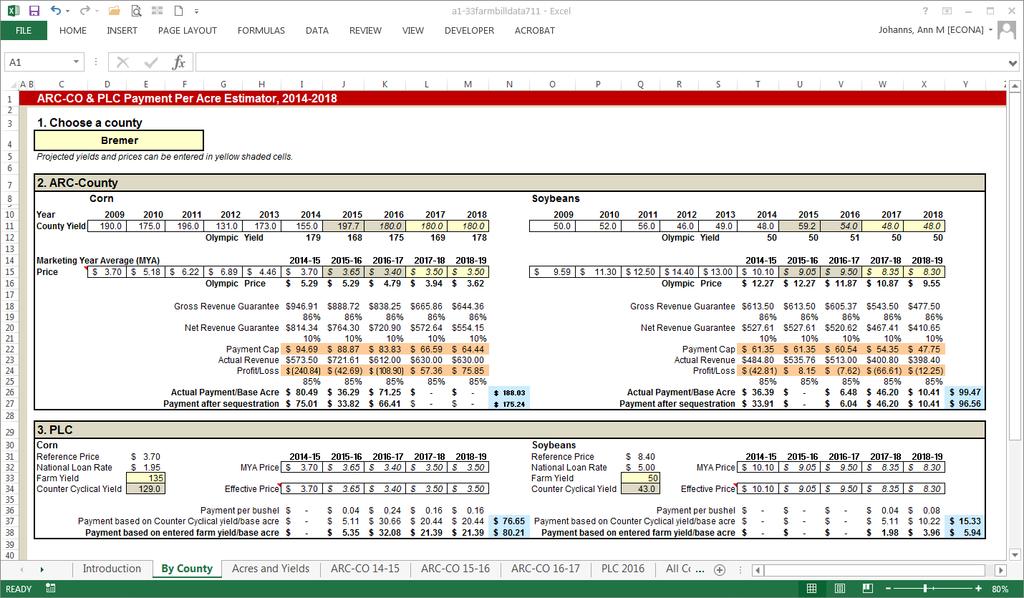
84 Projected 2016 ARC-CO Payments Corn Lyon Sioux Plymouth $72 $64 $72 Woodbury $12 Monona $ Corn ARC-CO Payment $50 - $76 $25 - $50 $1 - $25 $0 - $1 No Data Harrison Osceola O'Brien Cherokee $42 Mills $60 $76 $46 Ida Fremont $72 Crawford Pottawattamie $0 Shelby Clay Buena Vista Sac $55 Dickinson $73 Montgomery Page Carroll Audubon Cass Emmet $25 $21 $61 $41 $25 $30 Palo Alto Pocahontas Calhoun $35 $52 $29 Adams Taylor $64 $34 $30 Guthrie Adair $49 Greene $14 Kossuth Humboldt Webster $42 $26 Union $62 $27 $37 Ringgold Dallas $25 $57 $0 Boone $37 Madison Winnebago Hancock Wright Hamilton $48 $16 Clarke Decatur $35 $52 $27 $13 Polk $0 $0 Story $20 Warren $0 Worth Cerro Gordo Franklin Hardin $48 Lucas Wayne $36 $36 $46 $57 Jasper $0 $0 Marion Marshall Mitchell Floyd Butler Grundy $70 $11 Monroe $35 $54 $73 $75 Appanoose Tama Mahaska $60 Davis Chickasaw Bremer Poweshiek Howard Black Hawk $23 Wapello Benton Iowa Keokuk $67 $1 $13 $0 $6 $0 $15 $39 $37 $34 $49 Winneshiek Fayette Buchanan $32 Jefferson $72 $71 $0 Van Buren $0 $60 Linn $72 Johnson $70 Washington $0 Henry Lee Allamakee $67 Clayton $72 Delaware $0 $32 $72 Louisa Jones Cedar $71 $73 Muscatine $48 Des Moines $45 Dubuque $63 $71 Jackson Clinton Scott $53 $74 $40 *Payments based on yield and price projections as of 7/13/2016
85 Projected 2017 ARC-CO Payments Corn Lyon Sioux Plymouth $8 $31 $51 Woodbury $52 Monona $ Corn ARC-CO Payment $50 - $76 $25 - $50 $1 - $25 $0 - $1 No Data Harrison Osceola O'Brien Cherokee $63 Mills $46 $68 $55 Ida Fremont $54 Crawford Pottawattamie $42 Shelby Clay Buena Vista Sac $65 Dickinson $68 Montgomery Page Carroll Audubon Cass Emmet $48 $60 $66 $61 $62 $59 Palo Alto Pocahontas Calhoun $62 $65 $63 Adams Taylor $65 $66 $63 Guthrie Adair $58 Greene $58 Kossuth Humboldt Webster $63 $57 Union $66 $65 $67 Ringgold Dallas $60 $53 $47 Boone $63 Madison Winnebago Hancock Wright Hamilton $65 $57 Clarke Decatur $65 $66 $67 $62 Polk $47 $51 Story $61 Warren $55 Worth Cerro Gordo Franklin Hardin $62 Lucas Wayne $64 $63 $68 $65 Jasper $47 $51 Marion Marshall Mitchell Floyd Butler Grundy $54 $66 Monroe $49 $64 $67 $68 Appanoose Tama Mahaska $63 Davis Chickasaw Bremer Poweshiek Howard Black Hawk $66 Wapello Benton Iowa Keokuk $63 Winneshiek Fayette Buchanan $66 $60 $65 $61 $54 $47 $48 $59 $63 $66 $65 Jefferson $44 $66 $53 Van Buren $51 $66 Linn $66 Johnson $68 Washington $63 Henry Lee Allamakee $28 Clayton $67 Delaware $58 $43 $66 Louisa Jones Cedar $65 $68 Muscatine $63 Des Moines $61 Dubuque $63 $47 Jackson Clinton Scott $65 $69 $67 *Payments based on yield and price projections as of 7/13/2016

86 Projected 2016 ARC-CO Payments Soybeans *Payments based on yield and price projections as of 7/11/2016

87 Projected 2017 ARC-CO Payments Soybeans *Payments based on yield and price projections as of 7/11/2016
88 Projected 2016 ARC-CO Payments Crop Reporting District 1 $/Base Acre Corn Payment Soybeans Payment *Payments based on yield and price projections as of 7/13/2016
89 Projected 2016 ARC-CO Payments Crop Reporting District 2 $/Base Acre Corn Payment Soybeans Payment *Payments based on yield and price projections as of 7/13/2016
90 Projected 2016 ARC-CO Payments Crop Reporting District 3 $/Base Acre Corn Payment Soybeans Payment *Payments based on yield and price projections as of 7/13/2016
91 Projected 2016 ARC-CO Payments Crop Reporting District 4 $/Base Acre Corn Payment Soybeans Payment *Payments based on yield and price projections as of 7/13/2016
92 Projected 2016 ARC-CO Payments Crop Reporting District 5 $/Base Acre Corn Payment Soybeans Payment *Payments based on yield and price projections as of 7/13/2016
93 Projected 2016 ARC-CO Payments Crop Reporting District 6 $/Base Acre Corn Payment Soybeans Payment *Payments based on yield and price projections as of 7/11/2016
94 Projected 2016 ARC-CO Payments Crop Reporting District 7 $/Base Acre Corn Payment Soybeans Payment *Payments based on yield and price projections as of 7/13/ Yield data not available for Mills or Taylor Counties
95 Projected 2016 ARC-CO Payments Crop Reporting District 8 $/Base Acre Corn Payment Soybeans Payment *Payments based on yield and price projections as of 7/13/ Corn yield data not available for Union or Monroe Counties
96 Projected 2016 ARC-CO Payments Crop Reporting District 9 $/Base Acre Corn Payment Soybeans Payment *Payments based on yield and price projections as of 7/13/2016
97

98
99 What is the Iowa Nutrient Reduction Strategy? Voluntary, science-based program to reduce Nitrogen and Phosphorous impact on water Includes cities, industry and agriculture A practice-based approach to show meaningful and measureable progress A framework for innovation and verification of new practices and technologies
100 Partial Budgeting Changes that Increase Revenue + Changes that Reduce Cost Increased Profits Changes that Decrease Revenue + Changes that Increase Costs Decreased Profits
101 Decision Making Decisions always involve both facts & values Human-agriculture-environmental relationships are systems with multidirectional feedback loops Farmer s have feedback loops that influence social learning with beneficial or inadequate outcomes
102 Financial Impact If cover crops result in a decreased level of profitability, will you decrease the cash rental rate to provide an incentive to your tenant to adopt the strategy? $-50 $-40 $-30 $20 $-10 $0 $10 $20
103 Questions to ask your tenant(s) Are you raising cover crops? Yes How many acres? Why? Does it work financially? What s happening with your production (yields, weed pressure, burn down, differences from year to year)? Are there social pressures?
104 Farm Profitability Economic profits don t last long in a competitive market Economic profits destroyed by: Falling output prices due to increases in production Increased costs Production costs Land prices/rents Number of producers


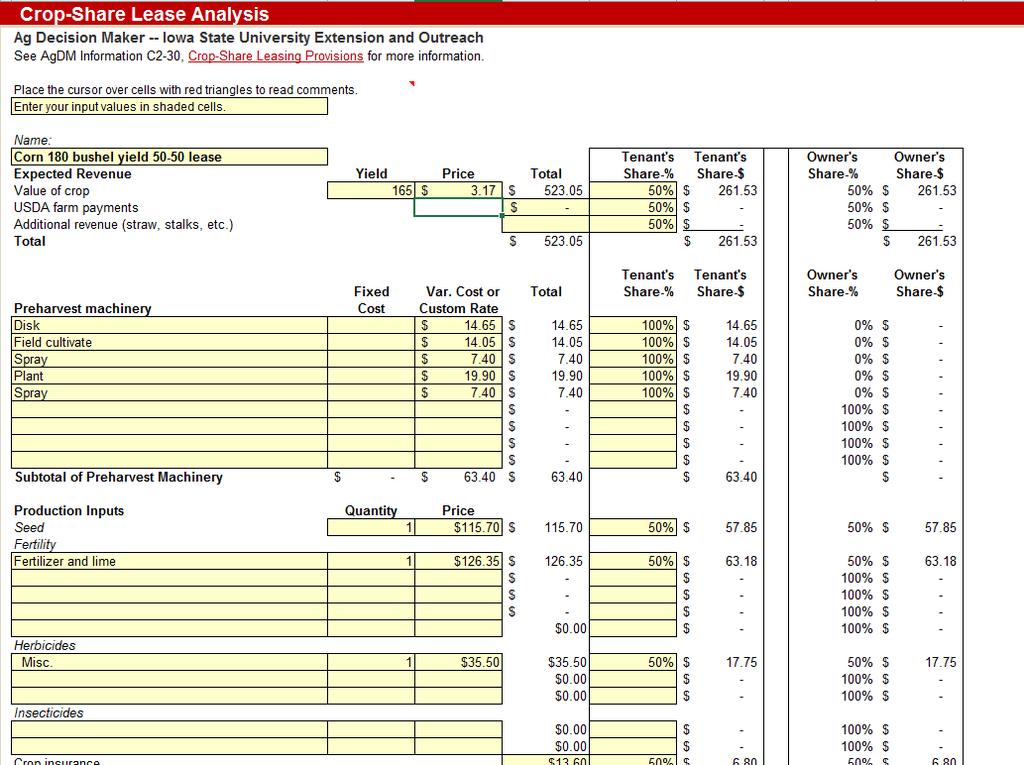
105 What is cost of production? - Preharvest machinery - Seed, chemicals, etc. - Harvest machinery - Labor - Land

106 Corn following Soybeans Land, $ Preharvest machinery, $36.90 Labor, $33.80 Harvest machinery, $89.85 Seed, chemicals, etc., $292.46

107 Cost per Acre Preharvest machinery Fixed Variable Total Tandem disk $3.80 $2.60 $6.40 Apply nitrogen $5.10 $5.00 $10.10 Field cultivate $2.70 $2.40 $5.10 Plant $6.20 $4.90 $11.10 Spray $2.30 $1.90 $4.20 Custom hire $0.00 $0.00 $0.00 Other $0.00 $0.00 $0.00 Other $0.00 $0.00 $0.00 Total per acre $20.10 $16.80 $36.90
108 Seed, chemicals, etc. Fixed Variable Total Seed ---- $ $ cost per 1000 kernels $3.71 kernels per acre 30,000 Nitrogen ---- $52.40 $52.40 price per pound $0.40 pounds per acre 131 Phosphate ---- $30.60 $30.60 price per pound $0.45 pounds per acre 68 Potash ---- $18.90 $18.90 price per pound $0.35 pounds per acre 54 Lime (annual cost) ---- $8.80 $8.80 Herbicide ---- $38.10 $38.10 Crop insurance ---- $12.20 $12.20 Miscellaneous ---- $10.00 $10.00 Interest on preharvest variable costs ---- $10.27 $10.27 length of period (months) 8 interest rate 5.2% Total ---- $ $292.46

109 Harvest machinery Fixed Variable Total Combine $19.90 $9.10 $29.00 Grain Cart $6.20 $2.70 $8.90 Haul $7.74 $5.35 $13.09 Fixed- price per bushel $0.04 Variable- price per bushel $0.03 Drying $9.00 $23.76 $32.76 Fixed- price per bushel $0.05 Variable- price per bushel $0.13 Handling $3.11 $2.99 $6.10 Fixed- price per bushel $0.02 Variable- price per bushel $0.02 Custom hire $0.00 $0.00 $0.00 Total per acre $45.95 $43.89 $89.85

110 Labor Fixed Variable Total Operator $ $33.80 Hours 2.6 Rate per hour $13.00 Hired ---- $0.00 $0.00 Hours 0 Rate per hour $0.00 Total $33.80 $0.00 $33.80

111 Total fixed, variable and all costs Fixed Variable Total Per acre $ $ $ Per bushel $2.03 $1.96 $3.99 Return per Acre Over Variable Costs All Costs Gross returns Expected selling price $ $ Government payments ---- $0.00 Effective LDP rate $ $0.00 Total returns ---- $ Net returns $ $11.61

112 Soybeans following Corn Land, $ Preharvest machinery, $38.50 Seed, chemicals, etc., $ Labor, $29.25 Harvest machinery, $36.95
113 Direct Corn Expenses $180 $160 $140 $120 $100 $80 $60 $40 $20 $0 Seed Insecticide & Fungicide Herbicide Fertilizer & Lime Drying & Storage
114 Direct Bean Expenses $60 $50 $40 Seed Insecticide & Fungicide Herbicide Fertilizer & Lime $30 $20 $10 $

115 Soybean Costs of Production $300 $250 $200 Land Seed, Chemicals, Fertilizer, etc. Machinery for Growing and Harvesting Labor $ $150 $100 $ $ $ $50 $0 $46.76 $75.43 $26.95 $

116 Corn Costs of Production $350 $300 $250 $200 $150 $100 $50 Land Seed, Chemicals, Fertilizer, etc. Machinery for Growing and Harvesting Labor $195 $155 $101 $292 $266 $127 $0 $29 $
117 $800 $700 $600 $500 $400 $300 $200 $100 $0 -$ Cost Estimates: Corn following Soybeans, 180 bu/acre $719 $266 $292 $127 $34 $630 at $3.50/bushel Costs Predicted Revenue Margin Land Crop Inputs Machinery Labor (-$89) or ($0.49)/bushel Source: Plastina, ISU Ext. Economics, FM-1712, Jan 2016
 or ($1.")
118 $600 $ Cost Estimates: Soybeans following Corn, 50 bu/acre $533 $445 at $9.50/bushel $400 $300 $200 $100 $0 $266 $163 $75 $29 Land Crop Inputs Machinery Labor (-$58) or ($1.16)/bushel -$100 Costs Predicted Revenue Margin Source: Plastina, ISU Ext. Economics, FM-1712, Jan 2016
119
120
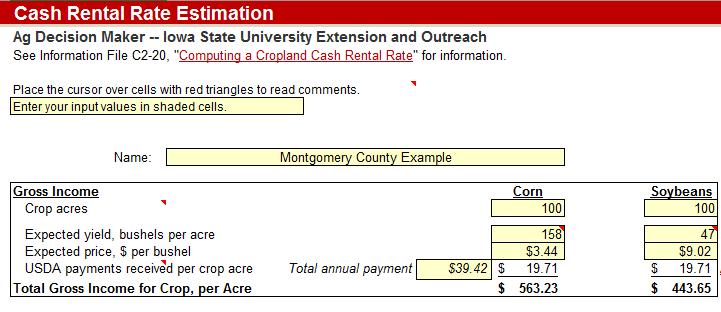
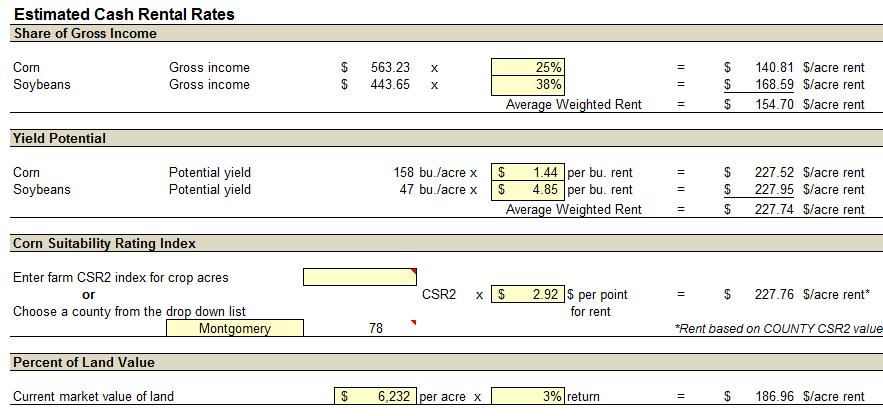
121 Estimating a Cash Rental Rate Ag Decision Maker information file C2-20 Decision Aid file C2-20 (spreadsheet) Flexible Cash Leases Ag Decision Maker information file C2-21 Decision Aid file C2-21 (spreadsheet)
122

123
124

125
126 Influences on 2017 Rental Market Grain prices Number of acres, weather Price of crude oil (ethanol demand and price) Export demand exchange rate Livestock feeding cattle, pigs, birds Reduced profits in 2016 Farm Bill payments Financing Supply and demand will ultimately set the rents.
127 Beginning Farmer Tax Credit - Program Purpose Encourage agricultural asset owners to lease to qualifying beginning farmers Provides owner a credit on Iowa income taxes owed 7% on cash rent 17% on crop share 1% additional first year if BF is a military veteran
128 Thank You! Tim Eggers Field Ag Economist (712)
129 Our Mission ISU Extension builds partnerships and provides research-based learning opportunities to improve quality of life in Iowa We believe in... Quality Access Diversity Accountability
Cash Rental Rates for Iowa
 Cash Rental Rates for Iowa 2002 Survey The cash rental rates presented in this publication are the result of a survey of farmers, landowners, agricultural lenders, real estate brokers, and professional
Cash Rental Rates for Iowa
 Cash Rental Rates for Iowa 2003 Survey The cash rental rates presented in this publication are the result of a survey of farmers, landowners, agricultural lenders, real estate brokers, and professional
The cash rental rates presented in this publication
 Cash Rental Rates for Iowa Ag Decision Maker 2007 Survey File C2-10 The cash rental rates presented in this publication are the result of a survey of farmers, landowners, agricultural lenders, real estate
The cash rental rates presented in this publication
 Cash Rental Rates for Iowa Ag Decision Maker 2010 Survey File C2-10 The cash rental rates presented in this publication are the results of a survey of farmers, landowners, lenders, real estate brokers,
The cash rental rate information presented
 Cash Rental Rates for Iowa Ag Decision Maker 2011 Survey File C2-10 The cash rental rate information presented in this publication is the result of a survey of farmers, landowners, lenders, real estate
Women in Agriculture Farms, Operations, Demographics Iowa and Counties 2012 Census of Agriculture. Women Farm Operators in the Census of Agriculture
 Community and Economic Development Indicators Program Sandra Charvat Burke Women in Agriculture, Operations, Demographics Iowa and Counties 2012 Census of Agriculture Women in the Census of Agriculture
The cash rental rate information presented
 Cash Rental Rates for Iowa Ag Decision Maker 2013 Survey File C2-10 The cash rental rate information presented in this publication is the result of a survey of farmers, landowners, lenders, real estate
Iowa State University
 Impact of Ethanol on Animal Agriculture John D. Lawrence Iowa State University Higher Corn Prices Came at a Good Time Hogs: extended period of positive returns Feedlots Near record weekly prices and new
Rented Land in Iowa: Social and Environmental Dimensions
 Rented Land in : Social and Environmental Dimensions Introduction More than half of farmland is rented. Decisions regarding who has access to that land and how it is farmed can influence the social and
Farm Leasing Arrangements. Tim Eggers. Field Agricultural Economist
 Farm Leasing Arrangements Tim Eggers Field Agricultural Economist teggers@iastate.edu 712-542-5171 www.extension.iastate.edu/feci Agenda Hot Topics in Ag Decision Maker Legislative Update Crop Conditions
Big-Picture Economic Impacts of Ethanol 6/01/07
 Big-Picture Economic Impacts of Ethanol 6/01/07 By Dr. Robert Wisner, University Professor of Economics and Coles Professor of International Agriculture Iowa State University Ames, Iowa, U.S.A. Some perspectives
Animal Production Concentration: Implications for Farmers, Communities and Regions Lessons from Iowa. Dave Swenson Department of Economics
 Animal Production Concentration: Implications for Farmers, Communities and Regions Lessons from Iowa Dave Swenson Department of Economics Scope Discussion of animal production concentration Nationally
Global Economic Impacts of Ethanol Industry Growth
 Global Economic Impacts of Ethanol Industry Growth By Dr. Robert Wisner, University Professor of Economics and Coles Professor of International Agriculture Iowa State University Ames, Iowa, U.S.A. Some
Tracy Blackmer Director of Research Iowa Soybean Association
 Tracy Blackmer Director of Research Iowa Soybean Association Diesel fuel usage Crop Type Activity Corn Soybean -------------gallons/acre------------- NH3 Application 0.60 - Field Cultivating 0.57 0.57
Ethanol & The Corn & Feed Grain Market Outlook for /27/07
 Ethanol & The Corn & Feed Grain Market Outlook for 2007-09 7/27/07 By Dr. Robert Wisner, University Professor of Economics and Coles Professor of International Agriculture Iowa State University Ames, Iowa,
Five Key Elements of Cultural Competence. Prevent Child Abuse Iowa Regional September 6-13, 2017
 Five Key Elements of Cultural Competence Prevent Child Abuse Iowa Regional Mee@ngs September 6-13, 2017 Equity Policy & Prac/ce Discussion Understand how ECI Cultural Competences can support local PCAI
A Business Newsletter for Agriculture. New Iowa farm custom rate survey available
 A Business Newsletter for Agriculture Vol. 15, No. 5 www.extension.iastate.edu/agdm March 2011 New Iowa farm custom rate survey available by William Edwards, extension economist, 515-294-6161, wedwards@iastate.edu
Determining the Market for Your Goods & Services
 Determining the Market for Your Goods & Services Prepared by: Dr. Kenneth E. Stone & Georgeanne M. Artz 460 Heady Hall, ISU Ames, IA 50011 Ph. (515) 294-7318 FAX (515) 294-1700 Email kstone@iastate.edu
From BNSF. Econ. 338C: Overview of Grain U.S. & Global Marketing. 2 Dump Pits
 From BNSF Econ. 338C: Overview of Grain U.S. & Global Marketing 2 Dump Pits Major Marketing Functions Providing time utility Providing form utility Providing space utility Financing Price/value discovery
Gap : How To Build An. For Long-Term Strategy Management
 Jumping The Strategy-To-Execution Gap : How To Build An Implementation Plan & Develop KPIs For Long-Term Strategy Management T h e 2 0 1 8 O P E N M I N D S E x e c u t i v e L e a d e r s h i p R e t
Impact of Ethanol on Animal Agriculture. John D. Lawrence Iowa State University
 Impact of Ethanol on Animal Agriculture John D. Lawrence Iowa State University 11,568 MGY 4,072 MBu 14,261 MGY 5,034 MBu 36,198 MGY 12,869 MBu Higher Corn Prices Came at a Good Time Hogs: extended period
Iowa State University Extension. Dr. Robert Wisner: Grain Outlook 3/15/06
 Iowa State University Extension Dr. Robert Wisner: Grain Outlook 3/15/06 Brazil mid-feb. 2006 1943-50 1959 Tree in Parana,, Brazil (No. 2 soybean state) Dates are approximate Key Corn Variables
Consumers, Vendors, and the Economic Importance of Iowa Farmers Markets: An Economic Impact Survey Analysis
 Leopold Center Pubs and Papers Leopold Center for Sustainable Agriculture 3-2005 Consumers, Vendors, and the Economic Importance of Iowa Farmers Markets: An Economic Impact Survey Analysis Daniel Otto
Another Plant?!...The Rapid Expansion in the Ethanol Industry and its Effect all the Way Down to the Farm Gate.
 Another Plant?!...The Rapid Expansion in the Ethanol Industry and its Effect all the Way Down to the Farm Gate. Josh D. Roe Department of Agricultural Economics Kansas State University Robert W. Jolly
Ethanol s Big-Picture Impact on Midwest Agriculture & Livestock 7/11/07
 Ethanol s Big-Picture Impact on Midwest Agriculture & Livestock 7/11/07 By Dr. Robert Wisner, University Professor of Economics and Coles Professor of International Agriculture Iowa State University Ames,
Power of Trees 2016 Annual Report
 Power of Trees provides hands-on lessons for schoolchildren, such as these students in Readlyn, Iowa. Power of Trees 2016 Annual Report Power of Trees is a partnership with Black Hills Energy, Trees Forever,
8/15/07. of Economics and Coles Professor of International Agriculture. Iowa State University
 Ethanol & The Corn & Feed Grain Market Outlook for 2007-0909 8/15/07 By Dr. Robert Wisner, University it Professor of Economics and Coles Professor of International Agriculture Iowa State University Ames,
Farmland Leasing Trends
 Farmland Leasing Trends Alejandro Plastina, PhD Assistant Professor, Economics ASFMRA Iowa Chapter Spring Seminar Ames, IA March 22, 2017 Main topics Trends in Cash Rents Factors affecting Cash Rents:
Groundwater Availability Modeling of the Cambrian-Ordovician Aquifer in Iowa
 Groundwater Availability Modeling of the Cambrian-Ordovician Aquifer in Iowa Water Resources Investigation Report No. 2A Iowa Department of Natural Resources Richard Leopold, Director July 2009 COVER Hydrogeologic
Farm Financial Outlook
 Farm Financial Outlook Alejandro Plastina, PhD Assistant Professor, Economics NACM Heartland - National Agriculture Retail Credit Exchange Group Ankeny, IA March 2, 2017 Main topics Farm Financial Situation
IOWA WATER QUALITY INITIATIVE
 IOWA WATER QUALITY INITIATIVE 2016: Three Years of Progress Through the WQI We continue to see collaboration around the Iowa Nutrient Reduction Strategy (NRS) build exponentially. More Iowans are engaging,
Outline. Outlook for Crop Farm Income, Cash Rents, Farmland Prices, and Agricultural Credit. U.S. Corn Yield, U.S.
 Outlook for Crop Farm Income, Cash Rents, Farmland Prices, and Agricultural Credit September 1st, 217 Outline Outlook for Crop Farm Income, Cash Rents, Farmland Prices, and Agricultural Credit Gary Schnitkey,
MINERAL PRODUCTION OF IOWA. IN s. W. BEYER.
 MINERAL PRODUCTION OF IOWA. IN 1899 BY s. W. BEYER. V ALUE OF MINERAL PRODUCTION. -CoaL........... $ 6,137,576 Clay (estimated).............. 2,500,000 Stone...,.... 809,924 -Gypsum (estimated)......
Ohio State University Extension Agriculture & Natural Resources
 Western Ohio Cropland Values and Cash Rents 2017-18 Barry Ward, Leader, Production Business Management Director, OSU Income Tax Schools OSU Extension, Ohio cropland values and cash rental rates are projected
Cash Rental Rates for Iowa 2016 Survey
 Cash Rental Rates for Iowa 2016 Survey Dr. Alejandro Plastina Assistant Professor, Department of Economics, ISU Academic Member of ASFMRA Panel Discussion on Current and Future Cash Rents in Iowa 89th
Western Ohio Cropland Values and Cash Rents
 AEDE-RP--13 Western Ohio Cropland Values and Cash Rents 2013-14 Barry Ward (ward.8@osu.edu) Leader Production Business Management OSU Extension, OSU Department of Agricultural, Environmental and Development
2006 Iowa Farm Costs. and Returns File C1-10. Ag Decision Maker. Definition of Terms Used
 2006 Iowa Farm Costs Ag Decision Maker and Returns File C1-10 The farm record data utilized in this report were obtained from the Iowa Farm Business Associations. The average of all farms in each table
MINERAL PRODUOTION IN IOWA
 MINERAL PRODUOTION IN IOWA IN 1905 BY S. W. BEYER. 2 VALUE OE
Western Ohio Cropland Values and Cash Rents
 AEDE-RP-0136-11 Western Ohio Cropland Values and Cash Rents 2011-12 Barry Ward (ward.8@osu.edu) Leader Production Business Management OSU Extension, OSU Department of Agricultural, Environmental and Development
Land Application for Effective Manure Nutrient Management
 Land Application for Effective Manure Nutrient Management Livestock operations produce meat, as well nitrogen, phosphorus, and potassium in animal manures, nutrients that can be important by-products when
ADDENDUM NO. 1. The following Addendum is part of the Construction Contract Documents dated July 18, 2012.
 ADDENDUM NO. 1 To: Project: All Plan Holders of Record and Interested Parties ARC Transfer Center Canopy Phase I 2012 Project IIW Project No. 11095-01 Issue Date: Thursday, August 16, 2012 Bids Due: 2:00
Ohio Cropland Values and Cash Rents
 Report Series: AEDE-RP-0101-08 Ohio Cropland Values and Cash Rents 2007-08 Barry Ward (ward.8@osu.edu) Leader Production Business Management OSU Extension, OSU Department of Agricultural, Environmental
10/22/2012. Current Land Values & Cash Rental Rates. Nebraska Land Values Know how. Know now.
 Current Land Values & Cash Rental Rates Presented by: Allan Vyhnalek Platte County avyhnalek2@unl.edu Prepared by: T. Lemmons & A. Vyhnalek Adapted from: B. Johnson. (2012). Nebraska Farm Real Estate Market
Western Ohio Cropland Values and Cash Rents
 AEDE-RP-0125-10 Western Ohio Cropland Values and Cash Rents 2009-10 Barry Ward (ward.8@osu.edu) Leader Production Business Management OSU Extension, OSU Department of Agricultural, Environmental and Development
RentPlan Calculating Crop Land Rental Rates
 RentPlan Calculating Crop Land Rental Rates 2019 in Manitoba ................................................ Rentplan Crop Land Rental Rate Calculator Version 1.0 Date: January, 2019 This guide is designed
Review/print this Iowa Farm*A*Syst unit Water Well Condition & maintenance Water Well Condition & maintenance
 Rev. 8/15 What is Iowa Farm A Syst? Iowa Farm*A*Syst is a farmstead assessment system developed to assist rural residents in protecting their water resources, particularly their drinking water. Individuals
Western Ohio Cropland Values and Cash Rents
 AEDE-RP-0136-11 Western Ohio Cropland Values and Cash Rents 2010-11 Barry Ward (ward.8@osu.edu) Leader Production Business Management OSU Extension, OSU Department of Agricultural, Environmental and Development
Current Report. Oklahoma Cropland Rental Rates: CR
 Oklahoma Cooperative Extension Service Current Report CR-23 39 Oklahoma Cropland Rental Rates: 28-9 Damona Doye Regents Professor and Extension Economist Oklahoma Cooperative Extension Fact Sheets are
The data for this report were collected by Iowa Farm Business Association consultants and compiled by Iowa State University Extension and Outreach.
 2016 Cash Iowa Rental Farm Rates Costs for Iowa Ag Decision Maker Returns 2015 Survey File C1-10 The farm record data utilized in this report were obtained from the Iowa Farm Business Association. The
Iowa Beef Center 2014 Cow-Calf Producer Survey
 Iowa Beef Center 2014 Cow-Calf Producer Survey Survey conducted by the Iowa Beef Center. Sample design, questionnaire design, and data collection in collaboration with USDA s National Agricultural Statistics
Farmland Market Update
 Farmland Market Update Wendong Zhang Assistant Professor of Economics and Extension Economist wdzhang@iastate.edu 2016 Midwest, Great Plains and Western Outlook Conference, August 16 th, 2016 The new Mike
Developing a Fair Lease Arrangement for Farmland Leasing Arrangements Workshops
 University of Nebraska - Lincoln DigitalCommons@University of Nebraska - Lincoln Presentations, Working Papers, and Gray Literature: Agricultural Economics Agricultural Economics Department February 2008
Current Report. Oklahoma Cropland Rental Rates: CR
 Oklahoma Cooperative Extension Service Current Report CR-2 1 Oklahoma Cropland Rental Rates: 212-1 Damona Doye Regents Professor and Extension Economist Oklahoma Cooperative Extension Fact Sheets are also
Crop Enterprise Budgets
 Economics 330 Lab 2 Fall 2008 Crop Enterprise Budgets Name The purposes of this lab are: (1) to become familiar with the concepts and organization of a crop enterprise budget (2) to estimate the costs
Using Enterprise Budgets to Compute Crop Breakeven Prices Michael Langemeier, Associate Director, Center for Commercial Agriculture
 June 2017 Using Enterprise Budgets to Compute Crop Breakeven Prices Michael Langemeier, Associate Director, Center for Commercial Agriculture Enterprise budgets provide an estimate of potential revenue,
STANDARDS FOR MEASURES OF EFFICIENCY FOR 2007*
 U2020 STANDARDS FOR MEASURES OF EFFICIENCY FOR 2007* These standards were estimated from 2006 prices and costs, along with production and physical inputs from previous years. (Estimates were made as of
Oklahoma Cropland Rental Rates: Roger Sahs Associate Extension Specialist
 Oklahoma Cooperative Extension Service CR-23 Current Report Rev. 19 Oklahoma Cooperative Extension Fact Sheets are also available on our website at: osufacts.okstate.edu Oklahoma Cropland Rental Rates:
2018 ISU Land Value Survey
 2018 ISU Land Value Survey Dr. Wendong Zhang wdzhang@iastate.edu, 515-294-2536 Assistant Professor of Economics and Extension Economist ISU Alumni Center, Ames, Iowa December 12, 2018 A Quick Introduction:
2017 ISU Land Value Survey
 2017 ISU Land Value Survey Dr. Wendong Zhang wdzhang@iastate.edu, 515-294-2536 Assistant Professor of Economics and Extension Economist ISU Alumni Center, Ames, Iowa December 12, 2017 A Quick Introduction:
Examining Potential Crop Profitability in 2014 Land Values, Cash Rents & Crop Inputs
 Examining Potential Crop Profitability in 2014 Land Values, Cash Rents & Crop Inputs Barry Ward Department of Agricultural, Environmental and Development Economics, The Ohio State University 1 Ohio Cropland
Crop Leases in River Valley District 2016 Survey Data from Clay, Cloud, Washington, and Republic Counties
 Crop Leases in River Valley District 2016 Survey Data from Clay, Cloud, Washington, and Republic Counties Kim Kohls K-State Research and Extension Crop Production Agent River Valley District * * * * *
Chuck Danehower Extension Specialist Farm Management Danny Morris Extension Specialist Farm Management
 Maximizing Essential Crop Inputs Chuck Danehower Extension Specialist Farm Management cdanehow@utk.edu Danny Morris Extension Specialist Farm Management danhmorr@utk.edu Tennessee State Average Yields
December Steven D. Johnson
 December 2013 Steven D. Johnson Farm & Ag Business Management Specialist (515) 957-5790 sdjohns@iastate.edu www.extension.iastate.edu/polk/farm-management Learning Objectives Review lessons learned from
Costs to Produce Corn and Soybeans in Illinois 2017
 Costs to Produce Corn and Soybeans in Illinois 2017 Costs to Produce Corn and Soybeans in Illinois 2017 Brandy M. Krapf, Dwight Raab, and Bradley L. Zwilling Illinois FBFM Association and Department of
2016 Kansas County-Level Cash Rents for Irrigated Cropland
 Kansas Irrigated Cash Rents at the County Level 2016 www.agmanager.info 2016 Kansas County-Level Cash Rents for Irrigated Cropland February 2016 (available at www.agmanager.info) Mykel Taylor, K-State
2015 LEASE SURVEY SUMMARY REPORT K-State Research and Extension Post Rock District MITCHELL County
 2015 LEASE SURVEY SUMMARY REPORT K-State Research and Extension Post Rock District MITCHELL County 2015 FARM LEASE ARRANGEMENT SURVEY SUMMARY FOR DRYLAND CROPS K-STATE RESEARCH & EXTENSION Post Rock Extension
The Contributions Approach to Establishing Equitable Pasture Lease Agreements Stocking Rates
 PB 1816-D The Contributions Approach to Establishing Equitable Pasture Lease Agreements This publication provides management information and guidelines for landlords and tenants to follow when negotiating
USING ENTERPRISE BUDGETS TO IMPROVE CUSTOMER S PROFITS. Kevin Shelley 1 and Matt Hanson 2
 USING ENTERPRISE BUDGETS TO IMPROVE CUSTOMER S PROFITS Introduction Kevin Shelley 1 and Matt Hanson 2 Assisting farmer clients determine their cost of production and per-acre profits is something many
A. Circle the best answer. Put a square around your second choice, if you want. If your second choice is correct you get half credit.
 Economics 330 Exam 1 Fall 2007 Farm Budgeting and Planning K E Y A. Circle the best answer. Put a square around your second choice, if you want. If your second choice is correct you get half credit. (4
Tennessee Cropland, Irrigated Cropland and Pastureland Cash Rental Rates for 2017 W 377
 Tennessee, and Cash Rental Rates for 2017 W 377 Aaron Smith Crop Marketing Specialist Becky Bowling Extension Specialist Tina Johnson Information Specialist Department of Agricultural & Resource Economics
Table 1: Table 2: Total Responses. Per Pair
 2016 River Valley District Pasture Survey Summary Katelyn Brockus, District Extension Agent, Livestock Production All survey recipients were provided a pasture survey with a total of sixty-six pasture
COUNTY OF KANE. Eldon F. Gould Geneva, Illinois Wayne Gehrke (630)
") COUNTY OF KANE FARMLAND ASSESSMENT REVIEW COMMITTEE Mark D. Armstrong, CIAO, Chairman County Government Center Roger C. Biddle 719 Batavia Avenue, Building C Eldon F. Gould Geneva, Illinois 60134-3000
COUNTY OF KANE FARMLAND ASSESSMENT REVIEW COMMITTEE Mark D. Armstrong, CIAO, Chairman County Government Center Roger C. Biddle 719 Batavia Avenue, Building C Eldon F. Gould Geneva, Illinois 60134-3000
Estimated Costs of Crop Production in Iowa 2006
 Estimated Costs of Crop Production in Iowa 2006 The estimated costs of corn, corn silage, soybeans, alfalfa, and pasture maintenance in this report are based on data from several sources. They include
Estimated Costs of Crop. Production in Iowa File A1-20 The estimated costs of corn, corn silage, soybeans, Ag Decision Maker
 Estimated Costs of Crop Ag Decision Maker Production in Iowa - 2007 File A1-20 The estimated costs of corn, corn silage, soybeans, alfalfa, and pasture maintenance in this report are based on data from
Estimated Costs of Crop. Production in Iowa File A1-20 The estimated costs of corn, corn silage, soybeans, Ag Decision Maker
 Estimated Costs of Crop Ag Decision Maker Production in Iowa - 2008 File A1-20 The estimated costs of corn, corn silage, soybeans, alfalfa, and pasture maintenance in this report are based on data from
 Grain Farm Income and Cash Rent Outlook: 2016 and 2017 Sep 7, 2016 Grain Farm Income and Cash Rent Outlook: 2016 and 2017 Budgets in management section of farmdoc Gary Schnitkey University of Illinois
Steven D. Johnson. Presentation Objectives
 April 2014 Steven D. Johnson Farm & Ag Business Management Specialist (515) 957-5790 sdjohns@iastate.edu www.extension.iastate.edu/polk/farm-management Presentation Objectives Review the latest Corn &
Ag Economy. Alejandro Plastina, Ph.D. Assistant Professor/Extension Economist
 Ag Economy Alejandro Plastina, Ph.D. Assistant Professor/Extension Economist Iowa Seed Association Seed Forum Iowa State Fairgrounds, Des Moines Feb 14, 2018 Overview U.S. farm sector projections Financial
The estimated costs of corn, corn silage,
 Estimated Costs of Crop Ag Decision Maker Production in Iowa - 2017 File A1-20 The estimated costs of corn, corn silage, soybeans, alfalfa, and pasture maintenance in this report are based on data from
UNIVERSITY OF MISSOURI-COLUMBIA Agricultural Experiment Station
 UNIVERSITY OF MISSOURI-COLUMBIA Agricultural Experiment Station MISSOURI FERTILIZER TONNAGE REPORT, 2000 FERTILIZER MATERIALS DRY MIXED FERTILIZERS LIQUID MIXED FERTILIZERS NITROGEN MATERIALS SPRING FALL
The Value of Farmland
 The Value of Farmland Tennessee Farmland Legacy Conference October 9-10, 2008 Goals of the Presentation Examine farmland trends in Tennessee Discuss the importance of agriculture to Tennessee (economically
Updating Payment Yields
 Updating Payment Yields 2014 Farm Bill March 2015 Robin Reid Mykel Taylor G.A. Art Barnaby Extension Associate Assistant Professor Extension Specialist Kansas State University Kansas State University Kansas
National Agricultural Statistics Service (NASS) vs. Land Grant University Cash Rent Surveys Why the Differences?
 vs. Land Grant University Cash Rent Surveys Why the Differences?") National Agricultural Statistics Service (NASS) vs. Land Grant University Cash Rent Surveys Why the Differences? Barry Ward Department of Agricultural, Environmental and Development Economics, 1 What is
National Agricultural Statistics Service (NASS) vs. Land Grant University Cash Rent Surveys Why the Differences? Barry Ward Department of Agricultural, Environmental and Development Economics, 1 What is
2017 LEASE SURVEY SUMMARY REPORT K-State Research and Extension Post Rock District LINCOLN County
 2017 LEASE SURVEY SUMMARY REPORT K-State Research and Extension Post Rock District LINCOLN County 2017 FARM LEASE ARRANGEMENT SURVEY SUMMARY FOR DRYLAND CROPS K-STATE RESEARCH & EXTENSION Post Rock District
The estimated costs of corn, corn silage, soybeans,
 Estimated Costs of Crop Ag Decision Maker Production in Iowa - 2009 File A1-20 The estimated costs of corn, corn silage, soybeans, alfalfa, and pasture maintenance in this report are based on data from
Kansas Farm Economy Update Land and Leasing
 Kansas Farm Economy Update Land and Leasing Mykel Taylor Kansas State University January 10, 2017 Net Farm and Ranch Income Returns over Total Costs ($/ac) $230,000 $180,000 $130,000 $80,000 $30,000 $(20,000)
The estimated costs of corn, corn silage,
 Estimated Costs of Crop Production in Iowa - 2018 Ag Decision Maker File A1-20 The estimated costs of corn, corn silage, soybeans, alfalfa, and pasture maintenance in this report are based on data from
2016 Kansas County-Level Cash Rents for Non-Irrigated Cropland
 Kansas Non-Irrigated Cash Rents at the County Level 2016 www.agmanager.info 2016 Kansas County-Level Cash Rents for Non-Irrigated Cropland February 2016 (available at www.agmanager.info) Mykel Taylor,
The estimated costs of corn, corn silage, soybeans,
 Estimated Costs of Crop Ag Decision Maker Production in Iowa - 2010 File A1-20 The estimated costs of corn, corn silage, soybeans, alfalfa, and pasture maintenance in this report are based on data from
FEATURING Land, Rent, Custom Rate Surveys Legal Considerations Worksheets Historical Data Written Forms Glossary Resources
 July 2016 The Farm Leasing Arrangements booklet offers many farmland leasing publica ons and resources in a single document. It is designed for use by farmland owners, tenants, and agricultural professionals.
The estimated costs of corn, corn silage, soybeans,
 Estimated Costs of Crop Ag Decision Maker Production in Iowa - 2011 File A1-20 The estimated costs of corn, corn silage, soybeans, alfalfa and pasture maintenance in this report are based on data from
Iowa Timber Industry An Assessment of Timber Product Output and Use, 2000
 United States Department of Agriculture Forest Service North Central Research Station Resource Bulletin NC-215 Iowa Timber Industry An Assessment of Timber Product Output and Use, 2000 Ronald J. Piva and
The estimated costs of corn, corn silage,
 Estimated Costs of Crop Ag Decision Maker Production in Iowa - 2014 File A1-20 The estimated costs of corn, corn silage, soybeans, alfalfa, and pasture maintenance in this report are based on data from
Agricultural Resources Conservation Fund 2015 Biennial Report
 Agricultural Resources Conservation Fund 2015 Biennial Report Submitted to the Tennessee General Assembly House Agriculture and Natural Resources Committee Senate Energy, Agriculture and Natural Resources
COMMUNITY FORUM SUMMARY
 COMMUNITY FORUM SUMMARY December 14, 2017 OELWEIN BUSINESS LEADERSHIP NETWORK The Business Leadership Network comprises Iowans who are leaders in business, educators, public health professionals, health
Economics 330 Fall 2005 Exam 1. Strategic Planning and Budgeting
 Economics 330 Fall 2005 Exam 1 K E Y Strategic Planning and Budgeting Circle the letter of the best answer. You may put a square around the letter of your second choice. If your second choice is right,
Estimated Costs of Crop Production in Iowa 2003
 Estimated Costs of Crop Production in Iowa 2003 The estimated costs of corn, corn silage, soybeans, alfalfa, and pasture maintenance in this report are based on data from several sources. They include
U.S. Farm Sector Profits
 Financial stress Alejandro Plastina, PhD Assistant Professor, Economics Crop Advantage-Denison, IA January 26, 2018 U.S. Farm Sector Profits 1 Overview 1) How has the financial situation of Iowa farms
Examining Potential Profitability in 2013 Land Values, Cash Rents & Crop Inputs
 Examining Potential Profitability in 2013 Land Values, Cash Rents & Crop Inputs Barry Ward Ward.8@osu.edu Department of Agricultural, Environmental & Development Economics Ohio State University Extension
The Agricultural Act of
 A Business Newsletter for Agriculture Vol. 18, No. 11 www.extension.iastate.edu/agdm September 2014 Base acreage reallocation and payment yield update by Alejandro Plastina, extension economist, plastina@iastate.edu,