UNIVERSITY OF TWENTE
|
|
|
- Ashlyn Peters
- 5 years ago
- Views:
Transcription
1 UNIVERSITY OF TWENTE FACULTY OF ENGINEERING TECHNOLOGY WATER ENGINEERING AND MANAGEMENT MARGINAL ECONOMIC VALUE OF WATER IN CROP PRODUCTION A thesis submitted in partial fulfillment of the requirements of the degree of Master of Science in Civil Engineering and Management Author: Fitsum S. Hailu S Supervisors: Prof. dr. ir. A.Y. Hoekstra A.D. Chukalla August 2017
2

3 Declaration This thesis is the result of the author s original research. It has been composed by the author and has not been previously submitted for examination, which has led to the award of a degree. All materials in this dissertation that are not the author s original work are cited through appropriate referencing and acknowledgement. Signature: Name: Fitsum Samuel Hailu Student No.: S Date: August 2017 i
4 Abstract This study explores the effect of two types of management practices on the average and marginal water productivities. The management practices are three irrigation techniques (furrow, sprinkler, and drip irrigation) and two mulching practices (no mulching and organic mulching). A case for an arid environment around Tunis with sandy loam soil for two crop types (wheat and maize) was considered. The AquaCrop model was used to simulate the soil-water-balance and crop yield. A comparison was made on how changing the management practices affect the crop yield and irrigation requirement, which ultimately also affect the average and marginal water productivities. For all the management practices implemented, the maximum crop yield attained remained the same but they all achieved this maximum with different irrigation requirement. Drip irrigation required the least amount followed by furrow and sprinkler irrigation, respectively. Moreover, the maximum average water productivity is also the highest for drip irrigation and it is also reached with the least amount of water. However, for the marginal water productivity, switching between management practices did not affect the maximum value but the volume of water required to attain this maximum was also the least in the case of drip irrigation. The results obtained apply for both crops (wheat and maize). The only difference is the magnitudes of values but the shapes of the production and productivity curves are similar for both crops. In addition, by partially satisfying the crop s evaporative requirement we found out it is possible to save considerable amount of water with no reduction in the maximum crop yield. Furthermore, when there is scarcity of land or water, we can maximize the crop production using two different approaches. When land is scarce, we make sure we effectively use all the land we have and we irrigate at maximum yield in order to get the most out of the available land. Conversely, when water is scarce, we have to aim for maximum average water productivity as that will result in maximizing our crop production. ii
5 Acknowledgements Foremost, I would like to express my sincere gratitude to my supervisor Prof. dr. ir. A.Y. Hoekstra for the continuous support of my study and research, for his patience, motivation, enthusiasm, and immense knowledge. His guidance helped me in all the time of research and writing of this thesis. I could not have imagined having a better supervisor and mentor for my master s study. A special thank you to my daily supervisor A.D. Chukalla for his guidance, for all the invested time in the supervision of my thesis, for his readiness for scientific discussion and his brilliant comments and suggestions. I attribute the level of my master s degree to his encouragement and effort. He consistently allowed this paper to be my own work but steered me in the right direction whenever he thought I needed it. Without him, this thesis would not have been completed. I would like to thank Mikias Wondimu for his critical comments and suggestions throughout the thesis work. He has given me constructive criticisms for my work as well as helped me in proofreading. I gratefully acknowledge the funding source of my study, the University of Twente, which has made my master s study possible. My time at Twente was made enjoyable in large part due to the many friends and groups that became a part of my life. I am grateful for the time spent with my friends and all the memories we created. Finally, my deep and sincere gratitude to my family for their continuous and unparalleled love, help and support. I am forever indebted to my parents for giving me the opportunities and experiences that have made me who I am. They selflessly encouraged me to explore new directions in life and seek my own destiny. This journey would not have been possible if not for them, and I dedicate this milestone to them: All that I am, and ever hope to be, I owe it to you. Fitsum Samuel Hailu University of Twente August 2017 iii
6 Table of Contents Declaration... i Abstract... ii Acknowledgements... iii List of figures... vi List of tables... viii List of abbreviations and acronyms... ix 1. Introduction... 1 Research Objectives... 4 Outline of dissertation Method and Data... 5 Soil-water balance and crop growth model... 5 Water Productivity indices... 8 Average water productivity... 8 Marginal water productivity... 8 Optimization of water and land under scarcity... 8 Experimental set-up... 9 Management Practices... 9 Irrigation Scheduling... 9 Irrigation Technique Mulching Practice Data Results and Discussion Overview of results from model experiments Effect of management practice on crop yield Irrigation techniques Mulching practices Effect of management practice on water productivity Irrigation techniques Average water productivity Marginal water productivity Mulching practices Average water productivity Marginal water productivity Effect of irrigation scheduling on irrigation water saving and maximizing profit iv
7 Effect of irrigation scheduling on irrigation water saving while keeping the maximum crop yield Effect of irrigation scheduling in maximizing profit by considering price of water Maximizing crop production under scarcity Conclusions References Appendices Appendix A Model simulation results Wheat Maize Appendix B Crop parameters Wheat Maize v
8 List of figures Figure 2.1 Flowchart for determining the average water productivity (AWP), marginal water productivity (MWP), and maximum production under land or water scarcity... 5 Figure 2.2 Chart of AquaCrop for the main components of the soil plant atmosphere continuum and the parameters driving phenology, canopy cover, transpiration, biomass production and final yield. Source: Steduto et al. (2012) Figure 2.3 Calculation scheme of AquaCrop with indication of the four steps, and the processes (dotted arrows) affected by water stress (a to e) and temperature stress (f to g). Source: FAO (2016) Figure 2.4 First half of Zadoks cereal growth stages. Source: (Poole, 2005) Figure 2.5 Second half of Zadoks cereal growth stages. Source: (Poole, 2005) Figure 3.1 Crop yield versus irrigation supply for wheat obtained using furrow irrigation for different irrigation schedules. Sch. 1 is irrigating from crop sowing date until the end of crop development stage up to field capacity before crop starts to experience leaf expansion growth stress. Sch.2 is similar to Sch. 1 but irrigation is triggered before crop experiences canopy senescence stress. Sch. 3 and 4 are similar to Sch. 1 but irrigation started 7 and 10 days after sowing, respectively. Sch. 5 is when irrigation is every 10 days up to field capacity and irrigation is triggered if the crop has experienced stomatal closure stress Figure 3.2 Average and marginal water productivity for wheat using furrow irrigation with no mulching practice Figure 3.3 Crop yield of wheat for the three irrigation techniques with no mulching practice Figure 3.4 Crop yield of wheat for furrow irrigation with no mulching and organic mulching practices Figure 3.5 Crop yield of wheat for sprinkler irrigation with no mulching and organic mulching practices 17 Figure 3.6 Average water productivity of wheat for the three irrigation techniques with no mulching practice Figure 3.7 Marginal water productivity of wheat for the three irrigation techniques with no mulching practice Figure 3.8 Average water productivity of wheat for furrow irrigation with two different mulching practices Figure 3.9 Average water productivity of wheat for sprinkler irrigation with two different mulching practices Figure 3.10 Effect of organic mulching on the marginal water productivity of wheat for furrow irrigation Figure 3.11 Effect of organic mulching on the marginal water productivity of wheat for sprinkler irrigation Figure 3.12 Crop yield of wheat for the different irrigation technique and mulching practice combinations Figure 3.13 Average water productivity of wheat for the different irrigation technique and mulching practice combinations vi
9 Figure 3.14 Marginal water productivity of wheat for the different irrigation technique and mulching practice combinations Figure 3.15 Volume of water saved by switching from fully meeting the crop s evaporative demand to partially meeting the demand for furrow irrigation in wheat Figure 3.16 Heat map showing how crop production can be maximized under scarcity Figure 3.17 Irrigated land that results in the maximum production for the water and land available Figure 3.18 Maximum production based on the available land and water vii
10 List of tables Table 2.1 Research model: management practices considered in a number of cases to simulate the effect on Average Water Productivity (AWP) and Marginal Water Productivity (MWP) Table 3.1 Amount of irrigation water saved using the different management practices for wheat and maize Table 3.2 Revenue-cost calculation for varying prices of water for wheat using furrow irrigation and no mulching Table 3.3 Calculation to determine the maximum production Table 3.4 Irrigated land, total production and respective yield for various amounts of available water viii
11 List of abbreviations and acronyms AL AW AWP B CC CWPF CWU DI E ET ET o FAO FI f m HI IL Irr MWP MY P RAW RDI RH T WP WP * WUE Y Available Land Available Water Average Water Productivity Biomass Green Canopy Cover Crop Water Production Function Consumptive Water Use Deficit Irrigation Evaporation Evapotranspiration Reference Evapotranspiration Food and Agriculture Organization Full Irrigation Parameter for mulch material Harvest Index Irrigated Land Irrigation Requirement Marginal Water Productivity Maximum Yield Production Readily Available Water Regulated Deficit Irrigation Relative Humidity Transpiration Water Productivity Normalized Water Productivity Water Use Efficiency Yield ix
12 Introduction 1. Introduction Agriculture plays a crucial role for the economy of most countries in the world. It is the main source of people s livelihood particularly in the developing and under-developed countries (Mendelsohn and Dinar, 1999). One of the main components of agriculture is crop production, and it encompasses a series of processes involved in the growing of crops from land preparation through planting to the product reaching the consumer. Water is an integral part of this long and complicated process, and the main factor limiting crop production in parts of the world where the rainfall is insufficient to meet the crop demand. The competition for the finite water resources worldwide is continually increasing and the continuous rise in the demand for agricultural commodities causes it (Foley et al., 2011, Ali and Talukder, 2008). The fact that world population is expected to increase by 29% from 7.5 billion to 9.7 billion in 2050 will put an immense pressure on agriculture (Worldometers.info, 2017, DESA, 2015). By 2050, world annual demand for maize, rice and wheat is expected to reach 3.3 billion tons, or 800 million tons more than 2014 s record combined harvest (Reeves et al., 2016). In order to meet the ever-increasing food demand, developed and developing countries have to increase their food production by about 60% and 100%, respectively (Alexandratos and Bruinsma, 2012). Much of the increase in production will need to come from existing farmland. However, one-third of that land is degraded, and farmers share of water is under growing pressure from other sectors. This calls for an immediate response to improve the efficiency and productivity of water use in crop production to guarantee future food security and address the complications that will likely follow because of climate change (Steduto et al., 2012). Climate change is generally expected to worsen the situation. While some areas will receive higher rainfall, most of the currently water-scarce regions will become drier and warmer. These two changes will exacerbate scarcity: reduced rainfall means less flow in rivers; higher temperatures mean increased evaporation and water consumption by natural vegetation (compounding the reduction in runoff), and higher water demand for agricultural use. Hence, tensions between supply and demand are likely to be aggravated. There are different strategies that can be taken to ensure the future food demand is met. Such solutions include decreasing the yield gap, reducing wastage of food, adopting more sustainable diets, and increasing water productivity (Alexandratos and Bruinsma, 2012, Kiani and Abbasi, 2012, Foley et al., 2011, Kijne et al., 2009, Kijne et al., 2003). Researchers have been trying to find different ways to increase the water productivity in crop production. They have applied different strategies to achieve that: changing the irrigation techniques (Xue and Ren, 2016, Oweis and Hachum, 2006), changing the mulching practices (Zamir et al., 2013, Ogban et al., 2008), and a combination of both the irrigation technique and mulching practice (Chukalla et al., 2015). Though increasing the physical water productivity is of paramount importance to ensure the future food demand, it should be done by also considering other influencing factors. Such factors include the amount of water available, environmental conditions, management practices and type of crop (Chukalla et al., 2015, Amarasinghe and Smakhtin, 2014, Bessembinder et al., 2005, Kijne et al., 2003, Molden, 1997). We have to consider those factors because in the process of increasing water productivity we should not compromise environmental sustainability (Hoekstra, 2013, Molden, 1997). In order to avoid the depletion of water and reduction of available water for other purposes, the scheme aimed at increasing water productivity should also take into account the water availability and environmental flow requirement (Qureshi et al., 2011). Most of the previous studies available are about how we can increase water productivity and/or reduce water footprint (Chukalla et al., 2015, Amarasinghe and Smakhtin, 2014, Oweis and Hachum, 2006). Even though it is useful to determine ways to increase the water productivity, it will give more insight to know 1 P a g e
13 Introduction the additional value that can be obtained from an additional m 3 of water, which depends on how much water is available already. Water productivity, as defined in most literatures is simply the ratio of yield to the amount of water consumed (Amarasinghe and Smakhtin, 2014, Molden, 1997). As such, it does not describe the incremental productivity of water. Hence, water productivity cannot be an appropriate indicator of economic efficiency, which requires consideration of incremental gains and costs, including opportunity costs (Wichelns, 2015). The number of researches done on marginal water productivity is very limited, and even those researches done are site specific (Elsheikh, 2015, Frija et al., 2014, Samarawickrema and Kulshreshtha, 2009). Scientists used to approach the task of finding an ideal cropping system, and suitable soil and management strategies that can maximize the crop productivity by designing field experiments. However, given the complexity of factors involved and the number of possible combinations that need to be studied, the field experiments can prove to be very expensive and time-consuming (Sivakumar and Glinni, 2002). In addition, there are also some scenarios such as the effect of global warming which cannot be modelled experimentally on the field; hence making use of crop-growth models the best alternative. The scientific community has developed more than 70 different types of crop models with different levels of sophistication (Di Paola et al., 2016). The use of crop simulation models has an increasing role in scientific research, farm development, and policy decisions. All models have their own purpose and merit, and before a model is used, a critical evaluation of the most appropriate model for a study should be made, based on the model's scope and purpose (Bennett et al., 2013). It is followed by selection of the best compromise between accuracy and ease of use to explore the model qualifications and assumptions. For this study, the water driven dynamic model called AquaCrop, developed by the Food and Agriculture Organization (FAO) of the United Nations is used. It is able to simulate the attainable yield of herbaceous crops under various management and environmental conditions (Steduto et al., 2012, Hsiao et al., 2009). AquaCrop employs a semi-quantitative approach that requires for users of the model to provide the soil fertility as an input instead of using nutrient-balance approach to model crop response to soil fertility (Van Gaelen et al., 2015). This semi-quantitative approach requires few input parameters (explicit and mostly intuitive), which are easily obtainable, then integrates the effects of various soil nutrients and mineralization processes, and attempts to balance simplicity, accuracy, and robustness (Steduto et al., 2009). Although other crop models have produced good crop yield simulation results, compared to them, the AquaCrop model is simpler, requires available field input data, and is highly reliable for the simulation of biomass, canopy cover, and yield under different climatic conditions. This study was done for the area around Tunis for a sandy loam soil for two of world s highly harvested crops wheat and maize under different irrigation management practices. Bread and durum wheat (Triticum aestivum and Triticum durum, respectively) comprise the third largest crop produced in the world (first place held by Maize and second place by rice) (FAO, 2014). Wheat is the most important source of carbohydrate in a majority of countries. Wheat contains minerals, vitamins, and fats (lipids), and with a small amount of animal or leguminous protein added is highly nutritious. A predominately wheat-based diet is higher in fiber than a meat-based diet (Curtis et al., 2002). Wheat is also a popular source of animal feed, particularly in years where harvests are adversely affected by rain and significant quantities of the grain are made unsuitable for food use. Such low-grade grain is often used by industry to make adhesives, paper additives, several other products and even in the production of alcohol (Curtis et al., 2002). Maize ranks as the most important crop worldwide in terms of grain production; although wheat and rice are the most important for direct human consumption (Steduto et al., 2012). It provides nutrients for humans and 2 P a g e
14 Introduction animals and serves as a basic raw material for the production of starch, oil and protein, alcoholic beverages, food sweetener and more recently fuel (FAO, 1992). In this study, by using AquaCrop model and knowledge of crop growth and developmental stages it was shown how irrigation scheduling affects the maximum crop yield obtained and the irrigation requirement to attain it. For the irrigation schedule selected, the relationship amongst the crop yield, average water productivity and marginal water productivity is explained. It was observed that changing the management practice (irrigation techniques and mulching practice) has no effect on the maximum crop yield obtained but the irrigation requirement varied and model experiments were done for both crops: wheat and maize. However, due to the change in the irrigation requirement when the management practices were altered, the average and marginal water productivities also changed and what these changes imply are also discussed. For each of the irrigation techniques and mulching practices used the maximum amount of irrigation water that can be saved with no decrease in the maximum crop yield attained was also calculated. Finally, decisions are made on how the crop production can be maximized when there is a scarcity of water or land. 3 P a g e
15 Introduction Research Objectives The main objective of this study was to estimate the average and marginal economic value of water in crop production as a function of the amount of water already applied for different management practices in an arid environment. This study covered the following specific objectives: To explore the effect of changing the management practice (irrigation scheduling, irrigation techniques, and mulching practices) on crop yield and irrigation requirement; To investigate the effect varying the management practices (irrigation techniques and mulching practices) on the average and marginal water productivities; To determine the effect of irrigation scheduling on irrigation water saving without reducing the maximum crop yield and determine how profit can be maximized when price of water is considered and; To determine the most suitable approach to maximize the crop production under land or water scarcity. Case study for wheat and maize near Tunis in Tunisia for the year Outline of dissertation A brief explanation of the methods employed and data used is given in Chapter 2. FAO s AquaCrop model is used to simulate the soil-water-balance and crop yield for the different management practices. In addition, a short description of how the model works and how the experiment is set-up is also included. The results and discussion of this research are summarized in Chapter 3. The final outputs of the model relevant to this study are crop yield and consumptive water use, and these are translated into average and marginal water productivities. Based on these results, the effect of management practices on the water productivities and how crop production can be maximized when there is a scarcity of land or water are discussed. Finally, in Chapter 4 the conclusions drawn from the study and recommendations for improvement and further research are presented. 4 P a g e

16 Method and data 2. Method and Data In this study, the different input variables are put in the crop water productivity model, AquaCrop which gives outputs of evapotranspiration (ET) and crop yield. These results are translated into average and marginal water productivity that were used to make further calculations and recommendations. Figure 2.1 Flowchart for determining the average water productivity (AWP), marginal water productivity (MWP), and maximum crop production under land or water scarcity In the above flowchart, the inputs in the gray parallelogram (climate, crop, and soil) are fixed. On the other hand, the input in the blue parallelogram, which is the management practice, is variable. It is by changing the management practice and keeping the others constant, we investigated the effect on the AWP and MWP. Soil-water balance and crop growth model In this study, FAO s AquaCrop model (version 5.0), which simulates the soil-water-balance and crop yield, is used to carry out a series of simulations with increasing water supply (rainfall and/or irrigation) over the growing period of a crop (keeping other things equal), monitoring the simulated ET and crop yield over 5 P a g e
 and crop yield (kg/ha) are used as input to calculate the Average Water Productivity (ton/m 3 ) and Marginal Water Productivity (ton/m 3 ), which is the additional crop yield")
17 Method and data the growing period. ET (m 3 /ha, or mm) and crop yield (kg/ha) are used as input to calculate the Average Water Productivity (ton/m 3 ) and Marginal Water Productivity (ton/m 3 ), which is the additional crop yield obtained for the additional unit of water applied. The structural components of AquaCrop, including the stress responses and the functional linkage among them, are shown schematically in the following figure. The continuous lines indicate direct links between variables and processes, whereas the dotted lines indicate feedbacks (Steduto et al., 2012). Figure 2.2 Chart of AquaCrop for the main components of the soil plant atmosphere continuum and the parameters driving phenology, canopy cover, transpiration, biomass production and final yield. Source: Steduto et al. (2012). AquaCrop simulates final crop yield in four easy to understand steps (which run in series in each daily time increment and ensure transparency in the modelling approach), as described below (FAO, 2016). a) Development of green canopy cover: in AquaCrop, foliage development is expressed through green canopy cover (CC) rather than leaf area index. CC is the fraction of the soil surface covered by the canopy; it ranges from zero at sowing (i.e. 0 percent of the soil surface covered by the canopy) to a maximum value at mid-season as high as 1 if full canopy cover is reached (i.e. 100 percent of the soil surface is covered by the canopy). By adjusting the water content in the soil profile each day, AquaCrop keeps track of stresses that might develop in the root zone. Soil-water stress can affect the leaf and therefore canopy expansion; if severe, it can trigger early canopy senescence. 6 P a g e

18 Method and data b) Crop transpiration: in well-watered conditions, crop transpiration (Tr) is calculated by multiplying the reference evapotranspiration (ET o) with a crop coefficient (KcTr). The crop coefficient is proportional to CC and hence varies throughout the life cycle of a crop in accordance with the simulated canopy cover. Not only can water stress affect canopy development, it can also induce stomata closure and thereby directly affect crop transpiration. The soil evaporation is adjusted for the withered canopy, mulches and partial wetting by irrigation. The AquaCrop model simulates the effect of mulching on evaporation and represents effects of soil organic matter through soil hydraulic properties influencing the soil water balance. Soil evaporation under mulching practice is simulated by correcting evaporation (E) with a factor that is described by two variables (Raes et al., 2012): soil surface covered by mulch (from 0 to 100 %); and mulch material (f m). According to Allen et al. (1998), the values of the parameters for mulch material (f m) are suggested to vary between 0.5 for mulches of plant material and close to 1.0 for plastic mulches (Raes et al., 2012).The correction factor for mulching is calculated as: Percent covered by mulch Correction factor for mulching = [1 f m ] (1) 1 Figure 2.3 Calculation scheme of AquaCrop with indication of the four steps, and the processes (dotted arrows) affected by water stress (a to e) and temperature stress (f to g). Source: FAO (2016). c) Above-ground biomass: the quantity of above-ground biomass (B) produced is proportional to the cumulative amount of crop transpiration (ΣTr); the proportional factor is known as biomass water productivity (WP). In AquaCrop, WP is normalized for the effect of climatic conditions, making normalized biomass water productivity (WP * ) valid for diverse locations, seasons and concentrations of carbon dioxide. 7 P a g e
19 Method and data d) Crop yield: the simulated above-ground biomass integrates all photosynthetic products assimilated by a crop during the season. Crop yield (Y) is obtained from B by using a harvest index (HI) which is the fraction of B that is a harvestable product. The actual HI is obtained during simulation by adjusting the reference harvest index (HI o) with an adjustment factor for stress effects. Temperature and water stresses directly affect one or more of the aforementioned processes (Figure 2.3). AquaCrop considers also the effect of soil fertility and soil salinity stress on canopy development, crop transpiration and biomass production (FAO, 2016). Water Productivity indices Molden (2007) defined water productivity as the ratio of the net benefits from crop, forestry, fishery, livestock, and mixed agricultural systems to the amount of water required to produce those benefits. In its broadest sense, it reflects the objectives of producing more food, income, livelihoods, and ecological benefits at less social and environmental cost per unit of water used, where water use means either water delivered to a user or depleted by a user. Put simply, it means growing more food or gaining more benefits with less water. Water productivity has two representations: physical water productivity the ratio of the mass of agricultural output to the amount of water used, and economic water productivity the value derived per unit of water used. The outputs files of AquaCrop simulation are the summary of the crop development and production, soil water balance, soil water content, salt balance, salt water content, soil salinity, and net irrigation requirement for the entire simulation. However, for this study, we only need the evapotranspiration, crop yield, and net irrigation requirement. Using these results, the water productivity indices (average water productivity and marginal water productivity) are calculated. Average water productivity The simple definition of average water productivity is the ratio of crop yield to water use: AWP = Y WU Water use in the denominator can be total consumptive water use or total water applied (rainfall and/or irrigation supply); the latter is used in this study when defining water productivity indices. Marginal water productivity Technically, the marginal productivity of a particular resource is defined as the addition to the gross output caused by an addition of one unit of that resource while other inputs are held constant. Hence, marginal water productivity is the ratio of change in crop yield to change in water use: MWP = ΔY ΔWU Optimization of water and land under scarcity In crop production, different resources are required but the most important and limiting ones are water and land. Depending on which resource is scarce, different approaches have to be taken to ensure maximum production. In order to determine which approach results in the highest production when one of the resources was scarce, an optimization was performed. (2) (3) 8 P a g e
20 Method and data AW if { Irr < AL, AW IL = (4) Irr AW AL, IL = AL (5) Irr IL < AL, if { P = AW Y (6) Irr IL AL, P = Y AL (7) where: AW = Available water (m 3 ) Irr = Irrigation requirement (m 3 /ha) AL = Available land = 1ha IL = Irrigated land (ha) Y = Yield (ton/ha) Experimental set-up A comprehensive set of simulations were carried out, applying different management practices in an extensive number of cases (Table 2.1). Table 2.1 Research model: management practices considered in a number of cases to simulate the effect on Average Water Productivity (AWP) and Marginal Water Productivity (MWP). Management Practices Management practices Modeling Effects Three irrigation techniques: furrow, AWP sprinkler and drip irrigation MWP Two mulching practices: no mulching and organic mulching Soil water balance and crop growth model (AquaCrop) The management practices implemented in this study were varying the irrigation scheduling (when and how much irrigation water is applied), irrigation techniques (the methods used to apply the irrigation water) and mulching practices. Irrigation Scheduling Irrigation scheduling is the water management strategy of determining when and how much water to apply to an irrigated crop in order to maximize the total crop yields. Commonly irrigation scheduling is defined as determining the time of irrigation and the amount of water to be applied. The maximization of crop yield requires a high level of water productivity, and this in turn requires the accurate measurement of the volume of water applied or of the depth of application. This is imperative because when crops are under water stresses there are reductions in crop yield and decrease in crop yield returns. To gain benefit from irrigation scheduling, there must be an efficient irrigation system. Irrigation scheduling is one of the important management activities that are vital to the effective and efficient utilization of water. Water management strategies based on irrigation scheduling are intended to reduce the amount of water applied and minimize crop yield reduction due to water stress. It will ensure that water is applied to the crop when needed and in the amount required. 9 P a g e

21 Method and data When we meet the full evaporative demand of the crop for the whole crop development stage it is referred to as full irrigation (FI). The main aim of FI is to maximize the crop yield obtained. AquaCrop can automatically generate the irrigation schedule with no stress condition. On the other hand, when we apply irrigation water below the evaporative requirement of the crop it is called deficit irrigation (DI) (Fereres and Soriano, 2007). The reduction can be for the whole crop development stage or only for some part of the crop development stage where the crop is more resistant to drought, known as sustained deficit irrigation and regulated deficit irrigation (RDI), respectively (Chukalla et al., 2015). However, in order to determine which irrigation schedule results in the highest crop yield and identify in which crop development stage or stages to apply deficit irrigation, a thorough knowledge of growth and development of crops is required. Growth and development in cereal plants do not proceed at a constant or fixed rate through time. They are modified by environmental factors like temperature, light intensity and duration, nutrition, and husbandry techniques (Landes and Porter, 1989). Therefore, calendar date is not suitable for the quantitative description of the developmental stage of plants. There have been many attempts to define precise and easily applicable methods for describing all the important periods and stages during cereal development. This need arises since cereal plants undergo, during their life cycles, periods and stages of differential sensitivity to environmental factors, notably temperature and photoperiod (Porter and Delecolle, 1987). Different scales are used to describe the growth stage in cereals. For example, Feekes Scale developed by Feekes (1941) under North-west European conditions, uses four principal positions (Feekes' codes 2 to 5). The four-digit Feekes' scale is inefficient for data processing, and for computer storage and retrieval (Loegering, 1968). Haun Scale developed by Haun (1973) allows a continuous numerical expression of plant development until the complete emergence of the flag leaf. A major limitation of Haun's scale is its restriction to the period of leaf emergence (Cabeza et al., 1996). Zadoks Scale, most commonly used type of scale and also the scale used in this study was developed by Zadoks (1985). It uses decimal code system that divides into 10 distinct developmental phases covering 100 individual growth stages. These 10 development stages along with their respective scales are given in the following figures. The individual growth stages are denoted by the prefix GS (growth stage) or Z (Zadoks) (Poole, 2005) Figure 2.4 First half of Zadoks cereal growth stages. Source: (Poole, 2005) 10 P a g e

22 Method and data Figure 2.5 Second half of Zadoks cereal growth stages. Source: (Poole, 2005) Not all stages of crop growth are uniformly susceptible to water scarcity. On the other hand, some stages can cope-up with water shortage very well, while others are more susceptible and water shortages at such stages may result in distinct crop yield losses. Moisture stress is known to reduce biomass, tillering ability, grains per spike and grain size at any stage when it occurs. Therefore, the overall effect of moisture stress depends on intensity and length of stress (Akram, 2011). Based on this knowledge of the growth stages, different schedules such as irrigating at a constant irrigation interval, varying the initial date of irrigation, irrigating for only some part of the crop development stage, irrigating when the soil moisture content reaches a certain threshold and so on have been implemented. All these different types of irrigation schedules are applied using AquaCrop until the most suitable schedule is found. The irrigation application dose is generally selected as the depth criterion. The dose is obtained by considering the irrigation method, crop and soil characteristics, and common local practices. The time criterion consists in selecting an allowable depletion level of the root zone at which irrigation should be triggered. Once the most suitable irrigation schedule (the irrigation schedule that results in the highest crop yield for the least amount of irrigation water) is determined then we used that schedule for the rest of the study. Irrigation Technique According to Ali (2011), different criteria can be considered when classifying irrigation techniques such as the energy or pressure required, how or where the irrigation water is applied, and wetted area by irrigation. Based on the wetted surface area, irrigation techniques can be listed as flood irrigation, trickle or localized irrigation and sprinkler irrigation. The first of these, flood irrigation, comprises furrow, border and basin irrigation. The second, trickle irrigation comprises drip and subsurface drip. Given the existing irrigation practices in the environment that we consider, we analyze three irrigation techniques: furrow (with 80% surface wetting), sprinkler (100% surface wetting), and drip (30% wetting). Generic assumptions have been made about the specific details of the different irrigation techniques, following default settings in the model. For furrow irrigation, an 80% wetting percentage is assumed representative of every furrow (narrow bed) from the indicative range of 60 to 100% in the AquaCrop manual (Raes et al., 2012). 11 P a g e
23 Method and data Mulching Practice Mulching involves the use of organic or inorganic materials to cover the cropped soil surface. Mulching has the potential of reducing evaporation, conserving soil moisture, modifying soil temperature, and improving aeration (Ogban et al., 2008, McCraw and Motes, 1991). Crop residues and grasses are typical organic materials commonly used for mulching, while synthetic materials (e.g. polyethylene sheet of different thickness and colors) are typical inorganic materials use for mulching. The mulching practice in AquaCrop considers mainly evaporation reduction from the soil surface. Two mulching practices were considered: no mulching and organic mulching with f m=0.5 and a mulch cover of 100% were considered. It is assumed the mulches have no effect on the surface runoff. Data The operation of AquaCrop model requires input data consisting of climatic parameters, crop, soil and field and irrigation management data. However, the model contains a complete set of input parameters that can be selected and adjusted for different irrigation management and crop types. Climate Arid environment The weather data required by AquaCrop model are daily values of minimum and maximum air temperature, reference crop evapotranspiration (ET o), rainfall and mean annual carbon dioxide concentration (CO 2). ET o was estimated using ET o calculator using the daily maximum and minimum temperature, wind speed at 2 meters above ground surface, solar radiation and mean relative humidity (RH). For this study, an arid climate was chosen. An arid environment can be defined as one in which the amount of precipitation an area receives, divided by the amount which is lost to evapotranspiration, yields a fraction which is less than 0.50 (Salem, 1989). For this study, we selected an area located near the Gulf of Tunis, Northern Africa (36.81 N, E) that has an aridity of as a typical representative. It is assumed that there is no rainfall and only irrigation takes place. Crop Wheat and Maize Depending on the photosynthetic pathway which ultimately determines the water productivity, crops can be broadly classified into two classes: C 3 and C 4 (Lara and Andreo, 2011). The C 3 crops have an average productivity between 0.15 and 0.20 ton/ha, whereas C 4 crops have a higher average productivity between 0.30 and 0.35 ton/ha (Raes et al., 2012). C 4 plants owe their greater resource use efficiency and potential productivity to their evolved photosynthetic pathway that is adapted to high light intensity, high temperature, and dryness (Liu et al., 2017). The C 4 photosynthesis is an adaptation of the C 3 pathway that overcomes the limitation of the photorespiration, improving photosynthetic efficiency and minimizing the water loss in hot, dry environments (Edwards and Walker, 1983). In this study, one representative crop was selected from each class: Wheat from C 3 and Maize from C 4. These crops were selected because they are two of the most harvested crops in the world and AquaCrop accurately models them (Raes et al., 2012). Although grounded on basic and complex biophysical processes, AquaCrop uses a relative small number of crop parameters to characterize the crop. FAO has calibrated these crop parameters for several crops 12 P a g e
24 Method and data and provides them as default values in the crop files stored in AquaCrop database. For this study, these default values are used and extensive descriptions of these crop parameters are given in the appendix. Soil type Sandy loam soil Soils in the arid zones are formed when the significant diurnal temperature changes mechanically disintegrate rocks, wind-blown sand abrades rock surfaces, or the root systems of plants break up rock particles (Salem, 1989). Based on the granular composition, the soil type in Tunis can be classified as sandy loam soil (Kayouli et al., 2006). Groundwater characteristics Deep The considered characteristics of the groundwater table are its depth below the soil surface and its salinity, which can vary throughout the year. If the groundwater is shallow, water and salts might move upward from the water table to the root zone by capillary rise. The depth of the groundwater table, and characteristics and soil water content of the soil profile determine the amount of water transported upward. For this study, the groundwater depth is assumed sufficiently deep and no upward transport of water and salt takes place. 13 P a g e
25 Crop yield (ton/ha) Results and discussion 3. Results and Discussion Overview of results from model experiments The outcomes of the different irrigation schedules are plotted in Figure 3.1. The figure shows that for the different type of irrigation scheduling employed the maximum crop yield varies. This difference in the maximum crop yield is observed even when the amount of irrigation water used is the same. By changing the management practice (irrigation technique and mulching practice), the amount of water required to reach a maximum crop yield is also altered, as shown in Figure 3.3, 3.4 and 3.5, respectively. The relationship between the marginal water productivity and the crop yield as well as between marginal water productivity and average water productivity is explained. Because of the change in the irrigation requirement when the management practices were altered, the average and marginal water productivities will also change and what these changes imply are also discussed. For each of the irrigation techniques and mulching practices used the maximum amount of irrigation water that can be saved is calculated. Finally, decisions are made on how the crop production can be maximized when there is a scarcity of water or land. Though the results of wheat are shown in almost all cases, a similar trend is observed for the case of maize as well. The only differences are that the maximum crop yield obtained is greater for maize than wheat and the irrigation requirement to attain this maximum is less in the case of maize. As a result, the values of the maximum average and maximum marginal water productivity are greater in maize than in wheat but the shapes of the productivity curves are similar. Effect of management practice on crop yield Irrigation Sch. 1 Sch. 2 Sch. 3 Sch. 4 Sch. 5 Figure 3.1 Crop yield versus irrigation supply for wheat obtained using furrow irrigation for different irrigation schedules. Sch. 1 is irrigating from crop sowing date until the end of crop development stage up to field capacity before crop starts to experience leaf expansion growth stress. Sch.2 is similar to Sch. 1 but irrigation is triggered before crop experiences canopy senescence stress. Sch. 3 and 4 are similar to Sch. 1 but irrigation started 7 and 10 days after sowing, respectively. Sch. 5 is when irrigation is every 10 days up to field capacity and irrigation is triggered if the crop has experienced stomatal closure stress. The effect of different irrigation schedules (Sch. 1 to Sch. 5) on the crop yield and irrigation requirement are shown in Figure 3.1. Sch. 1 is an irrigation schedule in which irrigation is started from the crop sowing date and practiced throughout the whole crop development stages refilling up to field capacity when the moisture content in the root zone drops by 31% and 20% of the readily available water (RAW) for wheat 14 P a g e
26 Water Productivity (ton/m 3 ) Results and discussion and maize, respectively. Sch. 2 is similar to Sch. 1 except we allowed the soil moisture depletion to drop until the crop starts to experience canopy senescence stress. Sch. 3 and 4 are similar to Sch. 1 but irrigation started 7 and 10 days after sowing, respectively. Irrigating every 10 days up to field capacity if the moisture content in the root zone has dropped by 100% of RAW resulted in Sch. 5. Among the different irrigation schedules implemented, Sch. 1 is selected as the most suitable one as it gives the highest possible crop yield for the smallest amount of irrigation water. Once the appropriate irrigation schedule is selected, it is possible to plot the average water productivity and marginal water productivity against the irrigation water applied on the same graph (Figure 3.2). The MWP curve has a shape that resembles a normal distribution because of the law of diminishing marginal return. The law states that the additional input (water in this case) will generally increase output (in this case crop yield), but there also is a point where adding more input will result in a smaller increase in the output, and there is another point where using even more input will lead to a decrease in the output. The marginal water productivity curve has two parts: the increasing and decreasing part, but the decreasing part can be either positive or negative. The marginal water productivity and crop yield are related in a way that when the crop yield is increasing at an increasing rate then MWP is also increasing. This means the additional unit of water is producing more and more yield. Next, when the crop yield is increasing at a decreasing rate, then the MWP starts decreasing but remains positive. This means the additional unit of water is producing yield but this yield is not as much as it was before. Finally, when the crop yield starts to decline, then the MWP becomes negative. This is explained when we apply too much water, the crop yield declines due to waterlogging Irrigation Average Water Productivity Marginal Water Productivity Figure 3.2 Average and marginal water productivity for wheat using furrow irrigation with no mulching practice The average water productivity is increasing as long as the marginal water productivity is greater than the average water productivity. It is evident that when the MWP is increasing the AWP will also be increasing because in that part the crop yield is also increasing. However, when the MWP is decreasing but it is still greater than the AWP, then the AWP will increase because the additional yield obtained by the additional unit of water is not as large as the yield by the previous addition but is still more than the AWP at that point. This results in the increase of the AWP. When the MWP decreases to the point that the AWP is equal to the MWP, then that intersection point is the maximum AWP. After this point, the AWP is greater 15 P a g e
27 Crop yield (ton/ha) Results and discussion than the MWP and AWP is decreasing. Similarly, the additional crop yield obtained by the additional unit of water is smaller than it was before resulting in decreasing the AWP. Irrigation techniques The irrigation technique used determined how much percent of the surface is wetted and this determined the amount of evaporation that took place, which ultimately influenced the water productivity. By switching among the three types of irrigation techniques (sprinkler, furrow and drip irrigation), the maximum crop yield obtained remained the same, what varied was the irrigation water required to attain this maximum. With increasing efficiency of water application, the amount of water required to reach the maximum crop yield decreased. For instance, to produce a maximum of tons of wheat in 1ha of land; we need 9513 m 3, m 3 and m 3 of water for drip, furrow and sprinkler irrigation, respectively (Figure 3.3) Irrigation Furrow Irrigation and No Mulching Drip Irrigation and No Mulching Sprinkler Irrigation and No Mulching Mulching practices Figure 3.3 Crop yield of wheat for the three irrigation techniques with no mulching practice The mulching practice used controlled the percentage of surface that is covered. This also determined the amount of evaporation that also influenced the water productivity. Similar to changing the irrigation technique, changing the mulching practice does not affect the maximum crop yield obtained. However, it lowers the amount of water required to attain this maximum crop yield by reducing the evaporation that takes place. For example, to produce a maximum of tons of wheat in 1ha of land; we need for furrow irrigation, m 3 and 9668 m 3 of water for no mulching, and organic mulching, respectively (Figure 3.4). For sprinkler irrigation, m 3 and 9733 m 3 of water for no mulching, and organic mulching, respectively (Figure 3.5). For drip irrigation, no reduction in the irrigation water requirement has been observed when organic mulches are used. 16 P a g e
28 Crop yield (ton/ha) Crop yield (ton/ha) Results and discussion Irrigation Furrow Irrigation and No Mulching Furrow Irrigation and Organic Mulching Figure 3.4 Crop yield of wheat for furrow irrigation with no mulching and organic mulching practices Irrigation Sprinkler Irrigation and No Mulching Sprinkler Irrigation and Organic Mulching Figure 3.5 Crop yield of wheat for sprinkler irrigation with no mulching and organic mulching practices Effect of management practice on water productivity The effect management practices (irrigation techniques and mulching practices) have on average and marginal water productivities is explained as follows. 17 P a g e
29 Average Water Productivity (ton/m 3 ) Results and discussion Irrigation techniques Average water productivity Irrigation Furrow Irrigation and No Mulching Drip Irrigation and No Mulching Sprinkler Irrigation and No Mulching Figure 3.6 Average water productivity of wheat for the three irrigation techniques with no mulching practice Switching the irrigation technique from sprinkler to furrow and to drip irrigation with no mulching practice resulted in the increase of the maximum average water productivity as shown in the above figure. Figure 3.6 also shows that with the change in the irrigation technique not only has the maximum AWP been increased but the volume of water required to reach this maximum has also been reduced. The main reason for sprinkler irrigation having a smaller maximum AWP has to do with the percentage of surface wetting. It wets 100% of the surface and that requires more amount of water and this also leads to more evaporation. On the other hand, drip irrigation wets only 30% of the surface that results in less evaporation and requiring less amount of water, which ultimately leads to attaining a higher maximum AWP. The AWP of furrow irrigation with 80% wetting lies in between the above two irrigation techniques (sprinkler and drip). Thus, by using more efficient irrigation techniques we can attain a higher maximum AWP with a lesser amount of water. Marginal water productivity The results show that when irrigation technique is changed the maximum MWP remains relatively the same but the volume at which this maximum is reached varies. The shape of the MWP is more or less the same because the MWP is simply the ratio of the change in crop yield to change in water use, and there is a similar change in the crop yield for the different irrigation techniques. This can be seen from the crop yield versus irrigation water use in Figure 3.3. As a more efficient irrigation techniques are applied the volume of water required becomes smaller and smaller. Drip irrigation requiring the least followed by furrow irrigation and sprinkler irrigation at the last place. 18 P a g e
30 Average water productivity (ton/m 3 ) Marginal Water Productivity (ton/m 3 ) Results and discussion Irrigation Furrow Irrigation and No Mulching Drip Irrigation and No Mulching Sprinkler Irrigation and No Mulching Figure 3.7 Marginal water productivity of wheat for the three irrigation techniques with no mulching practice Mulching practices Average water productivity Irrigation Furrow Irrigation and No Mulching Furrow Irrigation and Organic Mulching Figure 3.8 Average water productivity of wheat for furrow irrigation with two different mulching practices Similar to switching the irrigation technique, changing the mulching practice also has an effect on the AWP. When organic mulches are used the amount of water that evaporates decreased and this resulted in increasing the maximum AWP; and this reduction in evaporation also decreased the amount of water required to reach this maximum value. As the percentage of surface wetted is highest in sprinkler irrigation, 19 P a g e
31 Marginal Water Productivity (ton/m 3 ) Average water productivity (ton/m 3 ) Results and discussion we observe a more pronounced change in this technique, followed by furrow irrigation. The use of organic mulches does not have any effect when drip irrigation is used, but due to the effectiveness of this technique, it results in attaining a highest maximum AWP with the least irrigation requirement as compared to both the other techniques even when organic mulches are used Irrigation Sprinkler Irrigation and No Mulching Sprinkler Irrigation and Organic Mulching Figure 3.9 Average water productivity of wheat for sprinkler irrigation with two different mulching practices Marginal water productivity Irrigation Furrow Irrigation and No Mulching Furrow Irrigation and Organic Mulching Figure 3.10 Effect of organic mulching on the marginal water productivity of wheat for furrow irrigation Organic mulching has a similar effect as using a better and more efficient irrigation techniques, it does not increase the maximum MWP but rather shifts it a little to the left so it can be achieved with a smaller volume of water. In the case of furrow irrigation, there is a slight decrease in this maximum MWP when organic mulches are used (Figure 3.10) and a slight increase in sprinkler irrigation (Figure 3.11). On the other hand, 20 P a g e
32 Crop yield (ton/ha) Marginal Water Productivity (ton/m 3 ) Results and discussion for drip irrigation, no difference is observed when organic mulches are used but as observed in the case of AWP, the maximum MWP of drip irrigation is still slightly higher and is attained at a lower volume as compared with furrow and sprinkler irrigation (Figure 3.14) Irrigation Sprinkler Irrigation and No Mulching Sprinkler Irrigation and Organic Mulching Figure 3.11 Effect of organic mulching on the marginal water productivity of wheat for sprinkler irrigation When we put all the irrigation technique and mulching practice combinations in one single plot to show the difference in crop yield, AWP and MWP, the following figures are obtained Irrigation Furrow Irrigation and No Mulching Drip Irrigation and No Mulching Furrow Irrigation and Organic Mulching Sprinkler Irrigation and No Mulching Sprinkler Irrigation and Organic Mulching Figure 3.12 Crop yield of wheat for the different irrigation technique and mulching practice combinations 21 P a g e
33 Marginal Water Productivity (ton/m 3 ) Average Water Productivity (ton/m 3 ) Results and discussion Irrigation Furrow Irrigation and No Mulching Drip Irrigation and No Mulching Furrow Irrigation and Organic Mulching Sprinkler Irrigation and No Mulching Sprinkler Irrigation and Organic Mulching Figure 3.13 Average water productivity of wheat for the different irrigation technique and mulching practice combinations Irrigation Furrow Irrigation and No Mulching Drip Irrigation and No Mulching Furrow Irrigation and Organic Mulching Sprinkler Irrigation and No Mulching Sprinkler Irrigation and Organic Mulching Figure 3.14 Marginal water productivity of wheat for the different irrigation technique and mulching practice combinations 22 P a g e
34 Crop yield (ton/ha) Results and discussion Effect of irrigation scheduling on irrigation water saving and maximizing profit Effect of irrigation scheduling on irrigation water saving while keeping the maximum crop yield Irrigation Figure 3.15 Volume of water saved by switching from fully meeting the crop s evaporative demand to partially meeting the demand for furrow irrigation in wheat Appropriate irrigation scheduling plays an important role in irrigation water saving. By switching from the full irrigation in which we irrigate throughout the entire crop development (satisfying the crop s full evaporative demand) to irrigating up to a certain crop development stage (partially satisfying the crop s evaporative demand), a considerable amount of water is saved with no reduction in crop yield whatsoever. This was achieved with adequate knowledge of the drought sensitive stages of the crop development and applying this in the AquaCrop model. The volume of water that can be saved in a given area was calculated for a crop under a specific management practice. Table 3.1 Amount of irrigation water saved using the different management practices for wheat and maize Irrigation technique Furrow Sprinkler Drip Mulching practice Irrigation water saved (m 3 /ha) Wheat Maize No mulching Organic mulching No mulching Organic mulching No mulching Organic mulching Results show that about 1100 and 1500 m 3 /ha of water can be saved for wheat and maize, respectively. The reason why more volume of water can be saved in maize than in wheat is due to the drought resistive nature of maize. Since maize is a C 4 plant, scarcity of water has a lesser impact on it. Effect of irrigation scheduling in maximizing profit by considering price of water When we ignore the price of water and unit price of the yield, then it is always profitable to aim for maximum crop yield. However, when we consider the prices of water and crop then how the profit can be 23 P a g e
35 Results and discussion maximized is not so straightforward. The following table shows for varying prices of water the profitability of producing at maximum crop yield, maximum AWP or maximum MWP. Difference = Revenue Cost (8) where: Revenue = Yield Area Unit price (9) Cost = Irrigation Water Price (10) In this study, an area of 1ha is assumed, the crop yield and irrigation requirement are determined using AquaCrop. For wheat the current unit price is 168 /ton (FAO, 2017). Table 3.2 Revenue-cost calculation for varying prices of water for wheat using furrow irrigation and no mulching Irr (m 3 ) Wheat - Furrow Irrigation & No Mulching Y (ton/ha) AWP (ton/m 3 ) MWP (ton/m 3 ) Revenue ( ) Water Price ( /m 3 ) Cost ( ) Difference ( ) As it can be seen from Table 3.2 using maximum AWP becomes profitable only when the price of water is between and /m 3. When the price of water is more than /m 3, then it is better not to irrigate at all as it will only result in loss. On the other hand, when the price of water is less than /m 3 then it is actually more profitable to irrigate at maximum crop yield as the price of water compared to the price of wheat is very small, hence resulting in a higher profit. Maximizing crop production under scarcity Depending on how much area we irrigate, we can have different possible production values for the same amount of available water. The results for three different amounts of available water for wheat in furrow irrigation with no mulching practice are shown in the following table. The highlighted values indicate the highest possible amount that can be produced for the available water and land. Diff. ( ) Diff. ( ) Diff. ( ) 24 P a g e
 Furrow Irrigation and No Mulching - Wheat Y (ton/ha) MWP (ton/m 3 ) AWP (ton/m 3 ) P (ton) Available water (m 3 ) 6000 10000 12000")
36 Results and discussion Table 3.3 Calculation to determine the maximum production Irr Irr (m 3 /ha) Furrow Irrigation and No Mulching - Wheat Y (ton/ha) MWP (ton/m 3 ) AWP (ton/m 3 ) P (ton) Available water (m 3 ) IL (ha) P (ton) IL (ha) P (ton) IL (ha) From Table 3.3, it can be seen that maximum crop production is not a single point from the CWPF but rather numerous points depending on the amount of water available for irrigation. When the available water is less than the volume of water required to attain maximum water productivity (9557 m 3 /ha in this case), then in order to maximize crop production irrigation should be done to attain maximum productivity but this can only be achieved by irrigating lesser area than what is available. For instance, when we have 6000 m 3 and an area of 1ha, instead of irrigating the whole 1ha which would require 9557 m 3 of water, we can irrigate only 0.628ha and produce tons. On the other hand, when the amount of water available is more than the volume of water required to attain maximum crop yield (10355 m 3 /ha in this case), then in order to maximize crop production we should irrigate all the available land. For example, when the available water is m 3, then we can irrigate at maximum yield to produce tons but this requires an area of 1.159ha which is more than tha available land (1ha). Hence, we irrigate the available 1ha at maximum yield to produce tons. In the case the available water is between the volumes required to attain maximum productivity and maximum crop yield, then we can refer to the CWPF so as to know where exactly we can produce the most. This is summarized in the following figure. Figure 3.16 Heat map showing how crop production can be maximized under scarcity 25 P a g e
37 Production (ton) Irrigated area (ha) Results and discussion The previous heat map shows the measure that should be taken for different values of available water in order to maximize crop production. Next we calculated the irrigated land and respective crop production for a range of available water and the results are summarized as follows: Table 3.4 Irrigated land, crop production and respective crop yield for various amounts of available water AW (m 3 ) IL (ha) P (ton) Y=P/IL (ton/ha) Available water (m 3 ) Figure 3.17 Irrigated land that results in the maximum production for the water and land available From Figure 3.17, it can be seen that as the amount of available water increases the area that can be irrigated also increases linearly. This continues until all the available land is irrigated. Once all the available land is irrigated at maximum crop yield any further increase in the available water will not result in an increase the production as the land has reached its maximum producing potential and there is no more land available to be irrigated Available water (m 3 ) Figure 3.18 Maximum production based on the available land and water Figure 3.18 shows that as the irrigated land increases linearly with the available water so does the production. However, once the maximum production is attained at maximum crop yield any further increase in the available water will not result in an increase in production unless the land that can be irrigated is also increased. 26 P a g e
38 Conclusions 4. Conclusions Water management strategies based on irrigation scheduling are intended to reduce the amount of water applied and to minimize yield reduction due to water stress. This will ensure that water is applied to the crop when needed and in the amount needed. Based on the knowledge of the growth stages and application in AquaCrop model we can conclude that, irrigation from first day of sowing throughout the crop development stage up to field capacity before the soil moisture drops to a threshold where the crop starts to experience canopy cover expansion stress results in the highest yield with the least irrigation requirement. The water management practices implemented included other measures such as altering the irrigation technique and the mulching practice. From the study conducted, we can infer that the maximum crop yield obtained remains the same regardless of the management practices (irrigation techniques and mulching practices) employed; however, the amount of irrigation water required to reach the maximum crop yield is different. This applies for both wheat and maize, the only difference being that the maximum crop yield attained by maize is more than that of wheat. Using drip irrigation resulted in requiring the least amount of irrigation water followed by furrow and sprinkler irrigation, respectively. Using organic mulches reduced the evaporation that takes place reducing the crop s water requirement. However, using organic mulches in drip irrigation has no effect. Similarly, the maximum marginal productivity is unaffected by the different irrigation techniques and mulching practices employed but the irrigation requirement at which the crops reached this maximum varied. With adequate knowledge of crop growth and drought sensitive stages, it is possible to reduce the irrigation volume in order to save about 1500 m 3 /ha and 1100 m 3 /ha of water for maize and wheat, respectively with no reduction in the maximum crop yield whatsoever. This implies that we can reduce the irrigation water by not meeting the full evaporative demand of the crop, but care should be taken to make sure we provide ample water in the drought sensitive stage so that the crop yield will not be compromised. Competition for scarce water resources is already widely evident from the Murray Darling basin in Australia to rivers of the Middle East, southern Africa and the Americas, and from the aquifers of northern India to the Maghreb and the Ogallala in the central US. In addition, with an increase in population arable land is also going to be scarcer. Therefore, in order to maximize our production under such scarcity, we need to consider which resource is scarce. When water is scarce, we should make sure we make every available drop count by producing at maximum water productivity even if we do not irrigate all the land we have available. On the other hand, when the scarce resource is land then we should irrigate at maximum land productivity so we can get the maximum yield and maximize our crop production. We have noticed that AquaCrop has some inherent limitations, such as the neglecting of lateral water flows in the field, the inability to simulate the effects of nutrient limitation, fertilizer application, the effect of organic mulching on the organic content of the soil and decomposition of organic materials, and interception losses from sprinklers. In addition, the model is designed to predict at the single field scale (point simulations), which means the field is assumed uniform without spatial differences in crop development, transpiration, soil characteristics or management; and only green and blue water footprint are considered, gray water footprint is not taken into account. These limitations put a disclaimer on the results of our study, but we believe that the results of this study can provide a useful reference for similar future studies with other models. We see the need for further validation of our model results with field experiments, but this is costly and will generally need to focus on varying just a few management practices under a limited number of cases. 27 P a g e
39 References References Akram, M. (2011) Growth and yield components of wheat under water stress of different growth stages. Bangladesh Journal of Agricultural Research 36(3): Alexandratos, N. & Bruinsma, J. (2012) World agriculture towards 2030/2050: the 2012 revision. Ali, H. (2011) Practices of irrigation & on-farm water management. Springer Science & Business Media. Ali, M. H. & Talukder, M. S. U. (2008) Increasing water productivity in crop production A synthesis. Agricultural Water Management 95(11): Allen, R., Pereira, L., Raes, D. & Smith, M. (1998) Crop evapotranspiration: FAO Irrigation and drainage paper 56. FAO, Rome, Italy 20. Amarasinghe, U. A. & Smakhtin, V. (2014) Water productivity and water footprint: misguided concepts or useful tools in water management and policy? Water International 39(7): Bennett, N. D., Croke, B. F. W., Guariso, G., Guillaume, J. H. A., Hamilton, S. H., Jakeman, A. J., Marsili- Libelli, S., Newham, L. T. H., Norton, J. P., Perrin, C., Pierce, S. A., Robson, B., Seppelt, R., Voinov, A. A., Fath, B. D. & Andreassian, V. (2013) Characterising performance of environmental models. Environmental Modelling & Software 40:1-20. Bessembinder, J., Leffelaar, P., Dhindwal, A. & Ponsioen, T. (2005) Which crop and which drop, and the scope for improvement of water productivity. Agricultural Water Management 73(2): Cabeza, C. E., Kin, A. G., Deblonde, P. M. K. & Ledent, J. F. (1996) Use of Haun's scale for monitoring development of wheat from flag leaf emergence to end of stem elongation. European Journal of Agronomy 5(3-4): Chukalla, A. D., Krol, M. S. & Hoekstra, A. Y. (2015) Green and blue water footprint reduction in irrigated agriculture: effect of irrigation techniques, irrigation strategies and mulching. Hydrology and Earth System Sciences 19(12):4877. Curtis, B. C., Rajaram, S. & Gómez Macpherson, H. (2002) Bread wheat: improvement and production. Food and Agriculture Organization of the United Nations (FAO). Desa, U. (2015) World population prospects: The 2015 revision, key findings and advance tables. Working PaperNo. Di Paola, A., Valentini, R. & Santini, M. (2016) An overview of available crop growth and yield models for studies and assessments in agriculture. Journal of the Science of Food and Agriculture 96(3): Edwards, G. & Walker, D. (1983) C3, C4: mechanisms, and cellular and environmental regulation, of photosynthesis. University of California Press. Elsheikh, E. R. A. (2015) Water Productivity of Sunflower under different irrigation regimes at Gezira clay soil, Sudan.) Wageningen University, CRC Press/Balkema, vol. PhD thesis. FAO (1992) Maize in human nutrition. Rome, Food and Agriculture Organization of the United Nations. FAO (2014) FAOSTAT. Food and Agriculture Organization of the United Nations, Rome, Italy, See FAO (2016) AquaCrop training handbook - Book 1 Understanding AquaCrop. Rome, Food and Agriculture Organization of the United Nations. FAO (2017) Food Price Monitoring and Analysis. FAO, See (accessed June ). Feekes, W. (1941) De tarwe en haar milieu Vets, XVII, Tech. Tarwe Comm, Groningen:560. Fereres, E. & Soriano, M. A. (2007) Deficit irrigation for reducing agricultural water use. Journal of Experimental Botany 58(2): Foley, J. A., Ramankutty, N., Brauman, K. A., Cassidy, E. S., Gerber, J. S., Johnston, M., Mueller, N. D., O connell, C., Ray, D. K. & West, P. C. (2011) Solutions for a cultivated planet. Nature 478(7369): Frija, I., Frija, A., Chebil, A., Cheikh M hamed, H., Speelman, S. & Makhlouf, M. (2014) Marginal Water Productivity of Irrigated Durum Wheat in Semi-Arid Tunisia (10). Haun, J. (1973) Visual quantification of wheat development. Agronomy Journal 65(1): Hoekstra, A. Y. (2013) The water footprint of modern consumer society. Routledge. Hsiao, T. C., Heng, L., Steduto, P., Rojas-Lara, B., Raes, D. & Fereres, E. (2009) AquaCrop-The FAO Crop Model to Simulate Yield Response to Water: III. Parameterization and Testing for Maize. Agronomy Journal 101(3): Kayouli, C., Tesfai, T. & Tewolde, A. (2006) Country pasture/forage resource profiles. Eritrea FAO. 28 P a g e
40 References Kiani, A. R. & Abbasi, F. (2012) Optimizing water consumption using crop water production functions. INTECH Open Access Publisher. Kijne, J., Barron, J., Hoff, H., Rockström, J., Karlberg, L., Gowing, J., Wani, S. P. & Wichelns, D. (2009) Opportunities to increase water productivity in agriculture with special reference to Africa and South Asia. Stockholm Environment Institute, Project Report. Kijne, J. W., Barker, R. & Molden, D. J. (2003) Water productivity in agriculture: limits and opportunities for improvement. Cabi. Landes, A. & Porter, J. (1989) Comparison of scales used for categorising the development of wheat, barley, rye and oats. Annals of Applied Biology 115(2): Lara, M. V. & Andreo, C. S. (2011) C4 plants adaptation to high levels of CO2 and to drought environments. Abiotic Stress in Plants-Mechanisms and Adaptations: Liu, L. Y., Guan, L. L. & Liu, X. J. (2017) Directly estimating diurnal changes in GPP for C3 and C4 crops using far-red sun-induced chlorophyll fluorescence. Agricultural and Forest Meteorology 232:1-9. Loegering, W. Q. (1968) Problems of storing plant disease data for retrieval by automatic data processing machines. Mccraw, D. & Motes, J. E. (1991) Use of plastic mulch and row covers in vegetable production. Cooperative Extension Service. Oklahoma State University. OSU Extension Facts F Mendelsohn, R. & Dinar, A. (1999) Climate change, agriculture, and developing countries: does adaptation matter? The World Bank Research Observer 14(2): Molden, D. (1997) Accounting for water use and productivity. Iwmi. Molden, D. (2007) Water for food, water for life: a comprehensive assessment of water management in agriculture. Earthscan. Ogban, P., Ogunewe, W., Dike, R., Ajaelo, A., Ikeata, N., Achumba, U. & Nyong, E. (2008) Effect of tillage and mulching practices on soil properties and growth and yield of Cowpea (Vigna Unguiculata (L), Walp) in southeastern Nigeria. Journal of Tropical Agriculture, Food, Environment and Extension 7(2): Oweis, T. & Hachum, A. (2006) Water harvesting and supplemental irrigation for improved water productivity of dry farming systems in West Asia and North Africa. Agricultural Water Management 80(1 3): Poole, N. (2005) Cereal growth stages. Grains Research & Development Corporation. Porter, J. & Delecolle, R. (1987) Interaction of temperature with other environmental factors in controlling the development of plants. In Symposia of the Society for Experimental Biology.), vol. 42, pp Qureshi, M. E., Grafton, R. Q., Kirby, M. & Hanjra, M. A. (2011) Understanding irrigation water use efficiency at different scales for better policy reform: a case study of the Murray-Darling Basin, Australia. Water Policy 13(1):1-17. Raes, D., Steduto, P., Hsiao, T. & Fereres, E. (2009) AquaCrop-The FAO crop model to simulate yield response to water: reference manual annexes.). Raes, D., Steduto, P., Hsiao, T. & Fereres, E. (2012) Chapter 3 - Calculation Procedures, AquaCrop Reference Manual, Version 4.0. Food and Agriculture Organization of the United Nations, Rome, Italy. Reeves, T., Thomas, G. & Ramsay, G. (2016) Save and grow in practice: maize, rice, wheat. A Guide to Sustainable Cereal Production (FAO UN, 2016). Salem, B. (1989) Arid zone forestry: a guide for field technicians. Food and Agriculture Organization (FAO). Samarawickrema, A. & Kulshreshtha, S. (2009) Marginal value of irrigation water use in the South Saskatchewan River Basin, Canada. Great Plains Research: Sivakumar, M. V. & Glinni, A. F. (2002) Applications of crop growth models in the semiarid regions. In Agricultural system models in field research and technology transfer.) CRC Press, pp Steduto, P., Hsiao, T. C., Fereres, E. & Raes, D. (2012) Crop yield response to water. FAO Roma. Steduto, P., Hsiao, T. C., Raes, D. & Fereres, E. (2009) AquaCrop The FAO Crop Model to Simulate Yield Response to Water: I. Concepts and Underlying Principles. Agronomy Journal 101: Van Gaelen, H., Tsegay, A., Delbecque, N., Shrestha, N., Garcia, M., Fajardo, H., Miranda, R., Vanuytrecht, E., Abrha, B., Diels, J. & Raes, D. (2015) A semi-quantitative approach for modelling crop response to soil fertility: evaluation of the AquaCrop procedure. Journal of Agricultural Science 153(7): Wichelns, D. (2015) Water productivity and food security: considering more carefully the farm-level perspective. Food Security 7(2): P a g e
41 References Worldometers.Info (2017) World Population: Past, Present, and Future, See (accessed Jan ). Xue, J. & Ren, L. (2016) Evaluation of crop water productivity under sprinkler irrigation regime using a distributed agro-hydrological model in an irrigation district of China. Agricultural Water Management 178: Zadoks, J. C. (1985) A Decimal Code for the Growth-Stages of Cereals. Current Contents/Agriculture Biology & Environmental Sciences(41): Zamir, M. S. I., Javeed, H. M. R., Ahmed, W., Ahmed, A. U. H., Sarwar, N., Shehzad, M., Sarwar, M. A. & Iqbal, S. (2013) Effect of Tillage and Organic Mulches on Growth, Yield and Quality of Autumn Planted Maize (Zea Mays L.) and Soil Physical Properties. In Cercetari agronomice in Moldova.), vol. 46, pp P a g e
42 Appendices Appendices Appendix A Model simulation results Wheat Table A. 1 Summary of results for wheat using furrow irrigation with no mulching Irr E Furrow Irrigation and No Mulching T ET Y (ton/ha) MWP (ton/m 3 ) AWP (ton/m 3 ) Table A. 2 Summary of results for wheat using furrow irrigation with organic mulching Irr Furrow Irrigation and Organic Mulching E T ET Y MWP (ton/h (ton/m 3 ) a) AWP (ton/m 3 ) P a g e
43 Appendices Table A. 3 Summary of results for wheat using sprinkler irrigation with no mulching Irr E Sprinkler Irrigation and No Mulching T ET Y (ton/ha) MWP (ton/m 3 ) AWP (ton/m 3 ) Table A. 4 Summary of results for wheat using sprinkler irrigation with organic mulching Irr Sprinkler Irrigation and Organic Mulching E T ET Y (ton/ha) MWP (ton/m 3 ) AWP (ton/m 3 ) P a g e
44 Appendices Table A. 5 Summary of results for wheat using drip irrigation with no mulching Irr Drip Irrigation and No/Organic Mulching E T ET Y (ton/ha) MWP (ton/m 3 ) AWP (ton/m 3 ) P a g e
45 Appendices Maize Table B. 1 Summary of results for maize using furrow irrigation with no mulching Irr E Furrow Irrigation and No Mulching T ET Y (ton/ha) MWP (ton/m 3 ) AWP (ton/m 3 ) Table B. 2 Summary of results for maize using furrow irrigation with organic mulching Irr Furrow Irrigation and Organic Mulching E T ET Y (ton/ha) MWP (ton/m 3 ) AWP (ton/m 3 ) P a g e
46 Appendices Table B. 3 Summary of results for maize using sprinkler irrigation with no mulching Irr E Sprinkler Irrigation and No Mulching T ET Y (ton/ha) MWP (ton/m 3 ) AWP (ton/m 3 ) Table B. 4 Summary of results for maize using sprinkler irrigation with organic mulching Irr Sprinkler Irrigation and Organic Mulching E T ET Y (ton/ha) MWP (ton/m 3 ) AWP (ton/m 3 ) P a g e
47 Appendices Table B. 5 Summary of results for maize using drip irrigation with no mulching Irr Drip Irrigation and No/Organic Mulching E T ET Y (ton/ha) MWP (ton/m 3 ) AWP (ton/m 3 ) P a g e
48 Appendices Appendix B Crop parameters According to Raes et al. (2009), the recommended values provided for the crop parameters in the tables below represent estimates obtained in calibration-validation exercises of AquaCrop with experimental data. How good these estimates are depends on how extensive and thorough were the calibration and validation, and varies with the crop species listed. The experimental data used for a crop might have been taken in one to many locations, with or without water and temperature as limiting factors, and representing a few to many years of experiments. The notes and symbols before each table provides an indication of the thoroughness of the calibration-validation process with respect to optimal and water stress conditions, as well as with respect to the coverage of major production areas of that crop around the world. Note that if a crop is important in many geographical areas, even if testing with data from four or five diverse locations would not be considered thorough, whereas testing with data from three locations for a crop limited to one geographical area may be considered as adequate. The experiments used for calibration and validation were generally conducted under high levels of management, with the control treatments aimed at production levels close to the maximum potential achievable in that location. All the data used were obtained under conditions of good soil mineral nutrient status. The soil fertility feature of AquaCrop is just beginning to be tested now with data. AquaCrop is a relatively simple model by design, yet suitable for the simulation of most herbaceous species. The decision was made to keep the model simple and more general. The model can be modified to account for some unusual characteristic specific for a particular crop, but to do that for a number of crops each with its own special characteristics would make the model too complex. The user should be aware of this limitation of the model. Examples of such special characteristics are: (1) The cutout phenomenon exhibited by cotton under some conditions, when additional flowers (squares) and young fruits (bolls) no longer form when the fruit load is already large; but once the existing fruits mature and conditions are favorable, new flowers and fruits are produced again. Cutout can be induced by mild to moderate water stress but is simulated only indirectly in a limited way by the model. (2) Low land (flooded) rice can experience substantial variations in the water level of the field. This would determine how much of the canopy is submerged and not transpiring or photosynthesizing, and hence not producing biomass. The model does not consider submergence and assumes only a very small part of the canopy is submerged and this has no effect on transpiration or biomass production. 37 P a g e
49 Appendices Wheat 38 P a g e


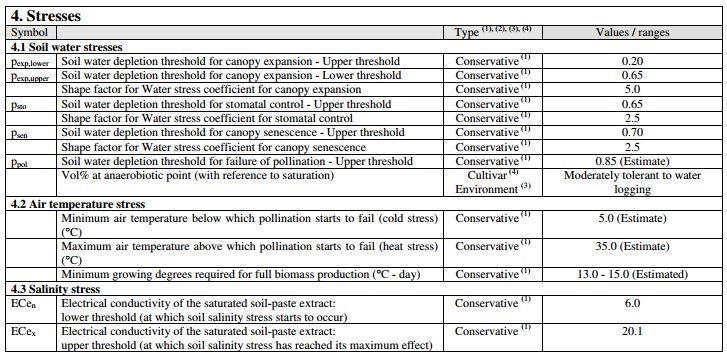
50 Appendices 39 P a g e
51 Appendices Maize 40 P a g e


52 Appendices 41 P a g e
CROP YIELD SIMULATION USING AQUACROP MODEL UNDER RAINFED AND IRRIGATED CONDITIONS
 CROP YIELD SIMULATION USING AQUACROP MODEL UNDER RAINFED AND IRRIGATED CONDITIONS A. Sarangi Water Technology Centre, Indian Agricultural Research Institute Library Avenue, New Delhi 110012 Introduction
Effect of fertilizer strategies on the grey water footprint in rain-fed and irrigated agriculture
 Effect of fertilizer strategies on the grey water footprint in rain-fed and irrigated agriculture SWAT 2015 PULA/SARDINIA/ITALY Researcher: A.D. Chukalla, PhD candidate Supervisor: Dr. M. S. Krol, Associate
May AquaCrop, the FAO simulation model for crop water productivity, irrigation management and hydrologic assessment
 2237-1 Joint ICTP-IAEA Conference on Coping with Climate Change and Variability in Agriculture through Minimizing Soil Evaporation Wastage and Enhancing More Crops per Drop 9-13 May 2011 AquaCrop, the
Abebe D. Chukalla 1, Maarten S. Krol 1, and Arjen Y. Hoekstra 1,2. Correspondence to: Abebe D. Chukalla
 https://doi.org/10.5194/hess-21-3507-2017 Author(s) 2017. This work is distributed under the Creative Commons Attribution 3.0 License. Marginal cost curves for water footprint reduction in irrigated agriculture:
AquaCrop A new model for crop prediction under water deficit conditions - Calibration for potato -
 AquaCrop A new model for crop prediction under water deficit conditions - Calibration for potato - Gabriella IZZI gabriella.izzi@fao.org Centro Internacional de la Papa (CIP) La Molina, Lima, Peru 22 September,
WATER PRODUCTIVITY FOR HYBRID MAIZE UNDER IRRIGATED AGRICULTURE. Chittaranjan Ray, Director Nebraska Water Center, University of Nebraska
 WATER PRODUCTIVITY FOR HYBRID MAIZE UNDER IRRIGATED AGRICULTURE Chittaranjan Ray, Director Nebraska Water Center, University of Nebraska OUTLINE OF TALK Global Food/Feed/Energy Demand The Challenge: Managing
Water Footprint for cotton irrigation scenarios utilizing CROPWAT and AquaCrop models
 European Water 59: 285-290, 2017. 2017 E.W. Publications Water Footprint for cotton irrigation scenarios utilizing CROPWAT and AquaCrop models M. Zoidou, I.D. Tsakmakis, G.D. Gikas * and G. Sylaios Laboratory
FRAMEWORK FOR SYSTEMATIC ANALYSIS OF POTENTIAL WATER SAVINGS IN AGRICULTURE, WITH EMPHASIS ON EVAPORATION, TRANSPIRATION AND YIELD WATER PRODUCTIVITY
 FRAMEORK FOR SYSTEMATIC ANALYSIS OF POTENTIAL ATER SAVINGS IN AGRICULTURE, ITH EMPHASIS ON EVAPORATION, TRANSPIRATION AND YIELD ATER PRODUCTIVITY Theodore C. Hsiao Dept. of Land, Air and ater Resources,
08. WATER BUDGETING AND ITS IMPORTANCE - IRRIGATION SCHEDULING - APPROACHES
 08. WATER BUDGETING AND ITS IMPORTANCE - IRRIGATION SCHEDULING - APPROACHES Water budgeting: Allocation of the water receipt including anticipated within the crop period and its detailed account of expenditure
Crop Water Requirement. Presented by: Felix Jaria:
 Crop Water Requirement Presented by: Felix Jaria: Presentation outline Crop water requirement Irrigation Water requirement Eto Penman Monteith Etcrop Kc factor Ks Factor Total Available water Readily available
On-Farm Water Management. More Crop Production
 On-Farm Water Management towards More Crop Production Dr. Saeed Nairizi Vice President Hon, ICID Presentation on the Strategy Theme (On-Farm) 61st International Executive Council Meeting, 10 16 October
CFT Water Assessment Description
 CFT Water Assessment Description Cool Farm Alliance 2017 For more information, see www.coolfarmtool.org Cool Farm Alliance Community Interest Company The Stable Yard, Vicarage Road, Stony Stratford, MK11
Dirk RAES, Pasquale STEDUTO, Theodore C. HSIAO, and Elias FERERES with contributions of the AquaCrop Network
 AquaCrop Section 2.21 Input files (Chapter 2 Users guide) Section 2.21 of Reference Manual AquaCrop Version 4.0 UPDATE August 2013 Dirk RAES, Pasquale STEDUTO, Theodore C. HSIAO, and Elias FERERES with
AquaCrop. Chapter 2 Users guide. Version 4.0. FAO, Land and Water Division Rome, Italy. Reference Manual June 2012
 Chapter 2 Users guide AquaCrop Version 4.0 Reference Manual June 2012 Dirk RAES, Pasquale STEDUTO, Theodore C. HSIAO, and Elias FERERES with contributions of the AquaCrop Network FAO, Land and Water Division
5.5 Improving Water Use Efficiency of Irrigated Crops in the North China Plain Measurements and Modelling
 183 5.5 Improving Water Use Efficiency of Irrigated Crops in the North China Plain Measurements and Modelling H.X. Wang, L. Zhang, W.R. Dawes, C.M. Liu Abstract High crop productivity in the North China
Chapter 5 Training videos. AquaCrop Version 6.0. Reference manual
 Chapter 5 Training videos AquaCrop Version 6.0 Reference manual March 2017 Chapter 5 Training videos AquaCrop Version 6.0 Reference manual March 2017 By Dirk RAES, Pasquale STEDUTO, Theodore C. HSIAO,
Crop Water Use Program for Irrigation
 Crop Water Use Program for Irrigation Divisions of Plant Sciences, Applied Social Sciences, Food Sciences and Bioengineering, and Soil, Environmental, and Atmospheric Sciences Water is an important factor
IRRIGATION SCHEDULING: KNOWING YOUR FIELD
 INSIGHT SERIES INSIGHTS ON IRRIGATION SCHEDULING: KNOWING YOUR FIELD A critical aspect of farm management is the ability to identify the appropriate timing of irrigation applications to a field and to
CHAPTER 6: Irrigation scheduling
 Pressurized Irrigation Techniques 6.1 CHAPTER 6: Irrigation scheduling Irrigation scheduling is one of the factors that influence the agronomic and economic viability of small farms. It is important for
New Zealand Drought Index and Drought Monitor Framework
 New Zealand Drought Index and Drought Monitor Framework Contents Executive summary... 2 1 Introduction... 3 2 Elements of International Drought Monitors... 3 3 The water balance model... 3 3.1 Potential
Food, Water, and Pawnee County, Kansas. Module 4 Summative Assessment
 Food, Water, and Pawnee County, Kansas Introduction The objective of this assignment is to assess the benefits of more efficient irrigation methods on a farm in Kansas using your knowledge from Module
Series: Irrigation of potatoes IV. Scheduling tools - Atmospheric methods
 Series: Irrigation of potatoes IV. Scheduling tools - Atmospheric methods Article and photos: Prof Martin Steyn, University of Pretoria In previous articles in the series we have discussed the factors
THE DFM CONTINUOUS LOGGING SOIL MOISTURE PROBE -FUNCTIONAL SPECIFICATIONS 2010-
 DFM Software Solutions cc Highly Specialized End-User Applications for the Agricultural Market Tel / Fax: +27 21 904 1154 PO Box 730, Eerste River, Cape Town, 7103 Email: dfm@dfmsoftware.co.za 124 Fairview
Simulation of tea yield with AquaCrop
 Climate Change and the Tea Sector in Kenya: Impact Assessment and Policy Action National Multi-stakeholder Workshop 29-30 April 2013, Naivasha Simulation of tea yield with AquaCrop Dirk RAES, KU Leuven
Thematic Brief 2 Water Productivity
 Thematic Brief 2 Water Productivity Brief prepared for the Entry phase of the project: Strengthening Agricultural Water Efficiency and Productivity on the African and Global Level The Project The GCP/INT/166/SWI
YEAR TO YEAR VARIATIONS IN CROP WATER USE FUNCTIONS
 Proceedings of the 27th Annual Central Plains Irrigation Conference, Colby, Kansas, February 17-18, 215 Available from CPIA, 76 N.Thompson, Colby, Kansas YEAR TO YEAR VARIATIONS IN CROP WATER USE FUNCTIONS
Climate Change Impacts on Rain-fed Agriculture and Crop Yields in the Niger Basin
 Climate Change Impacts on Rain-fed Agriculture and Crop Yields in the Niger Basin Aondover Tarhule and Uvirkaa Akumaga Dept. of Geography and Environmental Sustainability, University of Oklahoma Importance
Development of the Mississippi Irrigation Scheduling Tool-MIST
 Development of the Mississippi Irrigation Scheduling Tool-MIST Sassenrath, G.; Schmidt, A.; Schneider, J.; Tagert, M.L.; van Riessen, H.; Corbitt, J.Q.; Rice, B.; Thornton, R.; Prabhu, R.; Pote, J.; Wax,
AquaCrop. Plug-in program. Reference Manual. AquaCrop plug-in program Version 4.0 updated November 2013
 AquaCrop Plug-in program Reference Manual AquaCrop plug-in program Version 4.0 updated November 2013 November 2013 Developed by Dirk RAES, Pasquale STEDUTO, Theodore C. HSIAO, and Elias FERERES FAO, Land
AquaCrop training handbooks
 AquaCrop training handbooks rainfall atmosphere ETo CO 2 air temperature CC CCpot CCact 1 GDD soil water balance field capacity irrigation rainfall Zr surface runoff evapotranspiration 2 Transpiration
Yield potential, yield gaps, and water productivity
 Yield potential, yield gaps, and water productivity Patricio Grassini Lenny van Bussel Nairobi, June 2012 Overview Yield potential (Yp) and waterlimited yield potential (Yw) Yield gap (Yg) and exploitable
Challenges of Modeling Cropping System Responses and Adaptation to a Variable and Changing Climate
 Challenges of Modeling Cropping System Responses and Adaptation to a Variable and Changing Climate James W. Jones Agricultural & Biological Engineering Department University of Florida Southeast Climate
Field Day - University of Wyoming R&E Center Adams Ranch. Saturday, June 15, Sheridan, WY
 o Why Irrigation Scheduling? o Irrigation Efficiency o Water Use Efficiency (WUE) o Strategies for Irrigation Scheduling o Irrigation Research @ UW o Alfalfa x Irrigation o Limiting Water and Yield WHY
12/12/ General. Crop period and base period Duty and delta of a crop Duty and delta of a crop
 2. 1. General The quantity of water, regardless of its source, required by crop in a given period of time for its normal growth under field conditions. Crop period and base period CWR = ET or CU + application
Operating, Calibrating, and Maintaining Irrigation Systems
 Lesson A7 4 Operating, Calibrating, and Maintaining Irrigation Systems Unit A. Mechanical Systems and Technology Problem Area 7. Agricultural Equipment Systems Lesson 4. Operating, Calibrating, and Maintaining
Use of the FAO CROPWAT model in deficit irrigation studies
 Deficit irrigation practices 17 Use of the FAO model in deficit irrigation studies SUMMARY Dwindling water resources and increasing food requirements require greater efficiency in water use, both in rainfed
Strategies to Maximize Income with Limited Water
 Strategies to Maximize Income with Limited Water Tom Trout Research Leader, Agricultural Engineer USDA-ARS Water Management Research Unit Ft. Collins, CO 970-492-7419 Thomas.Trout@ars.usda.gov The best
ESTIMATION OF EVAPOTRANSPIRATION IN SARDAR SAROVAR COMMAND AREA USING WEAP
 ESTIMATION OF EVAPOTRANSPIRATION IN SARDAR SAROVAR COMMAND AREA USING WEAP BY : RINA. CHOKSI, GOPAL H. BHATTI AND PROF. H. M. PATEL CIVIL ENGINEERING DEPARTMENT, FACULTY OF TECHNOLOGY AND ENGINEERING,
Non-irrigated Irrigated Difference. Early 27.1 bushels per acre 33.8 bushels per acre 6.7 bushels per acre
 University of Missouri Extension G4420, Reviewed October 1993 Editor's note The printed version of this publication includes illustrations. Irrigating Soybeans Diana G. Helsel and Zane R. Helsel Department
Adapting Irrigated Agriculture to Drought in the San Joaquin Valley of California. Dr. James E. Ayars USDA-ARS SJVASC
 Adapting Irrigated Agriculture to Drought in the San Joaquin Valley of California Dr. James E. Ayars USDA-ARS SJVASC Vital Statistics Length - 1239 km Width 402 km Pop. 36,756,666 Economy $1.85 trillion
3.3 AquaCrop parameterization, calibration, and validation guide
 Lead Author Theodore C. Hsiao (University of California, Davis, USA) Contributing Authors Elias Fereres (University of Cordoba and IAS-CSIC, Cordoba, Spain), Pasquale Steduto (FAO, Land and Water Division,
Chapter 11 Feeding the World
 Chapter 11 Feeding the World HUMAN NUTRITIONAL REQUIREMENTS ARE NOT ALWAYS SATISFIED Undernutrition The condition in which not enough calories are ingested to maintain health. Malnourished Having a diet
Simulation of Crop Growth Model for Agricultural Planning
 International Journal of Agriculture and Food Science Technology. ISSN 2249-3050, Volume 4, Number 6 (2013), pp. 553-560 Research India Publications http://www.ripublication.com/ ijafst.htm Simulation
ET-BASED IRRIGATION SCHEDULING
 Proceedings of the 23rd Annual Central Plains Irrigation Conference, Burlington, CO., February 22-23, 2011 Available from CPIA, 760 N.Thompson, Colby, Kansas ET-BASED IRRIGATION SCHEDULING Allan A. Andales
KanSched2. An ET-Based Irrigation Scheduling Tool. October 2006
 KanSched2 An ET-Based Irrigation Scheduling Tool October 2006 Danny H. Rogers and Mahbub Alam Biological and Agricultural Engineering K-State Research and Extension KanSched 2.0 is a program that is designed
Agronomy 406 World Climates
 Agronomy 406 World Climates February 13, 2018 Hydrologic cycle. Team 4 Climate News presentation this Thursday. Review: METED module, Understanding the Hydrologic Cycle Active review session for the midterm
Irrigation & Fertilizer Affects on Productivity, Water Use and N Balance in Rice & Maize Cropping Systems in Telangana Region, India
 Indo-US AKI Project on Sustainable Water Resources Management Irrigation & Fertilizer Affects on Productivity, Water Use and N Balance in Rice & Maize Cropping Systems in Telangana Region, India Dakshina
Agriculture and Climate Change Rural Urban Linkages. Erick Fernandes, Adviser, Agriculture & Rural Development
 Agriculture and Climate Change Rural Urban Linkages Erick Fernandes, Adviser, Agriculture & Rural Development 75% of the world s poor are rural and most are involved in farming In the 21st century, agriculture
COTTON IRRIGATION SOLUTIONS
 COTTON IRRIGATION SOLUTIONS DRIP IRRIGATION SOLUTIONS FOR YOUR COTTON PRODUCTION Rivulis Irrigation 1800 558 009 (Aus) / +61 7 3881 4071 (intl.) www.rivulis.com.au A SOLUTION TO INCREASING YOUR YIELDS...
Africa Adaptation Project Namibia
 Building the Foundation for a National Approach to Climate Change Adaptation in Namibia Africa Adaptation Project Namibia CCA Ambassador Themes 1: Risks, impacts and policy implications Contents 1. Introduction...
Journal of Environment and Earth Science ISSN (Paper) ISSN (Online) Vol. 4, No.3, 2014
 ISSN (Online) Vol. 4, No.3, 2014") Comparison of Crop Water Productivity of Traditional and Hybrid Maize Varieties Zain Ul Abideen, Tahir Sarwar, Muhammad Jamal Khan, Fazli Hameed and Waheedullah Department of Water Management, Faculty
Comparison of Crop Water Productivity of Traditional and Hybrid Maize Varieties Zain Ul Abideen, Tahir Sarwar, Muhammad Jamal Khan, Fazli Hameed and Waheedullah Department of Water Management, Faculty
Water Savings from Crop Residue in Irrigated Corn
 Water Savings from Crop Residue in Irrigated Corn Norman L. Klocke Professor, Water Resources Engineer Kansas State University Garden City, Kansas Voice: 620-276-8286 Fax: 620-276-6028 Email: nklocke@ksu.edu
KanSched An ET-Based Irrigation Scheduling Tool for Kansas Summer Annual Crops
 KanSched An ET-Based Irrigation Scheduling Tool for Kansas Summer Annual Crops Gary A. Clark, Professor Danny H. Rogers, Extension Engineer, Irrigation Steven Briggeman, Extension Assistant Biological
Improve Water Productivity and Climatic Resilience for Agriculture: Chinese Lessons and Outlook
 Improve Water Productivity and Climatic Resilience for Agriculture: Chinese Lessons and Outlook Mei Xurong, Principal Scientist of Dryland Agriculture Director, State Engineering Laboratory for Efficient
CENTRAL PLATTE NATURAL RESOURCES DISTRICT NITROGEN MANAGEMENT CERTIFICATION TEST
 CENTRAL PLATTE NATURAL RESOURCES DISTRICT NITROGEN MANAGEMENT CERTIFICATION TEST NAME: CERT #: ADDRESS: CITY: Section A: The Nitrate Contamination Concern 1) The U.S. Environmental Protection Agency s
Estimating water needs of alfalfa and using ET to schedule Irrigation
 Estimating water needs of alfalfa and using ET to schedule Irrigation D. Zaccaria, R. Snyder, D. Putnam, A. Montazar, C. Little DWR-Funded Project (2014-2017) aiming at Developing updated information on
Irrigation Management for Trees and Vines
 Irrigation Management for Trees and Vines Louise Ferguson LFerguson@ucdavis.edu Department of Plant Sciences University of California Davis Agriculture & Natural Resources University of California Cooperative
Practical Notes for SRI Farmers By: Bancy M. Mati
 Practical Notes for SRI Farmers By: Bancy M. Mati 1 Kenyans Want More Rice The demand for rice in Kenya continues soar as more Kenyans show progressive changes in their eating habits, coupled with urbanization.
Nitrogen Dynamics Feeding the Crops that Feed Us
 Nitrogen Dynamics Feeding the Crops that Feed Us Overview All plants require nitrogen in relatively large amounts and nitrogen is the most commonly limiting nutrient in agriculture. Consequences of insufficient
Role of Climate and Soil in Regulating Water Limitations to Crop Productivity
 Role of Climate and Soil in Regulating Water Limitations to Crop Productivity Enli Wang, Chris Smith 1 May 2012, Vienna CSIRO LAND AND WATER/SUSTAINABLE AGRICULTURE FLAGSHIP Presentation outline Agriculture
WATER CONSERVATION TECHNICAL BRIEFS
 WATER CONSERVATION TECHNICAL BRIEFS TB 15 Drip irrigation and water scarcity SAI Platform June 2012 This document has been produced for internal information purposes only among SAI platform members. It
ISPRS Archives XXXVIII-8/W3 Workshop Proceedings: Impact of Climate Change on Agriculture
 IMPACT ANALYSIS OF CLIMATE CHANGE ON DIFFERENT CROPS IN GUJARAT, INDIA Vyas Pandey, H.R. Patel and B.I. Karande Department of Agricultural Meteorology, Anand Agricultural University, Anand-388 110, India
13. Integrated Water Resource Management for Increasing Productivity and Water Use Efficiency in the Rain-fed Areas of India
 13. Integrated Water Resource Management for Increasing Productivity and Water Use Efficiency in the Rain-fed Areas of India Piara Singh, P Pathak, Suhas P Wani and KL Sahrawat International Crops Research
Water Productivity of Cotton in the Humid Southeast - FAO. AquaCrop Modeling
 Water Productivity of Cotton in the Humid Southeast - FAO AquaCrop Modeling Xin Qiao, Doctoral Graduate Student Clemson University, Edisto Research & Education Center, 64 Research Road, Blackville, SC
Coping with Climate Change Challenges and Potential for Agriculture and Food Security in Arab Countries
 Coping with Climate Change Challenges and Potential for Agriculture and Food Security in Arab Countries Arab Climate Resilience Initiative, UNDP Rabat - Morocco, 3-5 November 2010 Mahmoud Solh Director
IMPACT ANALYSIS: RESULTS FROM TEST SITES. University of Bologna (UNIBO)
") Workshop on Precise Irrigation: The FIGARO Project Bologna 19 July, 2016 IMPACT ANALYSIS: RESULTS FROM TEST SITES Francesco Galioto, Meri Raggi, Parthena Chatzinikolaou, Davide Viaggi University of Bologna
Workshop on Precise Irrigation: The FIGARO Project Bologna 19 July, 2016 IMPACT ANALYSIS: RESULTS FROM TEST SITES Francesco Galioto, Meri Raggi, Parthena Chatzinikolaou, Davide Viaggi University of Bologna
Effect of Irrigation System Basin and Furrow in Saline Distributions Patterns and Productivity Corn (Zea Mays L.)
") IOSR Journal of Agriculture and Veterinary Science (IOSR-JAVS) e-issn: 2319-2380, p-issn: 2319-2372. Volume 9, Issue 5 Ver. II (May. 2016), PP 31-38 www.iosrjournals.org Effect of Irrigation System Basin
IOSR Journal of Agriculture and Veterinary Science (IOSR-JAVS) e-issn: 2319-2380, p-issn: 2319-2372. Volume 9, Issue 5 Ver. II (May. 2016), PP 31-38 www.iosrjournals.org Effect of Irrigation System Basin
CropSyst Modelling Solution. Reference documentation
 CropSyst Modelling Solution Reference documentation Release Issue Date 1 2 September 2013 Copyright European Union, 1995 2013 Reproduction is authorised, provided the source is acknowledged, save where
Private public Partnership and Technological Imperatives for Irrigation Development
 Private public Partnership and Technological Imperatives for Irrigation Development Alemayehu Mengiste Agritec System P.L.C, Addis Ababa, Ethiopia agrsys@ethionet.et Abstract In irrigated agriculture,
Innovations for Improving water use efficiency and agriculture productivity in dry areas
 Innovations for Improving water use efficiency and agriculture productivity in dry areas Global Food Security Challenges Milan Expo, Italy, 7-8 August, 2015 Pre-Conference of ICAE, Co-organized by the
Basic Types of Irrigation Systems. Surface irrigation Subsurface irrigation Sprinkler irrigation Drip/trickle irrigation
 Irrigation systems Basic Types of Irrigation Systems Surface irrigation Subsurface irrigation Sprinkler irrigation Drip/trickle irrigation Subsurface Irrigation Also call subirrigation Artificial regulation
FAO-Rome as a form of technical support to the Global Information and Early Warning System (GIEWS)
") pixabay/17 Country-Level ASIS: an agriculture drought monitoring system Background The Food and Agriculture Organization of United Nations (FAO) has developed an agricultural drought monitoring system
pixabay/17 Country-Level ASIS: an agriculture drought monitoring system Background The Food and Agriculture Organization of United Nations (FAO) has developed an agricultural drought monitoring system
N. AMENZOU(1,*), H. MARAH(1), F. RAIBI(1), J. EZZAHAR(1), S. KHABBA(2), S. ERRAKI, J. Lionel (3)
, H. MARAH(1), F. RAIBI(1), J. EZZAHAR(1), S. KHABBA(2), S. ERRAKI, J. Lionel (3)") 1 : Unité Eau et climat Centre National d Énergie des Science et Techniques Nucléaire, Rabat, Maroc. * amenzou@cnesten.org.ma 2 : Université Cady Ayyad, Marrakech, Maroc 3 : IRD Maroc Isotopic and conventional
1 : Unité Eau et climat Centre National d Énergie des Science et Techniques Nucléaire, Rabat, Maroc. * amenzou@cnesten.org.ma 2 : Université Cady Ayyad, Marrakech, Maroc 3 : IRD Maroc Isotopic and conventional
Impacts of Climate Change on the Semi-Arid Zones
 Impacts of Climate Change on the Semi-Arid Zones Ramadjita Tabo and Pierre C. Sibiry Traore ICRISAT-Niamey and Bamako Presented at the International Workshop on Adaptation To Climate Change in West African
Climate change in the South-West zone: the main agricultural and forest impacts
 Climate change in the zone: the main agricultural and forest impacts Frédéric Levrault, Nadine Brisson, Philippe Pieri, Alexandre Bosc 6 D Regions concerned: Aquitaine Midi-Pyrénées Poitou-Charentes Study
Rashid Ali Khan, FAO (Ret.) Gurgaon, Haryana
 Gurgaon, Haryana") Sustainability and Water Conservation mentioned in the draft strategic plan of DDWS was not provided adequate coverage, though important for improving the supply. In view of the unpredictable rainfall,
Sustainability and Water Conservation mentioned in the draft strategic plan of DDWS was not provided adequate coverage, though important for improving the supply. In view of the unpredictable rainfall,
Insights from Process Based Crop Model, GLAM: Wheat Yield Hindcasts and Projections over Ethiopia
 African Weather and Climate: Unique Challenges and Application of New Knowledge NCAR/UCAR, Boulder Aug. 2, 2011 Insights from Process Based Crop Model, GLAM: Wheat Yield Hindcasts and Projections over
Environmental impact of (olive) irrigation. Luca Testi IAS-CSIC Córdoba
 irrigation. Luca Testi IAS-CSIC Córdoba") Environmental impact of (olive) irrigation Luca Testi IAS-CSIC Córdoba 1 This talk is NOT about the environmental impact of olive growing. Olive growing in general has environmental impacts like any other
Environmental impact of (olive) irrigation Luca Testi IAS-CSIC Córdoba 1 This talk is NOT about the environmental impact of olive growing. Olive growing in general has environmental impacts like any other
Water Resources Engineering. Prof. R. Srivastava. Department of Water Resources Engineering. Indian Institute of Technology, Kanpur.
 Water Resources Engineering Prof. R. Srivastava Department of Water Resources Engineering Indian Institute of Technology, Kanpur Lecture # 13 Today we will continue to discuss some of the abstractions
COMBATING CLIMATE CHANGE AND LAND DEGRADATION IN THE WEST AFRICAN SAHEL: A MULTI-COUNTRY STUDY OF MALI, NIGER AND SENEGAL
 COMBATING CLIMATE CHANGE AND LAND DEGRADATION IN THE WEST AFRICAN SAHEL: A MULTI-COUNTRY STUDY OF MALI, NIGER AND SENEGAL BY PROF. S.A. IGBATAYO HEAD, DEPARTMENT OF ECONOMICS & MANAGEMENT STUDIES AFE BABALOLA
Coping with increased water scarcity: from Efficiency to Productivity
 Coping with increased water scarcity: from Efficiency to Productivity Theib Oweis Director, Integrated Water and Land Management Program, ICARDA, Amman, Jordan Presentation at the 2014 Symposium: Drought
Sensor Strategies in Cotton. Stacia L. Davis, Ph.D. Assistant Professor Irrigation Engineering LSU AgCenter
 Sensor Strategies in Cotton Stacia L. Davis, Ph.D. Assistant Professor Irrigation Engineering LSU AgCenter SDavis@agcenter.lsu.edu 80% 20% Introduction Comparing 2010 to 2014 totals Water Use, 2014 9,295
This project was conducted to support the Netherlands Ministry of Foreign Affair s Inclusive Green Growth aim of increasing water use efficiency by
 October 2016 This project was conducted to support the Netherlands Ministry of Foreign Affair s Inclusive Green Growth aim of increasing water use efficiency by 25% in Dutch financed projects. The project
Potential contribution of advances in photosynthesis to plant productivity and global food production
 POLICY PUBLIC: IDEAS, INSIGHTS AND INITIATIVES TO 2020 Future challenges in food and agriculture: Science informing policy Potential contribution of advances in photosynthesis to plant productivity and
Global Assessment of impacts of climate change on agricultural productivity the FAO GAEZ portal
 Global Assessment of impacts of climate change on agricultural productivity the FAO GAEZ portal John Latham, Gianluca Franceschini Geospatial Coordination Unit (GCU) Climate and Biodiversity Department;
The Green Revolution
 The Green Revolution Since the 1950s, most increases in global food production have come from increased yields per unit area of cropland. This green revolution has been brought about through the development
WATER AND THE HYDROLOGIC CYCLE
 WATER AND THE HYDROLOGIC CYCLE Summary Water is essential for the support of life and can be considered as a fundamental environmental good. Water is needed to support human habitation, grow crops and
Profitability of different management options for Sorghum cultivation in Dodoma, Tanzania
 Profitability of different management options for Sorghum cultivation in Dodoma, Tanzania Prakash N Dixit* * International Crops Research Institute for the Semi-Arid Tropics (ICRISAT), PO Box 39063-00623
Drip Irrigation. Seminar report SUBMITTED TO: SUBMITTED BY:
 A Seminar report on Drip Irrigation Submitted in partial fulfillment of the requirement for the award of degree of CIVIL SUBMITTED TO: SUBMITTED BY: www.studymafia.org www.studymafia.org www.studymafia.com1
SOIL AND THE HYDROLOGIC CYCLE
 GEOLOGY 408/508 SOIL AND THE HYDROLOGIC CYCLE CHAPTER 6 Brady & Weil, Rev. 14th ed. THE HYDROLOGIC CYCLE (FIGURE 6.2) WATER BALANCE EQUATION Watershed - an area of land drained by a single stream system
Water Productivity of Cotton in the Humid Southeast Experimentation
 Water Productivity of Cotton in the Humid Southeast Experimentation Hamid J. Farahani, Ph.D., Water Management Engineer USDA-NRCS East National Technology Support Center. 2901 E. Lee Street, Suite 2100,
Water Management in Horticultural Crops
 CHAPTER 7 Water Management in Horticultural Crops OBJECTIVES After studying this chapter, students will be able to: Learn about water management and various methods of irrigation including micro irrigation
Analysis of Rainfall Variability in Relation to Crop Production in Maun, Botswana
 Analysis of Rainfall Variability in Relation to Crop Production in Maun, Botswana Carly Muir College of Liberal Arts and Sciences, University of Florida The purpose of the study was to analyze patterns
Using Evapotranspiration Reports for Furrow Irrigation Scheduling IRRIGATION MANAGEMENT S E R I E S
 IRRIGATION MANAGEMENT S E R I E S Using Evapotranspiration Reports for Furrow Irrigation Scheduling Danny H. Rogers Extension Agricultural Engineer Cooperative Extension Service Manhattan, Kansas Efficient
Impacts of Climate Change on Food Security
 Climate Change and Food Security Impacts of Climate Change on Food Security Learners Notes This course is funded by the European Union's Food Security Thematic Programme and implemented by the Food and
AquaCrop theoretical and practical training
 AquaCrop theoretical and practical training Day 2 - Climate Johannes Hunink (j.hunink@futurewater.es) Peter Droogers 17-21 Oct-2016, Yerevan, Armenia AquaCrop Conceptual Framework Atmosphere CLIMATE Rain
METHODS OF IRRIGATION BY NAVANITA CHOUDHURY ASSISTANT PROFESSOR RSET
 METHODS OF IRRIGATION BY NAVANITA CHOUDHURY ASSISTANT PROFESSOR RSET CLASSIFICATION OF IRRIGATION METHOD A.Surface Irrigation: Water moves over and across the land by simple gravity flow in order to wet
Effect of irrigation and mulch on maize yield (Zea mays) in southern areas of Bangladesh
 in southern areas of Bangladesh") 2018 Scienceweb Publishing Journal of Agricultural and Crop Research Vol. 6(2), pp. 28-37, June 2018 ISSN: 2384-731X Research Paper Effect of irrigation and mulch on maize yield (Zea mays) in southern
2018 Scienceweb Publishing Journal of Agricultural and Crop Research Vol. 6(2), pp. 28-37, June 2018 ISSN: 2384-731X Research Paper Effect of irrigation and mulch on maize yield (Zea mays) in southern
EFFECTS OF SOWING DATE ON DAYS TO FLOWERING, YIELD AND GRAIN QUALITY OF SORGHUM (Sorghum bicolor L. Moench) IN THE NILE CORRIDOR REGION OF SOUTH SUDAN
 IN THE NILE CORRIDOR REGION OF SOUTH SUDAN") EFFECTS OF SOWING DATE ON DAYS TO FLOWERING, YIELD AND GRAIN QUALITY OF SORGHUM (Sorghum bicolor L. Moench) IN THE NILE CORRIDOR REGION OF SOUTH SUDAN MAJOK A. G. KOK A Thesis Submitted to Graduate School
EFFECTS OF SOWING DATE ON DAYS TO FLOWERING, YIELD AND GRAIN QUALITY OF SORGHUM (Sorghum bicolor L. Moench) IN THE NILE CORRIDOR REGION OF SOUTH SUDAN MAJOK A. G. KOK A Thesis Submitted to Graduate School