So Many Choices: Choosing the Right Business Intelligence Reporting Tool for Your Organization
|
|
|
- Myra Singleton
- 6 years ago
- Views:
Transcription
1 So Many Choices: Choosing the Right Business Intelligence Reporting Tool for Your Organization Barry Markovic IT Convergence Melissa English IT Convergence In today s IT world, there are so many choices to make. What is the right software for our business? What database will best support the company infrastructure? How will we store and maintain the data files? And finally, which reporting tool will give us the flexibility and information we need? Trying to make the right decisions can boggle the mind. In this paper, we discuss the pros and cons of some of the choices that are the most integrated with your Oracle Application reporting needs. Evaluating those pros and cons with respect to your organization s requirements will help you choose the right business intelligence reporting tool for your organization. While there are certainly technical issues involved in selecting and implementing any piece of software, this paper will focus on the functionality of each tool with respect to easily providing useful information. Oracle has supplied several very integrated and focused reporting tools aimed at a specific reporting area such as Financial Statement Generator (FSG), Oracle Financial Analyzer (OFA), and Oracle Sales Analyzer (OSA). Our experience is that FSG is the most widely used of the single reporting area tools. Because of its inherent design to create reports in the accepted Financial Statement Format, FSG is still a good choice for this type of reporting. If a specific financial statement format is not required, we recommend using the other reporting tools covered late in this paper for several reasons. First, FSG, OFA and OSA do not easily allow the integration of data from a variety of the Oracle Applications. Ad Hoc reporting is not a strong point for these tools. Second, they are harder to integrate into the latest information delivery tools such as dashboards. Third, if an organization is using FSG, OFA and/or OSA, it will probably need a more flexible reporting tool which would require maintaining multiple reporting tool environments. This would require more hardware, technical resources, user training, etc. For more flexible reporting tools that can be used across Oracle Application Modules, we will review and compare: 1. Oracle Business Intelligence Discoverer 2. Oracle Business Intelligence Applications 3. Noetix Reporting Tools Overview To some extent, each of these three reporting tools provides similar capabilities from an end user perspective. Canned reports can be scheduled and readily available in various summary or detail formats. A variety of visual displays is also available such as graphs, exception reporting, benchmarking, etc. They can be delivered via traditional paper reports, web display, Excel, and automatically ed. All three tools can provide robust business intelligence reporting in an Oracle Applications environment. Of course, each tool does have pros and cons. Below is a summary of some key features. This summary is based on what we feel is a key strength of the product. With some additional effort, some of the features not checked could be made available. Copyright 2008 by John Barry Markovic and Melissa English
2 Reporting Tool Canned Reports AD Hoc Real Time Dashboards Reporting Reporting BI Discoverer BI Applications Noetix Reporting Tools Business Intelligence Discoverer BI Discoverer is an ad hoc reporting tool that has reasonable report writing functionality. Executives, analysts and even casual end users find it easy to use. BI Discoverer is user-friendly enough that users with no technical background are able to write sophisticated reports through a graphical interface by clicking and dragging items for selection. Although the user interface is different, BI Discoverer is similar in functionality and complexity with Excel and MS-Access. Users can drag and drop row and column headings to manipulate the view and results of the reports, similar to Excel Pivot Tables. Discoverer consists of an Administrative side as well as an End User side. From the administration side of Discoverer, there is a seamless interface between the database and the user called an End User Layer. This helps to manage the data elements used from the existing tables to make that data available to the user without exposing the unused data elements to the user. This helps to reduce the number of null columns available for the reports. The End User Layer has supplied folders from Oracle to help ease the development of table joins. These supplied folders are available to the user based on the user access provided through the security options in the Oracle applications. Security options in the apps can control what the user has the ability to view and report on. For instance, only HR employees can obtain permission to see SSN and other sensitive personal information for the staff. From an End User side, Discoverer has three ways to access the tool; Discoverer Desktop, Plus and Viewer. Discoverer Desktop is accessed thru the client and is used to create and modify workbooks and worksheets. Discoverer Plus is accessed via the web and is used to create and modify workbooks and worksheets. Discoverer Viewer is accessed through the web and is used to only view workbooks and worksheets pre-defined by another user. Regardless of the access method you choose for Discoverer, you will find that Discoverer provides robust functionality in an easy to use GUI interface. Users create a Discoverer Workbook which contains one or more Worksheets. Similar to Excel s Sheets, each Worksheet is a separate report. Typically, worksheets in a workbook are different views of the same data. One Worksheet may display detailed transactions while another Worksheet COLLABORATE 08 Page 2


3 may show transactions summarized by Sales Geography, Product Line, Time Periods, etc. Reports can easily be manipulated to produce targeted data results by using run time parameters, complex data filters and exception reporting. Users can also do on-the-fly custom calculations, totals and percentages. In addition, there is the table and crosstab functionality that has page item pivoting capabilities to make it easy to see the report in many different views without re-creating the report. Below is a sample worksheet report using the Client version. There are Page Items with drop down lists to allow you to select specific dimensions to filter the displayed data (i.e. Cur Mon Year Parameter, User Login Name and Area). The user can select any combination of values from these drop-down lists. The below worksheet is using the cross tabular format which automatically summarizes data by the row and column values. Below is the same report displayed using the Viewer version. It has the web look and feel. Users have less control over fitting the data within a screen but there is a good print format option to produce a printed report or PDF file. COLLABORATE 08 Page 3

 is implemented.")
4 Additional functionality consists of having Business Intelligence Excel spreadsheet add-ins, Business Intelligence Publisher and automated ing of PDF formats of the reports. The BI Spreadsheet Add-in allows users to have their Excel Spreadsheet automatically updated by a Discoverer Query. BI Publisher allows Discoverer Reports to easily be included on the Web such as in a Corporate Portal. The key to making BI Discoverer an effective user tool is in the way the End User Layer (EUL) is implemented. This requires resources with IT experience and knowledge of the Oracle Application relational database model. Oracle does provide an easy to use GUI interface with the Discoverer Administration component. This includes automatically creating Folders from the Oracle Tables and Views in the database using a point and click interface. These Folders are used to select the data that is reported within a Worksheet. Lists of Values, Data Hierarchies and Alternative Sorts are also easy to implement using a click and point interface. User Security and Privileges are also easily implemented with a point and click interface. Security Alerts Applications Dashboard Business Flows Sample Experience has shown that for typical complex reports that need to include data from numerous tables in the Oracle Relational database, creating a SQL script that becomes a Custom Folder is more effective than using the point and click interface. This allows the technical developer creating the folder to use the full functionality of SQL to access the data required. Developers should use the existing Oracle Views as a starting point to create the SQL used in Custom Folders. Unfortunately, rarely does a view provide the exact data needed so an experienced SQL developer COLLABORATE 08 Page 4
5 is required to modify and combine Views and tables into a new SQL script. Another task that should be completed when developing the EUL is to ensure that the data items have names that clearly identify their use in the Oracle Applications. For example, many tables have items with generic names like Name, Attribute 1, Effective Start Date, etc. Changing these names to an easy to understand business description allows users to select the data they need. The EUL even allows a description to be entered for each item that allows even more documentation for users. Creating a well designed EUL is the most time consuming part of implementing a BI Discoverer environment. Luckily, creating the EUL is usually a one time set up process with minor enhancements as new releases of the Oracle Applications are implemented. Once good Custom Folders are developed, creating the actual Worksheet reports is the easy part. BUSINESS INTELLIGENCE APPLICATIONS Business Intelligence Applications provide a set of predefined reports in dashboard format that are immediately available upon installation. The Business Intelligence Applications (BI Applications) are listed below: 1. Oracle Financial Analytics 2. Oracle HR Analytics 3. Oracle Order Management and Fulfillment Analytics 4. Oracle Supply Chain Analytics 5. Oracle Sales Analytics 6. Oracle Service Analytics 7. Oracle Contact Center Analytics 8. Oracle Marketing Analytics 9. Oracle Usage Accelerator Analytics for CRM Each BI Application comes with a set of dashboards. Each dashboard consists of different regions each containing a specific type of content. There are five types of regions: 1. Parameter Region to allow the users to select run time parameters. 2. KPI Region to report on Key Performance Indicators. 3. Graph Region for graphic reporting. 4. Links Region to allow links to other Dashboards, company or external websites, etc. 5. Table Region to provide tabular reports. Below is a sample dashboard with the regions identified. COLLABORATE 08 Page 5

6 The content for a region is based on a report that has more details than the dashboard region. Users are able to drill down from a region to the underlying report. Depending on the report, users may be able to drill into the actual Oracle Application the report is based on. As shown in the following list, BI Applications provide dashboard reporting for many of the Oracle Application modules. 1. Daily Business Intelligence for Customer Support 1.1. Customer Support Management Dashboard 2. Daily Business Intelligence for Depot Repair 2.1. Depot Repair Management Dashboard 3. Daily Business Intelligence for Field Service 3.1. Field Service Management Dashboard 4. Daily Business Intelligence for Financials 4.1. Profit and Loss Dashboard 4.2. Profit and Loss by Manager Dashboard 4.3. Expense Management Dashboard 4.4. Expense Analysis Dashboard 4.5. Funds Management Dashboard 4.6. Payables Management Dashboard 4.7. Payables Status Dashboard 5. Daily Business Intelligence for Interaction Center Center Management Dashboard 5.2. Inbound Telephony Management Dashboard 6. Daily Business Intelligence for istore 6.1. Store Management Dashboard 6.2. Store Top Activity Dashboard 7. Daily Business Intelligence for Maintenance 7.1. Maintenance Management Dashboard 8. Daily Business Intelligence for Marketing 8.1. Marketing Management Dashboard 8.2. Lead Management Dashboard 9. Daily Business Intelligence for Procurement 9.1. Procurement Status Dashboard 9.2. Procurement Performance Management Dashboard 9.3. Procurement Management Dashboard 9.4. Procure-to-Pay Management Dashboard 9.5. Commodity Spend Management Dashboard COLLABORATE 08 Page 6
7 9.6. Commodity Supplier Management Dashboard 10. Daily Business Intelligence for Product Lifecycle Management Product Management - Engineering Dashboard Product Management Dashboard 11. Daily Business Intelligence for Projects Projects Profitability Management Dashboard Projects Operations Management Dashboard Capital Projects Cost Management Dashboard Contract Projects Cost Management Dashboard 12. Daily Business Intelligence for Quoting Quote Management Dashboard 13. Daily Business Intelligence for Sales Sales Forecast Management Dashboard Sales Management Dashboard Opportunity Management Dashboard 14. Daily Business Intelligence for Service Contracts Service Contracts Management Dashboard Service Renewals Management Dashboard 15. Daily Business Intelligence for Supply Chain Customer Fulfillment Management Dashboard Shipping Management Dashboard Inventory Management Dashboard Manufacturing Management Dashboard Product Cost Management Dashboard Plan Management Dashboard Product Revenue Bookings and Backlog Dashboard Warehouse Management Dashboard Transportation Management Dashboard As an example of the dashboards and reports for one BI Application, the following list identifies the dashboards and reports available in the BI Procurement Application: 1. Procurement Status Dashboard a. Unprocessed Requisitions b. Unfulfilled Requisitions 2. Procurement Performance Management Dashboard a. Processed Requisitions b. Fulfilled Requisitions 3. Procurement Management Dashboard a. Non-Contract Purchases b. Contract Leakage c. PO Purchases d. Payables Leakage 4. Procure-to-Pay Management Dashboard a. Manual Invoices 5. Commodity Spend Management Dashboard a. Invoice Amount b. PO Price Savings and Quantity Change c. Contract Utilization 6. Commodity Supplier Management Dashboard a. PO Price Change b. Returns c. Rejections on Inspection d. Receipt Date Exceptions COLLABORATE 08 Page 7
8 Dashboards can be customized as needed but normally the customization would be done by IT technical staff. Each Dashboard can have as many regions as needed to provide the required reporting. Normally, there would be one Parameter Region but there could be multiples for the other region types. There are several key concepts built into the BI Applications Dashboards. Responsibility Identifies the data that a user can access. There are predefined responsibilities along with the capability of creating new ones. Date Parameters Define the time period of the data being reported along with a time period for comparison purposes, such as current month to same month in the prior year. KPI or Key Performance Indicator KPIs are defined for each Dashboard based on accepted best practices. As an example, the KPIs for the Procurement Status Dashboard are used to see what volume of requisitions currently need processing into purchase orders or releases, including how many are processed late (past their expected date) and how long on average they have been in an unprocessed state. The actual KPIs are: Unprocessed Requisition Lines: Number of approved requisition lines that are not canceled, returned, or rejected, that are not on an approved purchase order or release. Unprocessed Requisition Lines Past Expected Date: Number of unprocessed requisition lines where the current date (specifically, the Data Last Updated date that displays at the bottom of each page) is past the Promised Date or Need-By Date on the purchase order or release shipment, or past the Need-By Date on the requisition line, whichever is available. Unprocessed Requisitions Amount: Price * Quantity. Sum of the amounts on each purchase order or release shipment corresponding to each unprocessed requisition line. If the requisition line has not yet been placed on a purchase order, then the requisition line amount (Price * Quantity) is used. Unprocessed Average Age (Days): Number of Days Pending / Unprocessed Requisition Lines. Each Dashboard has a similar set of predefined KPIs available upon installation. There is a key technical consideration when implementing BI Applications. Oracle Materialized Views are used as the source of data. These materialized views must be updated on a scheduled basis. Depending on the organization, this could be daily or even multiple times per day. Incremental updates are used to minimize processing time. For most BI reporting requirements, this snapshot of the data updated on an agreed upon schedule is sufficient. Noetix Tools Noetix Corporation offers Business Intelligence Reporting tools that work well with Oracle Applications. These tools include: Noetix Views Noetix Generator Noetix WebQuery Noetix Answers Noetix Platform o Noetix Dashboards o Noetix QueryServer Noetix Views is a set of custom Oracle Views each designed to provide specific business information. Data items in these views have been set to commonly understood business terms. This includes all of the flexfields an organization uses. The views and their data items are well documented. There is also a list of hints that ask typical business questions and then direct the user to a specific Noetix View to find the needed information. The following screen shots show the on-line Help available in Noetix Views. COLLABORATE 08 Page 8


9 Noetix Available Views Noetix AR Views COLLABORATE 08 Page 9


10 Noetix Views AR Customer Account Summary View Noetix Views AR Customer Account Summary Columns COLLABORATE 08 Page 10


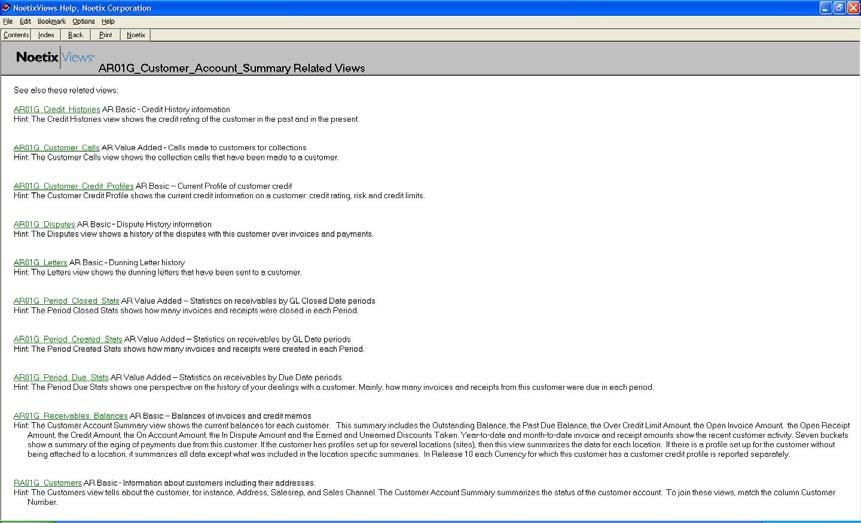
11 Noetix Views AR Customer Account Summary Examples Noetix Views AR Customer Account Summary Hint Noetix Views AR Customer Account Summary Related Views COLLABORATE 08 Page 11

12 The on-line Help included with Noetix Views is the key to enabling users to quickly understand the data available to them. Noetix provides views for the following Oracle Application modules: Oracle Financials Order Management Procurement Projects Discrete and Process Manufacturing Human Resources Payroll Grants Service Noetix Views are the foundation for all of the other Noetix products to easily access the data within Oracle Applications. Noetix Generator uses the Noetix Views to create an EUL within BI Discoverer. This greatly reduces the start-up time for implementing a BI Discoverer environment as most of the EUL is automatically created. It is worth noting that although the views are well designed, there are usually a few business requirements in each organization that require enhancement of specific Noetix views. However, even before these enhancements are made the views can provide much of the required reporting right out of the box. Noetix WebQuery is an ad hoc query reporting tool using a web interface. While the look and feel is different, the basic functionality is very similar to what the BI Discoverer Plus ad hoc query reporting tool provides. Users can easily select data, filter data, use run time parameters, sort and pivot data and create custom calculations. Scheduling reports and interfacing into Excel is also available. Noetix Answers are predefined reports for Oracle Applications that are available out of the box. These reports are customizable so new calculations can be created, filters can be applied, columns can be hidden, etc. Data can be seamlessly integrated into Excel. The following screen shots show how Noetix WebQuery and Noetix Answers work together to deliver reports to users via a web interface. Noetix WebQuery Menu showing available reports (Answers) COLLABORATE 08 Page 12

13 Noetix Answers Sample Report Noetix Platform is an overall platform that integrates the various Noetix components to provide a complete BI Reporting Environment. Components include: Noetix Views Noetix Dashboards Noetix WebQuery Noetix QueryServer Noetix Answers Noetix Platform Some of these components can be installed as standalone solutions but to have the complete BI Reporting capability, Noetix Platform provides the overall technical framework to ensure all of the components work together. Noetix QueryServer is the component within Noetix Platform that manages user queries with respect to the actual sources of data. Users can generate queries that include data from various sources such as Oracle Applications and custom applications both on different hardware platforms. Noetix QueryServer provides the following: 1. Breaks down the original query into the format needed by each separate data source 2. Passes the query to the data source 3. Collects the data from each data source 4. Combines the data from different data sources as needed 5. Delivers the final query data output to the Noetix component requesting it such as Noetix Dashboards or Noetix WebQuery. Noetix Dashboards provide interactive graphical reports with drill down capabilities similar to the dashboards in BI Applications. Noetix provides Dasboards for a variety of business functions including: 1. Accounts Payable 2. Banking 3. Call Center 4. Finance 5. Human Resources 6. Sales 7. Sales & Marketing for Siebel CRM As an example, below is a description of the Financial Dashboards: 1. Financials Dashboards 1.1. CFO Dashboard COLLABORATE 08 Page 13
14 KPIs covering GL, AP, AR and OM. Examples of KPIs are Total Revenue, Total Expenses, EBIT, COGS, Operating Income, Working Capital, Cash on Hand, Total AR, Total AP, Total Cash Receipts and Past Dues The CFO dashboard also provides sample financial reports such as Balance Sheet, Income Statement, Rolling Quarterly Income Statement, Cash Flow, Capital Spending, Equity Analysis and Stock Options Summary Sales Dashboard The contents include Sales by Region by Period, Number of New Customers, Average Order Size and Top/Bottom 5 Products, Top/bottom 5 Sales Persons and DSO. Reports included are Pipeline by Region, Sales and Product Sales Financial Ratios Dashboard Contains major financial ratios used by executives including: Activity Ratios AR Turnover, Asset Turnover and Inventory Turnover Liquidity Ratios Current, Quick, Days Sales in Inventory and Days Sales in Receivables Capital Ratios Debt, Debt/Equity, and Interest Coverage Profitability Ratios ROA, ROE, Average Total Assets, Profit Margin and Earning Per Share Below is a sample Noetix Dashboard with several options that display different data related to the purpose of that Dashboard. Noetix Dashboard Sample Screen 1 COLLABORATE 08 Page 14


15 Noetix Dashboard Sample Screen 2 Noetix Dashboard Sample Screen 3 COLLABORATE 08 Page 15
16 Conclusions and Recommendations All of the tools reviewed in this presentation are good products. They can enhance BI Reporting depending on an organization s requirements. The chart below summarizes some of the key points for each tool. BI Tool Pros Cons BI Discoverer Least expensive No pre-built reports Works well for organizations Creating the EUL requires time and just needing limited BI good technical resources reporting No seamless dashboard capability BI Applications Many canned reports available Many dashboards available Using materialized views will minimize performance impact for Oracle Applications users Noetix Noetix Views make this the easiest option for ad hoc reporting Many canned reports available Many dashboards available BI Tool Comparison Does not access data in real time Set up is more complicated than the other options Multiple vendors Another technology to support COLLABORATE 08 Page 16
17 Choosing the right BI Reporting tool for an organization depends on the reporting needs of that organization. Some organizations may just need some limited ad hoc reporting while other organizations want a complete BI solution. The table below summarizes some recommendations based on the overall reporting requirements. Organization Requirements Ad hoc data access tool for a limited number of data requirements Ad hoc reporting across a number of Oracle Application modules without the need for dashboard reporting Recommendations BI Discoverer with help from technical resources experienced with creating an effective EUL. Noetix Views with either of the following options: 1. BI Discoverer 2. Noetix WebQuery and Noetix Answers Complete BI reporting environment including: 1. Ad hoc reporting 2. Management summary reporting using a Dashboard framework 3. Various Oracle Application Modules The option picked depends on reviewing the canned reports provided by Noetix Answers and determining how well they meet the organization s requirements. One of the following options 1. BI Applications and BI Discoverer 2. Noetix Platform with all of its components The option picked depends on comparing each option s available canned dashboards and reports to the organizations BI Reporting requirements. This requires reviewing the actual reports available in each dashboard for the Oracle Application modules in use. BI Tool Recommendations Of course there are other issues that will influence the BI Reporting Tool decision. These usually involve technical issues and comparable costs. However, these technical issues may not be that significant when compared with the following benefits: 1. Quick implementation of a BI solution to improve immediate decision making. 2. Long term benefits of having a tool that is flexible and allows reporting to easily change as the organization changes. Answering the question of which reporting software is right for you, we can t do. What we have provided in this paper is the overview of each of the most popular reporting tools for your Oracle data. The information herein should assist your decision making process and help you compare the pros and cons against your needs. It is now up to you to determine the best tool, or the best combination of tools, to provide your organization s users with the reporting mechanism they need to be more effective and efficient in their roles. COLLABORATE 08 Page 17
So Many Choices: Choosing The Right Business Intelligence Reporting Tool For Your Organization
 So Many Choices: Choosing The Right Business Intelligence Reporting Tool For Your Organization Barry Markovic IT Convergence Melissa English IT Convergence Overview Which reporting tool will give us the
Welcome to the topic on the analytic content and applications that are made possible in SAP Business One version by running on SAP HANA.
 Welcome to the topic on the analytic content and applications that are made possible in SAP Business One version by running on SAP HANA. 1 At the end of this course, you will be able to describe the reporting
Oracle Business Intelligence Applications. Kostiantyn Stupak
 1 Oracle Business Intelligence Applications Kostiantyn Stupak 2 Business Analytics Span Multiple Disciplines Financial Performance & Strategy Management Supply Chain Analytic Applications Production Planning
General Business Accounting System
 General Business Accounting System We understand that an accounting system is really all about: Better Decision Making As a business grows it becomes more difficult for management to keep up with all the
Oracle Supply Chain Management Cloud: Plan to Produce
 Oracle Supply Chain Management Cloud: Plan to Produce (Includes Manufacturing, Planning, Inventory and Cost Management, Supply Chain Financial Orchestration, and Advanced Fulfillment) What s New in Release
Sage Peachtree Business Intelligence
 Sage Peachtree Business Intelligence Standard Reports Our ready-to-use reports give you immediate insight into and across your business. Delivered in the familiar environment of Microsoft Excel, the reports
Transforming Procurement with Oracle Business Intelligence Cloud Services (BICS)
") Transforming Procurement with Oracle Business Intelligence Cloud Services (BICS) Kshitij Kumar Global VP of BI/EPM and CTO Apps Associates LLC April 09, 2015 Copyright 2015. Apps Associates LLC. 1 Agenda
Transforming Procurement with Oracle Business Intelligence Cloud Services (BICS) Kshitij Kumar Global VP of BI/EPM and CTO Apps Associates LLC April 09, 2015 Copyright 2015. Apps Associates LLC. 1 Agenda
Fusion Accounting Hub Reporting Cloud. Florida OAUG SunCollaborate 2015
 Fusion Accounting Hub Reporting Cloud Florida OAUG SunCollaborate 2015 Anil Patil www.oracle.anilrpatil.com Agenda Why: Why do you need the FAH Reporting Cloud Service? What Challenges does it address?
Migrating to OBI EE? A Simplified Strategy for Oracle E- Business Suite & Discoverer Users
 Migrating to OBI EE? A Simplified Strategy for Oracle E- Business Suite & Discoverer Users Daryl Orts, VP Engineering Technologies Daryl.Orts@noetix.com Agenda Introduction Overview of Oracle BI Suite
Oracle BI 12c: Create Analyses and Dashboards Ed 1
 Oracle University Contact Us: Local: 1800 103 4775 Intl: +91 80 67863102 Oracle BI 12c: Create Analyses and Dashboards Ed 1 Duration: 5 Days What you will learn This Oracle BI 12c: Create Analyses and
Rhonda Stonaker Infosemantics, Inc.
 Rhonda Stonaker Infosemantics, Inc. Professional Background 2 OBIEE Architect at Infosemantics, Inc. Experience with BI solutions for Oracle EBS including R12 since 2002 Experience with Packaged Solutions
Extending the capabilities of Oracle Business Intelligence Applications (OBIA) January 19, 2010
 January 19, 2010") Extending the capabilities of Oracle Business Intelligence Applications (OBIA) January 19, 2010 Agenda Introduction Overview of OBIEE & OBIA How to extend OBIA? Simple Gaps Complex Enhancements Lessons
Extending the capabilities of Oracle Business Intelligence Applications (OBIA) January 19, 2010 Agenda Introduction Overview of OBIEE & OBIA How to extend OBIA? Simple Gaps Complex Enhancements Lessons
Sage 300 ERP 2014 Intelligence Reporting Standard Reports
 Sage 300 ERP 2014 Intelligence Reporting Standard Reports Get a number of ready-to-use reports that give you immediate insight into and across your business. Delivered in the familiar environment of Microsoft
Reporting, Dashboard, and BI
 Product Epicor ERP Benefits XXSimplified and integrated reporting XXBusiness focused trackers and dashboards XXIntegrated budgeting, planning and forecasting XXAdvanced Financial Reporting XXFlexible report
Fusion Accounting Hub Reporting Cloud
 Fusion Accounting Hub Reporting Cloud Anil Patil Director, Oracle Center Of Excellence Business and Application Services anil.patil@us.fujitsu.com www.oracle.anilrpatil.com 0 Copyright 2015 Fujitsu America,
Oracle Project Portfolio Management Cloud
 Oracle Project Portfolio Management Cloud What's New in Release 12 January 2017 Revised: August 2017 TABLE OF CONTENTS REVISION HISTORY... 4 OVERVIEW... 5 Security & New Features... 5 UPGRADE/UPDATE TASKS...
Sage ERP MAS. Everything you want to know about Sage ERP MAS Intelligence. What is Sage ERP MAS Intelligence? benefits
 Sage ERP MAS Everything you want to know about Sage ERP MAS Intelligence What is Sage ERP MAS Intelligence? Sage ERP MAS Intelligence (or Intelligence) empowers managers to quickly and easily obtain operations
DOAG 2012 Applications. Using a KPI driven approach
 DOAG 2012 Applications Optimizing Oracle E-Business Suite Using a KPI driven approach May 8, 2012 Agenda 1. Questions on C-Level 2. Example KPIs 3. Assessment of KPI Results 4. How to build KPIs 1. C-
Data Intelligence and Analytics for Sage 300. An Analytical Framework That Aligns Your Organization For Better Decision Making
 Data Intelligence and Analytics for Sage 300 An Analytical Framework That Aligns Your Organization For Better Decision Making Contents 3 Introduction 4 Solution Overview 5 Data Management and Modeling
Infor CloudSuite Business
 Business Achieve a next-generation business strategy in the cloud Whether you re providing services or moving inventory in your home-town, across the country or around the world with Infor CloudSuite Business,
Oracle Maintenance Cloud
 Oracle Maintenance Cloud Oracle Maintenance Cloud enables effective and efficient maintenance operations. With shrinking margins and declining capital spending, companies need to operate their assets with
Brokers Plus Modules &
 Brokers Plus System Features 1 Brokers Plus Modules & Brokers Plus System Features 2 Functions Brokers Plus System Features 3 Brokers Plus Modules & Functions... 1 1 CRM / Project Mgmt - cptracker Enterprise...
Sage Peachtree Product Overview. New! Sage Peachtree 2012
 Sage Peachtree 2009 2012 Product Overview New! Sage Peachtree 2012 Sage Peachtree is the accurate, easy-to-use accounting software that provides the insights and control you need. With the Sage Peachtree
When the Disco ends you don t need to stop moving Review of the best alternatives to Oracle Discoverer Tim Dickinson
 When the Disco ends you don t need to stop moving Review of the best alternatives to Oracle Discoverer Oracle EBS Reporting post Discoverer Thinking about using a non-oracle product to provide Oracle E-Business
Sage ERP Accpac 6.0A. SageCRM 7.0 I Integration Update Notice
 Sage ERP Accpac 6.0A SageCRM 7.0 I Integration Update Notice 2010 Sage Software, Inc. All rights reserved. Sage, the Sage logos, and all Sage ERP Accpac product and service names mentioned herein are registered
TABLE OF CONTENTS DOCUMENT HISTORY
 TABLE OF CONTENTS DOCUMENT HISTORY 3 UPDATE 18A 3 Revision History 3 Overview 3 Optional Uptake of New Features (Opt In) 4 Update Tasks 4 Release Feature Summary 5 Purchasing 6 Capture One-Time Delivery
DRAFT. Fusion ERP Cloud Service October Oracle Fusion ERP Cloud Service. Magdalene Ritter
 DRAFT Oracle Fusion ERP Cloud Service Fusion ERP Cloud Service October 2013 Magdalene Ritter 1 Copyright 2013, Oracle and/or its affiliates. All rights reserved. The following is intended to outline our
TABLE OF CONTENTS DOCUMENT HISTORY
 TABLE OF CONTENTS DOCUMENT HISTORY 5 UPDATE 17D 5 Revision History 5 Overview 5 Optional Uptake of New Features (Opt In) 6 Update Tasks 6 Feature Summary 7 Demand Management 9 Forecast Unique Demand Segments
munis a tyler erp solution
 munis a tyler erp solution Munis Financial Management Integrated Applications for Powerful Performance 1 A Single Solution That Improves the Way You Work Designed specifically for the public sector, Tyler
BI360 Suite and Dynamics CRM
 BI360 Suite and Dynamics CRM A Solver White Paper Published: November 28, 2017 INTRODUCTION... 3 ADVANTAGES OF BI360 REPORTING FOR MS CRM... 3 BI360 INTEGRATION TO MS CRM... 4 FREQUENTLY ASKED QUESTIONS
Sage 300 ERP Sage CRM 7.1 Integration Upgrade Guide
 Sage 300 ERP 2012 Sage CRM 7.1 Integration Upgrade Guide This is a publication of Sage Software, Inc. Version 2012 Copyright 2012. Sage Software, Inc. All rights reserved. Sage, the Sage logos, and the
QT9 ERP Job Management Software. Compliance. Paperless. User Friendly. Powerful.
 Compliance. Paperless. User Friendly. Powerful. SOFTWARE FEATURES Email Alerting Configure email alerts for inventory level of both your raw materials and your finished goods Outlook Integration Create
QPR ScoreCard. White Paper. QPR ScoreCard - Balanced Scorecard with Commitment. Copyright 2002 QPR Software Oyj Plc All Rights Reserved
 QPR ScoreCard White Paper QPR ScoreCard - Balanced Scorecard with Commitment QPR Management Software 2/25 Table of Contents 1 Executive Overview...3 2 Implementing Balanced Scorecard with QPR ScoreCard...4
Hello and welcome to this overview session on SAP Business One release 9.1
 Hello and welcome to this overview session on SAP Business One release 9.1 1 The main objective of this session is to provide you a solid overview of the new features developed for SAP Business One 9.1
Oracle Financials Cloud
 Oracle Financials Cloud Oracle Financials Cloud offers a broad suite of capabilities designed to empower modern finance and deliver customer success with streamlined processes, increased productivity and
TaiRox Productivity Tools for Sage 300
 Tools for all modules are available for $1495 + $300 per year, a single module's tools for $995 + 200 per year. This product is written as an SDK Application, integrating seamlessly with the desktop, activation
Sage ERP Accpac Online 5.6
 Sage ERP Accpac Online 5.6 Integration Resource Guide for Sage ERP Accpac And Sage CRM (Updated: December 1, 2010) Thank you for choosing Sage ERP Accpac Online. This Resource Guide will provide important
Business Intelligence For. SAP Business One:: SBOeCube
 Flexible, Scalable and Affordable analysis and insight into business performance - Business Intelligence For Real Time Data Exchange: SAP Business One:: SBOeCube Business intelligence is a key ingredient
NETSUITE CRM+ Powerful CRM that Drives the Complete Customer Lifecycle
 NETSUITE CRM+ Powerful CRM that Drives the Complete Customer Lifecycle Today s successful companies are agile and responsive to their customer s needs. Where possible, they ve replaced manual processes
ORACLE UPK PRE-BUILT CONTENT FOR: E-BUSINESS SUITE R12.1
 ORACLE UPK PRE-BUILT CONTENT FOR: E-BUSINESS SUITE R12.1 Oracle s User Productivity Kit (UPK) is a collaborative content development platform that drives end-user and project team productivity throughout
data sheet ORACLE ENTERPRISE PLANNING AND BUDGETING 11i
 data sheet ORACLE ENTERPRISE PLANNING AND BUDGETING 11i Oracle Enterprise Planning and Budgeting provides finance and business managers with the right information and self-service tools to help them understand
Software Feature Sets. Powerful. Flexible. Intuitive. Alight feature sets. Driver-Based Planning & Analytics
 Software Feature Sets Driver-Based Planning & Analytics Powerful. Flexible. Intuitive. Alight Planning is the first spreadsheet replacement that delivers the modeling and reporting power you want within
GADD platform Overview
 GADD platform Overview A GADD White Paper Published January, 2012 gaddsoftware.com Table of content 1. Introduction... 4 2. What makes the GADD platform different?... 4 2.1. How it has evolved... 4 2.2.
Infor VISUAL. Introduction. Statement of direction
 Statement of direction Infor VISUAL Introduction Infor VISUAL continues to change the way that manufacturers especially those who specialize in complex, make-to-order sales tackle the challenges of a global
MS-20466: Implementing Data Models and Reports with Microsoft SQL Server
 MS-20466: Implementing Data Models and Reports with Microsoft SQL Server Description The focus of this five-day instructor-led course is on creating managed enterprise BI solutions. It describes how to
ACCPAC FUNDAMENTALS. 1. It offers powerful analysis and reporting tools for accounting, finance, and auditing endusers
 ACCPAC FUNDAMENTALS A. FEATURES OF ACCPAC SYSTEM ACCPAC System The ACCPAC for Windows Series is a Windows accounting software, which provides a comprehensive business management solution for corporate
Reporting and Dashboards
 Reporting and Dashboards Page i Copyrights 2002-2011 Propertyware, Inc. All rights reserved. No part of this publication may be reproduced, transmitted or stored in any archives without the expressed
ORACLE FUSION FINANCIALS CLOUD SERVICE
 ORACLE FUSION FINANCIALS CLOUD SERVICE THE NEW STANDARD FOR FINANCE KEY FEATURES Innovative embedded multi-dimensional reporting platform Simultaneous accounting of multiple reporting requirements Role-based
NetSuite ERP Consultant Study Guide: April 2018
 1 NetSuite ERP Consultant Exam Study Guide: April 2018 2 Contents About the NetSuite ERP Consultant Exam... 5 Description of a Qualified Candidate:... 5 Maintaining Your Certification... 5 Recommended
Bisan Enterprise. Non Governmental Organizations NGO Professional Edition. A New Dimension in Financial Management Applications
 Bisan Enterprise Non Governmental Organizations NGO Professional Edition www.bisan.com A New Dimension in Financial Management Applications Bisan Enterprise NGO Professional Edition The information you
Sage 100 ERP 2014 Connect your business.
 Sage 100 ERP 2014 Connect your business. The foundation for connecting your business to provide a better customer experience, increase revenue, and make better business decisions New web and mobile functionality:
Welcome to the topic on purchasing items.
 Welcome to the topic on purchasing items. 1 In this topic, we will perform the basic steps for purchasing items. As we go through the process, we will explain the consequences of each process step on inventory
Oracle. Financials Cloud Creating Analytics and Reports. Release 13 (update 17D)
") Oracle Financials Cloud Release 13 (update 17D) Release 13 (update 17D) Part Number E89252-01 Copyright 2011-2017, Oracle and/or its affiliates. All rights reserved. Author: Kathryn Wohnoutka, Sanjay Mall
Oracle Financials Cloud Release 13 (update 17D) Release 13 (update 17D) Part Number E89252-01 Copyright 2011-2017, Oracle and/or its affiliates. All rights reserved. Author: Kathryn Wohnoutka, Sanjay Mall
Sage ERP Accpac. Intelligence FAQ. Revised: August 16, 2010
 Sage ERP Accpac Intelligence FAQ Revised: August 16, 2010 i WHAT IS SAGE ERP ACCPAC INTELLIGENCE? Sage ERP Accpac Intelligence is an exciting new product that empowers managers to quickly and easily obtain
2008 Oracle Corporation
 The following is intended to outline our general product direction. It is intended for information purposes only, and may not be incorporated into any contract. It is not a commitment to deliver any material,
Overview of the BI360 Suite
 Overview of the BI360 Suite A Solver White Paper for BI360 Cloud and Version 5+ Updated: Nov 2017, Document Version 4 Solver, Inc. www.solverglobal.com Copyright 2017 Table of Contents TABLE OF CONTENTS...
How to Work with the Fiori-Style Cockpit
 How-To Guide SAP Business One, version for SAP HANA Document Version: 2.3 2016-08-19 SAP Business One 9.2 PL04 and Later, version for SAP HANA Typographic Conventions Type Style Example Example EXAMPLE
BEING IN THE KNOW - THE POWER OF BUSINESS INTELLIGENCE AND ANALYTICS
 AGC'S Contractor to Contractor Webinar Series: BEING IN THE KNOW - THE POWER OF BUSINESS INTELLIGENCE AND ANALYTICS Nick Persellin, CPA Director of Financial Systems Bay, Ltd. A Berry Company Jon Bruce
Procurement and Spend Analytics
 Atlanta Oracle Applications User Group Procurement and Spend Analytics Customer Case Study Kshitij Kumar & Sravan Daggupati Apps Associates LLC November 20, 2009 Agenda Why BI Apps Welch s Case Study Procurement
The Next Generation of Analytic Apps
 The Next Generation of Analytic Apps Stefan Schmitz VP of Product Management Oracle Analytics October 2, 2017 Copyright 2017, Oracle and/or its affiliates. All rights reserved. Confidential Oracle Internal/Restricted/Highly
Index 99, 625. Master User Guide
 Master User Guide Index A ABC Inventory Processing 364 setup 172 storeroom options 390 ABC Processing running 1073 Abilities adjusting levels 1245, 1251 Access List (Blanket Contract) 944 master 942 Account
NetSuite. The World s #1 Cloud Business Management Suite. Why NetSuite? NETSUITE BENEFITS. Data Sheet. Dramatically Reduces IT Costs
 NetSuite The World s #1 Cloud Business Management Suite Data Sheet NETSUITE BENEFITS Benefits experienced by organizations using NetSuite include 1 : Reduced IT costs by 50% or more Accelerated financial
Which of the following are subareas of the People Integration subcomponent of SAP NetWeaver?
 SAP EDUCATION SAMPLE QUESTIONS: C_TERP10_60 SAP Certified Business Associate with SAP ERP 6.0 print view Disclaimer: These sample questions are for self-evaluation purposes only and do not appear on the
Automating Audit Analytics: The benefits, the concepts and the road to Continuous Auditing
 Automating Audit Analytics: The benefits, the concepts and the road to Continuous Auditing Agenda 1. Why automation for data based audits? 2. What options are available? 3. Automation Considerations 4.
Sage 100 ERP 2015 Intelligence Reporting Standard reports
 Standard reports Get six ready-to-use reports that give you immediate insight into and across your business. Delivered in the familiar environment of Microsoft Excel, the reports are fully customizable
This course explores the options available in the new role-based cockpit available for SAP Business One on HANA.
 This course explores the options available in the new role-based cockpit available for SAP Business One on HANA. 1 At the end of this topic, you will be able to: List the advantages of the new role-based
20466: Implementing Data Models and Reports with Microsoft SQL Server 2014
 20466: Implementing Data Models and Reports with Microsoft SQL Server 2014 Course Outline Module 1: Introduction to Business Intelligence and Data Modeling As a SQL Server database professional, you may
MAS 500. MAS 500 Version 7.0 Pre-Release Guide
 MAS 500 MAS 500 Version 7.0 Pre-Release Guide February 2004 Table of Contents Overview...1 Availability...1 Global Usability Enhancements...1 Distribution Enhancements...2 Manufacturing Enhancements...5
Product comparison: Prophix Enterprise vs. PROPHIX 10 R3
 Product comparison: vs. Prepared by Software Purpose This document is intended for current customers who are considering migrating to. Introduction is an integrated application that is built on an open
Sessions 1-6 and 1-7 Sage 300 CRE: Reconciliation Lab
 Sessions 1-6 and 1-7 Friday, October 13 10:15am 11:45am Room 615AB Friday, October 13 1:00pm 2:30pm Room 615AB Sessions 1-6 and 1-7 Sage 300 CRE: Reconciliation Lab Presented By: Kathy Lewis Kathy Lewis
MAPCON Feature Comparison Chart
 Feature Overview MAPCON Feature Comparison Chart LITE version PROFESSIONAL version Software-as-a-Service (We host it for you) Local Server or Workstation (Runs on your server) Web-Enabled Rich Internet
CMBI. Power BI for Excel training. Business intelligence consultancy CMBI Business Intelligence Services. Advanced Excel. Level 1 Foundations
 2018 Business Intelligence Services Advanced Excel Power BI for Excel training Level 1 Foundations Business intelligence consultancy Introduction to Power BI: Level 1 Course Overview What is Power BI for
Infor Service Management for manufacturing and distribution
 Manufacturing and distribution Infor Service Management for manufacturing and distribution Provide exceptional service Providing fast, responsive service isn t easy especially when your industry is technical,
Sage 100 Contractor Intelligence Reporting Standard reports
 Standard reports Sage 100 Contractor Intelligence Reporting comes with 16 ready-to-use reports that give you immediate insight into and across your business. Delivered in the familiar environment of Microsoft
Activant Prophet 21. Perfecting Your Month and Year End Closing Routines
 Activant Prophet 21 Perfecting Your Month and Year End Closing Routines This class is designed for System Administrators Operation Managers Accounting Managers Objectives Suggested month end and year end
Program Overview and Course Offerings. EAM elearning. Instructor-led online Infor EAM software training
 EAM elearning Instructor-led online Infor EAM software training EAM elearning from SwainSmith is designed for companies on the move that want to get the most out of Infor EAM. With EAM elearning, you get
SAP Analytics Cloud Content
 SAP Analytics Cloud Content Documentation Release Date: December 4, 2017 2016 SAP SE or an SAP affiliate company. All rights reserved. No part of this publication may be reproduced or transmitted in any
A single platform. Your many investment ideas. Comprehensive Alpha Research and Portfolio Management Platform
 A single platform. Your many investment ideas. Comprehensive Alpha Research and Portfolio Management Platform ClariFI, our alpha research and portfolio management platform, provides powerful analytics
ORACLE INVENTORY MANAGEMENT CLOUD
 ORACLE INVENTORY MANAGEMENT CLOUD Intelligent inventory management is crucial to the success of your company. Effectively managing inventory balances, movement, and turnover impacts your bottom line, and
OBI Financial Reporting Quick Start Guide Table of Contents
 Table of Contents About This Document:...1 Overview... 1 1. Accessing the System...2 2. Accessing a Dashboard...3 3. Entering Search Criteria... 4 4. Entering your Selection Criteria... 4 5. Using the
IBM Cognos Express Breakthrough BI and planning for workgroups and midsize organizations
 Breakthrough BI and planning for workgroups and midsize organizations Highlights delivers the essential reporting, analysis, dashboard, scorecard, planning, budgeting and forecasting capabilities that
Enterprise Performance Management Bridging the Gap from Strategy to Operations
 Enterprise Performance Management Bridging the Gap from Strategy to Operations A White Paper by Guident Technologies, Inc. Adam Getz Business Intelligence Architect May, 2007 2007 Guident 1 Summary In
Oracle's new Tax Reporting Ledger - A wellkept
 Oracle's new Tax Reporting Ledger - A wellkept secret White Paper OAUG Collaborate 2008 Hans Kolbe, Celantra Systems hanskolbe@celantrasystems.com (415) 730-1131 February 2008 The following paper documents
TABLE OF CONTENTS DOCUMENT HISTORY
 TABLE OF CONTENTS DOCUMENT HISTORY 4 UPDATE 17D 4 Revision History 4 Overview 4 Optional Uptake of New Features (Opt In) 5 Update Tasks 5 Feature Summary 6 Supply Chain Collaboration 7 Streamline Collaboration
Infor10 EAM v10.1: What's New?
 Infor10 EAM v10.1: What's New? Introduction Kevin Price, Sr. Product Manager Kevin is a more than 14-year veteran of the asset management business at Infor, serving roles in sales, service, product management,
Reporting For Oracle EBS Release 12 Subledger Accounting. Session Id : 13038
 Reporting For Oracle EBS Release 12 Subledger Accounting Session Id : 13038 Introductions Speaker Mohan Pothuri, Director, Product Development About 19 years professional experience; 9+ years with Noetix
Sage 300 ERP 2014 Get more done.
 Sage 300 ERP 2014 Get more done. Get more done by connecting your business, providing a better customer experience, and increasing revenue. New web and mobile functionality: driving better customer experiences
BI360 for Banks. Enabling World-class Decisions for Banks A Solver Vertical Industry White Paper
 BI360 for Banks Enabling World-class Decisions for Banks A Solver Vertical Industry White Paper Updated: Nov 2017, Document Version 4 Solver, Inc. www.solverglobal.com Copyright 2017 Table of Contents
BI360 for Professional Services Companies
 BI360 for Professional Services Companies BI360 Examples from the Professional Services Demo Model A Solver Vertical Industry White Paper Jan 2016 solverusa.com Copyright 2016 Table of Contents Introduction...
Safe Harbor Statement
 Safe Harbor Statement The following is intended to outline our general product direction. It is intended for information purposes only, and may not be incorporated into any contract. It is not a commitment
Oracle. Financials Cloud Creating Analytics and Reports. Release 12. This guide also applies to on-premises implementations
 Oracle Financials Cloud Release 12 This guide also applies to on-premises implementations Oracle Financials Cloud Part Number E73061-03 Copyright 2011-2017, Oracle and/or its affiliates. All rights reserved.
July This Sage product roadmap should be used as a product direction guideline only, and is subject to change at any time without notice.
 1 2 7% 51% Others 15% 4% Intuit 10% SAP 10% Microsoft 10% Oracle Business Management Solutions are our Core Business 14,500 Employees Worldwide 5.7M Customers Worldwide 2.9M Customers North America 40,000
Oracle Fusion Applications Materials Management and Logistics, Outbound Logistics Guide. 11g Release 1 (11.1.3) Part Number E
 Part Number E") Oracle Fusion Applications Materials Management and Logistics, Outbound Logistics Guide 11g Release 1 (11.1.3) Part Number E22711-03 December 2011 Oracle Fusion Applications Materials Management and Logistics,
Oracle Fusion Applications Materials Management and Logistics, Outbound Logistics Guide 11g Release 1 (11.1.3) Part Number E22711-03 December 2011 Oracle Fusion Applications Materials Management and Logistics,
You can easily view comparative data and drill through for transaction details.
 analyzing financial and operational information (such as number of sales reps, occupancy rates or cycle time), giving you a very powerful business management tool that leverages your financial data. You
Distributed Order Orchestration Overview. Oracle Team
 Distributed Order Orchestration Overview Oracle Team Safe Harbor Statement The following is intended to outline our general product direction. It is intended for information purposes only, and may not
What 's new in Sage 300 ERP 2012 [V.6.1]?
![What 's new in Sage 300 ERP 2012 [V.6.1]?](/thumbs/79/79578575.jpg "What 's new in Sage 300 ERP 2012 [V.6.1]?") -1- What 's new in Sage 300 ERP 2012 [V.6.1]? System Manager Multi-company License open multiple company databases from the Sage 300 ERP Desktop or from the portal. (Same user login on the same machine,
-1- What 's new in Sage 300 ERP 2012 [V.6.1]? System Manager Multi-company License open multiple company databases from the Sage 300 ERP Desktop or from the portal. (Same user login on the same machine,
The XA Update and Solve Problems Conference! ** Description of the Sessions by Topic and Room **
 The XA Update and Solve Problems Conference! ** Description of the Sessions by Topic and Room ** GENERAL and TECHNICAL Topics and Sessions in the Grand Room 8:30 9:50 Main Tent Sessions (for All Attendees)
Sage 200c Commercials Datasheet
 Sage 200c Commercials Datasheet Sage 200c Commercials automates the delivery of your customer orders with effective stock management. By responding to product and pricing demands quickly and effectively
accountsiq Cloud Accounting for Group Companies: Consolidated Accounts
 accountsiq Cloud Accounting for Group Companies: Consolidated Accounts accountsiq Gain immediate insights into your Group s performance accountsiq is a Cloud based international accounting system continuously
Enterprise Performance Management
 Enterprise Performance Management Improve Agency Financial Compliance and Deliver Actionable, Accurate Financial Reporting Oracle Public Sector EPM Team 5.9.2013 Safe Harbor Statement