Montana Spatial Analysis Project
|
|
|
- Eugene Wheeler
- 6 years ago
- Views:
Transcription

1 Montana Spatial Analysis Project Montana Department of Natural Resources and Conservation December 2006
2 Table of Contents Executive Summary... 2 Stewardship Analysis Project (SAP) Introduction... 5 SAP Implementation... 5 Stewardship Potential Suitability Analysis... 7 Data Layer Development... 8 Forest Resource Richness Private Forestland Forest Patches Riparian River Areas Wetlands Slope Proximity to Public Lands Priority Watersheds Public Water Supply Threatened and Endangered Species Forest Productivity Forest Resource Threats Wildfire Risk Forest Health (Insects and Diseases) Development Level Analysis Masks Forest stewardship potential on critical private lands Forest stewardship potential on critical private forestlands mask Forest stewardship potential on critical private non-forestlands Forest resource richness and forest resource threats Weighting Overlay Analysis Final Classification Analysis Results Appendices Appendix A: Final Maps Appendix B: Documentation and Metadata
3 Executive Summary Montana Department of Natural Resources and Conservation (DNRC) conducted an assessment of critical private forestland in Montana in This state-wide assessment was accomplished using geographic information system (GIS) analytic techniques and involved developing three spatial layers Forest Resource Richness, Forest Resource Threat, and Critical Private Forestland. Results of the analysis will be used to direct the future education and technical assistance activities and may be used to demonstrate the value of forests and forestry on the regional economy, environmental health, and quality of life. This analysis provides insight where future stewardship education and technical assistance opportunities may be most beneficial. It also captures where past activity (i.e. forest Stewardship management plans) has occurred. The project began in July, 2006, and ended in November, with approval by the Montana Forest Stewardship Steering Committee (MFSSC). A subcommittee of this group met several times with the consultant and DNRC staff and made final adjustments in the model weighting and evaluated results throughout the state. Montana has significant public land acres, primarily in larger contiguous blocks of National Forests in Western Montana, and in some blocks, but primarily scattered sections of Bureau of Land Management lands in Eastern Montana. Approximately 20 percent of the total acreage in Montana is west of the Continental Divide and 80 percent is east of the divide. This geographic split, coupled with the predominant pattern of public lands and industrial forest lands (which were excluded from this analysis) had a large influence on the acreage distribution of the ordinal classification (high, medium and low stewardship potential) applied to Montana SAP. Non forested lands that were still judged as having stewardship potential on critical private lands dominated the total acreage of analysis. Stewardship potential in Montana is defined by NIPF acreage that is prioritized for education and technical assistance. The final results for critical forest stewardship potential on critical private lands indicated there were slightly more than 25 million acres of stewardship potential in Montana, with approximately 2.7 million acres holding high potential. About 21 million acres were low potential, primarily currently non-forested lands east of the Continental Divide. Slightly more than 1 million acres of lands with stewardship potential were on currently nonforested lands. In public land survey sections of land with existing stewardship plans on nonindustrial forest ownership parcels, 204,553 acres were on high potential areas, and 407,174 were on low potential lands. Certain areas of Montana forests are undergoing rapid change due primarily to population growth and subsequent expansion from development. This is resulting in a fragmentation of both our forests and forest management potential, which together are weakening the state s competitiveness in the regional and global marketplace. In addition, it is increasingly difficult to promote sound forest management as non-industrial private forest (NIPF) landowners are steadily increasing in number and their individual ownership parcel size are becoming smaller. This challenge is exacerbated by weak funding, shifting priorities, and greater demands for accountability. Key stakeholders, forest resources, and threats to the resource vary across the state. Because of this variation, information designed to portray the region must be developed with an understanding of the differing pressures within Page 2
4 the region. DNRC does not have a source of information that adequately shows the pattern and distribution of critical forestland. This Assessment provides this understanding and a strong foundation for better forest management decisions. The consumers of the Assessment include DNRC state forestry agencies staff, and USDA Forest Service (USFS) regional and national programs. The Assessment results in GIS layers and maps showing forest resource richness and threat on a State-wide basis, with enough detail that sub-county assessments are meaningful. The merging of resource richness and resource threat show the distribution of critical (or priority) forestland. Not only do the results of the analysis provide a new way to describe the region s distinctiveness, they can be used to inform policy makers, stakeholders and concerned groups, as well as empower the region to communicate its distinctiveness and better quantify its management challenges. Knowing where the forest resources are, where they are most vulnerable, and where they are most valuable will be indispensable as the DNRC positions itself as the lead stakeholder of forestry issues in the region. The Assessment can help meet the challenge of diminishing funds and increasing customer base by facilitating strategic outreach. Because there is limited capacity to promote forest management to landowners, it is more effective to focus energy in places where it will provide the highest return. In addition, as Montana develops its strategy for market competitiveness, it will need to know where the opportunities lie to sustain its most valuable and lucrative assets. The state-wide Assessment will be invaluable for the DNRC as it strives to sustain healthy, productive forests, and protect the economic viability of its private forests. The Assessment analyzes where best to focus forest management resources, and therefore is a perfect complement to the Montana Wildfire Risk Assessment (MWRA), whose output will help focus fire suppression, prevention, and mitigation resources. These two data sets together will empower the region to market its identity more comprehensively. The resulting output will be useful and relevant at many spatial scales, from regional down to sub-county. As a result, the model outputs will help Montana address critical resource management issues within each state, be it with state and county policy makers or as a tool for agency foresters. A GIS modeling methodology has already been developed to identify resource richness and resource threat on non-industrial private forestland as part of the Spatial Analysis Project (SAP) of the Forest Stewardship Program. The USFS developed the SAP model primarily to address the efficacy of Forest Stewardship Plans and to promote strategic program delivery. DNRC recognizes additional benefits beyond meeting the standard goals of the project. Spatial analysis can assist states in managing their Private Forest Programs and can help as an analytical tool when addressing forest policy issues. A national objective was to have a country wide analysis completed state by state. Participating states are being asked to use a given set of 11 data layer themes and to follow an establish set of procedures and standards for displaying results. States have the freedom to add additional GIS data layers needed to describe local conditions, and to weight each data layer to best reflect is level of importance. Montana used one additional layer Forest Productivity. The standard data layers themes include: Riparian Corridors, Forest Patches, Public Water Supply Areas, Priority Watersheds, Threatened & Endangered Page 3
5 Species, Proximity to Public Forestlands, Wetlands, Topographic, Wildfire Risk, Insect and Disease Risks, and Development Risk. Montana DNRC worked with the MFSSC in establishing weighting factors for each data layer. These data layers and weighting factors focus on NIPF issues. The analysis provides a priority value for each 30 meter by 30 meter piece of non-industrial private forest land across the state. These cells were then grouped into high, medium, or low categories. The Montana weighting strategy included differences from the National model, and differences with other states that have completed their SAP analysis. Tree farms, for instance were considered in Colorado, but were not applied in Montana. Page 4
6 Stewardship Analysis Project (SAP) Introduction, Purpose & Background USDA-Forest Service and state forestry agencies have a long standing partnership that began in the late 1940s promoting the protection and improvement of private forestland. Current efforts are defined in the Cooperative Forestry Assistance Act of 1978 and create the Forest Stewardship Program (FSP) of 1990 as the primary tool for assisting family and other non-industrial forest landowners. The focus of this Spatial Analysis project is to assist the Forest Service and state forestry agencies in the administering and monitoring of FSP. Montana DNRC fully supports a national spatial analysis effort. The FSP has been very successful as a national program in promoting sustainable forest management. Comparing today s national and state strategies for assisting NIPF landowners with those of 1990 when FSP was first introduced clearly demonstrates the evolution of the program. Multi-resource management planning is now an accepted standard. It is by far the exception, that timber production is the primary goal when considering forest planning. Efforts such as spatial analysis strengthen the FSP and other assistance efforts, and benefit landowners, states, and the nation. NIPF landowners are defined as private individuals, group association, corporation, Indian tribe or other private legal entity. These lands may have existing forest cover or may be suitable for growing trees. Forestland was identified using the National Land Cover Database (NLCD) The USDA-Forest Service Northeast Area, in partnership with four state forestry agencies, developed a GIS process for mapping lands eligible for the FSP, prioritizing them, and overlaying these lands with existing forest stewardship plans. After these four states completed their spatial analysis project in , the Forest Service offered incentive grants to several Western states in order to complete spatial analysis projects. In 2005 Montana received a grant to initiate the analysis on a statewide basis. The Initial scoping of the SAP process was coordinated through the Montana Forest Stewardship Steering Committee (MFSSC). For the purpose of this exercise, Forest Stewardship potential was defined as NIPF acreage that would benefit most from education and technical assistance. Through a series of work sessions, 13 overall data sets were selected and individually evaluated for their specific application to the Montana SAP. At several milestones in the analysis process, the group reconvened to assess whether the process was heading in the correct direction. During these discussions there were several modifications made to data set structure and its relation to the overall project. Each of these modifications are covered in individual data set summaries. SAP Implementation The SAP will provide Montana with the ability to track and display FSP activities over a statewide landscape now and in the future. Through continual GIS analysis, resource data dealing with multiple issues can be mapped and planned. The Montana FSP will benefit from knowing more about the actual location of stewardship plans across the landscape, and identify potential opportunities where individual landowner planning can address key larger scale resource needs. SAP will also assist regional and national FSP managers to address program effectiveness and public funds accountability. Page 5
7 The FSP Spatial Analysis Project (SAP) is an effort to provide a consistent methodology across the country to evaluate and prioritize natural resource issues, and at the same time offer states the ability to customize collection and analysis of pertinent spatial data. The analysis will provide insight into: Important forest lands (rich in natural resources, vulnerable to threat, or both); Existing stewardship tracts (properties under management plans); and Areas of opportunity to focus future FSP efforts (stewardship potential). Montana s SAP will also address the following questions, as they relate to the FSP: Where are the state s NIPF lands? Where are the management plans? Where are the state s priority NIPFs (those lands of highest potential to benefit from active forest management)? What percentage of existing NIPF management plans are on the state s priority family forest lands? Are there opportunities to implement forestry education or technical assistance to increase forest management activities in high priority areas? With additional GIS data layers, spatial analyses can also be used to: Assess program effectiveness in serving state-identified critical resource management needs. Relate factors such as completed cost/share practices, landowner activities, and monitoring data to help determine program strategies and effectiveness. Establish future practices that can improve effectiveness in addressing priority needs based on landscape scale resource issues. Determine the economic, environmental and social importance of NIPFs. Provide additional information and clarity when addressing a broad range of forest policy issues. There are three primary directions that will evolve out of Montana s SAP. Development of a historic management plan database and associated geo-referenced map of existing forest stewardship plans. We would like to see statewide Tree Farm plans and conservation easements integrated in the future. Assessment of how the state can use the results of these analyses to guide future landowner assistance activities in conjunction with other NIPF programs. Recommendations for modifying the future spatial analysis efforts to evolve with the current FSP. Page 6
8 Stewardship Potential Suitability Analysis The state-wide stewardship suitability analysis is comprised of thirteen common data layers, and an analysis mask. The layers are divided into four categories: forest resource richness, forest resource threats, critical private forest and non-forest land with stewardship potential, and analysis masks. Forest Resource Richness Private forestland Forest patches Riparian river areas Wetlands Slope Proximity to public lands Priority watersheds Public water supply Threatened and Endangered Species Forest Productivity Forest Resource Threat Wildfire risk Forest health (Insects and diseases) Development level Critical Private Forestland (all input layers) Private forestland Forest patches Riparian river areas Wetlands Slope Proximity to public lands Priority watersheds Public water supply Threatened and Endangered Species Forest Productivity Wildfire risk Forest health (Insects and diseases) Development level Analysis Masks Forest and non-forest land cover Public land, private lands and large corporate forest land Page 7

9 Data Layer Development The thirteen data layers used for this analysis are described in the following section. The weighting scheme for the layers is shown in Figure 1. Twelve of these layers were mandated by the federal SAP requirements. The 13 th layer was added within the SAP flexibility scope, to localize the process for Montana. The MFFSC SAP subcommittee ranked the 13 layers based on relative importance for delivering stewardship education and technical assistance. Figure 1 SAP Data Layers with Weighting Forest Resource Richness 1. Private Forestland The private forestland layer was created by combining forest cover with private lands in Montana, as described in detail in the Analysis Masks section of the report. The forest stewardship potential on critical private lands mask was the source for this map layer. The forest cover used in this project was extracted from the National Land Cover Dataset (NLCD). The 1992 NLCD was derived from early to mid-1990s Landsat 5 Thematic Mapper satellite data and is a 21-class land cover classification scheme applied consistently over the United States. The spatial resolution of the data is 30 meters. NLCD is provided on a state-wide basis. Based on input from the MFSSC subcommittee, the NLCD shrub layer was excluded from the forest classification, unlike the approach that Colorado took in their SAP program. Page 8

10 The forest cover layer was derived by combining four NLCD classes: Deciduous Forest Evergreen Forest Mixed Forest Woody Wetland Private lands were derived from the Montana stewardship layers provided by two state agencies, and supplemental corporate forest land ownership provided by DNRC, as described in detail in the Analysis Masks section of the report. The final input grid included a grid value of 1 for private forestland and a 0 for all public and large corporate lands, with a weighted overlay value of 15 percent. 2. Forest Patches The forest patches layer was derived from the private forestland layer and the state-wide road grid. The goal of the forest patches layer was to determine a minimum patch size and place emphasis on management of these areas. Roads create discontinuities in forest cover and reduce forest patch size for some wildlife species. The latest Montana Department of Administration Information Technology Services Division (ITSD) transportation framework dataset was used for road delineation. This is the best compendium of roads and transportation infrastructure in the state, and represents the best available sources from the Montana Department of Transportation (MDT), local counties, Census Tiger files, and the U.S. Forest Service (USFS) road networks. All road classes in the statewide transportation layer were used in the development of this layer. A road grid, with 30 meter cell size, was created directly from the vector road features in the transportation framework dataset. The road grid was then used as a mask to cut out the forest areas from the private forestland layer. This resulted in a forest patches layer of areas equal to or greater than 100 acres. Initial specifications set up by the planning committee called for roads to be buffered by type: 100 feet for interstates, 55 feet for state and federal highways, and 38 feet for all other roads. But, because the analysis layers were 30 meter cell grids, it was impossible to use the desired buffers. Buffering the linear roads and then creating grids from the buffer polygons, created undesired breaks in the road corridor continuity. Also, it was impossible to exactly replicate 38 ft., 55 ft., or 100 ft. buffer polygons with 30 meter cells. However, creating a road grid with 30 meter cell size directly from the vector road features maintained the continuity of road corridors and approximated a buffer zone along the roads. The grid representation of a linear feature (i.e. roads) resulted in buffer zones ranging from about 0 to over 120 feet on one side of the linear element, but continuity was maintained when using the FOUR option with the ESRI regiongroup routine. Using FOUR prevented cells that only have adjacent corners from being assigned to the same group, so it did not connect forest patches on opposite sides of a road. Page 9
 National Hydrography Dataset (NHD).")
 are composed of network connectivity lines overlaying polygons in the NHD water bodies.")
11 Final input grid included a grid value of 1 for forest patches and a 0 for all other areas, with a weighted overlay value of 7 percent. 3. Riparian River Areas Riparian river areas were identified in the U.S. Geological Survey (USGS) National Hydrography Dataset (NHD). All perennial streams and major rivers in the NHD were buffered by 300 feet on each side. Some stream segments that were coded perennial (such as portions of the Clark Fork River) are composed of network connectivity lines overlaying polygons in the NHD water bodies. These lines assist in maintaining connectivity of the stream routes through those water bodies. These segments that pass through lakes were removed from the perennial stream data. The resulting perennial streams and rivers were buffered by 300 feet, and converted to a grid with grid value = 1 for riparian corridors and 0 or non-riparian areas. The final input grid included a grid value of 1 for riparian areas and a 0 for all non-riparian lands, with a weighted overlay value of 6 percent. 4. Wetlands Wetlands were identified in the National Wetland Inventory (NWI) data maintained by the U.S. Fish and Wildlife Service (USFWS). The inventory has only been completed for a portion of Montana. For areas not covered by NWI, the wetlands data from NLCD was used. The features in the NWI were split into riparian and wetlands, and only the wetlands classes were merged, forming this layer (the riparian codes PSSA, PSSB, PSSC, PUSA, PUBG and PUSC were excluded from this layer). The final input grid included a grid value of 1 for wetlands and a 0 for all other lands, with a weighted overlay value of 3 percent. 5. Slope The slope layer was used to highlight ease of operability for forest harvesting operations, which contribute to productive forests more likely to remain forest. Similarly, this layer can be used as an indicator of the site s erodibility. The statewide 30- meter digital elevation models (DEM) from the Montana State Library Natural Resources Information System (NRIS) was used to develop a Page 10


12 topographic slope layer with slopes classified into those ranging from 0 40 percent. The forest stewardship potential on critical private forestlands mask was used to select only slope values for the areas that fall within private forest lands. The final input grid included a grid value of 1 for all lands with slope less than 40 percent on private forestland and a 0 for all other lands, with a weighted overlay value of 3 percent. 6. Proximity to Public Lands The proximity to public lands layer was created by combining a ½ mile buffer of public lands of those public lands that were at least 10 percent forested (based on the NLCD forest cover layer). The public lands layer was developed as described in detail in the Analysis Masks section of the report. The final input grid included a grid value of 1 for all lands in proximity to forested public lands and a 0 for all other lands, with a weighted overlay value of 8 percent. 7. Priority Watersheds The priority watersheds layer was derived from the U.S. Environmental Protection Agency (EPA) data on impaired water locations. These data are based on the Clean Water Act Section 303(d) lists that show water quality standards impairment or threats to the attainment of beneficial uses or anti-degradation provisions. The 303(d) list includes five categories: Category 1: Waters for which all applicable beneficial uses have been assessed and all uses are determined to be fully supported. Category 2: Waters for which those beneficial uses that have been assessed are fully supported, but some applicable uses have not been assessed. Category 3: Waters for which there is insufficient data to assess the use support of any applicable beneficial use, so no use support determinations have been made. Category 4: Waters where one or more beneficial uses have been assessed as being impaired, fully supporting but threatened, all TMDLs are completed but impaired beneficial uses have not yet achieved fully supporting status, or impaired and TMDLs are not required: Category 5: Waters where one or more applicable beneficial uses have been assessed as being impaired or threatened, and a TMDL is required to address the factors causing the impairment or threat. Category 4 or 5 water features were selected as the map source for priority watersheds for the SAP process. The 6 th code watershed units (HUC) with an impaired water location were selected as the unit of analysis. These two layers were intersected and the 6 th code watersheds with category 4 or 5 impaired waters were selected as priority watersheds. Page 11


13 Both the federal Clean Water Act (CWA) and the Montana Water Quality Act require an ongoing program of water quality assessments and reporting as part of a process intended to protect and improve the quality of rivers, streams, and lakes in the state. The 2006 database update was not yet completed when this SAP analysis was conducted. As a result the data is based on 2004 data, the latest available data set. Final input grid included a grid value of 1 for priority watersheds and a 0 all other watersheds, with a weighted overlay value of 7 percent. 8. Public Water Supply The public water supply layer included community surface water intake locations, from the Source Water Protection database maintained by the Source Water Protection Program of the Montana Department of Environmental Quality (DEQ). The 5 th code watershed HUCs with a community surface water intake location were selected based on an overlay of the intake points on the GIS watershed layer. Any watershed polygon that had one or more intakes, regardless of type of intake or vulnerability, was selected. This database was maintained to help the Source Water Protection Program track the status and progress in completing Source Water Delineation and Assessment Reports (SWDARs) for every active public water supply in Montana. The GIS layer consists of one or more points for each public water supply that represent spring, well, or surface water intake locations. Release of this layer to the general public directly or through other agencies or entities was not authorized by DEQ. The data was generalized to broad watershed delineations and the original point locations cannot be identified. The final input grid included a grid value of 1 for watersheds including public water intake locations a 0 for all other watersheds, with a weighted overlay value of 5 percent. 9. Threatened and Endangered Species Data for the threatened and endangered species layer was obtained from the University of Montana Natural Heritage Program. The information provided by MTNHP is intended for distribution or use only within the requesting department, agency, or business. A generalized composite summary was created of all the data from MTNHP for threatened and endangered species. It cannot be reversed engineered to identify individual species locations. The final input grid included a grid value of 1 for threatened and endangered species and a 0 for all public and large corporate lands, with a weighted overlay value of 3 percent. Page 12

14 10. Forest Productivity Several alternatives were considered as the source for forest productivity. Landfire rapid assessment potential natural vegetation, representing the vegetation that could be supported on a given site based on the biophysical environment and absent any disturbance. This layer was available for all of Montana, but was designed for national to regional levels of analysis. The Landfire landscape level data was only available for Western Montana. SSURGO soils site index, the NRCS 1:24,000 scale detailed mapping included site index information for forest species. This data was used in the Oregon SAP analysis. The SSURGO is almost completed for most of Montana, but in our analysis, the site index values were sporadic in coverage, and appeared to be limited to western Montana. The pilot areas in eastern Montana had null values. We were unable to locate any detailed metadata or explanations in the literature. Dr. Fieldler observed that the site index values listed appeared on the low end in the pilot areas. US Forest Service Region 1 Vegetation Mapping Project (-VMAP). This layer is the best source for detailed vegetation mapping for lifeform, tree canopy cover class, tree diameter, and dominance type. The data set, however, only covers the western portion of Montana. University of Montana and Montana Department of Revenue potential forest productivity (see below). After review of the different alternatives using three sample pilot areas in the Flathead, Missoula, and Bull Mountain areas, and expert opinion from Dr Carl Fiedler at the University of Montana, the preferred data source for identifying forest productivity classes was determined to be the University of Montana/Montana Department of Revenue potential forest productivity layer. Although there were limitations of the data and model, it was complete for all of Montana and the SAP area of interest, and was judged to be a more accurate source of forest productivity than the SSURGO data. The UM model, developed by the Numerical Terradynamic Simulation Group at the University of Montana predicted and mapped potential forest productivity (cubic volume increment at culmination of mean annual increment, CMAI) for all forest land in the state of Montana. The biophysical modeling logic that was used to estimate productivity of forested landscapes primarily used the model Forest-BGC and its progeny Biome-BGC, Tree-BGC, and Fire-BGC. In the BGC (Bio-Geo Chemical) logic, basic growth processes (photosynthesis, transpiration, respiration and carbon allocation are driven directly by climatic events: daily precipitation, solar radiation relative humidity, precipitation and maximum and minimum temperature). The models were combined along with a hill slope hydrologic routing model, TOPMODEL, in a GIS environment for use in calculating ecosystem flux rates at spatial scales ranging from hill slope to regional resolutions. The combined set of models results in a regional hydro-ecological simulation system (RHESSys). The only derivative available from this project is the final Page 13
15 potential forest productivity layer for existing forest lands, derived from Landsat imagery in the This was the layer used in this analysis. The method used by Department of Revenue for forest valuation in Montana is currently in revision, and will be replaced in The new methodology uses a stratified sample of site index conditions based on extensive field plots. It will be beneficial to re-run the SAP analysis once these new data are made available in The following productivity classes were used. The non forestland, hardwood stands (cottonwood and aspen), and Department of Revenue defined non-commercial lands (which were lands with less than 15 acres of contiguous forest land) were given a value of 0 and defined as non-forest. Description Grid value / weighted overlay value Class 4: cu ft/ac/yr 3 Class 5: cu ft/ac/yr 6 Class 6: cu ft/ac/yr 12 Class 7: 85+ cu ft/ac/yr 13 Forest Resource Threats 1. Wildfire Risk The wildfire risk layer used the rapid assessment fire regime condition classes from the National Landfire Program. LANDFIRE Rapid Assessment fire regime condition classes (FRCC) delineate a standardized, interagency index to measure the departure of current conditions from reference conditions. FRCC is defined as a relative measure describing the degree of departure from the reference fire regime. This departure results in changes to one (or more) of the following ecological components: vegetation characteristics (species composition, structural stages, stand age, canopy closure, and mosaic pattern); fuel composition; fire frequency, severity, and pattern; and other associated disturbances (such as insect and disease mortality, grazing, and drought). FRCC is composed of three classes: 1. FRCC 1 - Within the natural (historical) range of variability ("reference fire regime") of vegetation characteristics; fuel composition; fire frequency, severity and pattern; and other associated disturbances 2. FRCC 2 - Moderate departure from the reference fire regime of vegetation characteristics; fuel composition; fire frequency, severity and pattern; and other associated disturbances 3. FRCC 3 - High departure from the reference fire regime of vegetation characteristics; fuel composition; fire frequency, severity and pattern; and other associated disturbances Page 14
16 Fire regime condition classes 2 and 3 were selected for this analysis. Those areas in condition class 2 and 3 were masked to only include the private forest lands, based on the private forest lands mask described in section 1. All areas in the two wildfire condition classes and on private forest land were given a grid value rating of 1, and all other areas a value of 0. This layer was weighted by a value of 11 percent. The more detailed landscape level Landfire data would have been preferable as a data source, but it was only available for the area west of the continental divide in Montana. The SAP analysis should be rerun with the landscape level Landfire data for the whole state when it is available (by 2009). The final input grid included a grid value of 1 for all areas defined with wildfire risk and a 0 for all other lands, with a weighted overlay value of 11 percent. 2. Forest Health (Insects and Diseases) Data from the forest health risk mapping efforts by the USFS was mapped from 2000 to Data was originally acquired from the USFS aerial surveys covering multiple years and insect and disease species. This group of layers contains ten individual layers representing the results of annual insect and disease aerial detection survey flights in USDA Forest Service - Region 1 from 2000 to These surveys cover a large part of the forested areas, including Federal, State, and Tribal lands in Region 1. The layers represent the actual aerial detection surveys, and also the areas that were flown and not flown. The surveys were conducted by the Forest Health Protection Group in the State and Private Forestry Staff, Region 1. Region 1 is within the perimeters of northeastern Washington, northern Idaho, and Montana; and a national grassland in North Dakota and northwestern South Dakota. The purpose of an aerial detection survey was to detect new outbreaks or identify previously undetected outbreaks of forest pests, monitor existing outbreaks, provide timely information for management planning, and provide information for forest health assessments and project plans. The selected data for the health layer in this SAP analysis consisted of the aerial detection survey flown in 2005 including Douglas-fir beetle, Engelmann Spruce beetle, Mountain Pine beetle, Fir engraver, Western Balsam bark beetle, Spruce budworm, White Pine blister rust, and dwarf mistletoe. Dan Rogers, DNRC SAP coordinator, discussed this layer with forest entomologists and selected the six species to be used in the analysis and determined that only the data from the most recent year would be used in SAP analysis. The final input grid included a grid value of 1 for presence of selected insects and diseases and a 0 for all other lands, with a weighted overlay value of 11 percent. Page 15
17 3. Development Level Development level was identified as those areas forecasted to have development of greater than five homes per quarter section by the year The analysis was conducted by the Sonoran Institute to examine future residential development in 31 of Montana s counties, where the majority of the stewardship plans have been completed (Beaverhead, Big Horn, Broadwater, Carbon, Cascade, Deer Lodge, Flathead, Gallatin, Glacier, Granite, Jefferson, Lake, Lewis and Clark, Liberty, Lincoln, Madison, Meagher, Mineral, Missoula, Park, Pondera, Powell, Ravalli, Sanders, Silver Bow, Stillwater, Sweet Grass, Teton, Toole, Treasure, and Yellowstone). Census block groups were analyzed from the 2000 Census data to determine if there were any additional areas of Montana with increases in residential development predicted in the future. The remaining counties not included in the Sonoran study all showed declining residential growth, so no additional analysis was required in the remaining 25 counties. The Sonoran dataset includes homes within subdivisions but excludes mobile homes, for which historical location information was not available. The historical data were collected from the Montana Departments of Revenue, and were summarized per Quarter Section according to the Public Land Survey System (PLSS). The tax assessor data are current through Forecasts of residential development were for This dataset describes the forecasted locations of homes within subdivisions but excludes mobile homes, for which historical location information was not available. Fifty-five potential explanatory variables were used to analyze the correlates of growth from These variables describe the study area with respect to natural resources, transportation, services, natural amenities, and past home development, and are consistent with the bio-physical and socio-economic factors identified in the growing body of literature investigating the drivers of human settlement patterns. Examples include suitability for agriculture, travel time to airports, and travel time to national parks. Data was used with the permission of the Sonoran Institute. The information provided was intended for distribution or use only within the requesting department, agency, or business, and should not be distributed to the public or used for other purposes. Final input grid included a grid value of 1 for private quarter sections projected to have 5 or more residences by 2025 and a 0 for all other lands, with a weighted overlay value of 8 percent. Analysis Masks Several analysis masks were developed for this project. They were used to exclude geographic areas in the analysis, and to define the geographic areas used in final acreage calculations for different categories and classifications of land. The original statement of work stated that The analysis mask for the Forest Resource Richness and Forest Resource Threat layers will include only open water. The analysis mask for the Critical Private Forestland layer will include urban areas, public land, and open water. For urban areas and open water, NLCD data will be used. The original mask definition in the statement of work was modified by DNRC staff and the subcommittee during the review process, and the final analysis masks were developed as follows: Page 16
18 1. Forest stewardship potential on critical private lands Excluded areas are public lands and industrial forest company lands, and specific land cover classifications from the NLCD database defined in the project scope of work. The NLCD exclusions included open water, quarries, bare rock and sand, perennial ice and snow, and industrial/urban areas as identified by NLCD (values = 11, 12, 21, 22, 23, 31, and 32). The land ownership source for the classified forest stewardship potential on critical private lands mask layer was initially extracted from the Information Technology Service Division (ITSD), Montana Department of Administration stewardship geodatabase. This layer was selected as the base for the public/private lands layer in Montana, even though there were gaps in the statewide geodatabase, which was acquired as a work in progress. Gaps in the layer, which primarily occurred in the Flathead Valley and other small portions of western Montana, were filled in with ownership information from the Montana Natural Resource Information System (NRIS) stewardship layer. The rationale for using the ITSD layer was its role as the basis for the Montana cadastral database, and a greater likelihood of maintenance in a timely fashion in the future. It also provided the ability for a closer match to stewardship plan maps. The cadastral was based on BLM Geographic Coordinates database (GCDB). Due to different survey control, this layer can have different ownership lines than the NRIS layer, which is based on 1:100,000 scale corners from USGS quadrangle maps. As a result some slivers were created in the merging process of filling the gaps with the NRIS version of stewardship. Once the public land composite was created, large corporate timber lands, derived from the Plum Creek timber company lands from the stewardship layer, were subsequently merged with the public/private land, and lumped into the public category. The same operation was applied to the separate GIS files of other large private timber companies provided by DNRC. This composite resulted in two final mutually exclusive layers used in the analysis, defining all the public (public and large corporate forest ownership) and private lands in Montana potentially available for stewardship. The private land mask was subsequently used in all operations, maps and acreage summaries requiring the classified forest stewardship potential on critical private lands mask. 2. Forest stewardship potential on critical private forestlands mask The forest stewardship potential on critical private lands mask layer, described in the previous section was subsequently overlaid on the existing forestland and forest cover grid to subdivide it into two components, those currently forested and those currently non-forested. The forest cover layer was derived by combining four NLCD classes: deciduous forest, evergreen forest, mixed forest and woody wetlands. The intersection of these two layers including the forest stewardship potential on critical private lands mask layer, and the existing forest layer from NLCD became the forest stewardship potential on critical private forestlands mask. 3. Forest stewardship potential on critical private non-forestlands This project identified all non-corporate forest private lands as critical to forest stewardship. The forest planning and management of agroforestry applications is part of the national Stewardship Program, but was not applied in Montana. The state's existing forest policies focus on maintaining and improving existing forest lands. Montana has a strong agricultural economic and social base, and converting farm lands to forestland is not an objective of the Montana SAP. Page 17
19 The derivation of this layer included all lands in the forest stewardship potential on critical private lands mask layer that were not included in the stewardship potential on critical private forestlands mask along with the areas of development and projected development, defined by the development layer, were also removed. The private forestlands mask and the private nonforestlands mask layers are mutually exclusive. 4. Forest resource richness and forest resource threats The DNRC staff and subcommittee modified the mask criteria for resource richness and resource threats to only include those lands within the forest stewardship potential on critical private lands mask layer, instead of the original, less exclusive criteria of all lands except open water. Weighting To produce the composite layers, each input layer was given a weight according to their relative importance. The MFCCS committee derived the weighting scheme for the individual suitability layers based on relative importance for delivering stewardship education and technical assistance. Once all data layers were assigned a percentage, the percentages were converted to weighting values, that is 10 percent became a value of 10 and the sum of the maximum points for all 13 layers equaled 100. With the exception of the forest productivity, which included variable points based on the productivity category, all of the other layers were binary presence/absence map layers and cored the full weighted score for the layer for map areas mapped present and scored 0 for areas mapped as absent. As Oregon noted in their assessment, adding additional layers to the analysis reduced the sensitivity of weighting. A total of 64 percent of the weighting criteria in Montana relied on or were influenced by existing forest cover. With the geographic distribution of lands and the ordinal measurement scale, any layer that had broad spatial distribution in eastern Montana (such as the operability criteria of slopes less than 40 percent) initially gave a given unit of analysis some score greater than 0. After the MFCCS subcommittee reviewed the results of the preliminary mapping they revised the analysis methodology and applied additional forest related pre-condition criteria to the wildfire risk, slope, and proximity to public lands layers. Data layer weights: Private forestland 15% Forest productivity 13% maximum o Class 4: 3% o Class 5: 6% o Class 6: 12% o Class 7: 13% Forest health (Insects and diseases) 11% Wildfire risk 11% Development level 8% Proximity to public lands 8% Forest patches 7% Priority watersheds 7% Riparian river areas 6% Public water supply 5% Page 18
20 Threatened and Endangered Species 3% Slope 3% Wetlands 3% Overlay Analysis The GIS data representing each of the layers was converted to the ESRI grid format with a cell size of 30 meters, an area representing approximately one-quarter acre. Each cell of the grid for each factor was converted to a value of either 0 or 1 (except for forest productivity). For example, all the 30-meter grid cells that fall within the riparian river buffers were coded as 1, while all cells outside the riparian buffers were coded as 0 in that layer. Each grid cell was multiplied by its weighted value, so that cells coded as 1 took on the weighted value while all 0 cells retained a value of 0. The final result grid contained cells whose values equaled the sum of the values in the same location (on the same quarter-acre) from all included layers in each composite layer. The ESRI Spatial Analyst extension allowed for the specification of an analysis mask. The analysis mask described above was used to exclude areas that did not meet eligibility requirements for inclusion in the Forest Stewardship Program. The ESRI Modelbuilder functionality was used to model and run each of the analysis steps in compiling the SAP overlay analysis. Three models were developed. These are shown in figures Figure 2 to Figure 4. Full documentation and GIS metadata are provided in Appendix B. Page 19
21 Figure 2 SAP Model Overlay Analysis Page 20
22 Figure 3 Resource Richness Overlay Page 21

23 Figure 4 Threats Analysis Overlay Page 22
24 Final Classification The forest stewardship potential on critical private lands and the two subcategories of private lands, forestlands and non-forestlands & non-developed lands, were subsequently classified into three categories of potential stewardship for each output layer: high, medium and low. The classification breaks were determined by the model input scoring matrix and thresholds set by the MFSSC subcommittee, using the following rules: The classification was derived from the final rounded integer value for the sum of grid layers used in the Classified forest stewardship potential on critical private lands layer (grid cells in a 30 meter x 30 meter unit of analysis). High - Those that had a value greater than or equal to 39, the sum of the highest three map layers scores. Page 23


25 Medium Those that had a value less than 39, the sum of the highest three map layers scores AND had a score greater or equal to 32, the sum of the remaining layers not in the top 3, but with forest related influence in the model. Low Those that had a value less than 32, with no forest related influence in the model Page 24

26 Analysis Results Montana forest ownership is shown in Figure 5. The majority of forest land is on US Forest Service land, comprising 59 percent, and corporate forest land accounts for 5 percent of the total. Approximately 19 percent of the forest land is in the non-industrial private forest land category which was the primary focus of this analysis. Parcels in this category range from less than 1 acre to thousands of acres. The Montana Department of Revenue tracks private forest land for forest valuation for acreage of forest land greater than or equal to 15 acres. Stewardship plans, however, can be prepared for forest lands with forest areas of 5 acres or greater. The fine scale of this analysis (30 x 30 meter units of resolution) will allow the DNRC and Forest Extension to evaluate stewardship potential on any size forest acreage in Montana. Figure 5 Montana Forest Ownership Page 25

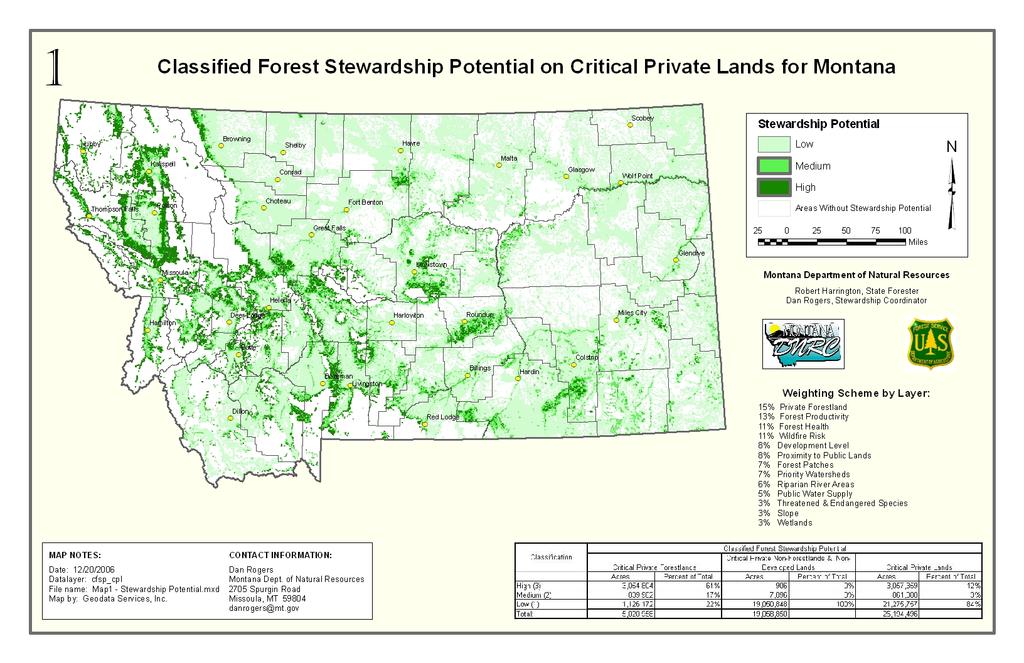
27 Figure 6 Classified Forest Stewardship Potential on Critical Private Lands Table 1 Classified Forest Stewardship Potential on Critical Private Lands The classified forest stewardship potential on critical private lands is composed of 12 percent in the high category, 3 percent in the medium category, and 84 percent in the low category, as shown in Figure 6 and Table 1. Of a total of more than 25 million acres, approximately 5 million acres are forestlands and approximately 19 million acres are non-forestlands and nondeveloped lands. About 3 million acres of forestlands were rated in the high potential category and about 900 acres of non-forestlands and non-developed lands were rated high. Almost all of the non-forestlands and non-developed lands were rated with low potential. Page 26
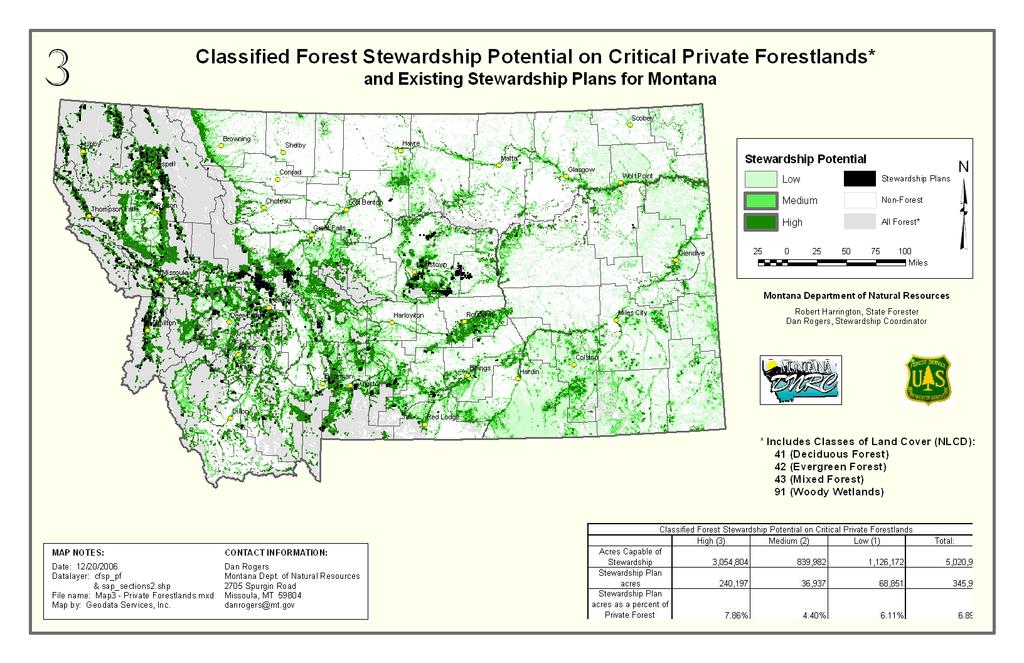
28 Table 2 Classified Forest Stewardship Potential on Critical Private Forestlands As reflected in Table 2, of a total of about 5 million acres of currently forested land, about 3 million acres of forestlands were rated in the high potential category, about 800,000 acres were rated in the medium potential category, and about 1 million acres were rated in the low potential category. About 8 percent of high potential forest land, 4 percent of medium and 6 percent of low is currently under stewardship management plans. In general, a larger proportion of the acreage rated high was located in western Montana and a larger proportion of acreage rated low was in eastern Montana. Page 27

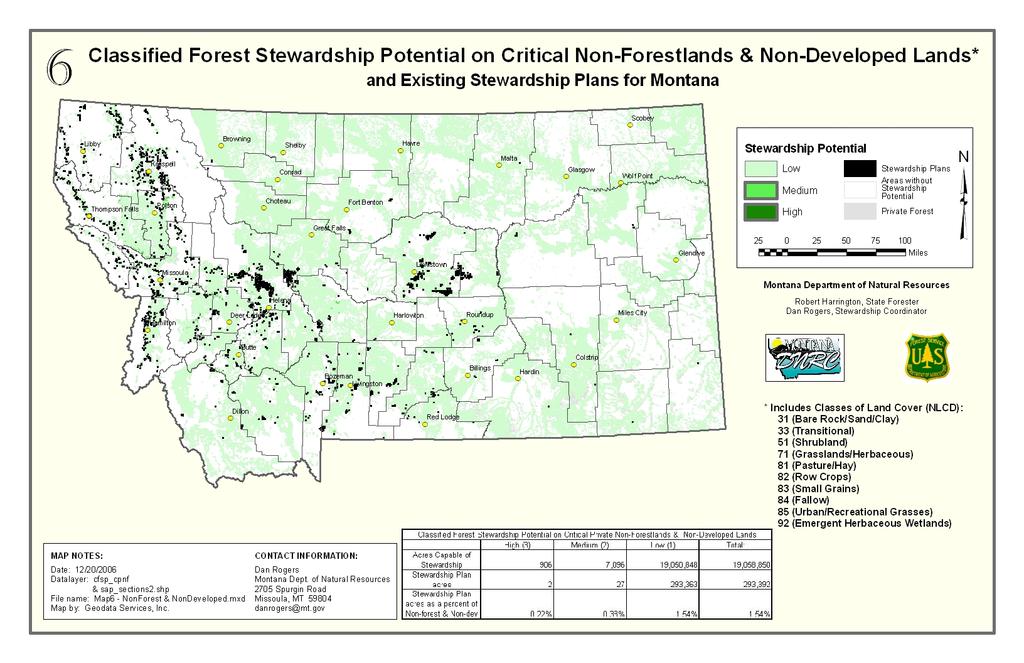
29 Figure 7 Classified Forest Stewardship Potential on Critical Private Non-Forestlands & Non-Developed Lands Table 3 Classified Forest Stewardship Potential on Critical Private Non-Forestlands & Non-Developed Lands The classified forest stewardship potential on critical private non-forestlands and non-developed lands is composed almost entirely of the low category of potential, as shown in Figure 7 and Table 3. Of a total of more than 25 million acres, approximately 5 million acres are forestlands and approximately 19 million acres are non-forestlands and non-developed lands. About 3 million acres of forestlands were rated in the high potential category and about 900 acres of nonforestlands and non-developed lands were rated high. Almost all of the non-forestlands and nondeveloped lands were rated with low potential. Page 28

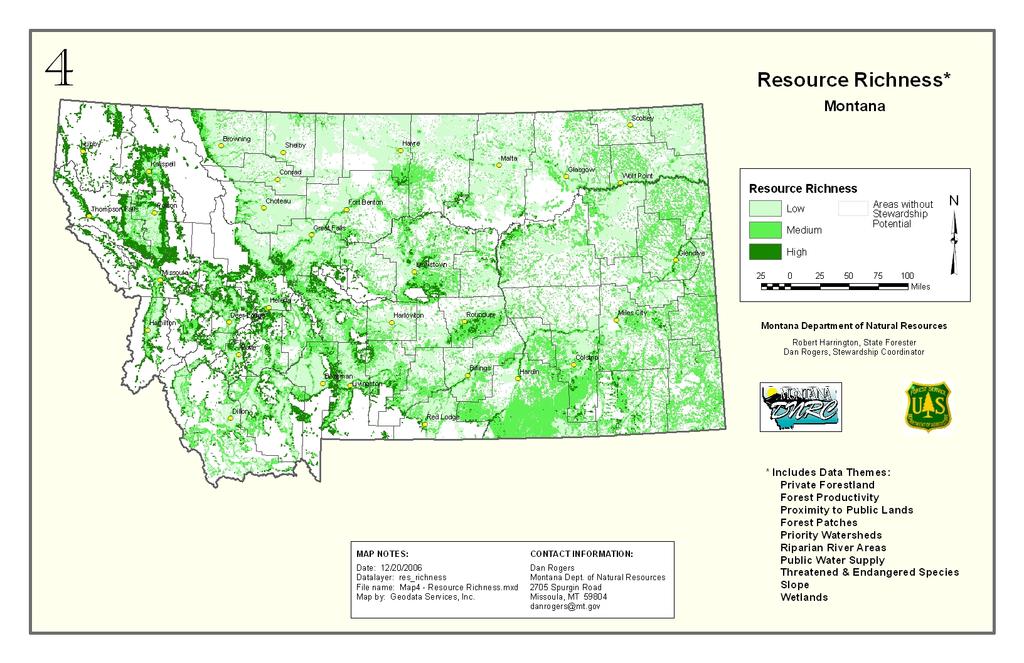
30 Figure 8 Resource Richness Results of the map layer combinations for resource richness and resource threats were also summarized based on the rating criteria for classified forest stewardship potential on critical private lands, and the results are shown infigure 8 and Figure 9. The Resource Richness grid is the final output of the SAP Resource Richness model. A subset of the data themes comprising the Forest Stewardship Potential Analysis model (SAP_model) were added together on a cell-by-cell basis to derive a richness score. The logic for weighting factors used in the SAP_model could not be used for the resource richness, since the total list of layers was separated into two categories. Therefore the Jenks method or Natural Breaks classification method in the ESRI ArcView software was used to derive the resource richness categories of High, Med, or Low. The natural breaks thresholds divide the classification into High (30-66), Medium (14-29), or Low (3-13). The same data layers were used as for the Forest Stewardship Potential model with the exception of Forest Health, Wildfire Risk, and Development. The resource threat layers are Forest Health, Wildfire Risk, and Development. Page 29
 were added together on a cell-by-cell basis to derive a richness score.")
31 Figure 9 Resource Threats The Resource Threats grid is the final output of the SAP Resource Threats model. A subset of the data themes comprising the Forest Stewardship Potential Analysis model (SAP_model) were added together on a cell-by-cell basis to derive a richness score. The logic for weighting factors used in the SAP_model could not be used for the resource threats, since the total list of layers was separated into two categories. Therefore the Jenks method or Natural Breaks classification method in the ESRI ArcView software was used to derive the resource threats categories of High, Med, or Low. The natural breaks thresholds divide the classification into High (12-30), Medium (9-11), or Low (8) Existing and historic forest stewardship plans Several of the objectives of the SAP project involved assessment of the stewardship values in relation to the non-industrial private forest (NIPF) plans that have been developed since The assessment involved identifying where the management plans were located, and determining what percentage of existing NIPF management plans were on the state s priority stewardship lands. This also provided a basis for establishing future practices that can improve effectiveness in addressing priority needs based on landscape scale resource issues. Although Montana has over 1500 completed plans developed under the FSP, there were approximately 1,200 non-industrial private forest ownership properties, representing approximately 650,000 total acres that were intact with accurate ownership information. Page 30
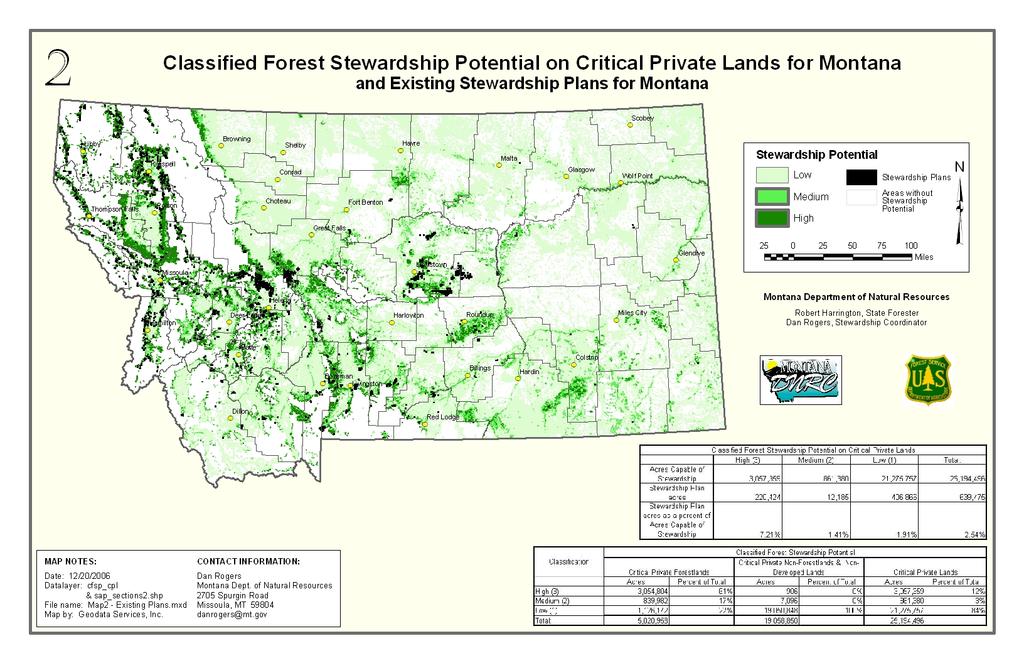
32 Figure 10 shows the PLSS sections (1x1 square mile) with completed stewardship plans, overlaid on a map of all potential forest stewardship values (high, medium, low). A total of 220,424 acres were estimated to be on lands rated high for forest stewardship potential, a total of 12,185 acres were rated medium, and a total of 406,866 were rated low. Approximately 290,000 of the lands rated in the low category, or 72 percent, were estimated to be on non-forestlands and nondeveloped lands. Looking only at the stewardship plans on private forestlands, 69 percent (240,197 acres) were on lands rated high for forest stewardship potential, 11 percent were on lands rated medium, and 20 percent on lands rated low. Caution is advised in reviewing these results, due to the lack of precise location of stewardship plan mapping and differences in acreage reporting over time. Further details are provided later in this section. Page 31

33 Figure 10 Existing Stewardship Plans for Montana Table 4 Existing Stewardship Plans for Montana There were several challenges in accomplishing this analysis in Montana. Early planning efforts did not require detailed map locations of the forest plan on the property, and thus, no map records exist for the majority of properties. Incomplete legal descriptions exist for most plans, and changes in ownership since the plan were developed also contributed to the challenge. Fortunately, Montana has developed a comprehensive cadastral mapping effort involving all parts of the state in one consistent geodatabase. This provides the ability to accurately map future stewardship plans in conjunction with landowners in planning workshops. It also provides some ability to map historic plans based on the owner name in property tax record databases. The contracted portion of this project did not include funding for the labor intensive mapping required to map every historic plan. DNRC staff plan to continue to develop these individual plan locations over the next few years. Page 32
34 In lieu of the ability to overlay the critical stewardship lands on NIPF plans and develop reports on acreage totals, a method was developed to assign stewardship potential to each section of land and associate those values with the portion of plans in each section of land. DNRC provided township, range and section descriptions for private properties with forest stewardship plans in two databases and two ArcView shapefiles, containing a total of 1228 owner records. There were 33 records with no township, range and section and one record with an incorrect township, range and section that could not be used. The remaining township, range and section descriptions were used as provided by DNRC. The databases were combined and a unique identification number was added for each owner. The township, range, and section for each record were standardized. A record was created for each unique township, range, and section combination. The total acreage for each owner was divided by the total number of sections for each owner to determine the average acres per section. About 200 records contain a total average acre per section that is larger than 640 acres (the standard size for one section). That was most likely a result of incomplete township, range and section descriptions for the property. The resulting database was joined to the public land survey shape file and the sections selected were extracted to create a PLSS section map with apportioned stewardship planning acres based on the reported values in the database tables maintained by DNRC. The GIS section layer included a unique identification number for each owner in that section (with up to five owners in some sections), the average acres per owner, and the total average acres of all owners in each section. The final step in summarizing the stewardship priority for each plan was to overlay the apportioned section map on each of the final stewardship analysis layers and report the acres of each plan in high, medium and low categories. Some sections included a mix of the three categories, others included a predominance of one category. Without knowing where in the section the precise forest plan location was, some level of abstraction was required in assigning the values. For the plans on critical private lands, the majority value was assigned to all plan acres in the section, regardless of the number of acres of critical private lands in the section. For instance, if 40 percent of a section included critical private lands and 60 percent did not, the section was still given a value. If 51 percent of the critical private forest lands were medium potential and 49 percent were low potential, all acres in the section were assigned to the medium potential category. Although the same logic of not knowing which part of a section included acres in a stewardship plan applied to forest and non-forest portions of all critical private lands, the spatial location and proportion of existing forestland was known. As a result, the process was modified slightly in reporting acreage by stewardship potential categories for forest and non-forest. An additional level of proportion was assigned based on the proportion of forest and non-forestlands for the acreage summaries of categories of stewardship potential, and these proportions were passed through to the stewardship plan acres. A detailed description of the exact GIS procedures used for this analysis is included in Appendix B. Page 33
35 Appendices Appendix A: Final Maps Map 1 Classified Forest Stewardship Potential on Critical Private Lands for Montana Map 2 - Classified Forest Stewardship Potential on Critical Private Lands and Existing Stewardship Plans for Montana Map 3 - Classified Forest Stewardship Potential on Critical Private Forestlands and Existing Stewardship Plans for Montana Map 4 - Resource Richness in Montana Map 5 - Resource Threats in Montana Map 6 - Classified Forest Stewardship Potential on Critical Non-Forestlands & Non- Developed Lands and Existing Stewardship Plans for Montana Map 7 - Forestland Ownership Page 34
36 Page 35
37 Page 36
38 Page 37
39 Page 38
40 Page 39
41 Page 40
Oregon Spatial Analysis Project
 Oregon Spatial Analysis Project Oregon Department of Forestry June 2006 Table of Contents Executive Summary... 1 Introduction... 3 Background... 3 History of Forest Stewardship and Spatial Analysis Projects...
Forest Stewardship Spatial Analysis Project Illinois Methodology March, 2007
 Forest Stewardship Spatial Analysis Project Illinois Methodology March, 2007 Project Summary Administered by the U.S. Forest Service and implemented by State forestry agencies, the Forest Stewardship Program
New Jersey Forest Stewardship Program Spatial Analysis Project Map Products And Data Layers Descriptions
 New Jersey Forest Stewardship Program Spatial Analysis Project 2007 Map Products And Data Layers Descriptions 01/07 NJ Forest Stewardship Program (FSP) Spatial Analysis Project (SAP) Methodology Project
State and Private Forestry Programs
 Appropriation State and Private Forestry The Fiscal Year (FY) 2009 President s Budget proposes $109,500,000 for programs under the State and Private Forestry appropriation, a decrease in budget authority
Montana Conservation Easement Summary by County December 21, 2016
 Montana Conservation Easement Summary by County December 21, 2016 Note: easement acres are calculated by the GIS and do not necessarily represent the acreage filed in the deed. County Easement Holder Acres
SPATIAL ANALYSIS OF POTENTIAL IMPACTS OF LOCAL FORESTRY ORDINANCES
 SPATIAL ANALYSIS OF POTENTIAL IMPACTS OF LOCAL FORESTRY ORDINANCES David R. Daversa, Stephen P. Prisley, and Michael J. Mortimer Department of Forestry, Virginia Tech, Blacksburg, VA 24061 ABSTRACT Local
ASSESSING THE DIRECTION OF THE FOREST RESOURCE
 ASSESSING THE DIRECTION OF THE FOREST RESOURCE C U R T W I L S O N - R E G I O N A L F O R E S T R Y L E A D E R N O R T H E A S T R E G I O N - G R E E N B A Y, W D N R J U N E 2 0 1 2 QUESTIONS FOR TODAY
Minnesota Stewardship Spatial Analysis Project Methodology and Analysis documentation January 28, 2008
 Minnesota Stewardship Spatial Analysis Project Methodology and Analysis documentation January 28, 2008 Summary In the fall of 2004, Minnesota DNR and the U.S. Forest Service began working together to create
Forest Stewardship Spatial Analysis Project Methodology Report for Washington July 2008
 Forest Stewardship Spatial Analysis Project Methodology Report for Washington July 2008 Washington Forest Stewardship Spatial Analysis Project Final Report Contact Info: Steve Gibbs Stewardship Coordinator
TAC CHARRETTE WORKBOOK Ecosystem Management and Sustainable Forestry Practices
 For Discussion Purposes TAC CHARRETTE WORKBOOK Ecosystem Management and Sustainable Forestry Practices NEW JERSEY HIGHLANDS COUNCIL March 28, 2006 1 Overview of RMP Goals and Structure NEW JERSEY HIGHLANDS
Characterizing the Fire Threat to Wildland Urban Interface Areas in California
 Introduction Characterizing the Fire Threat to Wildland Urban Interface Areas in California This document outlines the procedures used to identify areas in California that pose significant threats from
Appendix 5A Priority Landscapes GIS Analysis Methodology
 Appendix 5A Priority Landscapes GIS Analysis Methodology Overview This appendix describes the methodology used for Pennsylvania s Priority Landscapes GIS Analysis. The figure below is a conceptual diagram
Project Brief: Small Forestland Owner Parcel Identification and County GIS Data Compilation for Washington State WRIAs 23 & 49
 Project Brief: Small Forestland Owner Parcel Identification and County GIS Data Compilation for Washington State WRIAs 23 & 49 Prepared For: Mary McDonald Program Director Small Forest Landowner Office
State and Private Forestry Fact Sheet
 State and Private Forestry Fact Sheet New Mexico 2017 Investment in State's Cooperative Programs Program FY 2016 Final Community Forestry and Open Space $0 Cooperative Lands - Forest Health Management
The Washington Hardwoods Commission. Presents: A Hardwood Resource Assessment for Western Washington
 The Washington Hardwoods Commission Presents: A Hardwood Resource Assessment for Western Washington June, 2002 Abstract This project used Landsat TM images for mapping current forest distribution across
Forest Stewardship Spatial Analysis Project Wisconsin Methodology
 Project Summary One purpose of the Spatial Analysis Project (SAP) is to create a data layer for the state that represents levels of potential benefit from, or suitability for inclusion in, the Forest Stewardship
SBEADMR Priority Treatment Areas Process and Results
 SBEADMR Priority Treatment Areas Process and Results GIS Optimization & Interdisciplinary Validation, September & October 2015 Purpose Use GIS to focus and prioritize potential treatment areas within the
Appendix J. Forest Plan Amendments. Salvage Recovery Project
 Forest Plan Amendments Salvage Recovery Project APPENDIX J Lynx and Old Growth Forest Plan Amendments CHANGES BETWEEN DRAFT EIS AND FINAL EIS Changes in Appendix J between the Draft and Final EIS include:
The Science Behind Forest Riparian Protection in the Pacific Northwest States By George Ice, Summer 2004
 The Science Behind Forest Riparian Protection in the Pacific Northwest States By George Ice, Summer 2004 Riparian buffers, streamside management zones, and similar measures are essential parts of forest
11. Prioritizing Farmlands for Future Protection
 11. Prioritizing Farmlands for Future Protection Identification of Important Farmlands in Putnam County I n order to implement this Plan successfully, Putnam County decision-makers will have to take advantage
Green Infrastructure: A Guide to Asset Mapping in the Rappahannock-Rapidan Region. Rappahannock-Rapidan Regional Commission December 2015
 Green Infrastructure: A Guide to Asset Mapping in the Rappahannock-Rapidan Region Rappahannock-Rapidan Regional Commission December 2015 What Is Green Infrastructure? Green infrastructure is an interconnected
Wildlife Conservation Society Climate Adaptation Fund 2014 Restoring Oak Resilience at the Table Rocks, Rogue River Basin, Oregon FACT SHEET
 Wildlife Conservation Society Climate Adaptation Fund 2014 Restoring Oak Resilience at the Table Rocks, Rogue River Basin, Oregon FACT SHEET Project Overview Oak ecosystems in the Pacific Northwest exist
Statement of. Jim Stone, Rancher and Chairman Rolling Stone Ranch and The Blackfoot Challenge
 Statement of Jim Stone, Rancher and Chairman Rolling Stone Ranch and The Blackfoot Challenge Before the U.S. House of Representatives Subcommittee on National Parks, Forests, and Public Lands at the hearing
COLORADO FOREST LEGACY PROGRAM APPLICATION FOR 2019 FUNDS
 COLORADO FOREST LEGACY PROGRAM APPLICATION FOR 2019 FUNDS The Colorado Forest Legacy Program purpose is to protect environmentally important private forest areas that are threatened by conversion to non-forest
Appendix C Risk Assessment Methods
 Appendix C Risk Assessment Methods The following section outlines the specific methods, data, and values used to evaluate wildfire risk in Lane County. Identifying the Wildland Urban Interface Risk The
Wildlife Conservation Strategy
 Wildlife Conservation Strategy Boise National Forest What is the Wildlife Conservation Strategy? The Boise National Forest is developing a Wildlife Conservation Strategy (WCS) in accordance with its Land
Forest Stewardship Program National Standards and Guidelines
 Forest Stewardship Program National Standards and Guidelines Second Edition September 2005 USDA Forest Service State & Private Forestry Cooperative Forestry Forest Stewardship Program National Standards
Capacity and Capability of Mills in the Flathead National Forest Timber-Processing Area
 Capacity and Capability of Mills in the Flathead National Forest Timber-Processing Area Addendum to: Timber Use, Processing Capacity, and Capability to Utilize Small-Diameter Timber Within USDA Forest
Final Report of the Riparian Forest Buffer Panel
 Chesapeake Bay Program Final Report of the Riparian Forest Buffer Panel Introduction Findings Land Use-Specific Findings On Agricultural Land On Forested Land On Developed and Developing Lands Recommendations
State and Private Forestry Fact Sheet. Investment in State's Cooperative Programs:
 State and Private Forestry Fact Sheet 2015 Idaho Investment in State's Cooperative Programs: Program FY 2014 Final Community Forestry and Open Space $0 Cooperative Lands - Forest Health Management $364,500
A Report on the Montgomery County s Existing and Possible Tree Canopy
 A Report on the Montgomery County s Existing and Why is Tree Canopy Important? Tree canopy (TC) is the layer of leaves, branches, and stems of trees that cover the ground when viewed from above. Tree canopy
A Report on Existing and Possible Tree Canopy in the City of Charlotte and Mecklenburg County, NC
 A Report on Existing and Possible Tree Canopy in the City of Charlotte and Mecklenburg County, NC Why is Tree Canopy Important? Tree canopy (TC) is the layer of leaves, branches, and stems of trees that
Principal Investigator:
 Quantifying partial harvest intensity and residual stand composition among stable and changing forest landowner groups in northern Maine Principal Investigator: Steven A. Sader, Professor and Director
West Fork White River Watershed Conservation Map Summaries. Prepared for the Beaver Watershed Alliance. By the Watershed Conservation Resource Center
 West Fork White River Watershed Conservation Map Summaries Prepared for the Beaver Watershed Alliance By the Watershed Conservation Resource Center November 2014 The Watershed Conservation Resource Center
West Virginia Watershed Assessment Pilot Project Outline & Assessment Methodology March 2012
 Introduction The West Virginia Watershed Assessment Pilot Project was developed to define the methodology and identify the information and tools necessary to meet the project objectives stated below. The
TARGETING WATERSHEDS FOR RESTORATION ACTIVITIES IN THE CHESAPEAKE BAY WATERSHED. Technical Documentation October 4, 2002
 TARGETING WATERSHEDS FOR RESTORATION ACTIVITIES IN THE CHESAPEAKE BAY WATERSHED Technical Documentation October 4, 2002 Acknowledgements and Disclaimer This project was funded by the Chesapeake Bay Foundation,
US Forest Service Open Space Conservation Strategy
 US Forest Service Open Space Conservation Strategy Transportation Research Board September 3, 2008 Atlanta, Georgia Photo Credit: Regents at the University of Minnesota. All rights reserved. Used with
Forest Health Program
 Forest Health Program June 2007 www.for.gov.bc.ca/ hfp/health/ Library and Archives Canada Cataloguing in Publication Data British Columbia. Forest Health Program. Forest Health Program ISBN 978-0-7726-5814-2
Goose Creek Watershed Assessment Summary October 2003
 Goose Creek Watershed Assessment Summary October 2003 The Goose Creek Watershed The Goose Creek watershed is 385 square miles, covering nearly half of Loudoun County and one-quarter of Fauquier County
New Hampshire s Wildlife Habitat Conditions
 CHAPTER THREE New Hampshire s Wildlife Habitat Conditions Abstract Wildlife habitat condition was assessed for all 27 habitat types. NHFG developed a methodology to assess the relative ecological condition
3 Baseline and Existing Conditions
 1 2 3 4 5 6 7 8 9 10 11 12 13 14 3 Baseline and Existing Conditions The effective date of the VSP legislation is July 22, 2011. This is also the date chosen by the legislature as the applicable baseline
Acres 32% 35% Not Suitable. Impervious. Possible UTC. Vegetation. Existing UTC
 Acres A Report on Washington, D.C. s Urban Tree Canopy Why is Tree Canopy Important? Urban tree canopy (UTC) is the layer of leaves, branches, and stems of trees that cover the ground when viewed from
WATER SUPPLY ASSESSMENT AND RANKING OF WATERSHED DAMS IN GEORGIA
 WATER SUPPLY ASSESSMENT AND RANKING OF WATERSHED DAMS IN GEORGIA Charles D. Absher, P.E., CFM 1, and David M. Ashley, RLA 2 AUTHORS: 1 Senior Water Resources Engineer; and 2 Vice President, respectively,
Riparian Vegetation Protections. Heritage Tree Protection
 PLACER Protections in place: Oak Tree Retention/ Replacement Requirements General Plan Language Specific Voluntary Rural Design require preservation of native trees and groves through replacement and dedication
A Report on Existing and Possible Tree Canopy in the borough of Pottstown, PA
 Pottstown Land Cover A Report on Existing and Possible Tree Canopy in the borough of Pottstown, PA Why is Tree Canopy Important? Tree canopy (TC) is the layer of leaves, branches, and stems of trees that
Treatment/Project Area: Blanco Basin
 Treatment/Project Area: Blanco Basin rev. 4/15/11 Geographic Area - Bounded on north by watershed divide between Rito Blanco and Rio Blanco (Blue Mtn and Winter Hills make up western half of divide), the
Forest Legacy Program
 Forest Legacy Program Forest Management Sheet Legacy http://texasforestservice.tamu.edu The State of Texas contains 26 million acres of forestland, primarily in the Eastern third of the state. This forestland
Conservation Partners Legacy Grant Application
 My Applications Application main menu CPL Applications (Total to date: 129) Spreadsheet Conservation Partners Legacy Grant Application CPL1000112 Name and Contact Project Identifier: CPL1000112 Project
2016 Wyoming Forest Health Highlights
 2016 Wyoming Forest Health Highlights Figure 1. Orange trees toward bottom right indicate ponderosa pine mortality caused by bark beetles in the Black Hills of Wyoming. While mountain pine beetle has affected
3.0 Landscape Wildfire Threat Analysis
 3.0 Landscape Wildfire Threat Analysis 107 3.0 Landscape Wildfire Threat Analysis This Wildfire Threat Analysis is evaluates the current risks and potential for wildfire ignition, spread, behaviour, suppression
Climate Change. Introduction
 Climate Change This environmental assessment incorporates by reference (as per 40 CFR 1502.21) the Climate Change specialists report and other technical documentation used to support the analysis and conclusions
Pacific Northwest Region, Forest Service Basin-scale Restoration Prioritization Process
 Pacific Northwest Region, Forest Service Basin-scale Restoration Prioritization Process Pacific Northwest Region U.S.D.A. Forest Service Dave Heller, Regional Fish Program Leader Bruce McCammon, Regional
Urban Ecosystem Analysis Roanoke, Virginia
 June 2002 Urban Ecosystem Analysis Roanoke, Virginia Calculating the Value of Nature Report Contents 2-3 Project Overview 4 Major Findings 5 Roanoke Area Green Data Layer 6 Tree Canopy Loss Over Time 7
TABLE OF CONTENTS 5.0 FOREST MANAGEMENT PLANNING...
 TABLE OF CONTENTS 5.0 FOREST MANAGEMENT PLANNING... 1 5.1 Planning Framework... 1 5.1.1 Sustainable Forest Management Planning... 1 5.1.2 Five-Year Operating Plan... 1 5.1.3 Annual Operating Plans... 3
Chapter 13: Wildlife and Vegetation
 Chapter 13: Wildlife and Vegetation Introduction and Setting Nevada County contains an extremely wide range of plants, animals and habitat types. With topographic elevations ranging from 300 feet in the
Dear Interested Party,
 United States Department of Agriculture Forest Service Gunnison Ranger District 216 N Colorado St. Gunnison, CO 81230 Voice: 970-641-0471 TDD: 970-641-6817 File Code: 1950-1/2430 Date: June 8, 2010 Dear
Appendix E: Regional Ecosystem Framework Methodology and Calculations
 The data utilized in this scoring methodology are derived from the U.S. Environmental Protection Agency (EPA) Region 6 Geographic Information Systems Screening Tool (GISST) User s Manual, the Texas Grid,
Sierra Nevada Forest Plan Amendment Volume 1, Summary, Chapters 1 & 2
 reader's guide Sierra Nevada Forest Plan Amendment Table of Contents Sierra Nevada Forest Plan Amendment Volume 1, Summary, Chapters 1 & 2 TABLE OF CONTENTS The Table of Contents is divided into 3 Sections.
Forest Change Caused by Wind, Water, Ice, Fire, Insects/Disease & Harvesting
 Forest Change Caused by Wind, Water, Ice, Fire, Insects/Disease & Harvesting Why use remote sensing for mapping forest changes? Synoptic view of damage on a forest landscape or regional level. Can stop
Assessing and Adapting to Climate Change Intermountain Region. Natalie Little Forest Service Ogden, Utah
 Assessing and Adapting to Climate Change Intermountain Region Natalie Little Forest Service Ogden, Utah We have lots of information! Adapting to climate change: USFS information & tools Climate Change
FACT SHEET: BLM, USFS Greater Sage-Grouse Conservation Effort
 EMBARGOED UNTIL SEPTEMBER 22, 2015 @ 12:00PM ET FACT SHEET: BLM, USFS Greater Sage-Grouse Conservation Effort Overview Effective conservation of the greater sage-grouse and its habitat requires a collaborative,
FLORIDA S FOREST ACTION PLAN NATIONAL PRIORITIES. 1. Conserve and Manage Working Forest Landscapes for Multiple Values and Uses
 NATIONAL PRIORITIES SECTION Update Report STATE OF FLORIDA 2015 The 2008 Farm Bill, under Title VIII Forestry, amends the Cooperative Forestry Assistance Act of 1978, to include the requirement that each
DRAFT FOR CONSIDERATION AT THE APRIL 27, 2006 MEETING OF NATURAL RESOURCES COMMITTEE OF THE HIGHLANDS COUNCIL
 RMP Component: Resource Assessment / Ecosystem Assessment Technical Report: Forest Integrity Council Committee: Natural Resource Committee Memorandum Title: Technical Approach to Define Highlands Forest
Appendix D: MULTI-AGENCY COMPENSATORY MITIGATION PLAN CHECKLIST 1
 Appendix D: MULTI-AGENCY COMPENSATORY MITIGATION PLAN CHECKLIST 1 Mitigation Goals and Objectives o Describe functions lost at impact site o Describe functions to be gained at mitigation site o Describe
PRINCE GEORGE NATURAL AREAS AND THE EFFECTS OF CLIMATE CHANGE: CASE STUDY
 PRINCE GEORGE NATURAL AREAS AND THE EFFECTS OF CLIMATE CHANGE: CASE STUDY Natural Areas in Prince George The City of Prince George is dominated by natural, undeveloped areas within city limits and in adjacent
4 CONSERVED LANDS, PUBLIC LANDS, AND OTHER RECREATIONAL OPPORTUNITIES
 4 CONSERVED LANDS, PUBLIC LANDS, AND OTHER RECREATIONAL OPPORTUNITIES At the time of this study, there are approximately 2,300 acres of conservation land in Grantham, or 12% of the land area. The Town
Analysis of Vegetation Mortality and Prior Landscape Condition, 2002 Biscuit Fire Complex. Kirsten Harma and Peter Morrison
 Analysis of Vegetation Mortality and Prior Landscape Condition, 2002 Biscuit Fire Complex Kirsten Harma and Peter Morrison Pacific Biodiversity Institute February 14, 2003 Introduction The Biscuit Fire
Forests in the Farm Bill Coalition. Photo: David Harvey, Dixfield, Maine. Forest Priorities for the 2012 Farm Bill
 Forests in the Farm Bill Coalition Photo: David Harvey, Dixfield, Maine Forest Priorities for the 2012 Farm Bill January 2011 Congress and the Administration must work to ensure that the Farm Bill provides
Q&A: Omineca spruce beetle outbreak May 4, 2018
 Q&A: Omineca spruce beetle outbreak May 4, 2018 Q. How big is this outbreak? What kind of impact has it had so far? The most recent provincial aerial overview survey was completed in fall 2017 and found
Case Study Murray-Darling Basin, Australia Eugene, OR. Valuing a Watershed s Natural Capital
 Case Study Murray-Darling Basin, Australia Eugene, OR Valuing a Watershed s Natural Capital The Academy s June 21, 2012 webinar, with guests Rosalind Bark, Resource Ecological Specialist at Australia s
Results for the Puget Sound
 Northwest Forest Plan -The First 15 Years (1994-2008) Watershed Condition Status and Trend Results for the Puget Sound Steve Lanigan, Sean Gordon, Peter Eldred, Stephanie Miller July, 2013 The Northwest
Chapter 1: Preparing a Woodland Stewardship Plan
 1 Chapter 1: Preparing a Woodland Stewardship Plan John G. DuPlissis, Forestry Outreach Specialist, University of Wisconsin Stevens Point Melvin J. Baughman, Extension Forester, University of Minnesota
Nehalem River Watershed Assessment 1
 Nehalem River Watershed Assessment 1 1.0 Introduction Purpose Watershed assessment is a process for evaluating how well a watershed is working. The purpose of this assessment was to determine how natural
Chapter 1: Preparing a Woodland Stewardship Plan. What will you do with your woodland? Some landowners choose to let nature take its course.
 1 Chapter 1: Preparing a Woodland Stewardship Plan John G. DuPlissis, Forestry Outreach Specialist, University of Wisconsin Stevens Point Melvin J. Baughman, Extension Forester, University of Minnesota
The Galton Project Kootenai National Forest. The Galton Project
 Introduction The Galton Project The Fortine Ranger District of the Kootenai National Forest is in the early stages of developing a project entitled Galton, named for the mountain range dominating the eastern
Nebraska. State & Private Forestry Fact Sheet. Investment in State's Cooperative Programs: Key Issues:
 Nebraska Investment in State's Cooperative Programs: Program State & Private Forestry Fact Sheet FY 2006 Final FY 2007 Estimate Cooperative Lands - Forest Health Management 65,000 65,000 Cooperative Lands
2013 Western Washington Hardwood Assessment. University of Washington. Institute of Forest Resources. Luke Rogers John Perez-Garcia B.
 2013 Western Washington Hardwood Assessment & University of Washington Institute of Forest Resources Luke Rogers John Perez-Garcia B. Bruce Bare School of Environmental & Forest Sciences College of the
Forecasting Timber, Biomass, and Tree Carbon Pools with the Output of State and Transition Models
 Proceedings of the First Landscape State-and-Transition Simulation Modeling Conference, June 14 16, 2011 Forecasting Timber, Biomass, and Tree Carbon Pools with the Output of State and Transition Models
The New Economies of the Redwood Region in the 21 st Century 1
 The New Economies of the Redwood Region in the 21 st Century 1 William Stewart 2 Abstract The redwood region of California has experienced a number of major land use changes over the past one hundred and
Free Bridge Congestion Relief Project: Using FHWA s Eco-Logical Process
 Free Bridge Congestion Relief Project: Using FHWA s Eco-Logical Process An Ecosystem Approach to Developing Infrastructure Projects June 27, 2014 Charlottesville Albemarle Metropolitan Planning Organization
A Report on the City of Baltimore s Existing and Possible Urban Tree Canopy
 A Report on the City of Baltimore s Existing and Possible Urban Why is Important? Urban tree canopy (UTC) is the layer of leaves, branches, and stems of trees that cover the ground when viewed from above.
South Dakota Forest Stewardship Program Spatial Analysis Project. Summary and Methodology Report
 South Dakota Forest Stewardship Program Spatial Analysis Project Summary and Methodology Report September 2007 South Dakota Forest Stewardship Program Spatial Analysis Project Summary and Methodology Report
Montana s Forest Industry & Wood Products Todd A. Morgan, CF
 Montana s Forest Industry & Wood Products Todd A. Morgan, CF Montana Forests & Timber 25.9 million acres 69% federal ownership National Forests 61% of timberland 76% of timber volume 20-25% of annual harvest
Laura Zanolli Geography Major/GIS/Geology/Water Resources Portland State University
 Laura Zanolli Geography Major/GIS/Geology/Water Resources Portland State University The canopy is one part of a system of shade and cover that promotes bank stability and along with vegetation helps to
Long Prairie River Watershed Restoration and Protection Strategies (WRAPS) Report Summary
 Report Summary") Long Prairie River Watershed Restoration and Protection Strategies (WRAPS) Report Summary Minnesota has adopted a watershed approach to address the state s 80 major watersheds (denoted by 8-digit hydrologic
Long Prairie River Watershed Restoration and Protection Strategies (WRAPS) Report Summary Minnesota has adopted a watershed approach to address the state s 80 major watersheds (denoted by 8-digit hydrologic
LUCIS Modeling for Renewable Energy in Cochise County, Arizona
 LUCIS Modeling for Renewable Energy in Cochise County, Arizona Melanie Meyers Colavito 1, Iris Patten 2, Mark Apel 3 & Erik Glenn 4 1 School of Geography and Development, University of Arizona, Tucson,
LOWER DRUM PLANNING UNIT Yuba-Bear River Watershed
 Existing Conditions & Uses Overview Provides open space and recreation opportunities within the Sierra Nevada foothills 1,098 acres in Placer and Nevada Counties 789 acres outside the FERC boundary; 309
RESTORATION OF RARE PLANTS OF THE PALOUSE. Trish Heekin Conservation Planner Latah Soil and Water Conservation District
 RESTORATION OF RARE PLANTS OF THE PALOUSE Trish Heekin Conservation Planner Latah Soil and Water Conservation District Rare Plants of the Palouse We ve already covered What are they? Where do they occur?
Heather Brower- Scobey, MT
 Pheasants Forever The Habitat Organization Pheasants Forever, NRCS, and Montana Fish, Wildlife & Parks Farm Bill Wildlife Biologist Partnership Quarterly Progress report 2018 Q1 Heather Brower- Scobey,
Rogue Basin Ecological Integrity Assessment and Climate Change Management Interactions
 Rogue Basin Ecological Integrity Assessment and Climate Change Management Interactions Jimmy Kagan OSU PSU UO Ecological Integrity Measures (by area) Land management status Landscape features Habitat characteristics
8.0 MONTANA S NONPOINT SOURCE PRIORITIES AND ACTION PLAN
 8.0 MONTANA S NONPOINT SOURCE PRIORITIES AND ACTION PLAN The goal of Montana s Nonpoint Source Management Program is to provide a clean and healthy environment by protecting and restoring water quality
Capacity and Capability of Mills in the Bitterroot National Forest Timber-Processing Area
 Capacity and Capability of Mills in the Bitterroot National Forest Timber-Processing Area Addendum to: Timber Use, Processing Capacity, and Capability to Utilize Small-Diameter Timber Within USDA Forest
Forest Stewardship Program
 Forest Stewardship Program James Starr, Forest Management 06/2003 Purpose of Forest Stewardship Program is to assist private forest landowners in more actively managing their forest and related resources;
NDSU - North Dakota Forest Service North Dakota Cooperative Fire Protection Initiative Budget Request
 Agency Information NDSU - North Dakota Forest Service North Dakota Cooperative Fire Protection Initiative 2015-17 Budget Request North Dakota State Board of Higher Education May 29, 2014 NDSU-North Dakota
State Forest Action Plans: Protecting, Enhancing and Conserving State and Private Forests
 State Forest Action Plans: Protecting, Enhancing and Conserving State and Private Forests Joint Forestry Team USDA Forest Service (USFS) Natural Resource Conservation Service (NRCS) National Association
Introduction. Methodology for Analysis
 Scenic Report Prepared by: /s/gary Kedish Natural Resources Specialist for: Warner Mountain Ranger District Modoc National Forest January 20, 2016 Introduction This report focuses on the Visual Quality
Linda Joyce. USFS Rocky Mountain Research Station, October 13, 2015
 Linda Joyce USFS Rocky Mountain Research Station, October 13, 2015 Context, Opportunities, Challenges Forests where are they, how productive, what are they valued for, and what are the threats currently
JUNE 20, Collaborative Initiatives: Restoring watersheds and large landscapes across boundaries through State and Federal partnerships
 TESTIMONY of LESLIE WELDON DEPUTY CHIEF, NATIONAL FOREST SYSTEM UNITED STATES DEPARTMENT OF AGRICULTURE FOREST SERVICE BEFORE THE SENATE COMMITTEE ON ENERGY AND NATURAL RESOURCES SUBCOMMITTEE ON PUBLIC
Montana DNRC Trust Land Management Division Forest Management Program. Presented by: Shawn Thomas Chief, Forest Management Bureau
 Presented by: Shawn Thomas Chief, Forest Management Bureau sthomas@mt.gov Purpose Provide Land Board members understanding of the Trust Land Management Division Presentation Overview TLMD and General Overviews
Appendix A: Vegetation Treatments
 Appendix A: Vegetation Treatments In general, the proposed actions for the Light Restoration project focuses on establishing the composition, structure, pattern, and ecological processes necessary to make