COMPETITIVITATEA TRANSPORTULUI FEROVIAR DE MĂRFURI, ÎN EUROPA ŞI ÎN ROMÂNIA
|
|
|
- Joshua Ferguson
- 5 years ago
- Views:
Transcription
1 COMPETITIVITATEA TRANSPORTULUI FEROVIAR DE MĂRFURI, ÎN EUROPA ŞI ÎN ROMÂNIA Railway PRO Technology & Services Forum Arad, 5-6 aprilie 2017, Daniel Ciobanu
2 COMPETITIVITATEA TRANSPORTULUI FEROVIAR DE MĂRFURI ÎN EUROPA Railway PRO Technology & Services Forum, Arad 5-6 aprilie 2017


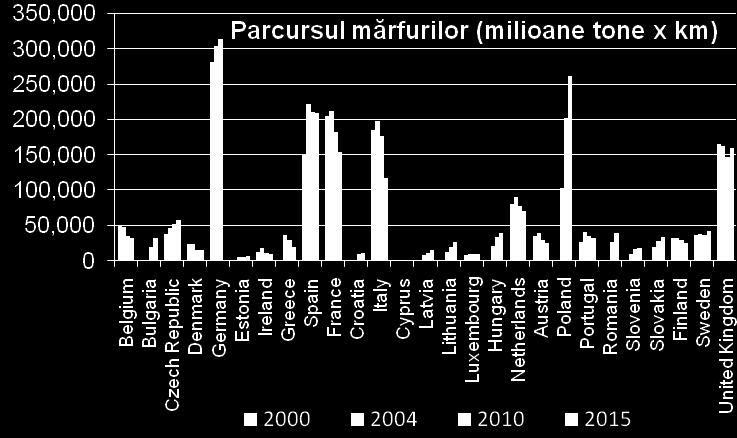
3 VOLUMUL TRAFICULUI Sursa datelor: Eurostat Railway PRO Technology & Services Forum, Arad 5-6 aprilie


4 COTE DE PIAŢA Sursa datelor: Eurostat Railway PRO Technology & Services Forum, Arad 5-6 aprilie
5 MĂRFURI TRANSPORTATE Products of agricultur e, hunting, and forestry; fish and other fishing products Metal ores and Coal and other lignite; mining crude and petroleu m and natural gas quarryin g product s; peat; uranium and thorium Food product s, beverag es and tobacco Textiles and textile products; leather and leather products Wood and products of wood and cork (except furniture); articles of straw and plaiting materials; pulp, paper and paper products; printed matter and recorded media Coke and refined petroleu m product s Chemicals, chemical products, and manmade fibers; rubber and plastic products ; nuclear fuel Other non metallic mineral product s Basic metals; fabricated metal products, except machinery and equipment Machinery and equipment n.e.c.; office machinery and computers; electrical machinery and apparatus n.e.c.; radio, Transport television equipment and communicati on equipment and apparatus; medical, precision and optical instruments; watches and clocks Furniture; other manufact ured goods n.e.c. Secondary raw materials; municipal wastes and other wastes Mail, parcels Equipme nt and material utilized in the transport of goods Goods moved in the course of household and office removals; baggage and articles accompanying Grouped goods: a mixture of types of goods which travellers; are motor vehicles transported being moved together for repair; other non market goods n.e.c. Unidentifiable goods: goods which for any reason cannot be identified and therefore cannot be assigned to groups % 23.2% 21.9% 2.3% 0.1% 1.9% 9.3% 16.4% 6.2% 6.3% 0.5% 1.4% 0.0% 5.5% 0.0% 0.3% 0.0% 2.6% 0.9% 0.2% Czech Republic 4.5% 32.4% 12.3% 0.4% 0.0% 1.0% 7.9% 4.2% 1.6% 6.1% 0.0% 2.7% 0.0% 3.0% 0.0% 0.4% 0.0% 14.3% 9.3% 0.4% Denmark 1.0% 0.0% 0.6% 0.6% 0.0% 27.3% 0.0% 3.5% 3.0% 18.3% 0.8% 1.5% 0.0% 3.2% 0.0% 3.5% 0.0% 4.1% 32.8% 16.1% Germany 1.1% 11.0% 13.7% 0.5% 0.0% 2.5% 11.6% 8.1% 3.5% 16.2% 0.3% 3.9% 0.0% 3.8% 0.0% 1.2% 0.0% 1.3% 21.2% 0.5% Estonia 0.4% 47.4% 2.9% 0.4% 0.0% 0.1% 29.1% 17.0% 1.6% 0.5% 0.2% 0.0% 0.1% 0.0% 0.0% 0.0% 0.2% 0.0% 0.0% 0.1% Ireland 11.7% 0.0% 55.4% 33.0% 0.0% 0.0% 0.0% 0.0% 0.0% 0.0% 0.0% 0.0% 0.0% 0.0% 0.0% 0.0% 0.0% 0.0% 0.0% 0.0% Greece 5.4% 2.3% 0.0% 4.1% 0.0% 9.1% 6.6% 1.6% 7.3% 18.6% 1.1% 0.0% 0.9% 0.0% 0.0% 41.3% 0.0% 0.0% 1.7% 0.0% Spain 7.5% 21.6% 3.3% 0.6% 0.0% 4.6% 1.8% 5.0% 3.7% 12.5% 0.0% 7.2% 0.0% 0.3% 0.0% 0.9% 0.0% 3.1% 28.0% 0.0% France 11.3% 1.9% 12.0% 4.6% 0.0% 1.0% 7.2% 8.1% 7.4% 14.8% 0.1% 6.5% 0.2% 1.5% 0.0% 0.7% 0.0% 6.7% 16.1% 0.8% Croatia 9.5% 16.0% 23.1% 4.4% 0.0% 1.1% 12.8% 13.2% 1.6% 8.5% 0.2% 0.5% 0.0% 3.7% 0.0% 0.5% 0.0% 0.0% 4.8% 0.0% Italy 3.2% 0.6% 4.3% 2.8% 0.6% 2.3% 2.7% 3.6% 1.7% 14.5% 0.1% 1.6% 0.0% 1.9% 0.0% 2.1% 0.0% 5.8% 52.2% 0.8% Latvia 4.4% 34.3% 2.0% 3.1% 0.1% 2.8% 39.1% 10.6% 0.1% 2.3% 0.2% 0.2% 0.1% 0.0% 0.0% 0.0% 0.0% 0.0% 0.8% 0.0% Lithuania 7.3% 5.7% 9.2% 4.6% 0.0% 1.8% 29.0% 31.4% 2.6% 6.9% 0.1% 0.5% 0.0% 0.5% 0.0% 0.1% 0.1% 0.0% 0.0% 0.0% Hungary 11.9% 17.2% 19.1% 1.1% 0.1% 3.0% 9.9% 9.4% 2.1% 8.8% 1.4% 2.1% 0.1% 2.1% 0.0% 0.2% 0.0% 0.5% 11.0% 19.8% Netherlands 0.8% 21.7% 15.1% 0.7% 0.0% 2.2% 1.6% 8.0% 1.3% 6.9% 0.0% 2.5% 0.0% 0.9% 0.0% 1.5% 0.1% 0.4% 36.5% 0.0% Austria 7.4% 3.5% 12.7% 1.2% 0.0% 5.3% 6.6% 4.5% 1.7% 8.3% 0.2% 5.9% 0.0% 6.2% 0.0% 0.9% 0.0% 0.0% 35.6% 0.0% Poland 2.0% 43.2% 26.4% 0.9% 0.0% 0.9% 11.4% 4.0% 1.3% 3.5% 0.1% 0.4% 0.0% 1.7% 0.0% 0.4% 0.0% 0.1% 3.5% 1.3% Portugal 9.8% 0.0% 9.7% 0.5% 0.0% 3.2% 15.1% 2.0% 17.0% 10.9% 0.0% 0.0% 0.0% 2.9% 0.0% 2.2% 0.0% 0.0% 26.6% 0.0% 6.6% 36.1% 4.5% 1.1% 0.0% 3.9% 30.7% 4.7% 3.4% 4.2% 0.1% 0.3% 0.0% 1.2% 0.0% 0.4% 0.0% 0.3% 2.4% 0.8% Slovenia 9.5% 8.9% 20.0% 1.1% 0.0% 3.6% 10.8% 1.9% 1.3% 7.6% 0.3% 1.9% 0.0% 4.6% 0.0% 0.7% 0.0% 0.1% 27.8% 2.6% Slovakia 9.3% 9.4% 39.9% 0.5% 0.0% 0.8% 8.2% 8.2% 1.6% 11.0% 0.0% 2.4% 0.0% 4.3% 0.0% 0.5% 0.0% 0.0% 3.8% 19.9% Finland 33.3% 1.5% 16.4% 0.1% 0.0% 23.5% 4.4% 14.1% 0.3% 5.9% 0.1% 0.2% 0.0% 0.3% 0.0% 0.0% 0.0% 0.0% 0.0% 0.0% Sweden 13.6% 0.3% 42.8% 1.3% 0.0% 9.4% 2.2% 2.0% 0.5% 7.3% 0.1% 1.4% 0.1% 2.4% 0.4% 1.5% 0.0% 0.4% 14.2% 0.0% United Kingdom 4.3% 25.8% 7.6% 0.2% 0.0% 0.0% 4.3% 3.7% 21.2% 8.6% 0.0% 0.6% 0.0% 2.9% 0.2% 0.0% 0.0% 16.1% 4.5% 0.0% Sursa datelor: Eurostat Railway PRO Technology & Services Forum, Arad 5-6 aprilie Other goods n.e.c.
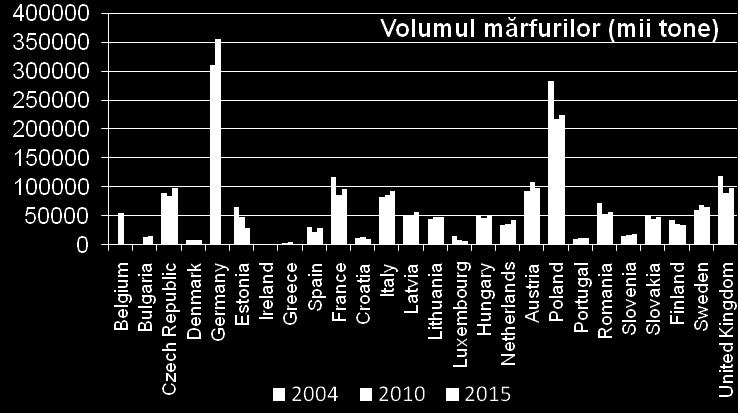
6 MĂRFURI TRANSPORTATE Mii tone United Kingdom Sweden Finland Slovakia Slovenia Portugal Poland Austria Netherlands Hungary Lithuania Latvia Italy Croatia France Spain Greece Ireland Estonia Germany Denmark Czech Republic United Kingdom Sweden Finland Slovakia Slovenia Portugal Poland Austria Netherlands Hungary Lithuania Latvia Italy Croatia France Spain Greece Ireland Estonia Germany Denmark Czech Republic United Kingdom Sweden Finland Slovakia Slovenia Portugal Poland Austria Netherlands Hungary Lithuania Latvia Italy Croatia France Spain Greece Ireland Estonia Germany Denmark Czech Republic United Kingdom Sweden Finland Slovakia Slovenia Portugal Poland Austria Netherlands Hungary Lithuania Latvia Italy Croatia France Spain Greece Ireland Estonia Germany Denmark Czech Republic 0 100,000200,000300, , , ,000 1,000, ,000 Products of agriculture, hunting, and forestry; fish and other fishing products Coal and lignite; crude petroleum and natural gas Metal ores and other mining and quarrying products; peat; uranium and thorium Food products, beverages and tobacco Sursa datelor: Eurostat Railway PRO Technology & Services Forum, Arad 5-6 aprilie
7 MĂRFURI TRANSPORTATE Mii tone United Kingdom Sweden Finland Slovakia Slovenia Portugal Poland Austria Netherlands Hungary Lithuania Latvia Italy Croatia France Spain Greece Ireland Estonia Germany Denmark Czech Republic 0 5,000 10,000 15,000 Textiles and textile products; leather and leather products Sursele datelor: Eurostat United Kingdom Sweden Finland Slovakia Slovenia Portugal Poland Austria Netherlands Hungary Lithuania Latvia Italy Croatia France Spain Greece Ireland Estonia Germany Denmark Czech Republic 0 50, ,000 Wood and products of wood and cork (except furniture); articles of straw and plaiting materials; pulp, paper and paper products; printed matter and recorded United Kingdom Sweden Finland Slovakia Slovenia Portugal Poland Austria Netherlands Hungary Lithuania Latvia Italy Croatia France Spain Greece Ireland Estonia Germany Denmark Czech Republic 0 40,000 80,000 Coke and refined petroleum products United Kingdom Sweden Finland Slovakia Slovenia Portugal Poland Austria Netherlands Hungary Lithuania Latvia Italy Croatia France Spain Greece Ireland Estonia Germany Denmark Czech Republic 0 100,000 Chemicals, chemical products, and man-made fibers; rubber and plastic products ; nuclear fuel Railway PRO Technology & Services Forum, Arad 5-6 aprilie
8 MĂRFURI TRANSPORTATE Mii tone United Kingdom Sweden Finland Slovakia Slovenia Portugal Poland Austria Netherlands Hungary Lithuania Latvia Italy Croatia France Spain Greece Ireland Estonia Germany Denmark Czech Republic United Sweden Finland Slovakia Slovenia Portugal Poland Austria Netherla Hungary Lithuania Latvia Italy Croatia France Spain Greece Ireland Estonia Germany Denmark Czech United Kingdom Sweden Finland Slovakia Slovenia Portugal Poland Austria Netherlands Hungary Lithuania Latvia Italy Croatia France Spain Greece Ireland Estonia Germany Denmark Czech Republic United Kingdom Sweden Finland Slovakia Slovenia Portugal Poland Austria Netherlands Hungary Lithuania Latvia Italy Croatia France Spain Greece Ireland Estonia Germany Denmark Czech Republic 0 200, , , , ,000 80,000 Other non metallic mineral products Basic metals; fabricated metal Machinery and equipment n.e.c.; office products, except machinery and machinery and computers; electrical machinery equipment and apparatus n.e.c.; radio, television and communication equipment Transport equipment Sursa datelor: Eurostat Railway PRO Technology & Services Forum, Arad 5-6 aprilie
9 MĂRFURI TRANSPORTATE Mii tone United Sweden Finland Slovakia Slovenia Portugal Poland Austria Netherl Hungary Lithuania Latvia Italy Croatia France Spain Greece Ireland Estonia Germany Denmark Czech United Kingdom Sweden Finland Slovakia Slovenia Portugal Poland Austria Netherlands Hungary Lithuania Latvia Italy Croatia France Spain Greece Ireland Estonia Germany Denmark Czech Republic United Kingdom Sweden Finland Slovakia Slovenia Portugal Poland Austria Netherlands Hungary Lithuania Latvia Italy Croatia France Spain Greece Ireland Estonia Germany Denmark Czech Republic United Kingdom Sweden Finland Slovakia Slovenia Portugal Poland Austria Netherlands Hungary Lithuania Latvia Italy Croatia France Spain Greece Ireland Estonia Germany Denmark Czech Republic 0 10,000 20,000-50,000 50, , , ,000 40,000 60, ,000 Furniture; other manufactured goods n.e.c. Sursa datelor: Eurostat Secondary raw materials; municipal wastes and other wastes Mail, parcels Equipment and material utilized in the transport of goods Railway PRO Technology & Services Forum, Arad 5-6 aprilie
10 MĂRFURI TRANSPORTATE Mii tone United Kingdom Sweden Finland Slovakia Slovenia Portugal Poland Austria Netherlands Hungary Lithuania Latvia Italy Croatia France Spain Greece Ireland Estonia Germany Denmark Czech Republic 0 40,000 80,000 United Kingdom Sweden Finland Slovakia Slovenia Portugal Poland Austria Netherlands Hungary Lithuania Latvia Italy Croatia France Spain Greece Ireland Estonia Germany Denmark Czech Republic 0 50,000100,000150,000 United Sweden Finland Slovakia Slovenia Portugal Poland Austria Netherlands Hungary Lithuania Latvia Italy Croatia France Spain Greece Ireland Estonia Germany Denmark Czech 0 50, ,000 United Sweden Finland Slovakia Slovenia Portugal Poland Austria Netherlands Hungary Lithuania Latvia Italy Croatia France Spain Greece Ireland Estonia Germany Denmark Czech Republic 0 50, ,000 Goods moved in the course of household and office removals; baggage and articles accompanying travellers; motor vehicles being moved for repair; other non Grouped goods: a mixture of types of goods which are transported together Unidentifiable goods: goods which for any reason cannot be identified and therefore cannot be assigned to groups Other goods n.e.c. Sursa datelor: Eurostat Railway PRO Technology & Services Forum, Arad 5-6 aprilie
11 TRANSPORTUL COMBINAT 100% 90% 80% 70% 60% 50% 40% 30% 20% 10% 0% Ponderea traficului combinat in totalul transportului feroviar (procent din tone transportate) Trafic conventional Transport combinat 100% 90% 80% 70% 60% 50% 40% 30% 20% 10% 0% Ponderea traficului combinat in totalul transportului feroviar (procent din tone x km) Trafic conventional Transport combinat Sursa datelor: Eurostat Railway PRO Technology & Services Forum, Arad 5-6 aprilie
12 TRANSPORTUL COMBINAT CONTAINERE SI CUTII MOBILE (TEU) Belgium 960,448 1,035, , , , ,293: : : : : 75, , ,818 57,327 51,679 53,272 63,725 35,419 31,608 Czech Republic 692, ,096 1,020, ,341 1,079,644 1,145,996 1,195,951 1,289,714 1,349,928 1,485,683 Denmark 252, , , , , , , , , ,635 Germany 4,833,220 5,603,297 6,023,299 5,078,291 5,614,553 5,921,037 6,228,484 6,456,060 6,272,430 5,979,035 Estonia 16,170 16,309: 17,355 22,484 34,538 48,863 62,014 72,019 42,995 Ireland 7,404 3,312 4,896 4,340 13,472 14,280 13,776 14,784 15,330 14,910 Greece 55, ,038 88, ,499 45, ,081 40, ,588 Spain 578, , , , , , , ,293 1,141,188 1,164,235 France : : : 1,094,046 1,007,059 1,112,848: : : : Croatia 59,226 91,234 96,577 64,786 69,582 44,214 37,743 41,299 40,792 34,115 Italy 2,563,382 2,539,719: 1,884,666: 2,040,988 2,128,603 2,192,242 2,237,547 1,689,060 Latvia 32,622 55,332 52,627 71,340 98, , ,083 97,700 97,017 69,779 Lithuania 58,444 95, ,711 70,247 78, , , ,952 90,745 69,964 Luxembourg 217,148: : : : : : : : : Hungary 431, , , , , , , , , ,093 Netherlands 681, ,534 1,785,808 1,271, , ,808: 1,297,304 1,362,921 1,497,640 Austria 1,215,686 1,336,403 1,398,429 1,130,447 1,456,358 1,488,480 1,380,577 1,399,707 1,521,912 1,575,298 Poland 1,268, , , , , ,564 1,031,252 1,088,618 1,044,870 1,050,557 Portugal 0 185, , , , , , , , , , , , , , , , , ,126 Slovenia 152, , , , , , , , , ,905 Slovakia 167, , , , , , , , , ,473 Finland 127, , ,960 89,334 70,204 60,174 43,105 42,211 41,137 33,434 Sweden 575, , , , , , , , , ,540 United Kingdom 1,071,285 1,134,173 1,213,165 1,181,793 1,175,928 1,124,693 1,183,535 1,160,016 1,315,549 1,185,015 Sursa datelor: Eurostat Railway PRO Technology & Services Forum, Arad 5-6 aprilie
13 TRANSPORTUL COMBINAT concurenţa cu transportul fluvial 60,000 Transporturi de containere mari [mii tone] 50,000 40,000 30,000 20,000 10,000 0 Belgium 2011 Czech Republic Germany France Croatia Hungary Netherlan ds Austria Poland Slovakia 15, ,212 64,358 14, ,816 15,304 18,208 9,507 2,053 4,709 Transport fluvial 23, ,724 4, , ,000 30,000 Transporturi de containere mari [milioane tone x km] 25,000 20,000 15,000 10,000 5,000 0 Belgium 2011 Czech Republic Germany France Croatia Hungary Netherla nds Austria Poland Slovakia 2,126 2, ,187 7, ,364 2,281 3,821 3, Transport fluvial , , Sursa datelor: Eurostat Railway PRO Technology & Services Forum, Arad 5-6 aprilie
14 COSTURI TAXE DE UTILIZARE A INFRASTRUCTURII Marfă (1000 tb) Călători (tren IC) Surse: Fourth report on monitoring development of the rail market, Raport al Comisiei Europene pentru Parlamentul European, 2014 Transportul feroviar de marfă nu este încă pe calea cea bună, Curtea de Conturi Europeană, Bruxelles, 2016 Railway PRO Technology & Services Forum, Arad 5-6 aprilie
15 CALITATE Viteza comercială Viteza comercială medie cu care circulă trenurile de marfă nu contribuie la îmbunătățirea situației nesatisfăcătoare a performanței transportului feroviar de marfă din punctul de vedere al volumului transportat și al ponderii modale în UE. Cu alte cuvinte, trenurile de marfă circulă lent și viteza acestora nu a crescut semnificativ în ultimul deceniu. Pe anumite rute internaționale, trenurile de marfă circulă cu o viteză medie de doar aproximativ 18 km/h. Printre cauze se numără și cooperarea deficitară dintre administratorii naționali de infrastructură. În statele membre din Europa Centrală și de Est, viteza medie este cuprinsă între 20 și 30 km/h. Situația este net superioară în cazul anumitor coridoare de transport feroviar de marfă (precum coridorul 1: Rin - alpin ), pe care viteza medie este de aproximativ 50 km/h, fiind deci aproape de viteza medie a camioanelor (circa 60 km/h). Sursa: Curtea Europeană de Conturi, Raportul special Transportul feroviar de marfă nu este încă pe calea cea bună, Bruxelles, 2016 Infrastructură Situația este exacerbată de infrastructura învechită, care a fost neglijată timp de mulți ani în favoarea transportului rutier, proiectele de infrastructură feroviară eventual implementate fiind axate pe dezvoltarea liniilor de mare viteză. Sursa: Curtea Europeană de Conturi, Raportul special Transportul feroviar de marfă nu este încă pe calea cea bună, Bruxelles, 2016 Consecinţă Transportul feroviar de marfă (și transportul combinat feroviar-rutier) se află în concurență directă cu transportul rutier de marfă: expeditorii compară cu regularitate cele două modalități atunci când decid modul de transport pe care îl vor utiliza. În mod firesc, aceștia vor alege modalitatea care corespunde cel mai bine nevoilor lor, luând în special în considerare criterii precum fiabilitatea, prețul, serviciile pentru clienți, frecvența și durata. Cu alte cuvinte, expeditorii aleg modalitatea de transport pe baza unor criterii comerciale, și nu pe baza priorităților de politică ale UE. Sursa: Curtea Europeană de Conturi, Raportul special Transportul feroviar de marfă nu este încă pe calea cea bună, Bruxelles, 2016 Railway PRO Technology & Services Forum, Arad 5-6 aprilie
16 STRUCTURA 90% 80% 70% 60% 50% 40% 30% 20% 10% 0% Czech Republic Pondere tone transportate, 2015 Hungary Austria Poland Slovakia Intern 70.35% 43.25% 28.63% 29.62% 76.55% 78.53% 17.01% Import 10.11% 28.25% 25.64% 26.62% 13.09% 12.16% 33.81% Export 12.46% 19.36% 25.86% 17.57% 9.22% 7.82% 24.80% Tranzit 7.07% 9.13% 19.87% 26.19% 1.14% 1.50% 24.39% Intern Import Export Tranzit 80% 70% 60% 50% 40% 30% 20% 10% 0% Czech Republic Pondere tone x km, 2015 Hungary Austria Poland Slovakia Intern 68.90% 36.26% 17.82% 22.59% 71.77% 72.82% 13.60% Import 7.65% 24.13% 25.68% 26.77% 14.18% 13.09% 26.79% Export 11.07% 25.34% 26.74% 19.87% 11.08% 10.39% 19.21% Tranzit 12.39% 14.27% 29.76% 30.76% 2.96% 3.69% 40.40% Intern Import Export Tranzit Sursa datelor: Eurostat Railway PRO Technology & Services Forum, Arad 5-6 aprilie
17 SUSŢINEREA TRANSPORTURILOR FEROVIARE Sprijin financiar pentru investiţii: ajutoare pentru construcţia şi dezvoltarea de terminale de transport combinat; ajutoare pentru achiziţia de echipamente utilizate în transportul combinat; ajutoare pentru elaborarea de studii de fezabilitate Subvenţii / ajutoare de stat pentru operare pentru: servicii de transport combinat însoţit sau neînsoţit. traficului de vagoane izolate transport feroviar de mărfuri periculoase Măsuri fiscale: scutire de la plata taxei pentru vehicule rutiere utilizate exclusiv în transportul combinat rambursarea unei părţi din taxa lunară pentru vehicule rutiere, pentru fiecare cursă efectuată în trenuri Ro-La; Tarifarea infrastructurii: taxe de utilizare a infrasttructurii feroviare mai mari pentru trenuri de călători decât pentru trenuri de marfă tarifarea utilizării infrastructurii rutiere la un nivel ridicat şi pe baza normelor privind poluarea mediului de către vehicule tarife speciale pentru utilizarea anumitor autostrăzi, inclusiv pentru circulaţia pe timp de noapte scutire de la plata taxelor de drum pentru transportatori rutieri străini, pe o anumită rază în jurul terminalelor de transport; Restricţii / intedicţii în transportul rutier: Interdicţii pentru transportul anumitor categorii de mărfuri; Interdicţii de circulaţie a vehiculelor grele, în anumite perioade şi / sau anumite zile şi / sau anumite intervale orare Alte forme de susţinere: acordare de autorizaţii de tranzit suplimentare pentru utilizatorii serviciilor Ro-La din ţări care nu sunt membre ale UE; recunoaşterea timpului petrecut în trenul Ro-La ca timp de repaus; Railway PRO Technology & Services Forum, Arad 5-6 aprilie

18 CFR MARFA IN CONTEXTUL VOLUMELOR DE TRAFIC EUROPEAN T o n e t r a n s p o r t a t e 250, , , ,000 i n , Railway PRO Technology & Services Forum, Arad 5-6 aprilie 2017

19 CONCURENŢA RUTELOR Coridorul II: Mai scurt cu 1100 km Coridorul V: Mai scurt Trenurile Viking + feribot de la Ilicevsk la Varna / Istanbul Mai scurt cu peste 400 km Trenuri + feribot rusesc de la Kavkaz la Varna Transport uri pentru proiectele Belene şi South Stream Preluare trafic din Asia Coridorul X: Mai scurt cu peste 500 km Coridorul IV via Serbia: Mai scurt cu 180 / 540 km Coridorul TRACECA - segmentul bulgar Problema interoperabilităţii rezolvată Railway PRO Technology & Services Forum, Arad 5-6 aprilie 2017
20 COMPETITIVITATEA TRANSPORTULUI FEROVIAR DE MĂRFURI ÎN ROMÂNIA Railway PRO Technology & Services Forum, Arad 5-6 aprilie 2017
![CFR MARFA - OPERATOR FEROVIAR NATIONAL Marfuri transportate [tone] 2015 27,785,066 2016 24,541,825 0 5,000,000 10,000,000 15,000,000 20,000,000 25,000,000 30,000,000 Activitate principală: transport](/docs-images/82/86413836/images/21-0.jpg "feroviar de marfă Sediu central: Bucuresti 4 Sucursale şi 4 Centre Zonale 1 Centru de intretinere si reparatii vagoane CFR IRLU - reparatii locomotive si utilaje Casa de expeditie Rofersped SA 8")
21 CFR MARFA - OPERATOR FEROVIAR NATIONAL Marfuri transportate [tone] ,785, ,541, ,000,000 10,000,000 15,000,000 20,000,000 25,000,000 30,000,000 Activitate principală: transport feroviar de marfă Sediu central: Bucuresti 4 Sucursale şi 4 Centre Zonale 1 Centru de intretinere si reparatii vagoane CFR IRLU - reparatii locomotive si utilaje Casa de expeditie Rofersped SA 8 Depouri de exploatare 11 Remize de locomotive 13 Revizii de vagoane 8 Terminale de containere operationale 1 Terminal ferry-boat Constanta Personal: 6508 angajati Parc de locomotive: 907 Parc de vagoane: ~ Railway PRO Technology & Services Forum, Arad 5-6 aprilie 2017
22 INFRASTRUCTURA Parametrul UM Obiectiv Linii modernizate Linii noi Valoarea actuală Gabarit AGTC - B C B Intermodal - P/C 70 P/C 400 P/C 45 P/C 375 Viteza maximă de circulaţie a trenurilor de marfă [km/h] Viteză comercială 17,49 Sarcina maximă pe osie v 100 km/h 22,5 22,5 [t/osie] v 120 km/h ,5 Sarcina admisă pe metru liniar [t/m] 8 8 7,2 Lungimea maximă a trenurilor [m] Tonajul brut al trenurilor de UTI-uri [t] Railway PRO Technology & Services Forum, Arad 5-6 aprilie
23 Mii tone Milioane tone x km CONCURENŢA intre MODURI DE TRANSPORT Marfuri transportate, pe moduri de transport Transport pe cai navigabile interioare Transport maritim Transport aerian Conducte petroliere magistrale Parcursul marfurilor, pe moduri de transport Transport pe cai navigabile interioare Conducte petroliere magistrale Sursa datelor: Institutul Naţional de Statistică Railway PRO Technology & Services Forum, Arad 5-6 aprilie

24 CONCURENŢA intre MODURI DE TRANSPORT Cota de piață pe moduri de transport feroviar 17,0 15,7 15,2 14,5 12,2 17,4 19,1 17,6 15,8 15,9 16,5 rutier 75,6 77,6 78,8 79,5 71,0 57,4 57,6 59,4 60,2 59,7 59,3 fluvial 4,1 3,6 3,3 3,3 6,0 10,5 9,2 8,8 8,4 8,7 9,0 maritim 0,0 0,0 0,0 0,0 8,7 12,5 12,2 12,4 13,7 13,7 13,3 aerian 0,001 0,001 0,001 0,001 0,006 0,008 0,008 0,009 0,010 0,010 0,010 conducte 3,3 3,2 2,7 2,7 2,1 2,2 1,9 1,8 1,8 2,0 2,0 TOTAL 100,0 100,0 100,0 100,0 100,0 100,0 100,0 100,0 100,0 100,0 100,0 Railway PRO Technology & Services Forum, Arad 5-6 aprilie 2017 Sursa datelor: Institutul Naţional de Statistică

.")
25 CONCURENŢA intre MODURI DE TRANSPORT Distribuţia pieţei de transport de marfă în România CFR Marfa 6,86% Operatori feroviari privati 7.99% 60.99% Transport fluvial 8.86% Transport aerian 0.01% Transport maritim 13.32% Transport prin conducte 1.96% *INS 2016 Transportul rutier a luat amploare începând cu anul1990, odată cu dezvoltarea parcului auto şi a infrastructurii rutiere şi renunțarea la prevederile care favorizau traficul feroviar (interzicerea traficului rutier peste 50 km). Railway PRO Technology & Services Forum, Arad 5-6 aprilie 2017
26 MĂRFURI Alte marfuri n.c.a. Marfuri neidentificabile: marfuri care din anumite motive nu 2015 Marfuri grupate: un amestec de tipuri de marfuri Marfuri deplasate pe parcursul mutarilor de domiciliu sau Echipamente si materiale utilizate in transportul de marfuri Posta, colete Transport Fluvial Materiale secundare neprelucrate; deseuri municipale si Mobila; alte marfuri fabricate n.c.a. Echipamente pentru transport Masini si utilaje n.c.a.; echipamente de birou si computere; Metale de baza; produse fabricate din metal, cu exceptia Alte produse minerale nemetalice Transport rutier Transport Feroviar Chimicale, produse chimice si fibre manufacturate; produse Cocs, produse rafinate din petrol Lemn si produse din lemn si pluta (cu exceptia mobilei); Textile si produse textile; piele si produse din piele Produse alimentare, bauturi si tutun Minereuri metalifere si alte produse de minerit si exploatare Carbune si lignit; titei si gaze naturale Produse agricole, din vanatoare si silvicultura; peste si alte Mii tone Sursa datelor: Institutul Naţional de Statistică Railway PRO Technology & Services Forum, Arad 5-6 aprilie
27 MĂRFURI Evoluţia pieţei de mărfuri care se transportă pe calea ferată 2016/2015 CREŞTERI Fabricarea produselor obtinute din prelucrarea titeiului 7,3 % Fabricarea altor produse din minerale nemetalice 9,4 % Industria constructiilor metalice si a produselor din metal 1,3 % industria alimentară 3,1 % industria de fabricare a autovehiculelor de transport rutier 8,9 % SCĂDERI Extractia carbunelui 10 % Extractia minereurilor metalifere 0,2 % Industria metalurgica 2,3 % Lucrarile de constructii 1,1 % Prelucrarea lemnului 0,7 % Industria chimica 4,5 % Sursa datelor: Institutul Naţional de Statistică Railway PRO Technology & Services Forum, Arad 5-6 aprilie

28 Evolutia transportului feroviar in ( mii tone ) STRUCTURA CFR Marfă OTF Railway PRO Technology & Services Forum, Arad 5-6 aprilie 2017

29 STRUCTURA Evoluția mărfurilor transportate în sistem feroviar Marfuri transportate in sistem feroviar Railway PRO Technology & Services Forum, Arad 5-6 aprilie 2017
30 COMPETITIVITATE Factori ce influenteaza competitivitatea transportului feroviar de marfa din : Conditii tot mai severe pentru realizarea prestatiilor pe infrastructura feroviara Cerinte de optimizare a timpului de transport in conditiile unei viteze comerciale reduse Presiune tot mai mare pe preturi si termene de plata Alocare periodica de resurse logistice suplimentare Railway PRO Technology & Services Forum, Arad 5-6 aprilie 2017


31 poarta catre Europa COMPETITIVITATE Portul Constanta cele mai mari si mai diversificate facilitati la Marea Neagra Acces direct al clientilor in zona Uniunii Europene Avantaje competitive ale transportului feroviar de marfa Posibilitatea utilizarii altor sisteme de transport in extensie fata de transportul feroviar Preturi competititive in contextul unei piete liberalizate a transportului feroviar de marfa Coridoarele Pan Europene IV si IX Railway PRO Technology & Services Forum, Arad 5-6 aprilie 2017


, conform unui")

32 CONCURENŢA RUTIERĂ Mărfuri transportate pe tipuri de vehicule rutiere Mărfuri transportate de sistemul rutier, pe distanţe 2.1% 6.3% 5.9% 4.4% 1.1% 37.6% 39.6% 9.0% 55.4% 17.9% 20.8% 3,5-7,5 tone 7,6-12,0 tone 12,1-17,0 tone Peste 17,0 tone Sursa datelor: Institutul Naţional de Statistică >50 km km km km km km km Sursa datelor: Institutul Naţional de Statistică Observaţie: Dacă ar prelua în întregime prestaţiile efectuate în autocamioane grele, sistemul feroviar ar putea doar să-şi dubleze performanţele. Transporturile în autocamione grele se derulează cu costuri de: în trafic intern, 0,65 euro/km (circa 2,9 lei/km), conform unui studiu UNTRR în anul 2013; în trafic internaţional, 0,79 euro/km, conform unui studiu prezentat în numărul din august 2013 al revistei Tranzit. Oportunismul este cuvântul de ordine : tarifele de transport au fost şi sunt negociate/schimbate lunar, clienţi importanţi se pierd "de pe o zi pe alta". Railway PRO Technology & Services Forum, Arad 5-6 aprilie
33 CONCURENŢA RUTIERĂ putine restricţii de circulaţie Indicativ drum A2 DN 7 DN 39 DN 22C DN 1 DN 1 Traseu Sens de parcurs Bucureşti (int. A2 cu CB) - Bucureşti - Fundulea-Lehliu (int. A2 cu Constanţa DN 3) - Feteşti (int. A2 cu Constanţa DN 3B) - Cernavodă (int. - Bucureşti A2 cu DN 3) - Murfatlar (int. Feteşti - A2 cu DN 3) Cernavodă Piteşti (ieşire din municipiu) - Râmnicu Vâlcea - Vestem (int.dn 7 cu DN 1) Agigea (int. DN 39 cu DN 39A) - Mangalia (intrare municipiu) Murfatlar (int. DN 22C cu DN 3) - Cernavodă (int. DN 22C cu A2) DN1, km (limita oraş Otopeni) - Ploieşti (int. DN 1 cu DN1A) Ploieşti (int. DN 1 cu DN 1B) - Braşov (int. DN 1 cu DN 1 A) ambele sensuri ambele sensuri Murfatlar - Cernavodă ambele sensuri ambele sensuri În ziua anterioară primei zile de sărbătoare legală 16,00-22,00 16,00-22,00 16,00-22,00 Perioada, zilele şi intervalele orare restricţionate Perioada din an, zilele şi intervalele orare În zilele de sărbătoare legală 6,00-22,00 6,00-22,00 6,00-22, ianuarie- 31 decembrie Perioada din an 1 iulie - 31 august 1 iulie - 31 august 1 iulie - 31 august 1 iulie - 31 august Luni - Joi vineri sâmbătă duminică - 12,00-24,00 6,00-14, ,00-24,00 12,00-24, ,00-22,00 6,00-22, ,00-22,00 0,00-24,00 0,00-24,00 6,00-22,00 12,00-24,00 0,00-24,00 Railway PRO Technology & Services Forum, Arad 5-6 aprilie
34 TRAFIC COMBINAT TRAFIC DE UTI, [TEU] Germania Sursele datelor: OECD, Eurostat 100% 90% 80% 70% 60% 50% 40% 30% 20% 10% 0% Structura traficului, 2015 Germania 100% 90% 80% 70% 60% 50% 40% 30% 20% 10% 0% % în tone transportate, 2014 Germania 100% 90% 80% 70% 60% 50% 40% 30% 20% 10% 0% % în tone x km, 2014 Germania TEU goale TEU incarcate Intermodal Vagoane conventionale Intermodal Vagoane conventionale Sursele datelor: Eurostat Railway PRO Technology & Services Forum, Arad 5-6 aprilie
35 TRAFIC COMBINAT Concurenţa pentru serviciile de transport combinat neînsoţit cu componentă feroviare: sistemul rutier: pe relaţii cu portul Constanţa: circa 30% din containerele sosite / expediate din / către Portul Constanţa pe cale terestră sau pe Dunăre; avantajele oferite de autostrada A2: durate de transport şi costuri scăzute, în special pentru clienţii din Bucureşti). pe relaţii care leagă terminale aflate la frontiera de vest a României (în special Rail Port Arad din staţia Curtici) de diferite localităţi din România, inclusiv unele aflate la mare distanţă (de exemplu, Bucureşti). Organizatorii de transport optează de regula pentru utilizarea sistemului feroviar în ţările vecine României şi pentru servicii rutiere în România. pe alte relaţii. sistemul fluvial: n River Shipping, care transportă containere pe barje pe relaţii care leagă portul Constanţa de porturi dunărene din sau Serbia. Numărul de containere preluat de sistemul fluvial este mic (1380 TEU, în 2015). Railway PRO Technology & Services Forum, Arad 5-6 aprilie
36 EUORO / CAMION TAXA DE UTILIZARE A INFRASTRUCTURII FEROVIAIRE vs. ROVINIETA LEI / TKM Transport feroviar Bucuresti - Craiova transport rutier Bucuresti - Craiova Transport feroviar Bucuresti - Port Constanta Bucuresti - Port Constanta - Austria - vehicule cu 3 axe si masa >3,5 t, EURO 6 - Austria - vehicule cu 4 axe si masa >3,5 t EURO 6 Taxa de pod Taxa de drum TUI (tren 3000 tb) Bucuresti - Arad Tren Ro-La (grad încărcare 80%) Railway PRO Technology & Services Forum, Arad 5-6 aprilie

37 COSTURI Intensitatea necesară pentru ajutorul de stat : 60% Railway PRO Technology & Services Forum, Arad 5-6 aprilie
38 BENEFICII Circulaţia zilnică între Bucureştii Noi şi Constanţa Ferry-Boat a unei perechi suplimentare de trenuri cu 33 containere de 40 înseamnă: 1. Economii de motorină de aproximativ 220 t/an; 2. Economii de energie primară + reducerea emisiilor de noxe. Energia primară [kj/an] Emisii de dioxid de carbon (CO 2 ) [t/an] 4568,23 Emisii de oxizi de azot (NOx) [t/an] 28,38 Emisii de dioxid de sulf (SO 2 ) [t/an] 2,16 Emisii de compusi organici volatili nemetanici [t/an] 4,87 Emisii de particule fine (praf) [t/an] -0,24 Calcule CFR Marfă, bazate pe date din proiectul EcotransIT Railway PRO Technology & Services Forum, Arad 5-6 aprilie
39 RESTANTE Programul de susţinere a transporturilor combinate de tip Ro-La Scrisoarea Comisiei Europene nr. C(2015) 2584 final având ca obiect Ajutorul de stat SA (2014/N) România - Schema de ajutor de stat pentru transportul combinat de tip Ro-La: În consecinţă, Comisia decide să nu ridice obiecţii cu privire la ajutor, deoarece acesta este compatibil cu piaţa internă, în conformitate cu articolul 93 din Tratatul privind funcţionarea Uniunii Europene. Perioada de valabilitate a avizului: ; Intensitatea prevăzută pentru ajutorul de stat: 60%; Programul nu a fost lansat până în prezent. Railway PRO Technology & Services Forum, Arad 5-6 aprilie
40 CONCLUZII ACŢIUNI NECESARE PENTRU CRESTEREA COMPETITIVITATII Modificarea legislaţiei Principiile de tarifare a utilizării infrastructurii si a serviciilor conexe Nivelul de accizare a motorinei Principiile de tarifare si furnizare a energiei electrice de tractiune Restricţii de circulaţie pe drumurile publice Regulamente feroviare Resursele umane Altele ( tarife AFER/AGIFER, autoritati / organisme nou infiintate ) Reabilitarea / dezvoltarea / modernizarea infrastructurii şi a terminalelor Promovarea serviciilor ecologice Suport pentru investiţii / Ajutoare de stat ( RO-LA ) Railway PRO Technology & Services Forum, Arad 5-6 aprilie

41 Multumesc pentru atentie! Daniel CIOBANU CFR Marfă Director Departament Vânzări - Trafic daniel.m.ciobanu@cfrmarfa.com
Meta Informations PUBLICATION OF DATA
 Response statistics for Public consultation on the initiative "Reforming the internal market for industrial products" from Commission Work Programme 2013 Status : Active Start date : 2013-01-22 End date
CAP CONTEXT INDICATORS
 CAP CONTEXT INDICATORS 2014-2020 24. AGRICULTURAL TRAINING OF FARM MANAGERS 2017 update CONTEXT INDICATOR 24: AGRICULTURAL TRAINING OF FARM MANAGERS Learning by doing is still the main form of for the
CAP CONTEXT INDICATORS
 CAP CONTEXT INDICATORS 2014-2020 44. ENERGY USE IN AGRICULTURE, FORESTRY AND THE FOOD INDUSTRY 2017 update BE BG CZ DK DE EE IE EL ES FR HR IT CY LV LT LU HU MT NL AT PL PT RO SI SK FI SE UK CONTEXT INDICATOR
Authors: Jannick H. Schmidt, 2.-0 LCA consultants
 SIXTH FRAMEWORK PROGRAMME PRIORITY [policy-oriented research priority SSP 5A] SPECIFIC TARGETED RESEARCH OR INNOVATION PROJECT FORWAST Overall mapping of physical flows and stocks of resources to forecast
NACE: Statistical Classification of Economic Activities
 NACE: Statistical Classification of Economic Activities NACE Rev.1 : To use until the 2008 operation included Section A Agriculture, hunting and forestry 01 Agriculture, hunting and related service activities
Analysis of household final consumption with a focus on the domestic market and the impact on employment
 Analysis of household final consumption with a focus on the domestic market and the impact on employment OCTOBER 2012 Národná banka Slovenska www.nbs.sk Imricha Karvaša 1 813 25 Bratislava milan_gylanik@nbs.sk
Energy demand dynamics and infrastructure development plans in the EU. October 10 th, 2012 Jonas Akelis, Managing Partner - Baltics
 Energy demand dynamics and infrastructure development plans in the EU October 10 th, 2012 Jonas Akelis, Managing Partner - Baltics Forecasted energy demand dynamics of EU-11 will be significantly higher
Over the whole year 2011, GDP increased by 1.4% in the euro area and by 1.5% in the EU27, compared with +1.9% and +2.0% respectively in 2010.
 35/2012-6 March 2012 Second estimates for the fourth quarter of Euro area and EU27 down by 0.3% +0.7% and +0.9% respectively compared with the fourth quarter of 2010 decreased by 0.3% in both the euro
OECD INTER-COUNTRY INPUT-OUTPUT DATA AND EMBODIED CO2 EMISSIONS
 OECD INTER-COUNTRY INPUT-OUTPUT DATA AND EMBODIED CO2 EMISSIONS Kirsten Wiebe & Norihiko Yamano OECD Directorate for Science, Technology and Innovation COP21 Le Bourget, France November 30, 2015 OECD Inter-country
Environmental Protection Expenditure Accounts
 Environmental Protection Expenditure Accounts 15.05.14 Environmental Protection Expenditure Account (EPEA) A statistical framework that describes environmental activities in monetary terms and organises
Integration of Digital Technology. Digital Economy and Society Index Report 2018 Integration of Digital Technologies 1
 Integration of Digital Technology Digital Economy and Society Index Report 2018 Integration of Digital Technologies 1 On Integration of digital technology, Denmark scored highest, followed by Finland,
Response charts for 'Quality Framework for Traineeships'
 Response charts for 'Quality Framework for Traineeships' Current search: Query definition All data requested Result pages There are 694 responses matching your criteria of a total of 694 records in the
Emissions Trading System (ETS): The UK needs to deliver its share of the total EU ETS emissions reduction of 21% by 2020, compared to 2005;
: The UK needs to deliver its share of the total EU ETS emissions reduction of 21% by 2020, compared to 2005;") Emissions Trading System (ETS): The UK needs to deliver its share of the total EU ETS emissions reduction of 21% by 2020, compared to 2005; Non-ETS emissions: The Effort Sharing Decision sets a target
Emissions Trading System (ETS): The UK needs to deliver its share of the total EU ETS emissions reduction of 21% by 2020, compared to 2005; Non-ETS emissions: The Effort Sharing Decision sets a target
THE 2008 ROUND OF REVISIONS OF THE NON-MANUFACTURING REGULATION (NMR) AND REGULATORY IMPACT (RI) INDICATORS
 AND REGULATORY IMPACT (RI) INDICATORS") THE 2008 ROUND OF REVISIONS OF THE NON-MANUFACTURING REGULATION (NMR) AND REGULATORY IMPACT (RI) INDICATORS The Non-Manufacturing Regulation (NMR) and Regulatory Impact (RI) indicators have been updated,
THE 2008 ROUND OF REVISIONS OF THE NON-MANUFACTURING REGULATION (NMR) AND REGULATORY IMPACT (RI) INDICATORS The Non-Manufacturing Regulation (NMR) and Regulatory Impact (RI) indicators have been updated,
Sectoral Profile - Industry
 Sectoral Profile - Industry Energy consumption Energy consumption trends in EU There is a regular decrease in energy consumption since 2003, although there was growth in industrial activity from 2003 to
INTERNATIONAL TRADE REPORT ON ADRIATIC AND IONIAN AREA. STATISTICS DATA Update 2014
 INTERNATIONAL TRADE REPORT ON ADRIATIC AND IONIAN AREA STATISTICS DATA Update 2014 Ancona, May 2015 The aim of this work is to provide a contribution to identify the economic and commercial dimension of
Environmental statistics in Europe Facts and figures on the environment: from environmental taxes to water resources
 STAT/10/189 10 December 2010 Environmental statistics in Europe Facts and figures on the environment: from environmental taxes to water resources What share of fresh water resources is being abstracted
EVOLUTION OF ORGANIC AGRICULTURE - A RESPONSE TO EUROPEAN CONSUMER REQUIREMENTS
 Lucrări Ştiinţifice vol. 55, Supliment /2012, seria Agronomie EVOLUTION OF ORGANIC AGRICULTURE - A RESPONSE TO EUROPEAN CONSUMER REQUIREMENTS Laura Cătălina ŢIMIRAŞ 1, Bogdan NICHIFOR 1, Luminiţa ZAIŢ
TOWARDS LATVIAN INFORUM MODEL INTRODUCTION AND BASE SCENARIO RESULTS
 TOWARDS LATVIAN INFORUM MODEL INTRODUCTION AND BASE SCENARIO RESULTS R.Počs, Dr.habil.oec., A.Auziņa, Mg.oec. V.Ozoliņa, Mg.oec. Riga Technical University Structure of presentation Current macroeconomic
ANNUAL PUBLICATION: detailed data. VOLUME OF EXPORTS FELL BY 4,7 PER CENT IN 2015 Export prices rose 0,7 per cent. 24 March 2016
 ANNUAL PUBLICATION: detailed data 2 March 216 VOLUME OF EXPORTS FELL BY,7 PER CENT IN 21 Export prices rose,7 per cent According to Finnish Customs preliminary data, the value of Finland s goods exports
Carbon Management and Infrastructure Development: Lessons from Industrial Ecology
 Carbon Management and Infrastructure Development: Lessons from Industrial Ecology Dr. Robin Curry Institute for a Sustainable World Queen s University, Belfast r.curry@qub.ac.uk Overview Industrial Ecology
Table 1. Labour productivity indicators * EU EU ,1 106,0 105,
 LABOUR PRODUCTIVITY DISPARITIES IN THE EUROPEAN UNION Goschin Zizi Academy of Economic Studies, 15-17 Calea Dorobantilor, Bucharest, Phone: 0765505869, E-mail: zizigoschin@yahoo.com Danciu Aniela Academy
Sea freight data indicate weak import demand both in US and EU27. Data on inland road and rail freight indicate weak domestic activity
 Statistics Brief Global Trade and Transport July 2013 Global Freight Volumes Indicate Increasing Dependency on -led Growth The latest update of global freight data collected by the International Transport
ISSN Bosnia and Herzegovina. Agency for Statistics of Bosnia and Herzegovina FOREIGN TRADE 2008 THEMATIC BULLETIN
 ISSN 1840-1066 Bosnia and Herzegovina Agency for Statistics of Bosnia and Herzegovina FOREIGN TRADE 2008 2009 THEMATIC BULLETIN 06 : Publisher:,,, 26 Agency for Statistics of Bosnia and Herzegovina, Bosnia
STUDIU COMPARATIV PRIVIND COSTURILE DE FABRICATIE A UNEI PIESE REPREZENTATIVE
 STUDIU COMPARATIV PRIVIND COSTURILE DE FABRICATIE A UNEI PIESE REPREZENTATIVE Gabriela Georgeta NICHITA Universitatea din Oradea, e-mail: gnichita@uoradea.ro Abstract: By comparative study in this paper,
CAP CONTEXT INDICATORS
 CAP CONTEXT INDICATORS 2014-2020 33. FARMING INTENSITY 2017 update CONTEXT INDICATOR 33: FARMING INTENSITY Intensification is an important restructuring process that has characterised European agriculture
INDUSTRIAL PRODUCTION INDICES IN JULY Figure 1. Industrial Production Indices (2010 = 100)
") INDUSTRIAL PRODUCTION INDICES IN JULY 2017 1 According to the preliminary data the Industrial Production Index 2, seasonally adjusted 3, increased by 0.2% in July 2017 as compared to June 2017. In July
INDUSTRIAL PRODUCTION INDICES IN JULY 2017 1 According to the preliminary data the Industrial Production Index 2, seasonally adjusted 3, increased by 0.2% in July 2017 as compared to June 2017. In July
10. Demand (light road freight veh shares)
") . Demand (light road freight veh shares) Overview Target The view is intended to calculate the share of light vehicles in total road freight vehicles. The light road freight vehicles are those belonging
. Demand (light road freight veh shares) Overview Target The view is intended to calculate the share of light vehicles in total road freight vehicles. The light road freight vehicles are those belonging
International trade related air freight volumes move back above the precrisis level of June 2008 both in the EU area and in the Unites States;
 Statistics Brief Global Trade and Transport October 2017 Air freight volumes increase since the second quarter of 2016 The latest update of global freight data collected by the International Transport
How do prices of primary energy carriers influence the competitiveness of the Polish economy
 How do prices of primary energy carriers influence the competitiveness of the Polish economy Michał Przybyliński University of Łódź 17 th INFORUM World Conference, Jurmala 2009 Previous research General
Eurostat current work on resource-efficient circular economy Renato Marra Campanale
 Eurostat current work on resource-efficient circular economy Renato Marra Campanale Renato.Marra-Campanale@ec.europa.eu Eurostat Unit E2 'Environmental statistics and accounts; sustainable development'
PRESS RELEASE. Industrial Production Price Index
 ROMANIA Press Office 16 Libertăţii Avenue, Sector 5, Bucharest Tel/Fax: 318 18 69; Fax: 312 48 75 e-mail: romstat@insse.ro; biroupresa@insse.ro PRESS RELEASE No. 48 of March 4, 2013 Industrial Production
Example of using detailed statistics: The case of poplar markets in EU
 Example of using detailed statistics: The case of poplar markets in EU Arvydas Lebedys FAO Forestry Officer (Statistics) Eurostat Forestry Statistics Working Group Meeting, Luxembourg, 16-17 November 2011
COMMISSION STAFF WORKING DOCUMENT Accompanying the document
 EUROPEAN COMMISSION Brussels, 14.12.2017 SWD(2017) 445 final PART 2/2 COMMISSION STAFF WORKING DOCUMENT Accompanying the document REPORT FROM THE COMMISSION TO THE EUROPEAN PARLIAMENT, THE COUNCIL, THE
FRAMEWORK CONVENTION ON CLIMATE CHANGE - Secretariat CONVENTION - CADRE SUR LES CHANGEMENTS CLIMATIQUES - Secrétariat KEY GHG DATA
 UNITED NATIONS NATIONS UNIES FRAMEWORK CONVENTION ON CLIMATE CHANGE - Secretariat CONVENTION - CADRE SUR LES CHANGEMENTS CLIMATIQUES - Secrétariat KEY GHG DATA Greenhouse Gas Emissions Data for 1990 2003
INDUSTRIAL PRODUCTION INDICES IN OCTOBER
 INDUSTRIAL PRODUCTION INDICES IN OCTOBER 2017 1 According to the preliminary data the Industrial Production Index 2, seasonally adjusted 3, decreased by 0.6% in October 2017 as compared to September 2017.
UN List of Industrial Products
 UN List of Industrial Products United Nations Statistics Division Workshop on Classifications, Montevideo, Uruguay, 14-18 March 2005 25/04/2005 1 History UN list of industrial products was developed in
Publishing date: 07/02/2018. We appreciate your feedback. Share this document
 Publishing date: 07/02/2018 Document title: Electricity and gas retail - List of Figures 2016 We appreciate your feedback Please click on the icon to take a 5 online survey and provide your feedback about
Public consultation on enhanced cooperation between Public Employment Services (PES)
") Public consultation on enhanced cooperation between Public Employment Services (PES) Fields marked with * are mandatory. Introduction The European Network of Public Employment Services (PES Network) was
Public consultation on enhanced cooperation between Public Employment Services (PES) Fields marked with * are mandatory. Introduction The European Network of Public Employment Services (PES Network) was
Price Statistics Working Group. Item 3.3 of the agenda. Methodological Development in the HICP
 EUROPEAN COMMISSION EUROSTAT Directorate C: National Accounts, Prices and Key Indicators Unit C-4: Price statistics. Purchasing Power Parities. Housing statistics PSWG06.2015/04 Annex Meeting of the Price
LITHUANIA-DENMARK BILATERAL TRADE review
 LITHUANIA-DENMARK BILATERAL TRADE review Published: 01.08.2017 SUMMARY Denmark is one of the most important trade partners for Lithuania. In 2016 the trade turnover in goods between the two countries slightly
INDONESIA. Manufacturing: Food & Beverages. Sectoral Activities Department
 INDONESIA Manufacturing: Food & Beverages Key Labour Market Indicators (2009) Economically Active Population Total: 113,740,000 13,000 12,500 12,000 11,500 11,000 10,500 10,000 Fig.1: Employment in Manufacturing
Transport statistics 2018 edition
 Transport statistics 2018 edition COMPACT GUIDES Transport what do we want to achieve? Transport is fundamental to our economy and society. Through several strategies, the European Commission intends to
The EU Directive on the management of waste from extractive industries. J Rizo European Commission DG ENVIRONMENT Brussels, June 2014
 The EU Directive on the management of waste from extractive industries J Rizo European Commission DG ENVIRONMENT Brussels, June 2014 The contextt The accidents Environmental problems Importance of mining
PPI Training. MODULE 2 The need to innovate in municipal waste management. PPI training Location of the training Date of the training.
 PPI Training MODULE 2 The need to innovate in municipal waste management PPI training Location of the training Date of the training Contents Status quo Waste management in Europe Drivers for innovation
COMMISSION OF THE EUROPEAN COMMUNITIES COMMISSION STAFF WORKING DOCUMENT. Accompanying the
 EN EN EN COMMISSION OF THE EUROPEAN COMMUNITIES Brussels, 19.06.2008 SEC (2008) 2047 COMMISSION STAFF WORKING DOCUMENT Accompanying the FIFTH PROGRESS REPORT ON ECONOMIC AND SOCIAL COHESION Growing Regions,
COMMISSION OF THE EUROPEAN COMMUNITIES COMMISSION STAFF WORKING DOCUMENT. Accompanying the
 COMMISSION OF THE EUROPEAN COMMUNITIES Brussels, 19.06.2008 SEC (2008) 2047 COMMISSION STAFF WORKING DOCUMENT Accompanying the FIFTH PROGRESS REPORT ON ECONOMIC AND SOCIAL COHESION Growing Regions, growing
INDUSTRIAL PRODUCTION INDICES IN FEBRUARY
 INDUSTRIAL PRODUCTION INDICES IN FEBRUARY 2018 1 In compliance with Regulation (EC) 1165/98 and amendment Regulation (EC) 1158/2005 since January 2018 the base year for Short-term business statistics has
The forest evolution in Romania after 1990
 Volume 15(3), 100-105, 2011 JOURNAL of Horticulture, Forestry and Biotechnology The forest evolution in Romania after 1990 Mănescu Camelia 1 *, Anăstăsoaei S. 1, Mateoc-Sîrb Nicoleta 1 1 University of
PoVeRE Green policy for packaging waste
 the packaging waste case PoVeRE Green policy for packaging waste 1 st International EIMPack Congress 2012 Recycling of Packaging Waste: Considering all the Costs and all the Benefits Portugal - Lisbon
DEFINITIONS FOR SMALL AND MEDIUM ENTERPRISES IN MALAYSIA. (Approved for Adoption by National SME Development Council on 9 June 2005)
") DEFINITIONS FOR SMALL AND MEDIUM ENTERPRISES IN MALAYSIA (Approved for Adoption by National SME Development Council on 9 June 2005) Issued by: Secretariat to National SME Development Council Bank Negara
DEFINITIONS FOR SMALL AND MEDIUM ENTERPRISES IN MALAYSIA (Approved for Adoption by National SME Development Council on 9 June 2005) Issued by: Secretariat to National SME Development Council Bank Negara
INDUSTRIAL PRODUCTION INDICES IN JANUARY
 INDUSTRIAL PRODUCTION INDICES IN JANUARY 2018 1 In compliance with Regulation (EC) 1165/98 and amendment Regulation (EC) 1158/2005 since January 2018 the base year for Short-term business statistics has
ODYSSEE-MURE, a decision support tool for energy efficiency policy evaluation. Recent energy efficiency trends in the EU
 ODYSSEE-MURE, a decision support tool for energy efficiency policy evaluation Recent energy efficiency trends in the EU Didier Bosseboeuf, ADEME, project coordinator Bruno Lapillonne, Karine Pollier; Enerdata
EXHIBITORS 242 FROM 24 COUNTRIES PARTICIPANTS 7030 FROM 58 COUNTRIES EVENT OVERVIEW
 EVENT OVERVIEW Between 6 th and 8 th of November, specialists from the transport and logistics industry took part in the exhibition. Among them there were owners, directors and managers of manufacturing,
NATIONAL RENEWABLE ENERGY ACTION PLAN FOR LITHUANIA
 NATIONAL RENEWABLE ENERGY ACTION PLAN FOR Tomas Garasimavičius Kaunas, 2010 50 45 40 35 30 25 20 15 10 5 0 ENERGY AGENCY EU and national RES targets 49 39,8 32,6 40 38 28,5 34 23,3 31 20,5 25 24 30 25
Energy efficiency trends in EU industry
 Energy efficiency trends in EU industry Odyssee-Mure webinar series on Energy Efficiency organised by Leonardo ENERGY Bruno Lapillonne, Karine Pollier, Laura Sudries, Enerdata 16 November 2016 The webinar
ECONOMIC BULLETIN Q3 2017
 December 2017 ECONOMIC BULLETIN Q3 2017 Indicators confirm a positive industry performance Food and drink industry Increase in manufacturing prices, production and sales EU food and drink industry turnover
Feasibility study for establishment of the most efficient solutions for regular maritime services connecting Black Sea and Danube ports
 Feasibility study for establishment of the most efficient solutions for regular maritime services connecting Black Sea and Danube ports Final Report 05 May 2014 Bucharest, Romania Authors of this report:
Wind energy in Europe markets
 Wind energy in Europe markets Turkish Wind Energy Congress (TWEC 2012), 7 November 2012, Istanbul Christian Kjaer CEO European Wind Energy Association (EWEA) More than 600 members from almost 60 countries
Trends in waste generation and management in Europe. Özgür Saki European Environment Agency
 Trends in waste generation and management in Europe Özgür Saki European Environment Agency The European Environment Agency An EU institution situated in Copenhagen since 1994 Provides the information necessary
Energy policy choices of Poland. Marek Wąsiński The Polish Institute of International Affairs Paris, 27 September 2016
 Energy policy choices of Poland Marek Wąsiński The Polish Institute of International Affairs Paris, 27 September 2016 Main Principles of Polish Energy Policy Energy independence Stable and price-efficient
Photo: Karpov. Wind in power 2009 European statistics. February 2010 THE EUROPEAN WIND ENERGY ASSOCIATION
 Photo: Karpov Wind in power 29 European statistics February 21 1 WIND IN POWER: 29 EUROPEAN STATISTICS Contents Executive summary 29 annual installations Wind map 29 Wind installations 29 Power capacity
International Indexes of Consumer Prices,
 International Indexes of Consumer Prices, July International Labor Comparisons Table of Contents Highlights... 1 Monthly Charts.. Monthly Tables... Annual Charts..... 5 Annual Tables.. 7 Technical Notes..
Chapter 23: Classifications
 Chapter 23: Classifications Regrouping and coding of industries (A) and products (P) The classifications of activities and products to be used are NACE Rev. 2 and CPA 2008. The corresponding aggregations
How to secure Europe s competitiveness in terms of energy and raw materials? The answer, my friend, is blowing in the wind
 How to secure Europe s competitiveness in terms of energy and raw materials? The answer, my friend, is blowing in the wind Iván Pineda Head of Policy Analysis, EWEA PolyTalk 2014, Brussels Around 600 members
Figures of Catalonia Generalitat de Catalunya Government of Catalonia
 www.idescat.cat Figures of Generalitat de Catalunya Government of POPULATION POPULATION STRUCTURE 5-9 % 0-4 % 5 4 3 2 1 0 0 1 2 3 4 5 Population (1 000) (1) 7 434 46 508 507 417 men 49.1 49.3 48.8 women
Global Warming Potential increased 6.8% in 2015, above the growth of economic activity
 Economic-environmental Indicators Air emissions accounts 1995-18 October 2017 Global Warming Potential increased 6.8% in, above the growth of economic activity In, the Global Warming Potential increased
EUROPE S ENERGY PORTAL
 EUROPE S ENERGY PORTAL METHODOLOGY GAS & ELECTRICTY PRICES Collect Analyze Report EUROPEAN UNION END-USERS Description of the process leading to the determination of end-user prices for natural gas and
ECONOMIC BULLETIN Q1 2017
 July 2017 ECONOMIC BULLETIN Q1 2017 Lower production, continued sales and employment growth, and continued export growth Food and drink industry Decrease in production and stable sales growth In Q1 2017,
ECONOMIC BULLETIN Q2 2017
 November 2017 ECONOMIC BULLETIN Q2 2017 Steady growth in production, sales and exports Food and drink industry Growth in production and sales In Q2 2017, EU food and drink industry production increased
Approximated greenhouse gas emissions in 2016
 Approximated greenhouse gas emissions Approximated greenhouse gas emissions in 2016 This briefing presents early approximated (proxy) estimates of greenhouse gas (GHG) emissions for 2016 in the European
INDUSTRIAL PRODUCTION INDICES IN OCTOBER
 INDUSTRIAL PRODUCTION INDICES IN OCTOBER 2015 1 According to the preliminary data the Industrial Production Index 2, seasonally adjusted 3, increased by 0.1% in October 2015 as compared to September 2015.
CAP CONTEXT INDICATORS
 CAP CONTEXT INDICATORS 2014-2020 40. WATER QUALITY 2017 update CONTEXT INDICATOR 40: WATER QUALITY Water quality is assessed through the Gross Nutrient Balance and nitrates in freshwater The nitrogen surplus
GUIDANCE FOR THE ACCREDITATION OF HEALTH AND SAFETY MANAGEMENT SYSTEM CERTIFICATION BODIES
 GUIDANCE FOR THE ACCREDITATION OF HEALTH AND SAFETY MANAGEMENT SYSTEM CERTIFICATION BODIES ΕΣΥ GA-H&S/01/02/08-07-2010 1 ΕΣΥ GA-H&S Issue: 01 Revision: 02 Issue Date: 11-07-2003 Revision Date: 08-07-2010
Energy Statistics 2017 edition
 Energy Statistics 2017 edition COMPACT GUIDES Energy Union Lighting, heating, transport, industrial output: without energy we would have none of these essential day-to-day services that make we and our
RENEWABLE H&C: BREAK-THROUGH NEEDS?
 RENEWABLE H&C: BREAK-THROUGH NEEDS? Tobias Fleiter, Jan Steinbach, Fraunhofer ISI Brussels, 2017/10/17, EUFORES Based on 3 EU H&C projects Mapping and analyses of the H/C fuel deployment EC tender study
Formularul certificatului de origine Forma A
 Anexa nr.2 la Regulament Formularul certificatului de origine Forma A 1. Goods consigned from (exporter`s business name, address, country 2. Goods consigned to (consignee`s name address, country) Referense
EUROPEAN COUNCIL Brussels, 31 May 2013 (OR. en)
") EUROPEAN COUNCIL Brussels, 31 May 2013 (OR. en) Interinstitutional File: 2013/0900 (NLE) EUCO 110/13 INST 234 POLG 69 OC 295 LEGAL ACTS Subject: DRAFT EUROPEAN COUNCIL DECISION establishing the composition
EUROPEAN COUNCIL Brussels, 31 May 2013 (OR. en) Interinstitutional File: 2013/0900 (NLE) EUCO 110/13 INST 234 POLG 69 OC 295 LEGAL ACTS Subject: DRAFT EUROPEAN COUNCIL DECISION establishing the composition
OXFORD ECONOMICS. Global Industry Services Overview
 OXFORD ECONOMICS Global Industry Services Overview 2016 ABOUT OXFORD ECONOMICS Oxford Economics is a world leader in global forecasting and quantitative analysis. Our worldwide client base comprises over
ECONOMIC BULLETIN Q2 2018
 October 2018 ECONOMIC BULLETIN Q2 2018 Slight increase in production and manufacturing prices, decrease in turnover and a steady export performance Food and drink industry Slight increase in production
Productivity Growth in Europe and the US: asectoral Study.
 Review of ECONOMICS and INSTITUTIONS Review of Economics and Institutions ISSN 2038-1379 DOI 10.5202/rei.v1i1.5 Vol. 1 No. 1, Spring 2010 Article 5 www.rei.unipg.it Productivity Growth in Europe and the
USA and EU27 external trade by sea and by air, measured in tonnes of goods moved, remain stagnant below pre-crisis (June 2008) levels;
 levels;") Statistics Brief July 2014 Global Trade and Transport Global freight data show diverging trends for developed and developing economies The latest update of global freight data collected by the International
Statistics Brief July 2014 Global Trade and Transport Global freight data show diverging trends for developed and developing economies The latest update of global freight data collected by the International
Utilization of Cedefop Forecast: PROJECT TRANSFERABILITY OF SKILLS. Jiri Branka
 Utilization of Cedefop Forecast: PROJECT TRANSFERABILITY OF SKILLS Jiri Branka branka@nvf.cz www.nvf.cz/observatory www.czechfutureskills.eu Project Description Transferability of skills across economic
ECC-Net statistics 1 regarding e-commerce
 ECC-Net statistics 1 regarding e-commerce 2012-2013 The European Consumer Centre Network The European Consumer Centre Network (ECC-Net) consists of 30 centres based in each EU Member State, Norway and
Conferinţa Ziua Cargo Am marfă, caut transport DB Schenker Direct Road. DB Schenker Ioana Marian & Ion Haşu Direct Road Bucureşti
 Conferinţa Ziua Cargo Am marfă, caut transport DB Schenker Direct Road DB Schenker în lume peste 100,000 angajaţi AMERI CA DE NORD EUROPA ASI A AFRI CA peste 130 ţări AMERI CA DE SUD AUSTRALI A mai mult
Photo: Thinkstock. Wind in power 2010 European statistics. February The European Wind energy association
 Photo: Thinkstock Wind in power 21 European statistics February 211 1 WIND IN POWER: 21 EUROPEAN STATISTICS Contents Executive summary 21 annual installations Wind map 21 Wind power capacity installations
E U R O P E A N U N I O N
 May 2018 Statistical Factsheet E U R O P E A N U N I O N CONTENTS Key figures EU-28 1. POPULATION & ECONOMY 2. FINANCIAL ASPECTS 3. ECONOMIC ACCOUNTS 4. AGRICULTURAL TRADE 5. FARM STRUCTURE 1 2-5 6-8 9-16
ECONOMIC BULLETIN Q1 2018
 July 2018 ECONOMIC BULLETIN Q1 2018 Moderate decline in production, turnover, manufacturing prices and exports and steady employment growth Food and drink industry Decrease in production and sales, and
Antitrust: Car price report shows price differentials for new cars in EU narrowing in 2010
 EUROPEAN COMMISSION - PRESS RELEASE Antitrust: Car price report shows price differentials for new cars in EU narrowing in 2010 Brussels, 26 July 2011 - The European Commission s latest car price report
STUDY REGARDING THE LEGISLATIVE CONDITIONS IN THE EUROPEAN UNION IMPORT FOR FRESH MEAT AND MEAT PRODUCTS
 Lucrări ştiinţifice Zootehnie şi Biotehnologii, vol. 40(2), (2007), Timişoara. STUDY REGARDING THE LEGISLATIVE CONDITIONS IN THE EUROPEAN UNION IMPORT FOR FRESH MEAT AND MEAT PRODUCTS STUDIU PRIVITOR LA
I) Background information. 1. Age
 Background information. 1. Age") Results of questionnaire for the general public on the revision of Directive 86/609/EEC on the protection of animals used for experimental and other scientific purposes I) Background information 1. Age
Results of questionnaire for the general public on the revision of Directive 86/609/EEC on the protection of animals used for experimental and other scientific purposes I) Background information 1. Age
Trends and drivers in greenhouse gas emissions in the EU in 2016
 EU greenhouse gas inventory Trends and drivers in greenhouse gas emissions in the EU in 2016 Official data for 2016 confirm the longterm reduction in greenhouse gas emissions across Europe. This briefing
INDUSTRIAL PRODUCTION INDICES IN AUGUST Figure 1. Industrial Production Indices (2010=100)
") INDUSTRIAL PRODUCTION INDICES IN AUGUST 2013 1 The preliminary data showed that the Industrial Production Index 2, seasonally adjusted 3, has increased by 0.9% in August 2013 as compared to July 2013.
INDUSTRIAL PRODUCTION INDICES IN AUGUST 2013 1 The preliminary data showed that the Industrial Production Index 2, seasonally adjusted 3, has increased by 0.9% in August 2013 as compared to July 2013.
Options for structural measures in the EU ETS
 CEPS Carbon Market Forum 23 April 2013, Brussels Options for structural measures in the EU ETS Stefan P. Schleicher Wegener Center for Climate and Global Change University of Graz A B B C C D E F F G G
Air transport of passengers and cargo/mail with remarkable increases Goods transport recovering in railway transport
 Transport activity 3 rd quarter 217 22 December 217 Air transport of passengers and cargo/mail with remarkable increases Goods transport recovering in railway transport In the 3 rd quarter 217, the movement
Relating to the transnational hiring-out of workers in the framework of the provision of services
 FORM FOR USE (OPTIONAL) BY THE REQUESTING ADMINISTRATION I. REQUEST FOR INFORMATION Relating to the transnational hiring-out of workers in the framework of the provision of services Pursuant to Article
ECONOMIC BULLETIN Q3 2018
 ECONOMIC BULLETIN Q3 2018 January 2019 Moderate increase in production, turnover and manufacturing prices slightly lower employment and exports Food and drink industry Moderate increase in production and
EU Construction & Demolition Waste Management Protocol Bucharest 17 October 2017
 EU Construction & Demolition Waste Management Protocol Bucharest 17 October 2017 European Commission - DG Research & Innovation - Unit I2 Eco-innovation Challenges for Construction and Demolition Waste
3. Future wood demand for energy
 UNECE/FAO Workshop on wood resource balances Part II: Future wood resource availability and demands presented by Sebastian Hetsch University of Hamburg Centre of Wood Science Udo Mantau Florian Steierer
Industrial production indices - global developments
 Industry, trade and services Author: Digna AMIL Statistics in focus 61/8 Industrial production indices - global developments A great deal has been written about the internationalisation of the world economy,