Economic Contributions of the Green Industry to the Texas Economy
|
|
|
- Flora Goodwin
- 6 years ago
- Views:
Transcription
1 Economic Contributions of the Green Industry to the Texas Economy Report to the Texas Nursery and Landscape Association 2016 by Marco A. Palma and Charles R. Hall Texas A&M AgriLife Extension Service Texas A&M University System 2124 TAMU. College Station, TX Acknowledgements This report was made possible by a grant from the Texas Nursery and Landscape Association (TNLA). The Data was obtained from the Texas Comptrollers of Public Accounts (TCPA), Baseline data from the Green Industry Research Consortium National Nursery Survey. Others who contributed with this report include Carmen Escalante (TCPA), Dan Hanselka, Dean McCorkle, Rebekka Dudensing (Texas A&M AgriLife Extension Service) and Alan Hodges (University of Florida). This report complies with the terms of the TNLA contract. The authors welcome comments or information about the usefulness and implications of these findings.
2 Introduction After bouncing back recently from the great recession with significant increases in sales for all sectors, green industry sales remained relatively flat in 2015 with a slight decrease in overall gross sales of less than 1% from the 2014 levels. Retail sales were slightly down 1.8% in 2015, while landscaping sales increased 3.20%. The sales baseline for the nursery and greenhouse category was updated using the National Nursery Survey 2014 data conducted by the green industry research consortium (please see for the full report). The survey incorporates responses from all 50 states in the U.S. The state of Texas is the third largest green industry state in terms of sales, economic output, employment and GDP contributions behind California and Florida. Total gross green industry sales are estimated at $18.9 billion. Following a big increase in 2013 to the highest peak in sales of $2.1 billion, the Production and Manufacturing sector experienced a slight decrease in sales of 2.4% and 3.4% in 2014 and 2015 respectively, to a total of $1.98 billion in Most of the decrease in the production and manufacturing sector came from the Lawn and Garden Equipment Manufacturing sector, which experienced a 34.1% decrease to $420 million in The Prefabricated Metal Buildings sector was down 14.3% to a total of $21.2 million. The grower Nursery and Greenhouse sector sales increased 23.8% from 1.39 billion in 2014 to the highest all time sales peak of $1.54 billion in The Horticultural Services sector sales increased 3.2% to an all-time record of $4.76 billion. Wholesale and Retail had a slight decrease of 1.88% to a total of $12.1 billion in The net margins attributed to the retail sector accounted for almost $3.7 billion. Net margin represents the share of sales that can be attributed to the retail sector and not accounting for the portion of the sales that was included in the production and manufacturing sector. This study measures green industry sales in Texas by sector and then estimates economic contributions to the Texas Economy in terms of output, employment and value added. Methodology In order to estimate economic contributions of the Green Industry to the Texas economy sales by each green industry sector need to be measured. The North American Industry Classification System (NAICS) was used to gather data on total green industry sales, including all sectors related to the green industry. The data used in this report were provided by the State Comptrollers Office, baseline data from the Green Industry Research Consortium National Nursery Survey, and includes industry sales through the end of fiscal year Every business in the state and the country is now classified by North American Industry Classification System (NAICS), which replaced the old Standard Industrial Classification (SIC) system. NAICS was developed jointly by the United States, Canada and Mexico to provide new comparability in statistics about business activity across North America. Green industry firms fall within one of the NAICS codes in Table 1. 2
3 Green Industry Sales in Texas When reporting sales to the State Comptroller s office, each firm must report all sales, including those sales in which sale taxes are collected and those that are not collected (wholesale). This reporting system has an area of potential slippage. For example, since wholesale growers do not collect any sales tax (for the state), some small and medium size growers are unaware of their reporting responsibilities. Not all of these firms realize that their services are subject to sale taxes. Therefore, unintended non- compliance has been a source of under reporting, which would underestimate green industry sales in Texas. Table 1. NAICS Codes for Green Industry Sectors Industry Sector NAICS Code Nursery & Greenhouse 1114 Lawn & Garden Equipment Mfg Greenhouse Manufacturing (Prefab. Metal Buildings)* Landscaping Services Landscape Architectural Services Flower, Nursery Stock And Florist Supplies Wholesalers Lawn & Garden Equipment & Supplies Stores 4442 Florists 4531 Building Material & Supplies Dealers* 4441 Food & Beverage Stores* 445 General Merchandise Stores* 452 Farm & Garden Machinery & Equipment Wholesalers* * Green industry represents a portion of overall business activity (Sectors not included in Previous Scope reports). Because of this potential slippage problem, additional data were used to supplement this report s methodology. Table 2 shows Total Green Industry Gross Sales in 2015, and Table 3 shows sales from for each green industry sector. Table 3 shows sales for the retail industry including gross sales, and also net sales. Net sales represent the margin sales that correspond to the retail sector only. 3
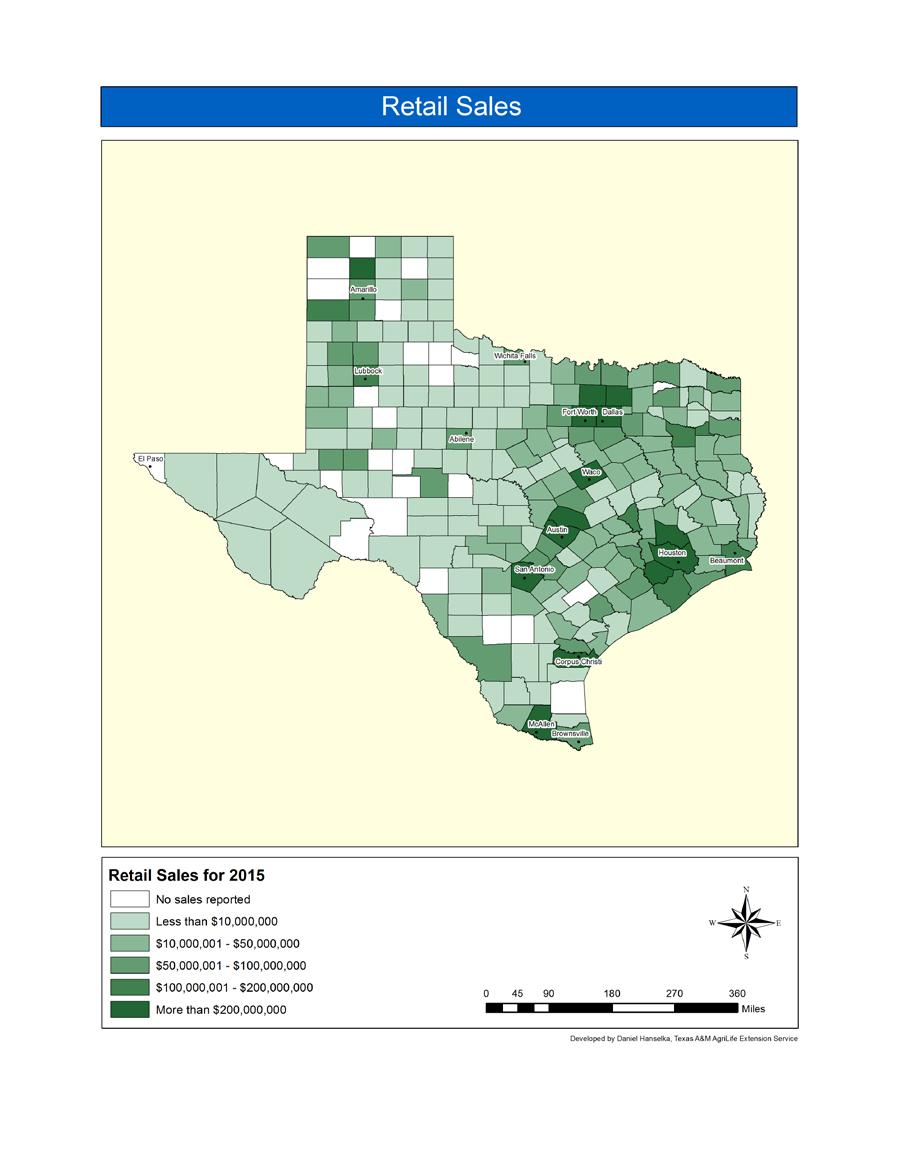
4 Table 2. Total Green Industry Gross Sales in Sector (NAICS code) Sales Establishments Production/Manufacturing 1,983,586, Nursery & Greenhouse (1114) ^ 1,541,737, Lawn & Garden Equipment Manufacturing (333112) ^ 420,609, Prefabricated metal buildings (332311) (Greenhouses) ^* 21,240, Horticultural Services 4,764,483, ,983,558 Landscaping Services (561730) 4,455,234,684 14,009 Landscape Architectural Services (541320) 309,249, ,969,549 Wholesale & Retail Trade Horticulture Products (Gross) 12,135,946,293 20,129 Flower, Nursery Stock and Florist Supplies Wholesalers (424930) 733,872, Lawn & Garden Equipment & Supplies Stores (4442) 5,695,194,031 2,267 Florists (4531) 1,049,681,888 3,315 Building Material & Supplies Dealers (4441)* 1,742,450,764 1,854 Food & Beverage Stores (445)* 417,339,726 2,749 General Merchandise Stores (452)* 1,605,929,700 9,231 Farm & Garden Equipment Wholesalers (423820)* 891,477, Total All Sectors 18,884,016, ,004,463 ^ Estimated from Baseline data from Economic Research Service and Texas Comptrollers Office Data ^ Estimated from baseline data from National Nursery Survey, and Texas Comptroller s Office Data. * NAICS represents a portion of Total Green Industry Sales Table 3. Total Green Industry Sales GROWER LANDSCAPE RETAIL (Gross) RETAIL (Net) TOTAL 2015 $1,983,586,654 $4,764,483,805 $12,135,946,293 $3,675,090,499 $10,423,160, $2,051,121,448 $4,612,211,522 $12,363,568,401 $3,744,020,587 $10,407,353, $2,100,242,682 $4,550,424,995 $11,721,100,798 $3,549,464,140 $10,200,131, $1,804,926,582 $4,054,303,568 $10,857,786,292 $3,288,029,320 $9,147,259, $1,918,432,053 $3,538,719,690 $10,374,997,040 $3,141,827,767 $8,598,979, $1,537,061,928 $3,390,016,982 $9,351,749,314 $2,831,960,872 $7,759,039, $1,336,866,584 $3,414,177,793 $9,039,697,678 $2,737,463,255 $7,488,507,632 Total industry sales, including grower, landscaping and retailing sales had a very minor decrease of 0.76% in 2015 for a total of $18.9 billion in gross sales. The grower sector experienced a slight decrease of 3.40% to a total of $1.98 billion. The landscaping sector increased sales by 3.20% to a total of $4.76 billion. Gross retail sales decreased slightly 1.88% to a total of $12.1 billion in Figures 1, 2, 3 and 4 represent industry sales for growers, landscaping, retailing (gross) and total gross industry sales respectively broken down by subsectors. 4
5 Figure 1. Grower Sales Million 2500 Greenhouses (Metal Buildings) Lawn Equipment Manufacturing Nursery&Greenhouse Figure 2. Landscaping Sales Billion 5 Landscaping Architectural Services Landscaping Services
6 Figure 3. Retailing Sales Billion Farm Equipment Food Stores Florists Flower Wholesalers General Stores Building Materials Lawn & Garden Supplies Figure 4. Total Industry Sales Billion 20 Wholesale and Retail Horticultural Services Production and Manufacturing
7 Table 4 presents green industry sales by sector and by major Metropolitan Statistical Area (MSA). There are 27 MSAs in Texas. The major MSAs are, Austin, Dallas, Ft. Worth, Houston, El Paso, and San Antonio. The economic scope reports sales in five of the major MSAs; together, the five major MSAs included in this report represent more than half of the total industry sales as shown in Figure 5. Houston and Dallas hold the largest share of green industry sales in 2015 with 19.03% and 16.49% respectively. Figure 6 is a graphical representation of grower, landscaping and retailing sales by MSA in Texas. Table 4. Total Green Industry Sales by Metropolitan Statistical Area (MSA), MSA GROWER LANDSCAPE RETAIL(Gross) TOTAL % OF TOTAL Austin 79,788, ,345, ,883,223 1,454,017, % Dallas 156,853,767 1,148,627,061 1,808,066,784 3,113,547, % Ft Worth 127,069, ,899, ,626,870 1,323,595, % Houston 259,080,027 1,337,296,448 1,997,428,586 3,593,805, % San Antonio 78,761, ,253, ,439,783 1,415,454, % Other 1,282,033, ,061,490 5,747,501,047 7,983,595, % Total 1,983,586,654 4,764,483,805 12,135,946,293 18,884,016, % Figure 5. Total Green Industry Sales in Texas by MSA in % Ft Worth 13.0% San Antonio 13.3% Austin Other 42.3% 57.7% MSA 28.6% Dallas 33.0% Houston 7
8 Figure 6. Green Industry Sales by Outlet and by MSA, Million Million Grower Landscape Million 2000 Retail Austin Dallas Ft Worth Houston San Antonio Economic Contributions of the Green Industry to the Texas Economy The net sales data from the previous section were used to estimate total economic contributions of the Green Industry to the Texas Economy. To evaluate the economic impact contributions of the green industry to the Texas economy, economic models were developed using the Implan software system and associated Texas datasets (MIG, 2010). The Implan system includes more than 500 industries. Input-Output models represent the structure of a regional economy in terms of transactions, employees, households, and government institutions (Miller & Blair, 1985). The economic multipliers derived from the Implan model were used to estimate the total economic activity generated in the state by sales (output) to final demand or exports. This includes the effects of intermediate purchases by green industry firms from other economic sectors (indirect effects) and the effects of green industry employee household consumer spending (induced effects), in addition to direct sales by industry firms. The wholesale and retail sectors use products from the production/manufacturing and horticultural services sectors; therefore, when calculating the impacts for the wholesale and retail trade horticulture products, output (retail sales) are reduced to reflect only the gross margin on sales to those sectors, otherwise we would be double counting the economic impact stemming from those products. Economic impact multipliers vary based on data about actual relationships in the economy. The total economic contributions of the Green Industry in Texas were estimated at $19.45 billion in output; 209,928 jobs, and $11.9 billion in value added as shown in Table 5. For the production and manufacturing sectors, including nursery and 8
9 greenhouse, lawn and garden equipment manufacturing, and metal building manufacturers, total output impacts were $3.1 billion; employment impacts were 24,430 jobs; and value added impacts were $1.96 billion. For the horticultural services sectors, including landscaping services and landscape architecture services, total output impacts were $9.06 billion; employment impacts were 117,313 jobs; and value added impacts were $5.46 billion. For the wholesale and retail trade sectors, total output impacts were $7.3 billion; employment impacts were 68,186 jobs; and value added impacts were $4.55 billion. The largest economic impact contributions for individual sectors were landscaping services, lawn and garden stores and nursery and greenhouse. Table 5. Economic Contributions of the Green Industry in Texas, Value Output Employment Added ($Mn) (jobs) ($Mn) Production & Manufacturing 3,104 24,430 1,959 Nursery & Greenhouse 2,425 22,345 1,735 Lawn & Garden Equipment Manufacturing 640 1, Prefabricated Metal Buildings Horticultural Services 9, ,313 5,456 Landscaping Services 8, ,896 5,058 Landscape Architecture Services 673 4, Wholesale & Retail Trade Horticulture Products 7,285 68,186 4,547 Flower, Nursery Stock & Florist Supplies Wholesalers 231 1, Lawn & Garden Equipment & Supplies Stores 3,672 30,762 2,287 Florists , Building Material & Supplies Dealers 1,124 9, Food & Beverage Stores 215 2, General Merchandise Stores 776 7, Farm & Garden Equipment Wholesalers 280 1, Total (All Sectors) 19, ,928 11,962 * Totals may not equal due to rounding 9
10 Figure 7. Green Industry Economic Output Contributions to the Texas Economy in 2015 Ft Worth $1.32B Dallas $3.11B Houston $3.59B Austin $1.45B San Antonio $1.42B Other $7.98B Figure 8. Employment Contributions by the Green Industry in Texas , , , ,000 80,000 60,000 68,186 40,000 20,000 24,430 0 Production & Manufacturing Horticultural Services Wholesale & Retail Economic impact results are also reported by major metropolitan statistical area (MSA) as summarized in Table 6. The MSAs with the greatest economic impact contributions to the State s economy are Houston and Dallas. 10
11 Table 6. Economic Impact Contributions of the Green Industry in Texas by MSA 2015 Value Output Employment Added ($Mn) (jobs) ($Mn) Austin 1,498 16, Dallas 3,207 34,612 1,972 Ft. Worth 1,363 14, Houston 3,701 39,951 2,276 San Antonio 1,458 15, Other 8,223 88,751 5,057 Total 19, ,928 11,962 * Totals may not equal due to rounding Measures of economic activity. Sales or output is the dollar volume of a good or service produced or sold. Final Demand is sales to final consumers, including households, governments, and exports. Intermediate sales are sales to other industrial sectors. Income is the money earned within the region from production and sales. Total income includes personal income (wage and salary income, including income of sole proprietor s profits and rents). Jobs or employment is a measure of the number of jobs required to produce a given volume of sales/production, expressed as full time equivalents, or as the total number including part time and seasonal positions. Value Added is the sum of total income and indirect business taxes. 11
12 Appendix Total Green Industry County Sales Estimates for 2015 County Sales County Sales County Sales County Sales County Sales Anderson 24,279,548 Deaf Smith 191,342,813 Hutchinson 3,562,652 Navarro 32,206,952 Val Verde 8,382,622 Andrews 2,331,721 Delta - Irion - Newton 251,357 Van Zandt 90,004,873 Angelina 50,919,361 Denton 507,020,834 Jack 187,930 Nolan 2,160,032 Victoria 101,134,097 Aransas 12,412,995 De Witt - Jackson 16,813,974 Nueces 246,537,554 Walker 24,192,655 Archer 5,211,872 Dickens 64,964 Jasper 20,559,010 Ochiltree 4,843,592 Waller 125,040,194 Armstrong - Dimmit 1,716,300 Jeff Davis 77,422 Oldham - Ward 667,141 Atascosa 42,650,371 Donley 165,684 Jefferson 148,097,721 Orange 31,637,700 Washington 52,711,264 Austin 71,153,362 Duval 191,409 Jim Hogg 228,980 Palo Pinto 14,813,665 Webb 92,368,798 Bailey 9,881,052 Eastland 13,795,941 Jim Wells 5,752,262 Panola 10,778,163 Wharton 197,508,106 Bandera 3,755,049 Ector 74,793,175 Johnson 105,490,162 Parker 81,313,287 Wheeler 240,392 Bastrop 56,594,362 Edwards 96,273 Jones 610,783 Parmer 126,921 Wichita 65,662,052 Baylor 7,333,375 Ellis 82,427,633 Karnes 1,867,649 Pecos 2,147,987 Wilbarger 1,330,813 Bee 18,633,426 El Paso - Kaufman 94,028,659 Polk 20,911,633 Willacy 1,110,246 Bell 153,778,202 Erath 43,019,987 Kendall 68,595,578 Potter 66,588,085 Williamson 436,001,616 Bexar 1,135,876,811 Falls 1,352,395 Kenedy - Presidio 561,533 Wilson 27,891,231 Blanco 1,426,754 Fannin 15,523,451 Kent 330 Rains 4,425,759 Winkler 366,188 Borden - Fayette 75,626,664 Kerr 37,849,955 Randall 88,586,999 Wise 38,786,032 Bosque 2,308,996 Fisher 30,913 Kimble 443,799 Reagan 63,770 Wood 77,600,347 Bowie 100,460,909 Floyd 271,147 King - Real 180,231 Yoakum 13,710,100 Brazoria 177,876,470 Foard - Kinney 0 Red River 287,977 Young 3,935,674 Brazos 262,038,274 Fort Bend 397,996,060 Kleberg 5,824,094 Reeves 1,724,798 Zapata 700,372 Brewster 1,502,535 Franklin 3,040,042 Knox 32,470 Refugio 177,465 Zavala 207,587 Briscoe 10,087 Freestone 14,058,610 Lamar 61,142,642 Roberts 82,901 Brooks 415,619 Frio 1,467,624 Lamb 83,888,742 Robertson 1,177,063 Brown 10,142,357 Gaines 42,660,085 Lampasas 13,406,725 Rockwall 50,321,669 Burleson 29,519,144 Galveston 226,926,812 La Salle - Runnels 6,144,905 Burnet 32,561,346 Garza 206,282 Lavaca 10,094,690 Rusk 15,585,933 Caldwell 25,607,387 Gillespie 27,332,812 Lee 13,360,765 Sabine 388,624 Calhoun 3,536,398 Glasscock - Leon 9,838,749 San Augustine 311,379 Callahan 969,491 Goliad 83,509 Liberty 48,023,760 San Jacinto 1,265,494 Cameron 130,652,077 Gonzales 16,506,307 Limestone 10,263,473 San Patricio 90,765,341 Camp 1,432,630 Gray 17,924,824 Lipscomb 53,035 San Saba 128,439 Carson 1,902,078 Grayson 109,047,383 Live Oak 2,224,908 Schleicher 51,116 Cass 10,458,698 Gregg 151,325,801 Llano 4,162,796 Scurry 3,631,313 Castro 25,448,003 Grimes 17,688,179 Loving - Shackelford 87,052 Chambers 21,232,535 Guadalupe 118,947,274 Lubbock 201,479,670 Shelby 19,281,221 Cherokee 45,681,357 Hale 86,451,089 Lynn 0 Sherman 0 Childress 1,029,501 Hall 40,708 Madison 1,015,107 Smith 379,975,904 Clay 473,944 Hamilton 595,628 Marion 538,061 Somervell 862,635 Cochran 14,880 Hansford 11,032,539 Martin 259,037 Starr 10,310,308 Coke 131,227 Hardeman 142,456 Mason 51,994 Stephens 3,802,641 Coleman 1,114,250 Hardin 15,432,489 Matagorda 90,194,128 Sterling - Collin 681,881,797 Harris 2,855,998,248 Maverick 16,485,363 Stonewall 14,593 Collingsworth 92,833 Harrison 61,158,652 McCulloch 8,419,020 Sutton 218,091 Colorado 38,258,549 Hartley - McLennan 253,858,313 Swisher 125,890 Comal 133,291,473 Haskell 889,128 McMullen - Tarrant 1,323,806,145 Comanche 13,500,487 Hays 114,612,561 Medina 46,237,588 Taylor 103,535,680 Concho - Hemphill 846,571 Menard 115,667 Terrell - Cooke 69,104,022 Henderson 44,131,332 Midland 95,716,557 Terry 47,667,340 Coryell 17,805,082 Hidalgo 301,127,045 Milam 6,838,613 Throckmorton 16,312 Cottle - Hill 29,011,175 Mills 656,614 Titus 19,401,537 Crane - Hockley 34,882,501 Mitchell 208,700 Tom Green 77,427,279 Crockett - Hood 20,155,250 Montague 10,989,640 Travis 1,055,919,216 Crosby 110,658 Hopkins 63,791,763 Montgomery 337,528,677 Trinity 1,193,407 Culberson 39,571 Houston 19,128,994 Moore 237,366,404 Tyler 2,456,416 Dallam 50,770,748 Howard 28,502,224 Morris 3,222,746 Upshur 10,403,205 Dallas 2,181,088,707 Hudspeth 48,501 Motley - Upton 40,758 Dawson 2,166,706 Hunt 50,266,630 Nacogdoches 42,708,946 Uvalde 5,598,769 12
13 13
14 14
15 15
16 16
Central & West Texas Forestlands: 2007
 Forestlands 2007 Report Published August 2009 Texas Forest Service Forest Inventory and Analysis Program In 2004, Texas Forest Service, in cooperation with the Southern Research Station s Forest Inventory
PRESTRESSED CONCRETE BENT CAPS
 PRESTRESSED CONCRETE BENT CAPS Christopher Miller, P.E. Table of contents 1 Conventionally Reinforced, Precast Bent Caps 3 2 Prestressed, Precast Bent Caps 4 3 Completed Projects 5-11 4 Prestressed Standard
Amendments to the 2006 International Energy Conservation Code
 Amendments to the 2006 International Energy Conservation Code Amend Section 101.4.2 Historic Buildings to read as follows: 101.4.2 Historic Buildings. Any building or structure that is listed in the State
HOT TOPICS IN AIR QUALITY
 HOT TOPICS IN AIR QUALITY 2014 TxDOT Planning Conference Houston-Galveston Area Council Presentation Topics 1 2 3 NAAQS Overview Near Road Air Monitors MPO and Local Program Successes EPA Advance Programs
TXDOT BRIDGE MANAGEMENT PRACTICES
 TXDOT BRIDGE MANAGEMENT PRACTICES Steven Austin, P.E. Texas Department of Transportation 4/26/17 TxDOT Bridge Management Practices Existing bridge inventory Routine and preventive maintenance Major bridge
Revised Statewide Asphalt Binder Selection Catalog
 TTI: 0-6674-01 Revised Statewide Asphalt Binder Selection Catalog Technical Report 0-6674-01-P1 Cooperative Research Program TEXAS A&M TRANSPORTATION INSTITUTE COLLEGE STATION, TEXAS in cooperation with
Stop searching for property records at the courthouse. Find them from your desktop in minutes.
 Spec Sheet DI Courthouse Stop searching for property records at the courthouse. Find them from your desktop in minutes. You no longer have to use antiquated index books to source documents. With DI Courthouse,
2013 Innovation Plus Shared Risk Programs Cotton Seed Replant and Crop Loss West Region
 Cotton Corn Cereals Soybeans Sugarbeets Peanuts Potatoes Horticulture Rice Tree, Nut & Vine Other 2013 Innovation Plus Shared Risk Programs Cotton Seed Replant and Crop Loss West Region 2013 Shared Risk
2015 International Energy Conservation Code. Significant Changes
 2015 International Energy Conservation Code Significant Changes Shirley Ellis Energy Codes Specialist Texas A&M Engineering Experiment Station shirleyellis@tamu.edu The Role of the ESL Mandated to review
STATEMENT OF QUALIFICATIONS (SOQ) SCREENING
 SCREENING") STATEMENT OF QUALIFICATIONS (SOQ) SCREENING Joe McCarthy November 3, 2017 Table of Contents 1 2 3 4 5 6 Who at TxDOT is Involved in the SOQ Screening Process? What is the PEPS Procurement Contracting Process?
STATEMENT OF QUALIFICATIONS (SOQ) SCREENING Joe McCarthy November 3, 2017 Table of Contents 1 2 3 4 5 6 Who at TxDOT is Involved in the SOQ Screening Process? What is the PEPS Procurement Contracting Process?
AFPC AGRICULTURAL & FOOD POLICY CENTER TEXAS A&M UNIVERSITY SYSTEM
 TEXAS AGRICULTURE BY CONGRESSIONAL DISTRICT: 1993-1996 AFPC Working Paper 97-10 September 1997 AFPC AGRICULTURAL & FOOD POLICY CENTER TEXAS A&M UNIVERSITY SYSTEM Department of Agricultural Economics Texas
TXDOT PREFERRED PRACTICES FOR STEEL UPDATE. Gregory Turco, M.S.E., PE TxDOT Bridge Division
 TXDOT PREFERRED PRACTICES FOR STEEL UPDATE Gregory Turco, M.S.E., PE TxDOT Bridge Division Table of contents 1 What are the Preferred Practices? 2 Current Preferred Practices 3 4 Draft 2018 Revisions Discussion
STATEWIDE AIR EMISSIONS CALCULATIONS FROM ENERGY EFFICIENCY, WIND AND RENEWABLES. May 2008
 STATEWIDE AIR EMISSIONS CALCULATIONS FROM ENERGY EFFICIENCY, WIND AND RENEWABLES May 28 Jeff Haberl, Bahman Yazdani, Charles Culp Energy Systems Laboratory Texas Engineering Experiment Station Texas A&M
General Overview of the Agricultural Act of Joe Outlaw Professor & Extension Economist Co-Director, AFPC
 General Overview of the Agricultural Act of 2014 Joe Outlaw Professor & Extension Economist Co-Director, AFPC Presentation Disclaimer This Information is Based on Our Reading of the Bill and Discussions
BASICS OF CONCRETE. Durability
 BASICS OF CONCRETE Durability 2 3 4 5 6 What Deterioration Mechanisms Are We Trying To Prevent? Corrosion Alkali-Silica Reaction (ASR) Alkali-Carbonate Reaction (ACR) Delay Ettringite Formation (DEF) Freeze-Thaw
THE ECONOMIC IMPACT OF RECENT AND PLANNED INVESTMENTS BY TXU ON BUSINESS ACTIVITY IN TEXAS AND AFFECTED COUNTIES AND LEGISLATIVE DISTRICTS
 THE ECONOMIC IMPACT OF RECENT AND PLANNED INVESTMENTS BY TXU ON BUSINESS ACTIVITY IN TEXAS AND AFFECTED COUNTIES AND LEGISLATIVE DISTRICTS The Perryman Group 510 North Valley Mills Drive, Suite 300 Waco,
NOTIFICATION OF ADDENDUM ADDENDUM NO. 1 DATED 2/02/2016
 NOTIFICATION OF ADDENDUM ADDENDUM NO. 1 DATED 2/02/2016 Control 0306-03-121, ETC. Project STP 2016(704) Highway SH 87 County JEFFERSON Ladies/Gentlemen: Attached please find an addendum on the above captioned
TRENDS IN TEXAS RURAL LAND VALUES FOR THE YEAR 2005
 TRENDS IN TEXAS RURAL LAND VALUES FOR THE YEAR 2005 TEXAS CHAPTER ASFMRA 6106 VANCE JACKSON #2 SAN ANTONIO, TEXAS 78230-3373 210.696.8909; FAX 210.696.1985 TexasASFMRA@agri-associations.org TEXAS CHAPTER
Simplified Prescriptive Options in the Texas Residential Building Energy Code Make Compliance Easy
 ESL-HH-0-05-6 Simplified Prescriptive Options in the Texas Residential Building Energy Code Make Compliance Easy Garrett A. Stone Eric M. DeVito Nelson H. Nease Partner Associate Associate Washington,
REDUCTION FROM ENERGY EFFICIENCY AND RENEWABLE ENERGY (EE/RE) PROGRAMS ACROSS STATE AGENCIES IN TEXAS
 PROGRAMS ACROSS STATE AGENCIES IN TEXAS") A METHODOLOGY FOR CALCULATING INTEGRATED NOx EMISSIONS REDUCTION FROM ENERGY EFFICIENCY AND RENEWABLE ENERGY (EE/RE) PROGRAMS ACROSS STATE AGENCIES IN TEXAS Juan-Carlos Baltazar, Ph.D., Piljae Im Jeff
A METHODOLOGY FOR CALCULATING INTEGRATED NOx EMISSIONS REDUCTION FROM ENERGY EFFICIENCY AND RENEWABLE ENERGY (EE/RE) PROGRAMS ACROSS STATE AGENCIES IN TEXAS Juan-Carlos Baltazar, Ph.D., Piljae Im Jeff
776 AGRICULTURE-TEXAS
 AGRCULTURE-TEXAS CouNTY TABLE H.-PRNCPAL CLASSES OF LVESTOCK ON [Number of animals Jan.,, not exactly comparable with Apr.,, because THE STATE Anderson Andrews Angelina Aransas Archer Armstrong Farms re!jorting
Case 2:03-cv TJW Document Filed 08/04/2006 Page 1 of 7 APPENDIX C
 Case 2:03-cv-00354-TJW Document 336-4 Filed 08/04/2006 Page 1 of 7 APPENDIX C Case 2:03-cv-00354-TJW Document 336-4 Filed 08/04/2006 Page 2 of 7 RED-M100 POPULATION ANALYSIS WITH COUNTY SUBTOTALS 08/04/06
Towards Tomorrow: Development of a Rating Path to Energy Codes RESNET Conference March 2, 2004
 Towards Tomorrow: Development of a Rating Path to Energy Codes 2005 RESNET Conference March 2, 2004 Towards Tomorrow: Development of a Rating Path to Energy Codes Tom Fitzpatrick Energy Systems Laboratory,
REDUCTION OF NO X EMISSIONS IN ALAMO AREA COUNCIL OF GOVERNMENT PROJECTS
 ESL-TR-04/05-01 REDUCTION OF NO X EMISSIONS IN ALAMO AREA COUNCIL OF GOVERNMENT PROJECTS Technology Assistance Project Texas Senate Bill 5 Legislation For Reducing Pollution in Nonattainment and Affected
TRENDS IN TEXAS RURAL LAND VALUES FOR THE YEAR 2006
 TRENDS IN TEXAS RURAL LAND VALUES FOR THE YEAR 2006 TEXAS CHAPTER ASFMRA 6106 VANCE JACKSON #2 SAN ANTONIO, TEXAS 78230-3373 210.696.8909; FAX 210.696.1985 TexasASFMRA@satx.rr.com TEXAS CHAPTER ASFMRA
IMPACTS OF ENERGY DEVELOPMENT ON TEXAS ROADS
 IMPACTS OF ENERGY DEVELOPMENT ON TEXAS ROADS Zheng Jenny Li, PhD, P.E. (Corresponding Author) Transportation Engineer Texas Department of Transportation MNT Pavement Preservation Branch 7901 North IH35
TRENDS IN TEXAS RURAL LAND VALUES FOR THE YEAR 2007
 TRENDS IN TEXAS RURAL LAND VALUES FOR THE YEAR 2007 TEXAS CHAPTER ASFMRA 6106 VANCE JACKSON #2 SAN ANTONIO, TEXAS 78230-3373 210.696.8909; FAX 210.696.1985 TexasASFMRA@satx.rr.com Texas Chapter ASFMRA
2013 Texas Agricultural Custom Rates
 2013 Texas Agricultural Custom Rates May 2013 Custom Rates Survey Conducted and Compiled by Texas A&M AgriLife Extension Service Department of Agricultural Economics Survey Coordinator: Survey Development
Current Prediabetes Prevalence Among Adults by Demographic Characteristics, Risk Factors, Other Conditions, and Place of Residence, Texas, 2013
 Current Prevalence Among Adults by Demographic Characteristics, Risk Factors, Other Conditions, and Place of Residence, Texas, 2013 Prepared by Blaise Mathabela, MS Epidemiologist Office of Surveillance,
est Proud Member of: Strike the rock and water will come out of it for the people to drink Exodus 17:6b
 est. 1980 Proud Member of: Strike the rock and water will come out of it for the people to drink Exodus 17:6b Preferred Builders List Over the three decades we have been building wells, we have developed
Texas Chapter ASFMRA 6106 Vance Jackson #2 San Antonio, Texas ; fax
 Texas Chapter ASFMRA 6106 Vance Jackson #2 San Antonio, Texas 78230 210.696.8909; fax 210.696.1985 e-mail TexasASFMRA@agri-associations.org TRENDS IN TEXAS AGRICULTURAL LAND VALUES GENERAL MARKET CONDITIONS
Barndominium builders brazoria county
 Barndominium builders brazoria county * All prices above do not include a slab. Slab sq ft price is about $8.50 a sq ft. This apartment barn has space on 02/04/2018 the bottom level for horse and dog stalls,
ORDINANCE NO. the City of Keller desires to remain current with the most recently published edition of the International Building Codes.
 ORDINANCE NO. AN ORDINANCE OF THE CITY COUNCIL OF THE CITY OF KELLER, TEXAS, AMENDING THE CITY OF KELLER CODE OF ORDINANCES, BY AMENDING CHAPTER 4, BUILDINGS, ARTICLE I, BUILDING CODE, BY REPEALING SECTION
Trans-Texas Corridor-35 Update
 Trans-Texas Corridor-35 Update TTC-35 Regional Briefing July 13, 2006 North Central Texas Council of Governments Transportation Department Trans-Texas Corridor-35 Is there a need? 6 Lanes 12 Lanes 20 Lanes
Red-cockaded Woodpecker
 T H E E N D A N G E R E D Red-cockaded Woodpecker A N D M O D E R N F O R E S T R Y I N T E X A S : L I V I N G I N H A R M O N Y A booklet by: Texas Partners in Flight, Texas Parks and Wildlife, U.S.
METHODOLOGY TO CALCULATE NOx EMISSIONS REDUCTIONS FROM THE IMPLEMENTATION OF THE 2000 IECC/IRC CONSERVATION CODE IN TEXAS
 METHODOLOGY TO CALCULATE NOx EMISSIONS REDUCTIONS FROM THE IMPLEMENTATION OF THE 2000 IECC/IRC CONSERVATION CODE IN TEXAS Jeff S. Haberl, Ph.D., P.E., Piljae Im, Charles Culp, Ph.D., P.E. Energy Systems
Biomass from Logging Residue and Mill Residue in East Texas, 2005
 Biomass from Logging Residue and Mill Residue in East Texas, 2005 By Weihuan Xu, Ph.D., Principal Economist Burl Carraway, Assistant Department Head Sustainable Forestry & Economic Development May 2007
Biomass from Logging Residue and Mill Residue in East Texas, 2003
 Biomass from Logging Residue and Mill Residue in East Texas, 2003 By Weihuan Xu, Ph.D., Principal Economist Burl Carraway, Assistant Department Head Sustainable Forestry & Economic Development June 2005
Trans Texas Corridor-35 (TTC-35) Study Area Identification Report
 Study Area Identification Report") Texas Department of Transportation Texas Turnpike Authority Division Trans Texas Corridor-35 (TTC-35) Study Area Identification Report 19 April 2004 updated July 2004 and July 2005 TTC-35 Study Area Identification
Texas Department of Transportation Texas Turnpike Authority Division Trans Texas Corridor-35 (TTC-35) Study Area Identification Report 19 April 2004 updated July 2004 and July 2005 TTC-35 Study Area Identification
An Economic Examination of Potential Ethanol Production in Texas
 Agricultural & Food Policy Center at Texas A&M University An Economic Examination of Potential Ethanol Production in Texas AFPC Research Report 3-1 February 3, 23 Funding provided in part by the Texas
Shale of the Century
 APRIL 2012 Texas Economy PUBLICATION 1996 A Reprint from Tierra Grande Shale of the Century Small Towns Dazed by Eagle Ford Influx By Harold D. Hunt Technology has a way of humbling those brave enough
o. F. Francke-, J. C. Cokendolpher, Ann H. Horton, S. A. Phillips, Jr., and L. R. Potts
 VOL. 8 NO. 1 THE SOUTHWESTERN ENTOMOLOGIST MARCH 1983 f DISTRIBUTION OF FIREANTS!/IN TEXASl I 31 o. F. Francke, J. C. Cokendolpher, Ann H. Horton, S. A. Phillips, Jr., and L. R. Potts Texas Tech University,
} p 12,651 1,567 1,983 2,566
 CENSUS OF AGRICULTURE-TEXAS CoUN'I'Y'l'ABLE H-FARMS, 0,, AND 0; FARM ACREAGE, AND VALUE OF LAND AND BUILDINGS, 0 AND ; VALUE OF BUILDINGS AND IMPLEMENTS AND MACHINERY, 0; AND CROPLAND HARVESTED, ; BY TENURE
TEXAS TIMBER PRICE TRENDS
 TEXAS TIMBER PRICE TRENDS BIMONTHLY MARKET REPORT VOL. 25 NO. 2 March/April 2007 TEXAS TIMBER PRICE TRENDS WHAT IS THE PURPOSE OF THIS REPORT? Texas Timber Price Trends is a bi-monthly publication reporting
TEXAS TIMBER PRICE TRENDS
 TEXAS TIMBER PRICE TRENDS BIMONTHLY MARKET REPORT VOL. 25 NO. 1 January/February 2007 TEXAS TIMBER PRICE TRENDS WHAT IS THE PURPOSE OF THIS REPORT? Texas Timber Price Trends is a bi-monthly publication
Economic Impacts of the Green Industry in the United States
 Economic Impacts of the Green Industry in the United States Final Report to the National Urban and Community Forestry Advisory Committee by Charles R. Hall, PhD, University of Tennessee 2621 Morgan Circle
TEXAS TIMBER PRICE TRENDS
 TEXAS TIMBER PRICE TRENDS BIMONTHLY MARKET REPORT VOL. 22 NO. 3 May/June 2004 TEXAS TIMBER PRICE TRENDS WHAT IS THE PURPOSE OF THIS REPORT? Texas Timber Price Trends is a bi-monthly publication reporting
TEXAS TIMBER PRICE TRENDS
 TEXAS TIMBER PRICE TRENDS BIMONTHLY MARKET REPORT VOL. 22 NO. 1 January/February 2004 TEXAS TIMBER PRICE TRENDS WHAT IS THE PURPOSE OF THIS REPORT? Texas Timber Price Trends is a bi-monthly publication
TEXAS TIMBER PRICE TRENDS
 TEXAS TIMBER PRICE TRENDS BIMONTHLY MARKET REPORT VOL. 22 NO. 6 November/December 2004 TEXAS TIMBER PRICE TRENDS WHAT IS THE PURPOSE OF THIS REPORT? Texas Timber Price Trends is a bi-monthly publication
Pen SAFE-D. Paperwork. ... With SAFE-D help, AG Dept. takes one last filing from ESDs. Set sail for Galveston and SAFE-D 1Q 2018
 SAFE-D Pen Official Newsletter of the State Association of Fire and Emergency Districts 1Q 2018 Paperwork... With SAFE-D help, AG Dept. takes one last filing from ESDs SAFE-D will collect the final staterequired
TEXAS TIMBER PRICE TRENDS
 TEXAS TIMBER PRICE TRENDS BIMONTHLY MARKET REPORT VOL. 23 NO. 4 July/August 2005 TEXAS TIMBER PRICE TRENDS WHAT IS THE PURPOSE OF THIS REPORT? Texas Timber Price Trends is a bi-monthly publication reporting
TEXAS TIMBER PRICE TRENDS
 TEXAS TIMBER PRICE TRENDS BIMONTHLY MARKET REPORT VOL. 20 NO. 5 September/October 2002 TEXAS TIMBER PRICE TRENDS WHAT IS THE PURPOSE OF THIS REPORT? Texas Timber Price Trends is a bi-monthly publication
For further information, please review the information on the following pages as provided by
 Date: 02/04/2008 Re: Avery Dennison Horizontally Applied Warranty Alert It has recently been brought to our attention that Avery Dennison has adjusted their position in regard to horizontally applied vinyl
TEXAS TIMBER PRICE TRENDS
 $2.00 TEXAS TIMBER PRICE TRENDS BIMONTHLY MARKET REPORT VOL. 19 NO. 2 March/April 2001 TEXAS TIMBER PRICE TRENDS How to Use This Report WHAT IS THE PURPOSE OF THIS REPORT? Texas Timber Price Trends is
2015 Ozone Standard. David Brymer. Air Quality Division. Presented to the 2016 Texas Transportation Planning Conference June 16, 2016
 2015 Ozone Standard David Brymer Air Quality Division Presented to the 2016 Texas Transportation Planning Conference June 16, 2016 Air Quality Division 2016 Texas Transportation Planning Conference 2015
/1/2014 NUECES & SAN PATRICIO OXY INGLESIDE LPG PIPELINE /1/2014 SAN PATRICIO OXY INGLESIDE LPG PIPELINE
 This file is continuously updated as soon as new construction reports are received. Complete thru June 5, 2014 If a T-4 permit number is listed as 00000, it is not yet permitted or added to an existing
Tower 55 Rail Reliever Study
 Public Meetings June 12 & 13, 2006 North Central Texas Council of Governments Transportation Department Tower 55 I.H. 30 Tower 55 I.H. 35W 0 385 770 1,540 2,310 3,080 Feet Rail Volumes - 2025 Legend DART
DFW 8-Hour Ozone SIP & Rules A&WMA Presentation May 21, Jay Tonne Kelly Keel TCEQ Air Quality Planning Section
 DFW 8-Hour Ozone SIP & Rules A&WMA Presentation May 21, 2008 Jay Tonne Kelly Keel TCEQ Air Quality Planning Section Texas Commission on Environmental Quality Air Quality Division Air Quality Planning Section
Texas Air Quality Nonattainment or Attainment-Maintenance Areas and Counties September 28, 2018
 Texas Air Quality or -Maintenance Areas and Counties TxDOT Environmental Affairs Division Release Date: 2018 200.02.FIG Version 9 Texas Air Quality or -Maintenance Areas and Counties Texas Air Quality
Texas Challenges & Texas Response
 Texas Challenges & Texas Response Texas Industrial Technology Showcase, Houston, Texas March 17-19, 2003 Jerry Matthews, Executive Director Jerrymatthews@mail.utexas.edu Texas Council on Environmental
TEXAS TIMBER PRICE TRENDS
 TEXAS TIMBER PRICE TRENDS BIMONTHLY MARKET REPORT VOL. 22 NO. 2 March/April 2004 TEXAS TIMBER PRICE TRENDS WHAT IS THE PURPOSE OF THIS REPORT? Texas Timber Price Trends is a bi-monthly publication reporting
TEXAS TIMBER PRICE TRENDS
 TEXAS TIMBER PRICE TRENDS BIMONTHLY MARKET REPORT VOL. 21 NO. 4 July/August 2003 TEXAS TIMBER PRICE TRENDS WHAT IS THE PURPOSE OF THIS REPORT? Texas Timber Price Trends is a bi-monthly publication reporting
ENERGY EFFICIENCY/RENEWABLE ENERGY IMPACT IN THE TEXAS EMISSIONS REDUCTION PLAN (TERP)
") ESL-TR-17-10-01 ENERGY EFFICIENCY/RENEWABLE ENERGY IMPACT IN THE TEXAS EMISSIONS REDUCTION PLAN (TERP) PRELIMINARY REPORT: INTEGRATED NOX EMISSIONS SAVINGS FROM EE/RE PROGRAMS STATEWIDE Annual Report to
ESL-TR-17-10-01 ENERGY EFFICIENCY/RENEWABLE ENERGY IMPACT IN THE TEXAS EMISSIONS REDUCTION PLAN (TERP) PRELIMINARY REPORT: INTEGRATED NOX EMISSIONS SAVINGS FROM EE/RE PROGRAMS STATEWIDE Annual Report to
ENERGY EFFICIENCY/RENEWABLE ENERGY IMPACT IN THE TEXAS EMISSIONS REDUCTION PLAN (TERP)
") ESL-TR-16-10-01 ENERGY EFFICIENCY/RENEWABLE ENERGY IMPACT IN THE TEXAS EMISSIONS REDUCTION PLAN (TERP) PRELIMINARY REPORT: INTEGRATED NOX EMISSIONS SAVINGS FROM EE/RE PROGRAMS STATEWIDE Annual Report to
ESL-TR-16-10-01 ENERGY EFFICIENCY/RENEWABLE ENERGY IMPACT IN THE TEXAS EMISSIONS REDUCTION PLAN (TERP) PRELIMINARY REPORT: INTEGRATED NOX EMISSIONS SAVINGS FROM EE/RE PROGRAMS STATEWIDE Annual Report to
Legend Source: Texas Water Development Board
 4055 International Plaza, Suite 200 Fort Worth, TX 76109-4895 Phone - (817) 735-7300 o / LOVING ANDREWS MARTIN BORDEN SCURRY HOWARD MITCHELL Area of Enlargement ECTOR WINKLER CRANE REEVES Region F Minor
ENERGY EFFICIENCY / RENEWABLE ENERGY IMPACT IN THE TEXAS EMISSIONS REDUCTION PLAN (TERP) VOLUME III APPENDIX
 VOLUME III APPENDIX") ESL-TR-4/-5 ENERGY EFFICIENCY / RENEWABLE ENERGY IMPACT IN THE TEXAS EMISSIONS REDUCTION PLAN (TERP) VOLUME III APPENDIX Annual Report to the Texas Commission on Environmental Quality September August
ESL-TR-4/-5 ENERGY EFFICIENCY / RENEWABLE ENERGY IMPACT IN THE TEXAS EMISSIONS REDUCTION PLAN (TERP) VOLUME III APPENDIX Annual Report to the Texas Commission on Environmental Quality September August
TRANS-TEXAS CORRIDOR-35 REGIONAL/STATE UPDATE
 TRANS-TEXAS CORRIDOR-35 REGIONAL/STATE UPDATE River of Trade Corridor Coalition Quarterly Meeting October 28, 2005 Greg J. Royster, P.E. Principal Transportation Engineer North Central Texas Council of
TEXAS TIMBER PRICE TRENDS
 $2.00 TEXAS TIMBER PRICE TRENDS BIMONTHLY MARKET REPORT VOL. 17 NO. 4 July/August 1999 TEXAS TIMBER PRICE TRENDS How to Use This Report WHAT IS THE PURPOSE OF THIS REPORT? Texas Timber Price Trends is
connection TRANSCO Breaking News: Malcolm Retiring, Armstrong to be New CEO Message from Frank Ferazzi
 connection TRANSCO FALL 2010 Message from Frank Ferazzi Frank Ferazzi, vice president and general manager of Williams Gas Pipeline East I am honored to have the opportunity to serve the Transco enterprise
Harvest Trends 2007 November 2008
 Harvest Trends 2007 November 2008 Texas Forest Resource Harvest Trends 2007 Weihuan Xu, Ph.D. Principal Economist Forest Resource Development and Sustainable Forestry College Station, Texas November 2008
Changes in Water Levels in Texas, 1995 to 2005
 Changes in Water Levels in Texas, 1995 to 2005 Radu Boghici, P.G. Report 379 July 2011 Texas Water Development Board www.twdb.texas.gov Texas Water Development Board Report 379 Changes in Water Levels
FIGURE 2.1. REGIONAL WATER PLANNING AREAS.
 FIGURE 2.1. REGIONAL WATER PLANNING AREAS. Panhandle (A) Llano Estacado (O) Region B Region C North East Texas (D) Brazos G Region F East Texas (I) Far West Texas (E) Plateau (J) Lower Colorado (K) Region
Texas Forest Resource. Harvest Trends 2009
 Harvest Trends 2009 September 2010 Texas Forest Resource Harvest Trends 2009 Yanshu Li, Ph.D. Burl Carraway Curtis VanderSchaaf, Ph.D. Forest Resource Development and Sustainable Forestry College Station,
ENERGY EFFICIENCY/RENEWABLE ENERGY IMPACT IN THE TEXAS EMISSIONS REDUCTION PLAN (TERP)
") ESL-TR-08-08-01 ENERGY EFFICIENCY/RENEWABLE ENERGY IMPACT IN THE TEXAS EMISSIONS REDUCTION PLAN (TERP) PRELIMINARY REPORT: INTEGRATED NOX EMISSIONS SAVINGS FROM EE/RE PROGRAMS STATEWIDE Annual Report to
ESL-TR-08-08-01 ENERGY EFFICIENCY/RENEWABLE ENERGY IMPACT IN THE TEXAS EMISSIONS REDUCTION PLAN (TERP) PRELIMINARY REPORT: INTEGRATED NOX EMISSIONS SAVINGS FROM EE/RE PROGRAMS STATEWIDE Annual Report to
Outdoor Burning in Texas. Field Operations Texas Commission on Environmental Quality
 Outdoor Burning in Texas Field Operations Texas Commission on Environmental Quality RG-049 Revised August 2008 OUTDOOR BURNING IN TEXAS Contents Introduction 3 The Outdoor Burning Rule Explained Summary
TR Economic, Hydrologic and Environmental Appraisal of Texas Inter-basin Water Transfers: Model Development and Initial Appraisal
 TR- 301 2007 Economic, Hydrologic and Environmental Appraisal of Texas Inter-basin Water Transfers: Model Development and Initial Appraisal By Yongxia Cai Research Assistant and Bruce A. McCarl Professor
TEXAS DEPARTMENT OF TRANSPORTATION LAREDO DISTRICT EAGLE FORD SHALE: IMPACTS TO THE TRANSPORTATION SYSTEM
 TEXAS DEPARTMENT OF TRANSPORTATION LAREDO DISTRICT EAGLE FORD SHALE: IMPACTS TO THE TRANSPORTATION SYSTEM Melisa D. Montemayor October 23, 2012 Overview 1. Eagle Ford Shale 2. Impact to The System 3. Pavement
Using ArcGIS to Determine Texas Water Planning Regions with Maximum Municipal Conservation Potential
 Using ArcGIS to Determine Texas Water Planning Regions with Maximum Municipal Conservation Potential Elizabeth Waite GIS Water Resources Fall 2012 Introduction Over the next fifty years the population
/5/2012 Midland & Martin Patricia Fuel Gas Line Fuel Gas Transmission 6.5 3"
 This file is continuously updated as soon as new construction reports are received. Current through August 30, 2012 Last revisions 6/29/12 If a T-4 permit number is listed as 00000, it is not yet permitted
Texas Department of Public Safety. Division of Emergency Management
 Texas Department of Public Safety Division of Emergency Management STRAC Emergency Healthcare Systems Conference May 5, 2014 TDEM At A Glance Responsible for a comprehensive state emergency management
El Paso Exploration & Production Company Eagle Ford Field Trip
 INTERSTATE PIPELINES EXPLORATION & PRODUCTION El Paso Exploration & Production Company Eagle Ford Field Trip October 5, 2010 Cautionary Statement Regarding Forward-Looking Statements This presentation
Technical Advisory Panel
 Air Victoria Community and Technical Advisory Panel Meeting November 4, 2009 Marie Lester Environmental Programs Coordinator 2009 Victoria Ozone Season Levels Year 1 st high 2 nd high 3 rd high 4 th high
Texas IPM Program Update. West Texas Agricultural Chemicals Institute Conference September 13, 2017
 Texas IPM Program Update West Texas Agricultural Chemicals Institute Conference September 13, 2017 Last Degree 3 2 12 10 11 Years of Service 8 6 58% 14 4 2 0 3 2 2 1 0 0-5 6-10 11-15 16-20 21-25 26-30
CREZ Progress Report No. 17 (November Update)
") Competitive Renewable Energy Zone Program Oversight CREZ Progress Report No. 17 (November Update) Final Prepared for Public Utility Commission of Texas Prepared by RS&H December 2014 TABLE OF CONTENTS
Competitive Renewable Energy Zone Program Oversight CREZ Progress Report No. 17 (November Update) Final Prepared for Public Utility Commission of Texas Prepared by RS&H December 2014 TABLE OF CONTENTS
Texas Forest Resource. Harvest Trends Weihuan Xu, Ph.D. Principal Economist Forest Resource Development College Station, Texas
 Texas Forest Resource Harvest Trends 2003 Weihuan Xu, Ph.D. Principal Economist Forest Resource Development College Station, Texas Publication 165 October 2004 Mountain Pine MILLS SURVEYED FOR HARVEST
ABSTRACT. levels by encouraging the reduction of emissions of
 TEXAS' SENATE BILL 5 LEGISLATION FOR REDUCING POLLUTION IN NON- ATTAINMENT AND AFFECTED AREAS: PROCEDURES FOR MEASURING ELECTRICITY SAVINGS FROM THE ADOPTION OF THE INTERNATIONAL ENERGY CONSERVATION CODE
/12/2017 MIDLAND WEST TEXAS CRUDE OIL TRANSMISSION " EXTENSION OF EXISTING SYSTEM
 This file is continuously updated as soon as new construction reports are received. Complete thru December 31, 201. If a T-4 permit number is listed as 01234, it is not yet permitted or added to an existing
Harvest Trends 2013 September 2014
 Harvest Trends 2013 September 2014 OKLAHOMA Wright City Broken Bow Idabel Dierks ARKANSAS Gurdon MILLS SURVEYED FOR HARVEST TRENDS 2013 SMALL SAWMILL (=20MMBF/YR) PLYWOOD MILL
MILLS SURVEYED FOR HARVEST TRENDS 2014
 Harvest Trends 2014 September 2015 OKLAHOMA Wright City Broken Bow Idabel Dierks ARKANSAS Gurdon MILLS SURVEYED FOR HARVEST TRENDS 2014 SMALL SAWMILL (=20MMBF/YR) PLYWOOD MILL
Hurricane Rita Timber Damage Assessment Texas Forest Service 30 September 2005
 Hurricane Rita Timber Damage Assessment Texas Forest Service 30 September 2005 Hurricane Rita made landfall on 24 September 2005, around 2:30 am CDT on the extreme southwest coast of Louisiana between
Texas Transportation Institute The Texas A&M University System College Station, Texas
 Technical Report Documentation Page 1. Report No. 2. Government Accession No. 3. Recipient's Catalog No. FHWA/TX-01/1859-1 4. Title and Subtitle DEVELOPMENT OF AN ENVIRONMENTAL COMPLIANCE MANUAL FOR SMALL
Harvest Trends 2015 January 2017
 Harvest Trends 2015 January 2017 OKLAHOMA Wright City Broken Bow Idabel Dierks ARKANSAS Gurdon MILLS SURVEYED FOR HARVEST TRENDS 2015 SMALL SAWMILL (=20MMBF/YR) PLYWOOD MILL
Texas Senate Bill 5 - Reducing Pollution in Non-Attainment Areas: An Overview of the Legislation
 Texas Senate Bill 5 - Reducing Pollution in Non-Attainment Areas: An Overview of the Legislation C.Culp, J.Haberl, B.Yazdani, T. Fitzpatrick, J.Bryant, D.Turner Energy Systems Laboratory, Texas A&M University
Economic Contributions of the Environmental Horticulture Industry in Florida in 2015
 Economic Contributions of the Environmental Horticulture Industry in Florida in 2015 Sponsored Project Report to Florida Nursery, Growers and Landscape Association, Orlando, Florida Alan W. Hodges, PhD*
Houston Ozone Past, Present, and Future?
 Houston Ozone Past, Present, and Future? AWMA-GCC Annual Conference March 1st, 2018 Ozone Past, Present, and Future? Items for today s discussion: 2015 Ozone Standard 2008 Ozone Standard Both standards
2015 Energy Code Legislative Changes
 2015 Energy Code Legislative Changes Phil Crone, Executive Officer Dallas Builders Association Steve Saunders, CEO Tempo Mechanical, TexEnergy Solutions, US Eco Logic August 30, 2016 History of Energy
2017 GROUNDWATER DISCHARGE AND USAGE
 2017 GROUNDWATER DISCHARGE AND USAGE 2018 2017 Groundwater Discharge and Usage Groundwater discharges from the Edwards Aquifer either as springflow or as pumping from wells. Comal and San Marcos springs,
Hurricane Harvey Round 1 Councils of Governments Method of Distribution Guidelines
 Texas General Land Office Community Development and Revitalization Program cdr@glo.texas.gov 1.800.998.4456 Hurricane Harvey Round 1 Councils of Governments Method of Distribution Guidelines Page 1 of
Harvest Trends 2012 September 2013
 Harvest Trends 2012 September 2013 OKLAHOMA Wright City Broken Bow Idabel Dierks ARKANSAS Gurdon MILLS SURVEYED FOR HARVEST TRENDS 2012 SMALL SAWMILL (=20MMBF/YR) PLYWOOD MILL
SIP Challenges in Houston-Galveston-Brazoria. Chief Engineer s Office, Air Quality Division
 SIP Challenges in 2008 Houston-Galveston-Brazoria Chief Engineer s Office, Air Quality Division Susana M. Hildebrand, Air Quality P.E., Division Director HGB SIP Challenges in 2008 February 12, 2008 Page