MELBOURNE REGIONAL LANDFILL AIR QUALITY ASSESSMENT
|
|
|
- Brandon Davis
- 6 years ago
- Views:
Transcription

1 Report MELBOURNE REGIONAL LANDFILL AIR QUALITY ASSESSMENT LANDFILL OPERATIONS PTY LTD Job ID May 2016
2 PROJECT NAME: Melbourne Regional Landfill Air Quality Assessment JOB ID: DOCUMENT CONTROL NUMBER AQU-VC PREPARED FOR: Landfill Operations Pty Ltd APPROVED FOR RELEASE BY: Robin Ormerod DISCLAIMER & COPYRIGHT: This report is subject to the copyright statement located at Pacific Environment Operations Pty Ltd ABN DOCUMENT CONTROL VERSION DATE PREPARED BY REVIEWED BY Final 13/05/2016 Bethany Warren Robin Ormerod Pacific Environment Operations Pty Ltd: ABN BRISBANE Level 19, 240 Queen Street, Brisbane Qld 4000 GPO Box 1677, Brisbane Qld 4000 Ph: Fax: SYDNEY Suite 1, Level 1, 146 Arthur Street North Sydney, NSW 2060 Ph: Fax: ADELAIDE 35 Edward Street, Norwood SA 5067 PO Box 3187, Norwood SA 5067 Ph: Fax: PERTH Level 1, Suite 3 34 Queen Street, Perth WA 6000 Ph: Fax: Job ID AQU-VC Cleanaway Melbourne Regional Landfill AQA R10 Low Res.docx ii
3 DISCLAIMER Pacific Environment acts in all professional matters as a faithful advisor to the Client and exercises all reasonable skill and care in the provision of its professional services. Reports are commissioned by and prepared for the exclusive use of the Client. They are subject to and issued in accordance with the agreement between the Client and Pacific Environment. Pacific Environment is not responsible for any liability and accepts no responsibility whatsoever arising from the misapplication or misinterpretation by third parties of the contents of its reports. Except where expressly stated, Pacific Environment does not attempt to verify the accuracy, validity or comprehensiveness of any information supplied to Pacific Environment for its reports. Reports cannot be copied or reproduced in whole or part for any purpose without the prior written agreement of Pacific Environment. Where site inspections, testing or fieldwork have taken place, the report is based on the information made available by the client or their nominees during the visit, visual observations and any subsequent discussions with regulatory authorities. The validity and comprehensiveness of supplied information has not been independently verified and, for the purposes of this report, it is assumed that the information provided to Pacific Environment is both complete and accurate. It is further assumed that normal activities were being undertaken at the site on the day of the site visit(s), unless explicitly stated otherwise. Job ID AQU-VC Cleanaway Melbourne Regional Landfill AQA R10 Low Res.docx iii
4 EXECUTIVE SUMMARY Landfill Operations Pty Ltd (Landfill Ops), a wholly owned subsidiary of Cleanaway Waste Management Ltd (Cleanaway), acquired from Boral Resources (Vic) Pty Ltd (Boral) the landfill rights for the Melbourne Regional Landfill (MRL), formerly called the Western Landfill, at Christies Road, Ravenhall in the outer western suburbs of Melbourne. Cleanaway also acquired an interest in the land on which the MRL is located and the adjoining land at Hopkins Road, Truganina and Christies Road, Ravenhall (Ravenhall Site). Pacific Environment Ltd was engaged by Landfill Ops to provide an air quality assessment to support a Works Approval application for the MRL Extension. The assessments will also support an application for a separate planning permit for use and development The assessment must satisfy the requirements of the following relevant Victorian regulations and guidelines: Environment Protection Act, Environmental Protection (Scheduled Premises and Exemptions) Regulations, Waste Management Policy (Siting, Design & Management of Landfills) (Landfill WMP), State Environmental Protection Policy (SEPP) Air Quality Management (AQM). SEPP Ambient Air Quality (AAQ). Best Practice Environmental Management (BPEM) Siting, Design, Operation and Rehabilitation of Landfills. EPA Publication 788.3, August 2015 (the BPEM ). Odour is of particular concern and interest as a regulatory and community issue because of its ability to have direct sensory effects on people who are exposed to those emissions. This exposure can lead to nuisance and complaints, a situation that is often difficult to address in a purely quantitative manner, i.e., with models and numbers. Nevertheless, a scientific approach to assessing the potential impacts and addressing ways to effectively manage them is an essential requirement of the approval process. The assessment has been performed using conservative assumptions around odour emission rates, total areas of odour sources, and location of emission sources. The dispersion model results have been interpreted using the conservative requirements by the EPA which results in an assessment that considers the worst case odour impacts and worst case interpretation of the impacts. This ensures the assessment highlights all possible risks associated with air quality and the operation of the landfill. CONCLUSIONS Operation of the landfill results in odour and dust emissions that have the potential to cause amenity impacts if they are not adequately controlled. Odour, while sometimes detectable off site when the active cell is close to the Ravenhall Site boundary, is not necessarily offensive. The degree to which odour impacts are likely to occur in the future operation of the MRL is the key item in this assessment. Observations at the Ravenhall Site and in the surrounding area on multiple occasions in 2014 and 2015 indicate that odour levels off site in the recent past have been consistent with what might be expected for a large landfill receiving putrescible wastes. A series of observations was made around the Ravenhall Site before the acquisition of the landfill business by Cleanaway. At that time, some practices on site were different from those that have now been put in place. Practices introduced by Landfill Ops are likely to have reduced the potential for odour emissions. This applies both to routine emissions, e.g., from the active face and capped cells, and to intermittent emissions, e.g., from failures in LFG capture system integrity or from engineering activity that involves disturbance of buried waste. Job ID AQU-VC Cleanaway Melbourne Regional Landfill AQA R10 Low Res.docx iv
5 A major issue with the landfill in the past two to three years in particular has been community perception of odour impacts. A sudden and very large surge in complaints received by EPA occurred in early 2014 and persisted for some months. Complaint levels have now returned to the low levels that are consistent with a pattern that prevailed before the surge in complaints. The 2014 surge in complaints appears to have been triggered by changes in community perception created by events related to announcements by Boral (previous operator of the landfill) about the future of the Ravenhall Site, and/or by other related factors in the community. Regardless of the triggers, this increase in complaints was remarkable. Details of complaints records show that the landfill was perceived to be the principal source of the odour being complained about. Analysis of EPA complaints data from July 2013 to September 2014 shows that the composting odours were very likely to have been the dominant cause of odour that triggered complaints about the Deer Park Landfill odour in nearby suburbs over the period when the composting facility was operating. The landfill is unlikely to have been a significant cause of complaints in those suburbs (even though it was perceived as the source). Observations in the field in 2014 confirmed that the downwind extent and intensity of the detectable odour from the landfill operations were considerably less than from the adjacent Pinegro green waste composting operation. After Pinegro had responded to an EPA PAN notice in mid-2014, field observations suggested that the odour had changed to some extent in character and was less offensive, but the distances that it was detected downwind remained similar. Monitoring conducted on 30 November and 1 December 2015, combined with odour observations from 2014 and 2015, was used to develop site-specific odour emissions for the active face, final capped cells and for the interim capped cells. Literature values for the leachate ponds were used to assess emissions as this source was not available for testing during the monitoring period. Modelling of future scenarios for landfill operations has been conducted on the assumption that a high standard of odour management will be in place. This is dictated by the BPEM and the Landfill Gas Management Plan that has been developed for the MRL Extension. To account for changes in the odour emissions characteristics of the area in the past 2 years, two base cases have been developed: Base Case 2014 (incl. Pinegro) which includes Pinegro, and Base Case 2015 without it. Modelling of the Base Case 2014 (incl. Pinegro) for this assessment used estimates of odour emissions from the Pinegro facility (which are inevitably very approximate) and from the recent landfill operations. The results of the modelling are summarised in an odour risk assessment matrix (Table ES1 below), constructed in accordance with the EPA s guidance on odour risk assessment. The nominated sensitive receptors are shown in the main report at Figure 3.1 and Figure 3.2. The future scenarios S1 to S4 are identified in Figure 2.4 and Section 2.5. Note that in Table ES1 the future scenarios 3 Low and 4 Low refer to the expected outcome of a reduced organic waste fraction during the relevant periods. The results for the Base Case 2014 (incl. Pinegro) show that the contribution of the Pinegro facility to odour levels in the surrounding area was very significant and resulted in a medium odour risk level at most of the sensitive receptors identified in this report. A medium risk means that detectable odour is present for at least 3-minutes for at least 45 hours in a year and up to 175 hours of the year. This means that odour is predicted to be detectable 0.5% - 2% of the time during the year. The extent of this medium risk level, extending well into suburban areas, is consistent with there being a potential for annoyance and complaint. On the other hand, the model results for the landfill alone (Base Case 2015) indicate negligible or low risk level at all but four of the 25 nominated receptors, located east of the site. The current impact of the landfill odour does not indicate the potential for significant levels of complaint, which is consistent with more recent experience. Job ID AQU-VC Cleanaway Melbourne Regional Landfill AQA R10 Low Res.docx v
6 Future scenarios indicate generally low or negligible odour risk with a few exceptions at the medium risk level for scenarios 1, 2 and 4. Scenarios 1 and 2 impinge on receptors R1 and R2, close to the southwest corner of the subject site. Scenario 4 is potentially associated with a medium risk at R15, but only if it is assumed that reducing the organic waste fraction in line with the Draft Metropolitan Waste and Resource Recovery Implementation Plan is not effective in ameliorating odour emissions. If it is assumed that the Plan would have an effect on odour emissions, the predicted risk at this receptor is low. Other management options for mitigating odour risk are also considered for this scenario. Receptor Base2014 (incl. Pinegro) Table ES1: Summary of Odour Risk at Nominated Receptors Base2015 S1 S2 S3 S3LOW S4 S4LOW 3,600 m² 1,800 m² 1,800 m² 1,800 m² 1,800 m² 1,800 m² 1,800 m² 1,800 m² R1 R2 R3 R4 R5 R6 R7 R8 R9 R10 R11 R12 R13 R14 R15 R16 R17 R18 R19 R20 R21 R22 R23 R24 R25 Blank Below risk assessment threshold, Green Low risk, Orange Medium risk, Red High risk S3LOW 20% Reduction in organic fraction S4LOW 30% Reduction in organic fraction The design and management of a landfill plays an extremely important role in odour emissions. The difference in odour impacts from a poorly managed landfill and a best practice operation is very significant. Minimising the opportunity for odour emissions requires attention to all of the significant potential odour sources, most particularly: the active face by minimising the area of newly placed waste that is exposed to the atmosphere on a continuous basis, and ensuring that there is adequate daily cover to minimise emissions Job ID AQU-VC Cleanaway Melbourne Regional Landfill AQA R10 Low Res.docx vi
7 the active cell (apart from the active face) - by ensuring an adequate interim cap is in place and that active LFG capture is installed as soon as possible, using a sacrificial horizontal collection system. completed cells by having in place an effective final cap, an efficient active LFG gas collection system and an effective monitoring and maintenance program to ensure no significant fugitive emissions. A vegetated cover will also help to reduce the potential for emissions through the surface. leachate by minimising the generation of leachate. This is achieved by ensuring maximum integrity of cells and minimising water infiltration, ensuring that any exposed leachate storage is located well away from sensitive locations, and by monitoring of leachate condition and emissions. site works by avoiding disturbance of previously placed waste, e.g., in developing or modifying the LFG capture system, when there is a risk that odour emissions will impact on sensitive locations. The effectiveness of improving odour management at landfills has been seen at other landfills. For example, at the Brisbane Landfill in Queensland, a major odour problem in the 1990s affecting the local community at Rochedale was significantly reduced by implementing an exhaustive set of improvements to site operations and monitoring. The final management program resulted from a mediation process involving multiple odour experts from Queensland, NSW and Victoria. The practices imposed at that time are now routine best practice measures for landfills, generally in line with the BPEM requirements. The current and proposed operations at MRL are operated by Landfill Ops in line with current best practice methods. One of the key issues in improving odour management is the ability to monitor and identify potential problems early and act quickly to rectify them. Improvements in monitoring and management technologies are occurring rapidly and it is expected that future operations will benefit from technologies and practices that may not yet exist or are not well developed. In all cases of identified medium odour risk, the current best practice methods are assumed to apply. However, it is expected that as site knowledge progresses and technologies advance, additional proactive measures can be identified, investigated and, if successful, applied to better manage odour risk. Longer term emission data and field observations will help to better characterise emissions and impacts. It is notable that the odour risk at specific receptors is not relevant at all times: weather conditions, and most importantly wind conditions, are key to determining whether an impact is likely to occur at any given time. This knowledge can assist in fine-tuning odour management approaches. Apart from a reduction in odour potential as organic fraction decreases, there may also be opportunity to treat some waste prior to placement as well as during placement to reduce emissions at critical times. Odour mitigation by use of neutralising agents sprayed onto waste or intercepting odour plumes is another option currently in place at the site and if longer term applications indicate that it is beneficial it would be applied as required. In relation to dust, predicted cumulative concentrations and dust deposition rates are within the relevant guidelines. Emissions from the Ravenhall Site occur in a context where quarry and other operations on the Boral land also emit dust. Short-term campaign monitoring of PM10 at the Ravenhall Site boundaries showed that concentrations are not excessive, and are broadly in line with expectations from the modelling. The contribution of sources other than landfill operations in the surrounding area is significant. Haul roads are a major part of the emission inventory for the landfill, and these sources are subject to regular watering to control dust emissions. MANAGEMENT PLAN Job ID AQU-VC Cleanaway Melbourne Regional Landfill AQA R10 Low Res.docx vii
8 Landfill Ops presently operates the Ravenhall Site to control odour and dust emissions in accordance with its EPA Licence and associated plans and guidelines. The specific conditions of the Licence in relation to odour and dust are: LI_A1 Offensive odours must not be discharged beyond the boundaries of the premises. LI_A4 Nuisance airborne particles must not be discharged beyond the boundaries of the premises. LI_L4 Waters contaminated by leachate must not be discharged beyond the boundaries of the premises L1_L5 You must prevent emissions of landfill gas from exceeding the investigation levels specified in Best Practice Environmental Management, Siting, Design, Operation and Rehabilitation of Landfills (EPA Publication 788). L1_L3 By the end of each day's operations waste must be covered with a layer of soil at least 0.30 metres thick or using another method of cover approved by EPA. LI_L6 You must progressively rehabilitate landfill cells in accordance with Best Practice Environmental Management, Siting, Design, Operation and Rehabilitation of Landfills (EPA Publication 788). For the ongoing management of the landfill operations, the key objectives of the BPEM for air quality are: no health, safety or environmental impacts due to landfill gas and dust minimise greenhouse gas emissions prevent offsite nuisance odours and dust meet requirements of relevant SEPP and waste management policies. Specifically, these objectives have been translated into an ongoing program designed to comply with the BPEM objectives and specific guidance on active management for odour control, cell rehabilitation, LFG management, monitoring and complaints management. A Landfill Gas Management Plan has been developed for the MRL Extension to meet these requirements. It is not recommended to monitor dust emissions as the dispersion modelling indicates the PEM Mining guideline is not likely to be exceeded at the sensitive receptors during the MRL extension. Measures to improve on current best practice will be investigated so that where and when predicted impacts indicate elevated odour risk, best possible site management is implemented proactively. Best practice is not a static benchmark and will shift over time as technologies enable routine use of improved methods. Job ID AQU-VC Cleanaway Melbourne Regional Landfill AQA R10 Low Res.docx viii
9 CONTENTS 1 INTRODUCTION 1 2 LANDFILL DESCRIPTION Project Location Current and Approved Operations Proposed Extension and Staging Emission Sources Selected Scenarios for the Assessment 7 3 LOCAL ENVIRONMENTAL SETTING Topography Sensitive Receptors Climate Dispersion Meteorology Wind Atmospheric Stability Mixing Height Measured Air Quality Field Observations and Measurements Odour Particulate Matter Community Impacts and Complaints Data Source and Setting Locations of Complaints Complaints Over Time Attribution of Complaints Discussion of Nuisance and Complaints 52 4 ASSESSMENT GUIDELINES AND POLICIES Assessment Framework BPEM Landfill Gas Odour and Dust Odour Guidelines Introduction Factors Affecting Odour Response State Policy EPA Odour Risk Assessment Methodology Particulate Matter Guidelines 60 5 PROJECTED EMISSIONS Odour Emissions Current Odour Management Site-Specific Odour Emissions Literature Review of Odour Emission Rates Landfill Gas Management Plan Draft Metropolitan Waste and Resource Recovery Implementation Plan Estimated Emissions for Selected Scenarios Particulate Matter Emissions Basis of Emission Estimates Estimated Emissions for Modelled Scenarios Estimated Emissions for Updated Transport Conditions 72 6 DISPERSION MODELLING EPA Air Quality Modelling Policy AERMOD Modelling System 74 Job ID AQU-VC Cleanaway Melbourne Regional Landfill AQA R10 Low Res.docx ix
10 6.3 Model Input Requirements Model Accuracy Cumulative Assessment and Background Data Particle Characteristics Source Details Time-Varying Emission Rates Sensitive Receptor Locations 81 7 MODEL RESULTS Odour Particulate Matter PM Dust Deposition 92 8 AIR QUALITY ASSESSMENT Odour Odour Risk Assessment Comparative Assessment Buffers and Odour Levels Particulate Matter 96 9 CONCLUSIONS Impacts Management Plan REFERENCES 101 APPENDIX A GLOSSARY A-1 APPENDIX B PAPERS ON ODOUR INTENSITY B-1 APPENDIX C SITE-SPECIFIC ODOUR OBSERVATIONS AND EMISSION RATES C-1 APPENDIX D AERMOD MODEL FILES D-1 APPENDIX E CFD MODELLING IN RELATION TO WINDBLOWN DUST EMISSIONS E-1 APPENDIX F SELECTION OF REPRESENTATIVE YEAR F-1 APPENDIX G FLEXPART MODELLING OF CELL ELEVATION EFFECT ON DOWNWIND CONCENTRATIONS G-1 APPENDIX H DUST EMISSIONS ESTIMATION H-1 APPENDIX I CONTOUR PLOTS I-1 Job ID AQU-VC Cleanaway Melbourne Regional Landfill AQA R10 Low Res.docx x
11 List of Tables Table 2.1: Summary of Emission Sources 6 Table 2.2: Summary of Modelled Scenarios 7 Table 3.1: Sensitive Receptor Locations 9 Table 3.2: Guide to Using VDI Odour Intensity Scale (Pitt, 2014) 36 Table 3.3: Suburb Population Estimates 41 Table 3.4: Number of Complaints Alleging Specific Sources of Odour 48 Table 3.5: Summary of EPA Notices and Actions by Boral in Table 5.1: Site-Specific Odour Emission Rates based on Measurement on 30/11/15 and 1/12/15 62 Table 5.2 Summary of Odour Emission Rates Reviewed for All Landfill Cell Categories (ou/m 2 /s) 62 Table 5.3 Odour Emission Rates Used in this Assessment (ou.m 3 /m 2 /s) a 63 Table 5.4 Summary of the Key Features of Each Cell 66 Table 5.5 Estimated Areas Associated with the Landfill Activities 66 Table 5.6 Estimated Odour Emission Rates for Selected Scenarios Associated with the Landfill Activities 66 Table 5.7 Areas and Odour Emission Rates Associated with the Pinegro Composting Facility s Activities 67 Table 5.8 Emission Factors Used for Dust Emissions Estimation 69 Table 5.9 Estimated Annual Dust Emissions from the Landfill Operations 71 Table 5.10: MRL Modelled and Updated Dust Emission based on the latest 73 Table 6.1 Dust Emissions from Nearby Industrial Facilities 78 Table 6.2 Modelled Volume Source Parameters 80 Table 6.3 Wind Erosion Emission Ratios Based on Wind Speed 81 Table 6.4 Operating Hours of the Landfill and the Major Industrial Facilities Operating in the Deer Park Area 81 Table 7.1: Odour Modelling Scenario Descriptions 83 Table 7.2 Predicted C min Odour Concentrations at Identified Sensitive Receptors Base 2014 and Base 2015 Scenarios 84 Table 7.3 Predicted C min Odour Concentrations at Identified Sensitive Receptors Scenarios 1 and 2 85 Table 7.4 Predicted C min Odour Concentrations at Identified Sensitive Receptors Scenarios 3 and 3 LOW 86 Table 7.5 Predicted C min Odour Concentrations at Identified Sensitive Receptors Scenarios 4 and 4 LOW 87 Table 7.6 Predicted Maximum Cumulative 24-hr PM10 Concentrations at Sensitive Receptors (Background Included) 88 Table 7.7: Predicted Dust Deposition at Sensitive Receptors for Selected Scenarios 92 Table 8.1: Summary of Odour Risk Assessment Using the Victorian EPA Methodology 94 Table 8.2: Summary of Odour Assessment Using NSW Methodology 95 List of Figures Figure 2.1: Site Context Plan with Sensitive Receptors 3 Figure 2.2: MRL Proposed Cells 4 Figure 2.3: Proposed Cells for Locations of Leachate Ponds 5 Figure 2.4: Selected Scenarios and Indicative Boundaries 8 Figure 3.1: All Sensitive Receptors Locations 10 Figure 3.2: Sensitive Receptor Locations North of MRL 11 Job ID AQU-VC Cleanaway Melbourne Regional Landfill AQA R10 Low Res.docx xi
12 Figure 3.3: Average Long-Term Minimum and Maximum Temperatures at Laverton (Source: BoM, 2014) 13 Figure 3.4: Average Long-Term Decile 1, Median and Decile 9 Rainfall at Laverton (Source: BoM, 2014) 14 Figure 3.5: Long-Term Average Wind Roses at Laverton ( ) for Summer (Upper) and Autumn (Lower) 15 Figure 3.6: Long-Term Average Wind Roses at Laverton ( ) for Winter (Upper) and Spring (Lower) 16 Figure 3.7: Monthly Average Wind Speed for Meteorological Years 2008 to Figure 3.8 Annual Wind Roses for Deer Park for 2008 Generated from AERMET Output 18 Figure 3.9 Annual Wind Roses for Deer Park for 2009 Generated from AERMET Output 19 Figure 3.10 Annual Wind Roses for Deer Park for 2010 Generated from AERMET Output 20 Figure 3.11 Annual Wind Roses for Deer Park for 2011 Generated from AERMET Output 21 Figure 3.12 Annual Wind Roses for Deer Park for 2012 Generated from AERMET Output 22 Figure 3.13: Annual statistics of 1/L by hour of the day for 2008 Generated from AERMET Output 23 Figure 3.14: Annual statistics of 1/L by hour of the day for 2009 Generated from AERMET Output 24 Figure 3.15: Annual statistics of 1/L by hour of the day for 2010 Generated from AERMET Output 24 Figure 3.16: Annual statistics of 1/L by hour of the day for 2011 Generated from AERMET Output 25 Figure 3.17: Annual statistics of 1/L by hour of the day for 2012 Generated from AERMET Output 25 Figure 3.18: Annual Distribution of Stability Category by Hour of the Day at Deer Park, 2008 Generated from AERMET Output 26 Figure 3.20: Annual Distribution of Stability Category by Hour of the Day at Deer Park, 2009 Generated from AERMET Output 27 Figure 3.21: Annual Distribution of Stability Category by Hour of the Day at Deer Park, 2010 Generated from AERMET Output 27 Figure 3.22: Annual Distribution of Stability Category by Hour of the Day at Deer Park, 2011 Generated from AERMET Output 28 Figure 3.23: Annual Distribution of Stability Category by Hour of the Day at Deer Park, 2012 Generated from AERMET Output 28 Figure 3.24: Statistics of AERMET generated Mixing Height for 2008 Generated from AERMET Output 30 Figure 3.25: Statistics of AERMET generated Mixing Height for 2009 Generated from AERMET Output 30 Figure 3.26: Statistics of AERMET generated Mixing Height for 2010 Generated from AERMET Output 31 Figure 3.27: Statistics of AERMET generated Mixing Height for 2011 Generated from AERMET Output 31 Figure 3.28: Statistics of AERMET generated Mixing Height for 2012 Generated from AERMET Output 32 Figure 3.29: EPA Monitoring Station at Deer Park (5 km NE of the Current Landfill Operations) 33 Figure 3.30: Running 24-hour PM10 Concentration at Deer Park Monitoring Station ( ). Red Line Indicates NEPM Standard 34 Figure 3.31: Plot of Hourly Wind Direction and Wind Speed with Corresponding Relative PM10 Concentration (size of bubble), Deer Park 34 Figure 3.32: Deer Park PM10 Pollution Rose ( ) - Regional Events Excluded 35 Figure 3.33: Observations of Odour Plumes from the landfill and Pinegro, 11 June Figure 3.34: Locations of Short-Term Dust Monitors 38 Figure 3.35: Hourly Average PM10 for Dust1 and Meteorological Data 38 Figure 3.36: Hourly Average PM10 for Dust2 and Meteorological Data 39 Figure 3.37: Hourly Average PM10 for Dust3 and Meteorological Data 39 Figure 3.38: Boral Deer Park Quarry Orsis Real-time Dust Monitor 40 Figure 3.39: Boral Deer Park Quarry 24-hour Average PM10 Concentrations (µg/m³) 40 Figure 3.40: Boral Deer Park Quarry 1-hour Average PM10 Concentrations (µg/m³) 41 Job ID AQU-VC Cleanaway Melbourne Regional Landfill AQA R10 Low Res.docx xii
13 Figure 3.41: Location of Surrounding Suburbs and Primary Odour sources (Current Landfill, Pinegro (now closed) and Boral Asphalt Plant Shaded Pink) with Remainder of Landfill Ops Property Shaded Grey 42 Figure 3.42: Distribution of Odour Complaints by Suburb 44 Figure 3.43: Complaints per 100 Residents by Suburb 44 Figure 3.44: Numbers of Complaints by Month, July 2013 November Figure 3.45: Daily Complaints, February-March Figure 3.46: Standardised Rate of Complaint by Suburb and Month and Year 46 Figure 3.47: Complaints Reported by Time of Day, July November Figure 3.48: Complaint roses showing the frequency of occurrence of wind directions associated with complaints, by suburb between July 2013 and September The area enclosed by each rose is proportional to the number of complaints from that suburb (total 1409). 50 Figure 3.49: Complaint roses showing the frequency of occurrence of wind directions associated with complaints, by suburb between October 2014 and November The area enclosed by each rose is proportional to the number of complaints from that suburb (total 460, average 32 per month). 51 Figure 4.1: Variability of Odour Nuisance across Gladstone, Queensland in 2002 (Ormerod, D'Abreton et al. 2002) 58 Figure 4.2: EPA Odour Risk Assessment Matrix (EPA, 2015) 60 Figure 5.1: Indicative Haul Road Layout for Future Scenarios 70 Figure 6.1 Major Industrial Facilities Located Near the Approved Site 77 Figure 7.1: Time-Series Plot for Maximum 24-hr Average PM10 Concentrations: Receptor 1 - Scenario 1 Met Year 2008 (Top) and 2009 (Bottom) 90 Figure 7.2: Time-Series Plot for Maximum 24-hr Average PM10 Concentrations: Receptor 17 - Scenario 2 Met Year 2008 (Top) and 2009 (Bottom) 91 Job ID AQU-VC Cleanaway Melbourne Regional Landfill AQA R10 Low Res.docx xiii
14 1 INTRODUCTION Landfill Operations Pty Ltd (Landfill Ops), a wholly owned subsidiary of Cleanaway Waste Management Group Pty Ltd (Cleanaway), acquired from Boral Resources (Vic) Pty Ltd (Boral) the landfill rights for the Melbourne Regional Landfill (MRL), formerly called the Western Landfill, at Christies Road, Ravenhall in the outer western suburbs of Melbourne. Cleanaway also acquired an interest in the land on which the MRL is located and the adjoining land at Hopkins Road, Truganina and Christies Road, Ravenhall (Ravenhall Site). Pacific Environment Ltd was engaged by Landfill Ops to provide an air quality assessment to support a Works Approval application for extension of MRL. The assessments will also support an application for a separate planning permit for use and development of the Ravenhall Site as a putrescible landfill for the extension of MRL with Melton City Council. The assessment must satisfy the requirements of the following relevant Victorian regulations and guidelines: Environment Protection Act, 1970 Environmental Protection (Scheduled Premises and Exemptions) Regulations, 2007 Waste Management Policy (Siting, Design & Management of Landfills) (Landfill WMP), 2004 SEPP Air Quality Management (AQM) SEPP Ambient Air Quality (AAQ) Best Practice Environmental Management (BPEM) Siting, Design, Operation and Rehabilitation of Landfills. EPA Publication 788.3, August 2015 (the BPEM ) Odour is of particular concern and interest as a regulatory and community issue because of its ability to have direct sensory effects on people who are exposed to those emissions. This exposure can lead to nuisance and complaints, a situation that is often difficult to address in a purely quantitative manner, i.e., with models and numbers. Nevertheless, a scientific approach to assessing the potential impacts and addressing ways to effectively manage them is an essential requirement of the approval process. The scope of work does not include a landfill gas (LFG) environmental risk assessment. The LFG risk assessment has been prepared by Golder Associates. Job ID AQU-VC Cleanaway Melbourne Regional Landfill AQA R10 Low Res.docx
15 2 LANDFILL DESCRIPTION MRL is a major municipal solid waste disposal facility located in Melbourne s western suburbs, receiving approximately 780,000 tonnes of waste per year. This tonnage is likely to increase as landfill airspace at other landfill sites across Metropolitan Melbourne is progressively consumed. The waste materials disposed of in the landfill are those that have not been diverted into recycling in the broader waste management system. As a result of the landfill s size and operational characteristics, it is a focus of attention on environmental impacts. 2.1 Project Location The Ravenhall Site is approximately 20 km west of the Melbourne CBD, bound by Christies Road to the east, Middle Road to the south, Hopkins Road to the west and the Ballarat rail line to the north. Ravenhall Site comprises the two properties located at Hopkins Road, Truganina and Christies Road, Ravenhall. Riding Boundary Road and Clarke Road reserves run through Ravenhall Site. Figure 2.1, the Site Context Plan, shows the approved landfill occupying part of the southeast portion of the Ravenhall Site. A much larger portion on both sides of Riding Boundary Road is approved for quarrying and has been operated since the 1960s. The surrounding suburbs with extensive residential areas are Caroline Springs, Burnside, Deer Park and Derrimut, located to the north through east of the Ravenhall Site. To the south and west are scattered residences on acreage properties. A composting facility was previously located within the Ravenhall Site, operated by Pinegro Products Pty Ltd. The composting facility stopped acceptance of incoming waste and all composted material was relocated offsite by October 2015 at which time the composting facility ceased operations and closed. However, the recent impacts of the operation are relevant to the odour impacts considered in this assessment. 2.2 Current and Approved Operations The existing EPA Licence to landfill waste at the existing facility has been in place since 30 December 1998, and is currently held by Landfill Ops. The current licensed area is 133 ha and is part of a 1,150 ha property that has mainly been used as a hard rock quarry since Boral currently operates the quarry on the property (Deer Park Quarry). The existing landfill is located in the south-east corner of the Ravenhall Site, south of Riding Boundary Road. The landfilling occurs in discrete engineered cells that are prepared, filled with waste, capped, progressively rehabilitated and managed over time so as to contain contaminants that could be released to groundwater and minimise air emissions. Biogas is also collected from completed cells and converted into renewable energy by the Landfill Gas-to-Energy (LFGTE) facility. Using the gas produced by waste decomposition, the LFGTE facility currently generates sufficient output to power the energy needs of around 4000 homes, 24 hours a day. The power generated on-site is fed into the national grid as green power. MRL also has three flare systems to burn the landfill gas during periods when the LFGTE facility is not operating or if the landfill generates more gas than the LFGTE facility can process. MRL is a major commercial facility, amongst the largest in the State, and receives waste from most parts of Melbourne but primarily Melbourne s west. It accepts waste from commercial operators as well as municipalities collecting from kerbsides (especially from the west of Melbourne), private waste companies, and industries including construction and manufacturing. The MRL does not currently accept waste from the general public. The MRL is able to operate 24 hours a day and has buffers from surrounding sensitive uses. It is licensed to and accepts the following waste: putrescible waste non-putrescible (or solid inert) waste Job ID AQU-VC Cleanaway Melbourne Regional Landfill AQA R10 Low Res.docx

16 shredded tyres contaminated soil C (low level). The Ravenhall Site is located within a State Significant Industrial Precinct Future as defined by Plan Melbourne and is also known as an existing hub of State importance in the Statewide Waste and Resource Recovery Infrastructure Plan. Figure 2.1: Site Context Plan with Sensitive Receptors Job ID AQU-VC Cleanaway Melbourne Regional Landfill AQA R10 Low Res.docx

17 2.3 Proposed Extension and Staging MRL has approximately 7-10 years of capacity remaining under the current approvals. As a result, it is proposed to extend the area of the landfill into the void created by Boral s quarry operations. Figure 2.2 shows the layout of future proposed cells. Figure 2.2 shows the proposed locations of the leachate pond for each cell. Broadly, the future stages progress towards the west and then to the north, focusing on filling in the southern and western perimeter areas of the Ravenhall Site as early as is feasible. Figure 2.2: MRL Proposed Cells Job ID AQU-VC Cleanaway Melbourne Regional Landfill AQA R10 Low Res.docx

18 Figure 2.3: Proposed Cells for Locations of Leachate Ponds Job ID AQU-VC Cleanaway Melbourne Regional Landfill AQA R10 Low Res.docx
19 2.4 Emission Sources The emissions of interest associated with this assessment are odour and dust. Odour and dust can affect the amenity of residents living near landfills. The key sources of odour are: Fresh waste as it is delivered and placed in the active cell. Interim cover material reduces this emission, but does not eliminate it entirely. Landfill gas (LFG) from capped cells. When cells accumulate waste which is kept in an anaerobic state by capping material, the waste degrades slowly, generating methane (CH4), carbon dioxide (CO2) and various minor gases, which constitute LFG. Methane and carbon dioxide are odourless, but odour from the minor gases, including sulphide and volatile organic compounds, is very strong at source and has the potential to be carried off site if not adequately controlled by LFG capture systems. Leachate, which drains internally through cells into leachate storage contains odorous compounds and must be managed to minimise emissions of odour. Because a landfill has a large area of exposed earth and a series of temporary roadways that change as cells are developed, filled and completed, there are potentially significant dust sources that include: wheel-generated dust from vehicle movements disturbance due to machinery action, including earthmoving, at various stages of a cell s life wind erosion from dusty exposed surfaces. Landfill Ops collects LFG from completed cells and because the gas contains enough methane to combust, converts this into renewable energy. Using the gas produced by waste decomposition, the LFGTE facility currently generates sufficient output to power the energy needs of around 4,000 homes, 24 hours a day. A summary of the possible MRL Extension emissions is provided in Table 2.1. Activity Transport of waste from Riding Boundary Rd to landfill active face Tipping of waste at landfill active face Waste spreading Cover material and capping material spreading Waste compaction Operation of flare Operation of landfill gas fired turbine (power generation) Covering of waste daily Interim landfill cells Capped landfill cell Wind erosion Table 2.1: Summary of Emission Sources Potential Air Emissions Particulate matter on unsealed internal roads. Products of combustion from internal combustion engines; i.e. particulate matter. Odour Odour It is assumed that the moisture content of freshly placed waste is sufficiently high to prevent dust emissions from waste handling. Particulate matter Odour Products of combustion from LFG flaring; i.e. particulate matter. Products of combustion from landfill gas fired turbines; i.e. particulate matter. Particulate matter Odour Odour. Odour Particulate matter from exposed areas (covered cells). Job ID AQU-VC Cleanaway Melbourne Regional Landfill AQA R10 Low Res.docx
20 2.5 Selected Scenarios for the Assessment The assessment uses modelling to examine the potential impacts of residual emissions after the application of best practice management, in line with requirements of the Best Practice Environmental Management (BPEM) Siting, Design, Operation and Rehabilitation of Landfills. EPA Publication 788.3, August 2015 (the BPEM ). For this assessment, between five and eight scenarios were modelled for PM10, dust deposition and odour, tracking various stages in the progress of the proposed site operations. Each scenario is based on the emissions associated with a nominated active cell and from the preparation of new cells. The scenarios were selected on the basis that the active cell in question is close to the Ravenhall Site boundary, and therefore represents a maximum impact off site compared to operations on internal cells. The scenarios are as listed in Table 2.2 and the cells are identified in Figure 2.4. The Base Case scenario represents current or recent past landfill operation. Base Case 2014 (incl. Pinegro) represents the recent past which includes Pinegro operations (now closed) and Base Case 2015 represents updated practices. Scenario 1 and Scenario 2 represent landfill operation with active cells on the southwest corner of the Ravenhall Site. Scenario 3 and Scenario 4 represent landfill operation with active cells close to the western boundary. Scenario 4 represents the active cell in the most northerly location of the Ravenhall Site. Scenarios 3 and 4 also consider the potential reduced odour emissions associated with reduced organic waste content, consistent with the Draft Metropolitan Waste and Resource Recovery Implementation Plan. These scenarios are labelled as LOW meaning low organic fraction of waste. Scenario Base Case 2014 (incl. Pingro) Base Case 2015 Active Cell 2L Table 2.2: Summary of Modelled Scenarios Meteorological Year Substance Description 2008 to 2012 (5 years) Odour 2008 and 2009 PM10 and dust deposition 2008 to 2012 (5 years) Odour 3,600 m² active cell + Pinegro emissions Scenario 1 1 Scenario and 2009 PM to 2012 (5 years) Odour 2008 Dust deposition 2008 and 2009 PM to 2012 (5 years) Odour 1,800 m² active tipping face Scenario and 2009 PM to 2012 (5 years) Odour Scenario 3 LOW 2008 to 2012 (5 years) Odour 2008 Dust deposition Scenario and 2009 PM to 2012 (5 years) Odour Scenario 4 LOW 2008 to 2012 (5 years) Odour 1,800 m² active tipping face 20% less organics 1,800 m² active tipping face 1,800 m² active tipping face 30% less organics Job ID AQU-VC Cleanaway Melbourne Regional Landfill AQA R10 Low Res.docx
21 Case Figure 2.4: Selected Scenarios and Indicative Boundaries Job ID AQU-VC Cleanaway Melbourne Regional Landfill AQA R10 Low Res.docx
22 3 LOCAL ENVIRONMENTAL SETTING 3.1 Topography The area around the Ravenhall Site is relatively flat basalt plain, with gentle slopes. The Ravenhall Site itself has been altered where quarrying and landfilling has taken place and completed landfill cells are elevated above natural ground level to a height of approximately 40 metres. 3.2 Sensitive Receptors Discrete sensitive receptors were identified in the vicinity of the proposed MRL Extension. Table 3.1 lists the discrete receptor coordinates, while Figure 3.1 shows all the receptors in relation to MRL and Figure 3.2 shows a close up image of the receptors north west of MRL. Most of the selected receptors represent the nearest residential and commercial locations in various directions, while R23 to R25 are located well within the residential areas of Caroline Springs, Deer Park and Derrimut, respectively. In addition, a mesh of 201 x 201 gridded receptors was included in the model, at a horizontal resolution of 50 m and a domain size of 10 km x 10 km, with the landfill site located in the centre of the domain. Table 3.1: Sensitive Receptor Locations Description Residential area/dwelling Commercial area Residential area/dwelling Commercial area Residential area/dwelling UTM Zone 55S Coordinates (m) Receptor ID Easting Northing R1 297,915 5,814,929 R2 297,485 5,814,875 R3 296,999 5,814,653 R4 296,886 5,814,765 R5 296,617 5,819,044 R6 297,673 5,819,600 R7 297,806 5,819,569 R8 297,784 5,819,449 R9 297,800 5,819,353 R10 298,078 5,819,245 R11 298,109 5,819,457 R12 298,256 5,819,537 R13 298,236 5,819,449 R14 298,212 5,819,274 R15 298,339 5,819,306 R16 299,688 5,819,103 R17 300,702 5,818,722 R18 300,753 5,818,777 R19 300,831 5,818,672 R20 301,351 5,816,363 R21 301,448 5,815,888 R22 301,746 5,814,857 R23 300,129 5,820,916 R24 303,354 5,818,923 R25 303,090 5,815,960 Job ID AQU-VC Cleanaway Melbourne Regional Landfill AQA R10 Low Res.docx

23 Figure 3.1: All Sensitive Receptors Locations Job ID AQU-VC Cleanaway Melbourne Regional Landfill AQA R10 Low Res.docx

24 Figure 3.2: Sensitive Receptor Locations North of MRL Job ID AQU-VC Cleanaway Melbourne Regional Landfill AQA R10 Low Res.docx
25 3.3 Climate Melbourne has a temperate climate due to its location on the northern periphery of the mid-latitudinal westerly zone. Summers are warm, with regular alternation between cool air masses from the Southern Ocean and hot dry continental air from the interior. Higher evaporation and sporadic rainfall in summer can lead to dry surface conditions for extended periods. During winter, the seasonal northward migration of the temperate westerly wind belt results in more regular cold fronts and associated rain, with occasional strong winds. Melbourne has a relatively small variation in winter temperatures in comparison to summer temperatures, with frosts and fog sometimes occurring. Melbourne experiences an increase in surface moisture during winter due to regular rainfall and low evaporation. During all seasons, settled weather associated with high pressure systems can produce clear calm nights with temperature inversions, and under these conditions low-level plumes can remain more concentrated further downwind from their sources. The local climate at the Ravenhall Site is reasonably represented by the nearest Bureau of Meteorology station with an adequate record length. In this case, Laverton RAAF, approximately 8 km to the south was selected. The monthly average minimum and maximum temperature (70-year average) is presented in Figure 3.3. The highest average temperature of 25.7 C occurs in January and the lowest average temperature of 5.0 C occurs in July. The absolute maximum and minimum temperatures of 47.5 C and -4.4 C were recorded on 7 February 2009 and 15 July 1984 respectively. The long-term average rainfall of 536 mm displays a weak bimodal distribution, with highest median monthly rainfall of 45 mm and 52 mm occurring during the months of May and October as shown in Figure 3.4. The rainfall for the month of February displays the highest variability and is associated with convective showers. Winter and spring have the highest number of rain days, averaging 9 days per month. The wind roses presented in Figure 3.5 and Figure 3.6 depict the characteristic of the seasonal wind at Laverton and also show the frequency of occurrence of winds by direction and strength. The bars correspond to the 16 compass points N, NNE, NE, etc. The bar at the top of each wind rose diagram represents winds blowing from the north (i.e., northerly winds), and so on. The length of the bar represents the frequency of occurrence of winds from that direction, and the widths of the bar sections correspond to wind speed categories, the narrowest representing the lightest winds. The major features of the long-term a summer (December-February) wind rose are as follows: the predominant wind direction is from the south and south-southeast highest speeds occur with winds from the southwest to northwest calm conditions occur for 3% of the time. The autumn (March-May) wind rose shows the following: the predominant wind direction is from the north with secondary maxima from the south and west highest speeds occur with winds from the west and north calm conditions occur for 4% of the time. a For a 15 year period ( ) Job ID AQU-VC Cleanaway Melbourne Regional Landfill AQA R10 Low Res.docx
26 The winter (March-May) wind rose shows the following: wind directions are exclusively from west to north-northeast with northerly winds predominating highest speeds occur with winds from the west calm conditions occur for 4% of the time. The spring (September-November) wind rose shows the following: wind directions are multimodal with southerly, westerly and northerly winds predominating highest speeds occur with winds from the west calm conditions occur for 2% of the time. Figure 3.3: Average Long-Term Minimum and Maximum Temperatures at Laverton (Source: BoM, 2014) Job ID AQU-VC Cleanaway Melbourne Regional Landfill AQA R10 Low Res.docx
27 Figure 3.4: Average Long-Term Decile 1, Median and Decile 9 Rainfall at Laverton (Source: BoM, 2014) Job ID AQU-VC Cleanaway Melbourne Regional Landfill AQA R10 Low Res.docx
28 Figure 3.5: Long-Term Average Wind Roses at Laverton ( ) for Summer (Upper) and Autumn (Lower) Job ID AQU-VC Cleanaway Melbourne Regional Landfill AQA R10 Low Res.docx
29 Figure 3.6: Long-Term Average Wind Roses at Laverton ( ) for Winter (Upper) and Spring (Lower) 3.4 Dispersion Meteorology Meteorological data for 2008, 2009, 2010, 2011 and 2012 were used in conjunction with the computer model AERMOD to simulate dispersion of emissions from the Ravenhall Site. Publication 1550 provides Job ID AQU-VC Cleanaway Melbourne Regional Landfill AQA R10 Low Res.docx
30 specific details on how to prepare meteorological data for used as input in AERMOD to drive air dispersion modelling. EPA committed to prepare and provide meteorological data for most locations in Victoria free of charge for at least a year under the new policy. For this assessment, the EPA prepared meteorological model input files for Deer Park for 2008 and These meteorological files were used for the dust and odour assessment. Further analysis of the potential odour impacts considered the additional years 2010, 2011 and The model input files for these years were generated using a methodology consistent with the approach taken by the EPA Wind Wind speed and direction are primary drivers of plume dispersion. Wind direction dictates the direction in which the plume travels. Thus, over a long period, the variation of wind directions determines the spatial pattern of ground level concentrations associated with pollutant plumes. Wind speed influences the initial dilution of the plume as it leaves the source. Broadly speaking, higher wind speeds result in lower ground level concentrations, except where windblown dust is an issue. The monthly average wind speed values for 2008 to 2012 are presented in Figure 3.7. The wind roses for 2008 to 2012 are shown in Figure 3.8 to Figure Wind roses show the frequency of wind from each direction sector (blowing towards the centre of the diagram), divided into coloured speed ranges. Generally, the wind roses show similar patterns, with a high frequency of winds from the south through west to the north-northeast. Strongest winds are from the west and north in both years, which is consistent with the long-term average wind data presented in Figure 3.5 and Figure 3.6. Figure 3.7: Monthly Average Wind Speed for Meteorological Years 2008 to 2012 Job ID AQU-VC Cleanaway Melbourne Regional Landfill AQA R10 Low Res.docx
31 Calm Winds: 0% Data Period: 2008 Average Wind Speed: 3.52 m/s Figure 3.8 Annual Wind Roses for Deer Park for 2008 Generated from AERMET Output Job ID AQU-VC Cleanaway Melbourne Regional Landfill AQA R10 Low Res.docx
32 Calm Winds: 0% Data Period: 2009 Average Wind Speed: 3.60 m/s Figure 3.9 Annual Wind Roses for Deer Park for 2009 Generated from AERMET Output Job ID AQU-VC Cleanaway Melbourne Regional Landfill AQA R10 Low Res.docx
33 Calm Winds: 1.1% Data Period: 2010 Average Wind Speed: 3.32 m/s Figure 3.10 Annual Wind Roses for Deer Park for 2010 Generated from AERMET Output Job ID AQU-VC Cleanaway Melbourne Regional Landfill AQA R10 Low Res.docx

34 Calm Winds: 1.3% Data Period: 2011 Average Wind Speed: 3.20 m/s Figure 3.11 Annual Wind Roses for Deer Park for 2011 Generated from AERMET Output Job ID AQU-VC Cleanaway Melbourne Regional Landfill AQA R10 Low Res.docx
35 Calm Winds: 0.7% Data Period: 2012 Average Wind Speed: 3.54 m/s Figure 3.12 Annual Wind Roses for Deer Park for 2012 Generated from AERMET Output Atmospheric Stability An important aspect of pollutant dispersion is the level of turbulence in the lowest 1 km or so of the atmosphere, known as the planetary boundary layer (PBL). Turbulence controls how effectively a plume is diffused into the surrounding air and hence diluted. It acts by increasing the spreading out of the plume both horizontally and vertically due to random motions. With stronger turbulence, the rate of plume diffusion increases. Weak turbulence limits diffusion, leaving the plume more compact and resulting in higher plume concentrations downwind of a source. Turbulence is generated by both thermal and mechanical effects to varying degrees. Thermally driven turbulence occurs when the surface is being heated, in turn transferring heat to the air above by convection. Mechanical turbulence is caused by the frictional effects of wind moving over the earth s surface, and depends on the roughness of the surface as well as the flow characteristics. Turbulence in the boundary layer is influenced by the vertical temperature gradient, which is one of several indicators of stability. Plume models use indicators of atmospheric stability in conjunction with other meteorological data to estimate the dispersion conditions in the atmosphere. Stability can be described across a spectrum ranging from highly unstable through neutral to highly stable. A highly unstable boundary layer is characterised by strong surface heating and relatively light winds, leading to intense convective turbulence and enhanced plume diffusion. At the other extreme, Job ID AQU-VC Cleanaway Melbourne Regional Landfill AQA R10 Low Res.docx
36 very stable conditions are often associated with strong temperature inversions and light winds, which commonly occur under clear skies at night and in the early morning. Under these conditions plumes can remain relatively undiluted for considerable distances downwind. Neutral conditions are linked to windy and/or cloudy weather, and short periods around sunset and sunrise, when surface rates of heating or cooling are very low. The stability of the atmosphere plays a large role in determining the dispersion of a plume and it is important to have it correctly represented in dispersion models. Current air quality dispersion models (such as AERMOD and CALPUFF) use the Monin-Obukhov Similarity Theory (MOST) to characterise turbulence and other processes in the PBL. One of the measures of the PBL is the Monin-Obukhov length (L), which approximates the height at which turbulence is generated equally by thermal and mechanical effects (Seinfeld and Pandis, 2006). It is a measure of the relative importance of mechanical and thermal forcing on atmospheric turbulence. Because values of L diverge to + and - infinity as stability approaches neutral from the stable and unstable sides, respectively, it is often more convenient to use the inverse of L (i.e., 1/L) when describing stability. Figure 3.13 to Figure 3.17 shows the hourly averaged 1/L for Deer Park computed from each year of data in the AERMET surface file. This plot indicates that the PBL is stable overnight and becomes unstable as radiation from the sun heats the surface layer of the atmosphere and drives convection. The changes from positive to negative occur at the shifts between day and night. This indicates that the diurnal patterns of stability are realistic. Figure 3.13: Annual statistics of 1/L by hour of the day for 2008 Generated from AERMET Output Job ID AQU-VC Cleanaway Melbourne Regional Landfill AQA R10 Low Res.docx
37 Figure 3.14: Annual statistics of 1/L by hour of the day for 2009 Generated from AERMET Output Figure 3.15: Annual statistics of 1/L by hour of the day for 2010 Generated from AERMET Output Job ID AQU-VC Cleanaway Melbourne Regional Landfill AQA R10 Low Res.docx
38 Figure 3.16: Annual statistics of 1/L by hour of the day for 2011 Generated from AERMET Output Figure 3.17: Annual statistics of 1/L by hour of the day for 2012 Generated from AERMET Output Job ID AQU-VC Cleanaway Melbourne Regional Landfill AQA R10 Low Res.docx
39 Figure 3.18Figure 3.18 to Figure 3.22 show the variations in stability over each year by hour of the day, with reference to the widely known Pasquill-Gifford classes of stability. The relationship between L and stability classes is based on values derived by Golder (1972) set out in NSW DEC (2005). Note that the reference to stability categories here is only for convenience in describing stability. The model uses calculated values of L across a continuum. These figures show that stable and very stable conditions occur for about 50% of the time, which is typical for inland locations that regularly experience temperature inversions at night. Atmospheric instability increases during the day and reaches a peak around noon as solar-driven convective energy peaks. A stable atmosphere is prevalent during the night. These profiles indicate that pollutant dispersion is most effective during the daytime and least effective at night. Figure 3.18: Annual Distribution of Stability Category by Hour of the Day at Deer Park, 2008 Generated from AERMET Output Job ID AQU-VC Cleanaway Melbourne Regional Landfill AQA R10 Low Res.docx
40 Figure 3.19: Annual Distribution of Stability Category by Hour of the Day at Deer Park, 2009 Generated from AERMET Output Figure 3.20: Annual Distribution of Stability Category by Hour of the Day at Deer Park, 2010 Generated from AERMET Output Job ID AQU-VC Cleanaway Melbourne Regional Landfill AQA R10 Low Res.docx

41 Figure 3.21: Annual Distribution of Stability Category by Hour of the Day at Deer Park, 2011 Generated from AERMET Output Figure 3.22: Annual Distribution of Stability Category by Hour of the Day at Deer Park, 2012 Generated from AERMET Output Job ID AQU-VC Cleanaway Melbourne Regional Landfill AQA R10 Low Res.docx
42 3.4.3 Mixing Height Mixing height is defined as a temperature inversion or statically stable layer of air capping the atmospheric boundary layer where an emitted or entrained tracer will be mixed by turbulence (Beyrich, 1997). It is often associated with, or measured by, a sharp increase of temperature with height (inversion), a sharp decrease of water-vapour, a sharp decrease in turbulence intensity and a sharp decrease in pollutant concentration. Mixing height is variable in space and time, and typically increases during fair-weather daytime over land from tens to hundreds of metres around sunrise up to 1 4 km in the mid-afternoon, depending on the location, season and day-to-day weather conditions. Two different types of temperature inversion frequently develop and may lead to air pollution episodes. These are: radiation or surface inversions that form overnight through rapid cooling of the ground and surface air layers subsidence inversions that form at various heights above the ground due to subsiding air associated with an anticyclone or high pressure ridge. Radiation inversions are usually short-lived and rarely persist beyond mid-morning. Subsidence inversions may persist for up to six days while the associated anticyclone is in the vicinity. Short periods of severe air pollution can occur with radiation inversions but sustained pollution events result from subsidence inversions. Mixing height profiles as output by AERMET for 2008 to 2012 are shown in Figure 3.23 to Figure A similar diurnal profile is evident for all years, with highest mixing heights during late afternoon in response to convective mixing. By contrast, lower mixing heights are found during the nocturnal hours when mechanical mixing height development occurs in the stable boundary layer. It is important to note that it is unlikely that mixing height will play a significant role in the dispersion of emissions from the Ravenhall Site owing to the low level, non-buoyant nature of those emissions. Job ID AQU-VC Cleanaway Melbourne Regional Landfill AQA R10 Low Res.docx
43 Figure 3.23: Statistics of AERMET generated Mixing Height for 2008 Generated from AERMET Output Figure 3.24: Statistics of AERMET generated Mixing Height for 2009 Generated from AERMET Output Job ID AQU-VC Cleanaway Melbourne Regional Landfill AQA R10 Low Res.docx
44 Figure 3.25: Statistics of AERMET generated Mixing Height for 2010 Generated from AERMET Output Figure 3.26: Statistics of AERMET generated Mixing Height for 2011 Generated from AERMET Output Job ID AQU-VC Cleanaway Melbourne Regional Landfill AQA R10 Low Res.docx

45 Figure 3.27: Statistics of AERMET generated Mixing Height for 2012 Generated from AERMET Output 3.5 Measured Air Quality The local air quality is characterised by continuous PM10 b, ozone and nitrogen dioxide measurements undertaken at the EPA monitoring station at Deer Park approximately 5 km to the northeast of Ravenhall Site (Figure 3.28). Of the contaminants measured at the EPA station, only PM10 is likely to be emitted in significant quantities from Ravenhall Site. b Particulate matter with an aerodynamic diameter less than 10 µm. These particles can remain suspended in the air for long periods and do not settle out significantly over distances involved in this assessment. Job ID AQU-VC Cleanaway Melbourne Regional Landfill AQA R10 Low Res.docx
 The 24-hour average PM10 concentrations recorded from January 2008 to December 2009 are presented in 29.")
46 Figure 3.28: EPA Monitoring Station at Deer Park (5 km NE of the Current Landfill Operations) The 24-hour average PM10 concentrations recorded from January 2008 to December 2009 are presented in Figure The data from this period were reviewed to be consistent with the meteorological data modelled. PM10 levels generally display an annual cycle with higher levels occurring mostly during the summer, when conditions are generally drier than in winter. Seventeen exceedances of the NEPM (Ambient Air) standard occurred during the period. All but one of these exceedances (viz. on 11 November 2009) was identified in the EPA Air Monitoring Reports as due to regional causes (i.e. fire or dust). A bubble plot of hourly wind direction, wind speed and corresponding relative PM10 concentration is shown in Figure Highest PM10 concentration generally occurs with strong northerly to northwesterly winds, which are the directions most likely to be associated with dust and bushfire events. Elevated hourly PM10 concentration is also seen with a period of strong southwesterly wind. This has also been identified as a regional event affecting multiple monitoring sites and hence does not represent a localised effect from Ravenhall Site. A PM10 pollution rose based on hourly data, with regional event days excluded, is shown in Figure A number of local sources appear to affect the local air quality, with somewhat elevated hourly concentration (> 90 μg/m 3 ) occurring with southerly winds. Hourly concentrations greater than 60 μg/m 3 also occur with northerly and northeasterly winds as well as with southwesterly to northwesterly winds. Job ID AQU-VC Cleanaway Melbourne Regional Landfill AQA R10 Low Res.docx
, Deer Park Job ID 20496 AQU-VC-013-20496 34 20496 Cleanaway")
47 Figure 3.29: Running 24-hour PM10 Concentration at Deer Park Monitoring Station ( ). Red Line Indicates NEPM Standard Figure 3.30: Plot of Hourly Wind Direction and Wind Speed with Corresponding Relative PM10 Concentration (size of bubble), Deer Park Job ID AQU-VC Cleanaway Melbourne Regional Landfill AQA R10 Low Res.docx


48 Figure 3.31: Deer Park PM10 Pollution Rose ( ) - Regional Events Excluded 3.6 Field Observations and Measurements Odour and particulate matter monitoring occurred to understand the actual ambient conditions and emissions occurring from the landfill operations. These measurements help inform the assessment and validate the emissions and current conditions considered. The observations and measurements are detailed below Odour Field conditions were observed on June 2014, 9-10 October 2014 and 30 November-1 December 2015 as part of the odour and dust investigation for this assessment. Air samples were taken and analysed for odour and trace gas composition and sensory odour evaluation was conducted in locations outside Ravenhall Site. The odour monitoring campaign conducted on 30 November and 1 December 2015 focused on determining the site- specific emission rates at the landfill and assessing downwind odour. The monitoring campaign included source sampling, including odour transects and flux hood sampling, and odour intensity observations downwind of the landfilling operations. The field sampling and results are provided in Appendix C. The field activities during all periods included a number of structured odour intensity observations, which are explained below. There were also less formally structured observations to determine whether or not odour was present and, if so, the character and likely source of the odour based on odour character and wind conditions. The purpose of these investigations was to identify and better understand the significant sources of odour at the Ravenhall Site to inform the odour modelling and assessment. The most significant known odour sources at the Ravenhall Site include the presence of fresh waste at the active cell, LFG and leachate odours - as well as the adjacent Boral asphalt plant to the north of Job ID AQU-VC Cleanaway Melbourne Regional Landfill AQA R10 Low Res.docx
49 the current active cell. Until October 2015, the Pinegro green waste facility also operated to the northwest. The latter two facilities are or were accessed from Riding Boundary Road. The field observations of odour relied on the use of odour intensity. Appendix A provides further details on odour intensity and other related terms. To standardise the odour logging and analysis approach as far as possible, two main steps were taken: Adoption of a standard scale for describing odour intensity, as detailed in German Standard VDI 3882 (I) which relates to odour measurement Use of the relationship between odour intensity and odour concentration to provide an estimate of field odour concentrations. A discussion of how odour intensity can be used in field assessment is contained in two papers (Ormerod et al, 2002; Pitt, 2014) that are included as Appendix B. In summary, the German Standard VDI sets out a scale from 0 to 6 that gives a descriptive guide to odour intensity. Table 3.2 sets out the scale (column 2), the standard descriptors (column 1) and the interpretive guide used in field assessment. Perceived Odour Strength Table 3.2: Guide to Using VDI Odour Intensity Scale (Pitt, 2014) Intensity Level Rating Interpretation Extremely strong 6 In normal circumstances, this should be very rare in a field situation. For an offensive type of odour, the reaction would be to mitigate against further exposure. This remains the dominant thought and motivation until the exposure level is reduced. The odour cannot be tolerated. Very strong 5 The odour character is clearly recognisable. For an offensive type of odour, exposure to this level is considered unpleasant/undesirable to the point that action to mitigate against further exposure is considered or taken. Strong 4 The odour character is clearly recognisable. For an offensive type of odour, exposure to this level would be considered unpleasant/undesirable. Distinct 3 The odour character is clearly recognisable. Note that this must still apply even if in a different context or situation - for example, not knowing or expecting what type of odour may be present. The odour is tolerable even for an offensive odour. Weak 2 The assessor is reasonably sure that odour is present but not 100% sure of the odour character. For example, at the weak level, suspended gravel dust is similar to a wet cement odour. Very weak 1 The odour character is not recognisable. There is probably some doubt whether the odour is actually present. A useful strategy where the odour is borderline between not perceptible and very weak is to alternate such observations between 0 and 1. Not perceptible 0 No odour. A normal feature of odour intensity in the field is that it varies over time, often within the time taken for a breathing cycle of an observer. Therefore, in order to gain a more representative estimate of the odour strength it is important to log the variations in intensity using a standardised approach. Typically, the approach is to sniff and record odour intensity every 10 seconds for 10 minutes. Over this time, it is possible to capture a fair sample of the fluctuations in odour strength. In order to translate this data into an average concentration estimate, however, it is necessary to compare odour intensity with odour concentration (Ormerod et al., 2002). The issue is detailed in Appendix B. Based on the field investigations and analysis of the data, detailed in Appendix C, estimates of odour plume concentration were derived from field odour intensity observations. When Pinegro composting Job ID AQU-VC Cleanaway Melbourne Regional Landfill AQA R10 Low Res.docx
50 facility was in operation two separate odour plumes were identified: one from Ravenhall Site and another from Pinegro. A schematic of field data from June 2014 is shown in Figure The odour concentration estimates are by necessity approximate but it was evident from observations and model-based analysis that the detectable (intermittently) odour plume from the active landfill extended up to about 2 km downwind from the active cell, and the detectable plume from Pinegro extended about 4 km downwind from its source at the time of the observations. Figure 3.32: Observations of Odour Plumes from the landfill and Pinegro, 11 June 2014 Green plume shows the odour from Pinegro. Orange plume shows the odour from the landfill. Pinegro and the MRL odours areas are shown in the lightly red shaded squares. The evidence from the field observations indicates that under the conditions observed at the time, the Pinegro odour plume was detectable considerably further outside the Ravenhall Site boundary than the landfill plume under most wind conditions. Additional observations in October 2014 and late 2015 were broadly consistent with these observations except that the Pinegro plume, although detectable at similar distances downwind, was less offensive in October 2014 than in June 2014, and absent (due to facility closure) in late Notes relating to the observation of odours around Ravenhall Site on all occasions are included in Appendix C Particulate Matter Field conditions were observed on 10 and 11 June 2014 and again on 9 and 10 October 2014 as part of the odour and dust investigation for this assessment. During these observations a temporary PM10 monitoring network was installed at 3 sites on the Ravenhall Site perimeter. Dust monitors (DustTraks) were placed in the field at three locations for a limited period to gain an appreciation of PM10 concentrations near the activities. The locations are shown in Figure The monitor named Dust1 was located on the old completed cell 1, about 100 m south of Boundary Riding Job ID AQU-VC Cleanaway Melbourne Regional Landfill AQA R10 Low Res.docx


51 Road. Dust2 was located about 10 m south of a completed cell and Dust3 was 100 m south of the active cell 2L. Data from these sites are presented in Figure 3.34, Figure 3.35 and Figure Figure 3.33: Locations of Short-Term Dust Monitors Figure 3.34: Hourly Average PM10 for Dust1 and Meteorological Data Job ID AQU-VC Cleanaway Melbourne Regional Landfill AQA R10 Low Res.docx


52 Figure 3.35: Hourly Average PM10 for Dust2 and Meteorological Data Figure 3.36: Hourly Average PM10 for Dust3 and Meteorological Data The available data show that hourly average concentrations of PM10 at all sites were below the management trigger level of 80 µg/m 3 for 1-hour average concentration contained in the BPEM Job ID AQU-VC Cleanaway Melbourne Regional Landfill AQA R10 Low Res.docx

. The monitoring consists of two Osiris monitors (Figure 3.37) to measure real-time dust concentration.")
53 Landfills. Although of only a limited duration, the data show that for Dust3, closest to downwind of active cell 2L and downwind under northerly flow, concentrations reached only about 50 µg/m 3. Somewhat higher concentrations were measured at Dust2 early in the period, when it was downwind of nearby soil screening activities. This indicates that the landfill operations are not a significant source of dust emissions. Additional dust monitoring was conducted by Boral Deer Park quarry during November and December 2015 (pers. comm. via 10 December 2015). The monitoring consists of two Osiris monitors (Figure 3.37) to measure real-time dust concentration. The results from these monitors again indicates that the ambient concentrations are well within the BPEM guideline of 60 µg/m³ (Figure 3.38). The real time monitoring (Figure 3.39) indicates that the peak hourly concentration occur in the evening periods (i.e to 2200). Again, this indicates that the landfill operations are not a significant source of dust emissions. Figure 3.37: Boral Deer Park Quarry Orsis Real-time Dust Monitor Figure 3.38: Boral Deer Park Quarry 24-hour Average PM10 Concentrations (µg/m³) Job ID AQU-VC Cleanaway Melbourne Regional Landfill AQA R10 Low Res.docx

54 Figure 3.39: Boral Deer Park Quarry 1-hour Average PM10 Concentrations (µg/m³) 3.7 Community Impacts and Complaints Data Source and Setting A complaints database was provided by EPA Victoria, with information identifying residences or complainants removed. The database contains data from July 2013 to 26 November 2015 (inclusive), with a total of 1,889 records. Each record holds information relating to the general location and time of the complaint, the alleged odour source, a description of the odour, and other details of the complaint where available. EPA included wind direction data for the time of the complaint (where possible), taken from the EPA s Deer Park monitoring station. Records from May to September 2014 did not have wind data so for that period wind data from the Ravenhall Site weather station was used instead. A total of 256 complaints had no associated wind data or specific time of complaints available. As a result, only 1,633 complaints were analysed. It is important to note that these complaints have not been validated by the EPA and are only considered alleged until validated. Complaints were received from the surrounding suburbs of Caroline Springs, Burnside, Burnside Heights, Deer Park, Derrimut, Ravenhall and Truganina. Only one complaint was received from Burnside Heights, so the analysis of the data presented below has combined Burnside Heights with Burnside. Figure 3.40 shows the locations of the suburbs and the three main odour sources associated with Landfill Ops activities in the area the MRL, the Boral asphalt plant and the Pinegro green waste composting facility. The populations of the surrounding suburbs were estimated by taking Australian Bureau of Statistics (ABS) data for the 2011 Census and ABS data on estimated annual population change between 2012 and 2013 by Statistical Area, from the ABS website. The results are shown in Table 3.3. Table 3.3: Suburb Population Estimates Suburb 2011 Census Population a Growth b (%) 2014 Estimate Burnside 9, ,648 Caroline Springs 20, ,108 Deer Park 16, ,286 Derrimut 5, ,838 Ravenhall ,040 Truganina 9, ,497 a b Australian Bureau of Statistics website ABS data for SA2 areas. Job ID AQU-VC Cleanaway Melbourne Regional Landfill AQA R10 Low Res.docx
 and Boral Asphalt Plant Shaded Pink) with")
55 Figure 3.40: Location of Surrounding Suburbs and Primary Odour sources (Current Landfill, Pinegro (now closed) and Boral Asphalt Plant Shaded Pink) with Remainder of Landfill Ops Property Shaded Grey Job ID AQU-VC Cleanaway Melbourne Regional Landfill AQA R10 Low Res.docx
56 3.7.1 Locations of Complaints In the data supplied by EPA, some errors were noted and some of those were corrected where possible. Twenty eight (28) records were designated to Ravenhall. Checking of street addresses revealed that most of these were in other suburbs: of the original 28 Ravenhall records, 21 were assigned to their correct suburbs based on street name, most of them in Caroline Springs. Of the remaining 7 records, two referred to a street without number and one of them runs through Burnside. The other five made no reference to a street or a time of complaint. Hence, on this basis, only a single complaint originally designated to Ravenhall was further analysed. One of the complaints reassigned from Ravenhall was to an address in Cairnlea, but this complaint record referred to odour detected at Caroline Springs on a previous occasion and not at the time of the record, so it is also excluded from detailed analysis, although it is included in the grand total of 1,889 complaints noted above. Of 11 complaints assigned to Truganina, 3 were found to be in Deer Park and Caroline Springs and no wind direction record was available for one of them, leaving 3 with no address and 4 from Truganina at a distance of 4 km to the south of Ravenhall Site. Given that two of these quite distant complaints coincided with wind directions from the south and west, i.e., not from Ravenhall Site, they are not considered further. The other two complaints were associated with wind directions from the north and north-west, which could indicate that odour from the Landfill Ops land was detected but the data does not permit a specific source to be identified. While some complaints records contain reference to a street number, there are 620 that refer only to the suburb without a street reference. Of these, 367 are reported as being in Caroline Springs. Limited random checks of other suburb street details indicated that most were correct. Analysis of the (partially) corrected EPA data shows that the complaints lodged in the 29 month period were distributed by suburb as listed in shown in Figure The majority were from Caroline Springs: 77% or a total of 1384 complaints, with 255 (12%) from Deer Park and 199 (9%) from Derrimut. Job ID AQU-VC Cleanaway Melbourne Regional Landfill AQA R10 Low Res.docx


57 Figure 3.41: Distribution of Odour Complaints by Suburb The surrounding suburbs have different populations, so to understand the density or rate of complaints taking population into account, the data were presented on a different basis in Figure This graph shows the number of complaints received per 100 residents from each suburb. It is evident from Figure 3.42 that residents in Caroline Springs were much more likely to complain about odour than residents in other suburbs, while the least likely to complain were in Burnside and Deer Park. Figure 3.42: Complaints per 100 Residents by Suburb Complaints Over Time The number of complaints by month shows that from July 2013 to January 2014 there was a relatively small number - between 4 and 18 per month compared to February 2014 to June 2014, and continuing at an intermediate level until April Complaints peaked during March 2014 at 468. Job ID AQU-VC Cleanaway Melbourne Regional Landfill AQA R10 Low Res.docx
58 The data show that a significant increase in complaints began in the last week of February. A window of daily complaints data for February and March illustrates this change in Figure A daily total of 64 complaints were received on 21 March, from Caroline Springs (62) and Burnside (2). It may be relevant to note that on 18 February 2014, Boral released a statement announcing that it had lodged an application for a Planning Permit from Melton City Council to extend the area for landfilling to be consistent with the approved quarry footprint. Figure 3.43: Numbers of Complaints by Month, July 2013 November 2015 Job ID AQU-VC Cleanaway Melbourne Regional Landfill AQA R10 Low Res.docx
59 Figure 3.44: Daily Complaints, February-March 2014 On a monthly basis, the standardised rate of complaint (i.e., on an adjusted per population basis) by month was calculated for each suburb and the results are presented in Figure Figure 3.45: Standardised Rate of Complaint by Suburb and Month and Year Job ID AQU-VC Cleanaway Melbourne Regional Landfill AQA R10 Low Res.docx
60 Figure 3.45 shows a significant increase in the rate of complaint per head of population in all suburbs from March, or February 2015 in the case of Caroline Springs. The effect appears more pronounced in Caroline Springs. Before February, there is relatively little difference between the suburbs, with the exception of Burnside which is further from any of the odour sources referred to in this assessment. This trend subsides after May The occurrence of complaints by time of day is shown in Figure The data are divided into three periods: July 2013 to January 2014 inclusive, when there were relatively few complaints February and March 2014, when complaints increased to a peak April to September 2014, with elevated complaints but shorter days and cooler weather than February and March. October 2014 to November 2015, when complaints have subsided. Figure 3.46: Complaints Reported by Time of Day, July November 2015 The small numbers of complaints before February mostly were noted during the morning and evening to late evening, with low occurrences during the middle of the day and overnight. The morning and evening occurrences were of a similar magnitude. This pattern is quite typical, reflecting a reduced probability of exposure to odours in the very early hours of the morning, when most people are asleep, and in the middle of the day when odours are typically well dispersed by favourable atmospheric conditions. On the other hand, the morning and evening meal times are typically peak times for complaints because people tend to be at home, they may be outdoors, and at these times atmospheric conditions often lead to less effective plume dispersion. The increase in complaints during February and March shows a clear reflection of this basic pattern, especially between 8-10 am and 8-10 pm. By April to September, the pattern showed a shift in the evening peak to between 5 and 8 pm, and a somewhat higher occurrence of complaints during the day. There was a marked peak in complaint numbers during February to June, and since then the rate of complaint has returned to a lower level that is intermediate between the peak period and the period before February. Job ID AQU-VC Cleanaway Melbourne Regional Landfill AQA R10 Low Res.docx
61 It is noteworthy that Landfill Ops does not operate the active face (i.e. there are no waste receivals) between 5pm and midnight ( ). Under current circumstances, the primary odour source from Ravenhall Site tends to be the active face where and when waste is being placed. This activity does not occur at the times of peak complaint numbers in the evening and the active face is covered with 0.3 m of temporary soil cover during non-operational periods Attribution of Complaints If an odour source or potential source is identified by a person complaining to EPA, it is registered in the complaints database as an alleged source. It is clear from Table 3.4 below that in the majority of cases, the alleged source of the complaints provided by EPA is landfilling operations (Landfill Operations Pty Ltd [Ravenhall], previously known as Boral Recycling Pty Limited [Ravenhall]), accounting for 72% of total complaints between July 2013 and November The other major category is unknown. Between July 2013 and January 2014 when complaint levels overall were relatively low, the landfill was the alleged source in 30% of all complaints (including those unknown ), and after the increase of complaints in February it accounted for 65%. This suggests a higher level of awareness of the landfill after early Notably, the Pinegro operation was identified only once in this dataset. Our field observations in June and October 2014 identified its odour at greater distances outside the site boundaries than odour from the landfill s routine operations. There is more discussion on this point in Section 3.6. Table 3.4: Number of Complaints Alleging Specific Sources of Odour Alleged Source Number Percent Landfill Operations Pty Ltd [Ravenhall] a, b 1,344 72% Unknown Alleged Source/Small % Not assigned % Boral Deer Park CLC 5 0.3% Orica Australia Pty Ltd [Deer Park] 2 0.1% Huntsman Ici Polyurethanes (Aust) Pty 2 0.1% Ristovski Group P/L (Soilworx) % Boral Recycling Pty Limited [Deer Park] % Spot On Panels Pty Ltd % Clayton Road Landfill Joint Venture % Boral Resources (Vic.) Pty. Limited % Pinegro Products Pty Ltd [Truganina] % Total 1, % a. Two complaints, one each assigned to Boral Deer Park CLC and Boral Recycling Pty Limited (Deer Park) in the EPA data, were reassigned Landfill Operations Pty Ltd [Ravenhall]. Large/Landfills/Factories was attributed to the MRL for assessment purposes. b. Previously known as Boral Recycling Pty Limited [Ravenhall]. Pacific Environment analysed the complaints to examine the relationship between wind direction and the occurrence of complaints. For this analysis we did not filter the data: all of the 1409 complaints for which it is possible to assign a wind direction are included. Wind data from the Deer Park monitoring station were provided by EPA up to the end of May 2014 and for the period since then the data were from the Boral on-site weather station. Some errors may be present in the data and there may not be a perfect match between the time of the odour complaint and the recorded wind direction in some cases. However, the broad pattern that emerges from the analysis is important. Job ID AQU-VC Cleanaway Melbourne Regional Landfill AQA R10 Low Res.docx
62 The results of the analysis are shown in Figure 3.47 and Figure 3.48, which provide a visual guide to the likely sources of complaints over the periods July 2013-September 2014 and October 2014-November 2015, respectively. They show complaint roses by suburb. For each of the suburb plots, the arms radiating out from the centre of the plot are in 22.5 degree sectors, i.e., 16 point compass directions. The length of each sector represents how many complaints were lodged when the wind was blowing from that direction. The area covered by each plot represents the number of complaints from that suburb. Note that for the 15 month period (July 2013 September 2014) in Figure 3.47 a total of 1409 complaints are included in the analysis, while for the 14-month period October 2014 November 2015 in Figure 3.48 there are 460 complaints represented in the analysis. The relative sizes of the plots are only relevant within each figure and not between the figures. A relevant factor in the analysis of the complaints is an EPA Pollution Abatement Notice (PAN) served on Pinegro on 5 May 2014 requiring the operation to meet two general requirements by 9 July 2014: modify the composting process at the premises to maintain aerobic decomposition so that no odour offensive to senses of human beings impact residents in the Caroline Springs/Deer Park area modify the infrastructure, technology and management practices at the premises to reduce odour emissions so that no odour offensive to senses of human beings is detected in the Caroline Springs/Deer Park area. The PAN made a number of observations that included: EPA officers detected strong odour with compost characteristics beyond the boundary of the premises both adjacent to and in residential areas. EPA officers detected strong odour with compost characteristics offsite and traced the odour back to the premises. The composting methods used at the premises were a likely cause of offensive odours being detected in the residential areas of Caroline Springs/Deer Park The frequency of complaints was significantly reduced by July 2014, consistent with the timeframe set in the PAN to address the offensive odours. However, the Pinegro operation eventually ceased operation later in Figure 3.48 is an indicator of odour source influences during the time after action was taken on the Pinegro site, while Figure 3.47 shows the situation for an earlier period that includes the peak of complaints received by EPA. Job ID AQU-VC Cleanaway Melbourne Regional Landfill AQA R10 Low Res.docx
.")
63 Figure 3.47: Complaint roses showing the frequency of occurrence of wind directions associated with complaints, by suburb between July 2013 and September The area enclosed by each rose is proportional to the number of complaints from that suburb (total 1409). Job ID AQU-VC Cleanaway Melbourne Regional Landfill AQA R10 Low Res.docx
.")
64 Figure 3.48: Complaint roses showing the frequency of occurrence of wind directions associated with complaints, by suburb between October 2014 and November The area enclosed by each rose is proportional to the number of complaints from that suburb (total 460, average 32 per month). Job ID AQU-VC Cleanaway Melbourne Regional Landfill AQA R10 Low Res.docx
65 In Figure 3.47, the Caroline Springs complaint rose shows that the most frequent wind direction associated with complaints in that suburb between July 2013 and September 2014 was southwesterly. This is in the general direction of the Ravenhall Site, but a trajectory on this heading points much more directly to the site of the former Pinegro operation than the landfill site. A similar conclusion can be reached by looking at the other main suburb plots: the Deer Park data shows west-southwest as the main direction and for Derrimut it is west-northwest. In both cases, these are not in the direction of landfilling operations at the time but are better aligned with the Pinegro facility or asphalt plant. The weight of evidence is strongly influenced by the large number of data points for Caroline Springs, which unambiguously shows Pinegro as the most likely source. Of note is the high frequency of complaints from Caroline Springs when the wind was from the southwest. This pattern does not seem to be a reflection simply of a prevailing wind direction and a chance correlation. Despite the very strong signal of complaints with southwest wind, the statistics (Section 3.4.1) show that wind from the southwest is not particularly common compared to westsouthwest and southerly. Therefore, the signal in the complaints data shown in Figure 3.47 does not appear to be a random outcome simply reflecting a prevailing wind pattern. It can be inferred from this analysis of the complaint information shown in Figure 3.47 that for the period relevant to the graphic, the landfill site was not the most likely source of odours leading to the complaints and that the key source was Pinegro. The more recent data reflects a significant reduction in odour complaints (Figure 3.43) with less focus on Pinegro (Figure 3.48). It is noteworthy that complaints from Derrimut appear to be associated with broadly northerly winds, not suggestive of sources around the Ravenall Site, but instead elsewhere. Pacific Environment s observations in October 2014 were that the Pinegro odour plume was still detectable at similar distances from the source as it was in June 2014, but that the character of the odour was not as offensive as before (a subjective evaluation, however) Discussion of Nuisance and Complaints The main adverse effect of environmental odours is nuisance. People generally become annoyed by an odour that they regard as unpleasant and from which they cannot readily escape. Repeated exposure to annoying levels of odour leads to nuisance. Long-term exposure to highly annoying odours may cause some physical symptoms that are related to stress, and the receiver may become particularly sensitive to the presence of the odour. Complaints generally arise when the odour causes a high level of nuisance. However, nuisance is not necessarily sufficient to lead to complaint, yet in some cases the odour problem may be so chronic or entangled with other issues that complaints can arise even when the odour is not particularly strong. Complaints are often associated with a strong emotional response, and a variety of factors can lead to a situation where complaints do not accurately reflect the severity of an odour problem. Because of the many influences on complaints apart from the odour itself, it is unwise to rely solely on complaints as an accurate indicator of the extent and severity of an odour nuisance problem. There are no standard, widely used protocols for using complaints to evaluate odour impact. Systems for receiving, recording and acting upon complaints differ and, importantly, the significance of complaints as indicators of impact can vary widely according to the specific situation. A report on odour assessment published by the Irish EPA states the following about using complaints as indicators of impact: Complaints registration provides an insight into the prevalence of a symptom of odour nuisance, but not of the prevalence of the nuisance itself. There are many factors at play that determine the ease or difficulty of registering a complaint. Therefore, complaint data must be treated with some caution. Registered complaints are a very strong indication that odour nuisance is a reality in a specific situation. Job ID AQU-VC Cleanaway Melbourne Regional Landfill AQA R10 Low Res.docx
66 However, the absence of registered complaints does not necessarily indicate the absence of nuisance. Also, once a conflict situation develops over odour emissions, the registering of complaints can become a tool in the fight, when residents use orchestrated complaints as a political lever to move the argument in their favour (OdourNet UK Ltd, 2001). In relation to the complaints from suburbs around the Ravenhall Site, there is clearly a high level of awareness among residents that there is a landfill operating at Ravenhall Site. When other sources are also present in an area, it is often the case that a prominent and well-known activity or company is the most commonly nominated as the cause for complaint. Ravenhall Site is a source of odour, like all similar landfills, and it has been the source of attention by EPA in the recent past, and in response has taken a number of action to mitigate odour emissions. A summary of actions taken in 2014 is presented in Table 3.5. LFG odour was detected in Derrimut by EPA in April 2014, and resulted from leakage in the LFG collection system. Pollution Abatement Notices were served in April and May The previous operator repaired and restored the relevant LFG wells and collection system components, and on 30 June 2014 EPA notified Boral Recycling that the issues had been resolved. Table 3.5: Summary of EPA Notices and Actions by Boral in 2014 Notice Type & Number Date Issued Summary Minor Works Pollution Abatement Notice April 2014 LFG odour confirmed by EPA officer at multiple locations in residential area of Derrimut on 30 March, linked to methane and odour detected on Boral site at Cells 1A, 2K and potentially 2H, 2I and 2J. Notice required remedial actions to prevent odorous LFG beyond the boundary by 12 May Notice of Revocation 19 May 2014 EPA revoked Minor Works PAN and issued a Pollution Abatement Notice to remedy the fugitive emissions of landfill gas identified in the inspection on Pollution Abatement Notice May 2014 Compliance inspection on 12 May revealed that during the remediation 46 wells had been found to have methane over 1000 ppm at the surface. Of these 34 had been remedied by resealing the annulus with bentonite, and 3 by re-balancing the gas field. However, there remained blockage or damage to 19 wells. LFG odour was detected from a number of wells during the compliance inspection. Notice required action by 19 June to rectify the remaining wells. Notice of Revocation 30 June 2014 Inspection on 20 June 2014 confirmed that compliance with all PAN requirements had been achieved. It is important that all of the available information relating to odour is placed into a perspective that considers other potential sources in the area as well. This is a common issue in complaints assessment where there are multiple potential odour sources. In these situations, often the results of detailed analysis can be at odds with widely held perceptions in communities. For example, analysis of complaints presented in the form shown in Figure 3.47 and Figure 3.48 strongly suggests that the landfill was not the primary source of odour leading to the high rate of complaints, despite the fact that odour complaints are commonly attributed to Boral Recycling (Table 3.4). Further to this point, and relevant to the PAN served on Pinegro in May 2014 (refer to Section 3.7.3), EPA inspected the Ravenhall Site and surrounds on 11 February 2014, as documented in its Inspection Report Some relevant statements in the report are as follows: Job ID AQU-VC Cleanaway Melbourne Regional Landfill AQA R10 Low Res.docx
67 With wind from the south, no odours were detected at Palm Springs Road north of the Boral land (approximately 3 km north of the current landfill) Odour observations were also made along Riding Boundary Road adjacent to the Pinegro composting facility and the site Strong odours were noted along the northern boundary of the Pinegro facility, when the observations were made directly downwind of Pinegro Varying odours from Pinegro were described as having old compost, fresh composting, organic and mulch characteristics Weak mulch odours were observed inside the northern boundary of the landfill, originating from shredding of green waste The EPA report stated that No offensive odours attributable to the site s operations were detected throughout the survey and The odours from Pinegro were very strong and this site has potential to discharge odours as far as Caroline Springs. The EPA Inspection Report further noted that The public perceives everything within the Boral site as Boral, there is little awareness that other entities operate on the same site. The EPA Inspection Report assessment provides support to the conclusions about odour sources reached earlier in this section of the report, i.e., that the landfill itself is not a major cause of complaints, particularly when LFG emissions are well controlled. Apart from the specific issue associated with the LFG emissions from the wells and capture system, and subsequently rectified by June 2014, there is little evidence to suggest that the Ravenhall Site s emissions should generate large numbers of complaints from the suburbs of Caroline Springs, Burnside, Deer Park and Derrimut. Despite the large number of complaints received between February and June 2014 that nominated Boral Recycling, and despite the LFG odour issue that was subject of EPA attention, the analysis of complaints summarised in Figure 3.47 strongly implicates Pinegro as the main source of odour nuisance in the surrounding areas at that time. EPA data shows that in the past year the level of complaint nominally associated with the landfill, which is now operated by Landfill Ops, has gradually returned to a low base level similar to that before the upsurge in complaints that occurred in early Job ID AQU-VC Cleanaway Melbourne Regional Landfill AQA R10 Low Res.docx
68 4 ASSESSMENT GUIDELINES AND POLICIES 4.1 Assessment Framework The air quality assessment was prepared in accordance with the following regulations and guidelines: Environment Protection Act, 1970 Environmental Protection (Scheduled Premises and Exemptions) Regulations, 2007 Waste Management Policy (Siting, Design & Management of Landfills) (Landfill WMP), 2004 State Environmental Protection Policy (SEPP) Air Quality Management (AQM) SEPP Ambient Air Quality (AAQ) Best Practice Environmental Management (BPEM) Siting, Design, Operation and Rehabilitation of Landfills. EPA Publication 788.3, August 2015 (the BPEM ) 4.2 BPEM The BPEM is a document that aims to provide guidance on the siting, design, operation and rehabilitation of new and existing landfills in Victoria. Landfill operators must meet the objectives and required outcomes contained in the BPEM by implementing the relevant best-practice measures that are described in the document. All landfill operations must comply with the EP Act, its Regulations, the Landfill Waste Management Policy (WMP) and relevant SEPPs. Specific reference to air quality in the BEPM is at Section 6.7. The objectives for air quality management at a landfill are: no health, safety or environmental impacts due to landfill gas and dust minimise greenhouse gas emissions prevent offsite nuisance odours and dust meet requirements of relevant SEPP and waste management policies Landfill Gas The requirements for LFG management are outlined in Section of the BPEM, and include the preparation of a landfill gas risk assessment. The BPEM requires compliance with clause 15 (3) and (4) of the Landfill WMP. The relevant objective is to ensure that no safety or environmental impacts are caused by landfill gas. To support the Works Approval application, the LFG risk assessment has been prepared by Golder Associates Odour and Dust For this assessment, the BPEM requirements for odour and dust are also relevant. Odour is addressed in Section of the BPEM as described in more detail below. Landfill odour is a key consideration in landfill siting. Landfill odours have two main sources; odour from the aerobic decomposition of freshly deposited wastes and odour from landfill gas generated by the anaerobic decomposition of wastes. Leachate ponds can also be a source of offensive odours. Good operation and adequate buffers are essential in odour management. These buffers are set to account for upset conditions and are not a substitute for best-practice management at the landfill or for normal operating conditions. At all times, a landfill must be managed to prevent offensive odours beyond the boundary of the premises. For existing landfills this will be assessed by community complaints that are verified by EPA Job ID AQU-VC Cleanaway Melbourne Regional Landfill AQA R10 Low Res.docx
69 officers. In particular, where surrounding land uses include residential, educational, health care or other sensitive uses, the highest degree of care must be taken to protect these areas from landfill odours. The provision of buffers in accordance with requirements outlined in Section of the BPEM will minimise impacts of odour on surrounding areas. While the major constituents of landfill gas, methane and carbon dioxide, are odourless, other minor constituents of landfill gases including organosulfur compounds can be very odorous. The key means of managing landfill gas odour is to manage the landfill gas in general by oxidising it through some of the measures discussed in Section Odour from aerobic waste deposition is managed by minimising the exposure of these wastes to the atmosphere. In accordance with Section of the BPEM, any large area where the land has been disturbed and is subject to vehicular traffic has the capacity to generate dust. Other potential dust sources are stockpiles of earth and the delivery of dusty loads of waste. The magnitude of the impact will depend on the: type and size of the operation prevailing wind speed and direction adjacent land use occurrence of natural and/or constructed wind breaks wind-abatement measures or buffers. Dust can impact on both health and amenity, depending on the size of the particles. Reactive management strategies should put in place including real-time monitoring of PM10. The monitoring may be required at the boundary of the premises both upwind and downwind of the active landfill area to assess any impact and guide mitigation actions. An hourly trigger level of 80 μg/m 3 should be used to assess the real-time data. If exceeded additional dust management practices, such as increased water sprays and dust suppressants should be applied. Dust suppression measures to be applied at the Ravenhall Site include: vegetating or mulching of exposed areas and formation of internal roads, including sealing roads that are used regularly use of water or other dust suppressants on roads or stockpiles that are not sealed or vegetated where leachate is to be used for dust suppression it may only be applied to areas that are within the active landfill cell to ensure the leachate does not contaminate stormwater run-off. 4.3 Odour Guidelines Introduction Key elements of quantitative odour criteria that are used for planning purposes are: concentration averaging time percentile value (frequency of occurrence) Job ID AQU-VC Cleanaway Melbourne Regional Landfill AQA R10 Low Res.docx
70 Concentration is the odour strength as determined by dynamic olfactometry (referred to in more detail below). Averaging time for most odour criteria are either 1 hour, 3 minutes or nose response time (about 1-2 seconds). In Victoria it is 3 minutes. Dispersion models that are used for predicting or simulating odour concentrations normally utilise a basic time interval of one hour for individual calculations. To obtain results for smaller averaging times, the 1-hour result is converted using a statistical relationship between concentration and averaging time. The percentile value refers to the percentage of time (usually over a full year) during which the actual odour concentration is no greater than the stated concentration. The shorthand notation incorporating these parameters is written in the form Cp,t where C is the concentration and the subscripts p and t refer to the percentile value and the averaging time, respectively. For example, C min refers to the 99.9 th percentile 3-minute average concentration Factors Affecting Odour Response The determination of air quality criteria for odour and their use in the assessment of odour impacts is recognised as a difficult topic in air pollution science. The topic has received considerable attention in recent years and the procedures for assessing odour impacts using dispersion models have been refined considerably in many jurisdictions. There is still considerable debate in the scientific community about appropriate odour criteria to be applied on the basis of dispersion modelling. There are two fundamental issues behind odour impact assessment: What "level of exposure" to odour is considered acceptable to meet current community standards? How can dispersion models be used to determine if a source of odour meets the criteria that are based on this acceptable level of exposure? The term "level of exposure" has been used to reflect the fact that odour impacts are determined by several factors, the most important of which are the so-called FIDOL factors: Frequency of exposure Intensity of the odour Duration of odour episodes Offensiveness of the odour Location of detected odour. Whether or not an individual considers an odour to be a nuisance will depend on a complex set of factors that includes the FIDOL factors, but also includes an even more complex set of qualitative or soft factors that are unique to a person s individual physiological and social circumstances (Van Harreveld 2001, OdourNet UK Ltd 2002). The influence of soft factors is illustrated in a Queensland case study of two industrial odour sources in separate but nearby communities. The rates of complaint in the two communities were estimated as 10-3 and 10-7 complaints per person per hour of plant operation, a 10,000-fold difference despite the fact that similar odour levels were determined by modelling and field validation. The differences could be largely attributed to the role of soft factors such as expectations about odour performance, the effects of extreme emissions episodes, company response to complaints and general profile in the community, nature of the local environment, media publicity, employment prospects and additional stressors including dust and noise (Ormerod, Turrati et al. 2003). Job ID AQU-VC Cleanaway Melbourne Regional Landfill AQA R10 Low Res.docx

71 An illustration of the variability of the odour nuisance levels within a community that is affected by a dominant odour source is given below in Figure 4.1 It shows the results of an investigation and community odour survey conducted in 2002 at Gladstone, where industrial odours from the QAL alumina refinery were a significant feature. A community odour survey with more than 520 responses to a question about long-term nuisance provided the data and when mapped the responses revealed highly varied responses within small area, reflecting the variability between individuals based on differences in physiological sensitivity, exposure patterns and perceptions based on experience and expectations of environmental quality. Figure 4.1: Variability of Odour Nuisance across Gladstone, Queensland in 2002 (Ormerod, D'Abreton et al. 2002) The risk that odour impacts capable of causing nuisance and complaints will occur in any given situation is difficult to define because there are many factors that can have an effect on the outcome. The difficulties in setting odour performance criteria are reflected in the variations in odour guideline settings across different Australian jurisdictions and in Victoria. For example, poultry operations have been assessed in Victoria on the basis of a C min criterion of 5 ou rather than the default value of 1 ou (Section 4.3.3). In New South Wales urban areas, the criterion is 2 ou but expressed as C99 1 sec and in Queensland it is 2.5 ou expressed as C hr. Across these commonly used criteria there are clear differences in percentile, averaging time and odour concentration settings, but all are intended to achieve similar outcomes. Some of the differences in approach may reflect the issues of quantifying odour emissions using different sampling methods and modelling assumptions State Policy State Environment Protection Policies relating to the air environment in Victoria are the State Environment Protection Policy (Ambient Air Quality) or SEPP (AAQ) ; and the State Environment Protection Policy (Air Quality Management) or SEPP (AQM). The SEPP (AQM) establishes the statutory framework for managing emissions to the air environment in Victoria. This includes the modelling and measurement of emissions of odorous substances. For specific odorous compounds occurring in isolation, design ground level concentrations are provided. For general odorous mixtures the Victorian criterion is C min = 1 ou. Job ID AQU-VC Cleanaway Melbourne Regional Landfill AQA R10 Low Res.docx
72 This means that the 99.9 th percentile odour concentration averaged over 3 minutes must not exceed 1 odour unit c, which is the level of detection as determined by dynamic olfactometry in accordance with Australian Standard (AS/NZS ) (Air quality Determination of Odour Concentration by Dynamic Olfactometry). The standard odour criterion in Victoria is the most stringent of those used in the various Australian jurisdictions and can create practical problems of compliance via modelling assessment for many industries that do not have readily-controllable point source emissions, such as landfills and intensive livestock operations. For that reason, an odour risk assessment can also be conducted to take into account other relevant information about odour impacts such as the evaluation of complaints data (for existing operations), comparison of buffers with other comparable sites, and discussion of the risk of odour exposure and nuisance obtained from more detailed analysis of model results and meteorological data. Under the SEPP AQM, odour must be managed so that local amenity is protected beyond the boundaries of the premises. The application of best practice is the primary way to manage the emission of odour at the source. Adequate separation of the emission sources from sensitive uses is a secondary way to manage odour once best practice options have been implemented EPA Odour Risk Assessment Methodology The EPA has developed a risk assessment methodology that involves the use of a risk matrix to help understand the predicted 3-minute average odour concentration results that are above 1 ou (EPA, 2015). The risk matrix is effectively a way to categorise the degree of potential risk in readily understood terms. In a practical sense, many activities that cannot contain and treat odorous emissions via engineered systems (e.g., scrubbers and stacks) are not able to readily comply with the 1 ou policy setting given typical separation distances to sensitive receivers. Indeed, experience has shown that odour levels above the policy criterion do not automatically result in odour nuisance, and tolerable odour exposure can be achieved if the frequency and intensity of odour events is not excessive. The odour risk matrix is a tool that relies on a risk assessment approach to evaluate acceptability of predicted odour levels. It was developed specifically for the case of broiler chicken farms, which are a prime example of operations that cannot economically treat odour emissions and generally cannot achieve the separation distances required to meet the 1 ou policy setting. The matrix evaluates how often various concentration bands are exceeded at sensitive locations, and a risk category (high medium, low) is applied. The EPA risk assessment matrix is shown in Figure 4.2. EPA has approved projects that are assessed as posing a medium risk of nuisance associated with odour. The odour risk assessment approach is adopted as the suitable basis for assessing this project, given that odours are released from area sources with limited possibilities for containment and treatment of the odorous gas flow. c The odour strength unit in Australia is ou whereas in the European approach, the notation is OU/m 3. The Australian approach treats odour strength as a dilution factor, while the European approach treats it as a concentration. Numerically they are identical but the units are used differently. Job ID AQU-VC Cleanaway Melbourne Regional Landfill AQA R10 Low Res.docx
73 Table 1 broiler farm odour risk assessment matrix Frequency Odour events per year Odour concentration 10+ OU 6 9 OU 1 5 OU 0 9 see note below H M L H H M >175 H H M Note: The highest 9 events per year are deemed statistical outliers. EPA has low confidence in these as estimates and recommends that they be disregarded for the purposes of risk assessment under SEPP (AQM). Key: L = low risk (compliant with SEPP (AQM)) M = medium risk H = high risk Figure 4.2: EPA Odour Risk Assessment Matrix (EPA, 2015) 4.4 Particulate Matter Guidelines The relevant guideline for airborne particulate matter (PM10) concentration is the guideline identified in the Protocol for Environmental Management in the Mining and Extractive Industries (PEM Mining). This guideline is appropriate because the Ravenhall Site is also currently used for quarrying. The guideline is a maximum 24-hour average concentration of 60 µg/m 3. This criterion is a cumulative concentration (i.e. including all background sources as well as the specific source under study). The PEM is a formal policy instrument and the criteria contained within it cannot be arbitrarily changed. Any changes to the PEM would require a formal consultation process. For dust deposition, which is a measure of direct amenity impacts, there is no guideline specifically set by EPA in Victoria. However, it is common practice here and in other states to refer to the NSW guideline, which requires: a maximum incremental deposition rate 2 g/m 2 /month a cumulative maximum rate due to all sources of 4 g/m 2 /month. Job ID AQU-VC Cleanaway Melbourne Regional Landfill AQA R10 Low Res.docx
74 5 PROJECTED EMISSIONS The projected emissions were based on the proposed future MRL Extension operations. Select scenarios were chosen to estimate emissions and for dispersion modelling based on the available data, locations of activities, quantity of activities and advice from the EPA. It is noted that the MRL power plant is not an included source in any of the emission estimation or dispersion modelling. This is due to the small emission resulting from the combustion of LFG making it an inconsequential source compared to the operations at the Ravenhall Site. The emissions associated with the MRL power plant are provided for context in Appendix H. 5.1 Odour Emissions Odour emissions from the landfill that are considered in this assessment are: Fresh waste as it is delivered and placed in the active cell. Interim covered cells. Fully capped cells. Leachate storage ponds. LFG from capped cells is considered to be primarily methane (CH4), carbon dioxide (CO2) and various minor gases. Methane and carbon dioxide are odourless, but odour from the minor gases, including sulphide and volatile organic compounds, is very strong at the source. The current LFG capture systems is considered to be best practice and minimises the odour emissions from this source, as confirmed by source odour monitoring, and therefore was not considered in the odour assessment Current Odour Management Landfill Ops approach to odour management is to implement control measures and monitoring practices additional to the controls that have already been in place. The most important areas are control of the active face area on a day-to-day operational basis, and to implement effective LFG controls. A significant amount of odour can be emitted from areas of an uncompleted cell with interim capping. Landfill Ops is implementing a system of sacrificial horizontal pipes with active collection to capture LFG that is generated within months of the waste being buried. As the cell is filled in layers, new horizontal collection pipes are installed to maintain effectiveness. Once the cell is complete and given a final cap, a permanent system of active gas collection via vertical wells is installed. For completed cells, the best practice approach is to install a membrane together with an overlying sub soil and vegetated top soil of more than 0.5 m thickness, active gas collection and regular monitoring to ensure that the collection system and the cell surface do not have leaks and cracks that emit fugitive LFG. Further, as vegetation establishes on the surface, the plant and soil bacteria processes act as a biofiltration system to remove odorous compounds. As a result of such measures, it is assumed that residual odour emissions generated by the interim cover cells will be significantly reduced compared to sites where the interim horizontal system is not implemented Site-Specific Odour Emissions An odour monitoring campaign was conducted on 30 November and 1 December 2015 to gather measurement to determine current site- specific odour emission rates for MRL sources. The monitoring campaign included source sampling, where available, and odour intensity observations to inform source sampling. This ensured that the odorous aspects of the landfill operations were captured during the monitoring event. The sampling plan for this event, resulting monitoring laboratory report, and the analysis to determine the odour emission rates are provided in Appendix C. These observations are supplemented various other observations made around the site in 2014 and The site-specific emission factors for the landfill sources are summarised in Table 5.1. It is noted that there were no operating leachate ponds and therefore a site-specific odour emission factor could not be Job ID AQU-VC Cleanaway Melbourne Regional Landfill AQA R10 Low Res.docx
75 determined for this source. However, the emissions from the leachate ponds are expected to be very minor. Table 5.1: Site-Specific Odour Emission Rates based on Measurement on 30/11/15 and 1/12/15 Odour Source Active face 3.3 Interim covered cells 0.16 Capped cells 0 Leachate ponds Odour Emission Rate (ou/m 2 /s) N/A N/A Site specific measurements were not available and the emission rate could not be determined Literature Review of Odour Emission Rates A review of available odour emission rates for landfill cells (i.e. active face, Interim cover cells and capped cells) used in published landfill odour assessments in Victoria and NSW was also conducted. A summary of this review is provided in Table 5.2 along with the site specific emission rates determined from monitoring. All emission rates other than GHD have been determined using flux hood measurement or in the case of the MRL site-specific measurement, have been adjusted to an equivalent flux hood value. The GHD data are as measured by back calculation from downwind samples and have not been adjusted to be a flux hood equivalent measurement. Table 5.2 Summary of Odour Emission Rates Reviewed for All Landfill Cell Categories (ou/m 2 /s) Description Active Face Interim Covered Cells Capped Cells MRL Site-Specific Measurements Lucas Heights landfill a Kimbriki a Eastern Creek a Woodlawn a Sita NSW Waste Treatment Facility b year old section of landfill b year old section of landfill b year old section of landfill b year old section of landfill b year old section of landfill b Golder database - VIC c Golder database - NSW c Nambour Landfill - QLD c Summerhill Waste Disposal Centre - NSW c Putrescible Landfill Site - NSW c GHD Wyndham Morning Measurements d GHD Wyndham Morning Measurements d GHD Model Average d,e a. Table 14 (SLR, 2012). b. Table 10 (Holmes Air Sciences, 2007). c. Tables 5, 7 and 8 (Golder Associates, 2012). d. Based on site specific measurements (GHD, 2013). Emission rates have not been adjusted to be flux hood equivalent measurements. e. Average of modelled hourly varying odour emission rates (GHD, 2013). The emission rates selected to estimate odour emissions from the landfill activities for this assessment are Job ID AQU-VC Cleanaway Melbourne Regional Landfill AQA R10 Low Res.docx
76 provided in Table 5.3. Where possible, site-specific emission factors have been used. The interim covered cells factor as sampled does not representative the future management of interim capped cells. For future cells the horizontal LFG capture system will be progressively installed during the cell s operation, whereas collection systems have previously been installed after the completion of the cell. The planned LFG capture system will reduce the odour emissions because a significant portion of the odorous gas will be captured for destruction in either the onsite power station or the flare. The NGER Technical Guidelines indicates that a typically operated LFG capture system can expect to capture at least 75% of the LFG generated (CER, 2014). For the purposes of this assessment, it is conservatively assumed that odour emissions from the interim covered cells will be reduced by 50%, allowing for the LFG capture while some of the area would not have effective capture. The reduced emission rate is used for all future modelling scenarios. Area Landfill Pinegro Composting Facility Table 5.3 Odour Emission Rates Used in this Assessment (ou.m 3 /m 2 /s) a Description Active face b 3.3 Odour Emission Rate (ou/m 2 /s) Interim covered cells Base Cases b 0.16 Interim covered cells - Future Scenarios c 0.08 Capped cells 0 Leachate ponds b 0.04 Receiving Area d 4 Maturation Pads d 1.2 Windrows Phase 1 e 27.8 Windrows Phases 2/3 f 3.6 a. Listed emission rates refer to stable light wind conditions, and are varied upwards for stronger winds and higher turbulence as per mass transfer theory and site observations b. Corresponds to the emission rate provided in Table 5.2. c. Assumes progressive LFG capture systems collects 50% landfill gas generated. d. Table 5.2 (Baker & McKenzie, 2013). e. Table 5.3 (Baker & McKenzie, 2013). This value corresponds to an average for phase 1 (2.0) and was adjusted by a factor of 13.9 as per the discussion on Under Estimation of IFH on page 26. This value excludes additional increased adjustment due to surface area effects noted on page 28. f. As per comment e) but adjusted for phase 2 by a factor of 4.6. With area sources of emissions such as landfills, there are several possible ways to determine emission rates but the different methods return vastly different values. It is generally difficult to reconcile the differences, owing in part to the relatively high uncertainty and variability of results and the economic limitations on gathering large amounts of data, as dynamic olfactometry is a relatively expensive method. The most reliable approach in principle to gather emissions for the most critical dispersion conditions is to rely on data that were generated from isolation flux hood or flux chamber sampling of the emitting surfaces, in line with Australian Standard Stationary source emissions - Area source sampling Flux chamber technique. An isolation flux hood is a device that imposes an artificial condition over the emitting surface, which is normally exposed to the ambient conditions of wind and other elements that lead to variations in emission rate. The flow conditions inside a flux hood result in emission rates similar to those in stable, light wind conditions in the real world. These tend to be the critical conditions for determining odour impacts from area sources and so the flux rates from flux hood sampling are the most appropriate to use for this purpose. Emissions of odour from most area sources increase as the wind speed and turbulence increase. The rate of increase in emissions is less than the increase in plume dispersion that occurs with stronger winds. The net result is that, with all other factors being equal, ground level concentrations downwind of an area source decrease as the wind speed increases. Job ID AQU-VC Cleanaway Melbourne Regional Landfill AQA R10 Low Res.docx
77 The assessment of odour impact is based on near-maximum concentrations that in the case of lowlevel, non-buoyant sources like landfills occur with stable light wind conditions. For this reason, adjusting emission rates to account for wind speed and turbulence effects will not lead generally to any significant change in the highest predicted concentrations. It is noted that there are considerable ranges in the quoted values of emission flux for landfills, probably reflecting a combination of uncertainties relating to odour sampling and olfactometry, as well as variations from site to site and over time at the same site. Whilst in principle the isolation flux method of sampling is best for capturing emission rates relevant to low wind stable conditions (critical for dispersion), there are practical issues with this sampling technique on rough surfaces and on surfaces that have spatial variation in emissions, such as an active face. The flux hood covers only a small area and hence there is always a question of representativeness of samples. Hence, alternative sampling methods such as transect sampling under real-world conditions are more able to integrate the effects of a spatially variable emissions surface, but at the same time the method is subject to very large uncertainties associated with characterising complex wind and plume conditions, with back-calculation methods and with olfactometric analysis of possibly low concentration samples. The estimation of odour emissions for the Pinegro composting operation is by necessity very approximate, as it is not based on close site inspection. Indicative data on layout and source areas were based on a series of Google Earth images for the past 2 years Landfill Gas Management Plan A Landfill Gas Management Plan has been developed for the MRL Extension and is included in the Works Approval Application. The Landfill Gas Management Plan has been designed, in part, to prevent off site nuisance odours. The methods identified to prevent off site nuisance odour include: Current buffer zones that meet BPEM requirements (i.e. 500 m to sensitive receptors). Future larger buffer zones to accommodate potential future residential and commercial zones (i.e. 1,000 m). Maintenance of the current LFG capture system. Progressive installation of LFG capture system in new cells. Use of composite liners and caps which meet the BPEM requirements. Progressive installation of the interim cap. Monitoring of perimeter gas well. Monitoring of surface emissions. Establishment of an odour complaints and action plan. Operation of a modern landfill gas containment, extraction and treatment system Draft Metropolitan Waste and Resource Recovery Implementation Plan The Victorian Statewide Waste and Resource Recovery Implementation Plan is part of a roadmap to ensure that the State will have the infrastructure to effectively manage the mix and volumes of waste generated for the next 30 years. The Plan addresses waste and resource recovery services needed to meet the needs of all Victorians. The Draft Metropolitan Waste and Resource Recovery Infrastructure Plan brings together priorities set out in the State plan and applies them within the metropolitan context. A key component of the plan is Job ID AQU-VC Cleanaway Melbourne Regional Landfill AQA R10 Low Res.docx
78 a schedule outlining the existing and future waste and resource recovery infrastructure that is required to manage Melbourne s waste. This infrastructure includes additional waste recovery infrastructure. The draft plan was released for industry community consultation. Cleanaway has reviewed it and has considered the impacts of the plan on the future waste mix to be received at the Ravenhall Site. Based on the Draft Plan, it is assumed that waste deposited in future cells will contain a smaller organic component, as increasing rates of recovery of organic waste for composting occur, compared to present waste streams. Lower proportions of organics in the fresh waste deposited at the Ravenhall Site can be expected to reduce odour emissions from the active face and the site in general. Cleanaway has developed assumptions for the organic component of waste streams during the relevant period using the priority actions set out in the Draft Metropolitan Waste and Resource Recovery Implementation Plan. It is anticipated that either or both of the below outcomes could occur: The organic component received at Ravenhall Site will be reduced by 1 million tonnes by This represents a percentage reduction of 24% of organics received. and/or The organic component received at Ravenhall Site will be reduced by 1.4 million tonnes by This represents a percentage reduction of 33% of organics received. Based on these outcomes, it is likely that the active face emissions would be reduced. A first order estimate is that the reduction in odour emissions will be proportional to the reduction in organic fraction of the waste, e.g., a 30% reduction in the organic fraction would result in a 30% reduction in odour emissions from fresh waste and from subsequent buried waste. For the purpose of odour modelling, the reduction has been applied to the dispersion model and risk assessment results for Scenarios 3 and 4 (Section 8.1.1) Estimated Emissions for Selected Scenarios The information provided by Landfill Ops presented in Table 5.4 was used to develop relative surface area for the active face, interim covered cells and capped cells for each selected model scenario. The provided information included cell identification, location, surface and timing. The aim of the dispersion modelling is to represent the worst case emissions that could occur at point during the modelled meteorological period. This ensures that the worst case emissions will coincide with the worst case meteorology for all sensitive receptors. The areas considered for the modelling are conservative and may not represent conditions that would commonly occur during the landfill operations, but are meant to provide an understanding of the worst possible odour emissions. The areas used for the model scenarios are provided in Table 5.5. The cell locations were presented earlier in Figure 2.2 and the indicative model areas in Figure 2.4. The selected odour emission rates are listed in Table 5.6. No residual odours are assumed to be emitted routinely from capped cells based on the odour management strategies that will be implemented by Landfill Ops. Provided that the Landfill Gas Management Plan is followed, this assumption is reasonable. The capping and LFG capture system is widely used to control odours and so established final caps should have no significant odour emissions provided that any avenues for LFG release via cracks and collection systems leaks are routinely monitored and rectified, as per the Landfill BPEM. Site-specific testing has confirmed that final cap emissions are essentially the same as those from natural soil surface off the landfill site. For the Base Case 2014 (incl. Pinegro), emissions from the Pinegro composting facility located in the vicinity of the landfill were included in the model for one run to evaluate their potential cumulative impacts. The odour source areas and the emission rates used in the dispersion model are presented in Table 5.7. Note that for the Base Case 2014 (incl. Pinegro) an active face area of 3,600 m 2 was Job ID AQU-VC Cleanaway Melbourne Regional Landfill AQA R10 Low Res.docx
79 modelled, which represents recent historical practice based on licence requirements. Base Case 2015 considers an 1,800 m 2 active face, which represents updated practice as advised by Landfill Ops. Cell No Table 5.4 Summary of the Key Features of Each Cell Cell Area (ha) Cell Area (m²) Cell Area (m²/year) Cell Life (Years) 1 (Scenario 1) ,000 94, ,000 55, ,000 73, (Scenario 2) ,000 89, ,000 62, ,000 71, ,000 58, (Scenario 3) , , ,000 68, (Scenario 4) , , ,000 56, ,000 47, ,000 52, ,000 67, ,000 54, ,000 55, Description Table 5.5 Estimated Areas Associated with the Landfill Activities Active Face Interim Covered Cells Area (m²) MRL Extension Capped Cells Leachate Pond Base Case 2014 (incl. Pinegro) 3, , ,000 Base Case , , ,000 Scenario 1 (Cell 1) 1, ,200 1,000 10,000 Scenario 2 (Cell 4) 1, , ,500 10,000 Scenario 3 (Cell 8) 1, , ,000 10,000 Scenario 4 (Cell 10) 1, ,125 1,207,075 10,000 Table 5.6 Estimated Odour Emission Rates for Selected Scenarios Associated with the Landfill Activities Scenarios Base Case 2014 (incl. Pinegro) Emissions Rates (ou/s) Active Cells Interim Covered Cells Capped Cells Leachate Pond 11,880 28, Base Case ,940 28, Scenario 1 (Cell 1) 5,940 14, Scenario 2 (Cell 4) 5,940 19, Scenario 3 (Cell 8) 5,940 11, Scenario 4 (Cell 10) 5,940 19, Job ID AQU-VC Cleanaway Melbourne Regional Landfill AQA R10 Low Res.docx
80 Table 5.7 Areas and Odour Emission Rates Associated with the Pinegro Composting Facility s Activities Description Area (m²) Emissions Rates (ou/s) Receival Area 7,386 29,544 Windrows Phase 1 3,091 85,930 Windrows Phases 2/3 6,418 23,105 Maturation Pad 1 4,608 5,530 Maturation Pad 2 3,302 3,962 Job ID AQU-VC Cleanaway Melbourne Regional Landfill AQA R10 Low Res.docx
81 5.2 Particulate Matter Emissions Basis of Emission Estimates Particulate matter emissions for this assessment were estimated based on data provided by Landfill Ops and published emission factors. As described earlier in Section 2.4, dust emissions are anticipated to be associated with the following activities: wheel-generated dust from vehicle movements disturbance due to machinery action, including earthmoving, at various stages of a cell s life wind erosion from dusty exposed surfaces. The emission estimation techniques used to estimate TSP and PM10 emissions were obtained from the following published US EPA chapters from the Emissions factors & AP 42 - Compilation of Air Pollutant Emissions Factors: Chapter Industrial Wind Erosion (US EPA, 2006a) Chapter Unpaved Roads (US EPA, 2006b) Chapter Aggregate Handling and Storage Piles (US EPA, 2006c). The emission factors used for this assessment are presented in Table 5.8. Indicative haul roads used to estimate the emissions from vehicles travelling on-site and are shown in Figure 5.1. Conservative paths between the weighbridge and active cells were assumed on the basis that the existing weighbridge will be relocated on Riding Boundary Road and that the future haul roads will be in use as soon as Cell 1 is operational. The dust emissions caused by wind erosion are dependent on the wind speed measured at a standard height of 10 metres at an exposed location. It should be noted that the wind speed is anticipated to be reduced by the local topography at the active cell of the landfill, where the disturbance of the surface is likely to generate a high proportion of erodible material. Appendix E explains a CFD modelling analysis that shows how the wind speed in a typical cell below surrounding terrain height will be reduced. This reduction in wind speed will reduce the emission of windblown dust and odour, which are affected by variations in wind speed. Conversely, an elevated cell will have areas, especially on the upwind edge, where the wind speed is higher but other parts where it is lower. Job ID AQU-VC Cleanaway Melbourne Regional Landfill AQA R10 Low Res.docx
82 Activity Excavators/ FELs - cover material spreading at active face a Trucks dumping - cover material at active face/active cell a Wind erosion - exposed area (covered cells) b Wheel generated dust - unpaved roads c Table 5.8 Emission Factors Used for Dust Emissions Estimation Scenario Emission Factors TSP PM10 PM2.5 Units All kg/tonne All kg/tonne All g/m² Base Case 2015 (Cell 2L) kg/km Scenario 1A (Cell 1) kg/km Scenario 2A (Cell 4) kg/km Scenario 3A (Cell 8) kg/km Scenario 4A (Cell 10) kg/km a. (US EPA, 2006c) - no default PM2.5 emission factor was available. A PM2.5/PM10 ratio of 0.15 was used based on AP42 background document for aggregate handling and storage piles. b. (US EPA, 2006a) - only maximum potential emissions for the active cell face, where material is freshly placed, were included in the assessment. The emissions from the other cells are expected to be minor as the cover material is anticipated to be deposited for a long period of time. According to Section of US EPA (2006a), the PM10/TSP ratio is 0.5 and the PM2.5/TSP ratio is c. (US EPA, 2006b) the slight variations among scenarios are due to the use of a weighted average gross mass of vehicles travelling on unpaved roads. Job ID AQU-VC Cleanaway Melbourne Regional Landfill AQA R10 Low Res.docx

83 Indicative Haul Roads Indicative Base Case Cell Boundary Indicative Property Boundary Indicative Future Cell Boundaries Figure 5.1: Indicative Haul Road Layout for Future Scenarios Job ID AQU-VC Cleanaway Melbourne Regional Landfill AQA R10 Low Res.docx
84 5.2.2 Estimated Emissions for Modelled Scenarios The estimated dust emissions from the landfill s current (Base Case) and future operations are presented in Table 5.9 for all scenarios. The majority of the dust emissions are wheel-generated dust from haul roads for all scenarios as shown in Table 5.9. The methodology and activity data used to estimate these emissions are contained in Appendix H. The changes in dust emissions across the scenarios are mainly due to the variation in on-site haul road distances between the scenarios, as shown in Figure 5.1, and the anticipated increase in tonnage of waste accepted at the landfill resulting in an increase in on-site traffic associated with waste disposal trucks. Table 5.9 Estimated Annual Dust Emissions from the Landfill Operations Emission Source Excavators/ FELs - cover material spreading at active face Trucks dumping - cover material and interim cover material at active face/active cell Waste handling by excavators, bulldozers, compactors, FELs and waste disposal trucks a Wind erosion - exposed area (covered cells) b Wheel generated dust - unpaved roads c, d Combustion in waste disposal trucks travelling to active face Combustion in light vehicles (contractor vehicles and site utes) Scenario TSP Emissions (kg/year) PM10 Base Case 2015 (Cell 2L) Scenario 1A (Cell 1) Scenario 2A (Cell 4) Scenario 3A (Cell 8) Scenario 4A (Cell 10) Base Case 2015 (Cell 2L) Scenario 1A (Cell 1) Scenario 2A (Cell 4) Scenario 3A (Cell 8) Scenario 4A (Cell 10) All - - Base Case 2015 (Cell 2L) 2,463 1,231 Scenario 1A (Cell 1) 3,653 1,827 Scenario 2A (Cell 4) 3,284 1,642 Scenario 3A (Cell 8) 2,894 1,447 Scenario 4A (Cell 10) 4,536 2,268 Base Case 2015 (Cell 2L) 232,630 50,723 Scenario 1A (Cell 1) 341,482 74,458 Scenario 2A (Cell 4) 400,626 87,354 Scenario 3A (Cell 8) 256,560 55,941 Scenario 4A (Cell 10) 336,407 73,351 Base Case 2015 (Cell 2L) Scenario 1A (Cell 1) Scenario 2A (Cell 4) 1,035 1,035 Scenario 3A (Cell 8) Scenario 4A (Cell 10) All Combustion in water carts All Combustion in haul trucks transporting cover material to active face Base Case 2015 (Cell 2L) Scenario 1A (Cell 1) Scenario 2A (Cell 4) Scenario 3A (Cell 8) Scenario 4A (Cell 10) Job ID AQU-VC Cleanaway Melbourne Regional Landfill AQA R10 Low Res.docx
85 Emission Source Scenario TSP Emissions (kg/year) PM10 Combustion in dozers All Combustion in excavators All Combustion in FEL All Combustion in flat drum roller All Combustion in compactor All Combustion in diesel combustion in light towers Combustion of LFG in engines for power generation e All All - - Base Case 2015 (Cell 2L) 237,059 53,888 Scenario 1A (Cell 1) 347,489 78,599 TOTAL Scenario 2A (Cell 4) 406,436 91,484 Scenario 3A (Cell 8) 261,546 59,443 Scenario 4A (Cell 10) 343,313 77,949 a. It is assumed that the moisture content of freshly placed waste is sufficiently high to prevent dust emissions from waste handling. b. Only maximum potential emissions for the active cell were included. c. Emissions from the following vehicles were included in the assessment: - waste disposal trucks - light vehicles (contractors and utes) - haul trucks transporting cover material to active face. These vehicles are assumed to travel on the same internal roads for the selected scenarios. Water carts are considered to be an insignificant source of dust emissions, mainly due to their low operating speed. It is noted that the unpaved road emission factor equation was derived based on a mean vehicle speed ranging from 8 to 69 km/hr in accordance with Table of the AP42 Chapter Unpaved Roads. d. The majority of the onsite roads are unpaved and therefore it is assumed that all onsite roads are unpaved as a conservative approach. e. In accordance with Table 55 of the NPI EET manual for Combustion Engines v3.0 (2008), particulate matter emissions are not expected from the combustion process for LFG Estimated Emissions for Updated Transport Conditions The updated transport conditions detail the number of trucks required per week to meet the needs for the additional waste handled at the MRL Extension (GTA Consultants, 2016). The transport conditions considered in the dispersion modelling (as pre Section 5.2.2) were based on previous draft plans. The updated transport conditions include a slightly higher frequency of trucks, except Scenario 2 where the frequency decreases. The updated estimated dust emissions for all scenarios are presented in Table 5.10 along with the modelled dust emissions. The percent increase in dust emission is also provided and shows that the dust emissions from the landfill increases a maximum of 10.6% and decreases by 4.6% for Scenario 2. The methodology and activity data used to estimate the updated emissions are described in Appendix H. Job ID AQU-VC Cleanaway Melbourne Regional Landfill AQA R10 Low Res.docx
86 Scenario Table 5.10: MRL Modelled and Updated Dust Emission based on the latest Modelled Emissions (kg/year) Updated Emissions (kg/year) Percent Increase TSP PM10 TSP PM10 Base Case 2015 (Cell 2L) 237,059 53, ,486 57, Scenario 1A (Cell 1) 347,489 78, ,821 83, Scenario 2A (Cell 4) 406,436 91, ,506 87, Scenario 3A (Cell 8) 261,546 59, ,398 65, Scenario 4A (Cell 10) 343,313 77, ,194 86, Job ID AQU-VC Cleanaway Melbourne Regional Landfill AQA R10 Low Res.docx
87 6 DISPERSION MODELLING 6.1 EPA Air Quality Modelling Policy The AERMOD dispersion modelling system was used for this assessment, which is in line with the requirements of the EPA policy on air quality assessment modelling in Victoria, as released in January To assist with the transition from the use of AUSPLUME to AERMOD, EPA has developed draft guidelines on the usage of AERMOD, which are as follows: Construction of input meteorological data files for EPA Victoria s regulatory air pollution model (AERMOD) (publication 1550) Guidance notes for using the regulatory air model AERMOD in Victoria (publication 1551). According to publication 1551, a proponent for use of an alternative model such as CALPUFF will need to seek approval from EPA. Two examples of using an alternative model are provided: Complex geographical locations whereby factors such as: terrain, coastal and land-use influences; in combination with the spatial scale of the impact zone of the sources; require the use of fully 3-dimensional meteorological fields. Publication 1550 provides specific details on how to prepare meteorological data for use as input in AERMOD to drive air dispersion modelling. EPA has committed to prepare and provide meteorological data for most locations in Victoria free of charge for at least a year under the new policy. For this assessment, EPA has prepared meteorological data for Deer Park for 2008 and Additional years, 2010, 2011 and 2012 were developed to supplement the meteorological data-set for the odour assessment. However, publication 1551 notes that for modelling of area sources, It is recognised that AERMOD concentration predictions for area sources in the current approved version of AERMOD are likely to be overestimated under very light wind conditions (i.e. for wind speeds less than 1 m/sec). This issue is addressed in Section 6.2 of the AERMOD Implementation Guide Last Revised March 19, 2009 with various options recommended for avoiding overestimates during such wind conditions. Consequently, emissions from extensive areas were represented by volume sources in AERMOD for this assessment. 6.2 AERMOD Modelling System AERMOD stands for the AERMIC Dispersion Model. AERMOD was designed by the AERMIC committee (the American Meteorological Society/ Environmental Protection Agency Regulatory Model Improvement Committee) to treat elevated and surface sources in terrain that is simple or complex (Cimorelli et al., 1996; Perry, et al., 2005). AERMOD is described in more detail by AERMIC (1995), Cimorelli et al. (1996) and US EPA (2002). The AERMOD modelling system consists of two pre-processors and the dispersion model. The meteorological pre-processor (AERMET) provides AERMOD with the meteorological information (morning soundings of winds, temperature, and dew point from the nearest upper air station; and on-site wind, temperature, turbulence, pressure, and radiation measurements) it needs to characterise the boundary layer (e.g. mixing height, friction velocity). The terrain pre-processor (AERMAP) both characterises the terrain and generates receptor grids and elevations for the dispersion model (AERMOD). AERMOD has been built on the framework of the older Industrial Source Complex Model version 3 (ISC3) model and retains the steady-state, straight line trajectory formulation of ISC3 and related models such as AUSPLUME. However, its treatment of dispersion in the presence of complex terrain improves on that Job ID AQU-VC Cleanaway Melbourne Regional Landfill AQA R10 Low Res.docx
88 used in ISC3 without the complexity of the current complex terrain models. It contains advanced algorithms to describe turbulent mixing processes in the planetary boundary layer for both convective and stably stratified layers. It also includes a detailed treatment of the dynamics of plumes that rise to interact with elevated inversions at the top of the convective mixed layer. AERMOD also offers new and potentially improved algorithms for plume rise and buoyancy, and the computation of vertical profiles of wind, turbulence and temperature. In November 2006 AERMOD replaced the Industrial Source Complex (ISC3) model as the US EPA s regulatory model for near-field applications (less than 50 kilometres) for simple and complex terrain (US EPA, 2005). AERMOD model input file for odour, PM10 and dust deposition are provided in Appendix D for one scenario. 6.3 Model Input Requirements The basic inputs for AERMOD include the following: A setup file which contains the selected modelling options, source information (type, location and source parameters), receptor locations and output options. Five meteorological data files, which are prepared from surface and upper air meteorological station data or prognostic model output. Surface data file which consists of surface data (wind speed, wind direction, ambient temperature, surface albedo, Bowen Ratio and surface roughness, turbulence parameters and mixing height data). Profile data file which consists of vertical profiles of meteorological data. The AERMOD profile data is different from upper level data measured by the Bureau of Meteorology; it is intended for incorporating tower (rather than radiosonde) measurement data into the dispersion modelling. For this project, there is no tower measurement, and the profile data contains only one measurement at the surface. For applications involving elevated terrain effects, the receptor and terrain data are processed by AERMAP before input to AERMOD. EPA generated meteorological data for two years, 2008 and 2009, which were provided to Pacific Environment by request. These two years were selected based on the temperature and wind speed/direction distributions being representative of long term averages as recorded by the Australian Bureau of Meteorology (BOM). Meteorological representative years are preferred for air modelling, as compared to the latest meteorological years, which may not be statistically representative. See Appendix F for details on the selection of representative meteorological years. These two years were used for both the dust and odour dispersion modelling. The meteorological data generated by EPA were based on surface measurements at the EPA s Deer Park air quality monitoring station and upper air at Tullamarine Airport. The latter was used to estimate hourly mixing height. To further evaluate predicted odour impacts, three additional meteorological year were modelled. These years were 2010, 2011 and 2012 resulting in an odour assessment that used five consecutive years of meteorology. The 2010, 2011 and 2012 meteorological data were generated using a methodology consistent with that used for the EPA files. An iterative process was used to determine similar model settings as the EPA did not provide specific details regarding inputs, assumptions and setting used to generate the file. The EPA s Deer Park air quality monitoring station data was used along with the upper air data from Job ID AQU-VC Cleanaway Melbourne Regional Landfill AQA R10 Low Res.docx
89 Tullamarine Airport. The minimum wind speed was set to 0.7 m/s and the surface roughness lengths were set radially, identical to the EPA files. The model domain is essentially flat for this project. The terrain data came from NASA Shuttle radar data (SRTM3) with a horizontal resolution of 90 m. The terrain options were tested during the model runs and modelling with and without variable terrain (option flat vs elevated ) showed very similar results. 6.4 Model Accuracy Atmospheric dispersion models represent a simplification of the many complex processes involved in determining ground-level concentrations of pollutants. One of the crucial issues in obtaining good quality results is the data quality used for modelling and the correct application of an appropriate model for the site conditions. Model uncertainties are composed of model formulation uncertainties and data uncertainties associated with meteorological and emission data. In addition, there is inherent uncertainty in the behaviour of the atmosphere, especially on shorter time scales due to the effects of random turbulence. Refer to US EPA (2005) for an overview of model uncertainties. Among these uncertainties: Model formulation uncertainties are associated with specific air quality models that are chosen, and vary with different models and model set up. Meteorological data uncertainties are associated with whether locally measured data are available and the quality of monitoring and derived data. It also depends on whether the station data can represent meteorology over the entire model domain as terrain and land use can significantly modify meteorology, especially wind, over the landscape The uncertainties in emissions for some applications can be quite large. For example, emissions may be estimated based on published manuals and not based on site specific emission testing. The inherent uncertainties due to random turbulence are mostly outside of the scope of traditional models. It is very important but quite difficult to quantify these uncertainties and provide a rule of thumb for regulators as well as for modellers. From a statistical point of view, the overall uncertainties could be much smaller than the sum of all the individual uncertainties. Comparisons of model simulations with monitoring results are used in order to obtain some measure of model performance, and consequently model uncertainty. Generally, models are more accurate for estimating longer time-averaged concentrations such as annual averages than for estimating the peak concentrations for shorter durations (such as 1-hour or 24-hour). 6.5 Cumulative Assessment and Background Data To assess predicted 24-hr average PM10 concentrations, a background concentration of 20 µg/m³ was used based on the 70 th percentile (i.e. EPA recommended method) of the 24-hr average PM10 data available for years 2008 and In addition to the regional background dust level, major industrial dust emission facilities near the Ravenhall Site were modelled based on published NPI emissions data. Dust emissions were assumed to be negligible for facilities that were not required to report to NPI. The industrial facilities included in this assessment are as follows: The existing Boral Deer Park quarry and associated plant Boral Deer Park asphalt plant Job ID AQU-VC Cleanaway Melbourne Regional Landfill AQA R10 Low Res.docx

90 The locations of these facilities are shown in Figure 6.1. The particulate emissions associated with these facilities are summarised in Table 6.1. The emissions for the existing Boral quarry plant were used for this assessment and were obtained from the latest air quality assessment prepared by Pacific Environment (Pacific Environment, 2015). For the odour assessment, the usual convention is that different odours should be assessed separately. Hence, given that there is just one landfill in the area, the landfill odours are modelled and assessed without considering background odour from other sources for all the scenarios except a Base Case variant that includes emissions from the Pinegro composting facility. This enabled the relative impacts of the landfill and the combined operations to be evaluated, to assist in understanding the history of complaints and observations around the Ravenhall Site. Figure 6.1 Major Industrial Facilities Located Near the Approved Site Job ID AQU-VC Cleanaway Melbourne Regional Landfill AQA R10 Low Res.docx
91 Activity DEER PARK EXISTING QUARRY AND QUARRY PLANT Table 6.1 Dust Emissions from Nearby Industrial Facilities TSP Emissions (kg/yr) Blasting 5,698 2,963 Wet drilling of unfragmented stone FELs - stone loaded onto haul trucks at quarry 16 8 Trucks unloading - fragmented stone From pit to quarry plant Trucks unloading - fragmented stone From bins to stockpiles PM Primary crushing Secondary crushing Tertiary crushing Screening - Stages 1 to 6 3,564 1,199 Fines screening - Stages 1 and 2 1,944 1,188 Conveyor transfer point 2, Wind erosion - stockpiling area 7,812 3,906 Graders 11,643 3,638 Wheel generated dust (unpaved roads) - out of pit 240,180 60,643 Wheel generated dust (unpaved roads) - in pit (haul trucks only) 60,535 15,285 Combustion in light vehicles Combustion in haul trucks 1,056 1,056 Combustion in water carts Combustion in excavators/front end-loaders 2,028 2,028 Combustion in graders Combustion in > 450 kw stationary engines TOTAL 338,418 93,550 ASPHALT PLANT Trucks unloading - quarry product and bitumen unloading FELs - aggregate loaded into hoppers of the cold feed unit 19 9 Miscellaneous transfers (including conveying) - aggregate transferred from cold aggregate bins to rotary dryer Wind erosion - aggregate stockpiles Combustion in FELs Natural gas dryers x 2 (fugitive dust emissions and combustion emissions from stacks 1 and 2 ) 3,117 2,004 TOTAL 3,463 2,187 a. Source: Pacific Environment (2015). 6.6 Particle Characteristics Dry deposition of TSP was modelled to predict dust deposition rates. When modelling PM10 ground-level concentrations, deposition was not included so that plume material was assumed not to be depleted as distance from the source increased, as a conservative approach. AERMOD Method 1, the US EPA default method, was used for modelling dry deposition. This method requires input of particle characteristics for each source. For this assessment, the following three bins were modelled: particles with a diameter greater than 10 µm particles with a diameter between 2.5 and 10 µm Job ID AQU-VC Cleanaway Melbourne Regional Landfill AQA R10 Low Res.docx
92 particles with a diameter less than 2.5 µm. For each bin, a single representative diameter was used; i.e. 30, 10, and 2.5 µm respectively. The mass ratio of the three bins varied with each source type, which was calculated based on the estimated emissions for TSP, PM10, and PM2.5. AERMOD requires input of the particle density and as such, 2.66 g/cm 3 was used to represent earth dust and 1.2 g/cm 3 was used for diesel exhausts (Virtanen et al. 2002). 6.7 Source Details For modelling purposes, emission sources are classified into three types; i.e. point, area, and volume sources. Point sources correspond to stacks and vents. Two dryer stacks associated with the Asphalt Plant were modelled as point sources to account for background emissions. Volume sources are generally sources that have initial horizontal and vertical spread, but without buoyancy for plume rises. Volume sources are commonly used to model dust generating activities, such as emissions from truck/shovels, haul roads, and transfer points, and processing activities at quarry plants. Area sources are often used for modelling emissions over an area, such as wind erosion of exposed areas or emissions from a pond. However, as stated in Section 6.1, AERMOD tends to overpredict impacts from area sources and as such, volume sources are recommended as an alternative. For this assessment, the majority of the identified sources of emissions were modelled as volume sources as recommended in Section 6.2 of the AERMOD Implementation Guide Revision 19 March These sources include wind erosion of exposed areas and odour emissions from the landfill s active and capped cells. Emissions from large areas were divided into smaller square volume sources to improve model prediction accuracy near these sources. The calculation is not accurate in the near field of a volume source. Hence, the size of each volume source in the model was decided on the principle that each source is roughly a square source, with its length much smaller than its distance to the nearest sensitive receptors. This overcomes the near-field issue. For the odour modelling the leachate ponds were locations based on their locations in Figure 2.3. Based on the landfill Cell Sequencing Plans (presented in Appendix B of the Works Approval application), the areas identified as interim capped were modelled as partially capped and partially as interim to represent the progressive capping occurring during the operation of the landfill. All final capped cells were modelled as fully capped. Active cells were modelled with their identified active face area in the middle of the cell with the rest of the area modelled as an interim capped surface. Scenario 1 was modelled with the active face closest to the sensitive receptors to consider the worst case odour impacts. Scenario 4 modelled the active face in the northern third of the active cell to represent worst case impacts as it is the part of the cell closest to the sensitive receptors. The rest of cell 10 was modelled as interim or fully capped based on the Cell Sequencing Plans and discussions with Landfill Ops. For Scenario 4, cell 9 was modelled as partially interim and partially capped. To model dust generated from haul roads, the following US EPA (2012) recommendations on haul road modelling were used: Top of Plume Height 1.7 x VH Volume Source Release Height 0.5 x Top of Plume height Width of Plume VW + 6m for single lane roadways / Road Width + 6m for two lane road ways. Job ID AQU-VC Cleanaway Melbourne Regional Landfill AQA R10 Low Res.docx
93 Initial Sigma Z Top of Plume / 2.15 Initial Sigma Y Width of Plume / 2.15 Here, VH corresponds to the vehicle height and VW corresponds to the vehicle width. For this assessment, typical haul truck dimensions of VH = 3 m and VW = 3 m were used. The volume source parameters associated with haul roads and the other identified volume sources used in this assessment are listed in Table 6.2. Source Table 6.2 Modelled Volume Source Parameters Height (m) Initial Sigma Z (m) Top of Plume (m) Initial Sigma Y (m) Haul roads Wind erosion Initial plume width/2.15 Other quarry dust Initial plume width /2.15 Odour sources Initial plume width /2.15 Pinegro odour Length/4 sources a. Note: for emissions from an area, the initial plume width is the same as the width of the area. 6.8 Time-Varying Emission Rates This section describes how time-varying emissions were considered in this assessment. For wind erosion sources, the emission rates used in the AERMOD model were varied based on the wind speed. These emission rates were estimated by converting the published emission factors for wind erosion using a cubic relationship that correlates emissions to wind speed; i.e., the erosion potential is proportional to the cube of the wind speed. This relationship is based on the assumption that wind erosion is linearly related to the power of the wind. The threshold friction velocity (wind velocity at which dust lift-off occurs) was set at 5.4 metres per second (measured at 10 metres height). In order to input the cubic relationship into the model, emission rates were binned in three separate emission rate categories according to wind speed. The variable emission ratios for the selected wind speed bins were obtained based on the actual wind speed observed at the Deer Park monitoring site and the cubic relationship. These emission ratios are presented in Table 6.3. To model PM10 from blasting activities, 1 blast per day was assumed between 11am and midday, even though in reality approximately two blasts per month occurs (30 blasts per year). When modelling TSP dust deposition, 1 blast per day was assumed; however, at much reduced rates (reduced by a ratio of 30/365). Emission rates associated with wheel generated dust were assumed to be constant over 24 hours/day for each operating day. For odour modelling, constant emission rates were used in AERMOD even though the odour emission rates from exposed areas would change with wind speed. Post-processing of the results involved applying an adjustment upwards of the concentration for each hour at each receptor based on the wind speed and turbulence, as explained further in Appendix C. The adjusted concentrations at the 99.9 th percentile level are generally very similar to the values produced by the model with a constant emission rate. However, the distribution of concentration changes more significantly at lower percentiles, which is important for generating more realistic estimates of the number of hours above certain odour thresholds, as required for the odour risk assessment. Job ID AQU-VC Cleanaway Melbourne Regional Landfill AQA R10 Low Res.docx
94 Table 6.3 Wind Erosion Emission Ratios Based on Wind Speed Wind Speed (WS) Bin (m/s) Emission Ratio WS < < WS < < WS < < WS < < WS < WS > Table 6.4 Operating Hours of the Landfill and the Major Industrial Facilities Operating in the Deer Park Area Facility Maximum Annual Operating Hours Daily Operating Hours Landfill 8, hr operations. Midnight to midnight. Existing Boral Quarry Plant Boral Asphalt Plant 3,600 6, hr operations. Midnight to midnight. 24-hr operations. Midnight to midnight. The plant operates on demand; however, hourly emission rates were estimated based on 3,600 hours/yr and were used for 24 hours a day as a conservative approach. 6.9 Sensitive Receptor Locations The locations of sensitive receptors used in the model are identified in Section 3.2 and Figure 3.1. Job ID AQU-VC Cleanaway Melbourne Regional Landfill AQA R10 Low Res.docx
95 7 MODEL RESULTS The scenarios described earlier in Table 2.2 were modelled. The results for each meteorological year are presented separately in the sections below. The base case scenario represents the existing operation (for stage A) and scenarios 1 to 4 represent future landfill stages as presented earlier in Figure 2.4. Note that the emission sources in all cases are assumed to be at the same level as the surrounding terrain. As indicated in Appendix G, the predicted ground level concentrations of odour with both in-pit and cell-top stages are lower than those predicted under this assumption when considering locations well downwind of the source. Hence, the modelling effectively represents a worst-case terrain configuration. 7.1 Odour The predicted odour concentrations are presented in this section. The results are compared to: the EPA guideline of 1 odour unit for the 99.9 th percentile of 3-minute average odour concentration (C min = 1 ou) the EPA odour risk assessment criteria, in line with SEPP AQM requirements. the NSW odour policy performance criteria, as a further point of comparison. The odour concentrations were modelled as hourly averages in AERMOD. To apply the results to the EPA guideline, the predicted hourly concentrations were converted to 3-minute average concentrations by applying the averaging time power low recommended in EPA publication 1551 as follows: c(t)/c(t0) = (t0/t) 0.2 = (60/3) 0.2 = 1.82 where: t is the averaging time (minutes) of interest (3 minutes in this case) t0 is the averaging time of model output (60 minutes in this case). For the alternative comparison against the NSW criteria, which are based on a different combination of percentile and averaging time than in Victoria, the adjustment of the hourly average involved multiplication by 2.3, the relevant peak-to-mean value for converting the values to a nose response time, taken to be approximately one second, as per the NSW policy. The NSW criteria use the 99 th percentile concentration for odour impact assessment. Based on the assumptions incorporated into the model, the model results for the scenarios described in Table 7.1 for the sensitive receptors identified in this report are summarised in Table 7.2 to Table 7.5. The model predicts generally similar results when using the five meteorological years. Contour plots of the 99.9 th percentile of 3-minute average odour concentration for each meteorological year are provided in Appendix I. The most notable odour concentrations were for Base Case 2014 (incl. Pinegro) where the highest odour concentration at the sensitive receptors is above 6 ou. The maximum odour concentration at the receptors for Base Case 2015 is 2.7 ou and for the future scenarios is 2 ou. The Base Case 2015 results show a much reduced impact with the closure of the Pinegro composting operation. The majority of receptors fall under the 1 ou criterion except for R20, R21, R22 and R25, the closest receptors to the east. The suburban areas and houses elsewhere around the site are below the threshold. Job ID AQU-VC Cleanaway Melbourne Regional Landfill AQA R10 Low Res.docx
96 Scenario 1 is closest to R1, and the results reflect this as the only receptor above the 1 ou criterion is R1. The impact is not extensive towards the west because easterly winds are rare, and so R2, which is also near the southwest of the site, is not affected significantly. R21, a receptor directly east of the landfill, is predicted to be above the 1 ou criterion for the 2010 and 2012 meteorology. Scenario 2 is to the north of R1 and R2, and it is predicted that these two receptors are above the 1 ou criterion. R20, a receptor directly east of the landfill, is predicted to be above the 1 ou criterion for the 2009, 2010 and 2012 meteorology. Scenario 3 is relatively separated from existing houses and given both separation distances and the wind regime of the area, with low frequency of easterly winds, future potential residential areas to the west are not significantly affected. As such, the predicted odour concentrations at all receptors are below the 1 ou criterion, with exception of R1. Scenario 4 shifts the focus to the north of the site. Receptor R15 is the only receptor that is predicted to be above the 1 ou criterion for all five meteorological years. R12 has predicted odour concentrations over 1 ou for four meteorological years and R16 has odour concentrations over 1 ou for the years 2009, 2011 and 2012 meteorology. R13 and R14 have predicted odour concentrations over 1 ou for the years 2010 and The significance of the results is best explained by reference to the odour risk assessment, presented in Section 8.1. Scenario Base Case 2014 (incl. Pinegro) Base Case 2015 Table 7.1: Odour Modelling Scenario Descriptions Active Cell 2L Description Meteorological Years 3,600 m² active cell + Pinegro emissions Scenario ,800 m² active tipping face Scenario Scenario 3 Scenario 3 LOW Scenario 4 Scenario 4 LOW ,800 m² active tipping face. 20% less organics ,800 m² active tipping face ,800 m² active tipping face. 30% less organics Job ID AQU-VC Cleanaway Melbourne Regional Landfill AQA R10 Low Res.docx
97 Table 7.2 Predicted C min Odour Concentrations at Identified Sensitive Receptors Base Case 2014 (incl. Pinegro) and Base Case 2015 Scenarios 3-minute Average Odour Concentrations (99.9 th percentile) Receptor Base Case 2014 (incl. Pinegro) (3,600 m²) Cell 2L Base Case 2015 (1,800 m²) Cell 2L R R R R R R R R R R R R R R R R R R R R R R R R R Maximum a a. Maximum does not include receptor 1. Job ID AQU-VC Cleanaway Melbourne Regional Landfill AQA R10 Low Res.docx
98 Table 7.3 Predicted C min Odour Concentrations at Identified Sensitive Receptors Scenarios 1 and 2 3-minute Average Odour Concentrations (99.9 th percentile) Receptor Scenario 1 (1,800 m²) Cell 1 Scenario 2 (1,800 m²) Cell R R R R R R R R R R R R R R R R R R R R R R R R R Maximum a a. Maximum does not include receptor 1. Job ID AQU-VC Cleanaway Melbourne Regional Landfill AQA R10 Low Res.docx
99 Table 7.4 Predicted C min Odour Concentrations at Identified Sensitive Receptors Scenarios 3 and 3 LOW 3-minute Average Odour Concentrations (99.9 th percentile) Receptor Scenario 3 (1,800 m²) Cell 8 Scenario 3 LOW (1,800 m², 20% Less Organics) Cell R R R R R R R R R R R R R R R R R R R R R R R R R Maximum a a. Maximum does not include receptor 1. Job ID AQU-VC Cleanaway Melbourne Regional Landfill AQA R10 Low Res.docx
100 Table 7.5 Predicted C min Odour Concentrations at Identified Sensitive Receptors Scenarios 4 and 4 LOW 3-minute Average Odour Concentrations (99.9 th percentile) Receptor Scenario 4 (1,800 m²) Cell 10 Scenario 4 LOW (1,800 m², 30% Less Organics) Cell R R R R R R R R R R R R R R R R R R R R R R R R R Maximum a a. Maximum does not include receptor 1. Job ID AQU-VC Cleanaway Melbourne Regional Landfill AQA R10 Low Res.docx
101 7.2 Particulate Matter PM10 The AERMOD results for the maximum cumulative 24-hour PM10 ground-level concentration are presented in this section. These concentrations include a background concentration of 20 µg/m 3 derived from the EPA monitoring data and the background concentration associated with the relevant key industrial facilities in the Deer Park area. The results for cumulative impacts at the selected receptors are presented in Table 7.6 for all scenarios. It shows that the PEM Mining guideline of 60 µg/m 3 for 24-hour average concentrations is not anticipated to be exceeded at any of the receptors. The highest predicted concentration is 59 µg/m 3 at R17 under Scenario 2. The updated transport conditions were qualitatively considered by scaling up the landfill emission impact at each sensitive receptor by the percent emissions increase described in Section 5.2.3, Table The qualitative assessment indicates that no sensitive receptor would exceed the maximum guideline of 60 µg/m³ for any scenario. The qualitative assessment indicates that the concentrations would decrease for Scenario 2, as the emissions were reduced based on the updated transport conditions. For Scenario 1, the ground level concentration increases, but only by about 3%, which indicates that maximum concentrations at R1 would be equivalent to the guideline value. Receptors Table 7.6 Predicted Maximum Cumulative 24-hr PM10 Concentrations at Sensitive Receptors (Background Included) Base Case Maximum 24-hr PM10 Guideline = 60 µg/m³ 2008 Meteorology 2009 Meteorology S1 S2 S3 S4 Base Case S1 S2 S3 S4 R R R R R R R R R R R R R R R R R Maximum Job ID AQU-VC Cleanaway Melbourne Regional Landfill AQA R10 Low Res.docx
102 Receptors 1 and 17 were identified as the most affected sensitive receptors for Scenarios 1 and 2, and as such, time-series plots for 24-hr average concentrations were generated for these two receptors, in accordance with Section 3.5 of the PEM Mining. The plots are presented in Figure 7.1 and Figure 7.2, which clearly show the background concentration and the contribution from the landfill and from the other key industrial facilities in the area. Overall, these figures demonstrate that the PM10 concentrations predicted at Receptors 1 and 17 are mostly well below the PEM Mining assessment criterion of 60 µg/m³. The time series plots show that there is broad peak of concentrations during the autumn period, when there tends to be a somewhat more unfavourable combination of wind conditions and surface moisture. Job ID AQU-VC Cleanaway Melbourne Regional Landfill AQA R10 Low Res.docx

 and 2009 (Bottom) Job ID 20496 AQU-VC-013-20496 90")
103 Figure 7.1: Time-Series Plot for Maximum 24-hr Average PM10 Concentrations: Receptor 1 - Scenario 1 Met Year 2008 (Top) and 2009 (Bottom) Job ID AQU-VC Cleanaway Melbourne Regional Landfill AQA R10 Low Res.docx
 and")
104 Figure 7.2: Time-Series Plot for Maximum 24-hr Average PM10 Concentrations: Receptor 17 - Scenario 2 Met Year 2008 (Top) and 2009 (Bottom) Job ID AQU-VC Cleanaway Melbourne Regional Landfill AQA R10 Low Res.docx
105 7.2.2 Dust Deposition The results for dust deposition at the selected sensitive receptors are presented in Table 7.7. The maximum predicted cumulative dust deposition arising from the sources included in the model is 0.92 g/m 2 /month. The landfill operations contribute a maximum predicted dust deposition of 0.57 g/m 2 /month, which is well below the guideline value for incremental impact of 2 g/m 2 /month. Because the predicted deposition rates are well below the guideline for incremental impact, only the Base Case scenario and the future scenarios likely to most impact the nearby sensitive receptors (i.e. Scenarios 2 and 4) were modelled using 2008 meteorological data. Table 7.7: Predicted Dust Deposition at Sensitive Receptors for Selected Scenarios Incremental Guideline = 2 g/m 2 /month Cumulative Guideline = 4 g/m 2 /month Receptors Landfill Only Including Other Modelled Sources Base Case S2 S4 Base Case S2 S4 R R R R R R R R R R R R R R R R R Maximum Job ID AQU-VC Cleanaway Melbourne Regional Landfill AQA R10 Low Res.docx
106 8 AIR QUALITY ASSESSMENT 8.1 Odour Odour Risk Assessment In line with the methodology developed for broiler chicken farms in Victoria, the recommended EPA odour risk assessment methodology was applied to the model results that are above 1 ou. The risk assessment presented here is based on the combined data from the five years of meteorological data used in the assessment. The risk assessment is only applied to the receptors predicted to be above 1 ou (3 minute average, 99 th percentile). In order to provide the best estimate of time-varying odour concentrations for application to the odour risk matrix (which needs to consider all the hourly values of predicted odour in the year), the baseline emission rates used for the active face and interim cap areas were adjusted to account for the varying effects of wind and turbulence conditions on odour emission rates, as explained in Appendix C. The adjustment took into account both theoretical considerations, allowance for model technicalities, and odour data obtained at and around the Ravenhall site. This means the values used in the risk assessment are not necessarily identical to those reported directly from the model outputs in Section 7.1. Details of the odour risk assessment are contained in Appendix C, and Table 8.1 below is a summary of the results for all receptors and all scenarios. The risk assessment for Scenario 3 and 4 also considers the potentially reduced odour emissions from reduced organic waste in landfilled material, following from the implementation of the Draft Metropolitan Waste and Resource Recovery Implementation Plan, as described in Section The most notable aspect of the risk matrix is that the Base Case 2014 (incl. Pinegro) shows elevated odour risk at all receptors. A medium risk is indicated at 23 receptors, which means that detectable odour is present for at least 3 minutes for at least 45 hours in a year and up to 175 hours of the year. This means that odour is predicted to be detectable 0.5% - 2% of the time during the year. The risk assessment does not incorporate the type of odour and its offensiveness, only that odour is detectable. To this point, not all people will respond in the same way: the percentage of people annoyed gradually increases as the frequency and/or strength of detectable odour events increases. There is no direct link between annoyance and complaints, as discussed in Section 3.7.4, but clearly as the risk level increases and a greater number of people are involved, the likelihood of complaints increases. Hence, the high level of complaints in 2014 can in part be explained by the odour risk result as presented. However, the sudden increase in complaints and the gradual decline suggest other triggers may have had an influence. The Base Case 2015 results show a much reduced impact with the closure of the Pinegro composting operation. The majority of receptors fall under the risk assessment threshold, which is 1 ou, and medium risk is confined to R20, R21, R22 and R25, the receptors to the east. The suburban areas and houses elsewhere around the site are below the threshold. Scenario 1 is closest to R1, and the results reflect this. The impact is not extensive towards the west because easterly winds are rare, and so R2, which is also near the southwest of the site, is not affected significantly. R21, a close receptor to the east, indicates a low odour risk. Scenario 2 is to the north of R1 and R2, and results in a medium risk at these receptors. R20, a close receptor to the east, indicates a low odour risk. Scenario 3 is relatively separated from existing houses and given both separation distances and the wind regime of the area, with low frequency of easterly winds, future potential residential areas to the west are not significantly affected. The risk assessment indicates no risk when considering the potential odour reduction with the removal of the organics in the waste deposited. Job ID AQU-VC Cleanaway Melbourne Regional Landfill AQA R10 Low Res.docx
107 Scenario 4 shifts the focus to the north of the site. Generally the predicted odour risks are low or negligible, except for the medium risk indicated at receptor R15. The risk drops to low if it is assumed that an expected 30% reduction in organic waste fraction has a corresponding effect on odour emissions. In all cases of identified medium risk for future scenarios, the current best practice methods are assumed to apply. However, it is expected that as site knowledge progresses and technologies advance, additional proactive measures can be identified, investigated and, if successful, applied to better manage odour risk. Longer term emission data and field observations will help to better characterise emissions and impacts. It is notable that the odour risk at specific receptors is not relevant at all times: weather conditions, and most importantly wind conditions, are key to determining whether an impact is likely to occur at any given time. This knowledge can assist in fine-tuning odour management approaches. Apart from a reduction in odour potential as organic fraction decreases, there may also be opportunity to treat some waste prior to placement as well as during placement to reduce emissions at critical times. Odour mitigation by use of neutralising agents sprayed onto waste or intercepting odour plumes is another option currently in place at the site and if longer term applications indicate that it is beneficial it would be applied as required. Receptor R1 R2 R3 Table 8.1: Summary of Odour Risk Assessment Using the Victorian EPA Methodology Base2014 (incl. Pinegro) Base2015 S1 S2 S3 S3LOW S4 S4LOW 3,600 m² 1,800 m² 1,800 m² 1,800 m² 1,800 m² 1,800 m² 1,800 m² 1,800 m² R4 R5 R6 R7 R8 R9 R10 R11 R12 R13 R14 R15 R16 R17 R18 R19 R20 R21 R22 R23 R24 R25 Blank Below risk assessment threshold, Green Low risk, Orange Medium risk, Red High Risk S3LOW 20% Reduction in organic fraction S4LOW 30% Reduction in organic fraction Job ID AQU-VC Cleanaway Melbourne Regional Landfill AQA R10 Low Res.docx
108 8.1.1 Comparative Assessment To gauge the results of the odour assessment using the Victorian framework against other well established criteria, an assessment of the odour model results has also been conducted against the NSW odour policy performance indicators. The NSW criteria are based on the 99 th percentile odour concentration expressed as a nose response time average, nominally 1 second. The criteria appear to provide satisfactory outcomes in NSW provided that valid assumptions and modelling methods are applied. Details can be found in NSW EPA (2006). The NSW criteria are set according to a risk-based scale that depends on the potentially affected population around a facility. They range from 2 ou for a large population (> 2000 people) to 7 ou for isolated rural residences. The principle is that in a larger population, the likelihood of encountering of odour-sensitive individuals is greater, hence the odour criteria need to be more stringent. The result of applying the NSW criteria is shown in Table 8.2 below. Receptor R1 R2 R3 Base2014 (incl. Pinegro) Table 8.2: Summary of Odour Assessment Using NSW Methodology Base2015 S1 S2 S3 S3LOW S4 S4LOW 3,600 m² 1,800 m² 1,800 m² 1,800 m² 1,800 m² 1,800 m² 1,800 m² 1,800 m² R4 R5 R6 R7 R8 R9 R10 R11 R12 R13 R14 R15 R16 R17 R18 R19 R20 R21 R22 R23 R24 R25 Blank Below risk assessment threshold, Yellow > 2ou (99 th percentile, Nose Response Time), Orange > 3ou (99 th percentile, Nose Response Time), Brown > 4ou (99 th percentile, Nose Response Time) S3LOW 20% Reduction in organic fraction S4LOW 30% Reduction in organic fraction Job ID AQU-VC Cleanaway Melbourne Regional Landfill AQA R10 Low Res.docx
109 Key features from Table 8.2 are that in many but not all of the cases where the Victorian criteria indicate a medium risk, the most stringent NSW criterion would be met. For example, most receptors were medium risk for Base Case 2014 (incl. Pinegro), but 17 of the 25 receptor were below the NSW risk criterion. All receptors, except R1 for scenario 2, are not associated with risk with the future landfilling operations. This result emphasises that the key impacts for future scenarios are around R Buffers and Odour Levels In relation to appropriate buffers, Section of the BPEM states: Appropriate buffer distance must be maintained between the landfill and sensitive land uses (receptors) to protect those receptors from any impacts resulting from a failure of landfill design or management or abnormal weather conditions. These failures might constitute discharge from the site of potentially explosive landfill gas, offensive odours, noise, litter and dust. Features that could be adversely affected by landfilling operations include surface waters, buildings and structures and airports. Buffer areas are not an alternative to providing appropriate management practices, but provide for contingencies that may arise with typical management practices. Buffer distances are set to reflect the potential impacts from landfilling activities. Generally, the buffers are set to manage: odour, which is of most concern during landfill operation landfill gas impacts, including the risk of explosion and/or asphyxiation. Landfill gas potential risk remains post closure and for at least 30 years post closure. For a Type 2 landfill such as MRL, a buffer of 500 metres is set out in the BEPM as the recommended distance between a building or structure and the edge of the nearest cell. Subject to an evaluation demonstrating that the environment will be protected and the amenity of the sensitive areas will not be adversely affected, the BPEM advises that lesser buffer distances may be applied subject to a risk assessment that considers design and operational measures. It is not proposed that a buffer distance smaller than 500 m be applied in this case. A minimum 500 m buffer is planned for future landfilling operations, with additional internal buffer space on the western boundary when cells north of Riding Boundary Road become active. Future operating scenarios considered in the assessment have been selected to represent the worst case for each nominated receptor. For the closer receptors such as R1 in particular, the main impact is from activities when closest to the receptor. However the active face moves quite rapidly and hence the worst case impacts will occur over a limited period or periods at any receptor. It is relevant to note, however, that regardless of the current or proposed operation of the landfill, the cessation of the emissions from the Pinegro facility is shown to have had a large effect on the odour impacts in the surrounding area. 8.2 Particulate Matter The model results for PM10 and nuisance dust indicate that with the management practices assumed, and model parameters used, off-site 24-hour average concentrations will be within the PEM mining assessment criterion of 60 µg/m 3 at the identified sensitive receptors for all scenarios. Dust emissions from the landfill operation have been included along with emissions from other activities on the total site (e.g., quarry operations, asphalt plant) as well as background sources as estimated from Deer Park EPA monitoring data. Job ID AQU-VC Cleanaway Melbourne Regional Landfill AQA R10 Low Res.docx
110 9 CONCLUSIONS 9.1 Impacts The assessment has focused on odour, PM10 and nuisance dust in accordance with the BPEM and in consultation with EPA. The assessment has been performed using conservative assumptions around odour emission rates, total areas of odour sources, and location of emission sources. The dispersion model results have been interpreted using the conservative requirements by the EPA which results in an assessment that considers the worst case odour impacts and worst case interpretation of the impacts. This ensures the assessment highlights all possible risks associated with air quality and the operation of the landfill. Operation of the landfill results in odour and dust emissions that have the potential to cause amenity impacts if they are not adequately controlled. Odour, while not necessarily offensive, is sometimes detectable off site, especially when the active cell is close to the Ravenhall Site boundary. The degree to which odour impacts are likely to occur in the future operation of the Ravenhall Site is the key item in this assessment. Observations at the Ravenhall Site and in the surrounding area on multiple occasions in 2014 and 2015 indicate that odour levels off site in the recent past have been consistent with what might be expected for a large landfill receiving putrescible wastes. A series of observations was made around the Ravenhall Site before the acquisition of the landfill business by Cleanaway. At that time, some practices on site were different from those that have now been put in place. Practices introduced by Landfill Ops are likely to have reduced the potential for odour emissions. This applies both to routine emissions, e.g., from the active face and capped cells, and to intermittent emissions, e.g., from failures in LFG capture system integrity or from engineering activity that involves disturbance of buried waste. A major issue with the landfill in the past two to three years in particular has been community perception of odour impacts. A sudden and very large surge in complaints received by EPA occurred in early 2014 and persisted for some months. Complaint levels have now returned to the low levels that are consistent with a pattern that prevailed before the surge in complaints. The 2014 surge in complaints appears to have been triggered by changes in community perception created by events related to announcements by Boral (previous operator of the landfill) about the future of the Ravenhall Site, and/or by other related factors in the community. Regardless of the triggers, this increase in complaints was remarkable. Details of complaints records show that the landfill was perceived to be the principal source of the odour being complained about. It should be noted that before and after the change in complaint levels, odour levels in the area may not have changed appreciably (although now the emissions have substantially reduced largely as a result of the closure of the Pinegro green waste composting operation within the Ravenhall Site). The occurrence of complaints and the fact that our analysis of them made sense from a scientific point of view means that odours were almost undoubtedly present. Before the level of awareness of odour was raised in the community, the odour impact was broadly tolerated to the extent that there were few complaints. This is not an uncommon situation and is acceptable. Analysis of EPA complaints data from July 2013 to September 2014 shows that the Pinegro composting odours were very likely to have been the dominant cause of odour that triggered complaints about the Deer Park Landfill odour in nearby suburbs over that period. The landfill is unlikely to have been a significant cause of complaints in those suburbs (even though it was perceived as the source). However, prior to June 2014 landfill gas odours were reported to have been detected in Derrimut and Deer Park. Action by Boral in response to a PAN issued by EPA in April 2014 rectified fugitive emissions from the LFG collection system. Observations in the field in 2014 confirmed that the downwind extent and intensity of the detectable odour from the landfill operations were considerably less than from the adjacent Pinegro operation. Job ID AQU-VC Cleanaway Melbourne Regional Landfill AQA R10 Low Res.docx
111 After Pinegro had responded to an EPA PAN notice in mid-2014, field observations suggested that the odour had changed to some extent in character and was less offensive, but the distances that it was detected downwind remained similar. Modelling of the Base Case 2014 (incl. Pinegro) for this assessment used estimates of odour emissions for the Pinegro facility and from the recent landfill operations, including site-specific data for the landfill. The results for the Base Case 2014 (incl. Pinegro) show that the contribution of the Pinegro facility to odour levels in the surrounding area was clearly larger than that of the landfill. Odour risk as determined using the EPA methodology indicate there was a medium risk at all of the receptors identified for the study. With the cessation if Pinegro operations, as reflected in the Base Case 2015 results, the odour risk throughout the area is substantially reduced to low or negligible at all but three of the closest receptors to the east. On our current understanding of the landfill emissions and field observations of odour downwind of the landfill (Section 3.6), the model results are broadly consistent with field experience and other evidence. Modelling of future scenarios for landfill operation has been conducted on the assumption that a high standard of odour management will be in place. This is dictated by the BPEM and would be expected to be reflected in approval and licence conditions. Application of the EPA odour risk assessment methodology indicates a medium risk of odour impacts at some receptors under most scenarios. Medium risks are predicted for all scenarios except Scenario 3 and Scenario 4 Low. The Low scenarios assume an expected reduction in organic fraction and an assumed parallel reduction in odour emissions. It is expected that as site knowledge progresses and technologies advance, additional proactive measures can be identified, investigated and, if successful, applied to better manage odour risk. The design and management of a landfill plays an extremely important role in odour emissions. The difference in odour impacts from a poorly managed landfill and a best practice operation is very significant. Minimising the opportunity for odour emissions requires attention to all of the significant potential odour sources, most particularly: the active face by minimising the area of newly placed waste that is exposed to the atmosphere on a continuous basis, and ensuring that there is adequate daily cover to minimise emissions the active cell (apart from the active face) - by ensuring an adequate interim cap is in place and that active LFG capture is installed as soon as possible, using a sacrificial horizontal collection system. completed cells by having in place an effective final cap, an efficient active LFG gas collection system and an effective monitoring and maintenance program to ensure no significant fugitive emissions. A vegetated cover will also help to reduce the potential for emissions through the surface. leachate by minimising the generation of leachate by ensuring maximum integrity of cells by minimising water infiltration, ensuring that any exposed leachate storage is located well away from sensitive locations, and monitoring of leachate condition and emissions. site works by avoiding disturbance of previously placed waste, e.g., in developing or modifying the LFG capture system, when there is a risk that odour emissions will impact on sensitive locations. The effectiveness of improving odour management at landfills has been seen at other landfills. For example, at the Brisbane Landfill in Queensland, a major odour problem in the 1990s affecting the local community at Rochedale was significantly reduced by implementing an exhaustive set of Job ID AQU-VC Cleanaway Melbourne Regional Landfill AQA R10 Low Res.docx
112 improvements to site operations and monitoring. The final management program resulted from a mediation process involving multiple odour experts from Queensland, NSW and Victoria. The practices imposed at that time are now routine best practice measures for landfills, generally in line with the BPEM requirements. The current and proposed operations at MRL are operated by Landfill Ops in line with current best practice methods. One of the key issues in improving odour management is the ability to monitor and identify potential problems early and act quickly to rectify them. Improvements in monitoring and management technologies are occurring rapidly and it is expected that future operations will benefit from technologies and practices that may not yet exist or are not well developed. For example, electronic nose technologies and other advanced gas sensors, remote sensing of gas leaks and realtime/predictive management systems are all in existence and evolving continually. In relation to dust, predicted cumulative concentrations and dust deposition rates are within the relevant guidelines. Emissions from the landfill occur in a context where quarry and other operations on the Boral land also emit dust. Short-term campaign monitoring of PM10 at the Ravenhall Site boundaries showed that concentrations are not excessive, and are broadly in line with expectations from the modelling. The contribution of sources other than landfill operations in the surrounding area is significant. Haul roads are a major part of the emission inventory for the landfill, and these sources are subject to regular watering to control dust emissions. 9.2 Management Plan Landfill Ops presently operates the landfill to control odour and dust emissions in accordance with its EPA Licence and associated plans and guidelines. The specific conditions of the Licence in relation to odour and dust are: LI_A1 Offensive odours must not be discharged beyond the boundaries of the premises. LI_A4 Nuisance airborne particles must not be discharged beyond the boundaries of the premises. LI_L4 Waters contaminated by leachate must not be discharged beyond the boundaries of the premises L1_L5 You must prevent emissions of landfill gas from exceeding the investigation levels specified in Best Practice Environmental Management, Siting, Design, Operation and Rehabilitation of Landfills (EPA Publication 788). L1_L3 By the end of each day's operations waste must be covered with a layer of soil at least 0.30 metres thick or using another method of cover approved by EPA. LI_L6 You must progressively rehabilitate landfill cells in accordance with Best Practice Environmental Management, Siting, Design, Operation and Rehabilitation of Landfills (EPA Publication 788). For the ongoing management of the landfill operations, the key objectives of the BPEM for air quality are: no health, safety or environmental impacts due to landfill gas and dust minimise greenhouse gas emissions prevent offsite nuisance odours and dust meet requirements of relevant SEPP and waste management policies. Job ID AQU-VC Cleanaway Melbourne Regional Landfill AQA R10 Low Res.docx
113 Specifically, these objectives have been translated into an ongoing program designed to comply with the BPEM objectives and specific guidance on active management for odour control, cell rehabilitation, LFG management, monitoring and complaints management. A Landfill Gas Management Plan has been developed for the MRL Extension to meet these requirements and is presented in the Works Approval application. It is not recommended to monitor dust emissions as the dispersion modelling indicates the PEM Mining guideline is not likely to be exceeded at the sensitive receptors during the MRL extension. Measures to improve on current best practice will be investigated so that where and when predicted impacts exceed the nuisance threshold, best possible site management is implemented proactively. Best practice is not a static benchmark and will shift over time as technologies enable routine use of improved methods. These steps might include the implementation of automated monitoring systems and contingency measures based on predicted and measured environmental and operating conditions that are associated with a high risk of worst case impacts. Emerging technologies enabling such improvements are coming into wider use and in the period between now and the future scenarios when impacts at existing receptors become higher it will be possible to investigate the feasibility of such options. Job ID AQU-VC Cleanaway Melbourne Regional Landfill AQA R10 Low Res.docx
114 10 REFERENCES AERMIC (1995), Formulation of the AERMIC MODEL (AERMOD) (Draft), Regulatory Docket AQM-95-01, AMS/EPA Regulatory Model Improvement Committee (AERMIC). Baker & McKenzie (2013), Resource Recovery Facility Gerogery Odour Impact Assessment, prepared in August CER (2014), National Greenhouse and Energy Reporting System Measurement Technical Guidelines for the estimation of greenhouse gas emissions by facilities in Australia, Clean Energy Regulators, Commonwealth of Australia, July Cimorelli, A.J., Perry, S.G., Lee, R.F., Paine, R.J., Venkatram, A. and Weil, J.C. (1996), Current Progress in the AERMIC Model Development Program. US EPA Publication No. 96-TP24B.04. DEWHA (2008), National Pollutant Inventory Emission Estimation Technique Manual for Combustion in Boilers 3.1, Department of the Environment, Water, Heritage and the Arts, Canberra, Australia. DEWHA (2008), National Pollutant Inventory Emission Estimation Technique Manual for Combustion Engines 3.0, Department of the Environment, Water, Heritage and the Arts, Canberra, Australia. DEWHA (2008), National Pollutant Inventory Emission Estimation Technique Manual for Fuel and Organic Liquid Storage, Version 3.1, Department of the Environment, Water, Heritage and the Arts, Canberra, Australia. Environment Australia, (1999c), Emission Estimation Technique Manual for Surface Coating, Environment Australia, Canberra, Australia. Environment Australia (2001), National Pollutant Inventory Emission Estimation Technique Manual for Mining Version 2.3, Environment Australia, Canberra, Australia. EPA (2015), Draft Odour Environmental Risk Assessment for Victorian Broiler Farms. GHD (2013), Wests Road RDF Expansion Cell 4C - Odour Dispersion Modelling Assessment to Support Works Approval Assessment, prepared by GHD in October Golder, D. (1972), Relations among stability parameters in the surface layer, Boundary Layer Meteorology 3, Golder Associates (2012), Hanson Landfill and Quarry Risk Assessment, Report Number , 31 October Golder Associates (2016), Works Approval Figures MRL Works Approval, Vic, Technical Memorandum Reference no , February Golder Associates (2016b), Landfill Gas Management Plan, Melbourne Regional Landfill, Ravenhall VIC. Report prepared for: Landfill Operations Pty Ltd. Report Number , February GTA Consultants (2016), Hopkins Road, Truganina & Christies Road, Ravenhall Transport Impact Assessment, Prepared for Landfill Operations Pty Ltd, Reference number 15M , February Job ID AQU-VC Cleanaway Melbourne Regional Landfill AQA R10 Low Res.docx
115 Holmes Air Sciences (2007), Air Quality Assessment: Proposed Sita Advanced Waste Treatment Facility, Elizabeth Drive, Kemps Creek, prepared on 11 October NSW EPA (2006), Assessment and management of odour from stationary sources in NSW Technical framework. Department of Environment and Conservation, Sydney. ISBN OdourNet UK Ltd (2002), Assessment of Community Response to Odorous Emissions. Bristol UK. Ormerod, R., et al. (2002), Report to the Queensland EPA, Notice to Conduct or Commission an Environmental Evaluation (Investigation), EPA reference GC0008/GLT14, Served on Queensland Alumina Ltd (QAL). Ormerod, R. J., et al. (2003), Variations in community responses to odour: implications for policy and management. CASN03 Clean Air Conference. Newcastle NSW Australia, Clean Air Society of Australia & New Zealand. Perry, S. et al., (2005), AERMOD: A Dispersion Model for Industrial Source Applications. Part II: Model Performance against 17 Field Study Databases. Journal of Applied Meteorology, 44(5): Pacific Environment (2015), 8948 Boral Deer Park Quarry Plant AQ Assessment R1.4, prepared by Pacific Environment on 24/04/15. UNSD (2014), Millennium Development Goals, targets and indicators 2013 statistical table, United Nations Statistics Division, US EPA (1985), Compilation of Air Pollutant Emission Factors, AP-42, Fifth Edition, Volume 1: Chapter General Industrial Surface Coating, United Stated Environmental Protection Agency, Research Triangle Park, NC, USA. US EPA (1997), Compilation of Air Pollutant Emission Factors, Volume 1: Stationary Point and Area Sources, AP-42, Chapter 7.1, Organic Liquid Storage Tanks, United States Environmental Protection Agency, Office of Air Quality Planning and Standards. US EPA (2000), TANKS Emissions Estimation Software, TANKS 4.09, United Stated Environmental Protection Agency, Research Triangle Park, NC, USA. US EPA (2002), User s Guide For The AMS/EPA Regulatory Model. AERMOD, U.S. Environmental Protection Agency, Draft - 08/10/02. US EPA (2005), Appendix W to Part 51-Guideline on Air Quality Models, United States Environmental Protection Agency, 40 CFR. ( US EPA (2006a), Emissions factors & AP 42, Compilation of Air Pollutant Emissions Factors, Chapter Industrial Wind Erosion, United States Environmental Protection Agency, November US EPA (2006b), Emissions factors & AP 42, Compilation of Air Pollutant Emissions Factors, Chapter Unpaved Roads, United States Environmental Protection Agency, November US EPA (2006c), Emissions factors & AP 42, Compilation of Air Pollutant Emissions Factors, Chapter Aggregate Handling and Storage Piles, United States Environmental Protection Agency, November Van Harreveld, A. P. (2001), "From odorant formation to odour nuisance: new definitions for discussing a complex process." Water science and technology 44(9): Job ID AQU-VC Cleanaway Melbourne Regional Landfill AQA R10 Low Res.docx
116 Appendix A GLOSSARY Job ID AQU-VC A Cleanaway Melbourne Regional Landfill AQA R10 Low Res.docx
117 GLOSSARY Term BPEM Cleanaway CBD CH4 CO2 Detection threshold Dynamic olfactometer Ddynamic olfactometry Emission rate Fugitive source Global Warming Potential L Landfill Ops LFG MOST MRL N2O NEPM Neutral gas NGA NGER Odorant Odorous gas Odour Odour concentration Meaning Best Practice Environmental Management (BPEM) Siting, Design, Operation and Rehabilitation of Landfills. EPA Publication 788.3, August 2015 Cleanaway Waste Management Ltd. Owns Landfill Ops. Central Business District Methane Carbon dioxide a) the odorant concentration that has a 50% probability of being detected under the conditions of the test or b) the dilution factor at which the sample has a 50% probability of being detected under the conditions of the test. A device that delivers a flow of mixtures of odorous and neutral gas with known dilution factors to a common outlet. Odour measurement using a dynamic olfactometer to deliver controlled odour mixtures to a group of panellists. The rate at which a substance is released from a source into the atmosphere, expressed as a mass or odour volume per unit of time; e.g. grams per second (particles), odour.volume per second (odour). An emission source that does not have a controlled or defined outlet, such as emissions from an open area source, or leakage from an engineered system. A relative measure of how much heat a greenhouse gas traps in the atmosphere. It compares the amount of heat trapped by a certain mass of the gas in question to the amount of heat trapped by a similar mass of carbon dioxide. A GWP is calculated over a specific time interval, commonly 20, 100 or 500 years. GWP is expressed as a factor of carbon dioxide (whose GWP is standardised to 1). For example, the 20 year GWP of methane is 86, which means that if the same mass of methane and carbon dioxide were introduced into the atmosphere, that methane will trap 86 times more heat than the carbon dioxide over the next 20 years. Monin-Obukhov length, an indicator of atmospheric stability. Cleanaway Waste Management Ltd. Operates the Melbourne Regional Landfill. Landfill gas: a mixture of methane, carbon dioxide and trace gases including various odorants. Monin-Obukhov Similarity Theory, a framework for describing the behaviour of the planetary boundary layer Melbourne Regional Landfill Nitrous oxide National Environmental Protection Measure In olfactometry, a gas that is treated in such a way that it is as odourless as possible National Greenhouse Accounts National Greenhouse and Energy Reporting A substance that is capable of stimulating an odour response Gas that contains odorants A sensation caused by the interaction of certain volatile substances (odorants) with the olfactory system The strength of an odour relative to its detection threshold, measured as a ratio and expressed in odour units. It is determined by dynamic Job ID AQU-VC A-2 Appendix A Glossary.docx
118 Term Odour intensity Odour unit PAN Particulate matter PM10 PBL Putrescible Ravenhall Site Recognition threshold Sensitive receptor Sensory odour evaluation SEPP SEPP AAQ SEPP AQM VDI VOC Meaning olfactometry and has a direct relationship to the concentrations of odorant substances in the sample. The perceived, subjective strength of an odour. Intensity does not have a direct relationship to the odorant concentration, and is a logarithmic function of the odour concentration. The standard unit of odour measurement, representing the number of dilutions required to dilute the sample of odour to its threshold concentration (equivalent to 1 odour unit). Pollution Abatement Notice Particles Particulate matter with aerodynamic diameter less than 10 µm. These particles can remain suspended in the air for long periods and do not settle out significantly over distances involved in this assessment. Planetary boundary layer: the lower level of the atmosphere typically in the order of 1 km where the effects of the earth's surface on turbulence and heating are important in the dispersion of pollutants. Liable to decompose and generate odour Hopkins Road, Truganina and Christies Road, Ravenhall The concentration at which an odour has a 50% probability of being recognised under the conditions of the test. Normally taken to be a fixed building or installation where odour annoyance may occur, such as a residence, school, hospital, etc. To identify and record odours detected based on the observer's sense of smell State Environment Protection Policy State Environment Protection Policy Ambient Air Quality State Environment Protection Policy Air Quality Management Verein Deutscher Ingenieure, or Association of German Engineers Volatile organic compound: an organic substance that will readily evaporate into a gas phase. Job ID AQU-VC A-3 Appendix A Glossary.docx
119 Appendix B PAPERS ON ODOUR INTENSITY Job ID AQU-VC B Cleanaway Melbourne Regional Landfill AQA R10 Low Res.docx
120
121
122
123
124
125
126

127
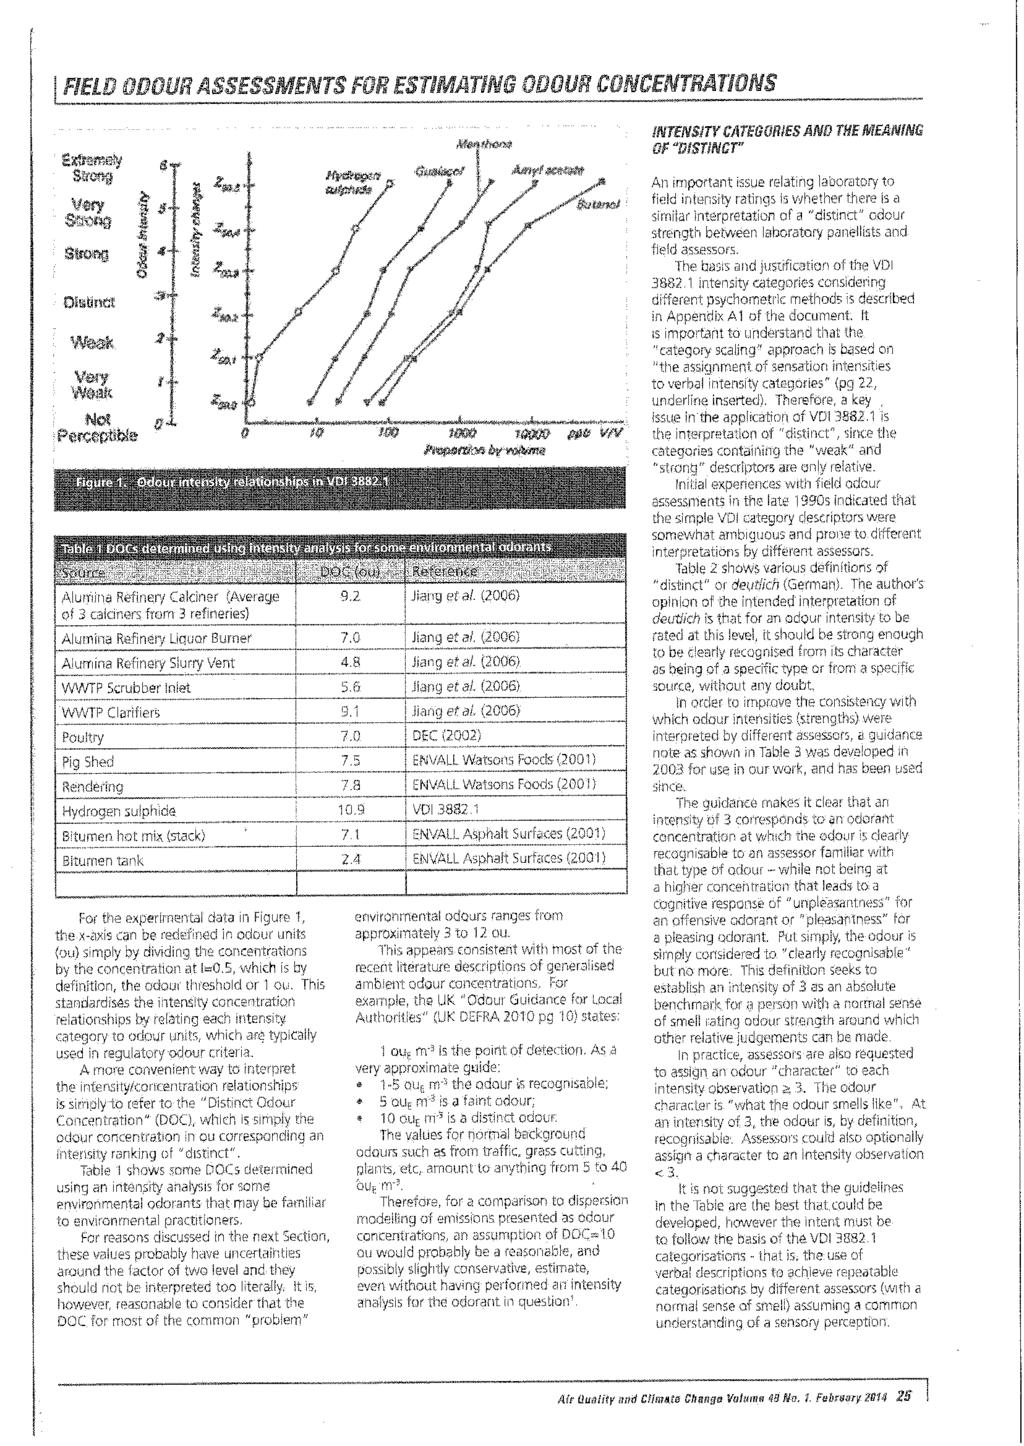
128
129

130
131
132
133
134
135
136 Appendix C SITE-SPECIFIC ODOUR OBSERVATIONS AND EMISSION RATES Job ID AQU-VC C Cleanaway Melbourne Regional Landfill AQA R10 Low Res.docx
137 C.1 INTRODUCTION Field observations of odour around the Ravenhall site were conducted in June and October 2014, and late The observations in June 2014 were conducted at a time when Boral operated the landfill and the Pinegro facility had received a Pollution Abatement Notice (PAN) from EPA and was apparently in the process of addressing the requirements of the PAN. The October 2014 observations were conducted after the PAN requirements had been addressed but Pinegro was still operating. The October-December 2015 observations, after closure of Pinegro and transfer of operations to Cleanaway, included a combination of targeted source sampling on site and field observations of odour intensity on and downwind of the landfill site. One of the key objectives of the observations and sampling was to derive or validate odour emission rates for the odour assessment. A summary of data gathered is as follows: Downwind odour intensity observations in June 2014, October 2014, October 2015 and 30 November- 1 December 2015 Source-specific measurements by Ektimo using flux hood sampling on final capped cell (Cell 1) adjacent to Riding Boundary Road and interim capped areas in the south-east of the site, as well as parts of active cell 2M with recently placed but covered Source-specific transect samples gathered by Ektimo downwind of the active face under operating conditions Supplementary on-site odour intensity observations by Pacific Environment staff during the Ektimo sampling campaign. Before discussing the results of these activities, it is relevant to identify some practical issues with emission rates from area sources such as landfills. C.2 AERODYNAMIC INFLUENCES ON EMISSION RATES AND IMPLICATIONS FOR SAMPLING AND EMISSION RATE ESTIMATION Most or all of the odour emitted from landfill sites is from surface-based area sources. Odour emitted from the surface is generated in putrescible material at and beneath the surface (from where odorant molecules can migrate to the surface). The landfill surface is the interface with the atmosphere above and across this interface, odorant molecules are transferred from the surface to the air by processes that are described by mass transfer theory. Mass transfer theory and experimental data demonstrate that emissions of gaseous compounds from area sources are influenced by conditions on both sides of the interface between the emission source and the atmosphere. A two-film transfer model is often used to describe the mass transfer process in terms of resistances in the gaseous and aqueous phases. The degree to which flow conditions on the atmospheric side control the emission rate of a specific compound can be related to Henry s Law, which identifies gas-phase and liquid-phase controlled compounds (Hudson and Ayoko, 2008a). Compounds commonly associated with odours from putrescible wastes are moderately to strongly gasphase controlled (Parker et al., 2009, Parker et al., 2012, Koziel et al., 2006). This implies that the emission rate is strongly influenced by flow conditions in the atmospheric boundary layer overlying the emitting surface, and this has been demonstrated (Hudson and Ayoko, 2009, Hudson et al., 2009). Note that although a landfill surface is not obviously aqueous, the behaviour of organic compounds associated with odour is influenced by moisture content and it is via the medium of moisture in the waste and soil that the relevant mass transfer and storage is most effective. An exception is where there are cracks in the landfill cap that can provide a direct escape route for LFG, a situation that is well controlled in a suitably managed landfill cell where best practice measures are in place. Job ID AQU-VC C-2 Appendix C - Field Observations and Emission Rates.docx
138 Mass transfer coefficients increase as both wind speed and turbulence increase (Gualtieri, 2006) and are related to friction velocity (Santos et al., 2012). Friction velocity is not measurable directly. More convenient factors in the atmospheric boundary layer that affect mass transfer are the vertical profiles of wind speed and turbulence intensity or stability (Scholtz et al., 2002, Bajwa et al., 2006, Rumburg et al., 2008a, Blunden et al., 2008, Chao, 2009, Rong et al., 2010, Saha, 2011, Santos et al., 2012, Hafner et al., 2012, Mahrt and Ek, 1984). Temperature and, at least under some circumstances, atmospheric relative humidity, exert some influence on emissions (Parker et al., 2012, Parker et al., 2009), and the emission of LFG through a cell surface (but not other sources of odour) is also influenced by changes in atmospheric pressure. Fetch, the length of an emitting surface traversed by air flow, is a significant factor in boundary layer formation, affecting mass transfer and emission estimation (Baum et al., 2008, Kaye and Jiang, 2000a). For example, Parker et al. (2012) demonstrated in the laboratory that the area of a sampled emission source had a direct effect on the calculated emission rate. However, the major controlling factors are wind speed and turbulence (or stability). Many studies have presented data that clearly reflect the influence of airflow over an emitting surface. Studies have shown the clear relationships between varying flow speed and emissions in controlled laboratory experiments, and there are many studies that have indicated a major difference in emissions from area sources as determined by different sampling methods, particularly isolation flux hoods versus wind tunnels. A smaller number of studies have determined emission rates from back-calculation of either odour sampled near an area source and measured by dynamic olfactometry, or further downwind using VDI 3882 type odour intensity observations (see section C.4.1) and back-calculation with dispersion models. Emission rates at MRL must vary with wind speed and turbulence in order to make sense of both the observations and theory. Emission rates are lowest under very light wind, stable conditions and are highest under very windy conditions. Isolation flux hoods simulate the former set of conditions to a useful approximation, and wind tunnels, which operate with a higher flow rate of air, simulate higher wind speed conditions, typical of conditions that often occur during the daytime. Back-calculation from downwind transects or intensity observations can span the complete range of conditions potentially associated with field observations and can return vastly different values accordingly. Importantly, for odour modelling of areas sources to be representative, emission rates from area sources must be related (as a minimum) to wind speed and stability (or turbulence) conditions. This requirement applies particularly to modelling for assessments that need estimates of odour concentration for all hours of the year, such as the EPA odour risk assessment method, which considers the number of hours per year when odour concentration reaches above certain thresholds. On the other hand, if the objective is to predict only the 99.9 th percentile value from an annual or longer dataset, it is often sufficient to assume that the emission rate, which relates only to light wind stable conditions (e.g., flux hood data), will suffice for all hours since in most situations light wind, stable conditions will determine the outcome regardless of how the lower-order percentile values might be changed by introducing aerodynamic adjustments. For the MRL odour assessment, in line with the EPA odour risk assessment method, the more comprehensive approach using all hourly data and hence, weather-dependent emission rates, is required. Because little research has been done to explore time-varying odour emission rates from area sources outside the laboratory, there is no universal dataset that describes the relationships between atmospheric conditions and emission rates for landfills. Hence for this study, a combination of observed estimates and theory was used to derive a simple model of time-varying emissions for the Ravenhall site to scale or adjust the raw model results that were based on constant, baseline flux rates. The scaling model was derived from dispersion model estimates of emission rates using site-specific observational data and provides a good (but somewhat conservative) fit to the set of data available. More details are presented in section C Job ID AQU-VC C-3 Appendix C - Field Observations and Emission Rates.docx
139 The basic form of the scaling algorithm is given below: OERa = (A. U p ).OERu (Equation 1) Where: OERa is the odour emission rate (or flux rate if applied to a unit area of source) adjusted to account for the effect of wind speed and turbulence on the odour flux/emission A is a transfer coefficient related to stability or turbulence U is wind speed at 10 m p is an exponent (typically 0.5 to 0.8, based on available research) OERu is the odour emission rate (or flux rate if applied to a unit area of source) based on the baseline flux rates applicable under stable conditions with 1 m/s wind. Equation 1 follows a general relationship described, for example, by Mahrt & Ek (1984) but in a simplified form here. The back-calculations necessary to derive OERs from downwind observations and the Ektimo transect measurements were based on AUSPLUME, which although now superseded by AERMOD for general regulatory modelling purposes in Victoria, is practically more straightforward to use and is adequate for the purposes of such an exercise. It has the advantage in this circumstance of using the Pasquill-Gifford (P-G) stability categories, which were derived from observations of dispersion from surface sources over distances of roughly 1 km, which are consistent with the nature of the plumes and observations in this case. The P-G classes are readily estimated from relatively simple field observations and measurements, e.g., using guidance such as that set out by Pasquill (1961) or Turner (1994). Any differences in estimates derived from AUSPLUME and AERMOD are small compared to other sources of uncertainty in the estimation process. For model back-calculations, observations of field conditions were based on a combination of on-site weather station data, as well as portable anemometer and observations of sky conditions. These observations were used to provide estimates of wind speed (adjusted to 10 m height, as is the usual basis for modelling) and P-G stability category for inclusion in the model for each case calculation. The P-G scheme is a relatively simple basis for categorising stability to a reasonable approximation (noting that all data for this type of exercise are by necessity approximate). The coefficient A in Equation 1 is a turbulence-related term, which has a significant influence on the estimated emission rate. Values for this term were obtained from data presented by Luna & Church (1972), relating vertical and lateral turbulence intensities to P-G stability category. Values for vertical and lateral components were multiplied to form a single set of values to indicate the overall relative turbulence intensity by P-G class, as per Table C.1 below. The products were scaled so the baseline condition (class F) is set to 1. Pasquill-Gifford Stability Class Table C.1 Turbulence coefficient A for Equation 1 Description Coefficient A A Highly unstable 49 B Moderately unstable 27 C Slightly unstable 10 D Neutral 4.4 E Slightly stable 2.3 F Strongly stable 1.0 Job ID AQU-VC C-4 Appendix C - Field Observations and Emission Rates.docx
140 On this basis, quantitative estimates of downwind odour concentration based on odour intensity observations were entered into the model, along with the corresponding stability class and wind speed estimates for the observation, and baseline emission rates using the estimated source configurations at the time of the observations. Baseline emission or flux rates are explained further in section C.3 and in particular section C.3.3. These rates occur under the baseline condition of a wind speed 1 m/s and stability category F (highly stable, corresponding to A = 1). The ratio between the observed odour concentration and the concentration estimated from the baseline emission rate was calculated and compared to the value obtained by using Equation 1. These results are presented in section C Baseline emission rates were assumed to be adequately represented by data from isolation flux hood sampling. Generally in odour modelling it is evident that this is a good working assumption. C.3 SITE-SPECIFIC SOURCE SAMPLING Odour sampling on site was conducted by Ektimo Pty Ltd on 30 November and 1 December 2015, in order to provide site-specific data on odour emission rates from the active face, interim capping and final capping. The Ektimo sampling and results are described in the Ektimo report R (section C.6), so only key aspects are discussed in this section. Sampling with an isolation flux hood was conducted on Cell 1, an old completed cell with final capping, and on areas with interim capping to the east of current activities on Cell 2M, as well as on areas of recently placed but covered waste in the active cell 2M. Cleanaway personnel described the interim capping on old cells to the east of 2M as not necessarily being to the same standards that are now applied and that will apply into the future. Site-specific sampling of the active face was based on a downwind transect method, and is described further in section C.3.3. C.3.1 Final cap The samples for the final cap also included a control sample taken on a normal soil surface on the northern side of Riding Boundary Road where has been no landfilling activity. The 4 samples collected on Cell returned values between 0.03 and 0.05 ou/m 2 /s (1.9 and 3 ou/m 2 /min), averaging 0.04 ou/m 2 /s. The control soil sample returned a value of 0.04 ou/m 2 /s and so it is concluded that there was no effective difference between the final cap surface and a natural soil surface in terms of odour emission. This site-specific data supports the assumption that a final cap should not be treated as an odour emission source, provided that is it suitably managed in line with BPEM landfills requirements for best practice control of LFG emissions. C.3.2 Interim cap Results of sampling from areas described as interim cap are summarised in Table C.2. Job ID AQU-VC C-5 Appendix C - Field Observations and Emission Rates.docx
141 Ektimo Sample ID No. Flux Rate (ou/m 2 /s) Table C.2: Interim Cap Sample Results Comments (based on information from Cleanaway) Completed cell but not yet final capped Completed cell but not yet final capped Completed cell but not yet final capped Value indicates likely cap or LFG collection integrity issue in past filled area Value indicates likely cap or LFG collection integrity issue in past filled area Recently filled and covered area of cell 2M, no sacrificial LFG collection in place Recently filled and covered area of cell 2M, no sacrificial LFG collection in place Recently filled and covered area of cell 2M, no sacrificial LFG collection in place. There is a substantial range of values in these samples, reflecting variations in the type of surface and the treatment of the cap and gas collection systems historically. The lower values are likely to be more reflective of a well-managed interim cap with sacrificial LFG collection and a consistent cap depth with good integrity. LFG collection systems are typically expected to be 75% effective in gas collection although well managed systems can achieve considerably better efficiency. The highest value of 0.35 ou/m²/s is likely due to inadequate capping and is not considered to represent typical interim capping conditions. This value was not considered in determining the Base Case interim capped emission rate. Dispersion modelling of interim capped areas is based on a flux rate of 0.08 ou/m 2 /s, which is about 45% of the average for the values listed in Table C.2. This value takes into account advice from Cleanaway about past and future practices, and allows for 50-75% improvement in future interim cap performance as a result of more consistent cap quality and instigation of sacrificial horizontal gas collection. C.3.3 Active face The active face transect samples are described in the Ektimo report R The calculated total emission rate from the active face in R is simply calculated as the product of the average of the odour concentration sampled across the transect and the wind speed through an assumed rectangular cross-section 15 m high at a distance of 70 m downwind from the active face. The average emission rate determined from the sampling was 380,000 ou/s or approximately 150 ou/m 2 /s. Conditions at the time are estimated to have been P-G class C with a 10 m wind speed of approximately 4 m/s. Given that emission rates vary in line with the wind speed and turbulence, it is necessary to review the estimated emission rates as presented in the Ektimo report and place them in the framework of timevarying emissions. Without adjusting these reported values, a model would predict detectable odours from the landfill at distances of well over 100 km, which is unrealistic, so adjustments must be made for realistic modelling. There are two aspects of the raw emission estimate that must be considered initially: the vertical profile of odour concentration 70 m downwind under the conditions of the sampling, and the contribution to the sample of other odours, specifically from the surface of the cell. The estimated vertical profile of odour, obtained from AUSPLUME, is presented as Figure C.1. With samples taken at approximately 1 m above ground level, the assumption of a constant vertical profile Job ID AQU-VC C-6 Appendix C - Field Observations and Emission Rates.docx
142 leads to over-estimation of the emission rate. From the profile data, a correction factor of 0.59 was calculated to account for the vertical profile. Given the geometry of the sampling position and the nature of the odour sources, it is likely that some contribution to the measured odour came from the surfaces around the active face itself, but still in the active cell area. Applying the reported values for interim cap emissions to the active cell in combination with the active face, a further correction factor of 0.84 was obtained from the model results. Hence, a combined correction factor that accounts for the concentration vertical profile and other source contributions is 0.59 x 0.84, which equals 0.5. Figure C.1: Vertical Profile of Odour Concentration from Active Face at 70 m Downwind A final correction was necessary in order to adjust the observed emission rate to one that represents the baseline set of conditions, class F stability and wind speed 1 m/s (at 10 m). From this basis, all model results can be adjusted as necessary according to wind and stability conditions. The estimated conditions applying were P-G class C (slightly unstable) and 10 m wind speed 4 m/s. From Equation 1 the emission rate under these conditions is estimated to be 23 times higher than under class F, 1 m/s (the baseline). Hence, the adjustment factor for these conditions is 1/23. Then, applying the 3 correction factors; vertical profile of 0.59, other sources of 0.84 and Equation 1 of yields a correction factor for the original estimate of Given that at the time of the observations, it is estimated that the active face area was approximately 2500 m 2, the estimated baseline odour flux rate for the active face is approximately 3.3 ou/m 2 /s. Job ID AQU-VC C-7 Appendix C - Field Observations and Emission Rates.docx
143 C.4 ODOUR INTENSITY OBSERVATIONS AND CONCENTRATION ESTIMATION C.4.1 Background to Method The field activities included a number of structured odour intensity observations, which are explained below. There were also less formally structured observations to determine whether or not odour was present and, if so, the character and likely source of the odour based on odour character and wind conditions. The purpose of these investigations was to identify and better understand the significant sources of odour in the vicinity of the landfill, and to identify and quantify the landfill odour plume at various distances downwind of the site. Odour intensity refers to the perceived strength of an odour, as assessed by an individual with a sense of smell that is within the typical range expected for the purposes of odour measurement. To standardise the odour logging and analysis approach as far as possible, two main steps were taken: adoption of a standard scale for describing odour intensity, as detailed in German Standard VDI 3882 (I) which relates to odour measurement; and use of the relationship between odour intensity and odour concentration to provide a rough estimate of field odour concentrations. This step enables odour observations in the field to be compared to estimates obtained by modelling and, more relevantly in this case, to enable emission rates to be estimated under the conditions applying at the time of observation using dispersion model back-calculation. A discussion of how odour intensity can be used in field assessment is contained in two papers (Ormerod et al, 2002; Pitt, 2014) that are included as Appendix B. In summary, the German Standard VDI sets out a scale from 0 to 6 that gives a descriptive guide to odour intensity. Table C.3 sets out the scale (column 2), the standard descriptors (column 1) and an interpretive guide used in field assessment. Job ID AQU-VC C-8 Appendix C - Field Observations and Emission Rates.docx
144 Perceived odour strength Table C.3: Guide to Using VDI Odour Intensity Scale (Pitt, 2014) Intensity level rating Interpretation Extremely strong 6 In normal circumstances, this should be very rare in a field situation. For an offensive type of odour, the reaction would be to mitigate against further exposure. This remains the dominant thought and motivation until the exposure level is reduced. The odour cannot be tolerated. Very strong 5 The odour character is clearly recognisable. For an offensive type of odour, exposure to this level is considered unpleasant/undesirable to the point that action to mitigate against further exposure is considered or taken. Strong 4 The odour character is clearly recognisable. For an offensive type of odour, exposure to this level would be considered unpleasant/undesirable. Distinct 3 The odour character is clearly recognisable. Note that this must still apply even if in a different context or situation - for example, not knowing or expecting what type of odour may be present. The odour is tolerable even for an offensive odour. Weak 2 The assessor is reasonably sure that odour is present but not 100% sure of the odour character. For example, at the weak level, suspended gravel dust is similar to a wet cement odour. Very weak 1 The odour character is not recognisable. There is probably some doubt whether the odour is actually present. A useful strategy where the odour is borderline between not perceptible and very weak is to alternate such observations between 0 and 1. Not perceptible 0 No odour. A normal feature of odour intensity in the field is that it varies over time, often within the time taken for a breathing cycle of an observer see for example Figure C.2 below. Therefore, in order to gain a more representative estimate of the odour strength it is very useful to log the variations in intensity using a standardised approach. Typically, the approach is to sniff and record odour intensity every 10 seconds for 10 minutes. Over this time, it is generally possible to capture a reasonable sample of the fluctuations in odour strength. In order to translate this data into an average concentration estimate, however, it is necessary to compare odour intensity with odour concentration (Ormerod et al., 2002). The issue is detailed in Appendix B. Job ID AQU-VC C-9 Appendix C - Field Observations and Emission Rates.docx
145 Figure C.2: Time variations in odour intensity recorded at 1330 on 10 June 2014 on Middle Road, 100 metres east of Hopkins Road To convert odour intensity observations to an odour intensity estimate as an average value for the observing period, it is necessary to assign a concentration value to each level on the intensity scale. In research on landfill odours, Sarkar (1999) derived an odour intensity-concentration relationship as per Table C.4. The distinct odour concentration in Table C.4 compares well with the data for various source types presented in Table 1 of Pitt (2014), which is included in Appendix B. Table C.4: Odour Intensity v Concentration Derived from Sarkar (1999) Intensity Descriptor Concentration (ou) 1 Very weak Weak Distinct Strong 26 5 Very strong 67 6 Extremely strong 176 C.4.2 Intensity Observations The most significant known odour sources around the subject site are the MRL activities as well as the adjacent Boral Asphalt plant to the north of the current active cell and, until mid-2015, the Pinegro green waste facility to the northwest. C June 2014 Odour observations were made on 10 June 2014 during the early afternoon and the morning of 11 June. On each occasion, traverses were made along the roads to the west and south of the landfill on both occasions wind was blowing from between north and east, and more directly northerly on 11 June. Job ID AQU-VC C-10 Appendix C - Field Observations and Emission Rates.docx
146 Figure C.2 shows the odour observed near the intersection of Middle Road and Hopkins Road, southwest of the landfill on 10 June, about 1 km downwind of the active cell. At this time, works were being completed to rectify the LFG extraction system to the east of the active face. The works involved disturbing a capped cell and exposing old waste. The observation point was downwind of this activity with a very light E to ENE breeze. The atmosphere was turbulent at the time, and as a result the odour was detected only intermittently, reaching intensity 3 (distinct) on one occasion. Otherwise the odour was weak or very weak, if present. The character of the odour was difficult to ascertain: in other words it was difficult at this intensity to determine if the odour was typical of newly received waste from the active face or LFG released from the drilling activity. There may have been a mixture of both, as a single brief interval of LFG odour was clearly detected just prior to the formal observation occurring. On the morning of 11 June, the rectification activity had ceased and odour was detected only from the active cell. The blue line along roads in Figure C.3 indicates the path taken while a vehicle was driven with the observer intent on detecting odour. No odour was detected at any point shown in blue. In the gaps in the blue lines there is a representation of two distinct odour plumes. Based on the field investigations and analysis of the data, estimates of odour plume concentration were derived from the VDI 3882/3940 type field odour intensity observations, for two separate odour plumes: one from the Western Landfill and another from Pinegro composting facility. A schematic of the field data for 11 June is shown in Figure C.3. The odour concentration estimates are by necessity approximate but it was evident from observations and model-based analysis that the detectable odour plume from the active landfill extended about 2 km downwind from the active cell, and the detectable plume from Pinegro extended about 4 km downwind from its source. At these distances detectable odour was intermittent and weak to very weak. Job ID AQU-VC C-11 Appendix C - Field Observations and Emission Rates.docx

147 Figure C.3: Observations of odour plumes from MRL and Pinegro, 11 June 2014 Job ID AQU-VC C-12 Appendix C - Field Observations and Emission Rates.docx
148 The evidence from the field observations indicates that under the conditions observed at the time, the Pinegro odour plume was detectable about twice as far from the Ravenhall site boundary as the landfill plume. C October 2014 Various traverses and observations at fixed points were made around the Ravenhall site on 9 and 10 October On the morning of 9 October, observations were made between approximately 0730 and 1000 local time. Initially, wind speed was approximately 1 m/s, conditions were stable and the wind direction was between NNW and NW predominantly. There was activity at the active face (i.e., arrival of laden trucks and discharging of the waste onto the active face). The active cell was located m west of the junction of Christies Road and Middle Road. Initial traverses along Christies Road and Middle Road detected odour only around the SE corner of the site, indicated by the shaded segment adjacent to the site in Figure C.4 and labelled A. Here the odour was distinct to sometimes strong on the VDI 3882(1) intensity scale. After multiple traverses along Middle Road and Christies Road, only one odour plume was detected. There was no separate plume identifiable as being from Pinegro or any other source separate from the landfill. However, the odour that was detected was initially difficult to identify clearly even though it was immediately downwind of the landfill at point A. Then, further south, travelling east along Boundary Road from Hopkins Road, no odour was detected until a point on Boundary Road labelled B. Here the odour was mostly faintly recognisable as the landfill active face odour associated with newly placed waste. Further east, a distinct and more continuously present odour was detected for a distance of about 200 metres, see label C. This odour was not recognisable as the typical landfill active face odour, but was a more earthy or vegetal type of odour. Initially it was thought that the odour could have come from construction earthworks taking place immediately to the north of the observation point, but this hypothesis was dismissed based on subsequent observations in the same location at various times during the morning. Based on odour intensity observations and calculations similar to those described in section C.4, the odour concentration in the weaker part of this transect that was identified as being associated with the landfill is estimated to have been in the order of 1 ou, based on the intermittent very weak to weak odour that reached distinct only very sporadically. Considering the wind conditions at the time, and more direct encounters of the Pinegro and landfill odours separately at a later time, it is concluded that to a significant extent the two plumes were overlapping during the period when unusual odour characteristics were identified. The odour that was initially observed adjacent to the landfill and later detected on Boundary Road, as described above, is very likely to have been strongly influenced by the Pinegro emissions. Overlapping of the plumes is consistent with the light, meandering north-westerly wind conditions for much of the early morning period. By 1000, conditions had become unstable and wind speed remained very light. Traverses along Middle Road detected no odour at this time. Under the light wind, turbulent conditions that had developed at this time, it is likely that intermittent odour would have been detectable had the observing period been longer: such weather conditions typically result in erratic plume behaviour, making plume tracking and consistent detection virtually impossible. Job ID AQU-VC C-13 Appendix C - Field Observations and Emission Rates.docx

149 Figure C.4: Odour observations on morning of 9 October 2014 Job ID AQU-VC C-14 Appendix C - Field Observations and Emission Rates.docx
150 On the evening of 9 October, wind was light (1-2 m/s) and wind direction varied between WNW and WSW. Observations around the site between 2145 and 2245 local time revealed the presence of four odour types, as indicated in Figure C.5 by the letters A, B, C and D. Based on wind conditions and the character of the odours detected, the following are concluded: Odour A was associated with the green waste at Pinegro. The odour plume was detectable distinctly at one point along the M8 Motorway where indicated in Figure C.5 by A3, but did not seem as offensive as it had been in June 2014 at similar levels of intensity. Hence, while it was a significant and distinct odour, it was not regarded as particularly offensive. Odour B was recognisable as odour coming from the Boral Asphalt plant on the corner of Riding Boundary Road and Christies Road. The odour was weakly detectable close to the plant only. Odour C was encountered both along Christies Road near the entrance to the landfill site at C1 and to the southeast along the eastern part of Middle Road where indicated as C2. This odour did not seem to be a typical odour associated with the active face (which was closed for the night at the time) and indicated putrefaction of previously buried material. It may have been associated with work on the LFG capture system or other cell engineering that disturbed previously buried material. Odour D was a weak to very weak earthy odour, probably associated with residual odours from the active face, which was under daily cover at that time of night, and interim capped areas in the south-eastern part of the landfill site. Job ID AQU-VC C-15 Appendix C - Field Observations and Emission Rates.docx

151 Figure C.5: Odour observations evening of 9 October 2014 Job ID AQU-VC C-16 Appendix C - Field Observations and Emission Rates.docx
152 On the morning of 10 October, observations between 0730 and 0830 were conducted under conditions of a moderate northerly wind, which was blowing directly across Middle Road. Just to the east of the active face, a weak LFG odour was detected at point A in Figure C.6. Odour of distinct intensity was detected directly downwind of the active face at B in Figure C.6. Further to west along Middle Road, a distinct woody or vegetal odour was detected directly downwind of the Pinegro site at point C in Figure C.6. This was recognised as the odour that was detected at A3 in Figure C.5 and was similar to the odour at C in Figure C.4. Moving along Boundary Road from the west, odour was detected for a section of about 250 metres near point D in Figure C.6. This odour was weak to distinct on the VDI 3882 odour intensity scale and was the same as that detected at point C on Middle Road, i.e., the evidence showed that it was from Pinegro. Further to the east, landfill odour was detected intermittently along a section of the road about 100 metres long, near E in Figure C.6. Here the odour had a slightly sweet character and was mostly weak or very weak, with some distinct peaks. On Doherty Road, very weak intermittent odours from Pinegro and the landfill were detected at points F and G, respectively, in Figure C.6. At such low intensity, odours may easily go unnoticed to someone not intent on detecting them. Job ID AQU-VC C-17 Appendix C - Field Observations and Emission Rates.docx

153 Figure C.6: Odour observations morning of 10 October 2014 Job ID AQU-VC C-18 Appendix C - Field Observations and Emission Rates.docx
154 C October 2015 On the morning of 23 October at around 10:00 wind was from the south at around 2 m/s and the weather cloudy. Under these conditions, the odour would be detected (if strong enough) only from Riding Boundary Road, to the north of the active cell 2M. During a slow traverse along the road, stopping at regular points, no odour was detected. For the purpose of comparing the observation to a model result, it is simply taken that the odour concentration at the distance of 1200 m was < 1 ou. C November-1 December 2015 Two experienced staff members from Pacific Environment conducted a series of odour intensity observations on and around the Ravenhall site on 30 November and 1 December 2015, coinciding with source sampling by Ektimo Pty Ltd. The results of each 10-minute observation are plotted in Figure C.7 below. The results are presented as estimated odour concentration values, colour coded according to the legend. It is evident that the values are generally low, reflecting the possible influence of: the relatively strong winds that prevailed during most of the on-site period, enhancing the dispersion of odour plumes possible olfactory fatigue (due to the constant presence of odour) in the case of some of the on-site observations, leading to under-reporting of odour intensity. However, the field practices of the observers were intended to minimise this effect. difficulties in staying downwind of the active face due to turbulence and flow complexities around the site (which has substantial artificial topography due to the landfilling activities). Job ID AQU-VC C-19 Appendix C - Field Observations and Emission Rates.docx

155 Figure C.7: Summary of Odour Intensity Observations, Converted to Estimated Odour Units, 30 November and 1 December 2015 Job ID AQU-VC C-20 Appendix C - Field Observations and Emission Rates.docx
156 C Summary of Downwind Observations vs Modelling The downwind odour intensity observations conducted under various conditions are summarised in Table C.5, in the form of estimated odour concentration values. Table C.5 also contains the results of model calculations corresponding to those observations, using best estimates of odour source characteristics and weather conditions. In Table C.5, the column Model ou at Base Emission Rate refers to the odour concentration predicted at the observing location where the Estimated Concentration from Observation applies. It is evident that for all of the observations except those where the P-G Class was F (very stable), the model predicts concentrations substantially lower than were estimated from the intensity observations. The ratios of the observed values to the modelled values are contained in the column OER Scale (Observation / Raw model result). The column OER Scale (from Equation 1) contains the result of applying the scaling for wind speed and turbulence described in Equation 1, i.e., the predicted OER multiplier for those weather conditions. The column Model/Obs Ratio is the final indicator of how well the observations compare to the adjusted model. If the model and observations were to match perfectly, each of the values in this column would be 1. Values higher than1 indicate that the model predicts higher concentration than was observed, and it is evident that there may be a bias towards overprediction in the overall results. However, it should be noted that not all of the observations are necessarily as close to the plume centreline as assumed, and this can lead to an apparent overprediction. It is also possible that under very light winds and cool conditions there is some (small) initial plume rise from waste recently placed on the active face. The effect is observable from wastewater ponds and natural water bodies under similar conditions and can provide enough plume rise to reduce the ground level concentrations downwind for some distance. Overall, adjusted model performance using Equation 1 appears to be broadly consistent with observed conditions and is concluded to be a better basis for evaluating the statistical distribution of hourly concentrations than assuming a constant, baseline emission rate. Job ID AQU-VC C-21 Appendix C - Field Observations and Emission Rates.docx
157 Date Time Distance Downwind (m) P-G Class Table C.5: Summary of Odour Intensity Observations Compared to Modelling 10 m Wind speed (m/s) Estimated Conc n from Observation (ou) Conc n ou used for model comparison Modelled ou at Base Emission Rate OER Scale (Observation /Raw model result) OER Scale (from Equation 1) 11-Jun E Jun E Model/Obs Ratio Comment 9-Oct F 1 ~ Possible plume buoyancy under light winds and cool conditions 9-Oct B 1.5 < Highly variable wind direction - difficult to locate plume 9-Oct F 1.5 ~ No active face operation night closure 30-Nov D 10 ~ Oct D 2 < Short observing period, may have missed although plume path was crossed Job ID AQU-VC C-22 Appendix C - Field Observations and Emission Rates.docx
158 C.5 REFERENCES Bajwa, K. S., V. P. Aneja & S. Pal Arya (2006) Measurement and estimation of ammonia emissions from lagoon atmosphere interface using a coupled mass transfer and chemical reactions model, and an equilibrium model. Atmospheric Environment, 40, Supplement 2, Baum, K. A., J. M. Ham, N. A. Brunsell & P. I. Coyne (2008) Surface boundary layer of cattle feedlots: Implications for air emissions measurement. Agricultural and Forest Meteorology, 148, Blunden, J., V. P. Aneja & J. H. Overton (2008) Modeling hydrogen sulfide emissions across the gas liquid interface of an anaerobic swine waste treatment storage system. Atmospheric Environment, 42, Chao, H.-P. (2009) A new approach for estimating emissions of organic solutes and organic solvents under wind speeds. Atmospheric Environment, 43, Gualtieri, C. (2006) Verification of Wind-Driven Volatilization Models. Environmental Fluid Mechanics, 6, Hafner, S. D., F. Montes & C. A. Rotz (2012) A mass transfer model for VOC emission from silage. Atmospheric Environment, 54, Hudson, N. A. & G. A. Ayoko (2008) Odour sampling 1: Physical chemistry considerations. Bioresource Technology, 99, Hudson, N. & G. A. Ayoko (2009) Comparison of emission rate values for odour and odorous chemicals derived from two sampling devices. Atmospheric Environment, 43, Hudson, N., G. A. Ayoko, M. Dunlop, D. Duperouzel, K. Burrell, K. Bell, E. Gallagher, P. NIcholas & N. Heinrich (2009) Comparison of odour emission rates measured from various sources using two sampling devices. BioresourceTechnology, 100, Kaye, R. & K. Jiang. (2000a) Development of odour impact criteria for sewage treatment plants using odour complaint history. Elsevier Science Ltd., Pergamon, P.O. Box 800 Kidlington Oxford OX5 1DX UK. Koziel, J. A., L. Cai, D. Wright & S. Hoff (2006) Solid phase microextraction as a novel air sampling technology for improved, GC-olfactometry-based, assessment of livestock odors.. J. Chromatogr. Sci., 44, Luna R & Church H (1972) A comparison of turbulence intensity and stability ratio measurements to Pasquill stability categories. J. Appl. Meteor. 11 (4), Mahrt, L. & M. Ek (1984) The Influence of Atmospheric Stability on Potential Evaporation. Journal of Climate and Applied Meteorology, 23, Ormerod R., D Abreton P.C., Grocott S. (2002) Development of Site-Specific Odour Criteria and Compliance Assessments Usnig Odour Intensity Observation and Modelling. Presented at 2002 Bieenial Conference of the Clean Air Society of Australia and New Zealand, Christchurch, August Parker, D., N. Cole, K. Casey, G. Galvin, R. Ormerod, C. Paris, E. Caraway & M. Rhoades. (2009) Wind tunnels vs. flux chambers: area source emission measurements and the necessity for VOC and odour correction factors. In 19th International Clean Air and Environment Conference. Perth, Western Australia: CASANZ. Job ID AQU-VC C-23 Appendix C - Field Observations and Emission Rates.docx
159 Parker, D., J. Ham, B. Woodbury, L. Cai, M. Spiehs, M. Rhoades, S. Trabue, K. Casey, R. Todd & A. Cole (2012) Standardization of flux chamber and wind tunnel flux measurements for quantifying volatile organic compound and ammonia emissions from area sources at animal feeding operations. Atmospheric Environment. Pasquill, F. (1961) The estimation of the dispersion of windborne material, The Meteorological Magazine, vol 90, No. 1063, pp Pitts D, (2014) Field Odour Assessments for Estimating Odour Concentrations. Air uality and Climate Change Volume 48 No. 1 February Rong, L., P. V. Nielsen & G. Zhang (2010) Experimental and Numerical Study on Effects of Airflow and Aqueous Ammonium Solution Temperature on Ammonia Mass Transfer Coefficient. Journal of the Air & Waste Management Association, 60, Rumburg, B., G. H. Mount, J. Filipy, B. Lamb, H. Westberg, D. Yonge, R. Kincaid & K. Johnson (2008a) Measurement and modeling of atmospheric flux of ammonia from dairy milking cow housing. Atmospheric Environment, 42, Saha, C. K. (2011) Mass transfer processes of odorants in aerial boundary layers. In Department of Biosystems Engineering Science and Technology. Aarhus, Denmark: Aarhus University. Santos, J. M., V. Kreim, J.-M. Guillot, N. C. Reis Jr, L. M. de Sá & N. J. Horan (2012) An experimental determination of the H2S overall mass transfer coefficient from quiescent surfaces at wastewater treatment plants. Atmospheric Environment, 60, Sarkar, U. (1999) Odour Nuisance from Solid Wastes: Development of a Model Describing Emission, Dispersion and Reception. Ph.D. Thesis, College of Aeronautics, Cranfield University, UK. Scholtz, M. T., E. Voldner, A. C. McMillan & B. J. Van Heyst (2002) A pesticide emission model (PEM) Part I: model development. Atmospheric Environment, 36, Turner, D.B. (1994). Workbook of atmospheric dispersion estimates: an introduction to dispersion modeling (2nd ed.). CRC Press. ISBN X. C.6 EKTIMO REPORTS Job ID AQU-VC C-24 Appendix C - Field Observations and Emission Rates.docx
160 Report Number R Odour Survey Report Pacific Environment Limited, Norwood This document is confidential and is prepared for the exclusive use of Pacific Environment Limited and those granted permission by Pacific Environment Limited.
161 Ektimo 24 December 2015 Document Information Client Name: Report Number: Pacific Environment Limited R Date of Issue: 24 December 2015 Attention: Address: Johan Meline 35 Edward Street Norwood SA 5067 Testing Laboratory: Ektimo (ETC) ABN Report Status Format Document Number Report Date Prepared By Reviewed By (1) Reviewed By (2) Preliminary Report Draft Report R002059[DRAFT] 9/12/15 ADo/TBu TBu Final Report R /12/15 ADo/TBu TBu GTr Amend Report Template Version: Amendment Record Document Number Initiator Report Date Section Reason Nil Report Authorisation Terry Burkitt Director (Quality) NATA Accredited Laboratory No Glenn Trenear Client Manager Accredited for compliance with ISO/IEC NATA is a signatory to the ILAC mutual recognition arrangement for the mutual recognition of the equivalence of testing, calibration and inspection reports Report R prepared for Pacific Environment Limited, Norwood Page 2 of 23
162 Ektimo 24 December 2015 Table of Contents 1 Executive Summary Results Final cap Point Final cap Point Final cap Point Final cap Point Soil blank Point Intermediate cap Point Intermediate cap Point Intermediate cap Point Intermediate cap Point Intermediate cap Point Tip face area Point Tip face area Point Tip face area Point Flux equipment blank Tip face downwind sampling Test Tip face downwind sampling Test Plant Operating Conditions Weather data during Tip face measurements Quality Assurance/ Quality Control Information Definitions Report R prepared for Pacific Environment Limited, Norwood Page 3 of 23
163 Ektimo 24 December 2015 EXECUTIVE SUMMARY Ektimo was engaged to perform odour survey works by Pacific Environment Limited to conduct an odour survey at the Melbourne Regional Landfill located at Christies Road, Ravenhall operated by Transpacific. Monitoring was conducted on 30 November and 1 December 2015 as detailed in the following table: Location Test Date Test Parameters* Final Cap - Point 1 30 November 2015 Odour Flux Final Cap - Point 2 30 November 2015 Odour Flux Final Cap - Point 3 30 November 2015 Odour Flux Final Cap - Point 4 30 November 2015 Odour Flux Soil Blank - Point 5 30 November 2015 Odour Flux Intermediate Cap - Point 1 30 November 2015 Odour Flux Intermediate Cap - Point 2 30 November 2015 Odour Flux Intermediate Cap - Point 3 30 November 2015 Odour Flux Intermediate Cap - Point 4 30 November 2015 Odour Flux Intermediate Cap - Point 5 30 November 2015 Odour Flux Tip face area - Point 1 1 December 2015 Odour Flux Tip face area - Point 2 1 December 2015 Odour Flux Tip face area - Point 3 1 December 2015 Odour Flux Flux equipment blank 1 December 2015 Odour Flux Tip face downwind 1 December 2015 Odour * Flow rate, velocity, temperature and moisture were determined unless otherwise stated All results are reported on a wet basis at STP. Unless otherwise indicated, the methods cited in this report have been performed without deviation. Plant operating conditions have been noted in the report. Report R prepared for Pacific Environment Limited, Norwood Page 4 of 23


164 Ektimo 24 December 2015 RESULTS 2.1 Final cap Point 1 Location Final cap: Point 1 GPS co-ordinates Date tested Location Description Surface Description Area Classification Sampling Method 37 46'46"S, '13"E 30/11/2015 Cell west of bitumen plant: North East section Dry ground with dried grass Rural AS Equilibration time, hrs Sample ID Dilution ratio Sampling time, hrs odour concentration, ou 75 odour flux rate, ou/m²/min 2.6 Sweep Rate, L/min Penetration Depth, mm Static Pressure, Pa Hedonic tone Odour character Surface temperature ( C) Chamber temperature ( C) Ambient temperature ( C) <2 neutral dust, dry soil, earth, dusty Report R prepared for Pacific Environment Limited, Norwood Page 5 of 23


165 Ektimo 24 December Final cap Point 2 Location Final cap: Point 2 GPS co-ordinates Date tested Location Description Surface Description Area Classification Sampling Method 37 46'48"S, '13"E 30/11/2015 Cell west of bitumen plant: South East section Dry ground with dried grass Rural AS Equilibration time, hrs Sample ID Dilution ratio Sampling time, hrs odour concentration, ou 75 odour flux rate, ou/m²/min 2.7 Sweep Rate, L/min Penetration Depth, mm Static Pressure, Pa Hedonic tone Odour character Surface temperature ( C) Chamber temperature ( C) Ambient temperature ( C) <2 neutral dust, dry soil, dusty Report R prepared for Pacific Environment Limited, Norwood Page 6 of 23


166 Ektimo 24 December Final cap Point 3 Location Final cap: Point 3 GPS co-ordinates Date tested Location Description Surface Description Area Classification Sampling Method 37 46'48"S, '10"E 30/11/2015 Cell west of bitumen plant: South West section Dry ground with dried grass Rural AS Equilibration time, hrs Sample ID Dilution ratio 59 1 Sampling time, hrs odour concentration, ou odour flux rate, ou/m²/min Sweep Rate, L/min Penetration Depth, mm Static Pressure, Pa Hedonic tone Odour character Surface temperature ( C) Chamber temperature ( C) Ambient temperature ( C) <2 neutral no discernable odour, dust Report R prepared for Pacific Environment Limited, Norwood Page 7 of 23


167 Ektimo 24 December Final cap Point 4 Location Final cap: Point 4 GPS co-ordinates Date tested Location Description Surface Description Area Classification Sampling Method 37 46'45"S, '11"E 30/11/2015 Cell west of bitumen plant: North West section Dry ground with dried grass Rural AS Equilibration time, hrs Sample ID Dilution ratio Sampling time, hrs odour concentration, ou 86 odour flux rate, ou/m²/min Sweep Rate, L/min Penetration Depth, mm Static Pressure, Pa Hedonic tone Odour character Surface temperature ( C) Chamber temperature ( C) Ambient temperature ( C) <2 neutral dust, dry soil, dusty Report R prepared for Pacific Environment Limited, Norwood Page 8 of 23


168 Ektimo 24 December Soil blank Point 5 Location Soil blank: Point 5 GPS co-ordinates Date tested Location Description Surface Description Area Classification Sampling Method 37 46'43"S, '9"E 30/11/2015 Soil North of cell Dry ground with dried grass Rural AS Equilibration time, hrs Sample ID Dilution ratio 60 1 Sampling time, hrs odour concentration, ou odour flux rate, ou/m²/min Sweep Rate, L/min Penetration Depth, mm Static Pressure, Pa Hedonic tone Odour character Surface temperature ( C) Chamber temperature ( C) <2 neutral dust, dry soil, dusty Ambient temperature ( C) 33 Report R prepared for Pacific Environment Limited, Norwood Page 9 of 23


169 Ektimo 24 December Intermediate cap Point 1 Location Intermediate cap: Point 1 GPS co-ordinates Date tested Location Description Surface Description Area Classification Sampling Method 37 47'24"S, '56"E 30/11/2015 Cell East of quarry Dry clay Rural AS Equilibration time, hrs Sample ID Dilution ratio Sampling time, hrs odour concentration, ou odour flux rate, ou/m²/min Sweep Rate, L/min Penetration Depth, mm Static Pressure, Pa Hedonic tone Odour character Surface temperature ( C) Chamber temperature ( C) Ambient temperature ( C) <2 neutral - mildly unpleasant dust, sweet, rotten, earth, compost Report R prepared for Pacific Environment Limited, Norwood Page 10 of 23


170 Ektimo 24 December Intermediate cap Point 2 Location Intermediate cap: Point 2 GPS co-ordinates Date tested Location Description Surface Description Area Classification Sampling Method 37 47'25"S, '54"E 30/11/2015 Cell East of quarry dry clay /soil / gravel Rural AS Equilibration time, hrs Sample ID Dilution ratio 98 1 Sampling time, hrs odour concentration, ou 86 odour flux rate, ou/m²/min Sweep Rate, L/min Penetration Depth, mm Static Pressure, Pa Hedonic tone Odour character Surface temperature ( C) Chamber temperature ( C) Ambient temperature ( C) <2 neutral dust, dry soil, dusty Report R prepared for Pacific Environment Limited, Norwood Page 11 of 23


171 Ektimo 24 December Intermediate cap Point 3 Location Intermediate cap: Point 3 GPS co-ordinates Date tested Location Description Surface Description Area Classification Sampling Method 37 47'26"S, '53"E 30/11/2015 Cell East of quarry dry clay /soil / gravel Rural AS Equilibration time, hrs Sample ID Dilution ratio 15 1 Sampling time, hrs odour concentration, ou odour flux rate, ou/m²/min Sweep Rate, L/min Penetration Depth, mm Static Pressure, Pa Hedonic tone Odour character Surface temperature ( C) Chamber temperature ( C) Ambient temperature ( C) <2 neutral dust, dry soil, dusty, earth Report R prepared for Pacific Environment Limited, Norwood Page 12 of 23


172 Ektimo 24 December Intermediate cap Point 4 Location Intermediate cap: Point 4 GPS co-ordinates Date tested Location Description Surface Description Area Classification Sampling Method 37 47'27"S, '54"E 30/11/2015 Cell East of quarry dry clay /soil / gravel / dried grass Rural AS Equilibration time, hrs Sample ID Dilution ratio Sampling time, hrs odour concentration, ou 600 odour flux rate, ou/m²/min 21 Sweep Rate, L/min Penetration Depth, mm Static Pressure, Pa Hedonic tone Odour character Surface temperature ( C) Chamber temperature ( C) Ambient temperature ( C) <2 mildly unpleasant onions, garlic, rotten Report R prepared for Pacific Environment Limited, Norwood Page 13 of 23


173 Ektimo 24 December Intermediate cap Point 5 Location Intermediate cap: Point 5 GPS co-ordinates Date tested Location Description Surface Description Area Classification Sampling Method 37 47'30"S, '54"E 30/11/2015 Cell East of quarry dry clay/ gravel / dried grass Rural AS Equilibration time, hrs Sample ID Dilution ratio Sampling time, hrs odour concentration, ou 320 odour flux rate, ou/m²/min 11 Sweep Rate, L/min Penetration Depth, mm Static Pressure, Pa Hedonic tone Odour character Surface temperature ( C) Chamber temperature ( C) Ambient temperature ( C) <2 mildly unpleasant onions, garlic, rotten Report R prepared for Pacific Environment Limited, Norwood Page 14 of 23


174 Ektimo 24 December Tip face area Point 1 Location Tip face area: Point 1 GPS co-ordinates Date tested Location Description Surface Description Area Classification Sampling Method 37 47'21"S, '43"E 1/12/2015 East of tip face Damp clay Rural AS Equilibration time, hrs Sample ID Dilution ratio 8 1 Sampling time, hrs odour concentration, ou 420 odour flux rate, ou/m²/min 15 Sweep Rate, L/min Penetration Depth, mm Static Pressure, Pa Hedonic tone Odour character Surface temperature ( C) Chamber temperature ( C) Ambient temperature ( C) <2 very unpleasant rubbish, sweet Report R prepared for Pacific Environment Limited, Norwood Page 15 of 23


175 Ektimo 24 December Tip face area Point 2 Location Tip face area: Point 2 GPS co-ordinates Date tested Location Description Surface Description Area Classification Sampling Method 37 47'21"S, '42"E 1/12/2015 East of tip face Damp clay Rural AS Equilibration time, hrs Sample ID Dilution ratio 62 1 Sampling time, hrs odour concentration, ou 370 odour flux rate, ou/m²/min 13 Sweep Rate, L/min Penetration Depth, mm Static Pressure, Pa Hedonic tone Odour character Surface temperature ( C) Chamber temperature ( C) Ambient temperature ( C) <2 very unpleasant rubbish, sweet Report R prepared for Pacific Environment Limited, Norwood Page 16 of 23


176 Ektimo 24 December Tip face area Point 3 Location Tip face area: Point 3 GPS co-ordinates Date tested Location Description Surface Description Area Classification Sampling Method 37 47'20"S, '42"E 1/12/2015 North of tip face Damp clay Rural AS Equilibration time, hrs Sample ID Dilution ratio 50 1 Sampling time, hrs odour concentration, ou odour flux rate, ou/m²/min Sweep Rate, L/min Penetration Depth, mm Static Pressure, Pa Hedonic tone Odour character Surface temperature ( C) Chamber temperature ( C) Ambient temperature ( C) <2 very unpleasant rubbish, sweet Report R prepared for Pacific Environment Limited, Norwood Page 17 of 23
177 Ektimo 24 December Flux equipment blank Location Date tested Location Description Surface Description Area Classification Sampling Method 1 Equipment Blank 1/12/2015 Ektimo Ringwood Nelopthane NA AS Equilibration time, hrs Sample ID Dilution ratio Sampling time, hrs odour concentration, ou < 30 odour flux rate, ou/m 2 /min < 1 Sweep Rate, L/min Penetration Depth, mm Static Pressure, Pa Hedonic tone Odour character Surface temperature ( C) Chamber temperature ( C) Ambient temperature ( C) 4.59 Surface <2 neutral no discernable odour NA Report R prepared for Pacific Environment Limited, Norwood Page 18 of 23
178 Ektimo 24 December Tip face downwind sampling Test 1 Downwind traverse: 56m Approximately 70m from tip face View East (approximately 70m downwind of tip face) View West to tip face Date 1/12/2015 Client Pacific Environment Report R Stack ID Tip face: Downwind Test 1 Licence No. - Location Ravenhall State VIC Ektimo Staff TBu/SDo Process Conditions Please refer to client records. Reason for testing: Client requested testing to determine emissions to air space space space space space space space space Downwind Traverse Details Traverse length x Estimated plume height Sampling plane area Temperature, C Average wind speed, m/s Averages wind direction Volumetric flow rate, discharge, m³/min Volumetric flow rate (wet STP), m³/min x mm 840 m² NW space space space space space space space space Odour Average Test 1 Test 2 Concentration M ass Rate Concentration M ass Rate Concentration M ass Rate ou oum³/min ou oum³/min ou oum³/min Results Hedonic tone Odour character Lower Uncertainty Limit very unpleasant rubbish, sweet 110 very unpleasant rubbish, sw eet 64 very unpleasant rubbish, sw eet 85 Upper Uncertainty Limit Sampling date & Time 1/12/ /12/ Dilution factor & Threshold 1 1 Notes: Determination of odour emission rates using the upwind / downwind measurement principle is not a NATA accredited method Report R prepared for Pacific Environment Limited, Norwood Page 19 of 23
 View toward tip face Date 1/12/2015")

179 Ektimo 24 December Tip face downwind sampling Test 2 Downwind traverse: 56m Approximately 70m from tip face View toward traverse location (approximately 70m downwind of tip face) View toward tip face Date 1/12/2015 Client Pacific Environment Report R Stack ID Tip face: Downwind Test 2 Licence No. - Location Ravenhall State VIC Ektimo Staff TBu/SDo Process Conditions Please refer to client records. Reason for testing: Client requested testing to determine emissions to air space space space space space space space space Downwind Traverse Details Traverse length x Estimated plume height Sampling plane area Temperature, C Average wind speed, m/s Average wind direction Volumetric flow rate, discharge, m³/min Volumetric flow rate (wet STP), m³/min x mm 840 m² 20 3 NW space space space space space space space space Odour Average Test 1 Test 2 Concentration M ass Rate Concentration M ass Rate Concentration M ass Rate ou oum³/min ou oum³/min ou oum³/min Results Hedonic tone Odour character Lower Uncertainty Limit very unpleasant rubbish, sweet 100 very unpleasant rubbish, sw eet 60 very unpleasant rubbish, sw eet 79 Upper Uncertainty Limit Sampling date & Time 1/12/ /12/ Dilution factor & Threshold 1 1 Notes: Determination of odour emission rates using the upwind / downwind measurement principle is not a NATA accredited method. Report R prepared for Pacific Environment Limited, Norwood Page 20 of 23
180 Ektimo 24 December 2015 TEST METHODS All sampling and analysis was performed by Ektimo unless otherwise specified. methods are available upon request. Specific details of the Parameter Tip face - Weather conditions Tip face - Wind speed Capped landfill locations - Odour flux Tip face - Odour Sampling Method Analysis Method Method Uncertainty* NATA Accredited Detection Limit Sampling Analysis Portable weather NA NA not specified x NA station Anemometer NA 0.4ms -1 not specified x NA AS AS ou/m 2 /min not specified AS AS ou not specified x PLANT OPERATING CONDITIONS Unless otherwise stated, the plant operating conditions were normal at the time of testing. See Transpacific s records for complete process conditions. WEATHER DATA DURING TIP FACE MEASUREMENTS The following data was collected from portable weather mast installed at the north east end of the downwind sampling traverse. Test Time Sampling Interval (min) Temperature ( C) Wind (m/s) Direction Relative pressure (Hpa) Test 1 1/12/ : NW /12/ : NW /12/ : NW /12/ : NW Averages: NW Test 2 1/12/ : NW /12/ : NWW /12/ : NW Averages: NW Note: Further data is available upon request if required. Report R prepared for Pacific Environment Limited, Norwood Page 21 of 23
181 Ektimo 24 December 2015 QUALITY ASSURANCE/ QUALITY CONTROL INFORMATION Ektimo (EML) and Ektimo (ETC) are accredited by the National Association of Testing Authorities (NATA) for the sampling and analysis of air pollutants from industrial sources. Unless otherwise stated test methods used are accredited with the National Association of Testing Authorities. For full details, search for Ektimo at NATA s website Ektimo (EML) and Ektimo (ETC) are accredited by NATA (National Association of Testing Authorities) to ISO/IEC General Requirements for the Competence of Testing and Calibration Laboratories. ISO/IEC requires that a laboratory have adequate equipment to perform the testing, as well as laboratory personnel with the competence to perform the testing. This quality assurance system is administered and maintained by the Compliance Manager. NATA is a member of APLAC (Asia Pacific Laboratory Accreditation Co-operation) and of ILAC (International Laboratory Accreditation Co-operation). Through the mutual recognition arrangements with both of these organisations, NATA accreditation is recognised world wide. A formal Quality Control program is in place at Ektimo to monitor analyses performed in the laboratory and sampling conducted in the field. The program is designed to check where appropriate; the sampling reproducibility, analytical method, accuracy, precision and the performance of the analyst. The Laboratory Manager is responsible for the administration and maintenance of this program. Report R prepared for Pacific Environment Limited, Norwood Page 22 of 23
182 Ektimo 24 December 2015 DEFINITIONS The following symbols and abbreviations may be used in this test report: STP Standard temperature and pressure. Gas volumes and concentrations are expressed on a dry basis at 0 C, at discharge oxygen concentration and an absolute pressure of kpa, unless otherwise specified. Disturbance A flow obstruction or instability in the direction of the flow which may impede accurate flow determination. This includes centrifugal fans, axial fans, partially closed or closed dampers, louvres, bends, connections, junctions, direction changes or changes in pipe diameter. VOC Any chemical compound based on carbon with a vapour pressure of at least kpa at 25 C or having a corresponding volatility under the particular conditions of use. These compounds may contain oxygen, nitrogen and other elements, but specifically excluded are carbon TOC monoxide, carbon dioxide, carbonic acid, metallic carbides and carbonate salts. The sum of all compounds of carbon which contain at least one carbon to carbon bond, plus methane and its derivatives. OU The number of odour units per unit of volume. The numerical value of the odour concentration is equal to the number of dilutions to arrive at the odour threshold (50% panel response). PM2.5 Atmospheric suspended particulate matter having an equivalent aerodynamic diameter of less than approximately 2.5 microns (μm). PM10 Atmospheric suspended particulate matter having an equivalent aerodynamic diameter of less than approximately 10 microns (μm). BSP British standard pipe NT Not tested or results not required NA Not applicable D50 Cut size of a cyclone defined as the particle diameter at which the cyclone achieves a 50% collection efficiency ie. half of the particles are retained by the cyclone and half are not and pass through it to the next stage. The D50 method simplifies the capture efficiency distribution by assuming that a given cyclone stage captures all of the particles with a diameter equal to or greater than the D50 of that cyclone and less than the D50 of the preceding cyclone. D Duct diameter or equivalent duct diameter for rectangular ducts < Less than > Greater than Greater than or equal to ~ Approximately CEM Continuous Emission Monitoring CEMS Continuous Emission Monitoring System DER WA Department of Environment & Regulation DECC Department of Environment & Climate Change (NSW) EPA Environment Protection Authority FTIR Fourier Transform Infra Red NATA National Association of Testing Authorities RATA Relative Accuracy Test Audit AS Australian Standard USEPA United States Environmental Protection Agency Vic EPA Victorian Environment Protection Authority ISC Intersociety committee, Methods of Air Sampling and Analysis ISO International Organisation for Standardisation APHA American public health association, Standard Methods for the Examination of Water and Waste Water CARB Californian Air Resources Board TM Test Method OM Other approved method CTM Conditional test method VDI Verein Deutscher Ingenieure (Association of German Engineers) NIOSH National Institute of Occupational Safety and Health XRD X-ray Diffractometry Report R prepared for Pacific Environment Limited, Norwood Page 23 of 23
183 Appendix D AERMOD MODEL FILES Job ID AQU-VC D Cleanaway Melbourne Regional Landfill AQA R10 Low Res.docx
184 D.1 ODOUR MODEL FILE ** **************************************** ** ** AERMOD Input Produced by: ** AERMOD View Ver ** Lakes Environmental Software Inc. ** Date: 20/01/2016 ** File: C:\Jobs\20496\Run 5\Odour\bat4\S4_a_2008_aermod.inp ** **************************************** ** ** **************************************** ** AERMOD Control Pathway **************************************** ** ** CO STARTING TITLEONE Scenario 4 (active cell 10), Flat terrain, Odour ** Updates: ** - new sensitive receptors locations (R1 to R17) ** - new scenarios (same base case) ** - emission estimates updated based on: ** 1. increased cell areas ** 2. increased active face area (from 1,600 m² to 1,800 m²) ** 3. inclusion of a leachate pond of 100m by 100m included for each scenario (located away from houses and not in a direct line with the active cell and sensitive receptors) Job ID AQU-VC D-2 Appendix D - AERMOD Model Files.docx
185 MODELOPT CONC FLAT AVERTIME 1 POLLUTID ODOUR RUNORNOT RUN ERRORFIL S4_a_2008.err CO FINISHED ** **************************************** ** AERMOD Source Pathway **************************************** ** ** SO STARTING ** Source Location ** ** Source ID - Type - X Coord. - Y Coord. ** LOCATION FRESH1 VOLUME LOCATION INTERM1 VOLUME LOCATION INTERM2 VOLUME LOCATION INTERM3 VOLUME LOCATION INTERM4 VOLUME LOCATION INTERM5 VOLUME LOCATION INTERM6 VOLUME LOCATION INTERM7 VOLUME LOCATION INTERM8 VOLUME LOCATION INTERM9 VOLUME LOCATION INTERM10 VOLUME LOCATION LEACHPOND1 VOLUME Job ID AQU-VC D-3 Appendix D - AERMOD Model Files.docx
186 LOCATION LEACHPOND2 VOLUME LOCATION LEACHPOND3 VOLUME LOCATION LEACHPOND4 VOLUME ** Source Parameters ** SRCPARAM FRESH SRCPARAM INTERM SRCPARAM INTERM SRCPARAM INTERM SRCPARAM INTERM SRCPARAM INTERM SRCPARAM INTERM SRCPARAM INTERM SRCPARAM INTERM SRCPARAM INTERM SRCPARAM INTERM SRCPARAM LEACHPOND SRCPARAM LEACHPOND SRCPARAM LEACHPOND SRCPARAM LEACHPOND CONCUNIT 1 OU/S OU/M**3 SRCGROUP fresh FRESH1 SRCGROUP interm INTERM1 INTERM2 INTERM3 INTERM4 INTERM5 SRCGROUP interm INTERM6 INTERM7 INTERM8 INTERM9 INTERM10 SRCGROUP leachate LEACHPOND1 LEACHPOND2 LEACHPOND3 LEACHPOND4 SRCGROUP ALL SO FINISHED Job ID AQU-VC D-4 Appendix D - AERMOD Model Files.docx
187 ** **************************************** ** AERMOD Receptor Pathway **************************************** ** ** RE STARTING GRIDCART UCART1 STA XYINC GRIDCART UCART1 END ** DESCRREC "" "" DISCCART DISCCART DISCCART DISCCART DISCCART DISCCART DISCCART DISCCART DISCCART DISCCART DISCCART DISCCART DISCCART DISCCART DISCCART Job ID AQU-VC D-5 Appendix D - AERMOD Model Files.docx
188 DISCCART DISCCART DISCCART DISCCART DISCCART DISCCART DISCCART RE FINISHED ** **************************************** ** AERMOD Meteorology Pathway **************************************** ** ** ME STARTING SURFFILE..\..\..\EPA\DEERPK08.SFC PROFFILE..\..\..\EPA\DEERPK08.PFL SURFDATA UAIRDATA PROFBASE 64.0 METERS WINDCATS ME FINISHED ** **************************************** ** AERMOD Output Pathway **************************************** ** Job ID AQU-VC D-6 Appendix D - AERMOD Model Files.docx
189 ** OU STARTING RECTABLE ALLAVE 9TH 44 RECTABLE 1 9TH 44 MAXTABLE ALLAVE 100 ** Auto-Generated Plotfiles PLOTFILE 1 ALL 9TH S4_a_2008.AD\01H9GALL.PLT 35 SUMMFILE S4_a_2008.sum OU FINISHED ** **************************************** ** Project Parameters **************************************** ** PROJCTN CoordinateSystemUTM ** DESCPTN UTM: Universal Transverse Mercator ** DATUM World Geodetic System 1984 ** DTMRGN Global Definition ** UNITS m ** ZONE -55 ** ZONEINX 0 ** D.2 PM10 MODEL FILE ** **************************************** ** ** AERMOD Input Produced by: Job ID AQU-VC D-7 Appendix D - AERMOD Model Files.docx
190 ** AERMOD View Ver ** Lakes Environmental Software Inc. ** Date: 24/08/2015 ** File: C:\Jobs\20496\Run 1\PM10\S1_2008\AERMOD.inp ** **************************************** ** ** **************************************** ** AERMOD Control Pathway **************************************** ** ** CO STARTING TITLEONE Scenario 1 (active cell 1), Flat terrain, PM10 Concentration ** Updates: ** - new sensitive receptors locations (R1 to R17) ** - new scenarios (same base case) ** - new haul roads (same haul road for base case) ** - existing quarry operations (Scenario 1 from latest assessment ) instead of future quarry operations ** - emission estimates updated based on: ** 1. new haul roads ** 2. increased vehicle traffic based on new transport assessment report ** 3. updated cell areas ** 4. new waste volumes ** 5. increased active face area (from 1,600 m² to 1,800 m²) Job ID AQU-VC D-8 Appendix D - AERMOD Model Files.docx
191 ** 6. existing quarry operations (Scenario 1 from latest assessment ) instead of future quarry operations ** 7. operating hours updated from 6,205 hrs/yr to 8,760 hrs/yr (updated emission rates) MODELOPT CONC FLAT AVERTIME 24 POLLUTID PM_10 RUNORNOT RUN ERRORFIL S1_2008.err CO FINISHED ** **************************************** ** AERMOD Source Pathway **************************************** ** ** SO STARTING ** Source Location ** ** Source ID - Type - X Coord. - Y Coord. ** LOCATION QP1 VOLUME ** DESCRSRC QuarryPlant LOCATION QP2 VOLUME ** DESCRSRC QuarryPlant LOCATION QP3 VOLUME ** DESCRSRC QuarryPlant LOCATION QP4 VOLUME ** DESCRSRC QuarryPlant LOCATION QP5 VOLUME Job ID AQU-VC D-9 Appendix D - AERMOD Model Files.docx
192 ** DESCRSRC QuarryPlant LOCATION QWE1 VOLUME ** DESCRSRC QWindErosion LOCATION QWE2 VOLUME ** DESCRSRC QWindErosion LOCATION QWE3 VOLUME ** DESCRSRC QWindErosion LOCATION QWE4 VOLUME ** DESCRSRC QWindErosion LOCATION QWE5 VOLUME ** DESCRSRC QWindErosion LOCATION QWE6 VOLUME ** DESCRSRC QWindErosion LOCATION QRD1 VOLUME ** DESCRSRC Quarry road LOCATION QRD2 VOLUME ** DESCRSRC Qroad LOCATION QRD3 VOLUME ** DESCRSRC Qroad LOCATION QRD4 VOLUME ** DESCRSRC Qroad LOCATION QRD5 VOLUME ** DESCRSRC Qroad LOCATION QRD6 VOLUME ** DESCRSRC Qroad LOCATION QBLA VOLUME ** DESCRSRC QBlast LOCATION ASP1 VOLUME Job ID AQU-VC D-10 Appendix D - AERMOD Model Files.docx
193 ** DESCRSRC QBlast LOCATION ASP2 POINT ** DESCRSRC Dryer Stack LOCATION ASP3 POINT ** DESCRSRC Dryer Stack LOCATION LF_WE1 VOLUME ** DESCRSRC landfill active cell wind erosion LOCATION LF_WE2 VOLUME ** DESCRSRC landfill active cell wind erosion LOCATION LF_WE3 VOLUME ** DESCRSRC landfill active cell wind erosion LOCATION LF_WE4 VOLUME ** DESCRSRC landfill active cell wind erosion LOCATION LF_FACE1 VOLUME ** DESCRSRC landfill lumped activities on the active face (except wind erosion) LOCATION LF_FACE2 VOLUME ** DESCRSRC landfill lumped activities on the active face - combustion LOCATION LANDF_RD1 VOLUME LOCATION LANDF_RD2 VOLUME LOCATION LANDF_RD3 VOLUME LOCATION LANDF_RD4 VOLUME LOCATION LANDF_RD5 VOLUME LOCATION LANDF_RD6 VOLUME LOCATION LANDF_RD7 VOLUME LOCATION LANDF_RD8 VOLUME LOCATION LANDF_RD9 VOLUME LOCATION LANDF_RD10 VOLUME LOCATION LANDF_RD11 VOLUME Job ID AQU-VC D-11 Appendix D - AERMOD Model Files.docx
194 LOCATION LANDF_RD12 VOLUME LOCATION LANDF_RD13 VOLUME LOCATION LANDF_RD14 VOLUME LOCATION LANDF_RD15 VOLUME LOCATION LANDF_RD16 VOLUME LOCATION LANDF_RD17 VOLUME LOCATION LANDF_RD18 VOLUME LOCATION LANDF_RD19 VOLUME LOCATION LANDF_RD20 VOLUME LOCATION LANDF_RD21 VOLUME LOCATION LANDF_RD22 VOLUME LOCATION LANDF_RD23 VOLUME LOCATION LANDF_RD24 VOLUME LOCATION LANDF_RD25 VOLUME LOCATION LANDF_RD26 VOLUME LOCATION LANDF_RD27 VOLUME LOCATION LANDF_RD28 VOLUME LOCATION LANDF_RD29 VOLUME LOCATION LANDF_RD30 VOLUME LOCATION LANDF_RD31 VOLUME LOCATION LANDF_RD32 VOLUME LOCATION LANDF_RD33 VOLUME LOCATION LANDF_RD34 VOLUME LOCATION LANDF_RD35 VOLUME BACKGRND ANNUAL 20.0 BACKUNIT UG/M3 Job ID AQU-VC D-12 Appendix D - AERMOD Model Files.docx
195 ** Source Parameters ** SRCPARAM QP SRCPARAM QP SRCPARAM QP SRCPARAM QP SRCPARAM QP SRCPARAM QWE SRCPARAM QWE SRCPARAM QWE SRCPARAM QWE SRCPARAM QWE SRCPARAM QWE SRCPARAM QRD SRCPARAM QRD SRCPARAM QRD SRCPARAM QRD SRCPARAM QRD SRCPARAM QRD SRCPARAM QBLA SRCPARAM ASP SRCPARAM ASP SRCPARAM ASP SRCPARAM LF_WE SRCPARAM LF_WE SRCPARAM LF_WE SRCPARAM LF_WE SRCPARAM LF_FACE SRCPARAM LF_FACE Job ID AQU-VC D-13 Appendix D - AERMOD Model Files.docx
196 SRCPARAM LANDF_RD SRCPARAM LANDF_RD SRCPARAM LANDF_RD SRCPARAM LANDF_RD SRCPARAM LANDF_RD SRCPARAM LANDF_RD SRCPARAM LANDF_RD SRCPARAM LANDF_RD SRCPARAM LANDF_RD SRCPARAM LANDF_RD SRCPARAM LANDF_RD SRCPARAM LANDF_RD SRCPARAM LANDF_RD SRCPARAM LANDF_RD SRCPARAM LANDF_RD SRCPARAM LANDF_RD SRCPARAM LANDF_RD SRCPARAM LANDF_RD SRCPARAM LANDF_RD SRCPARAM LANDF_RD SRCPARAM LANDF_RD SRCPARAM LANDF_RD SRCPARAM LANDF_RD SRCPARAM LANDF_RD SRCPARAM LANDF_RD SRCPARAM LANDF_RD SRCPARAM LANDF_RD SRCPARAM LANDF_RD Job ID AQU-VC D-14 Appendix D - AERMOD Model Files.docx
197 SRCPARAM LANDF_RD SRCPARAM LANDF_RD SRCPARAM LANDF_RD SRCPARAM LANDF_RD SRCPARAM LANDF_RD SRCPARAM LANDF_RD SRCPARAM LANDF_RD ** Variable Emissions Type: "By Wind Speed (WSPEED)" ** Variable Emission Scenario: "Scenario 3" EMISFACT QWE1 WSPEED EMISFACT QWE2 WSPEED EMISFACT QWE3 WSPEED EMISFACT QWE4 WSPEED EMISFACT QWE5 WSPEED EMISFACT QWE6 WSPEED EMISFACT LF_WE1 WSPEED EMISFACT LF_WE2 WSPEED EMISFACT LF_WE3 WSPEED EMISFACT LF_WE4 WSPEED ** Variable Emissions Type: "By Hour-of-Day (HROFDY)" ** Variable Emission Scenario: "H11" EMISFACT QBLA HROFDY EMISFACT QBLA HROFDY Job ID AQU-VC D-15 Appendix D - AERMOD Model Files.docx
198 EMISFACT QBLA HROFDY EMISFACT QBLA HROFDY SRCGROUP Others QP1 QP2 QP3 QP4 QP5 QWE1 QWE2 QWE3 QWE4 QWE5 QWE6 QRD1 SRCGROUP Others QRD2 QRD3 QRD4 QRD5 QRD6 ASP1 ASP2 ASP3 QBLA SRCGROUP LandFill LF_WE1 LF_WE2 LF_WE3 LF_WE4 LF_FACE1 LF_FACE2 LANDF_RD1 SRCGROUP LandFill LANDF_RD2 LANDF_RD3 LANDF_RD4 LANDF_RD5 LANDF_RD6 LANDF_RD7 SRCGROUP LandFill LANDF_RD8 LANDF_RD9 LANDF_RD10 LANDF_RD11 LANDF_RD12 SRCGROUP LandFill LANDF_RD13 LANDF_RD14 LANDF_RD15 LANDF_RD16 LANDF_RD17 SRCGROUP LandFill LANDF_RD18 LANDF_RD19 LANDF_RD20 LANDF_RD21 LANDF_RD22 SRCGROUP LandFill LANDF_RD23 LANDF_RD24 LANDF_RD25 LANDF_RD26 LANDF_RD27 SRCGROUP LandFill LANDF_RD28 LANDF_RD29 LANDF_RD30 LANDF_RD31 LANDF_RD32 SRCGROUP LandFill LANDF_RD33 LANDF_RD34 LANDF_RD35 SRCGROUP ALL BACKGROUND SO FINISHED ** **************************************** ** AERMOD Receptor Pathway **************************************** ** ** RE STARTING GRIDCART UCART1 STA XYINC GRIDCART UCART1 END Job ID AQU-VC D-16 Appendix D - AERMOD Model Files.docx
199 ** DESCRREC "" "" DISCCART DISCCART DISCCART DISCCART DISCCART DISCCART DISCCART DISCCART DISCCART DISCCART DISCCART DISCCART DISCCART DISCCART DISCCART DISCCART DISCCART RE FINISHED ** **************************************** ** AERMOD Meteorology Pathway **************************************** ** ** ME STARTING SURFFILE..\..\..\EPA\DEERPK08.SFC PROFFILE..\..\..\EPA\DEERPK08.PFL Job ID AQU-VC D-17 Appendix D - AERMOD Model Files.docx
200 SURFDATA UAIRDATA PROFBASE 64.0 METERS WINDCATS ME FINISHED ** **************************************** ** AERMOD Output Pathway **************************************** ** ** OU STARTING RECTABLE ALLAVE 1ST RECTABLE 24 1ST-2ND 6TH MAXTABLE ALLAVE 100 ** Auto-Generated Plotfiles PLOTFILE 24 ALL 1ST S1_2008.AD\24H1GALL.PLT 32 PLOTFILE 24 Others 1ST S1_2008.AD\24H1GOTHERS.PLT 33 PLOTFILE 24 LandFill 1ST S1_2008.AD\24H1GLANDFILL.PLT 34 PLOTFILE 24 ALL 2ND S1_2008.AD\24H2GALL.PLT 35 PLOTFILE 24 Others 2ND S1_2008.AD\24H2GOTHERS.PLT 36 PLOTFILE 24 LandFill 2ND S1_2008.AD\24H2GLANDFILL.PLT 37 PLOTFILE 24 ALL 6TH S1_2008.AD\24H6GALL.PLT 38 PLOTFILE 24 Others 6TH S1_2008.AD\24H6GOTHERS.PLT 39 PLOTFILE 24 LandFill 6TH S1_2008.AD\24H6GLANDFILL.PLT 40 SUMMFILE S1_2008.sum Job ID AQU-VC D-18 Appendix D - AERMOD Model Files.docx
201 OU FINISHED ** **************************************** ** Project Parameters **************************************** ** PROJCTN CoordinateSystemUTM ** DESCPTN UTM: Universal Transverse Mercator ** DATUM World Geodetic System 1984 ** DTMRGN Global Definition ** UNITS m ** ZONE -55 ** ZONEINX 0 ** D.3 DUST DEPOSITION MODEL FILE ** **************************************** ** ** AERMOD Input Produced by: ** AERMOD View Ver ** Lakes Environmental Software Inc. ** Date: 28/08/2015 ** File: C:\Jobs\20496\Run 1\Dep\Base_2008\AERMOD.inp ** **************************************** ** ** **************************************** ** AERMOD Control Pathway Job ID AQU-VC D-19 Appendix D - AERMOD Model Files.docx
202 **************************************** ** ** CO STARTING TITLEONE Base Case, Dust deposition ** Updates: ** - new sensitive receptors locations (R1 to R17) ** - new scenarios ** - new haul roads (same haul road for base case) ** - existing quarry operations (Scenario 1 from latest assessment ) instead of future quarry operations ** - emission estimates updated based on: ** 1. new haul roads ** 2. increased vehicle traffic based on new transport assessment report ** 3. updated cell areas ** 4. new waste volumes ** 5. increased active face area (from 1,600 m² to 1,800 m²) ** 6. existing quarry operations (Scenario 1 from latest assessment ) instead of future quarry operations ** 7. operating hours updated from 6,205 hrs/yr to 8,760 hrs/yr (updated emission rates) MODELOPT DDEP DRYDPLT FLAT AVERTIME 24 MONTH PERIOD POLLUTID TSP RUNORNOT RUN ERRORFIL BASE_2008.ERR CO FINISHED Job ID AQU-VC D-20 Appendix D - AERMOD Model Files.docx
203 ** **************************************** ** AERMOD Source Pathway **************************************** ** ** SO STARTING ** Source Location ** ** Source ID - Type - X Coord. - Y Coord. ** LOCATION QP1 VOLUME ** DESCRSRC QuarryPlant LOCATION QP2 VOLUME ** DESCRSRC QuarryPlant LOCATION QP3 VOLUME ** DESCRSRC QuarryPlant LOCATION QP4 VOLUME ** DESCRSRC QuarryPlant LOCATION QP5 VOLUME ** DESCRSRC QuarryPlant LOCATION QWE1 VOLUME ** DESCRSRC QWindErosion LOCATION QWE2 VOLUME ** DESCRSRC QWindErosion LOCATION QWE3 VOLUME ** DESCRSRC QWindErosion LOCATION QWE4 VOLUME ** DESCRSRC QWindErosion LOCATION QWE5 VOLUME Job ID AQU-VC D-21 Appendix D - AERMOD Model Files.docx
204 ** DESCRSRC QWindErosion LOCATION QWE6 VOLUME ** DESCRSRC QWindErosion LOCATION QRD1 VOLUME ** DESCRSRC Quarry road LOCATION QRD2 VOLUME ** DESCRSRC Qroad LOCATION QRD3 VOLUME ** DESCRSRC Qroad LOCATION QRD4 VOLUME ** DESCRSRC Qroad LOCATION QRD5 VOLUME ** DESCRSRC Qroad LOCATION QRD6 VOLUME ** DESCRSRC Qroad LOCATION ASP1 VOLUME ** DESCRSRC Asphalt non-stack LOCATION QBLA VOLUME ** DESCRSRC QBlast LOCATION ASP2 POINT ** DESCRSRC Dryer Stack LOCATION ASP3 POINT ** DESCRSRC Dryer Stack LOCATION LANDF_RD1 VOLUME ** DESCRSRC Landfill Haul Road LOCATION LANDF_RD2 VOLUME ** DESCRSRC Landfill Haul Road LOCATION LANDF_RD3 VOLUME Job ID AQU-VC D-22 Appendix D - AERMOD Model Files.docx
205 ** DESCRSRC Landfill Haul Road LOCATION LANDF_RD4 VOLUME ** DESCRSRC Landfill Haul Road LOCATION LANDF_RD5 VOLUME ** DESCRSRC Landfill Haul Road LOCATION LANDF_RD6 VOLUME ** DESCRSRC Landfill Haul Road LOCATION LANDF_RD7 VOLUME ** DESCRSRC Landfill Haul Road LOCATION LANDF_RD8 VOLUME ** DESCRSRC Landfill Haul Road LOCATION LANDF_RD9 VOLUME ** DESCRSRC Landfill Haul Road LOCATION LANDF_RD10 VOLUME ** DESCRSRC Landfill Haul Road LOCATION LANDF_RD11 VOLUME ** DESCRSRC Landfill Haul Road LOCATION LANDF_RD12 VOLUME ** DESCRSRC Landfill Haul Road LOCATION LANDF_RD13 VOLUME ** DESCRSRC Landfill Haul Road LOCATION LANDF_RD14 VOLUME ** DESCRSRC Landfill Haul Road LOCATION LANDF_RD15 VOLUME ** DESCRSRC Landfill Haul Road LOCATION LANDF_RD16 VOLUME ** DESCRSRC Landfill Haul Road LOCATION LANDF_RD17 VOLUME Job ID AQU-VC D-23 Appendix D - AERMOD Model Files.docx
206 ** DESCRSRC Landfill Haul Road LOCATION LANDF_RD18 VOLUME ** DESCRSRC Landfill Haul Road LOCATION LANDF_RD19 VOLUME ** DESCRSRC Landfill Haul Road LOCATION LANDF_RD20 VOLUME ** DESCRSRC Landfill Haul Road LOCATION LANDF_RD21 VOLUME ** DESCRSRC Landfill Haul Road LOCATION LANDF_RD22 VOLUME ** DESCRSRC Landfill Haul Road LOCATION LANDF_RD23 VOLUME ** DESCRSRC Landfill Haul Road LOCATION LANDF_RD24 VOLUME ** DESCRSRC Landfill Haul Road LOCATION LANDF_RD25 VOLUME ** DESCRSRC Landfill Haul Road LOCATION LANDF_RD26 VOLUME ** DESCRSRC Landfill Haul Road LOCATION LANDF_RD27 VOLUME ** DESCRSRC Landfill Haul Road LOCATION LANDF_RD28 VOLUME ** DESCRSRC Landfill Haul Road LOCATION LANDF_RD29 VOLUME ** DESCRSRC Landfill Haul Road LOCATION LANDF_RD30 VOLUME ** DESCRSRC Landfill Haul Road LOCATION LANDF_RD31 VOLUME Job ID AQU-VC D-24 Appendix D - AERMOD Model Files.docx
207 ** DESCRSRC Landfill Haul Road LOCATION LANDF_RD32 VOLUME ** DESCRSRC Landfill Haul Road LOCATION LANDF_RD33 VOLUME ** DESCRSRC Landfill Haul Road LOCATION LANDF_RD34 VOLUME ** DESCRSRC Landfill Haul Road LOCATION LANDF_RD35 VOLUME ** DESCRSRC Landfill Haul Road LOCATION LANDF_RD36 VOLUME ** DESCRSRC Landfill Haul Road LOCATION LANDF_RD37 VOLUME ** DESCRSRC Landfill Haul Road LOCATION LANDF_RD38 VOLUME ** DESCRSRC Landfill Haul Road LOCATION LANDF_RD39 VOLUME ** DESCRSRC Landfill Haul Road LOCATION LANDF_RD40 VOLUME ** DESCRSRC Landfill Haul Road LOCATION LANDF_RD41 VOLUME ** DESCRSRC Landfill Haul Road LOCATION LANDF_RD42 VOLUME ** DESCRSRC Landfill Haul Road LOCATION LANDF_RD43 VOLUME ** DESCRSRC Landfill Haul Road LOCATION LANDF_RD44 VOLUME ** DESCRSRC Landfill Haul Road LOCATION LANDF_RD45 VOLUME Job ID AQU-VC D-25 Appendix D - AERMOD Model Files.docx
208 ** DESCRSRC Landfill Haul Road LOCATION LANDF_RD46 VOLUME ** DESCRSRC Landfill Haul Road LOCATION LANDF_RD47 VOLUME ** DESCRSRC Landfill Haul Road LOCATION LANDF_RD48 VOLUME ** DESCRSRC Landfill Haul Road LOCATION LANDF_RD49 VOLUME ** DESCRSRC Landfill Haul Road LOCATION LANDF_RD50 VOLUME ** DESCRSRC Landfill Haul Road LOCATION LANDF_RD51 VOLUME ** DESCRSRC Landfill Haul Road LOCATION LANDF_RD52 VOLUME ** DESCRSRC Landfill Haul Road LOCATION LANDF_RD53 VOLUME ** DESCRSRC Landfill Haul Road LOCATION LANDF_RD54 VOLUME ** DESCRSRC Landfill Haul Road LOCATION LANDF_RD55 VOLUME ** DESCRSRC Landfill Haul Road LOCATION LF_WE1 VOLUME ** DESCRSRC landfill active cell wind erosion LOCATION LF_WE2 VOLUME ** DESCRSRC landfill active cell wind erosion LOCATION LF_WE3 VOLUME ** DESCRSRC landfill active cell wind erosion LOCATION LF_WE4 VOLUME Job ID AQU-VC D-26 Appendix D - AERMOD Model Files.docx
209 ** DESCRSRC landfill active cell wind erosion LOCATION LF_FACE1 VOLUME ** DESCRSRC landfill lumped activities on the active face (except wind erosion) LOCATION LF_FACE2 VOLUME ** Source Parameters ** SRCPARAM QP SRCPARAM QP SRCPARAM QP SRCPARAM QP SRCPARAM QP SRCPARAM QWE SRCPARAM QWE SRCPARAM QWE SRCPARAM QWE SRCPARAM QWE SRCPARAM QWE SRCPARAM QRD SRCPARAM QRD SRCPARAM QRD SRCPARAM QRD SRCPARAM QRD SRCPARAM QRD SRCPARAM QBLA SRCPARAM ASP SRCPARAM ASP SRCPARAM ASP SRCPARAM LF_WE Job ID AQU-VC D-27 Appendix D - AERMOD Model Files.docx
210 SRCPARAM LF_WE SRCPARAM LF_WE SRCPARAM LF_WE SRCPARAM LF_FACE SRCPARAM LF_FACE SRCPARAM LANDF_RD SRCPARAM LANDF_RD SRCPARAM LANDF_RD SRCPARAM LANDF_RD SRCPARAM LANDF_RD SRCPARAM LANDF_RD SRCPARAM LANDF_RD SRCPARAM LANDF_RD SRCPARAM LANDF_RD SRCPARAM LANDF_RD SRCPARAM LANDF_RD SRCPARAM LANDF_RD SRCPARAM LANDF_RD SRCPARAM LANDF_RD SRCPARAM LANDF_RD SRCPARAM LANDF_RD SRCPARAM LANDF_RD SRCPARAM LANDF_RD SRCPARAM LANDF_RD SRCPARAM LANDF_RD SRCPARAM LANDF_RD SRCPARAM LANDF_RD SRCPARAM LANDF_RD Job ID AQU-VC D-28 Appendix D - AERMOD Model Files.docx
211 SRCPARAM LANDF_RD SRCPARAM LANDF_RD SRCPARAM LANDF_RD SRCPARAM LANDF_RD SRCPARAM LANDF_RD SRCPARAM LANDF_RD SRCPARAM LANDF_RD SRCPARAM LANDF_RD SRCPARAM LANDF_RD SRCPARAM LANDF_RD SRCPARAM LANDF_RD SRCPARAM LANDF_RD SRCPARAM LANDF_RD SRCPARAM LANDF_RD SRCPARAM LANDF_RD SRCPARAM LANDF_RD SRCPARAM LANDF_RD SRCPARAM LANDF_RD SRCPARAM LANDF_RD SRCPARAM LANDF_RD SRCPARAM LANDF_RD SRCPARAM LANDF_RD SRCPARAM LANDF_RD SRCPARAM LANDF_RD SRCPARAM LANDF_RD SRCPARAM LANDF_RD SRCPARAM LANDF_RD SRCPARAM LANDF_RD Job ID AQU-VC D-29 Appendix D - AERMOD Model Files.docx
212 SRCPARAM LANDF_RD SRCPARAM LANDF_RD SRCPARAM LANDF_RD SRCPARAM LANDF_RD ** Variable Emissions Type: "By Hour-of-Day (HROFDY)" ** Variable Emission Scenario: "H11" EMISFACT QBLA HROFDY EMISFACT QBLA HROFDY EMISFACT QBLA HROFDY EMISFACT QBLA HROFDY ** Variable Emissions Type: "By Wind Speed (WSPEED)" ** Variable Emission Scenario: "Scenario 3" EMISFACT QWE1 WSPEED EMISFACT QWE2 WSPEED EMISFACT QWE3 WSPEED EMISFACT QWE4 WSPEED EMISFACT QWE5 WSPEED EMISFACT QWE6 WSPEED EMISFACT LF_WE1 WSPEED EMISFACT LF_WE2 WSPEED EMISFACT LF_WE3 WSPEED EMISFACT LF_WE4 WSPEED Job ID AQU-VC D-30 Appendix D - AERMOD Model Files.docx
213 PARTDIAM ASP PARTDIAM ASP PARTDIAM ASP PARTDIAM QP PARTDIAM QP PARTDIAM QP PARTDIAM QP PARTDIAM QP PARTDIAM QWE PARTDIAM QWE PARTDIAM QWE PARTDIAM QWE PARTDIAM QWE PARTDIAM QWE PARTDIAM QRD PARTDIAM QRD PARTDIAM QRD PARTDIAM QRD PARTDIAM QRD PARTDIAM QRD PARTDIAM QBLA PARTDIAM LF_WE PARTDIAM LF_WE PARTDIAM LF_WE PARTDIAM LF_WE PARTDIAM LF_FACE PARTDIAM LF_FACE Job ID AQU-VC D-31 Appendix D - AERMOD Model Files.docx
214 PARTDIAM LANDF_RD PARTDIAM LANDF_RD PARTDIAM LANDF_RD PARTDIAM LANDF_RD PARTDIAM LANDF_RD PARTDIAM LANDF_RD PARTDIAM LANDF_RD PARTDIAM LANDF_RD PARTDIAM LANDF_RD PARTDIAM LANDF_RD PARTDIAM LANDF_RD PARTDIAM LANDF_RD PARTDIAM LANDF_RD PARTDIAM LANDF_RD PARTDIAM LANDF_RD PARTDIAM LANDF_RD PARTDIAM LANDF_RD PARTDIAM LANDF_RD PARTDIAM LANDF_RD PARTDIAM LANDF_RD PARTDIAM LANDF_RD PARTDIAM LANDF_RD PARTDIAM LANDF_RD PARTDIAM LANDF_RD PARTDIAM LANDF_RD PARTDIAM LANDF_RD PARTDIAM LANDF_RD PARTDIAM LANDF_RD Job ID AQU-VC D-32 Appendix D - AERMOD Model Files.docx
215 PARTDIAM LANDF_RD PARTDIAM LANDF_RD PARTDIAM LANDF_RD PARTDIAM LANDF_RD PARTDIAM LANDF_RD PARTDIAM LANDF_RD PARTDIAM LANDF_RD PARTDIAM LANDF_RD PARTDIAM LANDF_RD PARTDIAM LANDF_RD PARTDIAM LANDF_RD PARTDIAM LANDF_RD PARTDIAM LANDF_RD PARTDIAM LANDF_RD PARTDIAM LANDF_RD PARTDIAM LANDF_RD PARTDIAM LANDF_RD PARTDIAM LANDF_RD PARTDIAM LANDF_RD PARTDIAM LANDF_RD PARTDIAM LANDF_RD PARTDIAM LANDF_RD PARTDIAM LANDF_RD PARTDIAM LANDF_RD PARTDIAM LANDF_RD PARTDIAM LANDF_RD PARTDIAM LANDF_RD MASSFRAX ASP Job ID AQU-VC D-33 Appendix D - AERMOD Model Files.docx
216 MASSFRAX ASP MASSFRAX ASP MASSFRAX QP MASSFRAX QP MASSFRAX QP MASSFRAX QP MASSFRAX QP MASSFRAX QWE MASSFRAX QWE MASSFRAX QWE MASSFRAX QWE MASSFRAX QWE MASSFRAX QWE MASSFRAX QRD MASSFRAX QRD MASSFRAX QRD MASSFRAX QRD MASSFRAX QRD MASSFRAX QRD MASSFRAX QBLA MASSFRAX LF_WE MASSFRAX LF_WE MASSFRAX LF_WE MASSFRAX LF_WE MASSFRAX LF_FACE MASSFRAX LF_FACE MASSFRAX LANDF_RD MASSFRAX LANDF_RD Job ID AQU-VC D-34 Appendix D - AERMOD Model Files.docx
217 MASSFRAX LANDF_RD MASSFRAX LANDF_RD MASSFRAX LANDF_RD MASSFRAX LANDF_RD MASSFRAX LANDF_RD MASSFRAX LANDF_RD MASSFRAX LANDF_RD MASSFRAX LANDF_RD MASSFRAX LANDF_RD MASSFRAX LANDF_RD MASSFRAX LANDF_RD MASSFRAX LANDF_RD MASSFRAX LANDF_RD MASSFRAX LANDF_RD MASSFRAX LANDF_RD MASSFRAX LANDF_RD MASSFRAX LANDF_RD MASSFRAX LANDF_RD MASSFRAX LANDF_RD MASSFRAX LANDF_RD MASSFRAX LANDF_RD MASSFRAX LANDF_RD MASSFRAX LANDF_RD MASSFRAX LANDF_RD MASSFRAX LANDF_RD MASSFRAX LANDF_RD MASSFRAX LANDF_RD MASSFRAX LANDF_RD Job ID AQU-VC D-35 Appendix D - AERMOD Model Files.docx
218 MASSFRAX LANDF_RD MASSFRAX LANDF_RD MASSFRAX LANDF_RD MASSFRAX LANDF_RD MASSFRAX LANDF_RD MASSFRAX LANDF_RD MASSFRAX LANDF_RD MASSFRAX LANDF_RD MASSFRAX LANDF_RD MASSFRAX LANDF_RD MASSFRAX LANDF_RD MASSFRAX LANDF_RD MASSFRAX LANDF_RD MASSFRAX LANDF_RD MASSFRAX LANDF_RD MASSFRAX LANDF_RD MASSFRAX LANDF_RD MASSFRAX LANDF_RD MASSFRAX LANDF_RD MASSFRAX LANDF_RD MASSFRAX LANDF_RD MASSFRAX LANDF_RD MASSFRAX LANDF_RD MASSFRAX LANDF_RD MASSFRAX LANDF_RD PARTDENS ASP PARTDENS ASP PARTDENS ASP Job ID AQU-VC D-36 Appendix D - AERMOD Model Files.docx
219 PARTDENS QP PARTDENS QP PARTDENS QP PARTDENS QP PARTDENS QP PARTDENS QWE PARTDENS QWE PARTDENS QWE PARTDENS QWE PARTDENS QWE PARTDENS QWE PARTDENS QRD PARTDENS QRD PARTDENS QRD PARTDENS QRD PARTDENS QRD PARTDENS QRD PARTDENS QBLA PARTDENS LF_WE PARTDENS LF_WE PARTDENS LF_WE PARTDENS LF_WE PARTDENS LF_FACE PARTDENS LF_FACE PARTDENS LANDF_RD PARTDENS LANDF_RD PARTDENS LANDF_RD PARTDENS LANDF_RD Job ID AQU-VC D-37 Appendix D - AERMOD Model Files.docx
220 PARTDENS LANDF_RD PARTDENS LANDF_RD PARTDENS LANDF_RD PARTDENS LANDF_RD PARTDENS LANDF_RD PARTDENS LANDF_RD PARTDENS LANDF_RD PARTDENS LANDF_RD PARTDENS LANDF_RD PARTDENS LANDF_RD PARTDENS LANDF_RD PARTDENS LANDF_RD PARTDENS LANDF_RD PARTDENS LANDF_RD PARTDENS LANDF_RD PARTDENS LANDF_RD PARTDENS LANDF_RD PARTDENS LANDF_RD PARTDENS LANDF_RD PARTDENS LANDF_RD PARTDENS LANDF_RD PARTDENS LANDF_RD PARTDENS LANDF_RD PARTDENS LANDF_RD PARTDENS LANDF_RD PARTDENS LANDF_RD PARTDENS LANDF_RD PARTDENS LANDF_RD Job ID AQU-VC D-38 Appendix D - AERMOD Model Files.docx
221 PARTDENS LANDF_RD PARTDENS LANDF_RD PARTDENS LANDF_RD PARTDENS LANDF_RD PARTDENS LANDF_RD PARTDENS LANDF_RD PARTDENS LANDF_RD PARTDENS LANDF_RD PARTDENS LANDF_RD PARTDENS LANDF_RD PARTDENS LANDF_RD PARTDENS LANDF_RD PARTDENS LANDF_RD PARTDENS LANDF_RD PARTDENS LANDF_RD PARTDENS LANDF_RD PARTDENS LANDF_RD PARTDENS LANDF_RD PARTDENS LANDF_RD PARTDENS LANDF_RD PARTDENS LANDF_RD PARTDENS LANDF_RD PARTDENS LANDF_RD SRCGROUP OTHERS QP1 QP2 QP3 QP4 QP5 QWE1 QWE2 QWE3 QWE4 QWE5 QWE6 QRD1 SRCGROUP OTHERS QRD2 QRD3 QRD4 QRD5 QRD6 ASP1 ASP2 ASP3 QBLA SRCGROUP LANDFILL LF_WE1 LF_WE2 LF_WE3 LF_WE4 LF_FACE1 LF_FACE2 LANDF_RD1 SRCGROUP LANDFILL LANDF_RD2 LANDF_RD3 LANDF_RD4 LANDF_RD5 LANDF_RD6 LANDF_RD7 SRCGROUP LANDFILL LANDF_RD8 LANDF_RD9 LANDF_RD10 LANDF_RD11 LANDF_RD12 Job ID AQU-VC D-39 Appendix D - AERMOD Model Files.docx
222 SRCGROUP LANDFILL LANDF_RD13 LANDF_RD14 LANDF_RD15 LANDF_RD16 LANDF_RD17 SRCGROUP LANDFILL LANDF_RD18 LANDF_RD19 LANDF_RD20 LANDF_RD21 LANDF_RD22 SRCGROUP LANDFILL LANDF_RD23 LANDF_RD24 LANDF_RD25 LANDF_RD26 LANDF_RD27 SRCGROUP LANDFILL LANDF_RD28 LANDF_RD29 LANDF_RD30 LANDF_RD31 LANDF_RD32 SRCGROUP LANDFILL LANDF_RD33 LANDF_RD34 LANDF_RD35 LANDF_RD36 LANDF_RD37 SRCGROUP LANDFILL LANDF_RD38 LANDF_RD39 LANDF_RD40 LANDF_RD41 LANDF_RD42 SRCGROUP LANDFILL LANDF_RD43 LANDF_RD44 LANDF_RD45 LANDF_RD46 LANDF_RD47 SRCGROUP LANDFILL LANDF_RD48 LANDF_RD49 LANDF_RD50 LANDF_RD51 LANDF_RD52 SRCGROUP LANDFILL LANDF_RD53 LANDF_RD54 LANDF_RD55 SRCGROUP ALL SO FINISHED ** **************************************** ** AERMOD Receptor Pathway **************************************** ** ** RE STARTING GRIDCART UCART1 STA XYINC GRIDCART UCART1 END ** DESCRREC "" "" DISCCART DISCCART DISCCART Job ID AQU-VC D-40 Appendix D - AERMOD Model Files.docx
223 DISCCART DISCCART DISCCART DISCCART DISCCART DISCCART DISCCART DISCCART DISCCART DISCCART DISCCART DISCCART DISCCART DISCCART RE FINISHED ** **************************************** ** AERMOD Meteorology Pathway **************************************** ** ** ME STARTING SURFFILE..\..\..\EPA\DEERPK08.SFC PROFFILE..\..\..\EPA\DEERPK08.PFL SURFDATA UAIRDATA PROFBASE 64.0 METERS Job ID AQU-VC D-41 Appendix D - AERMOD Model Files.docx
224 WINDCATS ME FINISHED ** **************************************** ** AERMOD Output Pathway **************************************** ** ** OU STARTING RECTABLE ALLAVE 1ST RECTABLE 24 1ST RECTABLE MONTH 1ST MAXTABLE ** Auto-Generated Plotfiles PLOTFILE MONTH ALL 1ST BASE_2008.AD\MOH1GALL.PLT 32 PLOTFILE MONTH OTHERS 1ST BASE_2008.AD\MOH1GOTHERS.PLT 33 PLOTFILE MONTH LANDFILL 1ST BASE_2008.AD\MOH1GLANDFILL.PLT 34 SUMMFILE BASE_2008.SUM OU FINISHED ** **************************************** ** Project Parameters **************************************** ** PROJCTN CoordinateSystemUTM ** DESCPTN UTM: Universal Transverse Mercator ** DATUM World Geodetic System 1984 Job ID AQU-VC D-42 Appendix D - AERMOD Model Files.docx
225 ** DTMRGN Global Definition ** UNITS m ** ZONE -55 ** ZONEINX 0 ** Job ID AQU-VC D-43 Appendix D - AERMOD Model Files.docx
226 Appendix E CFD MODELLING IN RELATION TO WINDBLOWN DUST EMISSIONS Job ID AQU-VC E Cleanaway Melbourne Regional Landfill AQA R10 Low Res.docx
227 E.1 INTRODUCTION The extraction and processing of material from quarries and pits can produce significant fugitive emissions as a result of site activities such as blasting, unpaved roads, loading, crushing, screening and stockpiling. The initial entrainment and subsequent dispersion of fugitive dust presents a process complicated by the in-pit topography. This in turn impacts on the accuracy and reliability of the conventional Gaussian plume based computational prediction methods employed for regulatory compliance (e.g., AERMOD). This section presents a numerical based flow analysis of a typical cell pit at the Melbourne Regional Landfill (MRL) utilising computational fluid dynamics (CFD). Results of the CFD modelling are presented in terms of the potential impact of pit topography on wind and turbulence. The investigation shows significant wind speed and turbulent kinetic energy reduction along the cell pit floor and decoupling of the floor in the pit from the ambient flow when the cell is at the early stage of filling. These reductions may have potentially greater impact on dust emissions from the cell pit floor than the 50% and 10% pit retention factor cited by the National Pollution Inventory (NPI) for TSP and PM10 respectively. The wind speed reduction would also reduce odour emissions from newly placed waste still exposed to the atmosphere. The effect of this reduction in odour and dust would diminish as the cell height approaches that of nearby terrain. Job ID AQU-VC E-2 Appendix E - CFD Modelling in Relation to Windblown Dust Emissions.docx
228 E.2 METHODOLOGY E.2.1 CFD Modelling For this investigation we used the Computational Fluid Dynamics (CFD) solver Easy_CFD to simulate fluid flow. Easy_CFD solves the governing equations using a finite volume approach whereby the conservation equations for the fluid entering and leaving the volume are integrated over the finite control cells (Lopes, 2013). The conservation laws for mass (continuity), momentum and energy form a closed set of modelling equations that can be solved for specified initial and boundary conditions. The exact solution of the equations provides a continuous distribution of the conservation variables (i.e. turbulent kinetic energy and dissipation of turbulent energy, or vector components such as the fluid velocity) in terms of 2- dimnsional spatial co-ordinates and time. However, it is well known that an exact solution is rarely available, with various numerical methods used to replace the continuous distribution by one at a set of discrete points in space and time. Through the discretisation of the modelling equations over the solution domain (space and time), the modelling equations are converted into a system of algebraic equations for which a general numerical method solution can be formulated. The computational domain is established and divided into a number of non-overlapping control cells that constitute the numerical grid. A numerical grid, composed from a finite number of control cells, is obtained through the discretisation in space of the solution domain. The quality of the flow solution is dependent on the mesh characteristics. The requirements for a good mesh are: High resolution in regions where flow characteristics are expected to result in higher gradients (e.g. solid walls) Mesh spacing should change gradually to reduce discretisation errors. Low degree of skewness (e.g. angle of intersection of mesh lines should be less than 90 ) to reduce discretisation errors. The transport equations in Easy_CFD incorporate fundamental equations of fluid transport, including Navier-Stokes, continuity, energy conservation and a turbulence models. The k-ε turbulence model is used to obtain a steady-state solution of the conservation equations. The k-ε turbulence model is the most widely used turbulence model, particularly for industrial applications. It is numerically robust and has been tested in a wide range of flow scenarios including heat transfer, combustion, and two-phase flows. It is generally accepted that the k-ε model usually yields realistic predictions of major mean flow features in most situations. The flow is treated as incompressible and employs an upwind time differencing scheme for the solution of the energy and turbulence equations and a First or Second Order Backward Euler differencing scheme for the momentum and continuity equations. Easy_CFD adopts the SIMPLEC algorithm (Semi-Implicit Method for Pressure Linked Equations-Consistent) proposed by Van Doormaal and Raithby (1984). E.2.2 Model Configuration The configuration and meshing of the CFD model domain is integral to the model outcomes. The domain and meshing needs to be sufficient to capture the important features of the flow. However, an overly detailed configuration is both computationally and practically more demanding of time. To best represent the critical features of the study, while also providing for efficient use of both computational and practical effort, the following methodology will be employed in the development of the CFD model configuration: Job ID AQU-VC E-3 Appendix E - CFD Modelling in Relation to Windblown Dust Emissions.docx

229 The cell is defined as a pit 150 m long and 45 m deep to approximate an active cell at the early stage of filling and with potentially higher terrain around it (Figure E.1). The cell has been idealised as a symmetrical square. Terrain effects have not been incorporated, with the surrounding terrain assumed flat. Figure E.1: Photograph of cell for CFD modelling E.2.3 Model domains The domain was meshed with over 21,728 cells with highest cell density (i.e. smaller cells) over and immediately around the edges of the pit to capture the sharp vertical gradients expected near these surfaces. A cross section of the idealised pit and associated meshing configuration is presented in Figure E.2. Job ID AQU-VC E-4 Appendix E - CFD Modelling in Relation to Windblown Dust Emissions.docx

230 Figure E.2: Image of the modelling domain including the mesh structure. The inlet atmospheric boundary layer flow is based on similarity parameterisations appropriate for the atmospheric boundary layer. A wind speed of 5 m/s was selected for the boundary as this approximates the speed at which dust lift-off may occur. Only one flow direction is modelled. The SST (Shear Stress Transport) turbulence model was used. This is a two-equation eddy-viscosity turbulence model that combines the k-omega turbulence model and k-epsilon turbulence model such that the k- omega is used in the inner region of the boundary layer and switches to the k-epilson in the free shear flow. Turbulence intensity is the ratio of the root-mean-square of the velocity fluctuations, u`, to the mean free stream velocity, u. An inlet turbulence intensity value of 0.1 was selected based on measurements undertaken at 5 m/s over relatively flat terrain (Nino and Eecen, 2002). Another important parameter in the numerical simulation of atmospheric boundary layers is the turbulence length scale (L) which represents the size of eddies in the boundary layer. A value of 100 m was selected based on the research of Yang and Zhang (2009). The outlet boundary is treated as conservative, whereby the outlet mass flow is automatically computed so as to satisfy conservation of mass. The boundary at the top of the domain was configured as a symmetry boundary, whereby a null gradient condition is imposed on the energy, turbulence and momentum equations. Job ID AQU-VC E-5 Appendix E - CFD Modelling in Relation to Windblown Dust Emissions.docx

231 Figure E.3: Image of the modelling domain showing inlet and outlet boundaries. Job ID AQU-VC E-6 Appendix E - CFD Modelling in Relation to Windblown Dust Emissions.docx
232 E.3 RESULTS The flow characteristics are simulated for atmospheric conditions and wind speed as detailed in Table E.1. Table E.1: Wind speed and atmospheric conditions of the ambient flow. Parameter Value Wind speed 5.0 m/s (constant vertical profile) Wind Direction 0.0 (perpendicular to wind break wall) Reference temperature 25.0 C Reference pressure 101,300 pa Thermal effect Non-isothermal. Density variations accounted for by buoyancy term I=-g(ρ-ρref) Turbulence SST model, Turbulence length scale=100 m, Turbulence intensity=0.1 Figure E.4 (upper) shows the horizontal wind speed simulated for the cell pit using CFD modelling. A region of maximum wind velocity ~6 m/s) seen at the windward crest of the pit is due to local acceleration through the pressure differential. Conversely, reduced velocity occurs in the pit. Wind streamlines show clear decoupling of the atmospheric flow, with momentum not reaching down to the cell pit floor. Some recirculation is seen in the pit (negative streamfunction). Dust can also be produced through the development of near surface vortices and increased turbulent mixing (Solomos et al, 2012). Consequently inspection of turbulent kinetic energy (TKE) fields is important to assess potential for dust lift-off. Figure E.5 shows that turbulent kinetic energy is reduced above the pit floor, but elevated along the far side of the pit slope. Job ID AQU-VC E-7 Appendix E - CFD Modelling in Relation to Windblown Dust Emissions.docx
 and")

233 Figure E.4: Wind velocity contours (upper) and streamlines/streamfunction (lower). Note that horizontal scale equals vertical scale. Job ID AQU-VC E-8 Appendix E - CFD Modelling in Relation to Windblown Dust Emissions.docx

234 Figure E.5: Turbulent kinetic energy contours. Note that horizontal scale equals vertical scale. Job ID AQU-VC E-9 Appendix E - CFD Modelling in Relation to Windblown Dust Emissions.docx
235 E.4 DISCUSSION An along-wind section at a height 0.5 m above the ground was taken in order to further assess the effects of the cell pit on wind velocity and turbulent kinetic energy (TKE) (Figure E.6). Figure E.6: Along-wind section extract for further analysis. Figure E.7 (upper) shows wind velocity along the transect in Figure E.6. As evidenced in the previous section, there is an 80 to 90% decrease in wind velocity along the pit floor. Local acceleration to 5.5 m/s is seen along the windward crest of the pit. TKE is shown in Figure E.7 (lower). In contrast to wind speed, TKE shows a gradual increase with downwind distance along the pit floor. However, these values are lower than the TKE values outside the pit. Job ID AQU-VC E-10 Appendix E - CFD Modelling in Relation to Windblown Dust Emissions.docx
236 Figure E.7: Wind speed (upper) and TKE (lower) for the along wind section. The approximate topography of the cell pit is also shown. Job ID AQU-VC E-11 Appendix E - CFD Modelling in Relation to Windblown Dust Emissions.docx
237 E.5 CONCLUSIONS Screening CFD modelling has been performed on an idealised cell pit (150 m long and 45 m high) at MRL. Use was made of the Easy_CFD solver software and modelling was performed with model inlet conditions set at: Wind speed: 5.0 m/s (constant vertical profile) One wind direction Temperature: 25.0 C Pressure: 101,300 pa Non-isothermal with density variations accounted for by buoyancy term. Results of the CFD modelling show that: There is a decoupling of the flow outside and within the pit, with substantially reduced velocity within the pit. Turbulent kinetic energy is reduced along the upwind pit slope, increasing with distance along the pit to a maximum value along the downwind pit slope. At 50 cm above the ground the wind speed reduction along the cell pit floor is reduced to between 10 and 20% of the initial wind. The screening CFD modelling therefore shows significant wind speed and turbulent kinetic energy reduction along the cell pit floor and decoupling of the floor in the pit from the ambient flow. These reductions may therefore have potentially greater impact on dust emissions from the cell pit floor than the 50% and 10% pit retention factor cited by the National Pollution Inventory (NPI) for TSP and PM10 respectively. The wind speed reduction would also reduce odour emissions from newly placed waste still exposed to the atmosphere. The effect of this reduction in odour and dust would diminish as the cell height approaches that of nearby terrain. Job ID AQU-VC E-12 Appendix E - CFD Modelling in Relation to Windblown Dust Emissions.docx
238 E.6 REFERENCES A.M.G. Lopes (2013) Easy_CFD User Manual S. Solomos, G. Kallos, E. Mavromatidis, and J. Kushta (2012) Density currents as a desert dust mobilization mechanism, Atmos. Chem. Phys, 12, Sang-Joon Lee and Hyoung-Bum Kim (1999) Laboratory measurements of velocity and turbulence field behind porous fences, Journal of Wind Engineering and Industrial Aerodynamics, 80, J.P. Van Doormaal and G.D. Raithby (1984) Enhancements of the simple method for predicting incompressible fluid flows, Numerical Heat Transfer, 7, R.R. Nino and P.J. Eecen, (2002) ECN-DOWEC: Turbulence and wind shear: A literature study and measurements, DOWEC- FIWI- PE /00 P Qing-shan Yang and Jian Zhang (2009) Simulation of horizontally homogeneous atmospheric boundary layer based on k-ε variant models combined with modified wall functions, Seventh Asia-Pacific Co Job ID AQU-VC E-13 Appendix E - CFD Modelling in Relation to Windblown Dust Emissions.docx
239 Appendix F SELECTION OF REPRESENTATIVE YEAR Job ID AQU-VC F Cleanaway Melbourne Regional Landfill AQA R10 Low Res.docx
240 F.1 INTRODUCTION In dispersion modelling, one of the key considerations is the representativeness of the meteorological data used 1. Once emitted to atmosphere, emissions will: rise according to the velocity and temperature at the point of emission be advected from the source according to the strength and direction of the wind at the height to which the plume has risen in the atmosphere, and be diluted due to mixing with the ambient air, according to the intensity of turbulence. Dispersion is the combined effect of these processes. Dispersion modelling is used as a tool to simulate the air quality effects of specific emission sources, given the meteorology typical for a local area together with the expected emissions. Selection of a year when the meteorological data is atypical means that the resultant predictions may not appropriately represent air quality. F.2 METHOD In order to determine the year of meteorological data to use for the dispersion modelling, the most recent 15 years (1998 to 2012 inclusive) of historical surface observations at Laverton 2 were reviewed. Ambient temperature, relative humidity and wind speed were statistically compared to long term averages for the region to determine the most representative year. Use was made of the nonparametric Mann-Whitney hypothesis test for large sample sizes. The null hypothesis for the Mann- Whitney test asserts that the populations of two samples have the same probability distribution (Hollander and Wolfe, 1999). In other words, the Mann-Whitney test determines the likelihood that two samples come from the same population. To compute the Mann-Whitney test statistic for this assessment, 15-year average hourly (temperature and wind speed) values were paired with each corresponding hourly year (e.g. 1998, 1999, ) value. The combined samples were sorted from least to greatest. Each observation was ranked and adjusted for ties and the sum of the ranks calculated. From the sum of ranks, a z-statistic was generated to determine the likelihood that the two samples were taken from the same population. The obtained Z value for each year is then compared to the critical Z value to determine whether to retain or reject the null hypothesis. If for example the absolute value of the obtained Z is less than 2.57, then the null hypothesis (i.e. that there is no significant difference between the individual year and long term mean) can be accepted at the 99% significance level (Figure F.1). 1 A requirement listed in most modelling guidelines. 2 The closest Bureau of Meteorology station to the Melbourne Regional Landfill. Job ID AQU-VC F-2 Appendix F - Selection of Representative Year.docx
241 Figure F.1: Normal curve showing area (between red lines) where null hypothesis holds. F.3 RESULTS The results of the Mann-Whitney test for temperature are shown in Figure F.2. The following years: 1999, 2000, 2005, 2008, 2009, 2010, 2011 and 2012 are representative of long term average conditions. Figure F.2: Mann-Whitney test scores for temperature. Values within the dashed red lines indicates acceptance of the null hypothesis. Job ID AQU-VC F-3 Appendix F - Selection of Representative Year.docx
242 The results of the Mann-Whitney test for relative humidity are shown in Figure F.3. The following years: 1999, 2002, 2005, 2006, 2007, 2008 and 2009 are statistically representative of long term average conditions. Figure F.3: Mann-Whitney test scores for relative humidity. Values within the dashed red lines indicates acceptance of the null hypothesis. Based on the above statistical hypothesis testing, only 1999, 2005, 2008 and 2009 is commonly representative of long term mean temperature and relative humidity conditions at Laverton. Consequently, those years were as selected for further assessment to determine the best two years for dispersion modelling. Figure F.4 shows the radar plot of wind direction frequency for the selected years and long-term average ( ). While wind direction frequencies are within 1% of long term averages for all directions and all years, 1999 displays the greatest deviation from long term averages, especially for the westerly to northwesterly directions. The wind speed frequency graph for the selected years is shown in Figure F.5 3. Both 1999 and 2009 show higher than average frequency of light winds (<2 m/s) while 2008 and 2009 display average to higher than average frequency of stronger winds > 5 m/s. The frequency of light and strong winds is essential to assess worst-case dispersion conditions for odour and dust respectively. On this basis, 2008 and 2009 can be considered the most suitable years for modelling. The annual rainfall for the period confirms this assessment. Figure F.6 shows that 2008 and 2009 can be considered very dry when the Bureau of Meteorology s definition is used (BoM, 2014). This will potentially increase dust emissions and in turn produce worst-case impacts. 3 Note that Mann-Whitney hypothesis testing is not performed for wind direction and speed owing to a less welldefined diurnal and annual cycle in these variables. Job ID AQU-VC F-4 Appendix F - Selection of Representative Year.docx
243 Figure F.4: Radar plot of wind direction frequency Figure F.5: Frequency plot of wind speed Job ID AQU-VC F-5 Appendix F - Selection of Representative Year.docx
. F.")
244 Figure F.6: Annual rainfall Horizontal lines depict, 10 th percentile,. 90 th percentile, and median values (source: BoM, 2014). F.4 CONCLUSION To summarise: The statistical assessment of temperature and relative humidity indicated that 1999, 2005, 2008 and 2009 are commonly representative of long-term average conditions. These four years are all characterised by below-average rainfall, with 2008 and 2009 classified as very dry. Wind direction frequencies are all within 1% of long term averages for all directions for these years. Both 1999 and 2009 show higher than average frequency of light winds (<2 m/s) while 2008 and 2009 display average to higher than average frequency of stronger winds > 5 m/s. The representative years were identified to be 2008 and 2009 calendar years on the basis of representative temperature, relative humidity and wind direction and worst case wind speed and rainfall data. These meteorology years were used for the dust and odour assessment, while further analysis of the potential odour impacts considered the additional meteorological years 2010, 2011 and The EPA Victoria guidance notes for regulatory air pollution model AERMOD states that, unless permission is given, the meteorological input files are required to contain five recent sequential years of hourly data (EPA Victoria, 2013). The EPA gave confirmation initially that two representative meteorological years were appropriate for the assessment, but additional years were included for the odour assessment to align with this guidance. Dispersion modelling for this assessment uses data for the 2008 to 2012 calendar years. Job ID AQU-VC F-6 Appendix F - Selection of Representative Year.docx
245 F.5 REFERENCES BOM (2014) Bureau of Meteorology EPA Victoria (2013) Guidance notes for using the regulatory air pollution model AERMOD in Victoria, Publication 1551, EPA Victoria Hollander, M. and Wolfe, D.A. (1999). Nonparametric Statistical Methods, John Wiley & Sons. Job ID AQU-VC F-7 Appendix F - Selection of Representative Year.docx
246 Appendix G FLEXPART MODELLING OF CELL ELEVATION EFFECT ON DOWNWIND CONCENTRATIONS Job ID AQU-VC G Cleanaway Melbourne Regional Landfill AQA R10 Low Res.docx
247 G.1 BACKGROUND This document explains the use of a separate model to supplement the odour and dust assessment modelling based on AERMOD. This model was used to investigate the effect of the landfill configuration on downwind plume concentrations. AERMOD is known as a plume model. The mathematical coding of plume models does not permit the behaviour of plumes in complex physical situations to be resolved in detail. For example, in a quarry there are pits and walls that have an effect on airflow. This consequently affects plume behaviour, but it can be accounted for only very crudely in a plume model. During the proposed landfill operations, cells will be developed in previously quarried areas. As cells are filled the immediate landform will change and so it can be anticipated that the effects on plume behaviour might also change with consequences for downwind concentrations of odour and dust. To gain a more detailed understanding of how changes in cell profile might affect the downwind impacts of emissions, a model known as FLEXPART was used in conjunction with the Weather and Research and Forecasting (WRF). Together these models allowed simulation of the effect of local terrain on 3-dimensional plume behaviour. The following information explains the modelling approach used and presents the results of FLEXPART modelling of emissions from the cell or pit floor and at the end of the cell life, when the cell is elevated above ground-level. The results give an indication of the potential effects of pit topography on groundlevel concentrations. Job ID AQU-VC G-2 Appendix G - FLEXPART Modelling of Cell Elevation Effect on Downwind Concentrations.docx
248 G.2 METHODOLOGY G.2.1 FLEXPART and WRF FLEXPART is a Lagrangian Particle Dispersion Model (LPDM), originally developed at the University of Natural Resources and Life Sciences in Vienna, with further development at the Norwegian Institute for Air Research in the Department of Atmospheric and Climate. Lagrangian particle models compute trajectories 1 of a large number of theoretical particles (or small air parcels) in the atmosphere 2. This enables the important plume dispersion processes of transport and diffusion 3 to be calculated. WRF is an advanced prognostic, mesoscale meteorological forecast model. It has been developed by the National Center for Atmospheric Research (NCAR) and the National Oceanic and Atmospheric Administration (NOAA) in the United States. WRF is suitable for a broad spectrum of applications across scales ranging from meters to thousands of kilometres. The model utilises a global database to produce fine-scale 3-dimensional meteorological fields, takes into account local terrain and land-use effects. The developers of FLEXPART have modified the model for use with WRF so that the multi-scale meteorological predictions made by WRF can be used in source-receptor analyses 2. G.2.2 Model Configurations For this assessment, WRF was run with a seven nest structure (27 km, 9 km, 3 km, 1 km, 333 m, 111 m and 37 m (horizontal resolution) centred on S and E as shown in Figure G.1. Vertical resolution consisted of 27 pressure levels. WRF was configured for three simple scenarios: The base case terrain where no cell pit or cell cap exists; the cell defined as a pit approximately 30 m deep to approximate an actual active cell at its earliest stage; and the cell at the end of its life, such that a mound approximately 30 m above local terrain exists. The model was run for a single day (7 July 2009) at a temporal resolution of 5 minutes in order to simulate the smaller scale motion in the vicinity of the Ravenhall Site for input to FLEXPART. FEXPART was configured to emit unit emissions of a tracer gas every minute for a one hour period between 05:00 and 06:00. The modelling assessed concentrations at 6 levels: 1 m, 10m, 50 m, 100 m, 150 m and 200 m. 1 Pathways in 3-D space 2 A. Stohl, A., Forster, C., Frank, A, and P. Seibert (2005), The Lagrangian particle dispersion model FLEXPART version 6.2, Atmos. Chem. Phys., 5, Transport is the movement of a plume with the general wind flow. Diffusion is the process by which it breaks up and spreads out, and hence becomes less concentrated, due to the effect of turbulence. Job ID AQU-VC G-3 Appendix G - FLEXPART Modelling of Cell Elevation Effect on Downwind Concentrations.docx

249 Figure G.1: WRF model nests. G.3 RESULTS G.3.1 WRF A snapshot of the wind field and temperature shading at 05:00 on 7 July 2009, as simulated by WRF, for the base case scenario is shown in Figure G.2. The figure shows a spatially homogenous southwesterly airflow across the area. Job ID AQU-VC G-4 Appendix G - FLEXPART Modelling of Cell Elevation Effect on Downwind Concentrations.docx

250 Figure G.2: Modelled wind vectors (arrows), temperature (shaded) and terrain (contour) at 05:00 LT for the base scenario The wind field and temperature for the cell pit scenario is shown in Figure G.3. The figure indicates the establishment of a perturbation in the wind field downwind of the pit. The pit also has a local impact on temperature, with slightly elevated temperatures advected a short distance downwind of the pit. Job ID AQU-VC G-5 Appendix G - FLEXPART Modelling of Cell Elevation Effect on Downwind Concentrations.docx

251 Figure G.3: Modelled wind vectors (arrows), temperature (shaded) and terrain (contour) at 05:00 LT for the cell pit scenario. Figure G.4 shows the same as Figure G.3 but for the cell cap scenario. The elevated terrain associated with the cell cap has significantly less impact on the downwind flow than the cell pit scenario, although a small increase in temperature is evident downwind of the cell cap due to minimal adiabatic heating. Job ID AQU-VC G-6 Appendix G - FLEXPART Modelling of Cell Elevation Effect on Downwind Concentrations.docx
, temperature (shaded) and terrain (contour) at 05:00 LT for the cell cap scenario Job ID")
252 Figure G.4: Modelled wind vectors (arrows), temperature (shaded) and terrain (contour) at 05:00 LT for the cell cap scenario Job ID AQU-VC G-7 Appendix G - FLEXPART Modelling of Cell Elevation Effect on Downwind Concentrations.docx
253 G.3.2 FLEXPART Figure G.5 shows the particles after 15 minutes simulation for emissions from the base case (upper), cell pit (middle) and cell cap (lower). In comparing the three figures, the following can be seen: Initial vertical mixing is marginally higher for the cell pit and base case than for the cell cap emissions. This is most likely due to increased turbulence associated with initial forced ascent of air leaving the pit. Further downwind, vertical mixing appears slightly enhanced for the base case and cell cap scenario compared to the cell pit scenario. Particle dispersion displays a slight anticlockwise curvature in the dispersion pattern downwind in the cell pit scenario and a clockwise pattern in the cell cap scenario. This is may be due to the conservation of Ertel's Potential Vorticity (EPV): As the air parcel starts to ascend the pit wall its depth decreases. This requires the vorticity to also decrease (i.e. acquire anticyclonic vorticity). Conversely, as the parcel moves down the cell capped slope, the depth starts to increase. The absolute vorticity must increase (i.e. become cyclonic) to conserve EPV. Vertical dispersion of particles is restricted by the mixing height of 100 m. Figure G.5: Simulated virtual particles with emissions from the base case (upper), cell pit (middle) and cell cap (lower) after 15 minutes. Job ID AQU-VC G-8 Appendix G - FLEXPART Modelling of Cell Elevation Effect on Downwind Concentrations.docx
254 Predicted ground-level tracer concentration for the Base scenario is shown in Figure G.6. Highest ground-level concentration is found at the source, with areas of elevated concentration approximately 400 m and 700 m downwind of the source. These areas of local maximum most likely reflect areas of plume grounding. Figure G.7 shows predicted ground-level tracer concentration for the Cell Pit scenario (upper) and Cap scenario (lower). Visual inspection of the Cell Pit scenario shows elevated predicted concentration within the pit and immediately downwind of the pit, with reduced concentration further downwind when compared to the base case. The Cell Cap scenario shows a similar dispersion pattern albeit with lower concentration near the source and a reduced spatial extent of downwind concentration 4. Figure G.6: Predicted 1-hour average ground-level tracer gas concentration (ppt) Base Scenario. 4 Note: Emissions used in the modelling are for plume behaviour demonstration purposes only and should not be construed to be actual GLCs. Job ID AQU-VC G-9 Appendix G - FLEXPART Modelling of Cell Elevation Effect on Downwind Concentrations.docx
 Cell Pit Scenario (upper) and Cap Scenario (lower) Job ID")
255 Figure G.7: Predicted 1-hour average ground-level tracer concentration (ppt) Cell Pit Scenario (upper) and Cap Scenario (lower) Job ID AQU-VC G-10 Appendix G - FLEXPART Modelling of Cell Elevation Effect on Downwind Concentrations.docx
256 G.4 DISCUSSION The percentage change in hourly average downwind tracer concentration (from base case) for the cell pit and cell cap is shown in Table G.1. A 20 % decrease in ground-level concentration (from base case) is apparent 500 m downwind of the source for the pit scenario. By contrast, the cell cap scenario shows a marginal increase in concentration 500 m downwind of the source. This is most likely attributed to enhanced downwind vertical mixing due to the local effects associated with the cell cap topography. A 0.6% to 14% increase in ground level concentration from the base case is seen 1,000 m downwind of the cell pit and cell cap respectively. Again, this is most likely due to enhanced downwind vertical mixing due to cell topography. At 1,500m downwind of the source, the cell pit and cell cap scenarios both display substantial reduction (26% and 38%) from the base case scenario due to enhanced plume dilution. Table G.1: Percentage change of concentration from base case at various distances downwind of source. Distance downwind Pit Scenario Cell Top Scenario 500 m -20% +4% 1, 000 m +0.6% +14% 1, 500 m -26% -38% Job ID AQU-VC G-11 Appendix G - FLEXPART Modelling of Cell Elevation Effect on Downwind Concentrations.docx
257 G.5 CONCLUSIONS FLEXPART modelling has been completed for three scenarios: A base case, with no quarry or cell capping (i.e. only undisturbed local terrain, which is essentially flat). The cell defined as a pit approximately 30 m deep to approximate one extreme scenario in local terrain changes as landfilling progresses. The cell at the end of its life, such that a mound approximately 30 m above local terrain exists. The scenarios are simplified in the sense that adjacent older cells will also lead to a change in terrain. The selected scenarios represent cases that are likely to identify any specific changes in downwind impacts associated with different cell stages. The model was run for a single day (7 July 2009) with unit emissions of a tracer gas every minute for a one hour period between 05:00 and 06:00. The small scale meteorology used as input to the dispersion model was simulated by WRF at a temporal resolution of 5 minutes. Results of the modelling show that: Initial vertical mixing is marginally higher for the cell pit and base case than for the cell cap emissions due to increased turbulence associated with forced ascent of air leaving the pit. Particle dispersion patterns vary slightly between the base, cell pit and cell cap scenarios and is most likely due to the conservation of EPV. Vertical dispersion of particles is restricted by the mixing height of 100 m and the nonturbulent flow. Emissions from the cell cap are associated with increased ground-level concentrations (from the base scenario) at 500 m and 1,000 m downwind due to terrain-induced vertical mixing. A substantial decrease in ground-level concentration is seen at 1,500 m downwind of the source for both the cell pit and cap scenarios (when compared to the base case). The FLEXPART modelling for a single meteorological case shows some variation in plume behaviour and consequently ground-level concentration in response to local terrain such as that found in cell pit/cell cap cases. At distances of greater than 1,500 m from the cell, there is a reduction in downwind concentration by between 26% and 38%. Job ID AQU-VC G-12 Appendix G - FLEXPART Modelling of Cell Elevation Effect on Downwind Concentrations.docx
258 Appendix H DUST EMISSIONS ESTIMATION Job ID AQU-VC H Cleanaway Melbourne Regional Landfill AQA R10 Low Res.docx
259 H.1 INTRODUCTION For this assessment, between three and five scenarios were modelled for PM10 and dust deposition, tracking various stages in the progress of the proposed site operations. Each scenario is based on the emissions associated with a nominated active cell and from the preparation of new cells. The scenarios were selected on the basis that the active cell in question is close to the site boundary, and therefore represents a maximum impact off site compared to operations on internal cells. The scenarios are as listed in Table H.1 and the cells are identified in Figure 2.3 in the report. The Base Case scenario represents current or recent past landfill operation. Base Case A represents the recent past. S1 and S2 represent landfill operation with active cells on the southwest corner of the site. S3 and S4 represent landfill operation with active cells close to the western boundary, S4 being the active cell in the most north-west location of the site. Scenario Base Case A Table H.1: Summary of Modelled Scenarios Active Cell 2L Meteorological Years Substance 2008 PM10, dust deposition 2009 PM10 S and 2009 PM10 S PM10, dust deposition 2009 PM10 S and 2009 PM10 S PM10, dust deposition 2009 PM10 In addition to the regional background dust level, major industrial dust emission facilities near the site were modelled based on published NPI emissions data. Dust emissions were assumed to be negligible for facilities that were not required to report to NPI. The industrial facilities included in this assessment are as follows: the existing Boral Deer Park quarry and associated plant (Pacific Environment, 2015)) Boral Deer Park asphalt plant. It should be noted that Boral has an operating rights agreement on the Hanson site and therefore the activities associated with the Hanson Quarry were assumed to be incorporated in the activities associated with the Boral quarry. The emission estimation techniques used to estimate TSP and PM10 emissions were obtained from the following published US EPA chapters from the Emissions factors & AP 42 - Compilation of Air Pollutant Emissions Factors: Chapter Industrial Wind Erosion (US EPA, 2006a) Chapter Unpaved Roads (US EPA, 2006b) Chapter Aggregate Handling and Storage Piles (US EPA, 2006c). The default emission factors, activity data and estimated emissions for each emission source are presented in the sections below. In addition to the MRL dust sources, the emissions from the MRL power plant have been estimated and considered in terms of the local air quality and regional contribution in Section H.7. Job ID AQU-VC H-2 Appendix H - Dust Emissions Estimation.docx
260 H.2 LOADING, UNLOADING AND MISCELLANEOUS TRANSFERS H.2.1 Landfill Emissions from trucks dumping cover material and interim cover material at the active face and from excavators spreading cover materials at the active face were estimated using the method described in the AP42 Chapter , Final Section Aggregate Handling and Storage Piles (US EPA, 2006c) for loading and unloading activities. The equations used to calculate the emission factors for TSP and PM10 are given below. The inputs used and estimated emission factors are listed in Table H.2. EF TSP = ( U 2.2 ) 1.3 ( M 2 ) 1.4 EF PM10 = ( U 2.2 ) 1.3 ( M 2 ) 1.4 where: EF TSP = Emission factor for TSP for loading and unloading activities (kg/tonne) EF PM10 = Emission factor for PM10 for loading and unloading activities (kg/tonne) M = Moisture content of material handled (%) U = Mean wind speed (m/s) Emissions of TSP and PM10 associated with cover materials handling activities at the active face were estimated using the equation below. The activity data and emissions are provided in Table H.3. E i = M EF i ( 100 CE i ) 100 where: E i = Emission rate for substance i (kg/yr) M = Total amount of material handled (tonnes/yr) EF i = Uncontrolled emission factor for substance i (kg/tonne) CE i = Overall control efficiency for substance i (%) Table H.2: Input Data and Estimated Emission Factors Associated with Cover Materials Handling Activities at the Landfill Scenario Source Data Input Value Units All Scenarios Trucks dumping cover material and interim material at active face Mean wind speed a 3.55 m/s Average moisture content b 14 % Excavators spreading material at active face Estimated TSP emissions factor Estimated PM10 emission factor kg/t kg/t a and 2009 scalar wind speed data at 10m height used for Deer Park. The Deer Park monitoring data were provided by Vic EPA. b. It corresponds to the weighted average moisture content for cover material and interim cover material (Table (US EPA, 2006c)): - Default value for municipal solid waste landfills - clay/dirt mix = 14 wt% - Default range for municipal solid waste landfills - cover: %. Mean value = 12 wt%. Job ID AQU-VC H-3 Appendix H - Dust Emissions Estimation.docx
261 Table H.3: Activity Data and Estimated Emissions Associated with Cover Materials Handling Activities at the Landfill Description Scenario Data Input Value Units Trucks dumping cover material and interim material at active face Excavators spreading materials at active face Trucks dumping cover material and interim material at active active face Excavators spreading material at active face a. Estimated based on: All Landfill Scenarios Base Case (Cell 2L) Estimated amount of cover material unloaded at active face a 275,940 t/yr Rain correction factor (all substances) b 28 % 60,000 m² Scenario 1 (Cell 1) 178,000 m² Scenario 2 (Cell 4) Average cell area c 160,000 m² Scenario 3 (Cell 8) 141,000 m² Scenario 4 (Cell 10) 221,000 m² Base Case (Cell 2L) 24,000 t/yr Scenario 1 (Cell 1) 71,200 t/yr Scenario 2 (Cell 4) Estimated amount of interim cover material unloaded at active face d 64,000 t/yr Scenario 3 (Cell 8) 56,400 t/yr Scenario 4 (Cell 10) 88,400 t/yr Base Case (Cell 2L) 32 kg/yr Scenario 1 (Cell 1) 37 kg/yr Scenario 2 (Cell 4) Estimated TSP emissions 36 kg/yr Scenario 3 (Cell 8) 35 kg/yr Scenario 4 (Cell 10) 39 kg/yr Base Case (Cell 2L) 15 kg/yr Scenario 1 (Cell 1) 17 kg/yr Scenario 2 (Cell 4) Estimated PM10 emissions 17 kg/yr Scenario 3 (Cell 8) 17 kg/yr Scenario 4 (Cell 10) 18 kg/yr Base Case (Cell 2L) 32 kg/yr Scenario 1 (Cell 1) 37 kg/yr Scenario 2 (Cell 4) Estimated TSP emissions 36 kg/yr Scenario 3 (Cell 8) 35 kg/yr Scenario 4 (Cell 10) 39 kg/yr Base Case (Cell 2L) 15 kg/yr Scenario 1 (Cell 1) 17 kg/yr Scenario 2 (Cell 4) Estimated PM10 emissions 17 kg/yr Scenario 3 (Cell 8) 17 kg/yr Scenario 4 (Cell 10) 18 kg/yr - a maximum working face (daily active face) area of 1,800 m² - cover material will be deposited each day on the working face area. - a deposited amount of daily cover material of 0.3 m/day mm clay material operating days/year (worst-case) - a cover material density of 1,400 kg/m³ (assumption based on a range of kg/m³ for soil). b. Estimated based on the Deer Park monitoring data provided by Vic EPA. It is assumed that no particulate emissions occur on rain days (i.e. > 0.25 mm). c. Estimated considering likely covered area based on Cell Sequencing Plan included in Works Approval Application. d. Estimated based on Works Approval Application: - the average cell area for each scenario as provided above. - an interim cover material thickness of 0.5 m - comprising 40 mm NDRC quarry product ( - an average cell life of 2 years Job ID AQU-VC H-4 Appendix H - Dust Emissions Estimation.docx
262 - a cover material density of 1,600 kg/m³ (assumption based on a range of kg/m³ for soil). H.2.2 Asphalt Plant Loading, unloading and miscellaneous transfers emissions at the Boral Deer Park asphalt plant are associated with the following activities: trucks unloading quarry product and bitumen aggregate loading into hoppers at the cold feed unit by front-end loaders miscellaneous transfers (including conveying) of aggregates from cold aggregate bins to rotary dryer. Emission estimation techniques for these activities were obtained from AP42 Chapter , Final Section Aggregate Handling and Storage Piles. The equations used to calculate the emission factors for TSP and PM10 are described in Section H.2.1. The inputs used and estimated emission factors are listed in Table H.4. Emissions of TSP and PM10 associated with material handling activities at the asphalt plant were estimated using the equation described in Section H.2.1. The activity data and estimated emissions are provided in Table H.5. Table H.4: Input Data and Estimated Emission Factors Associated with Materials Handling at Asphalt Plant Area Activity Data Input Value Units Asphalt Plant Trucks unloading quarry product and bitumen Aggregates loaded into hoppers of the cold feed unit Aggregates transferred from cold aggregate bins to rotary dryer Mean wind speed a 3.55 m/s Moisture content b 3 % Estimated TSP emissions factor kg/t Estimated PM10 emission factor kg/t a and 2009 scalar wind speed data at 10m height used for Deer Park. The Deer Park monitoring data were provided by Vic EPA. b. Section (US EPA, 2004): the bulk aggregate moisture content typically stabilises between 3 to 5% by weight. Lower end of the range was used to be conservative. Job ID AQU-VC H-5 Appendix H - Dust Emissions Estimation.docx
263 Table H.5: Activity Data and Estimated Emissions Associated with Materials Handling at the Asphalt Plant Area Description Data Input Value Units Asphalt Plant All activities Rain control efficiencies (all substances) a 28 % Trucks unloading quarry product and bitumen Aggregates loaded into hoppers of the cold feed unit Aggregates transferred from cold aggregate bins to rotary dryer Amount of asphalt produced b 148,430 t/yr Amount of bitumen unloaded b 9,000 t/yr Estimated amount of quarry product unloaded c 139,430 t/yr Estimated TSP emissions 134 kg/yr Estimated PM10 emissions 63 kg/yr Amount of aggregates loaded into hopper at the cold feed unit d 20,915 t/yr Estimated TSP emissions 19 kg/yr Estimated PM10 emissions 9 kg/yr Amount of aggregates transferred from the cold aggregate bins to the rotary dryer d 20,915 t/yr Number of transfer points associated with aggregates prior to rotary dryer e 3 - Partial enclosure control efficiency f 70 % Estimated TSP emissions 24 kg/yr Estimated PM10 emissions 11 kg/yr a. Estimated based on the Deer Park monitoring data provided by Vic EPA. It is assumed that no particulate emissions occur on rain days (i.e. > 0.25 mm). b. Boral (2014a). c. Back-calculated based on the amount of hot asphalt mix produced minus the amount of bitumen delivered at the site. d. Boral (2014a): 15% of aggregates are handled by FELs. e. Transfers include (Boral 2014b): - loading into the hoppers of the cold feed bins - loading onto the conveyor - unloading from conveyor. f. Table 4 (DSEWPC, 2012). All transfer points are assumed to be enclosed. Job ID AQU-VC H-6 Appendix H - Dust Emissions Estimation.docx
264 H.3 WIND EROSION H.3.1 Landfill Wind erosion emissions from the landfill are associated with the capped cells. The capped cells are anticipated to be revegetated over time and it is anticipated that it would take approximately twelve months to obtain a reasonable cover. Only maximum emissions for the current active cell, where cover material is freshly placed, were included in the assessment using the concept of friction velocity as described in AP42 Chapter , Final Section Industrial Wind Erosion (US EPA, 2006a). This equation uses the properties of the eroded material and the meteorological conditions to determine the annual emissions. The emissions from the previous cells are expected to be minor as the cover material will be deposited for a long period of time. The capping material used is expected to be dense and adhesive and therefore, minor dust emissions are anticipated from wind erosion. The landfill areas were assumed to be loaded with fresh material once during an annual period. This means that the maximum wind gust during an annual period would remove all erodible material at the surface and no additional material would be made available. Based on this assumption, the area of one capped cell is the maximum area that could incur wind erosion during an annual period. Based off the soil properties from Threshold Velocities for Input of Soil Particles into the Air by Desert Soils (Gillette D, 1980), a high content clay material was assumed to be a reasonable representation of the landfill clay caps. A friction threshold velocity, meaning the surface wind speed necessary to entrain the material, of 0.35 m/s was selected from this paper. To determine the maximum wind gust that occurs at the site, the maximum hour wind speed was selected from the Melton BoM dataset. The gust relationship described in the NPI Emission Estimation Manual for Fugitive Emission v2 was used to determine the fastest wind speed at the material surface. The equations used to calculate the emission factors for TSP and PM10 are given below. Emission factor equation inputs and estimated emission factors are provided in Table H.6. N EF TSP = 1 P i i=1 N EF PM10 = 0.5 P i where: EF i = Emission factor for substance i (g/m²/a) N = Number of disturbances per year (-) P i = Erosion potential corresponding to the observed (or probable) fastest mile of wind for the ith period between disturbances (g/m²) i=1 Job ID AQU-VC H-7 Appendix H - Dust Emissions Estimation.docx
265 P = 58 (u u t ) (u u t ) u + = u 10 where: u = Friction velocity (m/s) u t = Threshold friction velocity (m/s) + u 10 = Fastest wind speed of reference anemometer for period between disturbances (m/s) Emissions of TSP and PM10 associated with wind erosion at the active cell were estimated using the equation below. The activity data and estimated emissions are provided in Table H.7. E i = A EF i 1000 (100 CE i ) 100 where: E i = Emission rate for substance i (kg/yr) A = Total exposed area (m²/yr) EF i = Emission factor for substance i (g/m²/yr) CE i = Overall control efficiency for substance i (%) Table H.6: Input Data and Estimated Emission Factors Associated with Wind Erosion at the Landfill Scenario Data Input Value Units All Landfill Scenarios Maximum hourly wind speed a 14.9 m/s Conversion from hourly wind speed to fastest mile wind speed b Fastest mile of reference anemometer (u10 + ) b 18.9 m/s Friction velocity (u*) c 1.0 m/s Threshold friction velocity (ut) d 0.35 m/s Estimated emission factor for TSP e 41 g/m²/yr Particle size ratio PM10/TSP f a and 2009 scalar wind speed data at 10m height for Melton used to be conservative. The meteorological monitoring data were provided by Vic EPA. b. Estimated based on maximum hourly wind speed and conversion factor. c. Estimated based on fastest mile of reference anemometer. d. Table 4 (Gillette, D, 1980): value for high content clay material. e. Estimated based on friction velocity and threshold friction velocity. f. Section (US EPA, 2006a). Job ID AQU-VC H-8 Appendix H - Dust Emissions Estimation.docx
266 Table H.7: Activity Data and Estimated Emissions Associated with Wind Erosion at the Landfill Area Scenario Data Input Value Units Base Case (Cell 2L) 60,000 a m² Scenario 1 (Cell 1) 89,000 b m² Scenario 2 (Cell 4) Total exposed area covered cells 80,000 b m² Scenario 3 (Cell 8) 70,500 b m² Scenario 4 (Cell 10) 110,500 b m² Base Case (Cell 2L) 2,463 kg/yr Scenario 1 (Cell 1) 3,653 kg/yr Landfill Scenario 2 (Cell 4) Estimated TSP emissions 3,284 kg/yr Scenario 3 (Cell 8) 2,894 kg/yr Scenario 4 (Cell 10) 4,536 kg/yr Base Case (Cell 2L) 1,231 kg/yr Scenario 1 (Cell 1) 1,827 kg/yr Scenario 2 (Cell 4) Estimated PM10 emissions 1,642 kg/yr Scenario 3 (Cell 8) 1,447 kg/yr Scenario 4 (Cell 10) 2,268 kg/yr a. Estimated considering likely covered area based on Cell Sequencing Plan included in Works Approval Application. b. Estimated based on the average cell area for each scenario (refer to Table H.3) and an average cell life of 2 years. H.3.2 Asphalt Plant Wind erosion emissions at the asphalt plant are associated with the aggregates stockpiles. TSP emissions were estimated using the default emission factor from the AP42 Chapter 11.9 Western Surface Coal Mining (US EPA, 1998). PM10 emissions were estimated using activity particle size fraction from the AP42 Chapter Industrial Wind Erosion, as described in the above section. Emissions of TSP and PM10 associated with wind erosion at the active cell were estimated using the equation below. The default emission factors, data inputs, control efficiencies and estimated emissions associated with wind erosion are provided in Table H.8. E i = A EF i ( 100 CE i ) 100 where: E i = Emission rate for substance i (kg/yr) A = Total exposed area (ha/yr) EF i = Emission factor for substance i (kg/ha/yr) CE i = Overall control efficiency for substance i (%) Job ID AQU-VC H-9 Appendix H - Dust Emissions Estimation.docx
267 Table H.8: Emission Factors, Activity Data, and Estimated Emissions Associated with Wind Erosion at the Asphalt Plant Activity Area Data Input Value Units Asphalt Plant Default emission factor for TSP a 850 kg/ha/yr Particle size distribution PM10/TSP b Total exposed area c 0.23 ha Rain control efficiency (all substances) d 28 % Estimated TSP emissions 139 kg/yr Estimated PM10 emissions 69 kg/yr a. US EPA (1998) Table b. US EPA (2006a) Section c. Estimated area based on aerial images. d. Estimated based on the Deer Park monitoring data provided by Vic EPA. It is assumed that no particulate emissions occur on rain days (i.e. > 0.25 mm). Job ID AQU-VC H-10 Appendix H - Dust Emissions Estimation.docx
268 H.4 WHEEL GENERATED DUST UNPAVED ROADS H.4.1 Landfill Wheel generated dust emissions were estimated using a technique from AP42 Chapter , Unpaved Roads (US EPA, 2006b). The equations used to calculate the emission factors for TSP and PM10 are given below. The emission factor equation inputs and the estimated emission factors are listed in Table H.9. EF TSP = ( s 0.7 ) 4.9 ( ) ( W 3 EF PM10 = ( s 0.9 ) 1.5 ( ) W ( ) ) where: EF TSP = Emission factor for TSP due to travel on unpaved roads (kg/km) EF PM10 = Emissions factor for PM10 due to travel on unpaved roads (kg/km) s = Surface material silt content (g/m 2 ) W = Weighted average gross mass of vehicles travelling on the road (tonnes) 0.45 Emissions of TSP and PM10 5 associated with wheel generated dust were estimated using the equation below. The annual vehicle kilometres travelled, control efficiencies and estimated emissions are provided in Table H.9. E i = VKT EF i ( 100 CE i ) 100 where: E i = Estimated emissions from wheel generated dust for pollutant i (kg/yr) VKT = Annual kilometres travelled (km/yr) EF i = Uncontrolled emission factor for pollutant i (kg/km) CE i = Overall control efficiency for pollutant i (%) Table H.9: Modelled Transport Input Data, Control Efficiencies, Estimated Emission Factors and Emissions Associated with Modelled Wheel Generated Dust Scenario Data Input Value Units All Landfill Scenarios Base Case (Cell 2L) Scenario 1 (Cell 1) Silt content a 2.2 % Level 2 watering and rain correction factor b 82 % Weighted average gross mass of vehicles c 13.6 tonnes Total vehicle kilometres travelled d 1,507,355 km/yr Estimated emission factor for TSP 0.87 kg/km Estimated emission factor for PM kg/km Estimated TSP emissions 232,630 kg/yr Estimated PM10 emissions 50,723 kg/yr Weighted average gross mass of vehicles c 14.9 tonnes Total vehicle kilometres travelled d 2,123,211 km/yr Estimated emission factor for TSP 0.91 kg/km Estimated emission factor for PM kg/km Estimated TSP emissions 341,482 kg/yr Estimated PM10 emissions 74,458 kg/yr Job ID AQU-VC H-11 Appendix H - Dust Emissions Estimation.docx
269 Scenario Data Input Value Units Scenario 2 (Cell 4) Scenario 3 (Cell 8) Scenario 4 (Cell 10) Weighted average gross mass of vehicles c 15.2 tonnes Total vehicle kilometres travelled d 2,470,955 km/yr Estimated emission factor for TSP 0.91 kg/km Estimated emission factor for PM kg/km Estimated TSP emissions 400,626 kg/yr Estimated PM10 emissions 87,354 kg/yr Weighted average gross mass of vehicles c 13.8 tonnes Total vehicle kilometres travelled d 1,651,291 km/yr Estimated emission factor for TSP 0.87 kg/km Estimated emission factor for PM kg/km Estimated TSP emissions 256,560 kg/yr Estimated PM10 emissions 55,941 kg/yr Weighted average gross mass of vehicles c 14.8 tonnes Total vehicle kilometres travelled d 2,100,692 km/yr Estimated emission factor for TSP 0.90 kg/km Estimated emission factor for PM kg/km Estimated TSP emissions 336,407 kg/yr Estimated PM10 emissions 73,351 kg/yr a. Table (US EPA, 1998): default range for municipal solid waste landfills: % and mean = 6.4 %. Lowest value of the range used as the site visit conducted in 2014 confirmed that the roads at the landfill were well maintained. b. 75% control efficiency for level 2 watering. Confirmed via on 18/06/14. It is also assumed that no particulate emissions occur on rain days (i.e. > 0.25 mm). c. Estimated based on: - estimated total kilometres travelled by haul trucks, light vehicles and waste disposal trucks for each scenario - the following vehicles gross mass: light vehicles: 3.5 tonnes - assumption based on the definition of light vehicles (i.e. GVM < or = 3.5 t) in accordance with the NPI Manual for combustion engines v3.0 (DEWHA, 2008) haul trucks: tonnes - the average vehicle gross mass is dominated by haul trucks. Assumed to be CAT 770G off-highway trucks. Target gross machine operating weight used waste disposal trucks: 17 tonnes assuming an average tare weight of 13 tonnes and an average gross weight (i.e. truck filled with garbage) of 20 tonnes. d. Correspond to the total kilometres travelled by haul trucks, light vehicles and waste disposal trucks. The emission factors associated with mobile equipment such as dozers, excavators, compactors etc. should include emissions from the material movement as well as the equipment movement. As such, these are excluded from WGD emissions calculations. The total kilometres travelled were estimated based on aerial images and the assumed haul roads shown in Figure 5.1 of the report. Conservative paths between the weighbridge and active cells were assumed on the basis that the existing weighbridge will be relocated on Riding Boundary Road and that the future haul roads will be in use as soon as Cell 1 is operational, as agreed upon with Landfill Ops. Updated transport conditions were provided after the completion of dispersion modelling. The updated conditions showed an increase in the number of trucks required per week to meet the needs for the additional waste handled at MRL. This result increases the total vehicle kilometres travelled contributing to wheel generated dust. The wheel generated dust emissions were estimated using the updated transport conditions to assist in a qualitative assessment of dust emissions. The updated wheel generated dust emissions are presented in Table H.10. Job ID AQU-VC H-12 Appendix H - Dust Emissions Estimation.docx
270 Table H.10: Updated Transport Input Data, Control Efficiencies, Estimated Emission Factors and Emissions Associated with Modelled Wheel Generated Dust Scenario Data Input Value Units All Landfill Scenarios Base Case (Cell 2L) Silt content a 2.2 % Level 2 watering and rain correction factor b 82 % Weighted average gross mass of vehicles c 13.8 tonnes Total vehicle kilometres travelled d 1,598,328 km/yr Estimated emission factor for TSP 0.87 kg/km Estimated emission factor for PM kg/km Estimated TSP emissions 248,008 kg/yr Estimated PM10 emissions 54,077 kg/yr Scenario 1 (Cell 1) Weighted average gross mass of vehicles c 15.0 tonnes Total vehicle kilometres travelled d 2,249,398 km/yr Estimated emission factor for TSP 0.91 kg/km Estimated emission factor for PM kg/km Estimated TSP emissions 362,747 kg/yr Estimated PM10 emissions 79,095 kg/yr Scenario 2 (Cell 4) Scenario 3 (Cell 8) Weighted average gross mass of vehicles c 15.1 tonnes Total vehicle kilometres travelled d 2,358,944 km/yr Estimated emission factor for TSP 0.91 kg/km Estimated emission factor for PM kg/km Estimated TSP emissions 381,756 kg/yr Estimated PM10 emissions 83,239 kg/yr Weighted average gross mass of vehicles c 14.0 tonnes Total vehicle kilometres travelled d 1,809,760 km/yr Estimated emission factor for TSP 0.88 kg/km Estimated emission factor for PM kg/km Estimated TSP emissions 283,328 kg/yr Estimated PM10 emissions 61,778 kg/yr Scenario 4 (Cell 10) Weighted average gross mass of vehicles c 14.9 tonnes Total vehicle kilometres travelled d 2,318,831 km/yr Estimated emission factor for TSP 0.91 kg/km Estimated emission factor for PM kg/km Estimated TSP emissions 373,173 kg/yr Estimated PM10 emissions 81,368 kg/yr e. Table (US EPA, 1998): default range for municipal solid waste landfills: % and mean = 6.4 %. Lowest value of the range used as the site visit conducted in 2014 confirmed that the roads at the landfill were well maintained. f. 75% control efficiency for level 2 watering. Confirmed via on 18/06/14. It is also assumed that no particulate emissions occur on rain days (i.e. > 0.25 mm). g. Estimated based on: - estimated total kilometres travelled by haul trucks, light vehicles and waste disposal trucks for each scenario - the following vehicles gross mass: light vehicles: 3.5 tonnes - assumption based on the definition of light vehicles (i.e. GVM < or = 3.5 t) in accordance with the NPI Manual for combustion engines v3.0 (DEWHA, 2008) haul trucks: tonnes - the average vehicle gross mass is dominated by haul trucks. Assumed to be CAT 770G off-highway trucks. Target gross machine operating weight used waste disposal trucks: 17 tonnes assuming an average tare weight of 13 tonnes and an average gross weight (i.e. truck filled with garbage) of 20 tonnes. Job ID AQU-VC H-13 Appendix H - Dust Emissions Estimation.docx
271 h. Correspond to the total kilometres travelled by haul trucks, light vehicles and waste disposal trucks. The emission factors associated with mobile equipment such as dozers, excavators, compactors etc. should include emissions from the material movement as well as the equipment movement. As such, these are excluded from WGD emissions calculations. The total kilometres travelled were estimated based on aerial images and the assumed haul roads shown in Figure 5.1 of the report. Conservative paths between the weighbridge and active cells were assumed on the basis that the existing weighbridge will be relocated on Riding Boundary Road and that the future haul roads will be in use as soon as Cell 1 is operational, as agreed upon with Landfill Ops. Job ID AQU-VC H-14 Appendix H - Dust Emissions Estimation.docx
272 H.5 COMBUSTION EMISSIONS VEHICLE EXHAUSTS H.5.1 Landfill Diesel is combusted in the following vehicle/equipment: waste disposal trucks contractors light vehicles water carts haul trucks dozers excavators loaders the flat drum roller the compactor. TSP and PM10 emissions from vehicle exhausts were estimated using the method described in the NPI EET Manual for Combustion Engines (DEWHA, 2008). The equation used to calculate the emissions for TSP and PM10 is given below. The default emission factor for PM10 used are provided in Table H.11. The default emission factor for TSP is assumed to be equivalent to the PM10 emission factor as TSP emissions are generated through combustion (not mechanically generated). Fuel consumption was estimated based on kilometres travelled and fuel consumption rates as shown in the second equation below and Table H.12. As kilometres travelled for all scenarios were not available, they were estimated based on the assumptions shown in Table H.12. E i = Q EF i where: E i = Total emissions from vehicle exhausts for pollutant i (kg/yr) Q = Quantity of fuel consumed (L/yr) EF i = Default emission factor for pollutant i (kg/l) Q = VKT FCR where: Q = Quantity of fuel consumed (L/yr) VKT = Kilometres travelled (km/yr) FCR = Fuel consumption rate (L/km) Job ID AQU-VC H-15 Appendix H - Dust Emissions Estimation.docx
273 Table H.11: Default Emission Factors for Vehicle Exhausts from the Landfill Activities Mobile Equipment/Vehicles TSP and PM10 Emission factors (kg/l) Light Good Vehicles (< 3.5t GVM) a 2.39x10-03 Heavy Goods Vehicles (<12 t GVM <25t) b 1.84 x10-03 Track Type Tractor c 3.06 x10-03 Motor Graders d 2.68 x10-03 Track Type Loader e 2.90 x10-03 Off-Highway Trucks f 2.09 x10-03 Roller g 2.91 x10-03 Industrial Vehicles (Miscellaneous) h 3.63 x10-03 Source: DEWHA (2008): a. Table 15 b. Table 21 c. Table 26 d. Table 30 e. Table 32 f. Table 33 g. Table 34 h. Table 35 Job ID AQU-VC H-16 Appendix H - Dust Emissions Estimation.docx
274 Area Activity Description Landfill Waste disposal trucks travelling to active face Light vehicles (contractor vehicles and site utes) Water carts Haul trucks transporting cover material Table H.12: Activity Data Associated with Vehicle Exhausts from the Landfill Activities Base Case (Cell 2L) Scenario 1 (Cell 1) Value Scenario 2 (Cell 4) Scenario 3 (Cell 8) Scenario 4 (Cell 10) Average number of daily truck movements a trucks/day Average number of annual truck movements b 271, , , , ,240 trucks/yr Trip distance to active face (return) c km/trip Fuel consumption rate d L/km Estimated annual kilometres travelled e 1,008,845 1,606,540 1,952,195 1,154,218 1,588,830 km/yr Estimated diesel consumption f 290, , , , ,583 L/yr Average daily distance travelled g km/day Average daily distance travelled by site utes g km/day Number of contractors' light vehicles h Number of site utes i Fuel consumption rate j L/km Estimated annual kilometres travelled e 467, , , , ,200 km/yr Estimated diesel consumption f 57,466 57,466 57,466 57,466 57,466 L/yr Trip distance (return) c, k km/trip Average travel speed l km/hr Fuel consumption rate d L/km Estimated annual kilometres travelled e 70,080 70,080 70,080 70,080 70,080 km/yr Estimated diesel consumption f 20,183 20,183 20,183 20,183 20,183 L/yr Trip distance to active face (return) c km/trip Total volume of daily cover material and interim cover material transported m 212, , , , ,350 m³/yr Haul truck capacity n m³/trip Number of trips in a year o 8,417 9,587 9,409 9,220 10,014 trips/yr Operating hours p 4,208 4,794 4,704 4,610 5,007 hrs/yr Fuel consumption rate q L/hr Estimated annual kilometres travelled e 31,310 49,470 51,560 29,874 44,662 km/yr Units Job Number AQU-VC H-17 Appendix H - Dust Emissions Estimation.docx
275 Area Activity Description Dozers Excavators FEL Flat drum roller Compactor All Base Case (Cell 2L) Scenario 1 (Cell 1) Value Scenario 2 (Cell 4) Scenario 3 (Cell 8) Scenario 4 (Cell 10) Estimated diesel consumption f 209, , , , ,050 L/yr Operating hours r 2,920 2,920 2,920 2,920 2,920 hrs/yr Fuel consumption rate s L/hr Estimated diesel consumption f 101, , , , ,769 L/yr Operating hours y 1,095 1,095 1,095 1,095 1,095 hrs/yr Fuel consumption rate t L/hr Estimated diesel consumption f 17,304 17,304 17,304 17,304 17,304 L/yr Operating hours z hrs/yr Fuel consumption rate u L/hr Estimated diesel consumption f 6,666 6,666 6,666 6,666 6,666 L/yr Operating hours a 1,460 1,460 1,460 1,460 1,460 hrs/yr Fuel consumption rate v L/hr Estimated diesel consumption f 11,725 11,725 11,725 11,725 11,725 L/yr Operating hours b 1,460 1,460 1,460 1,460 1,460 hrs/yr Energy consumption rate w L/hr Estimated diesel consumption f 73,756 73,756 73,756 73,756 73,756 L/yr Annual total kilometres travelled (excluding water carts) x 1,507,355 2,123,211 2,470,955 1,651,291 2,100,692 km/yr Total diesel consumption 788, ,994 1,085, , ,503 L/yr a. Tables 6.1 and 6.2 (GTA Consultants, 2016): includes anticipated traffic volumes associated with waste transfer from South East Melbourne Transfer Station in Clayton (SEMTS) to MRL from 2017 onwards. b. Based on 1 trip per truck. c. Estimated based on aerial images and the assumed haul roads shown in Figure 5.1 of the report. d. Table 2 (ABS, 2012) rigid trucks for Victoria. e. Estimated by Pacific Environment based on activity data. f. Estimated by Pacific Environment based on estimated kilometres travelled and the vehicle fuel consumption rate. g. Estimated based on assumed operating hours and vehicle speed. - Light vehicles were assumed to only travel for 8 hours/day. - Speed limits on-site is between 20 and 40 km/h and the higher end was used to estimate the distance travelled as a conservative approach. h. Assumption. Units Job Number AQU-VC H-18 Appendix H - Dust Emissions Estimation.docx
276 i. Assumption. j. Passenger vehicles for Victoria. (ABS, 2010). k. Assumed to be travelling on the same roads as for the waste disposal trucks. l. It is assumed that the water cart will travel at a very low speed. m. Refer to activity data in Table H.3. n. Assumed to be CAT 770G off-highway trucks. o. Estimated based on total volume of daily cover material and interim cover material transported, and the truck capacity. p. Assuming half an hour per trip for current operations. q. Fuel consumption rate is estimated based on: - engine gross power in kw - assumed engine efficiency of 36% - energy content factor of 38.6 GJ/kL (Table 2.4.2A of the NGER Technical Guidelines) - load factor of 0.50 for off-highway trucks (Table 5 (DEWHA, 2008)). r. Assumption: 2 dozers anticipated to be used to push waste into face; i.e. CAT D8 and D9. Typically, only run 4 active face machines for 3 to 4 hours per day during peak times. It is assumed that the dozers will operate 4 hours/day for the entire year as a conservative approach. Assumed to be constant across the years. s. Assumed to be a CAT D8. Same method used as described in footnote (q). Load factor of 0.55 used for wheeled dozers (Table 5 (DEWHA, 2008)). t. Assumed to be a CAT 320E L (medium excavators). Same method used as described in footnote (q). Load factor of 0.50 used for track-type loaders (Table 5 (DEWHA, 2008)). u. Assumed to be a 963D Cat large track loader. Same method used as described in footnote (q). Load factor of 0.50 used for track-type loaders (Table 5 (DEWHA, 2008)). v. Assumed to be a CAT CB434D (tandem vibratory roller). Same method used as described in footnote (q). Load factor of 0.50 used for rollers (Table 5 (DEWHA, 2008)). w. Assumed to be a CAT 836H. Same method used as described in footnote (q). Load factor of 0.50 assumed (Table 5 (DEWHA, 2008)). x. Total kilometres travelled exclude kilometres travelled by water carts as the vehicle speed is considered low enough to generate an insignificant amount of dust. y. Assumption: 3 excavators anticipated to be used. Each excavator/fel was assumed to operate for 1 hour a day, 365 days a year (worst-case) to spread the daily cover material at the active face. z. Assumption: 1 FEL anticipated to be used. Each FEL was assumed to operate for 1 hour a day, 365 days a year (worst-case) to spread the daily cover material at the active face. a. Assumption: 1 flat drum roller anticipated to be used. The same number of operating hours as estimated for a single bulldozer (4 hours/day) and 365 days a year (worst-case) was assumed to estimate fuel consumption. b. Assumption: 2 CAT 836H compactors compact waste at active face as it is pushed up by dozers. Typically, only run 4 active face machines for 3 to 4 hours per day during peak times. It is assumed that the compactors will operate 4 hours/day for the entire year (365 days/yr) as a conservative approach. Job Number AQU-VC H-19 Appendix H - Dust Emissions Estimation.docx
277 Table H.13: Estimated Emissions Associated with Vehicle Exhausts from the Landfill Activities Emission Source Waste disposal trucks travelling to active face Light vehicles (contractor vehicles and site utes) Scenario Emissions (kg/annum) TSP PM10 Base Case (Cell 2L) Scenario 1 (Cell 1) Scenario 2 (Cell 4) 1,035 1,035 Scenario 3 (Cell 8) Scenario 4 (Cell 10) All Water carts All Haul trucks transporting cover material Base Case (Cell 2L) Scenario 1 (Cell 1) Scenario 2 (Cell 4) Scenario 3 (Cell 8) Scenario 4 (Cell 10) Dozers All Excavators All FEL All Flat drum roller All Compactor All Job Number AQU-VC H-20 Appendix H - Dust Emissions Estimation.docx
278 H.6 COMBUSTION EMISSIONS STATIONARY ENGINES Diesel is combusted in light towers (large stationary engines) at the landfill and in the dryer at the asphalt plant. TSP and PM10 emissions from stationary engines were estimated using the method described in the NPI EET Manual for Combustion Engines (DEWHA, 2008) and the AP42 Chapter 11.1 Hot Mix Asphalt Plants (US EPA, 2004). The equation used to calculate the emissions for TSP and PM10 is given below. The default emission factors for PM10 used are provided in Table H.14. The default emission factor for TSP is assumed to be equivalent to the PM10 emission factor as TSP emissions are generated through combustion (not mechanically generated). The activity data and estimated emissions associated with stationary engines exhausts are presented in Table H.15. E i = Q EF i where: E i = Total emissions from stationary engines for pollutant i (kg/yr) Q = Quantity of fuel consumed (L/yr) EF i = Default emission factor for pollutant i (kg/l) Table H.14: Default Emission Factors for Stationary Engines Description TSP Emission Factors PM10 Units > 450 kw stationary engines a 1.64x x10-03 kg/l Dryer, hot screens, mixer (fabric filter) b kg/t of HMA produced a. Table 43 (DEWHA, 2008). b. Table (US EPA, 2004). Table H.15: Activity Data and Estimated Emissions for Stationary Engines Activity Area Data Input Value Units Quantity of diesel combustion in light towers a 44,953 L/yr Landfill Estimated TSP emissions 74 kg/yr Estimated PM10 emissions 74 kg/yr Quantity of HMA produced b 148,430 t/yr Asphalt Plant Estimated TSP emissions 3,117 kg/yr Estimated PM10 emissions 2,004 kg/yr a. Estimated based on: - 9 light towers running for approximately 8 hrs a day. - a fuel consumption rate of 1.7 L/hr estimated based on the specifications for the Combilite CL-9K: for 130L of diesel, the engine can operate for 76 hours at 100% load days/year (worst-case). b. Refer to Table H.5. Job Number AQU-VC H-21 Appendix H - Dust Emissions Estimation.docx
279 H.7 MRL POWER PLANT MRL operates a power plant that combusts MRL landfill gas to generate electric energy. The power plant emission sources consist of four 1115 kw generators and three flares that burn the excess gas. Emissions from these sources have been estimated to understand if the power plant should be considered in the cumulative assessment. The emissions from the flares were estimated using the method described in the NPI EET Manual for Oil and Gas Extraction and Production Version 2.0 (DSEWPC, 2013). The equation used to calculate the emissions and the default emission factors are provided in Table H.16. The emissions from the generator s exhausts were estimated using the method described in the NPI EET Manual for Combustion Engines (DEWHA, 2008). The equation used to calculate the emissions and the default emission factors are provided in Table H.16. E i = Q EF i where: E i = Total emissions from flar/generator for pollutant i (kg/yr) Q = Quantity of fuel consumed (tonne/yr) (kwh/yr) EF i = Default emission factor for pollutant i (kg/tonne) (kg/kwh) Table H.16: Default Emission Factors for MRL Power Plant Emission Sources Emission Factor Flare (kg/tonne) a Biogas Engine (kg/kwh) b Carbon Monoxide (CO) Oxides of Nitrogen (NOx) Total VOCs 15 - TSP 0 - PM a. DSEWPC (2013) Table 8. Non-smoking flare b. DEWHA (2008): Table 56 and To estimate the current typical emissions from the MRL power plant flare, the April 2015 activity data were reviewed and extrapolated to determine annual fuel usages (estimated to be 13,400 tonnes/year). The emissions from the generators was determined assuming 100% capacity was used for all hours of the year (i.e. 39,039,600 kwh). The resulting annual emissions from the MRL power plant are summarised in Table H.17. Emission Factor Table H.17: Default Emission Factors for MRL Power Plant Emission Sources Flare (kg) Biogas Engine (kg) Carbon Monoxide (CO) 117, , ,000 Oxides of Nitrogen (NOx) 20, , ,000 Total VOCs 202, ,000 TSP 0-0 PM Total (kg) Job Number AQU-VC H-22 Appendix H - Dust Emissions Estimation.docx
280 As there are no estimated particulate matter emissions from the MRL power plant it is unnecessary to include them in the dust assessment. There is not a local issue with CO or NOx based on the ambient monitoring data (EPA Victoria, 2014). The 2013 maximum 1-hour NO2 concentration in Deer Park was 0.05ppm which is less than half of the EPA objective of 0.12 ppm. The hour maximum CO concentrations was 1.1 ppm which is significantly less than the EPA objective of 9.0 ppm. As the power plant has been operational for many years, this indicates that the power plant is not causing an air quality issue and therefore dispersion modelling of the power plant was found to be unnecessary. H.8 EMISSIONS SUMMARY The summary of the total annual modelled dust emissions associated with the landfill and the asphalt plant are provided in Table H.18. Wheel generated dust is the primary source of emissions for the landfill facility. The Asphalt plant s are minimal compared to the landfill and quarry emissions. Updated transport conditions included a slightly higher frequency of trucks for most scenarios compared to the modelled emissions. The summary of the total annual dust emissions including the updated transport condition are provided in Table H.18. Again, wheel generated dust is the primary source of emissions for the landfill facility. Facilityas Table H.18: Total Annual Modelled Emissions Summary Total Emissions (kg/year) TSP PM10 Landfill Base Case (Cell 2L) 237,059 53,888 Landfill Scenario 1 (Cell 1) 347,489 78,599 Landfill Scenario 2 (Cell 4) 406,436 91,484 Landfill Scenario 3 (Cell 8) 261,546 59,443 Landfill Scenario 4 (Cell 10) 343,313 77,949 Deer Park Boral Asphalt Plant 3,463 2,187 Table H.19: Total Annual Emissions Summary including Updated Transport Conditions Facility Total Emissions (kg/year) TSP PM10 Landfill Base Case (Cell 2L) 252,486 57,289 Landfill Scenario 1 (Cell 1) 368,821 83,303 Landfill Scenario 2 (Cell 4) 387,506 87,310 Landfill Scenario 3 (Cell 8) 288,398 65,363 Landfill Scenario 4 (Cell 10) 380,194 86,081 Deer Park Boral Asphalt Plant 3,463 2,187 Job Number AQU-VC H-23 Appendix H - Dust Emissions Estimation.docx
281 H.9 REFERENCES ABS (2010), Australian Bureau of Statistics Survey of Motor vehicles Use: 31/10/10. Boral (2014a), Deer Park NPI Input FY13.xlsx, pers comm. 17/06/14 via . Boral (2014b), Pers. Comm. pers comm. 18/06/14. Cowherd, Donaldson and Hegarty (2006), US EPA AP-42 Background document for revisions to fine fraction ratios used for AP-42 fugitive dust emission factors, November DEWHA (2008), National Pollutant Inventory Emissions Estimation Technique Manual for Combustion Engines v3.0, Department of the Environment, Water, Heritage and Arts, June DSEWPC (2012), National Pollutant Inventory Emissions Estimation Technique Manual for Mining v3.1, Department of Sustainability, Environment, Water, Population and Communities, January EPA Victoria (2013), 2013 Victorian air monitoring results, EPA Victoria, 18 September 2014, Golder Associates (2016), Works Approval Figures MRL Works Approval, Vic, Technical Memorandum Reference no , February Golder Associates (2016b), Draft Landfill Gas Management Plan, Melbourne Regional Landfill, Ravenhall VIC. Report prepared for: Landfill Operations Pty Ltd. Report Number , February GTA Consultants (2016), Hopkins Road, Truganina & Christies Road, Ravenhall Transport Impact Assessment, Prepared for Landfill Operations Pty Ltd, Reference number 15M , February Pacific Environment (2015), 8948 Boral Deer Park Quarry Plant AQ Assessment R1.4, prepared by Pacific Environment on 24/04/15. US EPA (1998), Emissions factors & AP 42, Compilation of Air Pollutant Emissions Factors, Chapter 11.9: Western Surface Coal Mining (Final Section), United States Environmental Protection Agency, October US EPA (2004), Emissions factors & AP 42, Compilation of Air Pollutant Emissions Factors, Chapter Hot Mix Asphalt Plants, United States Environmental Protection Agency, March US EPA (2006a), Emissions factors & AP 42, Compilation of Air Pollutant Emissions Factors, Chapter Industrial Wind Erosion, United States Environmental Protection Agency, November US EPA (2006b), Emissions factors & AP 42, Compilation of Air Pollutant Emissions Factors, Chapter Unpaved Roads, United States Environmental Protection Agency, November US EPA (2006c), Emissions factors & AP 42, Compilation of Air Pollutant Emissions Factors, Chapter Aggregate Handling and Storage Piles, United States Environmental Protection Agency, November Job Number AQU-VC H-24 Appendix H - Dust Emissions Estimation.docx
282 Appendix I CONTOUR PLOTS Job ID AQU-VC I Cleanaway Melbourne Regional Landfill AQA R10 Low Res.docx
283 I.1 SCENARIOS The contour plots predicted for odour, PM10 and dust deposition for the scenarios described in Table I.1 are presented in Section I.2, I.3 and I.4 respectively. For Scenario 3 and 4, the odour contours consider the potential reduced odour emissions due to the reduction of organic waste that is predicted based on the Draft Metropolitan Waste and Resource Recovery Implementation Plan. These scenarios are labelled as LOW meaning low organic fraction of waste. Table I.1: Summary of Modelled Scenarios Scenario Base Case 2014 (incl. Pinegro) Base Case 2015 Active Cell 2L Meteorological Year Substance Description 2008 to 2012 (5 years) Odour 2008 and 2009 PM10 and dust deposition 2008 to 2012 (5 years) Odour 3,600 m² active cell + Pinegro emissions Scenario 1 1 Scenario and 2009 PM to 2012 (5 years) Odour 2008 Dust deposition 2008 and 2009 PM to 2012 (5 years) Odour 1,800 m² active tipping face Scenario and 2009 PM to 2012 (5 years) Odour Scenario 3 LOW 2008 to 2012 (5 years) Odour 2008 Dust deposition Scenario and 2009 PM to 2012 (5 years) Odour Scenario 4 LOW 2008 to 2012 (5 years) Odour 1,800 m² active tipping face 20% less organics 1,800 m² active tipping face 1,800 m² active tipping face 30% less organics I.2 ODOUR CONCENTRATION The contours of predicted C min values are presented in Figure I.1 to Figure I.8 for the modelled scenarios detailed in Table I.1. It should be noted that the odour contours are indicative and should not be relied on in detail to determine specific concentrations at points of interest. A more appropriate indication of odour impact is gained by reference to the odour risk assessment. Job ID AQU-VC I-2 Appendix I - Contour Plots.docx
284 Figure I.1: Modelled 3-min Odour Concentrations (ou) - Base Case 2014 (incl. Pinegro) Cell 2L, Active Tipping Face 3,600 m² (Includes Pinegro) Job ID AQU-VC I-3 Appendix I - Contour Plots.docx
285 Figure I.2: Modelled 3-min Odour Concentrations (ou) - Base Case 2015 Cell 2L, Active Tipping Face 1,800 m² Job ID AQU-VC I-4 Appendix I - Contour Plots.docx
286 Figure I.3: Modelled 3-min Odour Concentrations (ou) Scenario 1 (Cell 1), Active Tipping Face 1,800 m² Job ID AQU-VC I-5 Appendix I - Contour Plots.docx
287 Figure I.4: Modelled 3-min Odour Concentrations (ou) Scenario 2 (Cell 4), Active Tipping Face 1,800 m² Job ID AQU-VC I-6 Appendix I - Contour Plots.docx
288 Figure I.5 Modelled 3-min Odour Concentrations (ou) Scenario 3 (Cell 6), Active Tipping Face 1,800 m² Job ID AQU-VC I-7 Appendix I - Contour Plots.docx
289 Figure I.6 Modelled 3-min Odour Concentrations (ou) Scenario 3 LOW (Cell 6), Active Tipping Face 1,800 m². 20% Less Organics Job ID AQU-VC I-8 Appendix I - Contour Plots.docx
 Scenario 4 (Cell 10), Active Tipping")
290 Figure I.7 Modelled 3-min Odour Concentrations (ou) Scenario 4 (Cell 10), Active Tipping Face 1,800 m² Job ID AQU-VC I-9 Appendix I - Contour Plots.docx
291 Figure I.8 Modelled 3-min Odour Concentrations (ou) Scenario 4 LOW (Cell 10), Active Tipping Face 1,800 m², 30% Less Organics Job ID AQU-VC I-10 Appendix I - Contour Plots.docx
292 I.3 PM10 CONCENTRATION Contour plots of cumulative impacts for PM10 for the scenarios described in Table I.1 are presented in Figure I.9 to Figure I.13. Modelling using meteorological data for 2008 and 2009 produced similar results. Job ID AQU-VC I-11 Appendix I - Contour Plots.docx
293 Figure I.9 Maximum 24-hour PM10 Concentrations (µg/m 3 ) Including Background - Base Case (Cell 2L) Job ID AQU-VC I-12 Appendix I - Contour Plots.docx
 Including Background Scenario 1")
294 Figure I.10 Maximum 24-hour PM10 Concentrations (µg/m 3 ) Including Background Scenario 1 (Cell 1) Job ID AQU-VC I-13 Appendix I - Contour Plots.docx
295 Figure I.11 Maximum 24-hour PM10 Concentrations (µg/m 3 ) Including Background Scenario 2 (Cell 4) Job ID AQU-VC I-14 Appendix I - Contour Plots.docx
296 Figure I.12 Maximum 24-hour PM10 Concentrations (µg/m 3 ) Including Background Scenario 3 (Cell 8) Job ID AQU-VC I-15 Appendix I - Contour Plots.docx
297 Figure I.13 Maximum 24-hour PM10 Concentrations (µg/m 3 ) Including Background Scenario 4 (Cell 10) Job ID AQU-VC I-16 Appendix I - Contour Plots.docx
298 I.4 DUST DEPOSITION The contour plots for dust deposition for the scenarios described in Table I.1 are presented in Figure I.14 to Figure I.16. The dust deposition results for the landfill s activities were compared to the incremental guideline of 2 g/m 2 /month and the results for cumulative impacts were compared to the cumulative guideline of 4 g/m 2 /month. However, total deposition rate will also include contributions from external sources that were not included in the model. Predicted deposition rates are well within the guidelines at sensitive receptors. Because the predicted deposition rates are well below the guideline for incremental impact, only the Base Case scenario and the future scenarios likely to most impact the nearby sensitive receptors (i.e. Scenarios 2 and 4) were modelled using 2008 meteorological data. Job ID AQU-VC I-17 Appendix I - Contour Plots.docx
 Base Case (Meteorological")
299 Figure I.14 Maximum Annual Average Dust Deposition (g/m 2 /month) Base Case (Meteorological Year 2008) Job ID AQU-VC I-18 Appendix I - Contour Plots.docx
 Scenario 2 (Meteorological")
300 Figure I.15 Maximum Annual Average Dust Deposition (g/m 2 /month) Scenario 2 (Meteorological Year 2008) Job ID AQU-VC I-19 Appendix I - Contour Plots.docx
 Scenario 4 (Meteorological")
301 Figure I.16 Maximum Annual Average Dust Deposition (g/m 2 /month) Scenario 4 (Meteorological Year 2008) Job ID AQU-VC I-20 Appendix I - Contour Plots.docx
BOGGABRI COAL MINE PRP U1: MONITORING RESULTS WHEEL GENERATED DUST
 Report BOGGABRI COAL MINE PRP U1: MONITORING RESULTS WHEEL GENERATED DUST BOGGABRI COAL PTY LTD Job ID. 08031 8 August 2014 PROJECT NAME: Boggabri Coal Mine PRP U1: Monitoring Results Wheel Generated Dust
GLNG PROJECT - ENVIRONMENTAL IMPACT STATEMENT
 6 J:\Jobs\42626220\07 Deliverables\EIS\FINAL for Public Release\6. Values and Management of Impacts\6-8 Air Quality\06 08 Air Quality (Section 6.8) FINAL PUBLIC track.doc GLNG Project - Environmental Impact
Draft Air Quality & Odour Net Effects Analysis & Comparative Evaluation Report
 Clean Harbors Canada Inc. Lambton Landfill Expansion Environmental Assessment Draft Air Quality & Odour Net Effects Analysis & Prepared By: JANUARY, 2014 Executive Summary Two expansion alternatives were
Newland Developers Pty Ltd. Land Parcel corner Ballarto Road and Clyde Fiveways Road, Clyde Buffer Constraint Assessment
 Newland Developers Pty Ltd Land Parcel corner Ballarto Road and Clyde Fiveways Road, Clyde Buffer Constraint Assessment November 2013 Table of contents 1. Introduction... 1 2. Site Location and Development...
Intermodal Logistics Centre at Enfield Environmental Assessment CHAPTER 12 AIR QUALITY ASSESSMENT
 Intermodal Logistics Centre at Enfield Environmental Assessment CHAPTER 12 AIR QUALITY ASSESSMENT October 2005 Contents 12. 12-1 12.1 Introduction 12-1 12.2 Factors Affecting Air Quality 12-1 12.3 Air
F3. Final Air Quality & Odour Net Effects Analysis & Comparative Evaluation Report
 F3. Final Air Quality & Odour Net Effects Analysis & Comparative Evaluation Report Clean Harbors Canada Inc. Lambton Landfill Expansion Environmental Assessment Air Quality & Odour Net Effects Analysis
Evaluating and Controlling Landfill Odors and Other Advancements in Landfill Technologies
 Evaluating and Controlling Landfill Odors and Other Advancements in Landfill Technologies Lindsay E. James, R.G. Senior Project Manager Blackstone Environmental, Inc. 16200 Foster Street Overland Park,
Evaluating and Controlling Landfill Odors and Other Advancements in Landfill Technologies
 Evaluating and Controlling Landfill Odors and Other Advancements in Landfill Technologies Lindsay E. James, R.G. Senior Project Manager Blackstone Environmental, Inc. 9153 West 133 rd Street Overland Park,
F3. Draft Air Quality & Odour Net Effects Analysis & Comparative Evaluation Report
 F3. Draft Air Quality & Odour Net Effects Analysis & Comparative Evaluation Report Clean Harbors Canada Inc. Lambton Landfill Expansion Environmental Assessment Draft Air Quality & Odour Net Effects Analysis
REPORT SURAT GAS PROJECT SUPPLEMENTARY AIR QUALITY ASSESSMENT. Coffey Environments
 REPORT SURAT GAS PROJECT SUPPLEMENTARY AIR QUALITY ASSESSMENT Coffey Environments Job No: 3568D 7 June 2013 PROJECT TITLE: Surat Gas Project Supplementary Air Quality Assessment JOB NUMBER: 3568D PREPARED
WasteMINZ Webinar 22 February 2018
 WasteMINZ Webinar 22 February 2018 Dr Doug Boddy Senior Air Quality Scientist Pattle Delamore Partners Ltd Auckland doug.boddy@pdp.co.nz Ph +64 9 529 5858 Mob +64 21 977 810 https://www.linkedin.com/in/doug-boddy-b279615/
Joint Statement prepared by Shane Lakmaker and Terry Bellair arising from conclave of air quality experts
 In the matter of the Metro Tunnel Planning Panels Victoria Proponent: Melbourne Metro Rail Authority Joint Statement prepared by Shane Lakmaker and Terry Bellair arising from conclave of air quality experts
P E C. Victorian Planning Authority. Cardinia Shire Council Planning Scheme Amendment C 232 Officer Precinct Structure Plan
 Victorian Planning Authority Cardinia Shire Council Planning Scheme Amendment C 232 Officer Precinct Structure Plan Review of GHD report # 75469 dated 31 July 2018 draft 2 Contents 1. Introduction 4 2.
Santos LNG Facility Noise Assessment
 F4 Noise REPORT 20-2014-R7 Revision 1 Santos LNG Facility Noise Assessment PREPARED FOR URS Australia Pty Ltd Level 16, 240 Queen Street Brisbane QLD 4000 9 NOVEMBER 2009 HEGGIES PTY LTD ABN 29 001 584
Work Program PRP4.2 Particulate Emissions from Coal Trains
 Work Program PRP4.2 Particulate Emissions from Coal Trains Prepared for Australian Rail Track Corporation Ltd Final Prepared by ABN 92 097 270 276 Ground Floor, 16 Marie St PO Box 2217 Milton, Queensland,
CCE AWARD SUBMISSION BARRIE LANDFILL RECLAMATION AND RE-ENGINEERING
 CCE AWARD SUBMISSION BARRIE LANDFILL RECLAMATION AND RE-ENGINEERING 2 CCE AWARD SUBMISSION GOLDER ASSOCIATES LTD. SUMMARY The City of Barrie landfill was impacting water resources and required remediation.
Gunlake Quarry. Air Quality Management Plan
 Gunlake Quarry Air Quality Management Plan August 2015 Table of Contents 1. Introduction 3 1.1 Overview 3 1.2 Aims and Objectives 3 2. Air Quality Criteria 3 2.1 Impact Assessment Criteria 4 2.2 Sources
10.0 AIR QUALITY AND CLIMATIC FACTORS
 .0 AIR QUALITY AND CLIMATIC FACTORS.1 ASSESSMENT METHODOLOGY.1.1 General Section 39 (2) (b) (ii) of the Transport (Railway Infrastructure) Act 2001, requires that proposed developments are examined in
Viridor Waste Management. Proposed Development of an In-Vessel Composting Facility. Land at Exide Batteries, Salford Road, Bolton
 Viridor Waste Management Proposed Development of an In-Vessel Composting Facility Land at Exide Batteries, Salford Road, Bolton Non-Technical Summary January 2009 Introduction Viridor Waste Management
Environmental Impact Statement. Avoca Tank Project
 ABN 88 100 095 494 Environmental Impact Statement for the Avoca Tank Project Prepared by: R.W. CORKERY & CO. PTY. LIMITED July 2014 This page has intentionally been left blank ABN 88 100 095 494 Environmental
APPENDIX H AIR DISPERSION MODELLING REPORT BY PROJECT MANAGEMENT LTD. (REF. CHAPTER 11 AIR QUALITY AND CLIMATIC FACTORS)
") 101050.22.RP.0001 A Environmental Impact Statement 15 th April 2005 APPENDIX H AIR DISPERSION MODELLING REPORT BY PROJECT MANAGEMENT LTD. (REF. CHAPTER 11 AIR QUALITY AND CLIMATIC FACTORS) S:\Projects\190900\101050
101050.22.RP.0001 A Environmental Impact Statement 15 th April 2005 APPENDIX H AIR DISPERSION MODELLING REPORT BY PROJECT MANAGEMENT LTD. (REF. CHAPTER 11 AIR QUALITY AND CLIMATIC FACTORS) S:\Projects\190900\101050
This summary and the Report subsequently inform the recommended mitigation contained in Section 28 and will inform the Project conditions.
 18. Air The Project Air quality team prepared an Air Quality Assessment Report for the Project, which is included in Volume 3 (Part 1). The Report provides an assessment of air quality effects associated
Table OCO 8.1 Air Quality Management. Audit Check. Ref Subject Reference Control Activity Responsibility Timing Performance Measure
 These tables set out the operational controls required to achieve the objectives and targets set out in Program 08 Air Quality Management. BBA will, as a minimum, implement the control activities and performance
Roma to Brisbane Pipeline Dalby Compressor Station Upgrade Environmental Management Plan. Appendix 8. Noise Assessment
 Roma to Brisbane Pipeline Dalby Compressor Station Upgrade Environmental Management Plan Appendix 8 Noise Assessment PR104962-1 Rev 0; June 2011 PR104962-1 Rev 0; June 2011 Roma to Brisbane Pipeline Dalby
24 August Leanne Cross Senior Environmental Planner KDC Via
 24 August 2018 Leanne Cross Senior Environmental Planner KDC Via email: Leanne@kdc.com.au RE: Air Quality Assessment Proposed Mt Piper Rail Loop Modification Dear Leanne, Todoroski Air Sciences has assessed
Paper No: o7130 Case Study: Odour Risk Management at the WTP, One of Australia s Largest & Most Unique WWTPs
 Paper No: o7130 Case Study: Odour Risk Management at the WTP, One of Australia s Largest & Most Unique WWTPs Josef Cesca, CH2M HILL Australia Pty Limited, jcesca@ch2mhill.com.au Amy Flanagan, CH2M HILL
8 AIR AND CLIMATE Introduction
 Table of contents 8 AIR AND CLIMATE... 8-1 8.1 Introduction... 8-1 8.1.1 Scope of the Assessment... 8-1 8.1.2 Methodology... 8-1 8.1.3 Assessment Criteria for Air Quality... 8-2 8.1.4 National Legislation
Comparison of Methods Used to Measure Odour at Wastewater Treatment Plant Fencelines
 Comparison of Methods Used to Measure Odour at Wastewater Treatment Plant Fencelines Jay R. Witherspoon and Jennifer L. Barnes CH2M HILL, Inc. 777 108 th Avenue NE, Suite 800 Bellevue, WA, USA 98004-5118
Site-Specific PM 10 Ambient Air Monitoring Plan
 Site-Specific PM 10 Ambient Air Monitoring Plan Great Plains Sand Processing Facility Wenck File #2771-01 Prepared for: GREAT PLAINS SAND, LLC 15870 Johnson Memorial Drive Jordan, MN 55352 February 2012
Dust Management Procedure Environment
 1 Purpose and Scope This procedure specifies the operational environmental requirements relating to dust management at the Roy Hill Project. This procedure applies to all personnel involved in activities
NEWGEN POWER STATION NEERABUP GREENHOUSE GAS ABATEMENT PROGRAMME (GGAP) March 2008 FINAL
 March 2008 FINAL") NEWGEN POWER STATION NEERABUP GREENHOUSE GAS ABATEMENT PROGRAMME (GGAP) March 2008 FINAL KATESTONE ENVIRONMENTAL PTY LTD A.B.N. 92 097 270 276 Unit 5, 249 Coronation Drive, Milton, Queensland, AUSTRALIA,
NEWGEN POWER STATION NEERABUP GREENHOUSE GAS ABATEMENT PROGRAMME (GGAP) March 2008 FINAL KATESTONE ENVIRONMENTAL PTY LTD A.B.N. 92 097 270 276 Unit 5, 249 Coronation Drive, Milton, Queensland, AUSTRALIA,
The location of the proposed CBP and embankments that would comprise TSF2 are shown in Figure 1-1.
 27 March 2017 Gwen Wilson Broken Hill Operations Pty Ltd Dear Gwen, Re: Air Quality Assessment for the Rasp Mine Modification 4 1 INTRODUCTION Pacific Environment has been commissioned by Broken Hill Operations
REPORT. Assessment of Separation Distances. Te Mata Mushrooms
 REPORT Assessment of Separation Distances Te Mata Mushrooms Prepared for Prepared by Date Job Number 29125.003 Distribution: (FILE) 2 copies 1 copy Table of contents 1 Introduction 1 2 Odour from Te Mata
MT ARTHUR COAL U1 Particulate Matter Control Best Practice Implementation Report Wheel Generated Dust
 U1 Particulate Matter Control Best Practice Implementation Report Document Owner Donna McLaughlin Document Approver Joel Chin Date Published 15 August 2014 Page 2 of 18 Contents 1. Introduction... 3 2.
Air Quality Management Plan
 Strength. Performance. Passion. Jandra Quarry Holcim Australia Pty. Ltd. 2015 Holcim Country Company Name 1 CONTENTS 1 1.1 1.2 1.3 1.4 2 2.1 2.2 2.3 3 3.1 3.2 4 4.1 4.2 4.3 5 5.1 5.2 6 6.1 6.2 7 8 8.1
Environmental Risk Analysis
 Appendix 10 11 12 13 14 15 16 17 18 191 Groundwater Controlled UHSA Air Agricultural Historic EIS Preliminary Environmental Blasting Quality Surface Secretary s Noise Statement Aboriginal Economic Action
Millipore Thermal Oxidiser Emissions Dispersion Modelling Impact Assessment
 Millipore Thermal Oxidiser Emissions Dispersion Modelling Impact Assessment Issue No 2 45078628 EPA Export 25-07-2013:19:52:54 Project Title: Report Title: Millipore Thermal Oxidiser Emissions Project
VIRIDOR WASTE MANAGEMENT LIMITED. Lostock Waste Treatment Plant. Airborne Pollutant Management Plan. November 2009
 VIRIDOR WASTE MANAGEMENT LIMITED Lostock Waste Treatment Plant CONTENTS 1 Introduction... 1 2 Sources, releases and impacts... 2 3 Airborne Pollutant Control Measures... 3 3.1 General... 3 3.2 Site Management
QUEENSLAND COMPETITION AUTHORITY
 REPORT TO QUEENSLAND COMPETITION AUTHORITY 2 JUNE 2017 WHOLESALE ELECTRICITY SPOT PRICES ESTIMATION OF QUEENSLAND WHOLESALE ELECTRICITY SPOT FOR USE BY THE QUEENSLAND COMPETITION AUTHORITY IN ITS ADVICE
BEST MANAGEMENT PRACTICES PLAN FOR FUGITIVE DUST Greenwood Aggregates Company Limited Violet Hill Pit > Town of Mono, ON
 BEST MANAGEMENT PRACTICES PLAN FOR FUGITIVE DUST Greenwood Aggregates Company Limited Violet Hill Pit > Town of Mono, ON Prepared For: Greenwood Aggregates Company Limited 205467 County Road 109 Amaranth,
Alinta Cogeneration (Wagerup) Pty Ltd Alinta Wagerup Units 1 2
 Pty Ltd Alinta Wagerup Units 1 2") Pty Ltd Alinta Wagerup Units 1 2 STACK EMISSIONS MANAGEMENT PLAN WP03100-EV-PL-0006 Rev 1 October 2006 Pty Ltd Alinta Wagerup Units 1 2 STACK EMISSIONS MANAGEMENT PLAN WP03100-EV-PL-0006 Rev 1 October
Pty Ltd Alinta Wagerup Units 1 2 STACK EMISSIONS MANAGEMENT PLAN WP03100-EV-PL-0006 Rev 1 October 2006 Pty Ltd Alinta Wagerup Units 1 2 STACK EMISSIONS MANAGEMENT PLAN WP03100-EV-PL-0006 Rev 1 October
Air Quality Technical Report PM2.5 Quantitative Hot spot Analysis. A. Introduction. B. Interagency Consultation
 Air Quality Technical Report PM2.5 Quantitative Hot spot Analysis I 65, SR44 to Southport Road (Segmented from SR44 to Main Street and Main Street to Southport Road) A. Introduction This technical report
Global Waste Technical Services Ltd. Street Fuel Ltd, Beth 6 Basin 3 Chatham Dockyard Chatham ME4 4SR. NOISE and VIBRATION MANAGEMENT PLAN
 Street Fuel Ltd, Beth 6 Basin 3 Chatham Dockyard Chatham ME4 4SR NOISE and VIBRATION MANAGEMENT PLAN Permit No. EPR/XP3598XP Global solutions any waste, anywhere Revision 1.0 May 2013 Global Solutions
Air Quality Near Railway Lines Used by Coal Trains
 June 2016 Air Quality Near Railway Lines Used by Coal Trains Preliminary Summary of Data from White Rock and Delta This report was prepared by the Air Quality and Climate Change Division of Metro Vancouver.
AIR QUALITY MANAGEMENT PLAN CORAKI QUARRY
 AIR QUALITY MANAGEMENT PLAN CORAKI QUARRY Date of Issue: Coraki Quarry Air Quality Management Plan 1.0 Purpose The air quality management plan is required to comply with Condition 15 of the Development
Bushfire Attack Level (BAL) Report Smythes Rd, Delacombe
 Report Smythes Rd, Delacombe") Bushfire Attack Level (BAL) Report 115-201 Smythes Rd, Delacombe 13 December 2015 Contents Summary of Conclusions...4 Introduction...5 Objective of the Report...5 General Terms of Engagement for Bushfire
Bushfire Attack Level (BAL) Report 115-201 Smythes Rd, Delacombe 13 December 2015 Contents Summary of Conclusions...4 Introduction...5 Objective of the Report...5 General Terms of Engagement for Bushfire
Draft Dust Management Plan
 Draft Dust Management Plan December 2017 Mt Messenger Alliance MMA-ENV-AIR-RPT-1032 Quality Assurance Statement Prepared by: Dylan Vernall, Sharon Atkins Tonkin and Taylor Ltd Reviewed by: Jenny Simpson
Appendix 12. Assessment of Air Quality Effects. Appendix 12
 Appendix 12 Assessment of Air Quality Effects Appendix 12 OTAIKA QUARRY - PROPOSED OVERBURDEN DISPOSAL AREA Application for Land Use Consent and Assessment of Environmental Effects Memorandum AECOM New
LYNWOOD QUARRY AIR QUALITY MANAGEMENT PLAN FINAL
 LYNWOOD QUARRY AIR QUALITY MANAGEMENT PLAN FINAL October 2016 LYNWOOD QUARRY AIR QUALITY MANAGEMENT PLAN FINAL Prepared by Umwelt (Australia) Pty Limited on behalf of Holcim (Australia) Pty Limited Project
EPA Inquiry: Submission on behalf of Paper Australia Pty Ltd
 Our reference AGPAPE16499-9101755/01 567 Collins Street, Melbourne VIC 3000 GPO Box 9925 Melbourne VIC Tel +61 396723000 Fax +61 396723010 www.corrs.com.au CORRS CHAMBERS WESTGARTH lawyers Sydney Melbourne
VIRIDOR WASTE MANAGEMENT LIMITED. Lostock Waste Treatment Plant. Odour Management Plan. November 2009
 VIRIDOR WASTE MANAGEMENT LIMITED Lostock Waste Treatment Plant CONTENTS 1 Introduction...1 2 Sources, releases and impacts...2 3 Odour Control Measures...3 3.2 Site Management Responsibility...3 3.3 Physical
EMISSION SUMMARY AND DISPERSION MODELLING REPORT
 1 EMISSION SUMMARY AND DISPERSION MODELLING REPORT Interior Heart and Surgical Centre Project (IHSC) Kelowna General Hospital Kelowna, British Columbia Prepared for PCL Constructors Westcoast Inc. Report
Victorian Temporary Standby Emergency Power Supply
 Victorian Temporary Standby Emergency Power Supply Community Presentation Morwell, Victoria January 2018 Introduction Temporary standby emergency power supply is needed to help meet Victoria s power needs
BELL BAY PULP MILL MANAGEMENT PLAN
 Management Plan BELL BAY PULP MILL MANAGEMENT PLAN Revision Date Revision Description Prepared Reviewed Approved B0 19 October 2007 C0 21 November 2007 D0 19 December 2007 E0 20 December 2007 F0 26 October
CCR Fugitive Dust Control Plan
 CCR Fugitive Dust Control Plan Mill Creek Generating Station Louisville Gas & Electric Company Jefferson County, Kentucky October 2015 CCR Fugitive Dust Control Plan - Mill Creek Generating Station Page
Review of KCBX Dispersion Modeling used to Support Their Variance Request
 Memorandum To: From: Robert Saikaly and Stephen Zemba Date: Subject: Review of KCBX Dispersion Modeling used to Support Their Variance Request CDM Smith Inc. (CDM Smith) reviewed two air dispersion modeling
Arab Journal of Nuclear Sciences and Applications
 Arab J. Nucl. Sci. Appl, Vol 51, 2, 68-81 (2018) Arab Journal of Nuclear Sciences and Applications ISSN 1110-0451 Web site: ajnsa.journals.ekb.eg (ESNSA) Environmental Impact of Conventional Power Plant
TECHNICAL BULLETIN. METHODOLOGY FOR MODELLING ASSESSMENTS OF CONTAMINANTS WITH 10-MINUTE AVERAGE STANDARDS AND GUIDELINES under O. Reg.
 TECHNICAL BULLETIN Standards Development Branch April 2008 METHODOLOGY FOR MODELLING ASSESSMENTS OF CONTAMINANTS WITH 10-MINUTE AVERAGE STANDARDS AND GUIDELINES under O. Reg. 419/05 EXECUTIVE SUMMARY This
Appendix 9. Wright Landfill Stabilization Report 2013
 Appendix 9 Wright Landfill Stabilization Report 2013 Board of County Commissioners State of Florida October 30, 2013 Ms. Dawn Templin Northwest District Florida Department of Environmental Protection 160
CRANBOURNE LANDFILL. Environmental Noise Assessment. Rp ML. 10 May 2013
 CRANBOURNE LANDFILL Environmental Noise Assessment Rp 001 2012351ML 10 May 2013 4/46 Balfour St Chippendale NSW 2008 T: +612 9282 9422 Fax: +612 9281 3611 www.marshallday.com Project: CRANBOURNE LANDFILL
Appendix Q. Tier 3 Air Quality Assessment
 Appendix Q Tier 3 Air Quality Assessment This Air Quality Assessment was received from Camilla Needham, BECA Associate Environmental Engineering 12 th July 2013. Report Northern Arterial Extension and
Waste Management, a Role for Surveyors - Linking the Environment and Planning
 Waste Management, a Role for Surveyors - Linking the Environment and Planning John R PARKER, Australia Key words: Waste management, environment, planning, extractive industry, recycling, landfill SUMMARY
2 ENVIRONMENTAL REVIEW AND THRESHOLDS OF SIGNIFICANCE
 2 ENVIRONMENTAL REVIEW AND THRESHOLDS OF SIGNIFICANCE 2.1 ENVIRONMENTAL REVIEW PROCESS The California Environmental Quality Act (CEQA) requires that public agencies (e.g., local, county, regional, and
Division 8 Intensive Animal Husbandry Code
 Division 8 Intensive Animal Husbry Code 12.8.1 Intensive Animal Husbry Code (1) The provisions in this division comprise the Intensive Animal Husbry Code. (2) They are compliance with the Intensive Animal
(1) Site Suitability PURPOSE
 Site Suitability PURPOSE") 3.3 Code for Development and Use of Rural Service Industries PURPOSE This purpose of this code is to encourage the development and use of suitable rural service industries on rural, industrial or suitable
3.3 Code for Development and Use of Rural Service Industries PURPOSE This purpose of this code is to encourage the development and use of suitable rural service industries on rural, industrial or suitable
and the term landfill generically refers to all landfills, including the above types, unless specified otherwise.
 7 Landfills 7.1 Introduction Facilities for disposing of wastes to the ground have been variously described as landfills, tips, or dumps, without reference to the degree of environmental safeguards employed
RESPONSE TO WEST GATE TUNNEL PROJECT INQUIRY AND ADVISORY COMMITTEE INTERIM ADVICE
 DATE PROJECT No. 1521107-261-TM-RevA RESPONSE TO WEST GATE TUNNEL PROJECT INQUIRY AND ADVISORY COMMITTEE INTERIM ADVICE In accordance with directions provided by the West Gate Tunnel Project (WGTP) Inquiry
Stage 2: WestConnex M5 King Georges Road Interchange Upgrade. Appendix B6 Construction Air Quality Management Plan
 Stage 2: WestConnex M5 King Georges Road Interchange Upgrade Appendix B6 Construction Air Quality Management Plan JULY 2016 DOCUMENT CONTROL File name Report name CEMP App B6 CAQMP Rev D Construction
Greater Amman Municipality
 Public Disclosure Authorized Public Disclosure Authorized Public Disclosure Authorized Public Disclosure Authorized ECO Consult Municipal Solid Waste Management & Carbon Finance in Amman Greater Amman
APPENDIX E. Air Quality and Greenhouse Gas Assessment COWAL GOLD OPERATIONS MINE LIFE MODIFICATION
 APPENDIX E Air Quality and Greenhouse Gas Assessment COWAL GOLD OPERATIONS MINE LIFE MODIFICATION Environmental Assessment 2016 Final Report Cowal Gold Operations Modification 13 Air Quality & Greenhouse
Waterview Operational Air Quality Monitoring Report November 2017
 Waterview Operational Air Quality Monitoring Report November 2017 Document No: [Subject] Waterview Tunnel Joint Operation nzta.govt.nz/waterviewconnection 1399 Great North Road, Waterview, Auckland 1026
FINAL REPORT PILBARA STRATEGIC ENVIRONMENTAL ASSESSMENT CUMULATIVE AIR QUALITY ASSESSMENT. BHP Billiton Iron Ore Pty Ltd.
 FINAL REPORT (COMMERCIAL INFORMATION VERSION) PILBARA STRATEGIC ENVIRONMENTAL ASSESSMENT CUMULATIVE AIR QUALITY ASSESSMENT BHP Billiton Iron Ore Pty Ltd Job No: 8299 22 September 2015 PROJECT TITLE: Pilbara
22 December 2009 Air Quality Management Plan by PAE Holmes Consultant Aleks Todoroski (PAE Holmes)
") EASTERN CREEK WASTE PROJECT REVISED 27 FEBRUARY 2017 LANDFILL GAS MONITORING PROGRAM Reviewed by: Pacific Environment (February 2016) Former QUARRY SITE AT OLD WALLGROVE ROAD EASTERN CREEK MATERIAL PROCESSING
EASTERN CREEK WASTE PROJECT REVISED 27 FEBRUARY 2017 LANDFILL GAS MONITORING PROGRAM Reviewed by: Pacific Environment (February 2016) Former QUARRY SITE AT OLD WALLGROVE ROAD EASTERN CREEK MATERIAL PROCESSING
To reduce the environmental impact we should ISOLATE or CONTAIN the waste in an IMPERMEABLE BARRIER
 To reduce the environmental impact we should ISOLATE or CONTAIN the waste in an IMPERMEABLE BARRIER 1 COMPONENTS OF ENGINEERED LANDFILL a) A Liner System b) A Leachate Collection Facility c) A Gas Control
Assessing odour impact in the field: A comparison of grid and plume measurements
 Assessing odour impact in the field: A comparison of grid and plume measurements PRESENTER: Christine West Emission Assessments Pty Ltd CONTACT DETAILS: Phone: 08 9494 2958 Email: christine@eapl.net.au
VIRIDOR WASTE MANAGEMENT LTD
 VIRIDOR WASTE MANAGEMENT LTD Proposed re-phasing of landfilling operations; amended restoration levels and aftercare scheme; and provision of a new waste reception building with associated site infrastructure
Washington County Landfill Reconstruction Project: Progress Updates
 Home Site Index Glossary What's New Ask MPCA Visitor Center MPCA Home > Clean Up > Perfluorochemicals > Perfluorochemical (PFC) Waste Sites > Washington County Site Progress Updates Washington County Landfill
VIRIDOR WASTE MANAGEMENT ARDLEY EFW PLANT EP APPLICATION - NON TECHNICAL SUMMARY
 VIRIDOR WASTE MANAGEMENT ARDLEY EFW PLANT EP APPLICATION - NON TECHNICAL SUMMARY S1014-0340-0008MPW NTS Rev1.doc Print Date 19 February 2009 ISSUE NUMBER 1 DATE 19/02/09 AUTHOR CHECKED MPW SMO Title Page
Veolia Environmental Services (Australia) Pty Limited
 Pty Limited") Veolia Environmental Services (Australia) Pty Limited Clyde Waste Transfer Terminal Odour Audit XXII Final Report January 2014 THE ODOUR UNIT PTY LTD THE ODOUR UNIT PTY LTD ABN 5309 116 5061 ACN 091 165
Veolia Environmental Services (Australia) Pty Limited Clyde Waste Transfer Terminal Odour Audit XXII Final Report January 2014 THE ODOUR UNIT PTY LTD THE ODOUR UNIT PTY LTD ABN 5309 116 5061 ACN 091 165
Bushfire-Prone Area Assessment Report
 Bushfire-Prone Area Assessment Report Brompton Lodge, Cranbourne 7 May 2013 Bushfire Prone-Area Assessment Report Brompton Lodge, Cranbourne Date of Inspection: 10 th April, 2013 Prepared For: Clients
Annual Monitoring Network Plan for the North Carolina Division of Air Quality. Volume 1 Addendum 2
 2016-2017 Annual Monitoring Network Plan for the North Carolina Division of Air Quality Volume 1 Addendum 2 December 28, 2016 North Carolina Division of Air Quality A Division of the North Carolina Department
Waste Licensing Waste Recovery/Disposal Activities (Other than Landfill Sites)
") Midland Waste Disposal Company Ltd., Waste Licensing Waste Recovery/Disposal Activities (Other than Landfill Sites) Section E Emissions Midland Waste Disposal Company Ltd., Waste Licensing Waste Recovery/Disposal
Midland Waste Disposal Company Ltd., Waste Licensing Waste Recovery/Disposal Activities (Other than Landfill Sites) Section E Emissions Midland Waste Disposal Company Ltd., Waste Licensing Waste Recovery/Disposal
Waterview Operational Air Quality Monitoring Report January 2018
 Waterview Operational Air Quality Monitoring Report January 2018 Document No: [Subject] Waterview Tunnel Joint Operation nzta.govt.nz/waterviewconnection 1399 Great North Road, Waterview, Auckland 1026
Air Quality Assessment For Development Options At Olkaria Geothermal Field In Kenya
 Proceedings World Geothermal Congress 2015 Melbourne, Australia, 19-25 April 2015 Air Quality Assessment For Development Options At Olkaria Geothermal Field In Kenya Cornelius J. Ndetei Kenya Electricity
ENVIRONMENTAL GUIDELINES FOR PREPARATION OF AN ENVIRONMENT MANAGEMENT PLAN. Environment Protection Authority, ACT May 2009
 ENVIRONMENTAL GUIDELINES FOR PREPARATION OF AN ENVIRONMENT MANAGEMENT PLAN Environment Protection Authority, ACT May 2009 ISBN-13: 978-0-642-60494-1 ISBN-10: 0-642-60494-0 Australian Capital Territory,
Drayton Management System Standard. Air Quality Management and Monitoring Plan
 Anglo Coal (Drayton Management) Pty Ltd Policies and Procedures Air Quality Management and Monitoring Plan Drayton Management System Standard Air Quality Management and Monitoring Plan Author: Name Pam
The Shropshire Energy from Waste Facility proposal. Some frequently asked questions. The Shropshire Energy from Waste Facility proposal
 The Shropshire Energy from Waste Facility proposal Some frequently asked questions The Shropshire Energy from Waste Facility proposal (a) What is an Energy from Waste Facility (EWF)? An EWF burns the rubbish
Division 13 Temporary Use Code
 Division 13 Temporary Use Code 12.13.1 Temporary Use Code (1) The provisions in this division comprise the Temporary Use Code. (2) They are compliance with the Temporary Use Code (section 12.13.2); overall
Closure Planning for a Tailings Storage Facility in Western Australia
 Closure Planning for a Tailings Storage Facility in Western Australia K. Bonstrom O Kane Consultants Pty. Ltd, Australia D. Chapman O Kane Consultants Inc, Canada D. Swain Perth, Australia M. O Kane O
3 CONSTRUCTION-GENERATED CRITERIA AIR POLLUTANT AND PRECURSOR EMISSIONS
 3 CONSTRUCTION-GENERATED CRITERIA AIR POLLUTANT AND PRECURSOR EMISSIONS 3.1 INTRODUCTION Construction activities have the potential to generate a substantial amount of air pollution. In some cases, the
Quantification Protocol for Landfill Gas Capture and Combustion Carbon Competitiveness Incentive Regulation
 Quantification Protocol for Landfill Gas Capture and Combustion Carbon Competitiveness Incentive Regulation Version 3.0 November 2018 Title: Quantification Protocol for Landfill Gas Capture and Combustion
ANNUAL PERFORMANCE STATEMENT
 ENVIRONMENT PROTECTION ACT 1970 SECTION 31 D(5) ANNUAL PERFORMANCE STATEMENT AGL LOY YANG PTY LTD HOLDER OF LICENCE: ACN: REGISTERED ADDRESS: PREMISES ADDRESS: 11149 077 985 758 LEVEL 24 200 GEORGE STREET
ARMSTRONG CREEK EAST PRECINCT STRUCTURE PLAN ADVISORY COMMITTEE HEARING BALOG BROILER FARM. 84 Groves Road, Connewarre
 ARMSTRONG CREEK EAST PRECINCT STRUCTURE PLAN ADVISORY COMMITTEE HEARING BALOG BROILER FARM 84 Groves Road, Connewarre Land: Lot 2, Lodged Plan LP 210971 Part Crown Allotment 2 Section 4A Parish of Connewarre,
Moolarben Coal Complex UG1 Optimisation Modification. Environmental Assessment APPENDIX F SURFACE WATER ASSESSMENT REVIEW
 Moolarben Coal Complex UG1 Optimisation Modification Environmental Assessment APPENDIX F SURFACE WATER ASSESSMENT REVIEW Moolarben Coal Complex UG1 Optimisation Modification Surface Water Assessment Review
FUGITIVE DUST CONTROL PLAN
 FUGITIVE DUST CONTROL PLAN FUGITIVE DUST CONTROL PLAN Yorktown Power Station Coal Combustion Residual Management Submitted To: Yorktown Power Station 1600 Waterview Road Yorktown, VA 23692 Submitted By:
Review of GHD s Modeling Assessment and Analysis of the Coal-fired Power Stations in the Latrobe Valley. Dr. H. Andrew Gray Gray Sky Solutions
 Review of GHD s Modeling Assessment and Analysis of the Coal-fired Power Stations in the Latrobe Valley Dr. H. Andrew Gray Gray Sky Solutions September 19, 2018 1 Introduction My name is Dr. H. Andrew
Environmental Noise Assessment
 July to September 2014 Rev 0 (Final) Report Details - July to September 2014 Filename: Job #: J0140003 Folder #: F13130 Revision: 0 (Final) Date: Prepared For Clark Potter, Senior Environmental Advisor
Division 15 Earthworks Code (including Lot Filling)
") Division 15 Earthworks Code (including Lot Filling) 12.15.1 Earthworks Code (1) The provisions in this division comprise the (2) They are compliance with the Earthworks Code (Section 12.15.2); overall
Division 15 Earthworks Code (including Lot Filling) 12.15.1 Earthworks Code (1) The provisions in this division comprise the (2) They are compliance with the Earthworks Code (Section 12.15.2); overall
Ambient Air Quality Monitoring Baseline Report, Kirby Misperton A Wellsite, KM8 Production Well
 Ambient Air Quality Monitoring Baseline Report, Kirby Misperton A Wellsite, KM8 Production Well. Prepared for: Third Energy UK Gas Ltd. Document Control Page Client Third Energy UK Gas Ltd. Document Title
MELBOURNE REGIONAL LANDFILL Landfill Gas Surface Emissions Monitoring
 MELBOURNE REGIONAL LANDFILL Landfill Gas Surface Emissions Monitoring Cleanaway is pleased to provide the Melbourne Regional Landfill Community Consultation Group (MRLCCG) with a summary and report outlining