WÄRTSILÄ TECHNICAL JOURNAL
|
|
|
- Amanda Hunter
- 6 years ago
- Views:
Transcription

1 WÄRTSILÄ TECHNICAL JOURNAL Twentyfo ur COVER STORY HYBRID POWER SYSTEM gives fuel savings 58 page ENERGY 4 Coping with variations in power demand An 80:20 mix does the trick 30 Striking the balance in 2020 What makes an affordable balancing system MARINE 48 Gas handling at every step Catering for all types of carrier 52 Optimum propeller design New developments lead to fuel savings


2 in detail issue no ipad Web Contents ENERGY Smart Power Systems Part 2/2...4 Adding flexibility to India s electricity system...10 Features and parameters of various power plant technologies...16 Utility portfolio optimization with Smart Power Generation Striking the balance in MARINE The Wärtsilä NO x reducer for IMO Tier III compliance LNG Propulsion achieves the next step in technological evolution...42 Gas handling throughout the chain Optimum propeller design leads to higher ship efficiency...52 Wärtsilä s Hybrid Power System gives fuel savings and lower emissions THIS ISSUE OF IN DETAIL is also available on ipad as a Wärtsilä ipublication app from Apple's Appstore, as well as in a browsable web version at Publisher: Wärtsilä Corporation, John Stenbergin ranta 2, P.O. Box 196, FIN Helsinki, Finland Editor-in-Chief: Ilari Kallio Managing editor and editorial office: Virva Äimälä English editing: Tom Crockford, Crockford Communications Editorial team: Tomas Aminoff, Marit Holmlund-Sund, Christian Hultholm, Dan Pettersson, Dinesh Subramaniam, Minna Timo, Susanne Ödahl Layout and production: Spoon Printed: October 2014 by PunaMusta, Joensuu, Finland ISSN Copyright 2014 Wärtsilä Corporation Paper: cover Lumiart Silk 250 g/m², inside pages UPM Fine 120 g/m² and feedback: indetail@wartsila.com THERE HAS GOT TO BE A BETTER WAY TO DO THIS has been the igniting impulse to a lot of the greatest inventions mankind has ever come up with. Either it s something that simply doesn t work that spurs our imagination, or then we spot an opportunity in something that s not done in an optimal manner. At least that s what gets me going, whether we are talking about fixing a process or improving the efficiency of an energy system. Innovation is all about solving a problem or grabbing an opportunity that has gone unnoticed, and finding the optimal solution where all resources are put to maximized use. This issue of InDetail shows this quest for optimum in action. You can read about the Viking Lady, for which we have co-developed an extremely efficient hybrid energy system giving annual fuel savings of about 15 percent and a substantial reduction in emissions. In an article on the energy markets in India we show how the system s efficiency can be optimised. Another article, based on an award-winning white paper, reveals what can be done to reach optimized balancing with renewables in Europe by Our job is to spot inefficiencies and opportunities and then bring an optimum to the equation. Simply put, we want to offer products and solutions that answer our customers needs. To be successful we need to understand our customers business environment, their challenges and how the customer tries to navigate around those challenges during every phase in their lifecycle. And then find an answer to the question: there has got to be a better way to do this. It s as simple as that. Enjoy your reading! Ilari Kallio Vice President of R & D, Ship Power 4-Stroke Editor-in-Chief of In Detail


3 WÄRTSILÄ TECHNICAL JOURNAL Solar PV 2.9% Solar Thermal 0.1% Geothermal 0.2% Biomass 1.3% Biogas 0.2% Pumped Storage 2.3% Small Hydro 2.1% Nuclear 6.4% Coal 31.6% Large Hydro 14.9% Offshore Wind 0.1% Onshore Wind 6.0% Oil 5.8% Gas 25.9% FEATURES AND PARAMETERS OF VARIOUS POWER PLANT TECHNOLOGIES Internal combustion engines can provide the needed operational flexibility for power systems around the world. Utility portfolio optimization with Smart Power Generation. Over 2.4 GW power generation capacity installed in the USA based on Wärtsilä ICEs. LNG Propulsion achieves the next step in technological evolution. More than 1000 Wärtsilä dualfuel engines sold and operating globally. More than 10 million accumulated running hours. Wärtsilä NO x reducer for IMO Tier III compliance. Over 250 NO x emission abatement units in operation or on order to date. MORE ON PAGE 4 MORE ON PAGE 42 MORE ON PAGE 36 in detail 3
![[ ENERGY / IN DETAIL ] [ ENERGY / IN DETAIL ] Smart Power Systems Part 2/2](/docs-images/74/70023963/images/4-0.jpg "AUTHOR: Jussi Laitinen, Communications Manager, Wärtsilä Power Plants 4 in")
4 [ ENERGY / IN DETAIL ] [ ENERGY / IN DETAIL ] Smart Power Systems Part 2/2 AUTHOR: Jussi Laitinen, Communications Manager, Wärtsilä Power Plants 4 in detail
 characteristics Electricity is generated sustainably, contributing to mitigating climate change Security of supply is maintained at a high level (99,99%) at all times")
5 WÄRTSILÄ TECHNICAL JOURNAL Smart Power System (SPS) characteristics Electricity is generated sustainably, contributing to mitigating climate change Security of supply is maintained at a high level (99,99%) at all times Total electricity cost to consumers is competitive, including transmission costs: grid, reserves and dispatch. Increasing flexibility is inevitable in power systems with high shares of wind and solar energy. The key is to choose the optimal sources of flexibility. The winning technology is cost-effective and able to cover long periods of low wind and solar output. In the first part of this article (In Detail 1/2014), we described the urgent need for a new approach in the design and operation of power systems. We showed that flexibility is a fundamental contributor in finding a harmony between the three cornerstones of Smart Power Systems reliability, affordability and sustainability. In many markets, the need for increased flexibility is created by rapidly growing shares of renewable generation (RES). In this second part we use recent publications of the International Energy Agency (IEA) to compare costs and the technical potential of different sources of flexibility. The four sources of flexibility There are four sources of flexibility in power systems. In this section we describe the costs and the potential of each source: 1. Energy storage 2. Interconnectivity 3. Demand response 4. Flexible generation The four flexibility sources have different characteristics, capabilities and restrictions. All of them should be included in the system design, and they should have equal opportunities to compete in the future electricity markets. In the outcome, the Smart Power System, all four sources are present and contribute to the flexibility needs within their boundaries. This text is based on IEA s 2014 paper The Power of Transformation: Wind, Sun and the Economics of Flexible Power Systems which is the most comprehensive attempt to describe the four flexibility sources to date. In addition, Energy Technology Perspectives 2014 by the IEA is used when describing flexible generation. Costs are of specific interest here because in the end of the day, costs will largely determine the investments. Significant investments will be needed to keep power systems stable with high shares of renewable capacity. As IEA states, when VRE [variable renewable energy, i.e. wind and solar] capacity is added very rapidly, dedicated investments may become necessary to increase the total system s flexibility, even in the absence of demand growth or infrastructure retirement. Calculating the costs of different flexibility sources is very complex and there is no consensus on methods indeed, there are not many in-depth attempts to create them. One of the more plausible methods is IEA s Levelised Cost of Flexibility (Figure 1). in detail 5
6 [ ENERGY / IN DETAIL ] [ ENERGY / IN DETAIL ] 1. Flexible generation with ICE 1 2. Interconnection 2 3. Storage 3 Pumped hydro CAES Li-ion batteries Costs of the four sources of flexibility 4. Demand response 4 Water heater (household) Aluminium smelter USD/MWh 1. If operating full load hours (FLH) are reduced, the costs rise. 2. Costs are very sensitive to system size. Here transmission distances are km. Shorter lines are much cheaper (below 2 USD/MWh) but less relevant in integrating renewables. 3. Costs of energy storage depend on technology and utilisation factor (the amount of energy stored and the frequency of discharging). Retrofit pumped hydro facilities are less expensive than new infrastructure. 4. In water heaters, the thermal inertia allows sporadic electricity consumption (load shifting). The capital costs of smart metering devices are significant. In aluminium smelters, the flexibility arises from interrupting the power consumption with no such time shift as in water heaters (load shedding). The capital costs are negligible; costs arise from producing less aluminium for the market. Fig. 1 - The levellised cost of flexibility (LCOF) is an estimate of the additional costs associated with generating or consuming 1 MWh of electricity more flexibly. Source: The Power of Transformation: Wind, Sun and the Economics of Flexible Power Systems, IEA Storage In theory, energy storage is ideal in balancing RES variability, because it can serve as both a source of electricity generation and a source of electricity demand. Storing surplus energy from windy days or sunny seasons for later use would solve many if not all challenges regarding RES integration. Pumped storage hydropower is by far the largest form of electricity storage to date, with a share of over 99%. The advantages of pumped hydro include maturity of the technology, fast response times and a charge/discharge capability of several hours. The disadvantages include high up-front costs, geographical limitations and the fact that pumped hydro is feasible at gridlevel only, in contrast to applications in distribution and residential scale. Compressed air energy storage (CAES) is the second largest form of storage, followed by a variety of battery technologies. 6 in detail Despite significant R&D efforts and extensive funding of pilot projects, battery technologies struggle to realise widespread deployment due to challenges in energy density, lifetime, charging capabilities, safety, recyclability and system costs, IEA states. As an example, hybrid cars still use the same battery technology than in the 1990 s when the vehicles were introduced. Storage will have its role in energy systems, but it may not be very significant in the near future. In addition to costs, the short time scales of charging and discharging cause serious challenges. It may not be realistic to expect any storage technology to cover economically several days or weeks of low wind and solar output in systems with high RES penetration. In summary, electricity storage is likely to become cost-effective in power systems after reaching a very high-vre penetration. However, given its comparably high costs, it will be among those options deployed after the potential of more cost-effective solutions has been exhausted, IEA says (Figure 2). 2. Interconnection Interconnection or supergrids are the only source of flexibility that can directly provide for geographical aggregation of wind and solar power. Transporting excess electricity from windy and sunny areas to where demand exists would not only solve the variability challenge of RES but also partly the uncertainty aspect: forecasting the output of several wind farms results in less errors than forecasting just one wind farm. To make a difference in balancing RES output, interconnecting cables should be hundreds of kilometres long. This is possible by high voltage direct current (HVDC) technology. The normal AC power is converted to DC and back. HVDC is a mature technology in point-to-point transmission, but there is little experience of meshed HVDC networks connecting several locations.
7 WÄRTSILÄ TECHNICAL JOURNAL Worldwide installed electricity storage capacity Compressed air energy storage 440 MW Sodium-sulphur battery 304 MW 140,000 MW Pumped hydro Others Lithium-ion battery 100 MW Advanced lead-acid battery 70 MW Nickel-cadmium battery 27 MW Flywheel 25 MW Redox-flow battery 10 MW Fig. 2 - Pumped storage hydro power is currently by far the largest form of electicity storage. Source: The Power of Transformation: Wind, Sun and the Economics of Flexible Power Systems, IEA According to the IEA, calculating costs of major interconnectivity projects is very difficult and no universal methodology is agreed upon. It can be almost impossible to disentangle the direct and indirect costs and benefits of building long-distance transmission systems, when several countries are involved in a project and some countries only have a transit role. However, some rough IEA estimates are presented in Figure 1. Ultimately, the potential of interconnectivity relies on the assumption that wind always blows somewhere and the wind power infrastructure with a wide enough geographic dispersion would offer a relatively stable power output. This assumption has been questioned by several authors. According to satellite observations and international wind energy data, weather systems can be continent-wide. This means the problem of too much or too little wind power would exist even with a continent-wide interconnecting network. Indeed, Petersen (2011) has shown that wind output curves are peaky even with combined data from around the world (Figure 3). 3. Demand response Demand response (DR) is a variety of technologies that shift or shed load at a given moment. Any energy efficiency technology that reduces load when RES output is low will help RES integration. Secondly, DR can help shift demand peaks towards periods of high RES output. Household devices, such as washing machines or freezers, can be equipped with smart meters that more or less automatically shift load by short periods of time. Industrial applications include load shifting in cold warehouses and load shedding in aluminium smelters. In general, DR solutions are relatively cost-effective. However, the lack of experience of large-scale programmes adds uncertainty to cost calculations. According to the IEA, estimates of additional costs for enabling smart operation of appliances vary by a factor of ten. Prerequisites for unleashing DR s potential include high accuracy metering devices, right price signals, incentives for system-friendly load operation and IT infrastructure for remote control of loads. 4. Flexible generation Flexible or dispatchable generation includes various fast-reacting technologies, both renewable and non-renewable. This is by far the most common source of system flexibility to date. Traditionally flexible generation is used to shave peaks in electricity demand. Now it is widely seen as a key solution to balance the variable output of wind and solar power. The crucial difference to the other three sources of flexibility is that they can cover only relatively short periods of low in detail 7
![[ ENERGY / IN DETAIL ] [ ENERGY / IN DETAIL ] 7000 Combined wind output July 2010 MW of power production MW of power production 6000 5000 4000 3000 2000 1000 0 7000 6000 5000 4000 3000 2000](/docs-images/74/70023963/images/8-0.jpg "1000 0 6 hour power production intervals Combined wind output January 2010 BPA (Pasific north-west, USA) Alberta, Canada Ontario, Canada Ireland NSW (New South Wales, Australia) BPA (Pasific")

8 [ ENERGY / IN DETAIL ] [ ENERGY / IN DETAIL ] 7000 Combined wind output July 2010 MW of power production MW of power production hour power production intervals Combined wind output January 2010 BPA (Pasific north-west, USA) Alberta, Canada Ontario, Canada Ireland NSW (New South Wales, Australia) BPA (Pasific north-west, USA) Alberta, Canada Ontario, Canada Ireland NSW (New South Wales, Australia) 6 hour power production intervals Fig. 3 - The output of wind turbines shows significant variation even with combined data from several areas around the planet. This challenges interconnectivity as a flexibility provider in a high-res world. Source: John Petersen, AltEnergyStocks.com 8 in detail
9 WÄRTSILÄ TECHNICAL JOURNAL Technology Minimum load (%) Ramp rate (%/min) Start-up time, warm (h) Combustion engine bank CC Gas CCGT inflexible Gas CCGT flexible 15 30* Gas OCGT * 15% is reached by plants with steam cycle bypass at reduced efficiency. The table refers to typical characteristic of existing power plants. Operational and environmental constrains can have a significant impact on how much of this technical flexibility is actually available. Source: IEA 2014 Fig. 4 - Comparing features of flexible generation technologies. Source: The Power of Transformation: Wind, Sun and the Economics of Flexible Power Systems, IEA 2014 RES output. In the long term, flexible dispatchable generation can be critical for meeting demand during sustained periods of low VRE generation, the IEA predicts. Where available, hydropower offers an excellent means to support wind and solar power. Elsewhere however, the most practical and feasible flexible generation solution is agile thermal power plants, typically fuelled by natural gas. To effectively follow RES output, key features of these plants are fast start and stop, quick ramping up and down and high efficiency at part-load. The main competing technologies are combined cycle gas turbines (CCGT), open cycle gas turbines (OCGT) and modular internal combustion engine (ICE) power plants. The turbine solutions are traditionally used for large-scale baseload power production. ICEs are mostly associated with the transport sector and, until recently, have not been widely recognized as a plausible solution in energy production. According to the IEA, this has changed. This apparent disinterest in ICEs appears to have changed in recent years as the industry looks more closely at tools to help manage distributed generation, to quote from the IEA s Energy Technology Perspectives The rapid development in plant size (up to 600 MW) and fuel efficiency (up to 48%) contributes to what the IEA calls the comeback of a well-known technology. Indeed, Growth in ICE plants actually exceeds that of turbine-based technologies. According to the IEA, the benefits of ICE s compared to turbine-based plants include modularity, fast start and ramping, multi-fuel capability, tolerance for altitude and extreme temperatures, construction time of less than one year and high efficiency at part-load. The main benefit of turbines is high (50 60%) efficiency when operating at full load (Figure 4). The evaluation of costs of flexible generation is complex and depends on the technology, capacity factor and the operational profile. In general however, it is clear that the costs are a fraction compared to the other three sources of flexibility (Figure 1). Comparing the costs of turbinebased plants and ICEs is case specific. Generally speaking, the more flexibility is needed in terms of frequent starts, quick ramping and constant part-loading, the more competitive ICEs become. By contrast, the more flat the output curve, the more competitive are turbines. Wärtsilä is the market leader in ICE power plants with over 50% market share when all fuels are included. In gas-fired ICE plants Wärtsilä s market share is over 70%. (Figures from the year Sources: Diesel and Gas Turbine World Wide and Wärtsilä.) Conclusions To absorb the intermittency of wind and solar energy, much more flexibility is needed in power systems. All four sources of flexibility will have their role in Smart Power Systems. However, according to the IEA, gas-fired flexible generation will have a key role because of lowest costs and the ability to cover long periods of low RES output. Fast-reacting ICE power plants are the most flexible technology and are challenging gas turbines as the business-as-usual solution. in detail 9
![[ ENERGY / IN DETAIL ] [ ENERGY / IN DETAIL ] Adding flexibility to India s electricity system](/docs-images/74/70023963/images/10-0.jpg "AUTHOR: Rajagopalan, M (Raj), Market Development Director - MEA, Wärtsilä Power Plants 10 in")
10 [ ENERGY / IN DETAIL ] [ ENERGY / IN DETAIL ] Adding flexibility to India s electricity system AUTHOR: Rajagopalan, M (Raj), Market Development Director - MEA, Wärtsilä Power Plants 10 in detail

11 WÄRTSILÄ TECHNICAL JOURNAL India s current approach of relying heavily on baseload coal-fired plants cannot adequately cope with variations in power demand. An 80:20 hybrid mix of coal plants and flexible gas plants would impart more flexibility and improve the system s efficiency. The Indian economy is the fourth largest in the world. Yet, weighed down by its large population of 1.2 billion people, the per capita income is among the lowest in the world. Similarly, India s electricity system, with around 240 GW of installed capacity, is the fifth largest in the world. Yet its per capita utilization of electricity is just 917 kwh/person/year, which is well below the global average of 2900 kwh/person/year, and far below the 10,000 kwh/person/year of some of the more developed countries. Given the lower energy elasticity of developing economies, it is well recognized that India needs to scale up its electricity market rapidly to match its aspiration of becoming a global economic power. An estimate says that 300 million people in the country do not have access to electricity. To ensure inclusive growth, the needs of these potential consumers must also be addressed. In trying to overcome the shortage and achieve adequacy of power at the lowest possible cost, the emphasis in all the in detail 11
12 [ ENERGY / IN DETAIL ] [ ENERGY / IN DETAIL ] country s planning exercises, has been on adding baseload thermal plants that operate on coal. The reasoning has been that the country is rich in domestic coal resources at a price that is controllable and not subject to global market dynamics. At present, coal plants account for 58% of the country s total installed capacity (MW) and about 72% of its total generation (MU). Coal will continue to play a dominant role in the future too, as an average addition of 14,000 MW per year has been planned. Thus in the foreseeable future, coal plants will account for over 60% of the total capacity and more than 65% of the total generation. Some 15,000 MW of gas-based generation plants using combined cycle gas turbines (CCGT) were added in the period The hope was that the production of domestic gas would be ramped up, and that it would be supplied at a cost that would make power generation competitive with that from coal. Unfortunately, there have been problems with respect to both the availability and price of domestic gas, with the result that most of these gas plants are under-utilised and are viewed as stranded assets. They cannot be revived by using alternatives such as imported R-LNG (Regasified Liquefied Natural Gas) as the cost is seen as being prohibitive. Challenges posed by variable load Given the shortage of electricity and the absence of alternatives, one would conclude 12 in detail that the coal-powered plants must be running flat-out at close to full load most of the year round. But the reality is different. Although India s total installed capacity, including coal, hydro, nuclear, gas, was 223,346 MW as at the end of March 2013, and the peak demand was far less at 135,453 MW, there was still a shortfall in meeting the demand. Shortages continue to exist in different parts of the country. Coal plants are seen to be operating at close to full load during peak hours and cannot be ramped up further to overcome peak shortage. Yet, paradoxically, the average load-factor of coal-based plants has been coming down over the years, as can be seen below (Figure 1). There have been several attempts to explain this falling plant-load factor (PLF) trend. One reason cited is that an inadequate coal supply has severely restricted generation in many of the thermal plants, resulting in a lower average despatch. Another explanation is that there are inter-state and inter-regional transmission constraints that prevent the free flow of power. It is argued that once these bottlenecks are removed, and when the southern grid is hooked up to the NEW grid to form a composite national grid, the offtake from coal plants would improve. Yet another explanation is that loss-making distribution companies (discoms) are reluctant to procure more power due to poor cost-realisation from the consumers, and without a 24 x 7 supply obligation- would prefer to resort to loadshedding instead. All these explanations have some merit. However, an analysis carried out by Wärtsilä in its white paper Peaking and Reserve Capacity in India shows that the most plausible reason for the lower PLF is the significant variation in power demand between peak and non peakhours. While peak demand continues to grow rapidly, the average drawal throughout the day grows at a slower pace. The cyclical pattern is becoming more pronounced with increased urbanisation, as is evident from the daily load curve of a plant in Maharashtra in Western India (Figure 2). A similar cyclical pattern is discernible in many of the thermal plants across all seasons. The conclusion is this: If, to ensure adequacy, the system is packed with baseload capacity beyond a certain threshold, it can be counter-productive. The plants will be forced to operate at suboptimal, lower load during off-peak hours and at night. They will run at very poor efficiency, burning more fuel for every kwh generated while entailing additional maintenance costs. This will increase the generation cost per kwh. In addition, when the plants are run at less than normative PLF, the fixed cost amortised on a kwh basis will increase in inverse proportion.
13 WÄRTSILÄ TECHNICAL JOURNAL Fig. 1 - PLF of coal plants Oct May Jan Jul - 13 Fig. 2 - Daily load curve of the Mahagenco, Nasik power plant. in detail 13
14 [ ENERGY / IN DETAIL ] [ ENERGY / IN DETAIL ] Sub-optimal use of plants means also more CO 2 emissions. The problem threatens to worsen in the future. If the capacity addition of 70,000 MW of coal-based plants is completed in the next five years as planned, the average PLF of the plants could come down to 65%, or even lower, while meeting the energy demand projected for the period. The problem will be rendered more acute by the planned addition of 30,000 MW of wind and solar power plants. To allow preferential evacuation from these must-run plants, the average PLF of the coal plants may have to dip below 60%. Coping with the challenges Conscious of the need for specific action, a Task Force was constituted by the CEA (Central Electrical Authority) in 2012 to deliberate over various aspects of setting up peaking power plants and creating adequate system reserves. The key observations made by the Task Force were: The load curves in different regions show that demand tends to peak during certain times of the day and in certain seasons. It is evident that dedicated peaking power plants are required to meet the spikes in demand. Pure baseload plants will not be able to serve this need. Peaking plants must have definite characteristics, such as quick starting time and the ability to run at part-load without a drop in efficiency. Such plants should also serve the purpose of standby reserve, i.e. to come online rapidly. Plants capable of meeting these requirements are hydro-electric or gasbased power plants operated by opencycle gas turbines or internal combustion engines. The identified potential for hydro power is only 10,897 MW during the next five years. Another 17,000 MW of peaking capacity, not to mention the 17,500 MW for reserves, recommended by the Task Force must, therefore, come from gas plants that use aero-derivative turbines or large internal combustion engines (ICE). The Wärtsilä white paper points out the advantages of using ICE technology. The instant start and rapid ramp-up characteristics make it ideal for peaking and reserve applications among all technologies that use gas. Plants using ICE can be built to any size, even 500 MW or larger, in a single phase or spread over a period of time. These plants consist of multiple engines each of which operates at high efficiency. The modularity ensures the highest efficiency at any plant load, as the number of engines pressed into service can be controlled to suit the variation in load. This feature is essential as peaking demand can vary, and the plant may be required to cater to different loads at different times of the day. ICE s excel on this count. The flexibility of ICEs is extremely useful in countering the variability of renewable energy, as they can be brought on instantly if there is a drop in generation from renewable energy sources, and stopped to allow its evacuation into the grid when the renewable generation picks up. Thus, they act as enablers of renewable energy and contribute to the reduction in carbon emissions. Myth: Gas-based power is more expensive There is widespread belief that power generated from gas-based plants will be far too expensive compared to using coal, and that distribution companies (discoms) will resist the evacuation of such power due to unwillingness on the part of end consumers to pay a high price. This may be true for power from baseload CCGT plants, but the white paper argues that gas-based peaking plants enable reliability, and that the cost of power from such plants needs to be assessed in a broader perspective: Instead of viewing the cost of generation from a gas-based peaking plant on a standalone basis and concluding that it is too expensive, a more holistic pricing approach should be followed. A hybrid combination of coal and gas plants can be planned for, and the weighted-average cost of generation worked out accordingly. The capacity of coal plants could be limited to 80% of the system s peak demand, which could then be complemented with flexible gas-based plants sized for the other 20%. The resulting benefits would be: Coal plants would serve the baseload needs and be allowed to operate at normative load (80-85%), where their efficiency is highest. Efficient, quick-start, gas-based plants could be used to supplement the power supply for peaking needs. Though the PLF of these plants will be less than 15% (as they will come on only during demand peaks), they will, by design, operate at their highest efficiency at all loads. Although the capacity (MW) of these plants will be fully available, gas consumption will be limited since the energy generated annually (MU), as a percentage of the total, will be low. This hybrid combination will offer the advantages of best efficiency and flexibility. The weighted-average cost of generation from the hybrid or optimized combination can then be compared with that of coal plants operating at a low PLF of 67%. Applying the hybrid principle on two representative coal plants of the largest generator of thermal power in the county, NTPC (National Thermal Power Corporation), the white paper showed that power from a hybrid combination of 80% coal and 20% gas is more cost-effective than that produced by plants based on 100% coal and operating at a lower PLF. This is valid even when using more expensive R-LNG instead of domestic gas. If the 80:20 hybrid principle is extrapolated and applied across the entire 70,000 MW of thermal plant capacity targeted during any 5-year block in the whole country, the coal plant capacity addition can be limited to 56,000 MW, and gas-based peaking plants can make up the remaining 14,000 MW. Calculations show that the average cost of generation, taking into consideration both fixed and energy 14 in detail
15 WÄRTSILÄ TECHNICAL JOURNAL costs, from this hybrid combination of plants will be cheaper by INR 0.14/kWh (1.8 Euro/MWh) than when the entire addition of capacity comes from coal plants. This is after assuming a fairly high gas price of USD 18/MMBTU for operating the peaking plants. The savings spread over the entire 70,000 MW capacity would be approximately MINR 56,000 (MEUR 700) per year. Other advantages of gas-based plants In addition to the above, the flexible gas plants would offer the following benefits over a 5-year time frame: As the burden on investment will be lower by nearly MINR 350,000 (approx. MEUR 4375), financial closure will happen much faster. The IDC of these plants will be lower, as the modular plants can be constructed faster. The land requirement will be lower by 14,000 acres. The avoided water consumption will be nearly 500 million cu.m/year. To put this in perspective, this quantity is more than enough to satisfy the annual need of a large city the size of Bengaluru. CO 2 emissions will be reduced by 13 million tons/year. This comes from using a cleaner fuel like gas for peaking, as well as from operating the baseload coal plants at improved efficiency. The flexibility offered by the gas plants is of immense value in the following applications: Ancillary services: Frequency support and regulation Reserve capacity: As these plants offer the comfort of standby reserve, they can meet a large part of the secondary and tertiary spinning reserve requirements. Load-centre servicing: Gas plants can be located close to cities/ towns and reduce the strain on the transmission system. Moreover, the black-start capability of these plants will be useful in evolving an islanding scheme for important load-centres. Enabling policy Obviously, such a concept needs to be supported with policy initiatives and a regulatory framework. The setting up of dedicated peaking plants needs to be incentivised through a competitive bidding process, which can be technologyneutral but which lays down minimum criteria for start/stop and ramp up/down characteristics. Also, the current system of merit order despatch stacks power plants unit-wise, based on energy cost. Thus, power from a gas-based plant on a standalone basis always appears more expensive than that from a coal plant. The existing system also considers the heat rate of coal plants at normative PLF, even though the plants, in reality, run at a lower load-factor due to lower evacuation. A system that allows bids and despatches from hybrid plants, will pave the way for higher system efficiency. Conclusion Relying only on baseload coal plants to meet India s growth needs would be fraught with risks and would lead to inefficiency. A hybrid mix of coal and flexible gas plants, in the ratio of 80:20, would make the system flexible, more efficient, more capable of absorbing clean renewable energy into the system, and bring the country closer to realising the vision of 24 x 7 power supply for all. in detail 15
16 [ ENERGY / IN DETAIL ] [ ENERGY / IN DETAIL ] Features and parameters of various power plant technologies AUTHOR: Kenneth Engblom, Marketing Director, Wärtsilä Power Plants Operational flexibility is of increasing importance for power systems around the world. Internal combustion engines can provide this much needed flexibility while also offering high simple cycle efficiency. 16 in detail Before making an investment in a new power plant, some kind of feasibility study is always done to ensure that the optimal technology is chosen. By tradition, natural gas power plants have been based on gas turbines. Combined cycle gas turbines (CCGT) have been used for baseload applications, and open cycle gas turbines (OCGT) for peak load applications. But things are now changing, and with the increased amount of renewable energy being fed into power systems, new more flexible generation will be needed. The possibility to declare a power plant as purely baseload or purely peaking is not correct anymore. Fossile power plants are now required to operate in a much wider operating field with multiple starts and stops combined with periods of peaking and baseload. This means that a high efficiency at any load has to be combined with operating flexibility not seen in baseload plants today. Similarly the peaking plants today are sometimes not flexible enough to react to the peak demands or emergency duty. Therefore the modern peaking plants also have to become more flexible meaning faster to start, take load and stop. These new requirements have led to an increased need for existing reservoir hydro power plants, as well as new renaissance of the internal combustion engines (ICEs). Historically ICEs have been used mainly for smaller power plants in isolated grids and for industrial self generation, but are now being increasingly used in large interconnected power systems like national grids because of their inherent features combining superior flexibility with highest simple cycle efficiency. In this article we will look through both existing and new features and parameters that will be important for people making feasibility studies. The Table of Power Generation provides an overview of the most important features and parameters of the commercial power generation technologies available today. Power generation technologies can be divided in various ways. For example, they can be based on fuel type, the technology behind transferring energy in whatever form it comes into electricity, the operating profile (e.g baseload, intermediate, peaking, not dispatchable, or intermittent), or a combination of all of these. See world installed capacity (Figure 1). The technologies that are mostly used today are: Intermittent/Non dispatchable renewable energy: PV solar and wind Partly dispatchable renewable energy: hydro, solar thermal, geo thermal, bio mass burning steam plants Baseload generation (> 4000 h/y): nuclear, coal burning steam power plants Intermediate generation ( h/y): combined cycle gas turbines (CCGT), internal combustion engines (ICEs) Peaking and stand by generation (<1000 h/y): open cycle gas turbines (OCGT), internal combustion engines (ICEs)
17 WÄRTSILÄ TECHNICAL JOURNAL Pumped Storage 2.3% Small Hydro 2.1% Offshore Wind 0.1% Large Hydro 14.9% Onshore Wind 6.0% Solar PV 2.9% Nuclear 6.4% Gas 25.9% Solar Thermal 0.1% Geothermal 0.2% Biomass 1.3% Biogas 0.2% Coal 31.6% Oil 5.8% TECHNOLOGY 2014 SHARE [%] Thermal % Coal % Oil % Gas % Total Wind % Onshore Wind % Offshore Wind % Total Hydro % Large Hydro % Small Hydro % Pumped Storage % Nuclear % Solar PV % Solar Thermal % Geothermal % Biomass % Biogas % Grand total: % Fig. 1 - The global power market, cumulative installed capacity by technology, MW, Source: GlobalData statistics 15 Sept Explanations for the parameters in power generation as shown in The Table of Power Generation (open fold on page 13). Plant configuration & size Typical brands & models This lists a few typical brands and models that correspond to the type of technology defined. This is intended as an example to explain the technology type and is by no way meant to favour any brands, or to be a complete list of the brands and models available within that category. There can be big differences between the brands and models with any specific technology. Therefore, the performance values and parameters given are a typical average of the brands and models in the segment. Typical unit size, plant size, number of units, and average plant size Here, the typical size of a complete plant of that specific technology is given. As most plants consist of several units, it is more important to evaluate the complete plant than each individual unit. In this way the benefits and additional flexibility of plants with several units are taken into consideration in the model. The average plant size is then the basis for the performance parameters given later in the table. Fuel range This states the range of fuel that this technology can burn. The fuels considered are: HFO (heavy fuel oil), LFO (light fuel oil) or diesel, NG (natural gas) or LNG (liquefied natural gas), BioG (biogas), coal, lignite and biomass (i.e. wood or peat). The first column regarding fuel indicates the type of fuel for which the performance parameters are given. Plant specific EPC cost Power plant specific EPC cost ( /kw) at 20 C and at sea level (average ISO conditions) This gives an estimation of the complete EPC (engineering, procurement, construction) cost including all equipment, installation, and the typical civil work required to have a ready plant exporting electricity to the grid. However, suitable ground conditions with proper soil bearing capacity is assumed, and therefore any soil improvement or piling activities are excluded. The cost of land, as well as the development and permitting costs, are also excluded. in detail 17
18 [ ENERGY / IN DETAIL ] [ ENERGY / IN DETAIL ] Power (%) Temp. Derating Loss 20/35 C = 0.97 Altitude Derating Loss 0/1500 m = Power (%) Ambient Temperature ( C) Altitude above sea level (Meters) Fig. 2 - The effect of temperature and altitude on power. 100 Average Degradation Loss 0-32,000 Hours = 0.98 Power (%) Fig. 3 - The degradation of power output from a power plant based on running hours. In this example a major service is carried out after 36,000 h, after which the performance is almost back to new condition. This factor is based on average degradation during the first 32,000 hours or: 0,96 +1,00 / 2 = 0, ,000 20,000 30,000 Running Hours 40,000 50,000 running, albeit at partial load. Every unit must be running so as to be able to meet the ramping requirements. As the relative cost of a power plant is very much related to its size and the cost of labour in the county where it is being built, three typical price levels are provided. Depending on the size and the location of the plant, the estimated EPC price will be in accordance with one of the three numbers. The first column provides an estimation of the upper cost boundary, i.e. a small power plant built in a high cost area; whereas the third column would correspond to the opposite; a large power plant built in a low cost area. For a combination of the two, namely a large power plant - which is relatively cheaper to build than a small one - being built in a high cost area, the middle column is the most applicable. Furthermore, the EPC estimate is given based on the nominal output of the plant 18 in detail at 20 C ambient air temperature and at sea level, which corresponds to the average ISO conditions for combustion engines (25 C) or gas turbines (15 C). We call this the average ISO conditions. The temperature derating power loss 20/35 C Many technologies have a derated output at higher ambient air temperatures. Therefore, the specific EPC cost given at average ISO conditions needs to be divided by the temp. derating power loss 20/35 C to find the actual cost at a location where the temperature is 35 C (Figure 2). This exact de-rating factor is crucial in order to ascertain the actual cost at any specific location. Altitude derating power loss 0/1500 m.a.s.l. (metres above sea level) Just as technologies have a derated output at higher ambient air temperatures, so too do they have a derated output at higher elevations where the air is thinner (i.e. lower air density). Therefore, the specific EPC cost given at average ISO conditions needs to be divided by the altitude derating power loss at 1500 m.a.s.l. to find the actual specific cost at 1500 m.a.s.l. (Figure 2). Power degradation Some technologies will suffer a reduction in power after a certain operating time. This degradation factor gives the typical average reduction of power over a four year or 0-32,000 hour period. At the end of the period the power is at its lowest. After a major overhaul, with the critical combustion parts having been replaced, typically most of the lost power is recovered. When preparing long-term feasibility studies, it is crucial to take this factor into consideration (Figure 3)
19 WÄRTSILÄ TECHNICAL JOURNAL Availability & reliability (Figure 4) Unit availability & reliability For each unit, the availability and reliability factors are defined as a percentage according to the following definitions based on time: AH h (PH h -POH h -MOH h -FOH h ) Availability (AH) = = 1 PH h (PH h ) Forced Outage Factor = FOH h PH h (PH h -POH h -MOH h -FOH h ) Reliability = (1-Forced Outage Factor) h = 1 (PH h -POH h -MOH h ) Where: PH h = Total available running time (typically 8760 h / year) POH h = Planned Outage: Production time lost due to scheduled maintenance MOH h = Maintenance outage: Production time lost due to waiting for maintenance FOH h = Forced outage: Production time lost due to failure or unplanned maintenance SH h = Service hours: Total actual running time RSH h = Reserve shutdown hours: Total time the unit was on stand-by, available and ready to be utilized. Availability and reliability can also be defined as the energy produced rather than the amount of time in operation. Time is, however, more relevant when measuring reliability. If we measure availability or reliability as energy, (time*power), additional factors such as the power derating from ambient conditions, the actual need of power, and the possibility to dispatch will affect the results. Plant availability & min 90% capacity This gives the total plant availability and reliability, according to the previous definitions, but further defined in terms of the amount of time the plant is capable of operating at >90% of its nominal capacity. At 90% available capacity the plant can perform all the necessary regulation, load following, and various ancillary services. This parameter highlights the benefits of a multi-unit plant, where losing one unit out of 10 due to failure or maintenance will not affect the availability or reliability of the whole plant, because the remaining units can still produce 9/10th or 90% of the nominal output. in detail 21
20 [ ENERGY / IN DETAIL ] [ ENERGY / IN DETAIL ] Max capacity factor The capacity factor is the ratio between the actual energy output (including derating, planned and forced outages) of a plant vs. its nominal ISO rated capacity, over a given period of time. By deducting maintenance and forced outages, we have the availability. When further deducting the power lost due to ambient condition derating, we finally have the max capacity factor. be a better number to use in simulating power plants that are meant to start and stop frequently (Figure 5). This efficiency number also needs to be multiplied by the temperature and altitude de-rating factors, as well as the ageing factor. (A (MWh)) (Y-I-D-B) (PH h -POH h -MOH h -FOH h ) x Actual capacity) Capacity Factor = = = 1 (Y(MWh)) Y (PH h x Nominal ISO capacity) Where: The max capacity factor assumes that C (Reserve Shut Down) and J (Plant Usage) = 0, i.e. the plant would always be needed and never in reserve shutdown. It is the highest capacity factor that can be achieved in theory. A = Total amount of energy produced Y = gross maximum generation at nominal ISO conditions SH e = Total amount of energy produced PH e x Nom ISO cap. = Total available energy that would have been produced at nominal ISO output running 8760h/year Heat rate / electrical efficiency Electrical efficiency at 20 C and sea level (average ISO conditions) This indicates the plant s total net electrical efficiency based on a lower heating value (LHV) at 20 C and at sea level (average ISO conditions) given at various loads. A plant with several units can turn down some units and run the remaining ones at full load, thereby eliminating part load efficiency losses. This type of operation is called the efficiency mode. Temperature derating efficiency loss 20/35 C Most technologies have a lower efficiency at a higher ambient air temperature. Therefore, the efficiency given at average ISO conditions needs to be multiplied by the temp. derating efficiency loss 20/35 C to find the actual efficiency at a location where the temperature is 35 C. The efficiency loss is defined in the same way as for the power loss explained in Figure 2. Altitude derating efficiency loss 0/1500 m.a.s.l. (meters above sea level) Just as technologies have a derated output at higher ambient temperatures, so too do they have a derated output at higher elevations 22 in detail where the air is thinner (i.e. lower density). Therefore, the efficiency given at average ISO conditions needs to be multiplied by the altitude derating efficiency loss 0/1500 m.a.s.l. to find the actual efficiency at a location 1500 metres above sea level. Efficiency degradation Some technologies will suffer a reduction in efficiency after a certain operating time. This factor measures the average efficiency reduction over a four year/0-32,000 hour period. After a major overhaul, with the critical combustion parts having been replaced, typically most of the lost efficiency is recovered. When performing longterm portfolio modelling, it is crucial to take these losses into consideration when considering fuel usage. The efficiency loss is defined in the same way as for the power loss explained in Figure 3. Pulse efficiency 1 hour load cycle Many plants are required to perform several starts and stops per week, or even per day. The full load efficiency has, therefore, very little relevance in these situations. In this case, the average efficiency during a one hour running cycle, here called pulse efficiency 1 hour load cycle, might O&M and consumables Lubricating oil consumption This parameter quantifies the typical lubricating oil consumption. Certain technologies do not consume oil in a continuous way during normal operations, but still require oil changes at regular intervals. Water consumption The amount of water that each technology typically consumes (i.e. discards) is mainly dependent upon the type of cooling system. Closed-circuit and air-cooled systems can consume very little, while cooling tower solutions consume a considerable amount of water. Both values will be available for those technologies in which both systems are typically used. Variable O&M cost Variable O&M costs are those costs that are incurred only when the plant is running. The given figure is calculated as an average of a 10-year or 64,000-hour time period, on a /kwh basis including: All spare parts for the complete plant (prime movers and auxiliaries) according to standard maintenance schedules Maintenance labour But excluding: Import duty and inland transportation of spares Consumables like water, chemicals and lube oil Possible unscheduled maintenance for the prime mover and auxiliary equipment Oil, water & fuel oil analyses Safety spares and swing sets Fixed O&M cost O&M costs are incurred regardless of whether the plant is running or not. They are calculated in terms of /kw per year, and are based on the average plant size
21 WÄRTSILÄ TECHNICAL JOURNAL Average load from start to stop, hot start hour pulse Average effiency from start to stop, hot start 2 hour pulse 3 hour pulse 4 hour pulse 5 hour pulse 20 Internal Combustion Engine (ICE) Gas Turbine Aeroderivative (AERO) Gas Turbine, Heavy Duty (HD) ICE Combined Cycle Gas Turbine Combined Cycle Fig. 5 - Pulse efficiency vs. full load efficiency for various technologies. mentioned in the table. They include: Operating personnel Operation planning, spare part coordination, plant safety Contracted service fees (if any) Office equipment and basic personnel training Daily/weekly routine checks and minor services Buildings (power house & workshop/ warehouse) maintenance & cleaning But excluding: Liability Insurance Internet, phone costs Vehicle costs, protective gears, tools Advanced personnel training Environmental monitoring and waste handling services Taxation services and audits Start-up costs ( / MW/start) Every time a power plant is fired up there will be fuel burned so as to start-up, synchronize, and make the plant ready to produce electricity. The longer this period the higher the start-up fuel costs are. Furthermore, some technologies incur increased wear and tear every time they are started. This is due to the mechanical and thermal stress from transient conditions. Usually, the quicker the start up and increase in temperature, the greater the stress and wear on the equipment. This results in a reduced lifetime of the components. Gas turbines are particularly sensitive to this, and they use a term called EOH (Equivalent Operating Hours) which is used to convert each start to an extra amount of normal running hours. The start-up cost in The Table of Power Generation includes the approximate cost of replacing components earlier, plus the additional fuel burned during a start-up. Other parameters Typical plant construction time This represents the amount of time it typically takes to build the power plant from the issuing of construction permits and the EPC contractor having access to the site. Plant lifetime This means the number of years the resource is expected to be used and useful, based on various factors such as OEM guarantees, fuel availability, and environmental regulations. Technology cost change This gives an estimate of how the cost of the technology has evolved during recent years, and a forecast of what the annual cost change will be in the upcoming years. in detail 23
![[ ENERGY / IN DETAIL ] [ ENERGY / IN DETAIL ] Utility portfolio optimization with Smart Power Generation AUTHORS: Joseph Ferrari, Market Development Analyst, Wärtsilä North America Mikael Backman,](/docs-images/74/70023963/images/22-0.jpg "Market Development Director, Wärtsilä North America Portfolio optimization is a key to sustainable, affordable and reliable power systems.")
22 [ ENERGY / IN DETAIL ] [ ENERGY / IN DETAIL ] Utility portfolio optimization with Smart Power Generation AUTHORS: Joseph Ferrari, Market Development Analyst, Wärtsilä North America Mikael Backman, Market Development Director, Wärtsilä North America Portfolio optimization is a key to sustainable, affordable and reliable power systems. This has never been more relevant than it is for utility systems tasked with meeting aggressive renewable targets through a renewable portfolio standard (RPS) or by other means. 24 in detail Background and motivation Portfolio optimization is the key to integrating renewable energy. Wärtsilä has shown with great success exactly how and why it is a key player in the optimization process. We began by performing annual dispatch studies of power systems with aggressive renewable penetration to understand how flexible, modern, stateof-the-art, modular gas-fired internal combustion engines (ICEs) can improve system performance. One study system was the California Independent System Operator (CAISO), which delivers electricity to 80% of the state of California (CA) and handles 35% of the electricity load in the western United States. California has a legislated renewable portfolio standard (RPS) requiring 33% of load be served by renewable energy,
23 WÄRTSILÄ TECHNICAL JOURNAL ,000 16,000 14,000 12,000 MW 10,000 8,000 6,000 4,000 2, HOUR Dispathcable Generation Renewable Generation Net Load Load Fig. 1 - Load and net load for shoulder month day for a west coast US utility in compliance with 33% RPS. The evening load ramp is 1.5 GW/h, but the dispatchable fleet must provide for the much larger 7 GW/h net load ramp. primarily wind and solar, by the year Every 2 years the CA public utility commission publishes details of all new capacity expected to be installed 10 years forward. For the years 2020 and 2022 the amounts published were 5-6 GW, or approximately 7% of the installed capacity. Two studies were performed [1], [2], which explored outcomes if the new capacity were Wärtsilä ICEs instead of the planned build out of primarily gas turbines (GTs) and gas turbine combined cycles (GTCCs). Results showed California could save hundreds of millions of dollars annually, reduce CO 2 generation by 1-2%, and improve reliability if they installed Wärtsilä ICEs instead of GTs/GTCCs. This all happens because Wärtsilä ICEs are extremely flexible, can absorb fluctuations in net load (discussed below), and free the most efficient assets in the fleet (GTCCs) to do what they are designed to do run at full load with a minimal number of starts and stops. In short, the flexibility of ICEs unlocks the full potential of other assets in the fleet. The system studies addressed the question of how agile, gas-fired ICE power plants can enhance renewable integration efforts, but did so assuming either/or scenarios for new capacity (all Wärtsilä or all GT-based), and looked solely at operational costs. But large power systems are typically made up of a number of utilities. Utilities make decisions on what capacity to install using long-term (10 to 30+ year) integrated resource plans (IRPs) that take both capital and operational costs into account. Their final portfolios are thus an optimization across both operational and capital costs. This article describes how Wärtsilä power plants can be included in the utility IRP process and ultimately contribute to the optimal capacity mix. Renewable energy and net load It is no simple task for utilities to absorb large amounts of wind and solar energy for a number of reasons. Wind and solar are energy sources. The energy they provide is intermittent, not entirely predictable, and rarely in phase with demand. They have low variable cost and are often assured priority dispatch, which means load is first served by renewables. The remaining load, called net load, must be balanced by the remainder of the utility fleet. The challenge of a variable net load Balancing a fleet to meet a variable and somewhat unpredictable net load is not so straightforward, but can be vastly improved with greater flexibility than traditionally found in utility portfolios. For example, in California (as in other places) solar generation typically falls prior to the evening peak. This becomes most problematic in shoulder months when peak loads are at their lowest, necessitating a relatively large net load ramp at this critical time (Figure 1). Variable net load causes problems because many utility systems have a thermal fleet in detail 25
24 [ ENERGY / IN DETAIL ] [ ENERGY / IN DETAIL ] Load Duration Curve 14,000 14,000 Chronological 12,000 12,000 NET LOAD (MW) 10,000 10,000 8,000 8,000 6,000 6,000 4,000 4,000 NET LOAD (MW) 2,000 2, HOUR HOUR Fig. 2 - LDC and Chronological representations of net load for the same day for a western US utility complying with 33% RPS. 26 in detail dominated by steam boilers and GTCCs installed years before the RPS standards were implemented, and not designed with cyclic operation in mind. When these plants are expected to balance renewables, grid operators must weigh the significant start costs (tens of thousands of $$ per start), long start times ( minutes), long minimum up and down times (4-8 hours) and limited ramp capacity of these plants against the need for sufficient capabilities to balance renewables. To maintain the operational ramp rates needed requires over-commitment of capacity, thus increasing fuel consumption and CO 2 generation. Simply put, the fleet is not optimized for renewable integration. While utilities are not free to re-design their entire portfolio, there is room for improvement moving forward with the help of better resource planning and improved generation technology performance. Most utilities have some level of increasing demand and peak load growth, and always have assets that will retire over the course of planning horizons spanning decades, leaving room for new generation. The flexibility of this new generation can have a major impact on utility operations, but the types of new capacity added are dependent on the options considered and how they are analyzed in the IRP process. Filling the need for new capacity Utility resource planning efforts may be compromised by legacy use of capacity expansion models (CEMs) that rely on what is known as the load duration curve (LDC). The LDC takes load data and sorts it from highest to lowest, providing insight into the traditional bins of baseload, intermediate and peaking. The LDC simplification is used by the majority of commercially available CEM software packages to choose the optimal type and amount of additional capacity to meet demand into the future. But it does not address the capabilities these assets need to optimize delivery of energy, as the LDC discards all information on net load variability. Capacity suggested by the LDC approach is quite capable of meeting energy needs, but is not assured to reliably balance
25 WÄRTSILÄ TECHNICAL JOURNAL NET EFFICIENCY (LHV, %) Efficiency Mode Load Follow Mode 12 X Wärtsilä ICE Aero GT Industrial GT LOAD (%) Fig. 3 - Net plant efficiency as a function of load. net load. The system is not optimized to provide the needed flexibility, and is more costly than the type of fleet that would emerge if a more systematic approach were used that accounted for ramping and cycling. Chronological modeling versus the traditional approach One approach advocated for providing a systematic framework is called Chronological capacity expansion modeling (Chrono). Chrono uses net load data directly for new build decisions over the planning horizon (Figure 2). New power plant assets suggested by Chrono have the required capacity to meet energy needs as well as the capabilities needed to meet the challenges of a variable net load, both of which are needed for reliable renewable integration. Flexible capacity options: Wärtsilä ICEs and gas turbines Gas-fired simple cycle assets typically considered for flexibility in the IRP process include MW aeroderivative and MW industrial GTs. Aeroderivatives have efficiencies in the 40-42% range (net, LHV (lower heating value)), and are typically chosen for peaking, intermediate and balancing purposes. Industrial GTs, in comparison, are lower cost but also lower efficiency (net 30-35% LHV), and often chosen for pure peaking applications. Both options have start times in the range of minutes and ramp rates in the range of 20 to 50% per minute. Although aero GTs are marketed with zero start costs, industrial GTs often have start costs of USD10,000 or more. Another option is utility scale (50 to 500 MW) gas-fired internal combustion engine plants. These plants are based on parallel arrangement of multiple 10 or 20 MW units (the approximate sizes of Wärtsilä 20V34SG and Wärtsilä 18V50SG respectively). The capital costs for ICE plants are equivalent to aeroderivative GTs, boast high efficiency (net 44-46% LHV), start times of 5 minutes or less, and pure hours-based O&M so the plants can start multiple times per day at no additional cost. Ramp rates are on the order of 100%/minute (30% to full load in 40s). The benefit of the modular ICE approach is twofold; first, capacity needs can be met exactly, avoiding overbuild common to installation of plants in MW blocks; second, a multi-engine plant can maintain very high part-load efficiencies according to one of two operational modes (Figure 3). In load following mode, all engines back down simultaneously. This allows for quick response spinning capacity for contingency and operational reserves. In efficiency mode the plant modulates load while maintaining full or close to full load efficiency by running a subset of the engines at full load with the remainder on standby. Full plant output can be reached within minutes by starting the remaining engines. Utility-scale ICE plants provide flexibility in plant sizing and in operations. They are also a well-established technology, designed to meet the most stringent environmental guidelines, and use no process water. Wärtsilä, the leading supplier of mediumspeed ICE engines, has over 56 GW of installed capacity for power generation, in detail 27
![[ ENERGY / IN DETAIL ] [ ENERGY / IN DETAIL ] Wärtsilä has over 2.4 GW installed capacity for power generation in the USA. The Plains End power plant with Wärtsilä 20V34SG engines in Denver, Colorado.](/docs-images/74/70023963/images/26-0.jpg "with over 2.4 GW installed in the USA, including three plants in California. Chronological simulations show the value of modular, flexible ICE plants.")
26 [ ENERGY / IN DETAIL ] [ ENERGY / IN DETAIL ] Wärtsilä has over 2.4 GW installed capacity for power generation in the USA. The Plains End power plant with Wärtsilä 20V34SG engines in Denver, Colorado. with over 2.4 GW installed in the USA, including three plants in California. Chronological simulations show the value of modular, flexible ICE plants. To assess the benefits highly flexible ICE plants can bring to utilities, we performed a comparative, long term study using Chronological capacity expansion modeling. The PLEXOS software package was used for the analysis. The utility chosen was a representative west coast US utility with 27 GW installed capacity, modest load growth (1.2%/year), experiencing over 6 GW of retirements and expected to comply with a 33% RPS standard several years into the planning horizon. Net load challenges are evident for this utility (Figure 1). We ran two scenarios, a base and a flex. Base: new build options consisted of 50 and 100 MW aero GTs, 200 MW industrial GTs, and 300 and 600 MW GTCCs. Flex: included all of the GT-based options in the base scenario, plus two ICE options; utility-scale ICE plants using either 10 or 20 MW units, representative of Wärtsilä 20V34SG and Wärtsilä 18V50SG engines respectively. 28 in detail The utility will install new power plants over the planning horizon, and what is installed is a function of what is considered for new builds. The base scenario evaluates the capacity mix if only GT-based gas plants are considered. The flex scenario allows ICE power plants to be considered against GTs, to determine the extent to which ICEs would contribute to the optimal portfolio. All other factors across the simulations were kept equal for both scenarios. Full details of the analysis are contained in a white paper by Wärtsilä and Energy Exemplar [3]. What flexible, fast Wärtsilä ICE plants can do for the utility Simulation outcomes indicated that Wärtsilä ICE capacity would completely supplant aeroderivative GTs and a large amount of Industrial GTs when included in the pool of potential new capacity choices (Figure 4). The flex scenario yielded 870 MUSD savings NPV over the base, with the majority of savings coming from operational costs. This cost reduction translates directly to ratepayer savings. Overall operations costs were reduced (flex vs base) due to the superior capabilities of ICE plants over both aero and industrial GTs. ICE plants played a larger role in the flex scenario in absorbing net load fluctuations and freeing GTCC capacity to provide energy. In the flex case the capacity factor of combined cycles increased (68% base to 71% flex), and the number of GTCC starts was cut by 50%; both of these features are part of the fleet optimization effect observed at the system scale for CAISO [1], [2], with similar CO 2 reductions as well. The savings and improvements can be separated into a few broad areas; Portfolio optimization: Flexible ICE capability with zero (maintenancebased) start costs and high operational ramp rates allow combined cycle assets to generate at a more stable dispatch that optimizes the fleet generation cost. Efficiency improvements: In addition to the overall portfolio improvements, ICE plants are more efficient than GT plants. Improved import/export net balance: The lower marginal electricity cost of the portfolio reduced imports from neighboring providers and increased exports which had a positive portfolio effect. More capital efficient build out: The smaller increments of the ICE based assets reduced overbuild situations as they can be tailored to the exact MW requirements while maintaining economies of scale, e.g. plants can be
27 WÄRTSILÄ TECHNICAL JOURNAL NEW CAPACITY (GW) Internal Combustion Engine GT (Aero) GT (Industrial) 1 0 GTCC Base Scenario Flex Scenario Fig. 4 - Flex scenario including Wärtsilä ICE technology meets utility needs with 628 MW (9%) less capacity. built for 160 MW or 180 MW with the same cost per kw installed. Less capacity needed: Generally the greater the flexibility of a capacity type, the less capacity needed to meet net load fluctuations. In addition, modularity allows for exact matching of capacity needs. CO 2 reduction: The flex fleet generates more GWh, but consumes less fuel than the base fleet, reflected by a 1.5% reduction in CO 2 emissions. So the portfolio optimization reduces ratepayer costs and carbon footprints simultaneously. Summary Portfolio optimization is the key to sustainable, affordable and reliable power systems. This has never been more relevant than it is for utility systems tasked with meeting aggressive renewable energy targets. While prior studies have shown the value of Wärtsilä ICEs in improving operational outcomes from a system perspective (e.g., CAISO), this current work highlights the value of Wärtsilä capacity from the perspective of the utility integrated resource planning effort. The findings highlight the importance of using the right modeling approaches (Chronological vs. LDC), as the Chrono approach holds promise in bringing the flexibility needs required for renewable integration into consideration. They also shed light on the importance of including a full suite of commercially available technologies in the IRP effort. Inclusion of Wärtsilä ICE plants in the suite of new build options can yield future fleets that are more flexible and reliable, require less capacity to meet utility needs, while delivering both ratepayer savings and greenhouse gas reductions. The modular and flexible approach of ICE capacity is an example of Smart Power Generation; cost competitive, flexible, efficient and clean capacity, ultimately designed to unlock the full potential of the sustainable, affordable and reliable Smart Power System. REFERENCES [1] Ferrari J and M Backman, Managing Grid Dynamics, pp.4-12, InDetail Wärtsilä Technical Journal 01/2013. [2] Power System Optimization by Increased Flexibility, a White Paper by Wärtsilä and Energy Exemplar, com/wp-content/uploads/publications/2014_ EnergyExemplar/Power%20System%20 Optimization%20by%20Increased%20 Flexibility% pdf [3] Incorporating Flexibility in Utility Resource Planning, a White Paper by Wärtsilä and Energy Exemplar, wp-content/uploads/publications/2014_ EnergyExemplar/IOU%20white%20paper%209.7.pdf in detail 29
![[ ENERGY / IN DETAIL ] [ ENERGY / IN DETAIL ] Striking the balance in 2020 AUTHOR:](/docs-images/74/70023963/images/28-0.jpg "Melle Kruisdijk, Director of Market Development, Wärtsilä Power Plants 30 in")
28 [ ENERGY / IN DETAIL ] [ ENERGY / IN DETAIL ] Striking the balance in 2020 AUTHOR: Melle Kruisdijk, Director of Market Development, Wärtsilä Power Plants 30 in detail
29 WÄRTSILÄ TECHNICAL JOURNAL Future electricity systems require increased reserve capacity and frequency restoration reserve (FRR) to manage Europe s expanding renewable energy fleet. An award-winning paper presented at POWER-GEN Europe, discusses what key attributes will make up optimum and affordable balancing systems in As the European Union (EU) targets at least 20% of its overall capacity mix from renewables, the thermal fleet must achieve system balance by managing normal system variations, as well as variability and production forecast errors of wind and solar. In traditional power systems, where renewables were less dominant in the overall capacity mix, part-loading thermal generators was sufficient to maintain system balance. In future however, part-loading to balance the rapidly expanding renewable energy fleet will be inefficient and expensive. Increased carbon emissions, reduced fuel efficiency, higher numbers of generators in the system, and the cost of curtailing wind generation are just some of the financial and environmental implications of widespread part-loading. Achieving system balance in future power systems As a result of a high share of renewables in power systems, more reserve capacity is needed and new requirements will be placed on ramping services and frequency restoration reserve (FRR). By definition, FRR is the process of activating reserves to stabilise system balance. When looking at the characteristics of FRR that are best suited to activate reserves to stabilise electricity systems, it is important to understand which imbalances are in a system and the amount of reserve needed. According to the European Network of Transmission System Operators for Electricity (ENTSO-E), imbalances in an interconnected system can be triggered for several reasons. These include: Disturbance or full outage of a power generating module, (high voltage direct current) interconnector or load Continuous variation of load and generation; random fast (noise) disturbances caused by fast variations of consumption and generation Random slow disturbances caused by forecast errors of load due to unexpected weather or renewables generation To perform optimal system balance, ENTSO-E is developing standard balancing products that can be shared between countries through a common merit order list. To support this, Wärtsilä commissioned a DNV GL study and reported on the study findings in the award winning paper Optimal Balancing Products for Cross in detail 31
30 [ ENERGY / IN DETAIL ] [ ENERGY / IN DETAIL ] Generation costs ( /MWh) Impact of fast reserve generators on national OPEX intensity of NL (Base portfolio) Annual generation (TWh) No reserve 750 MW, 1000 MW, 750 MW, 500 MW, 900s 900s 675s 900s 750 MW, 900s Renewable reserves 750 MW, 900s Reserve sharing OPEX - Without fast reserve OPEX - With fast reserve Generation - Without fast reserve Generation - With fast reserve Annual demand Fig. 1 - Impact of fast reserve generators on the national OPEX intensity (defined as total Dutch OPEX divided by generation in the Netherlands). The first blue column is the national OPEX for the case without reserve requirements: the difference between this column and the other columns represents the additional OPEX cost from the reserve requirement. The difference between national demand (orange dots, right-axis) and generation values (green and purple dots, right-axis) represents the net exchange with neighboring countries (import minus export). Source: DNVGL Frequency restoration product specifications and the role of fast reserve generators, May 2014, p in detail Border Sharing in Power Systems with High Shares of Renewables at POWER- GEN Europe Wärtsilä maintains that optimum cross-border balancing product selection is based on two questions. Firstly, what should be the properties and specifications for balancing products for frequency restoration reserves in a system with a high degree of renewables (which provide adequate frequency quality for the continental European synchronous power system)? Secondly, how does the selection of properties and specifications for balancing products influence total system costs? The presented recommendations are based on evidence from technical and economic studies undertaken by DNV GL in April Additionally, Wärtsilä assesses the possible contribution of internal combustion engines, which are capable of providing an alternative to part-loading by starting from standstill and rapidly providing power to the grid. Technical performance DNV GL s technical study focused on the central European power system as expected in 2020 with the model validated against actual generation in Three main conclusions were drawn: 1. With respect of reserve capacity the technical performance of the power system was found to be adequate once reserve

31 WÄRTSILÄ TECHNICAL JOURNAL Power plant in Kiisa, Estonia providing dynamic generation capacity to meet sudden drops in supply, thus helping to secure the availability of electricity throughout the country. capacity the size of the open loop imbalance is available. The open loop imbalance is composed out of different types of imbalances, including forecast errors and disturbances. As such, the required FRR capacity depends on these phenomena. For the full day simulations (continuous variations and forecast errors) increasing reserve capacity beyond the imbalance size did not lead to significant additional improvements, while generation trip studies (disturbances) showed increasing reserve capacity above the trip imbalance gave increased performance in the prorata activation scheme but did not give any significant improvements in the merit order scheme. 2. Ramping capability for FRR was found to play a role once adequate reserve capacity is available (faster ramping leading to improved system response). For full day simulations, once the required FRR capacity is available the system performance in terms of frequency stability can be improved further by decreasing ramping time (by increased ramping speed) both in pro-rata and in merit-order regimes. Generation trip studies showed increased speed gave an increased system performance both in prorata and in merit-order regimes. 3. Upward frequency restoration reserve can be replaced by fast non-spinning generators without jeopardising the power system response. Fast non-spinning reserves are defined in the DNV GL study as generators that have a preparation period of 30s and a ramping period of 91s. This gives them a full activation time of 121s. Pro-rata activation All available reserves are activated proportionally (to their respective amount of capacity available for balancing) up to the amount of the imbalance. As a consequence all generators are available for the provision of reserves ramp simultaneously, resulting in a high aggregate ramp rate for the system. Merit-order activation Available reserves are activated consecutively, based on their price in the merit-order list (cheapest being activated first), up to the amount of the imbalance. As a consequence the aggregate ramp rate for the system increases with the number of bids activated and thus with the size of the imbalance. Economic balancing Achieving adequate frequency quality alone is not enough; optimum systems must also be economically efficient to bring financial benefit to European consumers. To determine the least-cost solution for generating electricity that also achieves sufficient reserve capacity, DNV GL analysed the European power system based on the energy market modelling and simulation software PLEXOS. The impacts of different generation portfolios were assessed, firstly under a Base Case scenario. This scenario corresponded to ENTSO-E s EU2020 scenario where the share of wind power is occasionally more than 50% of the momentary load of the Netherlands, while also surrounding countries have considerable shares of wind power (Figure 1). The study showed that increasing capacity has a stronger impact on costs compared to decreasing ramping time and that operational expenditure (OPEX) in detail 33
32 [ ENERGY / IN DETAIL ] [ ENERGY / IN DETAIL ] Difference in OPEX between case with and without fast reserve generators (%) 0% -0.1% - 0.2% - 0.3% - 0.4% - 0.5% - 0.6% - 0.7% Impact of adding fast reserve generators on national OPEX for different portfolios (750 MW, 675s case) Base case (high wind) High PV High coal - 0.8% Fig. 2 - Operational Expenditure impact on the Dutch power system by adding fast reserves under different scenarios. The impact is defined as the relative change in normalized OPEX ( / MWh generated) when adding fast reserve generators to the portfolio. Source: DNVGL Frequency restoration product specifications and the role of fast reserve generators, May 2014, p50. costs decrease when reserves are shared, renewables provide reserve capacity, and fast reserve generators provide reserves on a national level. In the Dutch generation portfolio, where the contribution of internal combustion engines to frequency control was investigated, adding fast reserves reduces additional OPEX from reserve requirements by up to 50%, and the benefits of fast reserve generators are not impacted by renewables providing down reserves. This means combustion engines and renewables complement each other. For the Dutch electricity system, two additional scenarios were considered: High PV, where the offshore wind and CHP segments of the Base Case are replaced by PV generation, and High Coal, where the segments mentioned above are replaced by coal fired generation. The impact of fast reserves on national OPEX under different portfolios (displayed in Figure 2) shows that for each generation 34 in detail scenario analysed, cost savings can be achieved. Conclusions In response to the two questions investigated in this study, Wärtsilä concludes that shortening the activation period of balancing products improves system response for fast disturbances caused by fluctuations in consumption and generation. This conclusion is applicable only if the automatic generation control (AGC) - i.e. the system for adjusting output of multiple generators at different plants in response to load changes - is adapted adequately. Under a pro-rata activation regime, speed and capacity can be exchanged once sufficient capacity is available. Non-spinning reserves can also replace spinning reserves without deteriorating system response, again if AGC is adapted adequately. In cost terms, allowing cross-border sharing of reserve capacity reduces system costs and it is more cost effective to improve system response by increasing speed, instead of capacity. Developing effective cross-border balancing markets is integral to facilitating a competitive, low carbon pan-european electricity market. With flexible reserve product selection hanging in the balance, Wärtsilä is calling on market designers to embrace its recommendations on FRR product design. The research demonstrates that, once sufficient capacity to resolve imbalance is available, system response can be improved by FRR products that focus on reducing full activation time, rather than increasing capacity. Wärtsilä therefore proposes that fast reacting, non-spinning reserves should participate in FRR delivery because such systems reduce national system costs and improve response.

33 WÄRTSILÄ TECHNICAL JOURNAL Definitions Frequency restoration reserve The process of activating reserves to restore system frequency to nominal frequency. Integral quality indicator The absolute value of the frequency deviation from 50 Hz divided by the difference between the respective trumpet curve and 50 Hz. Merit-order activation Available reserves are activated consecutively, based on their price in the merit-order list (cheapest being activated first), up to the amount of the imbalance. Net load The total electricity demand minus renewable generation. This remaining part of the demand has to be met with power generation that can be dispatched, i.e. generating units that can be ramped and/or started and stopped as needed. Non-spinning reserve Off-line capacity available to come on line in the event of a contingency; must satisfy requirements for start-up time and ramping capability. Open loop imbalance is composed out of the different types of imbalances: forecast errors, block trade effects and disturbances and as such the required Frequency restoration reserve capacity depends on these phenomena. The President of PennWell Corporation, Robert F. Biolchini, handing the Best Paper Award to Market Development Director Melle Kruisdijk of Wärtsilä. PLEXOS model in this study, the PLEXOS model is calculated by co-optimising the generation of electricity and FRR requirements, taking power plant constraints (such as ramp rates and starting time) into account, resulting in the least-cost solution for generating electricity while having sufficient reserve capacity available. Costs due to activation of reserves were not assessed in this part of the study. Pro-rata reserve activation All available reserves are activated proportionally (to their respective amount of capacity available for balancing) up to the amount of the imbalance. Spinning reserve Online contingency reserve; synchronized to the grid. Open loop imbalance is composed out of the different types of imbalances: forecast errors, block trade effects and disturbances and as such the required Frequency restoration reserve capacity depends on these phenomena. in detail 35
![[ MARINE / IN DETAIL ] [ MARINE / IN DETAIL ] The Wärtsilä NO x Reducer for IMO Tier III compliance AUTHOR: Johanna Vestergård, Engineer, Portfolio Management, Wärtsilä Ship Power The Wärtsilä NO x](/docs-images/74/70023963/images/34-0.jpg "Reducer represents the latest in emission abatement technology. It offers ship owners a welcome opportunity to optimize operations and meet the growing demand for environmentally sound traffic.")
34 [ MARINE / IN DETAIL ] [ MARINE / IN DETAIL ] The Wärtsilä NO x Reducer for IMO Tier III compliance AUTHOR: Johanna Vestergård, Engineer, Portfolio Management, Wärtsilä Ship Power The Wärtsilä NO x Reducer represents the latest in emission abatement technology. It offers ship owners a welcome opportunity to optimize operations and meet the growing demand for environmentally sound traffic. 36 in detail Today, new and more stringent legislation concerning nitrogen oxide (NO x ) emissions is a global phenomenon, and governing bodies like the International Maritime Organization (IMO) are introducing stricter regulations. The Wärtsilä NO x Reducer (NOR) system is an exhaust gas after treatment device, based on Selective Catalytic Reduction (SCR) technology. It lowers the exhaust levels of NO x and meets the upcoming NO x requirements. The IMO NO x emission standards The first IMO Tier I NO x emissions standard entered into force in It applies to marine diesel engines installed in ships constructed on or after January 1, 2000 and prior to January 1, 2011.
35 WÄRTSILÄ TECHNICAL JOURNAL NO x (g/kwh) RATED ENGINE SPEED (rpm) Tier I - engines > 130kW New ships 2000 Tier II - engines > 130kW New ships 2011 Tier III - engines > 130 kw New ships from 2016 in ECAs Fig. 1 - IMO NO x emission limits. Marpol Annex VI and the NO x Technical Code were later reviewed with the intention to achieve further reductions in emissions from ships, and IMO Tier II and Tier III NO x emission standards were finally adopted in The IMO Tier II NO x standard entered into force on January 1, 2011, replacing the IMO Tier I NO x emissions standard globally. The Tier II NO x standard applies for marine diesel engines installed in ships constructed on or after January 1, The IMO Tier III NO x emissions standard becomes effective from the year The Tier III standard will apply in designated emission control areas (ECA) that are to be defined by the IMO. So far, the North American ECA and the US Caribbean Sea ECA have been defined and will be applicable to marine diesel engines installed in ships keel laid after January 1, Other ECAs that might be designated in the future for Tier III NO x control, will enter into force for ships constructed on or after the date of adoption by the Marine Environment Protection Committee (MEPC) of the applicable ECA, or at a later date as may be specified separately. The IMO Tier II NO x emission standard will apply outside the Tier III designated areas. The NO x emission limits specified in the IMO standards are expressed as being dependent on engine speed. These can be seen in Figure 1 below. The IMO Tier III NO x emissions level corresponds to an 80% reduction from that specified in the IMO Tier I standard. Such a reduction can be reached by applying a secondary exhaust gas emission control system, and the Wärtsilä NO x Reducer (NOR) system is an efficient way of attaining compliance with the IMO Tier III standard (Figure 1). The Wärtsilä NO x Reducer Wärtsilä has delivered SCR systems to vessels since the 1990 s and have until now over 250 units in operation/on order. Wärtsilä developed its own SCR system portfolio named the Wärtsilä NO x Reducer (NOR). The Wärtsilä NOR was first released in 2009 and has now been further developed with a more compact and flexible design for easier installation onboard. The Wärtsilä NOR is designed for use with all four-stroke engines and is suitable for both newbuilds and retrofits. The NOR is compatible for operating on both distillate and heavy fuel oils, and can be operated together with other exhaust gas after treatment units, such as SO x Scrubbers. The Wärtsilä NOR system is based on SCR technology. The SCR is an exhaust emissions after-treatment system that reduces the amount of NO x in the engine s exhaust gas by means of catalyst elements and a reducing agent. During the process, a reducing agent, namely a solution comprised of urea water, is added to the exhaust gas stream. The water in the urea solution is evaporated as the solution is injected into the hot exhaust gas causing the urea to decompose into ammonia. The exhaust gas NO x emissions are thereafter in detail 37
![[ MARINE / IN DETAIL ] [ MARINE / IN DETAIL ] transformed into harmless nitrogen (N2) and water (H2O), as they react with the ammonia over the catalytic surface inside the reactor.](/docs-images/74/70023963/images/36-0.jpg "The main component of the NOR system is the Reactor containing a soot blowing system and the catalyst elements.")
36 [ MARINE / IN DETAIL ] [ MARINE / IN DETAIL ] transformed into harmless nitrogen (N2) and water (H2O), as they react with the ammonia over the catalytic surface inside the reactor. The main component of the NOR system is the Reactor containing a soot blowing system and the catalyst elements. The other essential modular parts of the NOR system are the Urea pump unit, the Urea dosing unit, the Control unit, the Air unit, and the Urea Mixing and Injection unit. The prefabricated auxiliary units have a compact design and, for the purpose of easy installation, several auxiliary units are centralized so that the same units 38 in detail can be utilized for multiple installations. The units have built in redundancy, with easy maintenance being one of the main development targets. Figure 2 above gives an overview of a multiple Wärtsilä NOR installation. The highly efficient NOR system is optimized in terms of installation flexibility and ease of maintenance. The NOR is typically designed to achieve NO x emission reductions at the IMO Tier III level, but can also easily be designed for meeting other NO x requirements. The NOR reactor design is available in a wide range of sizes and shapes. The reactor can be orientated either vertically or horizontally and is available in shorter or longer, and wider or narrower shapes in order to make the best use of valuable installation space onboard. With high levels of standardization and modularization, the system is optimized for marine applications. Figures 3, 4 and 5 (next page) show examples of typical reactor dimensions and shapes. The 2 catalyst layer reactor is short and wide, while the 3 catalyst layer is longer and narrower. The working temperature of the SCR


37 WÄRTSILÄ TECHNICAL JOURNAL Standard scope of delivery Optional or in customer s scope Fig. 2 - A multiple Wärtsilä NOR installation. Fig. 3-2 catalyst layer and 3 catalyst layer reactors. in detail 39
38 [ MARINE / IN DETAIL ] [ MARINE / IN DETAIL ] Engine size MDF Fuel HFO Fuel (MW) L(mm) H (mm) W (mm) L(mm) H (mm) W (mm) (incl. cones) (incl. 150 mm (incl. 150 mm (incl. cones) (incl. 150 mm (incl. 150 mm insulation) insulation) insulation) insulation) Fig. 4 - Typical dimensions, 2 catalyst layer reactor. Engine size MDF Fuel HFO Fuel (MW) L(mm) H (mm) W (mm) L(mm) H (mm) W (mm) (incl. cones) (incl. 150 mm (incl. 150 mm (incl. cones) (incl. 150 mm (incl. 150 mm insulation) insulation) insulation) insulation) Fig. 5 - Typical dimensions, 3 catalyst layer reactor. 40 in detail

39 WÄRTSILÄ TECHNICAL JOURNAL System komponents 1 Static mixer 2 Injector lance 3 Injection nozzle 4 Mixing duct Fig. 6 - Urea injection and mixing arrangement. system is dependent on the sulphur content and type of fuel used. Wärtsilä has validated the catalyst elements with engines running on different fuel oil qualities, and has also optimized the engine s exhaust gas temperatures for the SCR operation. This ensures good functionality and operation of the SCR system when running on any fuel oil quality at any engine load. Each reactor is also provided with an efficient, automatically operated, soot blowing unit. The soot blowing system removes soot deposits from the catalyst elements, thereby ensuring their long term performance. The Wärtsilä NOR has a common control system for the complete SCR system. Each unit is connected to this control system, and all functionality and control activities are automatically processed and executed according to the status of the running engine and the SCR system. The NOR control system is also constructed using the same components as the engine control system. This enables smooth communication between the engines and the NOR systems, thus ensuring efficient nitrogen oxide reduction in all operating conditions. The Wärtsilä NOR does not need an NO x analyser for the functionality and operation of the system. An NO x analyser can, however, be installed as an optional device to provide NO x emission measurements after the SCR reactor for possible emission reporting needs. The analyser can be a stationary analyser based on continuous emission measurements, or alternatively a portable emission analyser for spot check measurements. The mixing duct arrangement is of great importance for the performance of the SCR system. A mixing plate is installed in the exhaust gas duct before the urea injector. The static mixer ensures that the reducing agent is uniformly mixed with the exhaust gas. After the urea injection, the exhaust gas flow passes through a mixing duct where the urea is transformed into ammonia and mixed homogeneously before it reaches the reactor with the catalyst elements. Figure 6 illustrates the urea injection and mixing duct arrangement. Wärtsilä NO x Reducer offers performance and efficiency The benefits of the Wärtsilä NOR system include a compact and flexible design that makes for easy installation; the fact that it is optimized and validated for Wärtsilä medium-speed engines in terms of reliability and size; the efficient SCR process with high activity over a wide temperature range; the durable catalyst elements to withstand ageing and corrosion; its compliance with IMO Tier III as standard and the ability to meet other NO x levels if required; the noise reduction capacity and the possibility to integrate the NOR reactor with silencers; the fact that it can be used with various fuels and that it is compatible with SO x scrubber systems. Conclusions The NOR system installation provides flexibility for operators for compliance with different NO x emission regulations throughout the entire life of the vessel. A vessel operating worldwide could, for example, comply with IMO Tier II levels and only when entering into ECA zones, would the NOR system be put into operation for compliance with the IMO Tier III level. By choosing the Wärtsilä NO x Reducer, the overall performance of the engine and the exhaust gas system is optimized in terms of emissions reduction, noise abatement and engine efficiency. The Wärtsilä NOR is available for IMO Tier III compliance for all Wärtsilä four-stroke diesel engines, and for Wärtsilä dual-fuel engines when running in back-up mode. Wärtsilä can deliver the IMO Tier III certification for the full package, including the engine and SCR technology. in detail 41
![[ MARINE / IN DETAIL ] [ MARINE / IN DETAIL ] LNG Propulsion achieves the next step in technological evolution AUTHOR: Giulio Tirelli, Director, 4-stroke Portfolio & Applications, Wärtsilä Ship Power](/docs-images/74/70023963/images/40-0.jpg "With the introduction of the Wärtsilä 46DF dual-fuel engine, the traditional design principles for LNG-powered vessels can be reviewed with substantial benefits to ship owners and operators.")
40 [ MARINE / IN DETAIL ] [ MARINE / IN DETAIL ] LNG Propulsion achieves the next step in technological evolution AUTHOR: Giulio Tirelli, Director, 4-stroke Portfolio & Applications, Wärtsilä Ship Power With the introduction of the Wärtsilä 46DF dual-fuel engine, the traditional design principles for LNG-powered vessels can be reviewed with substantial benefits to ship owners and operators. 42 in detail Wärtsilä dual-fuel engines are already well-known in the marine market, and the technology they are based on is a daily reality for hundreds of owners all around the world. Vessels propelled with Wärtsilä dual-fuel (DF) engines are today operating in the most diversified global and environmental conditions, from Canada to China, from Korea to Norway, and from Brazil to Denmark. Despite this wide acceptance from the marine market, innovation never stops and in March 2014, Wärtsilä launched the latest exemplar of the DF engine family: the Wärtsilä 46DF. Similarly to previously introduced DF engines, the Wärtsilä 46DF engine is derived from a well-established diesel engine, the

41 WÄRTSILÄ TECHNICAL JOURNAL Fig. 1 - The Wärtsilä 46DF, the most powerful and efficient gas engine on the market. Wärtsilä 46F, a market leader in applications such as cruise vessels, RO-RO and RO-Pax ferries. The cumulated experience from earlier DF engines made it possible for Wärtsilä for revisit the design of many of the engine s working parameters, such as combustion spaces, fuel injection charge air, and automation. The results of such extensive work brought outstanding performances in power output and fuel consumption (both in gas and diesel mode) for the newly introduced engine, while also reducing its environmental footprint. In order to further improve its suitability for the multiplicity of applications where this engine could be applied, the Wärtsilä 46DF is available in two different versions. The high efficiency version offers drastically lower fuel consumption with a cylinder power of 1045kW, while the high power version is capable of a cylinder power of 1145kW with excellent engine thermal efficiency. Compared to engines targeting similar applications, the Wärtsilä 46DF achieves in detail 43
42 [ MARINE / IN DETAIL ] [ MARINE / IN DETAIL ] kw/cyl W46DF Competitors Fig. 2 - The Wärtsilä 46DF power output per cylinder vs. its main competitors Gas BSEC - kj/kwh + 3% Diesel SFOC - g/kwh % + 7% % W46DF Competitors W46DF Competitors Fig. 3 - The Wärtsilä 46DF fuel consumption vs. its main competitors. a power output per cylinder that is up to 27% higher than the competition. In principle, this offers the chance to design an LNG-propelled vessel with 27% fewer installed cylinders than the available alternatives, with all the related benefits in onboard space demand, engine room arrangements, and reduced maintenance requirements (Figure 2.) In this respect, it should be mentioned that the Wärtsilä 46DF is the first gas 44 in detail engine where basically no penalty in power output is imposed as a result of switching from traditional diesel propulsion to LNG. From this point of view, a new vessel design could, in principle, have the same engine configuration (and therefore similar engine room arrangements) regardless of whether it features a Wärtsilä 46F diesel engine or its DF cousin, thewärtsilä 46DF. This leads to benefits for both designers and owners, in that similar vessels in the fleet could be treated alike, irrespective of being diesel or LNG propelled. Another big achievement of the newly introduced design is the combination of the outstanding power output described above, with a drastic improvement in fuel consumption, both in gas and diesel mode. Compared to the competition, when running in gas mode the Wärtsilä 46DF has up to 6% lower gas consumption. When in diesel mode, the benefits are even higher,

43 WÄRTSILÄ TECHNICAL JOURNAL The M/S GDF Provalys, the first LNG Carrier powered by Wärtsilä DF engines. reaching up to a 7% reduction in fuel consumption. The implications for the economic and environmental impact to owners and operators are clear; lower fuel consumption implies lower fuel expenses and a reduced environmental footprint, thanks to less fuel being burned (Figure 3.) The Wärtsilä 46DF on LNG Carriers One of the most important application fields for which the Wärtsilä 46DF engine has been developed is the LNG Carrier market. In a conventional installation for a large size LNG Carrier (i.e. featuring a cargo capacity above 150,000 m 3 ), the selected engine configuration has been traditionally comprised of three 12-cylinder Wärtsilä 50DF V-engines, plus one 6-cylinder Wärtsilä 50DF in-line engine. The total amount of installed cylinders has, therefore, been 42 units. With the introduction of the Wärtsilä 46DF engine, the installed configuration applied to a modern LNG Carrier design could be reduced down to four 8-cylinder Wärtsilä 46DF engines. The reduction of ten installed cylinders offers clear direct benefits in reducing maintenance expenses, maintenance downtime, and onboard space demand without changing the high flexibility and operability of the vessel, factors that have led to the market leadership of DF-Electric propulsion. In addition, the selected engine configuration can now feature four engines that are exactly equal in all their aspects. This increases the possibilities for optimizing vessel efficiency, vessel flexibility, identical engine rooms design and the logistics and supply of spare parts. With its big improvements in liquid fuel consumption, the Wärtsilä 46DF is able to directly tackle the requirements of an increasingly common cargo trading scheme: the LNG Carrier spot market. With the remarkable increase in fleet size of LNG Carriers, the availability of LNG transportation services has been consequently rising. This has made the transportation offer and demand equilibrium more fluid. The result is that more owners are no longer chartering their LNG Carriers based on the traditional long time-charterer agreements (characterized by fixed routes, usually fixed export and import terminals, and remaining the same for a duration of about 20 years), but on a spot cargo basis. The spot market has the peculiarity of seeing a single vessel unloading all its traded cargo at the import terminal. This operation serves to maximize the benefits from the LNG purchase price vs. sell price differential. When totally empting its cargo tanks, the vessel will require the back haul trip to be performed on traditional liquid fuel, not having the chance to use Natural or Forced Boil-Off Gas (NBOG or FBOG). in detail 45
44 [ MARINE / IN DETAIL ] [ MARINE / IN DETAIL ] M/S Viking Amorella M/S Viking Grace Next Generation 46DF DWT Passengers Lane meter for cars 450 m 500 m L.o.a m 218 m Application type Diesel MECHANICAL Diesel ELECTRIC Power installed (MW) 31,180 30,4 30,4 Same installed power N of cylinders installed cylinders less intalled Service speed 22 kn 22 kn 22 kn Same vessel speed Fuel consumption Reference - 290,000 /year - 300,000 /year Lower fuel consumption and related emissions Fig. 4 - Comparisons between the M/S Viking Amorella, the M/S Viking Grace, and an ideal similar vessel powered by the Wärtsilä 46DF. The Wärtsilä 46DF s top of the class liquid fuel consumption consequently ensures the biggest savings also for LNG Carriers operating on a spot market. The Wärtsilä 46DF on RO-Pax Ro-Pax represents another vessel family for which the Wärtsilä 46DF has been developed, and consequently where expectations are the highest. RO-Pax vessels are designed to transport cars, trucks, trailers and passengers, usually on very fixed routes during the entire life of the vessel. Thus, these ships typically operate at very constant speeds and their operating profile remains the same for years. Furthermore, they have a very tight turnaround time in port so as to maximize the volume of cargo and passengers transported, and they operate continuously, usually for 365 days a year, coping with all the variations in environmental conditions. LNG propulsion is particularly suited to RO-Pax vessels thanks to the certainty of operations; a vessel would most likely call always at the same ports throughout its lifetime. If the LNG bunkering supply chain and infrastructure is in place and available in these same harbours, the vessel has almost certainly the capability of utilizing such a fuel continuously. One of the most recent and most advanced LNG-powered references in the RO-Pax field is the M/S Viking Grace. 46 in detail In service since 15th January 2013, the vessel operates between Turku, Finland and Stockholm, Sweden with an opensea operating speed of 22 kn. Sharing the same route with the M/S Viking Grace and operating in the opposite direction is the M/S Viking Amorella, a vessel built about 25 years ago and featuring a traditional propulsion system based on liquid fuel. Apart from the differences between the age of the two vessels and the economy of scale factor (the newest having almost double the dead-weight, with 13% more passenger capacity, and with the lane meter for car capacity increased by 11%), the M/S Viking Grace s propulsion plant configuration was revised during the design phase to incorporate the most advanced technologies available at that time. As a result, the M/S Viking Grace features four 8-cylinder Wärtsilä 50DF engines, installed in diesel-electric configuration. Despite the fact that the two above mentioned vessels operate in the Baltic Sea with the same design speed, and although the newer ship is much bigger than the older one, the total installed power on the M/S Viking Grace has been remarkably reduced. The same reduction trend can be seen in the total number of cylinders installed, and the fuel consumption costs that have been cut by about 290,000 EUR/year. Finally, the NO X, SO X and CO 2 emissions were reduced to the very low levels that LNG-based propulsion is capable of reaching. Let s now imagine the possibility of introducing a new vessel totally equal to the M/S Viking Grace. Without taking into consideration possible improvements in the hull design, hull efficiency, dimensions, capacities, etc., but with the only difference being the use of Wärtsilä 46DF engines as the major power producers, numerous substantial additional benefits would immediately materialize. Maintaining the vessel s operational patterns (the same schedules, flexibility, safety and redundancy), the newly built vessel would see a further reduction of four installed cylinders, and lower fuel consumption accounting for an approximate EUR 300,000 saving per year compared to the reference vessel, and would have similar benefits regarding the NO X, SO X and CO 2 emissions, thanks to the smaller amount of fuel utilized. Dual-fuel propulsion is becoming a reality in all marine segments. Current DF references include highly diversified categories, such as tugs, navy vessels, offshore production and support vessels, dry and wet cargo ships, inland waterway, and passenger ships. Wärtsilä today counts more than 1000 DF engines sold and operating globally, with more than 10 million cumulated running hours of experience. The introduction of the Wärtsilä 46DF will certainly continue this trend.

45 WÄRTSILÄ TECHNICAL JOURNAL The M/S Viking Grace. Merchant LNGC 150 vessels Coastal Patrol Multigas Carrier 5 vessels DF-propulsion Ro-Ro 2 vessels DF main and auxiliary engines Bulk Carrier 1 vessels Conversion 1 vessels ~ 650 engines Navy Offshore OSV s Production TUG Guide Ship 31 vessels 2 platforms 2 vessels 1 vessel / engine 96 engines 9 FPSO s etc. 2 engines each 1 FSO Mechanical drive IWW 40 engines 2 vessels 3 engines Others Cruise & Ferry LNG Cruise Ferry LNG Ferries DF Power Plant 1 vessel 4 ferries 67 installations 4 engines 18 engines 354 engines complete gas train output 4600 MW Conversion online since 1997 Power Plants 1 ferry 2 engines 6 segments > 1,000 engines > 10,000,000 running hours Wärtsilä dual-fuel references. in detail 47
![[ MARINE / IN DETAIL ] [ MARINE / IN DETAIL ] Gas handling throughout the chain AUTHORS: Stein Thoresen, Director,](/docs-images/74/70023963/images/46-0.jpg "LPG Systems, Wärtsilä Ship Power Kjell Ove Ulstein, Business Development Manager, Wärtsilä Ship Power 48 in detail")
46 [ MARINE / IN DETAIL ] [ MARINE / IN DETAIL ] Gas handling throughout the chain AUTHORS: Stein Thoresen, Director, LPG Systems, Wärtsilä Ship Power Kjell Ove Ulstein, Business Development Manager, Wärtsilä Ship Power 48 in detail
47 WÄRTSILÄ TECHNICAL JOURNAL Gas is a particularly challenging type of cargo. If the conditions change on board the gas carrier, there s a risk of the vessel arriving in port with nothing to sell. If anything goes wrong in handling the cargo on board a gas carrier, the customer is left with nothing to trade. That is why no one can ever have a bad day when handling gas. Wärtsilä has the most extensive experience on the market, complete with the broadest portfolio of cargo handling systems for gas carriers. These come in handy in times of booming gas markets. Wärtsilä gas cargo handling has its roots in the Kvaerner group, which entered the business in the early 1960s. In 1998, the Kvaerner gas handling business became part of the Hamworthy group, which was later acquired by Wärtsilä in This acquisition was a win-win deal for both parties: Hamworthy s long experience in gas handling teamed up with Wärtsilä s propulsions systems and the widest service network in the world. This winning constellation in combination with a booming gas market is now rewarded with a record-breaking order book. Wärtsilä is the only market player that is able to be there for customers throughout the whole gas handling chain and to cater for all types of carriers, from small-size ones up to huge 300-metre vessels. This wide scope is one of the reasons why orders keep flowing in, as the cyclical world economy means some particular type of carrier is always in vogue. The broadest offering on the market Wärtsilä delivers cargo handling plans for all types of gas carriers from the smallest size LPG carriers for coastal transport to the biggest size LNGC s with a capacity to carry more than 220,000 cubic metres of cargo. Since Hamworthy became part of Wärtsilä, fuel supply systems based on gas are also offered. Gas-driven propulsion and auxiliary machinery is particularly well suited for gas carriers, as cargo and fuel systems can be integrated to save energy. On a gas carrier, the Wärtsilä logo can be seen on a lot of equipment. In some cases, the Wärtsilä package covers more than 30 per cent of the price tag of the ship, and that figure gets closer to 40 per cent if cargo tanks are included in the delivery scope. Wärtsilä s cargo handling entails everything from loading the gas at the terminal to keeping it safe during freight and unloading it at the final destination. When the cargo consists of gas, it is of utmost importance to keep it under stable conditions. After all, the ship s owners must deliver the cargo as promised to the customer. This means that the gas in in detail 49
![[ MARINE / IN DETAIL ] [](/docs-images/74/70023963/images/48-0.jpg "MARINE / IN DETAIL ] 50 in")
48 [ MARINE / IN DETAIL ] [ MARINE / IN DETAIL ] 50 in detail

49 WÄRTSILÄ TECHNICAL JOURNAL in detail 51
50 [ MARINE / IN DETAIL ] [ MARINE / IN DETAIL ] Wärtsilä s gas handling product and service offering includes: Ship design Cargo Tank Design and Manufacturing Cargo Handling System, Engineering and Equipment Reliquefaction Plants Fuel Gas Supply System Complete propulsion system 52 in detail the cargo tanks must be kept at a certain temperature and pressure. These vary depending on the type of cargo. For ethylene, the required temperature can be down to -104 C, and for LNG even down to -163 C. To ensure that the temperature remains at the right level the cargo needs to be correctly processed during loading as well as under sail. Energy efficiency is crucial Reliable and energy-efficient operation is a key issue for ship owners. Keeping the cargo cool is not only a delicate affair, but also an expensive one. The cooling process consumes substantial amounts of energy and the reliquefaction plant is by far the equipment on board with the highest power consumption. Running the compressors is also an energy-intensive affair. With increasing energy prices, energy efficiency becomes a crucial issue for ship owners in order to stay competitive. Wärtsilä has been able to improve energy efficiency by about 20 per cent during the last five years by improving the equipment and processes. There are a lot of safety issues involved in the handling of a gas cargo on board a ship. All rules and regulations must be followed and the carrier must be designed to secure easy and safe operation for the crew. Gas leakage can be fatal as the cargo is not only toxic but also highly flammable. Gas detection systems are always installed to detect any leakage. In addition, gas release systems are installed that can release gas to safe masts if the pressure exceeds allowed levels. Wärtsilä s products and solutions naturally all comply with the International Maritime Organization s (IMO) Safety of Life at Sea (SOLAS) recommendations and regulations. Wärtsilä has a particularly high competence when it comes to process calculations. Most processes can be covered. Innovative ship design together with the knowhow to deliver model testing of the hull and class drawings makes Wärtsilä an attractive partner to both owners and yards for developing new ship concepts. This was the case for the latest ethane carriers we delivered to transport ethane from shale gas in the US to process plants in Europe and the Far East. Wärtsilä s Baltic Design Centre is a part of the organisation and an important contributor in the development of ship design and cargo tanks as well as contract execution. Wärtsilä s large network can cater to all types of ships. Offering aftermarket service and spare parts wherever the vessel is docking is highly valuable for ship owners. Korea and China in the lead By now Wärtsilä has 85 contracts under execution for plants to be delivered to gas carriers of all types and sizes. Over 90 per cent of these contracts come from shipyards in China and Korea, which consequently constitute the main markets. Korea has been the dominant maker of gas carriers for quite some time. During the last ten years also China has entered the fray, winning success in delivering gas carriers not only serving its own massive gas market but also for export. China is a great consumer of gas both for heating power plants and for process plants

51 WÄRTSILÄ TECHNICAL JOURNAL Advanced 3D modeling used for optimizing total design and arrangements. for the plastic industry. Being substantially cleaner than coal and oil, gas fits well into China s policy of battling its huge pollution problem. Currently, China and Korea both have about equal shares of the market for new gas carriers. Wärtsilä is currently working on its most extensive turnkey project to date, under construction in Brazil. A huge equipment and design package is being delivered to eight LPG carriers at Vard shipyard in Suape. Wärtsilä is responsible for the complete design of the ship, from model testing and calculations of ship behaviour to delivering complete cargo tanks. Complete packages for handling cargo on board the vessels are also included. The LPG carriers are being built at the shipyard in Brazil, as legislation states that all Brazil-owned ships must be built in Brazil. This adds further challenges to the project: the 500-ton gas tanks are manufactured in China and shipped to Brazil for installation on board the ships. Strong in innovation As it takes about two years to build a gas carrier from scratch and Wärtsilä s solutions for gas carriers have a delivery time of about 18 months, the Wärtsilä team needs to be included in the plans at quite an early stage. That is why a lot of effort is put into developing a thorough understanding of the market and the customer s needs right in the first planning phase. This is essential for coming up with innovative concepts. Staying tuned with customers needs is also an important driver for innovation. Ship owners typically operate gas carriers for at least 25 years, making the cost of operation a key issue. Hence, the R&D efforts focus on ensuring low operation costs for the ship owners. Currently under work is improving big-size LPG carriers to handle LPG with ethane for exporting from the booming US market. Another important R&D focus area is using LNG fuel for the main engines and to integrate fuel system with the cargo handling for energysaving measures. In line with tighter IMO legislation R&D projects on implementing LNG as fuel for carriers and bunkering ships are also under way. in detail 53
![[ MARINE / IN DETAIL ] [ MARINE / IN DETAIL ] Optimum propeller design leads to higher ship efficiency AUTHOR: Norbert Bulten, General Manager Hydrodynamics, BL Propulsion, R&D Fig.](/docs-images/74/70023963/images/52-0.jpg "1 - Numerical flow simulation of the propeller and hull.")
52 [ MARINE / IN DETAIL ] [ MARINE / IN DETAIL ] Optimum propeller design leads to higher ship efficiency AUTHOR: Norbert Bulten, General Manager Hydrodynamics, BL Propulsion, R&D Fig. 1 - Numerical flow simulation of the propeller and hull. Although Wärtsilä has a hundred years of experience in designing Fixed Pitch (FP) and Controllable Pitch (CP) propellers, new developments have enabled even greater fuel savings for ship owners and operators. 54 in detail The latest Wärtsilä s propeller designs come as a result of the extensive use of Computational Fluid Dynamics (CFD) in the design process. Numerical methods are also applied more and more to develop more fuel efficient modern hull designs. With the application of numerical simulations (see Figure 1), it has become possible to make the analyses for true full scale dimensions, thereby eliminating the use of semiempirical scaling methods. The conventional maritime industry approach is to optimize hull resistance and propeller performance separately. The bare hull resistance is minimized by the naval architect, and the propeller thrust is maximized for a given power by the propeller designer. Once both designs are combined (ship + propeller) the actual performance of the system is found. Due to the action of the propeller, the actual bare hull resistance increases, which is often considered as being an inevitable loss of overall performance. Modern numerical flow simulations specifically address this issue. OPTI Design FP and CP propeller design process The use of numerical simulations in the design process enables the introduction of a completely new approach in the design of propellers. This new approach is described in Figure 2, which illustrates both the conventional approach, based on model scale testing, and the new approach based
53 WÄRTSILÄ TECHNICAL JOURNAL Ship resistance & propulsion -stock propeller Propeller Open Water test Ship propulsion designed propeller Wake field & Power requirements (Optimum) propeller diameter selection Wake field full scale (Optimum) propeller diameter selection full scale WÄRTSILÄ PROPELLER DESIGN Conventional approach based on model tests Propeller design philosophy Evaluation main parameters Ship resistance CFD Propeller Open Water CFD Ship propulsion CFD designed propeller Additional actions for OPTI Design based on full scale CFD Fig. 2 - Flow chart of the OPTI Design and conventional propeller design processes. on full scale numerical flow simulations. The different steps in the conventional approach are represented in the blue boxes: Model scale ship resistance and selfpropulsion measurements with stock propeller Propeller open water performance measurements Self-propulsion measurements with the actual designed propeller and extrapolation to full scale performance The initial measurements provide the inflow velocity distribution to the propeller (wake field), which is important input for the propeller design process. Based on the powering prediction of the ship with a stock propeller, selection of the actual propeller diameter can be made. For this diameter selection the so-called B-series are often used. These B-series are based on a large set of model scale propeller performance measurements that date back to just after World War II. Nowadays, there is realisation that the actual full scale performance can differ rather significantly from the B-series predictions. The use of full scale numerical flow simulations for vessel and propeller designs is one of the key features of the new OPTI Design approach. The different steps in the OPTI Design philosophy are shown in the orange boxes: Full scale bare hull calculation to determine hull resistance and wake field Selection of the optimum propeller diameter based on available full scale B-series polynomials Propeller design process based on standard design tools, making use of decades of experience Full scale propeller performance evaluation in open water with CFD Full scale propulsion calculation with hull and propeller to determine the interaction factors and thus the propeller performance in behind ship condition An impact analysis can be carried out to evaluate the effects of geometric variations of the propeller These actions are defined to get firstly, the most accurate input for the design process and secondly, to check the performance of both the propeller in open water and the propeller in behind ship condition with the focus on the actual (full) scale. It can be seen from the diagram, that a final model scale test can still be part of the OPTI Design process. Development of numerical methods During the past two decades, the development of numerical methods has made huge progress. Nowadays, the effects of viscous flow can be taken into account for engineering applications, which means that accurate bare hull resistance predictions and propeller open water performance calculations are feasible. Based on current technology, the viscous flow simulations (also denoted as RANS (Reynolds-Averaged Navier-Stokes)) can take the effects of the free surface along the hull, and the dynamic sinkage and trim of the vessel into account. Moreover, the accuracy of the calculations can compete with the accuracy of the model scale resistance measurements. Now that confidence in the numerical methods has been established, the step towards actual in detail 55
54 [ MARINE / IN DETAIL ] [ MARINE / IN DETAIL ] Model scale Bare Hull Resistance (N) Model scale measurements Model scale CFD simulations Ship Speed (knots) Fig. 3 - Comparison of calculated and measured bare hull resistance on model scale. full scale geometries can be made. In this way the need for the semi-empirical extrapolation methods, as used in the model tests, will diminish. The following step in the development of the numerical simulations is the propulsion calculation, whereby the ship and the propeller are analyzed together. The propeller performance is then derived from fully transient moving mesh simulations with sliding interfaces. In these simulations, the propeller position is adjusted for every time step, which gives the time dependent solution of the flow. The propeller thrust and torque are calculated for each time step in this approach. The added value of the numerical simulations is found in the extensive options of flow visualization (see, for example, Figure 1) and post-processing. With these means of data analysis, it is possible to get new insights on the actual occurring flow phenomena, such as the interaction phenomena. It is also possible to determine the contribution of drag on the different components and appendages on the hull so as to get an indication of their contribution to the total resistance. Full scale hull resistance and wake field The value of the numerical simulations is, to a large extent, based on the achieved accuracy of the simulations. Validation of the methods is, therefore, one of the key elements in the implementation process of CFD. At Wärtsilä, a multi-year project 56 in detail on the method development for propeller performance predictions, thruster load determination, and ship hull resistance calculations, among others, has been executed. A typical result of the validation work is shown in Figure 3, where the calculated bare hull resistance on model scale is compared with the experimental data from the model basin. The agreement between the calculations and the measurements is very good over the whole range of analysed ship speeds. Calculations of the vessel resistance at actual full scale have been made as well. Though a direct comparison with full scale resistance is not possible, a good agreement has been found with the results of the semiempirical extrapolation methods. The model scale and full scale bare hull resistance calculations provide the velocity distribution at the location of the propeller. This is called the ship s wake field. This is always one of the key input data sets for the propeller designer. The industry has come to recognize that the measured wake field at model scale is not fully representative of the actual inflow to the propeller on the ship itself. A comparison between the calculated wake field at model scale and at full scale is shown in Figure 4. Due to the low velocity region in the top part, the propeller loading is increased, which may lead to more cavitation. The actual cavitation behaviour of the propeller on the ship might differ, which results in less noise and lower pressure pulses. These benefits can be turned into more efficient propeller designs thanks to an enlarged design envelope. A strong non-uniform velocity distribution requires compromises in the design at the cost of efficiency. Thus, the more disturbances there are present, the lower the propeller efficiency will be. Propeller performance determination The numerical simulation of a propeller offers other challenges than those of the hull resistance simulations. The complex 3D shape of the propeller blades with their subtle, though critical details at the leading and trailing edges of the blades, have to be taken properly into account. The first propeller performance CFD calculations at Wärtsilä date from a decade ago, so there is considerable experience available on this topic. Over the years, the focus has been on achieving both high accuracy of the simulations, as well as clear process descriptions, in order to get perfect repeatability of the calculations. The performance of a propeller is often presented in an open water diagram, in which the dimensionless advance speed of the water is presented on the horizontal axis, and the thrust produced and the torque absorbed by the propeller are presented on the vertical axis. The propulsive efficiency is defined as the resistance times the advance speed divided by the shaft power. An example of the open water performance calculations

55 WÄRTSILÄ TECHNICAL JOURNAL Fig. 4 - Comparison of model scale (left) and full scale wake field. 0.9 Dimensionless thrust, torque and effiency Thrust-Experiments Torque-Experiments Efficiency-Experiments Thrust-CFD-model scale Torque-CFD-model scale Efficiency-CFD-model scale Thrust-CFD-full scale Torque-CFD-full scale Efficiency-CFD-full scale Dimensionless advance speed Fig. 5 - Open water performance diagram of propeller for model scale and full scale. in detail 57
![[ MARINE / IN DETAIL ] [ MARINE / IN DETAIL ] Fig. 6 - Numerical flow simulation of a propeller in HPN at full scale.](/docs-images/74/70023963/images/56-0.jpg "110 108 Normalised Effiency (%) 106 106 102 100 98 96 94 92 90 94 96 98 100 102 104 106 108 110 112 Full Scale Model Scale Difference Optimum Normalised Propeller Diameter (%) Fig.")
56 [ MARINE / IN DETAIL ] [ MARINE / IN DETAIL ] Fig. 6 - Numerical flow simulation of a propeller in HPN at full scale Normalised Effiency (%) Full Scale Model Scale Difference Optimum Normalised Propeller Diameter (%) Fig. 7 - Optimum diameter selection based on model scale and full scale propeller performance data. 58 in detail

57 WÄRTSILÄ TECHNICAL JOURNAL on model scale and full scale is shown in Figure 5. In this diagram, the results from the model scale experiments are also shown. It can be seen that the differences between model scale and full scale are larger than the deviations between measurements and calculations. Hereby showing the relevance of a full scale approach. The lack of proper correlation between model scale and full scale has long been acknowledged within the industry. The International Towing Tank Conference (ITTC) has developed a correction formula for the propeller thrust and torque. This conventional method for propeller performance scaling (ITTC 78) is used by many model basins. More recent studies have shown that this method is not valid for every type of propeller design. For more conventional, simple designs the method is fairly accurate, but for more advanced (modern) designs with some skew and rake, completely different trends have been found. In order to take the full benefits of design features such as tip rake into account, full scale performance calculations are required. In the case of ducted propellers, such as a propeller with an HPN as shown in Figure 6, no scaling procedures are available at the model basins. In general, this results in rather pessimistic performance predictions for ducted propulsion systems. A typical full scale example, which can be used for validation, is the bollard pull sea trial. In such tests, a vessel is connected to shore with a cable, in which the maximum pull force at zero speed can be measured. In such conditions, the actual hull resistance is negligible due to the lack of forward speed. Comparisons of the measured pull force with full scale CFD results have proven that the Reynolds scale effects for ducted propellers are present and significant in most cases. of the optimum propeller diameter and RPM. The conventional method to select these particulars is based on the model scale Wageningen B-series. This is a set of polynomials of a large range of propellers with different numbers of blades, blade area ratios, and pitch. The performance of these propellers was determined shortly after World War II in the Marin model basin. With the model scale polynomials, the optimum diameter and RPM can be determined for a specific ship. Recently, a new set of full scale polynomials has been developed based on full scale CFD simulations of the B-series propellers. This data is the property of Wärtsilä. With these full scale polynomials, the selection of the optimum diameter and RPM can be based on the actual full scale input. A comparison has been made of the diameter selection based on the model scale and full scale polynomials. The results are shown in Figure 7, where the normalized efficiency is plotted against the normalized diameter. The starting point is the currently selected propeller (100%-diameter), based on model scale. Based on the model scale curve, it seems that the propeller has indeed the optimum diameter. However, if the actual full scale curve is used in the selection process, then a larger propeller would be selected. It should be noted, that besides the efficiency gain due to the optimum diameter selection, also a clear difference in efficiency due to Reynolds scaling effects is visible in this diagram. Conclusions The new way of working, based on full scale numerical flow simulations, eliminates numerous issues that are part of model scale testing procedures. Full scale bare hull resistance calculations provide proper data of the actual inflow velocity distribution to the propeller. This gives the propeller designer the best starting point for the design process and reduces the compromises, which have to be made to get acceptable cavitation behaviour and pressure pulses. The use of the full scale B-series polynomials, which are exclusive Wärtsilä property, can give a different optimum propeller diameter, which results in improved propulsive efficiency and consequently, more fuel efficient ship operation. The versatility of the numerical simulations also enables the integration of energy saving devices, such as HPN-nozzles and EnergoPac rudder configurations in the OPTI propeller design cycle (Figure 8). Optimum propeller diameter selection The key feature of the OPTI Design propeller process is the application of full scale numerical flow simulations. As discussed previously, the use of actual full scale dimensions in the simulations will have an impact on the wake field, which determines to a certain extent the design envelope of the propeller with respect to cavitation behaviour and pressure pulses. Another important parameter, with respect to fuel efficient designs, is the selection Fig. 8 - Numerical flow simulation of a vessel with FPP and EnergoPac rudder. in detail 59
![[ MARINE / IN DETAIL ] [ MARINE / IN DETAIL ] Wärtsilä s Hybrid Power System gives fuel savings and lower emissions AUTHOR: Ingve Sørfonn, Technical Director, Wärtsilä Norway AS Following the success](/docs-images/74/70023963/images/58-0.jpg "of the new energy system onboard Eidesvik s offshore supply vessel the Viking Lady, Wärtsilä, Eidesvik and DNV have taken the FellowSHIP project to a new stage that makes this the world s first OSV")
58 [ MARINE / IN DETAIL ] [ MARINE / IN DETAIL ] Wärtsilä s Hybrid Power System gives fuel savings and lower emissions AUTHOR: Ingve Sørfonn, Technical Director, Wärtsilä Norway AS Following the success of the new energy system onboard Eidesvik s offshore supply vessel the Viking Lady, Wärtsilä, Eidesvik and DNV have taken the FellowSHIP project to a new stage that makes this the world s first OSV with a hybrid system, including dual-fuel (DF) engines, an energy storage system and a fuel cell energy source. 60 in detail This latest stage of the demonstration project has given the Viking Lady energy storage capability in the form of a battery test pack, which has received formal acceptance from DNV. Wärtsilä s contribution to the FellowSHIP Hybrid project is the development of the DC inverter systems, the hybrid control, battery package and systems, as well as the integration of the onboard systems. The integrated onboard system has now been in operation for eight months, and a final measurement programme was executed this spring to verify the fuel savings and emissions to air. The result is in line with the expectations, giving annual fuel savings of about 15% and a substantial reduction in emissions. This is achieved through more efficient and smoother operation of the engines and their use as a redundant source of power.

59 WÄRTSILÄ TECHNICAL JOURNAL Fig. 1 - A typical hybrid system configuration. In harbour, the ship will at a later stage be able to operate on fuel cell and battery power alone, thereby significantly reducing emissions in environmentally sensitive areas. Additional benefits are derived from a reduction in machinery maintenance costs, noise and vibrations. Hybrid power systems Configuration Hybrid power systems combine different power sources with energy storage devices. The selection and integration of energy storage devices is also of paramount importance in order to control network variations, resulting in smooth and uninterrupted operation. To improve the efficiency of the system further, and to allow for the new power sources and storage technologies to power the ship, a heat recovery system may utilize the high-temperature exhaust heat. The introduction of the hybrid power system and its integration with conventional diesel- or dual- fuel engine generating sets, offers a significant improvement in efficiency by running the engines at optimal load and absorbing many of the load fluctuations through batteries. The power and energy capacity of the battery should be suitable to allow the engine to run for most of the time at optimal load, thereby yielding a notable efficiency improvement for the entire system. A key element, therefore, is the control algorithms for load sharing between the units and efficient power and energy management. In the particular case of in-harbour operation, the energy storage system may be able to operate as a stand-alone unit, covering the complete energy demands of the vessel. This requires significant advances in power management and control of the hybrid system, and possibly also the harvesting of renewable energy. Control systems have to be introduced in order to derive a completely autonomous system. The electrical system must be able to maintain network frequency and voltage under variable power demand profiles, as well as supplying the necessary current during fault conditions (Figure 1). Energy storage There are a number of different technologies used for energy storage. Currently, battery technology has shown a promising development in cost and energy density, and as such is a logical choice for energy storage. Another possible technology may be double layer capacitors, if the use of the energy storage is for pure power peak shaving. Discussions on how to design the capacity of an energy storage system will depend on how the system is to be used. The design will take two main directions; either the batteries will be used as a peak shaving power source, or they will be used as the main power source for redundant operations. There is a huge difference in dimensioning the batteries as a power source versus an energy source. Batteries have improved in energy density and are a viable choice for use in energy demanding operations. Batteries can deliver large power peaks, theoretically in the 5-10C area, but will be limited by the investment of power electronics to deal with such high power peaks. For a total operation there may be a demand for both high power and energy. Many influencing factors have to be considered, such as new class rules, charging strategies including renewable and onshore power, the battery life, investment costs, and the configurations of other engine driven generating sets onboard. Peak shaving Using batteries as a peak shaving source requires a well designed control system and a good understanding of the total efficiency of a combustion engine in a variable load operation. There are many control strategies that can be implemented, depending on the use. in detail 61
![[ MARINE / IN DETAIL ] [ MARINE / IN DETAIL ] Fig. 2 - Current power and energy densities for different technologies. Fig. 3 -Li-ion batteries onboard.](/docs-images/74/70023963/images/60-0.jpg "Periodically transients may influence the fuel consumption differently according to the type of engines, and should be handled by the battery.")

60 [ MARINE / IN DETAIL ] [ MARINE / IN DETAIL ] Fig. 2 - Current power and energy densities for different technologies. Fig. 3 -Li-ion batteries onboard. Periodically transients may influence the fuel consumption differently according to the type of engines, and should be handled by the battery. When the battery system stabilises the fluctuations in engine load in a large thermal engine, this will also reduce maintenance costs over the longer term. Another control strategy is the stop/start of engines, which can be implemented in any control scheme if not running in critical operations. This will be one of the best fuel saving measures, but it requires a large energy storage capacity. Main source of power Using the battery as an energy source in addition to peak shaving requires a high degree of energy availability from the battery. The battery energy can be discharged and charged within the defined C ratings that are acceptable for the lifetime of the battery. Charging can be done using the onboard engine generating sets, or from other installations both on- and offshore. The huge difference in energy content compared with traditional fuels is the existing barrier preventing batteries being used as a main source of power in an economical way. Fuel saving potential Present day battery technology allows for their use in ships with variable load profiles as a supporting energy system with reduced loads, as when operating in ECAs and in 62 in detail harbour conditions. With the expected forthcoming rules, batteries should also be used as a main source of power in normal and critical operations. The expected fuel savings potential is between 10-20% of the yearly fuel bill depending on the type of engines and operations. Some types of operation will have a higher saving potential. The pay-back time will, in many of these applications, be between 3 and 4 years for a new build. Future development of battery technology The future of energy storage devices depends, to a large degree, on major industries such as the automotive, computer, and renewable power industries. The potential for increased power/energy density and lower costs appears to be promising. As an example, the US Department of Energy wants batteries with five times the energy storage of those we have today. They want them to be five times cheaper and to be ready in five years. Five universities have been selected, along with several national labs and private companies, to carry out this research. Today s chemical battery technology is fairly mature, and a serious competitor capable of meeting this projected timescale has yet to emerge. Exotic materials, like graphene or carbon nanotubes, are being explored as anode materials. Currently, energy storage is all about trade-offs. You can have lots of power (watts), or lots of energy (watt-hours), but you can t generally have both. Super capacitors can release a massive amount of power, but only for a few seconds. This is a problem because most modern applications require large amounts of power and energy. While waiting for the dream to be realised, Lithium-ion batteries are currently the best solution for high-power-and-energy applications. Viking Lady demonstration Installation The FellowSHIP project is a joint industry demonstration programme between Eidesvik, DNV and Wärtsilä. The 92 m offshore supply vessel Viking Lady, which is powered by four Wärtsilä 32DF dual-fuel driven generating sets, each with a capacity of 1950 kw output and running on LNG, was used as the test vessel. The onboard demonstration and installation of the fuel cell power pack were highly successful. Following this, the next step of the FellowSHIP project was to install and test an energy storage device in the form of a 442 kwh battery pack. The installation allows the benefits of a true hybrid energy system to be explored for use in the offshore supply vessel. The battery and fuel cell are connected to a separate DC switchboard, which is further connected to the existing onboard main 690V LLC switchboard. Both the batteries and the DC distribution system are installed in their respective


61 WÄRTSILÄ TECHNICAL JOURNAL containers with, as far as possible, their own utility systems for fast installation onboard. Research and development There are many areas of new research and development that have been executed as a part of the FellowSHIP programme. The most important of these are within the rules and safety systems, the battery system design and control, the inverter control, and the essential hybrid control. A complete lab test set-up has been designed in order to test the complete system before installation. Large battery systems are new to the maritime industry and new rules had to be developed for use of such systems. New class rules have been developed by DNV as a part of the project. A comprehensive measurement programme has been carried out to verify the savings potential. The hybrid system has been modeled in detail and verified with measurements. The measuring programme has been extended to continue after the installation, and different operations have been measured to compare the present way of operating the vessel with that of using the hybrid system. The testing has been performed in different weather conditions to be able to analyze the effects of savings and exhaust emissions in all conditions. Vessel operation The understanding of a vessel s operation is crucial for designing an efficient energy system. Experience shows that the energy system often operates differently than was predicted in the design phase. This may have different causes, such as the need for power reserve because of instant power peaks; operational experience from the crew; established procedures; and charter demands. It is important that the comparisons are made in relation to how the vessel is normally operated. The annual fuel savings are based on several years of logging the operational profile, divided into the following operational conditions; Harbour; Standby at the field; DP; and Transit. As a general observation, it is estimated that for 75% of the time the loading is less than 50% of the engine s capacity, and in some conditions the engine loading Fig. 4 - Battery pack installed. Fig. 5 - Operational modes. Harbour Standby DP Transit in detail 63
![[ MARINE / IN DETAIL ] [ MARINE / IN DETAIL ] Load (kw) 700 600 600 500 500 Conventional (G1) 400 400 Conventional (G4) 300 300 200 Hybrid (G4) 200 100 100 Hybrid (G4) 0 0-100 -100-200 0 Time (sec)](/docs-images/74/70023963/images/62-0.jpg "1000 0 Time (sec) 1000 Load (kw) Conventional (G1) Conventional (G4) Hybrid (G4) Hybrid (G4) Fig. 6 - DP operation in good weather. Fig. 7 - DP operation in bad weather. is as low as 10%.")
 and with the hybrid system (hybrid) during the")
62 [ MARINE / IN DETAIL ] [ MARINE / IN DETAIL ] Load (kw) Conventional (G1) Conventional (G4) Hybrid (G4) Hybrid (G4) Time (sec) Time (sec) 1000 Load (kw) Conventional (G1) Conventional (G4) Hybrid (G4) Hybrid (G4) Fig. 6 - DP operation in good weather. Fig. 7 - DP operation in bad weather. is as low as 10%. This low load loading represents about half of the annual energy consumption. Results The testing has been performed on the field in regular operation, and the tests have been run in sequence by operating as normal (conventional) and with the hybrid system (hybrid) during the same period. The discharge from the battery system has some limitations in power, and thus the total plant is not as fine tuned as it would be in a normal sized installation. Throughout the testing, the hybrid control is controlling the battery at a fixed state of charge (SOC). The total annual fuel savings, based on the actual operating profile, is in the area of 15%. Reductions in annual emissions to the air are approximately 25-30% for NO x and green house gases. Testing in DP operation Dynamic Positioning (DP) is an operational mode whereby the vessel remains in a fixed position related to an offshore unit. It involves strict requirements regarding power redundancy. Normally two or more engines have to be in operation to secure back-up power for the required load in case a fault condition occurs. Due to these requirements, the operation is not energy efficient because the loading of the engines is normally very low. However, by 64 in detail using a battery system and one engine the efficiency can be increased. The testing has been performed as a normal DP operation outside the critical operational zone. We expect that the use of batteries in this condition will be accepted shortly. Testing while waiting at the field This mode includes waiting at the field without special redundancy requirements. Normally, this mode also requires a certain level of back-up power due to peak loads from the onboard utility systems, as well as from irregular wave conditions that cause the vessel to drift. From the hybrid system point of view, this will be similar to a DP operation. A start-stop strategy may be implemented if the battery energy capacity is sufficient, which was not the case for the test installation. Testing in transit Normal transit operations involve sailing between field installations or to shore, and with variable speed conditions. The propeller is normally run in power mode, but with the battery installation the propeller was also tested in rpm mode, with a high and stable utilization of the engine. The normal operational philosophy is to have some redundancy in this mode in order to manage large instant power peaks from the onboard utility systems, which normally means that one extra engine is in operation. This will be avoided by using batteries. Fuel savings are dependent upon the engine configuration and weather conditions, and have been measured at between 5 and 20%. Testing in harbour Harbour conditions with a low demand for power may form a large part of the operational time for an offshore vessel. Harbour administration requirements make it attractive to use environmentally sound power sources, especially during overnight docking, so as to reduce emissions and lower the noise level in populated areas. Batteries with sufficient capacity, in combination with an optimized auxiliary power system, may therefore be a good choice. In this way, the engines can be shut down during the night, thus reducing both emissions and noise. During the day, the charging process will ensure efficient loading of the engine leading to reduced emissions and a more efficient operation. Charging from shore, if available, is also possible. The fuel savings depend on the battery capacity and the need for charging, but will be in the area of 25-30%. Electrical distribution In typical electrical drive systems, a classic AC distribution system is used. The engine driven generating sets are operated at a fixed frequency. Most of the drives are used mainly to control the electric motors, and

 3100 3000 2900 2800 2700 2600 2500 0 Time (sec) 300 Power mode Conventional (G2) Fig.")
63 WÄRTSILÄ TECHNICAL JOURNAL Percentage of conventional Conventional (G1) Hybrid 2GS Hybrid 1GS 0 Fuel No x CH4 Fig. 8 - Fuel and emission savings comparison in DP. Load (kw) Time (sec) 300 Conventional (G1) Conventional (G2) Conventional (G4) Hybrid (G1) Hybrid (G4) Hybrid Battery Fig. 9 - Transit in bad weather Load (kw) Time (sec) 300 Power mode Conventional (G2) Fig. 10 -Power consumption in Power and RPM modes in bad weather. The battery will facilitate the use of speed mode in this condition. in detail 65
![[ MARINE / IN DETAIL ] [ MARINE / IN DETAIL ] 690 V/50 Hz Bus A1 Bus A2 Gen 1 Battery 455 kw G Gen 2 M Thruster 1 G M Thruster 2 Buslink Bustie Gen 3 M Thruster 3 Fig.](/docs-images/74/70023963/images/64-0.jpg "11 - Electrical system on-board the Viking Lady. G Gen 4 M Thruster 4 G Bus B2 Bus B1 thus diode rectifiers are used for the input stage.")
64 [ MARINE / IN DETAIL ] [ MARINE / IN DETAIL ] 690 V/50 Hz Bus A1 Bus A2 Gen 1 Battery 455 kw G Gen 2 M Thruster 1 G M Thruster 2 Buslink Bustie Gen 3 M Thruster 3 Fig Electrical system on-board the Viking Lady. G Gen 4 M Thruster 4 G Bus B2 Bus B1 thus diode rectifiers are used for the input stage. To fulfill standards and norms with respect to harmonics in the AC grid, usually 12-pulse diode rectifiers in the power range of kw are needed in low voltage systems. Often, a 12-pulse transformer is used at the input of each motor drive. This is a disadvantage with respect to space requirements, and is detrimental to the efficiency of the drive system. To avoid transformers, Active Rectifiers can be used for the input stage. This is, however, a more costly solution if no bi-directional energy flow is required. It is possible, nevertheless, to reduce the number of transformers with the help of the patented Wärtsilä Low Loss Concept (LLC). Transformers are used for a 300 phase shift between bus-bars. It should be noted that the main power flow is not through the transformers, thereby reducing losses as well as the space required for the transformers. The Viking Lady already has a LLC configuration installed, and the new DC system is connected to one of the 690V busbar systems with an active front end solution. The battery system is connected to the DC bus via a DC/DC converter. Energy can flow to and from the 690V bus-bar by discharging or charging the batteries. Power is limited by the installed power electronics. 66 in detail Fig Typical response curves for a battery system DC system DC distribution is a natural common point of coupling in a modern hybrid system, as DC is the basic source for most modern power inverters. Energy sources and loads connected to the same DC source will reduce the number of conversion steps onboard. The bi-directional DC/DC converter controls the battery and steps up the voltage on the DC bus to the desired voltage level. A bi-directional active rectifier (AR) is connected between the DC bus and the AC network. In normal operation, this will transfer all the power between the battery and the AC grid. In a fault condition, this unit also needs to maintain the AC grid stability without inertia from the rotating generators. This will be the case also when only operating with batteries. Hybrid system control The main objective of the control system is to keep the DC-link voltage at the desired
65 WÄRTSILÄ TECHNICAL JOURNAL Power from the dc-link Power to the dc-link Fig Droop Control with respect to dc-link voltage. value, to share the load between the power generating modules, and to provide fast and stable power. The load sharing can be performed according to a pre-defined load profile to maintain maximal response capacity, or to minimize fuel costs and/or emissions. The battery system may have different control strategies depending on the best fuel efficiency control for the actual ship. Nevertheless, some basic control will be implemented, such as peak shaving, which is illustrated in Figure 12. The battery will take all load fluctuations from the load, (mainly propulsion loads) and optimize the engine operation to achieve its best performance. The control can be divided into primary control, secondary control and tertiary control. Primary Control Each inverter is controlled with some droop control of the dc-link voltage, as indicated in Figure 13. The task of the droop control is to have fast control of the dc-link, while the energy storage of the dc-link is small compared with the inertia in the power generators. An auxiliary supply system has to fulfil the requirements for frequency and voltage, as is the case with classic AC-systems. Secondary Control At this level, adjustments to the power references and droop functions can be made. This can include load sharing functions for the generators. The procedure for starting and synchronizing new units is implemented at this level as well. The communication between units and the power/energy management is carried out using a bus-system and wiring. Maximum available power for the different consumers is distributed at this level. Tertiary control This level represents the overall vessel control system, taking into account all the relevant environmental and operational conditions. The result of this control optimization is the realisation of an optimal route and ship speed. Due to forecast uncertainties, these variables have to be updated continuously. Conclusion Today, the majority of ship propulsion systems are based on diesel mechanical units. However, during the last 20 years, electrical propulsion systems have become the preferred solution in special application areas. The introduction of the Hybrid Power System is a new and attractive way of reducing both fuel and exhaust emissions. Wärtsilä has a broad offering of direct propulsion solutions and electrical solutions. It can now also offer flexible basic energy storage solutions for use in combination with the traditional means of power generation. The test results show considerable savings in fuel, and reduced emissions compared with systems currently available. The payback time is already attractive for vessels with variable load profiles, and future developments in cost and energy density will introduce this technology to numerous market segments. in detail 67

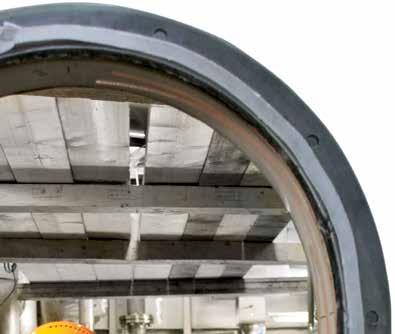
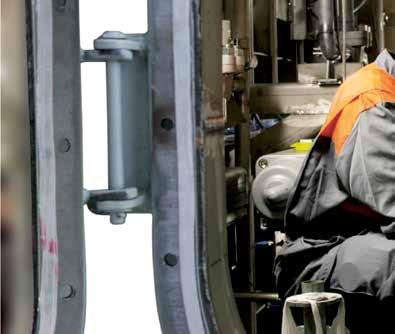


66
Adding flexibility to India s electricity system
 [ ENERGY / IN DETAIL ] [ ENERGY / IN DETAIL ] Adding flexibility to India s electricity system AUTHOR: Rajagopalan, M (Raj), Market Development Director - MEA, Wärtsilä Power Plants 10 in detail WÄRTSILÄ
Peaking & Reserve Capacity in India
 Peaking & Reserve Capacity in India POWERGEN India & Central Asia 2015 Stuti Gandotra Market Development Specialist, Middle East, Asia & Australia Wärtsilä India Pvt. Ltd. Legal disclaimer This document
Efficienza energetica, smart grid e fonti rinnovabili: la strada maestra per un Europa elettrica
 Workshop Safe 2012 Efficienza energetica, smart grid e fonti rinnovabili: la strada maestra per un Europa elettrica MARCO A.G. GOLINELLI - VICEPRESIDENTE WÄRTSILÄ ITALIA S.P.A. ROME, 6.07.2012 1 Wärtsilä
Executive summary. Value of Smart Power Generation for utilities in Australia. A white paper by Wärtsilä and Roam Consulting
 Value of Smart Power Generation for utilities in Australia A white paper by Wärtsilä and Roam Consulting Executive summary This study analyses the potential of Smart Power Generation () power plants in
Saving money and the environment with Smart Power Generation
 Saving money and the environment with Smart Power Generation CONTENT Introduction 4 Case 1: California 6 Case 2: Great Britain 8 Case 3: India 10 IEA statements of ICEs 12 The value of flexibility 14 Future
RECIPROCATING ENGINE POWER PLANTS FOR FLEXIBLE POWER GENERATION
 RECIPROCATING ENGINE POWER PLANTS FOR FLEXIBLE POWER GENERATION Polttomoottori- ja Turbotekniikan Seminaari Otaniemi 15.5.2014 Thomas Hägglund VP Power Plant Technology, Wärtsilä Corporation Power Plants
Capturing growth through global systems integration
 Energy Solutions: Capturing growth through global systems integration Javier Cavada, President, Energy Solutions, Executive Vice President 1 Wärtsilä 29 September 2016 Javier Cavada Renewables rapidly
Flexible Power Generation Enabling Wide Integration of RES
 The European Power Generation Strategy Summit & Power Project Financing and New Technologies Forum 3rd-5th December 2012 Four Seasons - Prague Czech Republic Flexible Power Generation Enabling Wide Integration
Dry Flexicycle power plants a closed loop combined cycle with unique operational flexibility
 Power-Gen Middle East 2014 Dry Flexicycle power plants a closed loop combined cycle with unique operational flexibility Mr. Risto Paldanius, Director, Business Development, Wärtsilä Power Plants Mr. Kristian
[R]enewables 24/7 EXECUTIVE SUMMARY
![[R]enewables 24/7 EXECUTIVE SUMMARY](/thumbs/91/106622492.jpg "[R]enewables 24/7 EXECUTIVE SUMMARY") [R]enewables 24/7 EXECUTIVE SUMMARY Infrastructure needed to save the climate Grids keep power systems working The electricity grid' is a collective name for all wires, transformers and infrastructure
[R]enewables 24/7 EXECUTIVE SUMMARY Infrastructure needed to save the climate Grids keep power systems working The electricity grid' is a collective name for all wires, transformers and infrastructure
The Optimal Approach to Firming Windpower
 5735 Hollister Avenue, Suite B Goleta, California 93117 T 805.683.9659 F 805.683.9671 www.gravitypower.net The Optimal Approach to Firming Windpower Summary As many regions of the world are staging massive
Anjan Kumar Sinha NTPC Ltd
 Flexibilisation of Thermal Stations-NTPC's Approach Anjan Kumar Sinha NTPC Ltd Contents Variability of Renewable Power Flexibilization: Need for Benchmarking Operationalisation of flexibility Design and
Flexibilisation Issues of Thermal Stations. Anjan Kumar Sinha NTPC Ltd
 Flexibilisation Issues of Thermal Stations Anjan Kumar Sinha NTPC Ltd India s Present Installed /Renewable Capacity Total Installed Capacity=331 GW Installed RES=60 GW (As on 31.10.2017 (As on 30.10.2017,
Table of contents. 1 Introduction System impacts of VRE deployment Technical flexibility assessment of case study regions...
 Table of contents Foreword................................................................................. 3 Acknowledgements...5 Executive summary...13 1 Introduction...21 Background...21 Context...21
SMART POWER GENERATION
 SMART POWER GENERATION ENABLING THE TRANSITION TO A MODERN, SUSTAINABLE POWER SYSTEM Electricity consumption will continue to grow rapidly all over the world during the coming decades. At the same time,
Easy Transition to Renewables
 Easy Transition to Renewables Presentation to the Australian Institute of Energy 6-11- 2017 Ben Rose WHY DOES THE WORLD NEED CLEAN ENERGY NOW? We are not doing enough to met our Paris commitments What
Flexible energy for efficient and cost effective integration of renewables in power systems
 A Wärtsilä White Paper supported by modelling conducted by Redpoint Energy, a business of Baringa Partners Flexible energy for efficient and cost effective integration of renewables in power systems 2
Smart savings for power transmission systems
 Smart Power Generation Smart savings for power transmission systems Smart savings for power transmission systems New electricity market studies show that major grid operators and power utilities can achieve
Maximising profits through efficient pulse load operation
 Best Paper Award PowerGen Asia 2015 C H R I S T I A N H U LT H O L M & J A I M E L Ó P E Z Maximising profits through efficient pulse load operation WÄRTSILÄ ENERGY SOLUTIONS Maximising profits through
RELIABILITY AND SECURITY ISSUES OF MODERN ELECTRIC POWER SYSTEMS WITH HIGH PENETRATION OF RENEWABLE ENERGY SOURCES
 RELIABILITY AND SECURITY ISSUES OF MODERN ELECTRIC POWER SYSTEMS WITH HIGH PENETRATION OF RENEWABLE ENERGY SOURCES Evangelos Dialynas Professor in the National Technical University of Athens Greece dialynas@power.ece.ntua.gr
Energy Technology Perspectives 2014 Harnessing Electricity s Potential
 The Global Outlook An active transformation of the energy system is essential to meet long-term goals. (ETP 2014) charts a course by which policy and technology together become driving forces in transforming
LIQUID AIR ENERGY STORAGE (LAES) Pumped Hydro Capability No Geographical Constraints
 Pumped Hydro Capability No Geographical Constraints") LIQUID AIR ENERGY STORAGE Large scale, Long duration LIQUID AIR ENERGY STORAGE (LAES) Pumped Hydro Capability No Geographical Constraints Stuart Nelmes Engineering Director Copyright of Highview Power
LIQUID AIR ENERGY STORAGE Large scale, Long duration LIQUID AIR ENERGY STORAGE (LAES) Pumped Hydro Capability No Geographical Constraints Stuart Nelmes Engineering Director Copyright of Highview Power
ALL ISLAND GRID STUDY STUDY OVERVIEW. January 2008
 ALL ISLAND GRID STUDY STUDY OVERVIEW January 2008 1 Study Overview The All Island Grid Study is the first comprehensive assessment of the ability of the electrical power system and, as part of that, the
The impacts of nuclear energy and renewables on network costs. Ron Cameron OECD Nuclear Energy Agency
 The impacts of nuclear energy and renewables on network costs Ron Cameron OECD Nuclear Energy Agency Energy Mix A country s energy mix depends on both resources and policies The need for energy depends
Hydrostor. Advanced Compressed Air Energy Storage (A-CAES)
") Hydrostor Terra TM Advanced Compressed Air Energy Storage (A-CAES) Hydrostor Terra is the most cost-effective and flexible bulk energy storage solution, delivering hundreds of MWs and GWhs. Low cost Lowest
Hydrostor Terra TM Advanced Compressed Air Energy Storage (A-CAES) Hydrostor Terra is the most cost-effective and flexible bulk energy storage solution, delivering hundreds of MWs and GWhs. Low cost Lowest
Technical Series, Edition 8
 Totally Integrated Power Technical Series, Edition 8 SIESTORAGE Energy Storage System a Technology for the Transformation of Energy System Answers for infrastructure and cities. Introduction: transformation
National Council on Electricity Policy Annual Meeting & Workshop Denver, CO. May 8, Jeff Bladen Executive Director Market Development
 National Council on Electricity Policy Annual Meeting & Workshop Denver, CO May 8, 2018 Jeff Bladen Executive Director Market Development Assessing the Challenge MISO region is undergoing rapid and substantial
Integration of wind and solar in power systems. Cédric Philibert Renewable Energy Division International Energy Agency
 Integration of wind and solar in power systems Cédric Philibert Renewable Energy Division International Energy Agency Electricity Security Workshop, Bangkok, 21 January 2016, Outline 1. Competitive solar
ENGINES AND STORAGE ARE UNLOCKING A 100% RENEWABLE ENERGY FUTURE
 ENGINES AND STORAGE ARE UNLOCKING A 100% RENEWABLE ENERGY FUTURE NORDEA BREAKFAST SEMINAR Javier Cavada, President, Energy Solutions & Executive Vice President 1 Wärtsilä PUBLIC 18 June 2018 Javier Cavada
2012 Grid of the Future Symposium. Evolution of the US Power Grid and Market Operations through the next Decade
 21, rue d Artois, F-75008 PARIS CIGRE US National Committee http : //www.cigre.org 2012 Grid of the Future Symposium Evolution of the US Power Grid and Market Operations through the next Decade A. OTT,
Flexibility in Indian Power System
 www.nsgm.gov.in Flexibility in Indian Power System Atul Bali, NSGM-PMU, INDIA Indian Power Sector Overview Installed Capacity 329 GW Thermal: 66.7% Hydro: 13.5% Nuclear: 2.1% Renewables: 17.7% Peak Demand
IMTE AG Power Consulting Engineers
 REMOTE AREA POWER SUPPLY Generally in many countries worldwide, most electricity is supplied by utilities or private IPPs from large central located power plants, via power supply networks called grids.
Session IV: Access to Electricity Services in Rural Areas
 Session IV: Access to Electricity Services in Rural Areas Mini Grids: Experience from India Debajit Palit Fellow and Internal Resource Advisor The Energy and Resources Institute, New Delhi Mini-Grids in
Integrating variable renewables: Implications for energy resilience
 Integrating variable renewables: Implications for energy resilience Peerapat Vithaya, Energy Analyst System Integration of Renewables Enhancing Energy Sector Climate Resilience in Asia Asia Clean Energy
TOWARDS A 100% RENEWABLE ENERGY FUTURE Roundtable B: Transforming Energy Beyond the Cheap vs Green Dilemma SIEW 2018
 TOWARDS A 100% RENEWABLE ENERGY FUTURE Roundtable B: Transforming Energy Beyond the Cheap vs Green Dilemma SIEW 2018 Name: Nicolas Leong Date: 1 November 2018 1 Contents 1. Smart energy vision executive
TECHNICAL AND ECONOMIC ANALYSIS OF THE EUROPEAN ELECTRICITY SYSTEM WITH 60% RES EDF R&D
 TECHNICAL AND ECONOMIC ANALYSIS OF THE EUROPEAN ELECTRICITY SYSTEM WITH 60% RES EDF R&D Strasbourg, 13 Septembre 2016 1 The study: how can we integrate «a lot of RES» in power systems? 60 % RES (generation)
California Grid Operations: Current Conditions and Future Needs
 California Grid Operations: Current Conditions and Future Needs Jim Detmers Vice President, Operations Global Climate & Energy Project November 1, 2007 STANFORD UNIVERSITY Our objective today is identify
Dynamic Price, Product and Messaging Specification
 1 2 3 4 5 6 7 8 Retail Dynamic Price, Product and Messaging Specification (DRAFT) Draft Memo to by Ed Cazalet on Sept 7, 2009. During the August 2nd 2009, OASIS Energy Interoperation Technical Committee
The Power of Transformation Wind, Sun and the Economics of Flexible Power Systems
 The Power of Transformation Wind, Sun and the Economics of Flexible Power Systems Federal Ministry for Economic Affairs and Energy, 1 July 2014, Berlin Main Results and Strategic Approach Ms Maria van
Energy Storage and the Built Environment. Steve Saunders Associate Director Arup t +44 (0)
") Energy Storage and the Built Environment Steve Saunders Associate Director Arup t +44 (0)113 242 8498 steve.saunders@arup.com www.arup.com the creative force behind many of the world's most innovative
Energy Storage and the Built Environment Steve Saunders Associate Director Arup t +44 (0)113 242 8498 steve.saunders@arup.com www.arup.com the creative force behind many of the world's most innovative
ENERGY TRANSITION IN KAZAKHSTAN TOWARDS 100% RENEWABLE ELECTRICITY
 ENERGY TRANSITION IN KAZAKHSTAN TOWARDS 100% RENEWABLE ELECTRICITY Dmitrii Bogdanov, Alla Toktarova, Christian Breyer Lappeenranta University of Technology, Finland 8 th Researchers Seminar Lappeenranta,
THE MOST RELIABLE, LONGEST-LASTING VANADIUM FLOW BATTERY IN THE WORLD
 THE MOST RELIABLE, LONGEST-LASTING VANADIUM FLOW BATTERY IN THE WORLD WWW.VRBENERGY.COM THE MOST RELIABLE, LONGEST-LASTING VANADIUM FLOW BATTERY IN THE WORLD ABOUT VRB ENERGY VRB ENERGY OWNERSHIP VRB Energy
MODELLING THE MARKET IMPACT OF BATTERY STORAGE IN ASIA-PACIFIC ELECTRICITY MARKETS
 MODELLING THE MARKET IMPACT OF BATTERY STORAGE IN ASIA-PACIFIC ELECTRICITY MARKETS DISCLAIMER THIS PAPER HAS BEEN PREPARED BASED ON OUR PROFESSIONAL EXPERIENCE AND INFORMATION WHICH IS AVAILABLE IN THE
Towards a sustainable Romanian energy sector: Roadmap to RES in 2030 Deloitte Romania, June 2018
 Towards a sustainable Romanian energy sector: Roadmap to RES in 2030 Deloitte Romania, June 2018 Content Background 03 1. Development scenarios 04 2. Impact & benefits 09 Key messages 12 2 Background Romania
RENEWABLE POWER GENERATION COSTS IN 2014
 RENEWABLE POWER GENERATION COSTS IN Executive Summary The competiveness of renewable power generation technologies continued improving in 2013 and. The cost-competitiveness of renewable power generation
Handout 1: Thermodynamic Resources in the 2016 IRP
 Handout 1: Thermodynamic Resources in the 2016 IRP This handout consists of a summary table that provides the Black & Veatch technical and financial parameters for resources considered in the 2016 IRP.
Tomorrow s Energy Scenarios 2017 Summary Booklet
 Tomorrow s Energy Scenarios 2017 Summary Booklet Planning our Energy Future EirGrid Tomorrow s Energy Scenarios Summary Booklet Planning our Energy Future Page 1 Introducing scenario planning At EirGrid,
Trends in renewable energy and storage
 Trends in renewable energy and storage Energy and Mines World Congress, 2017 Rachel Jiang November 27, 2017 Key trends Solar, wind may make up one-third of global electricity generation by 2040 and a growing
Methodology for calculating subsidies to renewables
 1 Introduction Each of the World Energy Outlook scenarios envisages growth in the use of renewable energy sources over the Outlook period. World Energy Outlook 2012 includes estimates of the subsidies
TECHNICAL AND ECONOMIC ANALYSIS OF THE EUROPEAN ELECTRICITY SYSTEM WITH 60% RES
 TECHNICAL AND ECONOMIC ANALYSIS OF THE EUROPEAN ELECTRICITY SYSTEM WITH 6% RES EDF R&D The full costs of electricity provision OECD NEA Paris, 2 January 216 1 System effects are strongly country specific
Profound changes underway in energy markets Signs of decoupling of energy-related CO 2 emissions and global economic growth Oil prices have fallen pre
 Keisuke Sadamori Director of Energy Markets and Security, IEA The 88th IEEJ Energy Seminar, 5th October 215 Profound changes underway in energy markets Signs of decoupling of energy-related CO 2 emissions
POWER PLANTS: POSITIONING IN THE FAST CHANGING ENERGY WORLD
 POWER PLANTS: POSITIONING IN THE FAST CHANGING ENERGY WORLD Rakesh Sarin, President, Power Plants & Executive Vice President 1 Energy market in the midst of big dichotomy GREEN EARTH The world wants More
The Role of AMI and DR in Enabling Island Renewable Integration
 The Role of AMI and DR in Enabling Island Renewable Integration Smart Metering Caribbean Miami, FL February 23, 2012 Matt Lecar, Principal Lavelle Freeman, Principal GE Energy Consulting Outline Unique
HEATWAVES AND ELECTRICITY SUPPLY
 HEATWAVES AND ELECTRICITY SUPPLY is the time of heatwaves in many parts of Australia. Hot weather places significant demand on the electricity system, increasingly so over the last decade with the increased
An ETI Perspective. Can you base a UK transition to low carbon on solar PV?
 An ETI Perspective Can you base a UK transition to low carbon on solar PV? INTRODUCTION A ROLE FOR SOLAR Could solar PV really form the basis for transitioning the UK s energy system to low carbon or is
Creating and enabling environment for Power Plant Flexibility
 Creating and enabling environment for Power Plant Flexibility Dr. Peerapat Vithayasrichareon, Energy Analyst System Integration of Renewables Grid integration of variable renewable energy Asia Clean Energy
UK Future Energy Scenarios. Richard Smith Future Transmission Networks Manager
 UK Future Energy Scenarios Richard Smith Future Transmission Networks Manager January 2012 Cautionary Statement This presentation contains certain statements that are neither reported financial results
Roadmap for Solar PV. Michael Waldron Renewable Energy Division International Energy Agency
 Roadmap for Solar PV Michael Waldron Renewable Energy Division International Energy Agency OECD/IEA 2014 IEA work on renewables IEA renewables website: http://www.iea.org/topics/renewables/ Renewable Policies
Gas-fired efficiency in part-load and pulse operation
 [ ENERGY / IN DETAIL ] [ ENERGY / IN DETAIL ] Gas-fired efficiency in part-load and pulse operation AUTHOR: Dawn Santoianni Gas-fired power plants are the most responsive and flexible generating assets
Power to Gas Innovation for the Gas Infrastructure
 Power to Gas Innovation for the Gas Infrastructure 6 th Pipeline Technology Conference 2011 Dr. Jürgen Lenz, Vice-President, DVGW Energy supply requirements are getting complicated Source: "KIC Sustainable
Residential Demand Response using a Single Variable Information System-
 Residential Demand Response using a Single Variable Information System- The Wind Number ABSTRACT Renewable energy has become cost-competitive with natural gas and coal-fired power plants as a source of
STOCKAGE HYDRO. 7 decembre 2018
 STOCKAGE HYDRO 7 decembre 2018 Storage overview A need of storage Value of pumped hydro depends on Electricity price spread for arbitrage And also Standby capacity payments Ancillary services payments
ENERGY SOLUTIONS: ENGINES AND STORAGE ARE UNLOCKING A 100% RENEWABLE ENERGY FUTURE
 ENERGY SOLUTIONS: ENGINES AND STORAGE ARE UNLOCKING A 100% RENEWABLE ENERGY FUTURE Javier Cavada, President, Energy Solutions & Executive Vice President 1 Wärtsilä PUBLIC 31 May 2018 Javier Cavada Global
84 Pathways for the GB Electricity Sector to Investment in large-scale generation capacity
 84 Pathways for the GB Electricity Sector to 2030 8. Investment in large-scale generation capacity Pathways for the GB Electricity Sector to 2030 85 SUMMARY Significant investment required to 2030, but
Capacity reserves until 2025: declining, but sufficient
 1 Capacity reserves until 2025: declining, but sufficient Trends from ENTSO-E s Scenario Outlook & Adequacy Forecast 2015 Once a year, ENTSO-E 1 publishes a Scenario Outlook & Adequacy Forecast (SO&AF).
Integrating Variable Renewable Energy into the Grid
 GREENING THE GRID Integrating Variable Renewable Energy into the Grid Key Issues and Emerging Solutions ENHANCING CAPACITY FOR LOW EMISSION DEVELOPMENT STRATEGIES (EC-LEDS) Agenda and Learning Objectives
CAISO s Plan for Integration of Renewable Resources
 CAISO s Plan for Integration of Renewable Resources July 21, 2008 CEC 33% Renewables Workshop Presented by David Hawkins Program Tracks 2008-9 CAISO Work Plan Track 1 - Develop Operational Tools Wind and
OPPORTUNITIES FOR HYDROGEN-BASED ENERGY STORAGE FOR ELECTRIC UTILITIES 1
 OPPORTUNITIES FOR HYDROGEN-BASED ENERGY STORAGE FOR ELECTRIC UTILITIES 1 T. Ramsden 2, B. Kroposki 2, J. Levene 2 Abstract One potential market opportunity for hydrogen is the use of hydrogen as an energy
Building the World's Largest Reciprocating Engine Power Plant in Jordan, 600MW
 Building the World's Largest Reciprocating Engine Power Plant in Jordan, 600MW Power-Gen Middle East, Abu Dhabi, October 2014 Al Azzam, Amani Mohamed 1 ; Koul, Upma 2 and Paldanius, Risto 3 1. Abstract
Executive summary OECD/IEA Executive Summary
 Executive summary Great efforts are being made to boost the share of renewable energy sources in the global energy mix, driven by the need for enhanced energy security and environmental protection and
FLEXILIZATION ISSUES OF THERMAL POWER PLANTS
 FLEXILIZATION ISSUES OF THERMAL POWER PLANTS Conserving Now, Preserving Future Anjan Kumar Sinha NTPC Ltd India s Present Installed /Renewable Total Installed Capacity=331 GW Capacity Installed RES=60
TRANSITION TO A 100% RENEWABLE ENERGY SYSTEM FOR NIGERIA
 TRANSITION TO A 100% RENEWABLE ENERGY SYSTEM FOR NIGERIA Ayobami S. Oyewo, Arman Aghahosseini and Christian Breyer Lappeenranta University of Technology, Finland Neo-Carbon Energy 8th Researchers Seminar,
Grid-Interactive Electric Thermal Storage (GETS) Space and Water Heating
 Space and Water Heating") Grid-Interactive Electric Thermal Storage (GETS) Space and Water Heating Paul Steffes, P.E. Steffes Corporation 3050 Hwy 22 N Dickinson, ND 58601 psteffes@steffes.com Abstract Utilities have long been
Grid-Interactive Electric Thermal Storage (GETS) Space and Water Heating Paul Steffes, P.E. Steffes Corporation 3050 Hwy 22 N Dickinson, ND 58601 psteffes@steffes.com Abstract Utilities have long been
Mapping flexibility of power systems. Roman Targosz June 29, 2015
 Mapping flexibility of power systems Roman Targosz June 29, 2015 Joint Industry Action on Energy Efficiency Coalition: General advocacy to raise the profile of energy efficiency in EU Policy Represents
FUTURE AT FULL POWER
 1 st National Conference on LNG for Transport Italy and the Mediterranean area FUTURE AT FULL POWER Marco A.G.Golinelli Vice President, Power Plants Wärtsilä Italia S.p.A. Roma 11 Aprile 2013 1 Wärtsilä
Reliability and the Future of the Electricity Grid: A North American Bulk Power System Perspective
 Reliability and the Future of the Electricity Grid: A North American Bulk Power System Perspective Mark Lauby, Senior Vice President and Chief Reliability Officer North American Electric Reliability Corporation
Contribution of Renewables to Energy Security Cédric PHILIBERT Renewable Energy Division
 Contribution of Renewables to Energy Security Cédric PHILIBERT Renewable Energy Division EUFORES Parliamentary Dinner Debate, Brussels, 9 September, 2014 What Energy Security is about IEA defines energy
World Energy Scenario Current and Future Status: An Overview M. J. R. Chowdhury*, M. A. R. Sarkar
 World Energy Scenario Current and Future Status: An Overview M. J. R. Chowdhury*, M. A. R. Sarkar Department of Mechanical Engineering, Bangladesh University of Engineering and Technology, Dhaka, Bangladesh
Demand Response Association of Energy Engineers. Presenter: David Wylie, P.E. ASWB Engineering
 Demand Response 2015 Association of Energy Engineers Presenter: David Wylie, P.E. ASWB Engineering National Energy Peak Leveling Program 1977 2 National Energy Peak Leveling Program 1977 3 When Demand
1.818J/2.65J/3.564J/10.391J/11.371J/22.811J/ESD166J SUSTAINABLE ENERGY
 1.818J/2.65J/3.564J/10.391J/11.371J/22.811J/ESD166J SUSTAINABLE ENERGY Prof. Michael W. Golay Nuclear Engineering Dept. 1 Energy Supply, Demand, and Storage Planning The Example of Electricity PRESENTATION
Abstract. The renewable energy revolution
 Pumped Hydro Energy Storage and the Renewable Energy Revolution Professor Andrew Blakers Australian National University Andrew.blakers@anu.edu.au Ph 02 6125 5905 September 2015 Abstract In Australia and
Electricity generation, electricity consumption, system integration, production and consumption balance
 Prof. Dr. Andrej Gubina University of Ljubljana, Faculty of Electrical Engineering Electricity generation, electricity consumption, system integration, production and consumption balance Maribor, Slovenia,
Solar Power Realities
 Solar Power Realities Supply-Demand Characteristics, Storage and Capital Costs by Peter Lang Abstract This paper provides a simple analysis of the capital cost of solar power and energy storage sufficient
Integrating High Penetrations of Variable Renewable Generation Lori Bird and Debra Lew, NREL NCSL Webinar March 28, 2012
 Integrating High Penetrations of Variable Renewable Generation Lori Bird and Debra Lew, NREL NCSL Webinar March 28, 2012 NREL is a national laboratory of the U.S. Department of Energy, Office of Energy
Renewable Energy and the CCC Renewables Review
 Renewable Energy and the CCC Renewables Review Presentation to the EPRG Spring Conference Cambridge, 12 May 2011 Professor Michael Grubb Faculty of Economics, Cambridge University Context: a rich body
Smart Power System with Internal Combustion Engine (ICE) and Energy Storage System (ESS) as Solar Enabler
 and Energy Storage System (ESS) as Solar Enabler") Smart Power System with Internal Combustion Engine (ICE) and Energy Storage System (ESS) as Solar Enabler ENABLING SMART POWER SYSTEMS 1 Wärtsilä INTERNAL 21.12.2017 Embracing Next Generation Technologies
Smart Power System with Internal Combustion Engine (ICE) and Energy Storage System (ESS) as Solar Enabler ENABLING SMART POWER SYSTEMS 1 Wärtsilä INTERNAL 21.12.2017 Embracing Next Generation Technologies
The intelligent cooperation between consumption and generation at the heart of the Smart Grid.
 Smart Energy Demand Coalition Position Paper The intelligent cooperation between consumption and generation at the heart of the Smart Grid. The SEDC Vision: To promote the active participation by the demand
South Australia s business community is paying the price for a grid that is no longer fit for purpose.
 Executive Summary South Australia s business community is paying the price for a grid that is no longer fit for purpose. The meeting of COAG s Energy Council on 19 August must take action to start the
Renewable Technologies in the Future NEM
 Renewable Technologies in the Future NEM 100% Renewables for Australia? Dr Jenny Riesz Australian Power Institute (API) Summer School Wednesday 24 th February 2016 Who am I? Overview 100% Renewables: Worth
Reduced Network Modeling of WECC as a Market Design Prototype
 PAPER 2011GM0942 1 Reduced Network Modeling of WECC as a Market Design Prototype James E. Price, Member, IEEE, and John Goodin Abstract California s administration, legislature, and energy regulators have
Impact of innovation on renewables Integration on renewables
 16 TH ERRA ENERGY INVESTMENT AND REGULATION CONFERENCE, SEPTEMBER 25-26, 2017, ASTANA, KAZAKHSTAN Impact of innovation on renewables Integration on renewables DR. ALEXANDRE OUDALOV, MARKET INNOVATION,
Where is moving the electricity sector and how are Electric. Industry Investment Decisions Influenced by Potential
 Where is moving the electricity sector and how are Electric Industry Investment Decisions Influenced by Potential Instability in the Regulatory Environment by : G. Dodero I.P.G. Industrial Project Group
Overcoming Barriers to Flexibility in the Generation Fleet. Presented by A.K.Sinha, NTPC Ltd, India
 Overcoming Barriers to Flexibility in the Generation Fleet Presented by A.K.Sinha, NTPC Ltd, India Outline Changing Power Sector Scenario Emerging Energy Landscape in India Moving towards Green Energy.increasing
Ancillary Service. the WEM System Management. June 2018
 Ancillary Service Report for the WEM 2018-19 June 2018 System Management Important notice PURPOSE AEMO publishes the Wholesale Electricity Market Ancillary Services report under clause 3.11.13 of the Wholesale
POWER-GEN Europe 2015 Optimal reserve operation in Turkey frequency control and non-spinning reserves. By Christian Hultholm, Niklas Wägar
 POWER-GEN Europe 2015 Optimal reserve operation in Turkey frequency control and non-spinning reserves By Christian Hultholm, Content Manager, Marketing & Business Development, Power Plants Niklas Wägar
100% Fossil Free Electricity. June 27, 2018
 100% Fossil Free Electricity June 27, 2018 Current Washington Emissions Levels 100 90 +7% 80 70 60 50-82% 40 30 20 10 0 1990 2013 2050 (goal) 2016 2017 2018 2019 2020 2021 2022 2023 2024 2025 2026 2027
Group 8. Energy System Integration: New Zealand Case Study, 2030 & 2050 Futures.
 Energy System Integration: New Zealand Case Study, 2030 & 2050 Futures. Presented by: Jonathan Black Nadia Maria Salgado Herrera Aditya Kelkar (Group 8) Group 8 07.25.14 Background & Overview NZ has LOTS
Energy Storage Use Cases for Enhancing Grid Flexibility Presentation to SAPVIA Networking Event
 Energy Storage Use Cases for Enhancing Grid Flexibility Presentation to SAPVIA Networking Event Dr Peter Klein Cape Town, 28 September 2017 Email: pklein@csir.co.za Dr Tobias Bischof-Niemz Chief Engineer
Beyond LCOE: The Value of CSP with Thermal Energy Storage
 CSP Beyond LCOE: The Value of CSP with Thermal Energy Storage energy.gov/sunshot Mark S. Mehos, Program Manager, CSP NREL Discussion SunShot and LCOE Understanding the Value of CSP with Thermal Energy
CHINA 2050 HIGH RENEWABLE ENERGY PENETRATION SCENARIO AND ROADMAP STUDY. Energy Research Institute National Development and Reform Commission
 CHINA 2050 HIGH RENEWABLE ENERGY PENETRATION SCENARIO AND ROADMAP STUDY Energy Research Institute National Development and Reform Commission ENERGY RESEARCH INSTITUTE NATIONAL DEVELOPMENT AND REFORM COMMISSION