Storability of modified wet distillers grains with solubles
|
|
|
- Angelica Holt
- 6 years ago
- Views:
Transcription

1 Graduate Theses and Dissertations Graduate College 2011 Storability of modified wet distillers grains with solubles Guevara Che Nyendu Iowa State University Follow this and additional works at: Part of the Bioresource and Agricultural Engineering Commons Recommended Citation Nyendu, Guevara Che, "Storability of modified wet distillers grains with solubles" (2011). Graduate Theses and Dissertations This Thesis is brought to you for free and open access by the Graduate College at Iowa State University Digital Repository. It has been accepted for inclusion in Graduate Theses and Dissertations by an authorized administrator of Iowa State University Digital Repository. For more information, please contact
2 Storability of modified wet distillers grains with solubles by Guevara Che Nyendu A thesis submitted to the graduate faculty in partial fulfillment of the requirements for the degree of MASTER OF SCIENCE Co-majors: Agricultural Engineering and Biorenewable Resources and Technology Program of Study Committee: Thomas J. Brumm, Major Professor Carl J. Bern D. Raj Raman Daniel D. Loy Iowa State University Ames, Iowa 2011 Copyright Guevara Che Nyendu, All rights reserved.
3 ii In the light of the knowledge obtained, the happy achievement seems almost a matter of course, and any intelligent student can grasp it without too much trouble. But the years of anxious searching in the dark for a truth that one feels but cannot express, the intense desire and the alternations of confidence and exhaustion, and the final emergence into light only those who have experienced it can appreciate it. Albert Einstein
4 iii TABLE OF CONTENTS LIST OF FIGURES... vi LIST OF TABLES... ix ACKNOWLEDGEMENTS... x CHAPTER 1. GENERAL INTRODUCTION... 1 Thesis Organization... 1 Introduction... 1 Objectives... 5 CHAPTER 2. REVIEW OF LITERATURE... 7 Corn processing and refining: wet milling and dry-grind method... 7 Corn wet milling process... 7 Corn dry-grind process... 9 Grain handling and grinding Liquefaction and Saccharification Fermentation Distillation and dehydration Co-product recovery Benefits and challenges of distillers grains utilization Economics of distillers grains Distillers grains composition Demand and Utilization of distillers grains Distillers grains storage and deterioration Bagging storage Fresh piles and bunker storage... 26
5 iv Additives Characteristics of CakeGuard preservative Factors that influence distillers grains deterioration during storage Moisture and Temperature Relative humidity Microorganisms Carbon dioxide evolution as a measure of deterioration (dry matter loss) CHAPTER 3. STORABILITY OF MODIFIED WET DISTILLERS GRAINS WITH SOLUBLES Abstract Introduction Materials and Methods Results Discussion Conclusions CHAPTER 4. GENERAL CONCLUSIONS RECOMMENDATIONS FOR FUTURE RESEARCH REFERENCES APPENDIX A. STATISTICAL RESULTS APPENDIX B. MODIFIED WET DISTILLERS GRAINS WITH SOLUBLES DRY MATTER LOSS FOR 21 DAYS USING DIRECT DRY MATTER DETERMINATION METHOD APPENDIX C. EXPERIMENTAL SETUP AND COMPONENTS APPENDIX D. VISUAL OBSERVATIONS MADE DURING MODIFIED WET DISTILLERS GRAINS STORAGE... 93
6 v APPENDIX E. CARBON DIOXIDE SOFTWARE OPERATING INSTRUCTIONS
7 vi LIST OF FIGURES Figure 2.1. Wet milling ethanol process (Butzen and Hobbs, 2002) Figure 2.2. Dry-grind ethanol process (Butzen and Haefele, 2008) Figure 2.3. Wet distillers grains with solubles from dry-grind ethanol process (Erickson et al., 2008b) Figure 2.4. Modified wet distillers grains with solubles from dry-grind ethanol process (Loy et al., 2009) Figure 2.5. Dried distillers grains with solubles from dry-grind ethanol process (Loy and Strohbehn, 2007d) Figure 2.6. Dried distillers grains with solubles in pellets (Rasby and Stalker, 2009) Figure 2.7. Seasonal price index of DDGS from 2003 to 2007 with cattle-on-feed by for the US ([AMS & University of Nebraska-Lincoln], [Waterbury and Mark, 2008] and [Erickson et al., 2008a]) Figure 2.8. Deteriorated surface of bagged modified wet distillers grains with solubles (Strohbehn et al., 2008b) Figure 2.9. Split silo bag containing wet distillers grains due to compaction (Erickson et al., 2008a) Figure Wet distillers grains with soluble ensiled with straw in a bunker (Loy et al., 2009) Figure Modified wet distillers grains with solubles piled on field (Loy et al., 2009) Figure 3.1. Schematic diagram of conventional dry grind ethanol production from corn (Liu, 2011)
8 vii Figure 3.2. Spongy kitchen scrubber placed between MWDGS samples in glass column Figure 3.3. Environmental chamber showing the arrangement of the glass columns containing modified wet distillers grains with solubles Figure 3.4. Schematic diagram of carbon dioxide evolution monitoring system Figure 3.5. Effects of temperature and preservative treatment interaction on modified wet distillers grains with solubles treated with 0.1% (w/w) CakeGuard preservative at 10 o C, 20 o C and 30 o C Figure 3.6. Effects of preservative and temperature on modified wet distillers grains with solubles dry matter loss (DML) for 21 days with DML for each repetition and mean DML for the repetitions Figure 3.7. Dry matter loss rates in untreated and preservative treated stored modified wet distillers grains with solubles as a function of temperature for 21 days Figure B1. Diagram showing carbon dioxide measurement setup Figure B2. Rosemount gas analyzer, flow meter, stacks of manifolds and condenser components of carbon dioxide measurement setup Figure C1. Day 0; samples stored at 10 o C Figure C2. Day 7: samples stored at 10 o C Figure C3. Day 14: samples stored at 10 o C Figure C4. Day 21: samples stored at 10 o C Figure C5. Day 0: samples stored at 20 o C Figure C6. Day 7: samples stored at 20 o C Figure C7. Day 14: samples stored at 20 o C
9 viii Figure C8. Day 21: samples stored at 20 o C Figure C9. Day 0: samples stored at 30 o C Figure C10. Day 7: samples stored at 30 o C Figure C11. Day 14: samples stored at 30 o C Figure C12. Day 21: samples stored at 30 o C
10 ix LIST OF TABLES Table 3.1. Percent dry matter loss in CakeGuard preservative treated and untreated modified wet distillers grains with solubles after 21 days of storage
11 x ACKNOWLEDGEMENTS I was blessed with the guidance of Program of Study committee of distinguished members in their field of education. I will forever remain grateful to each of them; Dr. Thomas J. Brumm, Dr. D. Raj Raman, Dr. Carl J. Bern, and, Dr. Dan Loy for their dedication, encouragement, cooperation and assistance through my academic program. I thank you all. I am enormously grateful to Dr. Brumm who not only served as my major professor but supported me throughout my program and thesis. I attribute the level of my Master of Science degree to his inspiration, encouragement and effort; my heartfelt thanks. Dr. Raman, I will forever remain indebted to you for recommending me to Dr. Brumm. You have offered me much support, advice and insight throughout my work; thank you very much. Dr. Bern, my sincere appreciation for your valuable assistance especially when one of the environmental chambers broke down during the course of usage. Special thanks to Dr. Loy for his readiness and willingness to answer my questions. I would like to acknowledge Dr. Philip Dixon and his student Allan for their input on my experimental design and statistical analysis. Many thanks to Lincolnway Energy, west of Nevada and Alltech Inc. for their willingness to supply distillers grains and CakeGuard preservative respectively for this study. I am grateful to my family and friends for their encouragement and camaraderie. Well done! Bernardo del Campo, we made the respirometer work! Thank you for a head start on its operation.
12 1 CHAPTER 1. GENERAL INTRODUCTION Thesis Organization The study contained in this thesis is structured into four chapters. The first chapter presents a thesis organization and comprehensive introduction. The second chapter contains a review of literature. The third chapter contains a paper entitled Storability of modified wet distillers grains with solubles that is organized to meet the Journal of Stored Products Research publication requirements. The fourth chapter contains general conclusions. Introduction The negative environmental impacts of fossil-based fuels have drawn significant attention to renewable fuels, especially ethanol (Chisti, 2008). The demand for ethanol fuel as an alternative to and additive for fossil fuels has seen dramatic increase in the last decade. The primary feedstock for ethanol in the United States is corn (Biswas and Staff, 2001). Other potential feedstock such as sorghum, barley, wheat, rye and, cereals (Staff, 2010) are also used for ethanol production. The most common resultant co-product from processing these crops is distillers grains. Ethanol plants consider distillers grains as a significant source of revenue through export and sale as a local feed. Profits from distillers grains contribute about 10 to 40% of an ethanol plant s entire revenue stream, depending on distillers grains sale price, corn feedstock price, natural gas price and other market conditions (Rosentrater and Kongar, 2009). In addition, distillers grains potential as lignocellulosic raw material (Noureddini and Byun,
13 2 2010) for biofuels might create a blossoming demand therefore maximizing the competitiveness and marketability of the co-product in the domestic and international market. Generally, various starch-based crops are grown for ethanol but the most dominant source of starch is corn. Corn accounts for more than 90% of total ethanol production and most widely produced feed grain in the United States (USDA, 2010). US corn production is estimated to reach a record of 14.9 billion bushels in 2010 to 2011(Glauber, 2010). It is anticipated that by 2015, the portion of corn used for ethanol production will rise from its current value of 12% to 23% ([Runge and Senaure, 2007] and [Luchansky and Monks, 2009]). Commercialization of corn ethanol is possible because of vast knowledge of processing methods, infrastructure, economics and efficiency relative to other types of biomass. In 2009, the U.S. ethanol industry exported 8 million Mg (1 Mg = 1 metric ton = 1 tonne = 1000 kg) of distillers grains worth $1.6 billion (RFA, 2011b). China, Japan, Canada, Turkey and Mexico are among the top importers of distillers grains (Fox, 2009). China is currently the world s largest producer of meat for their internal markets and huge meat import from Canada (AAFC, 2010). These countries therefore have high demand for livestock feed such as distillers grains. Primarily, there are two techniques for producing fuel ethanol using corn grain: wet mill process and, dry-grind process (Rosentrater and Kongar, 2009). The major differences between the processing methods are the techniques used for extracting starch, their respective products and, co-products. The wet mill process is more versatile than the dry milling process (Dale and Tyner, 2006); but to achieve this versatility, wet mills are more capital and resource intensive (Rosentrater and Kongar, 2009). Conventional wet milling is a complex
14 3 process designed for the recovery and purification of starch and several co-products: germ, gluten, fiber and steep liquor (Ramirez et al., 2008). On the other hand, the dry-grind ethanol process is relatively simple (Klopfenstein et al., 2007), resulting in comparatively low investment and operational cost, yet achieving high ethanol yields (Rausch and Belyea, 2006). Therefore, dry-grind processing rapidly gained prevalence in the ethanol industry and accounted for 82% of the entire industry (RFA, 2007). The dry-grind process produces ethanol, distillers grains and carbon dioxide. The dry-grind production consist of a relatively simple sequence of operations, including grinding, cooking, liquefying, saccharifying, fermenting and distilling (Rosentrater and Kongar, 2009). Distillers grains are co-products from ethanol production, with corn being the main feedstock in the Midwestern region of the United States (Birkelo et al., 2004). These feeds are rich in nutrient content (Rosentrater et al., 2005) because remaining nutrient after starch extraction is concentrated threefold in into the co-product (Klopfenstein et al., 2007). Distillers grains as feed are an economical source of both protein and energy (Klopfenstein, 1996). The abundance, nutritional profile, and favorable price of distillers grains has given cattle feeders the option to consider distillers grains as a feed source (Kinman et al., 2011). Livestock such as cattle, pigs, horses, sheep, goat, poultry and even pets have distillers grains inclusion in their feed. In the Midwest of the United States, distillers grains are a common feed input for beef and dairy cattle that is considered to effectively improve cattle performance and operation profitability (Klopfenstein et al., 2007). Farm operations that include distillers grains in their feed attested that livestock performance on distillers grains outweighs other feeds such as corn. Cows fed distillers grains are found to have greater feed efficiency, higher milk yield and maintained milk
15 4 component concentration (Anderson et al., 2006). Inclusion of distillers grains in diets fed to pigs may also improve immune system activation (Stein and Shurson, 2009). Moreover, the wet form of distillers grains are rich in protein and energy relative to corn thus an excellent feed source for feedlot cattle (Schoonmaker et al., 2010). Extensive research dating back to the 1980s has demonstrated the effectiveness of wet distillers grains as a protein and energy supplement in feedlot diets ([Farlin, 1981], [Firkins et al., 1985] and [Schoonmaker et al., 2010]). Despite the benefits derived from these co-products, wet distillers grains limitations typically have the tendency to deteriorate (dry matter loss) within a short time during storage. Nevertheless, research has suggested that high moisture distillers grains have higher energy value per unit dry matter than dried distillers grains (Loy and Strohbehn, 2007c). Traditionally, wet distillers grains are dried. This drying process, however, increases the energy costs incurred by the ethanol plant and may produce changes that reduce its nutritional value (Kinman et al., 2011). Several studies have been conducted to find suitable storage method for wet distillers grains so that the negative impacts of drying can be avoided. Chemical preservatives methods of retarding deterioration in wet distillers grains during storage is increasing in recent years. Among these chemical preservatives, CakeGuard (Alltech Inc., USA) is the most common. This commercial product is suggested to reduce storage losses of wet feeds (Sommerfeldt, 2011). In literature, shelf-life is widely used to describe storage time or storage life of wet distillers grains but unfortunately, this term is a misnomer. Storage life is a more appropriate term to describe the period of distillers grains storage. Storage life of wet distillers grains describes the allowable storage time when freshly discharged distillers grains are stored until
16 5 significant dry matter is lost and regarded unsafe or unusable for feeding and blending. Significant because currently, no acceptable level or standard exists to describe deteriorated wet distillers grains safe feeding. Loss of dry matter (deterioration) is important because the wet feed prices are based on dry matter. Shelf-life which is commonly used in literature refers to feed quality. Wet distillers grains that has reached its shelf-life might still be safe, but quality can no longer be assured. Also, shelf-life is used to describe the quality of food for human consumption. On the other hand, both terms (storage life and shelf-life) are used interchangeably, however clear distinction is necessary to avoid misinterpretation. Wet distillers grains storage loss could affect negatively the overall revenue generated by an ethanol plant and end user. Loss of this wet feed means loss of money and valuable resource. The likelihood of feeding or blending spoiled and contaminated distillers grains (e.g., mycotoxins) is also high which could inevitably end up in livestock product meant for human consumption. To enable storage loss prediction and retardation, it has become imperative to study wet distillers grain deterioration. The study of deterioration will serve as an acceptable measure to guide ethanol producers and end users as to when feed quality will be reduced or become unusable. Objectives The objective of this study was to determine the effect of CakeGuard preservative and temperature on modified wet distillers grains with solubles dry matter loss (as estimated by carbon dioxide evolution) during storage. Consequently, the hypotheses tested in this study were: 1) there is no CakeGuard treatment effect on modified wet distillers grains with
17 6 solubles dry matter loss during storage and, 2) there is no temperature effect on modified wet distillers grains with solubles dry matter loss during storage.
18 7 CHAPTER 2. REVIEW OF LITERATURE The livestock feed industry has seen dramatic change due to increased supplies of feed (co)products such as distillers grains as a result of recent growth in the corn-ethanol industry in the United States (Hubbard et al., 2009). The supply of distillers grains from ethanol production creates tremendous opportunities as a potentially cheap and viable feed for livestock producers, particularly those in the beef and dairy industries (Buckmaster et al., 2008). Thanks to the high demand for protein both domestically and internationally. Distillers grains as a feed input for livestock may continue to gain significant importance if global patronage continue to rise. Corn processing and refining: wet milling and dry-grind method Ethanol production from grains yields various byproducts and co-products that are recovered and fed to cattle ([Schingoethe, 2007] and [Sasikala-Appukuttan et al., 2008]). At present, corn is the primary grain for ethanol production in the United States because of the high starch content, approximately two-third of a kernel (Loy and Miller, 2008). Processing a unit mass of corn into ethanol yields the following products (on an approximate equal mass basis): ethanol, distillers grains, and carbon dioxide (Saunders and Rosentrater, 2009). Generally, there are two techniques for producing fuel ethanol using corn grain: wet mill process and dry-grind process (Rosentrater and Kongar, 2009). These are detailed below: Corn wet milling process Wet mills are typically larger (Loy and Miller, 2008). The corn wet milling process (Figure 2.1) is very complex and produces a variety of products and co-products. The
 corn, processed into variety of products intended for human use (Klopfenstein et al., 2007). Figure 2.1.")
19 8 individual kernels of corn are fractionated into components; starch, germ cake, fiber, gluten meal, crude oil and solubles (Gulati et al., 1996). Usually wet milling process requires highquality (No.2 or better) corn, processed into variety of products intended for human use (Klopfenstein et al., 2007). Figure 2.1. Wet milling ethanol process (Butzen and Hobbs, 2002). In wet milling, corn is first cleaned to remove foreign material (sand, weeds, pieces of cob, and other cereal grains) and broken corn kernels ([Blanchard, 1992], [Johnson and May, 2003], [Watson and Eckhoff, 2004] and [Singh and Johnston, 2004]). The cleaned corn is then steeped with the objectives of softening the corn kernel, reducing or inhibiting the activity of undesirable microorganisms, and to assist in pure starch recovery ([Bartling, 1940]
20 9 and [Jackson and Shandera Jr, 1995]). Steeping is important because it plays an overall role in the efficiency of the wet milling process (Pérez et al., 2001). Following the steeping process, kernels are then fractionated into kernel components of corn bran, starch, corn gluten meal (protein), germ, and soluble components corn (Klopfenstein et al., 2007). Wet milling produces corn gluten feed, corn gluten meal, and starch slurry (Ramirez et al., 2008) as the major feed products. Corn dry-grind process The corn dry-grind process is commonly referred to as the dry milling process (Kim et al., 2008a). This method is the most widely used in the U.S. for ethanol production (Kwiatkowski et al., 2006) with an annual production capacity of 50 billion Liters (13.23 billion gallons) (RFA, 2011a). The advantages of this processing technique include; low capital and energy investment costs (Rodríguez et al., 2010), relatively simple process (Rausch and Belyea, 2006) and high value co-products. Dry-grind process is designed to subject the entire corn kernel to fermentation (Rausch and Belyea, 2006) with the objective of maximizing the capital return per gallon of ethanol (Bothast and Schlicher, 2005). In a dry-grind mill, the resultant feed co-products are distillers grains, distillers solubles and distillers grains plus solubles (Klopfenstein et al., 2007), which are excellent sources of supplemental proteins in livestock feed (Kim et al., 2008a). The nutrients in the corn kernels are concentrated threefold in the distillers grains (Klopfenstein et al., 2007). Apart from ethanol and co-product, carbon dioxide produced can be used for food processing or industrial purposes (Bothast and Schlicher, 2005). The major steps in the dry-grind ethanol

21 10 process (Figure 2.2) include; grain handling and milling, liquefaction and saccharification, fermentation, distillation and dehydration; and co-product recovery (Dale and Tyner, 2006). Figure 2.2. Dry-grind ethanol process (Butzen and Haefele, 2008). Grain handling and grinding Dried kernels brought into the plant are examined for quality. Following the quality examination the entire corn kernel (germ, endosperm and pericarp) is ground into a coarse flour through hammer mill (Bothast and Schlicher, 2005). The granular material is mixed with water to form slurry (Singh and Johnston, 2004). The slurry is commonly referred to as mash (Butzen and Haefele, 2008). The grinding increases the surface area of the corn, exposing starch and allowing more efficient hydrolysis to occur (Dale and Tyner, 2006).
22 11 Liquefaction and Saccharification At this stage, the slurry is cooked with enzymes at approximately 160 o C using pressurized steam to break down the crystalline structure of starch granules (Singh and Johnston, 2004). Amylase (alpha-amylase) enzyme is added to break down starch polymers into short chain molecules (Singh and Johnston, 2004). The slurry is gelatinized by the alphaamylase; a process referred to as liquefaction (Kim et al., 2008a). The slurry is further saccharified; hydrolysis of glucose using enzyme (Wang et al., 2007). Corn starch is made up of individual units of glucose, linked together in chains by alpha-1, 4 and alpha- 1, 6 linkages (Bothast and Schlicher, 2005). Dale and Tyner (2006) described the role of enzymes in dry-milling as; alpha amylases as endozymes (enzymes that cause hydrolysis to occur randomly) that cleave alpha- 1, 4 linkage hydrolyzing starch solutions into dextrin solutions. Gluco-amylase however consists of several different kinds of enzymes including: alpha-amylases, cellulases, and proteases. Gluco-amylase are exoamylytic (cleaves molecules in a stepwise manner) cleaving alpha-1, 4 and alpha-1, 6 linkages. Starch hydrolysis can be done using acid or enzymes. Acid hydrolysis is a random cleaving of the alpha-1, 4 and alpha-1, 6 linkages in starch over time ([Alexander, 1994] and [Dale and Tyner, 2006]). The acid hydrolysis reaction that occurs is: (C 6 H 10 O 5 ) n + H 2 O (H+) C 6 H 12 O 6 The enzymatic reaction is same as acid hydrolysis but an increased concentration of fermentable sugars are achieved. The enzymatic reaction that takes place and forms the basis of dry-grind ethanol process described is shown as:
23 12 (C 6 H 10 O 5 ) n + H 2 O (Alpha- + Gluco-amylase) C 6 H 12 O 6 The slurry is then held at an elevated temperature (~85 o C) for a short period of time, and cooled to approximately 32 o C (Berger and Singh, 2010). Cooking the slurry is either done using the traditional batch cooking or continuous method which is more energy efficient compared to the later (Butzen and Haefele, 2008). After saccharification process, the glucose rich stream is transferred to a fermentation vessel for yeast fermentation into ethanol (Kim et al., 2008a). Fermentation The fermentation of glucose into ethanol (alcohol) is achieved using yeasts called Saccharomyces cerevisiae (Butzen and Haefele, 2008). The yeasts, a type of fungi are able to metabolize glucose, disaccharides and trisaccharides for cell growth, repair, reproduction and alcohol production (Dale and Tyner, 2006). The fermentation process takes hours in batch or continuous fashion with a final concentration of 10-12% (Bothast and Schlicher, 2005). Ethanol production from glucose is represented by the following equation (Singh et al., 2001): C 6 H 12 O 6 + H 2 O + Yeast 2CO 2 + 2C 2 H 5 OH + H Heat The resulting mixture after fermentation is called beer, which consists of ethanol, water, and solids that were not fermented (Rausch and Belyea, 2006). The fermentation process yields ethanol and carbon dioxide (CO 2 ). CO 2 produced is captured upon degasification and sold as a by-product or released into the atmosphere (Dale and Tyner,
24 ). The beer is fed to a system consisting of two distillation columns and a stripping column (Singh et al., 2001). Distillation and dehydration Distillation is the process of separating the ethanol from the solids and water in the slurry (Butzen and Haefele, 2008). Fractional distillation is used to separate the various components of the slurry based on different boiling points. The resulting beer is flushed to separate the carbon dioxide (Singh et al., 2001). Through controlled sequential evaporations, condensations, re-evaporations, and re-condensations the ethanol content in the vapor is concentrated to higher levels (Dale and Tyner, 2006). After distillation, the mixture is dehydrated to create fuel-grade ethanol (Bothast and Schlicher, 2005). Usually, conventional distillation/rectification methods can produce 95% pure (190 proof) ethanol (Butzen and Haefele, 2008). The 5% remaining water is removed using modern technology through molecular sieve system to produce absolute (100% or 200 proof) ethanol (Bothast and Schlicher, 2005). The final ethanol output is consumable therefore, it is denatured using gasoline to render it undrinkable (Butzen and Haefele, 2008). Co-product recovery Following distillation, the remaining alcohol-free slurry containing non-fermentable portions of the corn (protein, fat and fiber), along with yeast and other chemicals added to the fermentation (e.g., micronutrients and antibiotics) are collected from the distillation base and referred to as whole stillage (Singh and Johnston, 2004). Whole stillage is centrifuged to produce wet distillers grains (high density portion) and thin stillage. Using an evaporator, thin stillage is concentrated to form distillers syrup (Rausch and Belyea, 2006) or condensed

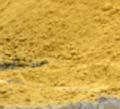
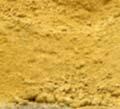
25 14 distillers solubles (Ganesan et al., 2006) or simply solubles. Solubles, the term that will be used in this work is a viscous, low-solid and high protein co-product stream which can be blended with wet distillers grains or dried distillers grains (Belyea et al., 1998). For every bushel of corn, 17 pounds of DDGS (1 pound = kg) are generated via the dry-grind process (Bothast and Schlicher, 2005). Commonly, ethanol plants may mix the syrup with the wet grains to form wet distillers grains with solubles (WDGS) (Figure 2.3) also called wet cake (Dale and Tyner, 2006). Figure 2.3. Wet distillers grains with solubles from dry-grind ethanol process (Erickson et al., 2008b). WDGS are approximately 65-70% moisture content (Erickson et al., 2008a). WDGS can be partially dried to ~50% moisture content (Schuster, 2011), called modified wet distillers grains with solubles (MWDGS) (Figure 2.4) or 10% moisture content called dried distillers grains with solubles (DDGS) (Erickson et al., 2008a) shown in Figure 2.5.


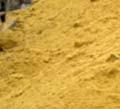

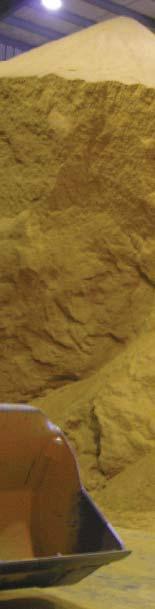
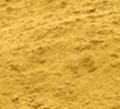
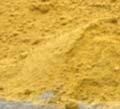

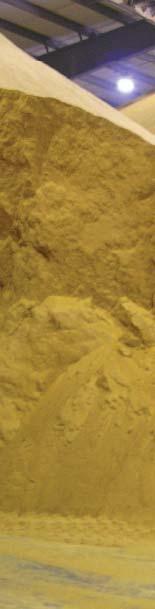
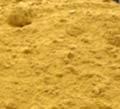

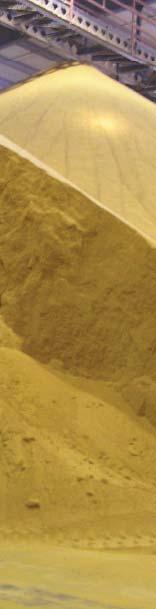
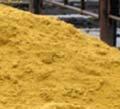
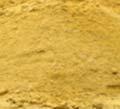

26 15 Figure 2.4. Modified wet distillers grains with solubles from dry-grind ethanol process (Loy et al., 2009). Figure 2.5. Dried distillers grains with solubles from dry-grind ethanol process (Loy and Strohbehn, 2007d). Recently, DDGS pelleting technology is another preservation method used in the ethanol industry. Pelleting is suggested to reducee shipping cost (both direct and indirect) by 89% and
.")
.The size of DDGS cubes shown below iss 0.")


.")


.")
27 16 sale cost by 96% (Rosentrater and Kongar, 2009). DDGS can also be compacted into cubes (Figure 2.6).The size of DDGS cubes shown below iss m (0.75 in). Figure 2.6. Dried distillers grains with solubles in pellets (Rasby and Stalker, 2009). Benefits and challenges of distillers grains utilization The benefits of using WDGS such as high metabolizablee energy, lower cost per unit dry matter compared to DDGS are many however, and transportatio n costs (Klopfenstein, 1996). High two major drawback exist: deterioration nutrient levels and highh moisture of the wet co-product promotes rapid deterioration. Transporting of water raises transportationn cost since less dry matter is moved per unit total mass moved. The various forms of distillers grains come with their unique merits and demerits. Moreover, studies have shown that the metabolizable energy value of distillers grains aree consistently higher than that of corn (Trenkle, 2008). Klopfenstein (1996), found that the metabolizable energy value of wet distillers co-products was 132 to 174% that of corn when 40% dry matter was used for finishing cattle whereas the metabolizabl le energy value of DDGS was 130% that of corn.
28 17 Studies conducted by Erickson et al., (2005), there was 15 to 25% improvement in feed efficiency when 30 to 40% of corn grain was replaced with wet distillers grains. They found that the metabolizable energy value of wet distillers grains for finishing was 140 to 150% that of corn when medium levels (average of 17% of diet DM) was used and 130% of corn with 40% of DM. DDGS are available throughout the year because they are easy to transport and have longer storage life due to less moisture content (Rosentrater and Kongar, 2009). High moisture WDGS are limited to short distances by transportation costs and have very short storage life. Protein destruction due to heat from drying is of great concern in DDGS compared to WDGS (Kaiser, 2008). Drying WDGS into DDGS denatures proteins and carbohydrate therefore reducing nutritional compositions (Ham et al., 1994) and energy content (Weiss et al., 2007). WDGS are highly palatable and they condition diets that are dry by maintaining homogeneity of feed particles (Kalscheur and Garcia, 2011). Other benefits of WDGS includes: lower cost per unit DM, higher energy concentration, mix well into a total livestock rations and moisture of the wet feed can reduce sorting when fed to cows (Weiss et al., 2007). Economics of distillers grains Distillers grains have become an important part of the ethanol plant profitability. However, the available supply and cost of competing commodity protein sources primarily corn, soybeans, and soy meal influence the market price of distillers co-products (Bothast and Schlicher, 2005). Some of the factors that heavily affect decisions relative to co-product feed pricing and inclusion rates include nutrient value of feeds, nutrient value of competing
29 18 feeds, consistency of product, reliability of supply, transportation, consistency of pricing and storage losses (Loy and Strohbehn, 2007b). The price of the co-products are affected by moisture change since, water is regarded as insignificant in value. Fuel energy is required to dry WDGS to DDGS, therefore wet distillers co-products has been studied as a means of reducing energy and economic cost because of lower prices (Klopfenstein, 1996). As at June 2011, the average prices for distillers co-products per Mg (1 ton) basis were; WDGS: ~$77, MWDGS: ~$102, DDGS: ~$210, corn gluten feed CGF (wet): ~$72, (CGF) (pelleted): ~$185 and corn gluten meal (CGM): ~$530 (Steevens and Sexten, 2011). Transportation is a significant expense associated with distillers grains and feed inclusion rates. Transportation methods include rail, unit-train, export containers, trucks and barges. The mode of transportation depends on the proximity to the ethanol plants. Cost of transportation of distillers grains also depend on the form that is moved from one point to another. Typically, the transportation price of WDGS is higher due to higher moisture content (Vander Pol et al., 2006) taken into consideration how much dry matter is conveyed. Feedlots located 0 to 97 km (0 to 60 miles) from an ethanol plant feed 30% to 40% dry matter of WDGS to cattle, as the distance of feedlot increases from 97 to 161 km (60 to 100 miles), optimum inclusion ranges between 20% to 30% (Vander Pol et al., 2006). A 2004 survey of ethanol plants, showed that ethanol plants pay $30 per Mg (1 ton) to transport WDGS at a distance of 2494 km (1,550 miles) for rail ($0.0120/Mg-km or $0.0194/ton-mile) and $4 per (1 ton) for 132 km (82 miles) using trucks ($0.0303/Mgkm or $0.0488/ ton-mile, or $2.5 times more than rail) (USDA, 2004). Co-products prices may also be influenced by seasonal variations especially summer and winter (Waterbury and


.")


![, 2008a]).](/docs-images/76/73346342/images/30-16.jpg "During summer")


30 19 Mark, 2008). Seasonality price trend of WDGS and MWDGS is scanty however those of DDGS (Figure 2..7) can be applied. DDGS price trend in Figure 2.7. is a function of demand from cattle feeders (Waterbury and Mark, 2008). Figure 2.7. Seasonal price index of DDGS from to 2007 with cattle-on-feed by for the US ([AMS & University of Nebraska-Li incoln], [Waterbury and Mark, 2008] and [Erickson et al., 2008a]). During summer months feedlots are less active and this can result in lower co-product prices (Christiansen, 2009). The variation in prices is a function of the number of cattle and feed demand. Several other factors could generally influence corn co-product pricing within individual plant.
31 20 Distillers grains composition Distillers grains are rich in nutrient content (Rosentrater et al., 2005) because remaining nutrient after starch extraction is concentrated threefold in into the co-product (Klopfenstein et al., 2007). Therefore distillers grains are considered to be a good source of ruminally undegradable protein, energy, and readily digestible fiber ([Jones, 2007] and [Schingoethe, 2006]). The nutrient composition of distillers grains as with many co-products feeds, is influenced by several factors including type of grain used, grain quality, grinding procedures, extent of fermentation, drying conditions, quantity of solubles blended back with the distillers grains and particle separation (Kaiser, 2008). Studies by Buckner et al. (2008b) showed that, dry matter and sulfur content for WDGS and MWDGS varied from plant to plant greatly though protein, fat and phosphorus remain fairly correlated. Kaiser (2005), also found that there was substantial variation in WDGS composition both within and across ethanol production facilities. The texture, color and odor of distillers grains vary among different plants. Variations exists from plant to plant even within a given plant (Klopfenstein et al., 2007). According to O Connor (2007), DDGS quality is impacted by the design of the overall ethanol plant particularly; the design of the back end of the plant, centrifuges, evaporators and dryers. WDGS on average contains 31.0% crude protein, 11.9% fat, 0.8% phosphorus and 0.77% sulfur on dry matter basis (Buckner et al., 2011). Distillers grains contain large amount of neutral detergent fiber (NDF) but low amounts of lignin (Schingoethe, 2006). Highly digestible fiber (Kaiser, 2008) and fat are excellent energy sources; therefore high fat levels in WDGS is desirable unless dietary inclusion is greater than 40% to 50% of diet DM
32 21 (Buckner et al., 2008b). Mineral concentrations of wet distillers grains are usually low; example 0.11% calcium, 0.43% phosphorus, 0.18% potassium (Rausch and Belyea, 2006). The concentration of initial additives in distillers grains should inform livestock producers that mycotoxins contamination of corn is likely to have high concentration in the final co-product if present in the kernels. Mycotoxins are not degradable during the ethanol process (Garcia et al., 2008). Mycotoxins are poisonous compounds produced by molds under certain conditions (Bern et al., 2010). In addition, distillers grains in excess of minerals impact negatively on livestock performance; excess phosphorus and excess sulfur intake causes polioencephalomalacia ([NRC, 2001] and [Schingoethe et al., 2009]). Comprehensive and in-depth information on the chemical composition of distillers grains can be found in Rosentrater et al. (2005) work on ethanol processing residue properties. Demand and Utilization of distillers grains The demand for distillers grains may continually rise with increasing ethanol production. Animal producers may purchase co-products for variety of reasons. However, the primary reason is economic (Rausch and Belyea, 2006). In 2005, over 70% of Iowa feedlot were using ethanol co-products whiles 27% of the cow-calf producers were incorporating them in their rations according to a survey conducted by the Iowa Beef Center (Loy and Strohbehn, 2007a). Distillers grains has received tremendous global patronage and countries including; Ireland, United Kingdom, Canada, Spain, Mexico, China, Taiwan, Japan and South Korea are among the top importers of distillers co-product (Shurson, 2006). Kaiser (2005), reported that over 85% of U.S. fed distillers grains are consumed by dairy and beef cattle and incorporation of this feed into swine and poultry diets is increasing.
33 22 Anderson et al. (2006), observed that milk protein and fat yields were higher when lactating dairy cows were fed with WDGS and DDGS at 20% DM however, the effect of WDGS on yield was better. Results on WDGS from previous study by Schingoethe et al. (1999) showed similar trend to those obtained by Anderson et al. (2006). In general, research has shown that feeding distillers co-products results in an increase of average daily gain, feed efficiency and overall body weight and performance (Buckner et al., 2008a). Eun et al. (2009), found that the effect of low and high level of DDGS on growth performance, digestibility, ruminal fermentation and carcass characteristics of beef steers growth was higher than those fed on ordinary barley grain ration. A combination of corn coproduct feeds was observed to enhance performance in feedlot cattle. Loza et al. (2010) experimented with 0%, 10%, 15%, 20%, 25% and 30% WDGS (dry matter basis) in diets containing 30% wet CGF (DM basis), dry-rolled corn and highmoisture corn-based finishing diets for beef cattle. They observed that inclusion of 30% wet CGF in the diet increased dry matter intake, average daily gain and growth to feed ratio when compared to diets with no co-products. Greater average daily gain was obtained at 15% to 20% inclusion rates combined with 30% wet CGF hence, concluded that combination of WDGS and WCGF in finishing diets resulted in similar or improved steer performance compared to corn. Inclusion of corn co-products in livestock diet offer many feeding opportunities. New development might pave way for inclusion of distillers grains in humans diets. Liu et al. (2011) experimented on the quality of corn-bread incorporated with DDGS. They observed that moisture levels and texture were similar to corn-bread without DDGS however; DDGS-
34 23 corn-bread was slightly darker in appearance and DDGS inclusion rate beyond 25 g per 100 g DDGS showed decline in textural quality and batter elasticity. Distillers grains storage and deterioration The most important factors that greatly affect distillers grains (co-product in general) are storage methods, handling and, transportation especially with wet distillers grains (Loy and Strohbehn, 2007b). The ethanol industry and farm operations have faced many challenges storing wet distillers grains. The method of distillers grains storage depends on the form. DDGS will store well for a longer time because of less moisture compared to WDGS. The high moisture co-products will likely require large and sophisticated storage facilities to avoid exposure to weather effects, contamination and deterioration. Without proper storage, the right amount of moisture, nutrient and temperature will induce microbial activities leading to a rapid reduction of wet co-product storage life. Deterioration of food products occurs as a result of insects, microorganisms, biochemical and physical changes ([Frazier and Westhoff, 1978] and [Jayas and Jeyamkondan, 2002]). Exposure of WDGS to air promotes aerobic decomposition therefore it is important to exclude air during storage. The limitations of WDGS prohibit long distance delivery. Therefore WDGS become an alternative to farm operations close to the ethanol plants. Basically, the two major reasons why storage has become relevant for distillers coproducts are; ethanol plants prefer to deliver co-product semi-load quantities making it difficult for smaller feedlots to completely utilize in a short time and farm operations may want to use WDGS and MWDGS on seasonal basis due to price fluctuation (Erickson et al., 2008a).
.")
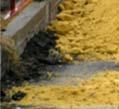
35 24 Studies have shown that more than 34% of co-product users are willing to pay $1-$5 extra to extend storage life of co-products, 45% desire to pay more than $5 to extend storage life whereas 25% refused extra cost for storage life extension (Baskett et al., 2009). Some common storage and preservation practices include: bagging, piling and additives: use of chemical and biological preservatives (Nelson et al., 2009). Bagging storage Silage bags are commonly used for distillers grain storage and considered to be effective. Conventionally, the wet feeds are mixed or ensiled with forage materials before bagging. Strohbehn et al. (2008b) successfully stored 50.2% moisture MWDGS and WDG/dry hay (80%/20%) for 39 to 90 days respectively. Deterioration was however seen to occur at the edges in the silo bags (Figure 2.8). Figure 2.8. Deteriorated surface of bagged modified wet distillers grains with solubles (Strohbehn et al., 2008b).
 for over 122 day period. Similar work by Erickson et al.")
36 25 They also observed that after 90 days of storage, lactating cows responded well to the blended feed. Strohbehn et al. (2008a), stored 17.7% and 32.7% of MWDGS dry matter ration, in combination with haylages (hay + silage) for over 122 day period. Similar work by Erickson et al. (2008a) showed that WDGS store in bags successfully without any deterioration or compacting problems when moistures were increased by 50%. They discovered that storage of WDGS in bags under a pressure of 300 psi (1 psi = kpa) or greater can result in bag bursting (Figure 2.9). Figure 2.9. Split silo bag containing wet distillers grains due to compaction (Erickson et al., 2008a). Strohbehn et al. (2008b) suggested that bagging cost is not competitive hence the need for more cost effective storage methods. Also, sample cost calculations estimate by Waterbury et al. (2009) using Co-Product STORE; a tool designed to quantify co-product storage for two storage methods (bunker and silo bags). They found that the as-is mixture
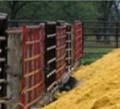
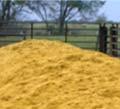
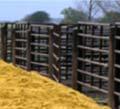
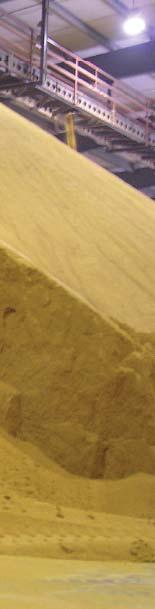
37 26 cost per Mg (1 ton) with shrink was less for bag storage than bunker storage however, the dry matter mixture cost per Mg (1 ton) with shrink was greater for silo bag storage method compared to the bunker method. It should be noted that, a typical storage method will depend on several parameters including feed costs, equipment and structure costs and, other variable costs. Fresh piles and bunker storage The most common method of storing distillers grains is heaping on fields until fed or placed in bunkers due to large quantities that cannot be bagged. Fresh pile distillers grains are either stored covered, uncovered or heaped in a bunk (Nelson et al., 2009). According to a 2009 survey by Basket et al. (2009), about 80% of co-product users in Iowa and neighboring States indicated that fresh pile is their primary method of co-product storage whereas the remaining used piles with plastic or additives, upright silos, and forage sheds or silos as wet co-product storage practices. These methods of storing wet co-product may expose the feed to all kinds of environmental conditions, thus increasing susceptibility to contamination and deterioration if not fed quickly. Studies conducted with wet distillers grains (WDG) stored in covered and uncovered bunker silo resulted in storage losses of 8.55% and 9.64% for a period of three months (Baskett et al., 2009). Erickson et al. (2008a), found that WDGS does not store properly in bunkers without forage (Figure 2.10) because high moisture content causes the pile to flow however MWDGS (Figure 2.11) will pile in bunkers without forage.


38 27 Figure Wet distillers grains with soluble ensiled with straw in a bunker (Loy et al., 2009). Figure Modified wet distillers grains with solubles piled on field (Loy et al., 2009).
39 28 Additives Additives include both biological and chemical preservatives that are commonly incorporated into wet feeds. Biological additives include; grass hay, corn stalk, wheat straw and soybean hulls. Ensiling with these biological materials is one of the options that has been successfully demonstrated ([Garcia and Kalscheur, 2004] and [Loy, 2008]). These materials are blended dry with the purpose of reducing moisture of the wet feed during storage. Schingoethe et al. (2006) combined WDGS at 0%, 15%, and 30% and soy hulls and concluded from their study that WDGS can be preserved by ensiling with soy hulls. A demonstration storage test showed that MWDGS alone did not store well as WDG/ dry hay blend. Dry matter loss due to deterioration and mold in MWDGS observed was 5.1% after 35 days (Strohbehn et al., 2008b) Furthermore, chemical additives are becoming a common practice in the ethanol industries. Preservatives added at the ethanol processing plant can extend storage life (Loy, 2008). The common chemical preservatives in the U.S. markets are CakeGuard (Alltech Inc., USA), ZeniPro (Kemin Inc., USA) and Biomin (Biomin America Inc., USA). The primary active ingredient found in these chemical preservatives is propionic acid. Chemical preservatives are noted to extend the storage life of high moisture co-products when added at the processing plant. The chemical balance and composition of most chemical preservative however will determine its potency. Trials with chemical preservatives have indicated that visually, deterioration in untreated (no preservative) distillers grains (3.1%) was greater than in distillers grains treated with preservative (1.3%) when stored outdoor in open boxes (Walker and L. A. Forster,
40 ). Similar research by (Kung, 2005), showed that preservatives are potential aerobic stabilizer of high moisture feeds. Trials at Utica Energy indicated that wet distillers grains treated with CakeGuard at a low usage rate showed increased stability to 10 to 14 days and longer stability was achieved using higher rates (Sommerfeldt, 2011). It was observed in other trials that without the presence of CakeGuard, deterioration were observed in about three days when humid, and in dry conditions deterioration observations were made about seven days. Drackley et al. (2004) studied the effect of preservative product (Zenipro) on wet distillers grains and found that there was apparent visual deterioration differences in treated and untreated (control) wet distillers grains yet, there was no clear difference in their analytical measures of yeast or mold count. In addition, they observed that treated wet distillers grains did not clump or harden. Characteristics of CakeGuard preservative In 2002, Alltech senior application specialist, Michelle Stevens, researched and developed what later became known as CakeGuard (Sommerfeldt, 2011). The commercial product; is advertised as an easy to use, highly effective preservative that protect distillers grains from losses in palatability and nutritive value caused by molds growth as well as dangers of toxicity from mycotoxins (Alltech Inc., USA). CakeGuard is marketed to extend storage life and increases marketing flexibility of distillers wet grains (Alltech Inc., USA). According to specification of the product, CakeGuard is a propionic acid-based mold inhibitor for distillers wet grains. The preservative has a ph of 5.0 and contains propionic acid, sodium benzoate, water, and potassium sorbate. It is a clear liquid with a pungent odor with a specific gravity of 1.14 g/ml. It is recommended that the product be stored in a closed
41 30 container away from heat and light. It has a life span of 36 months. The recommended dosage is 1.0 kg CakeGuard per Mg (1 Mg = 1 metric ton = 1 tonne = 1000 kg) of distillers wet grains. Factors that influence distillers grains deterioration during storage Short storage life or shelf life of wet distillers grains is the common term associated with the wet feed due to rapid rate of deterioration. In reflection, deterioration of wet coproduct is of a major concern. The mechanism of deterioration of wet co-products is not well understood however high moisture, concentrated nutrient and presence of oxygen are suggested to be the major factors that promote rapid deterioration of wet co-product. According to Fawole (1969), intrinsic biological activities like respiration and sprouting and extrinsic biological activities like mold and yeast are two factors that affect stored grain. The mechanism of deterioration is probably a complex system of interactions of microorganisms, environmental conditions and respiration of biological materials. As a result of this rationality, it has been suggested that deterioration of a biological material can only be obtained by separating microbial activities ([Milner and Geddes, 1945] and [Steele, 1967]). However, it will be impossible for biological degradation to occur without microorganisms. Research has shown that deterioration is mostly affected by moisture; temperature, microorganisms (mold and yeast) and relative humidity. Moisture and Temperature Microbial survival and activities can be influenced by moisture and temperature variations. The moisture content and temperature will influence and even direct events that occur during storage and may sometimes lead to deterioration and self-heating (Mills, 1989).
42 31 Marks and Stroshine (1995), observed that the storability of corn was reduced with high moisture content during corn storage tests. High moisture content influences the rate of deterioration of biological materials. High moisture affects grain storability whereas low moisture increases the time period for corn storage (Al-Yahya, 1996). The original condition of a material is probably the most important factor affecting it storage. The problem with moisture can be eliminated by drying however, it attracts energy cost. Relative humidity Relative humidity is the ratio of the absolute humidity of air to the maximum possible absolute humidity of that air, at the same temperature (Bern et al., 2010). This implies that, relative humidity (and therefore moisture) is dependent on temperature. An air sample with relative humidity level of 50% will increase five degrees in temperature from 25 o C to 30 o C if its relative humidity decrease to 38% however, if the temperature of the air sample is decreased five degrees, from 25 o C to 20 o C, the relative humidity level will increase to 69% (Mills, 1989). Relative humidity determines the rate of moisture lost or gained by a material thus affecting the rate of microbial activities. Biological organisms that cause stored products to deteriorate require different levels of relative humidity for normal development (Mills, 1989). Generally the level for bacteria for any stored plant material is above 90% and for deterioration molds it is above 70% (Mills, 1989). Microorganisms Microbes of different kinds under various conditions can grow on all kinds of biological substrates and contribute to deterioration. Exposure of wet distillers grains to aerobic conditions is another critical factor that affects deterioration thus storage life. Molds
43 32 may grow if under normal storage condition temperature between 68 o F (20 o C) and 86 o F (30 o C) is maintained for extended time (Garcia et al., 2008). The ideal growing condition for mold ranges between 13% to 18% moisture (Garcia et al., 2008). Yeast can grow effectively at neutral ph however yeasts are able to grow at a ph of 5 or lower and in the presence of sugars, organic acids and other easily metabolized carbon sources (Kurtzman, 2006). At sufficiently low ph, growth is stopped. Carbon dioxide evolution as a measure of deterioration (dry matter loss) All biological materials are made up of two components: water and dry matter. Loss of dry matter occurs as a result of glucose oxidation in the presence of other variables such as moisture, temperature and microorganisms (Bern et al., 2002). Carbon dioxide evolution as a result of glucose oxidation due to fungal activities represent a usable indicator for dry matter loss-dml (Bern et al., 2002). DML can be determined in two ways: indirect method by measuring evolved carbon dioxide and direct method by weight difference. Two general methods of indirect method of measuring CO 2 from grains during storage as an indication for DML exists ([Milner and Geddes, 1945] and [Fawole, 1969]). Firstly, the quantity of CO 2 generated within inter-seeds atmosphere in a sealed container for a period during storage can be measured. It is however recommended that such containment should not exceed 96 hours to prevent accumulation of quantities of CO 2 that decrease microbial activity ([Bailey, 1921] and [Fawole, 1969]). Secondly, and probably the most common, continuous or intermittent aeration is applied to seeds and the exiting air is analyzed for evolved CO 2 ([Bailey, 1921] and [Fawole, 1969]).
44 33 Steele (1967), Steele et al. (1969), Fernandez et al. (1985), Friday et al. (1989), Al- Yahya (1993), used various CO 2 evolution techniques measurement to quantify DML of stored grains. The aeration method was used by Steele (1967) on his work; deterioration of damaged shelled corn as measured by carbon dioxide production which follow previous deterioration studies on grain deterioration. Al-Yahya et al. (1993) used similar method of aeration for his work on fungicide treated high moisture corn for DML measurement. White et al. (2010), also applied the aeration method to quantify DML on ozone-treated highmoisture corn. As CO 2 evolution is an accepted tool for quantifying dry matter loss of aerobic decomposition of biological materials (Chitrakar et al., 2006), this study on storability of MWDGS followed the method of aeration to quantify DML during storage.
45 34 CHAPTER 3. STORABILITY OF MODIFIED WET DISTILLERS GRAINS WITH SOLUBLES A paper to be submitted to Journal of Stored Products Research G. C. Nyendu 1, T. J. Brumm 1, C. J. Bern 1, D. R. Raman 1, D. D. Loy 2, B. del Campo 3 1 Department of Agricultural and Biosystems Engineering, Iowa State University, Ames, IA 50011, USA; 2 Department of Animal Science, Iowa State University, Ames, IA 50011, USA; 3 Department of Mechanical Engineering, Iowa State University, Ames, IA Corresponding author: Thomas J. Brumm, 102 Davidson Hall, Ames, Iowa 50011, Phone: , Fax: , tbrumm@iastate.edu. Abstract Distillers grains, a high-quality co-product from dry-grind ethanol production processes, is widely uses as a livestock feed both locally and internationally. However, the wet form of distillers grains deteriorates (i.e., undergoes dry matter loss-dml) rapidly during storage which affects overall management and utilization. There are several active research initiatives aimed at developing alternative preservation methods to retard storage losses thus extending the wet feed storage life to meet the fundamental principle of availability of feed during scarcity. And yet, data on wet distillers grains DML is highly limited. This study investigated the effect of 0.1% w/w CakeGuard preservative (propionic acid-based) and temperature (10 o C, 20 o C and 30 o C) on modified wet distillers grains with solubles (MWDGS) DML under aerobic conditions during storage for 21 days. There was significant difference in DML with preservative treatment at 20 o C and 30 o C. Effect of temperature treatment was significant. Preservative and temperature interaction effect on DML was
46 35 significant. Treated MWDGS DML after 21 days averaged 3.12%, 16.8% and 19.3% DML whereas untreated samples averaged 3.22%, 21.4% and 28.0% DML at 10 o C, 20 o C and 30 o C respectively. Overall, the preservative helped maintain appearance and texture of the wet feed within the storage period. While further research is obviously necessary to define criteria for predicting storage losses, this study serves as a foundation for future investigations. Keywords: Wet distillers grains; Deterioration, Storage life; CakeGuard preservative Introduction Increasing demand for renewable and sustainable energy fuels has led to expanding corn-based ethanol production in the United States especially across the Midwest. Ethanol is becoming important as an alternative to fossil fuels. As a consequence, large quantities of coproducts are generated, most commonly distillers grains obtained from processing cereal grains into ethanol (Wu, 1989). Corn is the predominant feedstock for ethanol production (Kim and Dale, 2004) because on an industrial scale, it is currently the most economical feedstock that can be converted (Rosentrater et al., 2005). Feeding wet distillers grains with solubles results in better performance than dried distillers grains with solubles (Klopfenstein et al., 2007). Other benefits includes: maintain nutrients in corn growing areas, saves drying costs and promotes beef industry. Distillers grains have become the most economically attractive feed input for livestock globally. The supply of distillers grains is growing yearly. In 2010, 32.5 million Mg (1 Mg = 1 metric ton = 1 tonne = 1000 kg) of distillers grains was produced compared to 2.3 million Mg in 1999 (RFA, 2011c). Distillers grains export and domestic market contribute
47 36 substantially to the economic viability of ethanol manufacturing generally dried distillers grains account for 10 to 40% of an ethanol plant s entire revenue stream (Rosentrater and Kongar, 2009). Continuing high levels of ethanol production will make distillers grains available to the feed industry. However, availability and utilization of distillers grains are influenced by many factors including supply and demand, compositional variation, handling, transportation and storage. Although wet distillers grains are cheaper than dried distillers grains on both wet and dry matter basis, high moisture content and concentrated nutrients promote rapid deterioration (dry matter loss- DML) of the wet co-product during storage (Bern et al., 2008). These limitations engender challenges to the overall management of the wet feed and therefore affect how wet distillers grains are handled, transported, stored and how much they cost feed buyers (Mathews and McConnell, 2009). Generally, corn distillers grains are often fed wet to avoid drying costs (Birkelo et al., 2004). Therefore, information on deterioration is a priority if decreased dependence on drying wet distillers grains, which represents as much as 30% of energy cost and 50% of natural gas usage in a typical dry mill ethanol plant (Loy, 2009), is to be achieved. Distillers grains production Distillers grains are co-products from ethanol production, with corn being the main feedstock in the Midwestern region of the United States (Birkelo et al., 2004). Generally, corn can be converted into ethanol by either wet milling or dry-grind processing ([Singh et al., 2001] and [Belyea et al., 2004]) depending on the pretreatment method. Wet-mills are capital intensive (Rausch and Belyea, 2006) and are designed to produce a variety of
48 37 products, therefore the plants are complex and larger (Gallagher et al., 2005). The purpose of wet milling is to fractionate the kernel into its constituents (Jackson and Shandera Jr, 1995) which results in starch, crude oil, protein, fiber, corn gluten meal and corn gluten feed ([Voloch et al., 1984], [Ladisch and Svarczkopf, 1991], [Matz, 1991] and [Gulati et al., 1996]). Alternatively, the dry grind ethanol process is relatively simple (Rausch and Belyea, 2006), and has low capital and energy investment costs (Rodríguez et al., 2010). It is currently the predominant corn processing method in the ethanol industry. In 2006, dry grind ethanol refineries accounted for 82% of production capacity, and wet mills 18% (RFA, 2007). Dried distillers grains with solubles (DDGS) and wet distillers grains with solubles (WDGS) are the major co-products of the dry-grind ethanol facilities (Kim et al., 2008b). Corn dry-grind processing (Figure 3.1) is designed to subject the entire corn kernel to fermentation (Rausch and Belyea, 2006). Figure 3.1. Schematic diagram of conventional dry grind ethanol production from corn (Liu, 2011).
49 38 The major steps involved in the dry-grind method include dry-grinding, liquefaction, saccharification, fermentation, distillation and co-product recovery (Liu, 2011). The entire corn kernel is ground and slurried with water and alpha-amylase enzyme to form mash (Butzen and Haefele, 2008). The mash is held at an elevated temperature (~85 o C) for a short period and cooled to 32 o C (Berger and Singh, 2010). Following this step, glucoamylase enzyme and yeast are added for simultaneous saccharification and fermentation in a fermentation vessel (Berger and Singh, 2010). During this process, simple sugars are converted into ethanol and carbon dioxide by the action of yeast and heat (Kwiatkowski et al., 2006). Ethanol is recovered from the mash by distillation leaving the non-volatile components called whole stillage (Bothast and Schlicher, 2005). Whole stillage is centrifuged to produce a liquid fraction called thin stillage and a solid fraction called wet distillers grains (the high density portion) (Kim et al., 2008b). The thin stillage is processed through a series of evaporators and concentrated into condensed distillers solubles (CDS), commonly referred to as syrup (Ganesan et al., 2006). Wet distillers grains are usually blended with the syrup to form wet distillers grains with solubles (WDGS) (Kaiser, 2008). WDGS has a moisture content (all moistures are % wet basis) of about 65% and is sometimes dried to dried distillers grains with solubles (DDGS) with a moisture content of 10 to 12% with a goal of increasing storage life (Butzen and Haefele, 2008). Some ethanol plants may produce modified wet distillers grains with solubles (MWDGS) by partially drying WDGS to ~50-55% moisture (Perrin et al., 2009) or to a given moisture content upon customer request.
50 39 Distillers grains nutrient profile The resultant feed co-products: distillers grains, distillers solubles and distillers grains plus solubles from the dry-grind method (Klopfenstein et al., 2007), are excellent sources of supplemental proteins in livestock feed (Kim et al., 2008a). Distillers grains are a good source of energy, protein, fiber, and phosphorus (Schroeder, 2010) and contain an average of 31% protein, 12% fat, and 0.8% phosphorus on dry matter basis (Buckner et al., 2008b). WDGS and MWDGS, have high metabolizable energy concentration, mix well into total livestock rations (Weiss et al., 2007) and are highly palatable (Kalscheur and Garcia, 2011). They enhance feed efficiency (Vander Pol et al., 2006) and have the tendency to reduce acidosis occurrences than do low-roughage diets (Trenkle, 2008). Distillers grains storage and storage life For years, development work on wet distillers grains has been focused on methods of improving and extending wet co-products storage life. Bagging in silage bags is the conventional method for storing wet feeds (Erickson et al., 2008b). Fresh pile distillers grains are either stored covered, uncovered or heaped in a bunk (Nelson et al., 2009). Studies have shown that wet distillers grains can be successfully stored by ensiling ([Garcia and Kalscheur, 2004] and [Loy, 2008]. Treating distillers grains with chemical preservative as an alternative to other preservative methods is increasing. Johnson and Huber (1987), studied the effect of 0, 1.57%, 3.14% and 4.71% (dry matter basis) ammonia on wet distiilers grains. They observed that wet distillers grains treated with a low ammonia dosage were less stable and deteriorated faster than untreated grains. However, intermediate and high ammonia dosages reduced mold
51 40 growth and spoilage losses. Nofsinger et al. (1983) observed significant effect of sorbic acid, potassium sorbate and ammonia on wet distillers grains DML whereas propionic acid did not reduce dry matter loss. Many chemical preservatives, however, contain propionic acid as the active ingredient. Propionic acid or other organic acids may be effective in inhibiting mold growth and extending storage life of wet feeds (Uslu et al., 2009) however, scientific documentation of such results are difficult to find (Schroeder, 2010). Also, very limited published data exists on aerobic microbes suspected to catalyze spoilage of WDGS (Rosentrater and Lehman, 2008). WDGS utilization as livestock feed is increasing and becoming common, however, due to deterioration challenges, feeding of the wet co-product is limited. WDGS are usually seen to mold when exposed to air for 3 to 14 days (Erickson et al., 2008a) and typical by seven days in the tropics (Tjardes and Wright, 2002). Although creating DDGS is a solution which may increase storage life, research has shown that drying reduces energy digestibility in DDGS (Weiss et al., 2007), and heat denatures nutrients therefore reducing the feeding value of DDGS ([Klopfenstein, 1991] and [Klopfenstein, 1996]). Increased use of WDGS (versus DDGS) could reduce the overall energy cost of corn ethanol production, and subsequent environmental impacts such as greenhouse gas emissions by drying operations (Rosentrater and Lehman, 2008). Carbon dioxide evolution as a measure of dry matter loss Carbon dioxide (CO 2 ) evolution from biological materials has been studied as a useful measure of aerobic decomposition (Chitrakar et al., 2006). Various studies have established that dry matter loss as estimated by carbon dioxide emission from grains is an
52 41 indicator of deterioration ([Saul and Steele, 1966], [Steele, 1967], [Steele et al., 1969] and [Bern et al., 2002]). Data on corn DML as estimated by carbon dioxide evolution from fungal activities during storage (Saul and Steele, 1966), with results from other researchers, form the basis for an ASABE Standard for estimating allowable storage time for shelled corn based on moisture content and temperature ([Bern et al., 2002], [ASABE, 2006] and [Moog et al., 2008]). The techniques employed by these researchers involved capturing and weighing evolved CO 2 present in aeration air ([Steele, 1967], [Steele et al., 1969], [Fernandez et al., 1985], [Al-Yahya et al., 1993], [Dugba et al., 1996]) or determining CO 2 concentration evolved in aeration air ([Wilcke et al., 1993], [Ng et al., 1998] and [Chitrakar et al., 2006]). Withstanding the fact that seed grains and wet distillers grains have different physical and chemical properties (Nofsinger et al., 1983), the concept of seed grains (corn) deterioration will help elucidate and serve as a guide to study deterioration in wet distillers grains. Problem statement Wet distillers grains deteriorate rapidly therefore it is difficult to store for extended periods. The wet feed storage losses (dry matter loss) are not properly developed. It is very difficult to find scientific documentation results on wet distillers grains deterioration, thus creating a huge gap in the knowledge base. A standard on WDGS deterioration is unavailable to guide livestock safe feeding limit. Deteriorated WDGS poses a threat to livestock as it can result in off-flavors, toxins, discoloration, rotting and formation of pathogenic or allergenic
53 42 propagules ([Chelkowski, 1991], [Bigelis, 1992], [Gravesen et al., 1994], [Tipples, 1995] and [Filtenborg et al., 1996]). Predicting and retarding wet distillers grains deterioration will enable efficient utilization and thus avoiding wastage and allowing profit maximization for ethanol producers since extra cost of drying will be reduced. In addition, research on wet distillers grains DML will lead to an acceptable standard which will serve an informative tool for predicting storage losses and a measure against deterioration. Quantification of wet distillers grains dry matter loss is therefore crucial. Objectives The objectives of this study were: 1. To quantify deterioration (dry matter loss, as estimated by carbon dioxide evolution) in MWDGS during storage as a function of preservative (CakeGuard: propionic acidbased) treatment and temperature. 2. To evaluate the efficacy of the commercial product on MWDGS dry matter loss. Materials and Methods Overview An experiment was conducted to determine the effect of CakeGuard (Alltech Inc., USA) preservative and temperature on MWDGS dry matter loss during storage. 1 ml of diluted preservative was applied to 50-g samples. Treated and untreated samples were placed in autoclaved glass columns and aerated for a period of 21 days in environmental chambers set at 10 o C, 20 o C, and 30 o C. Storage temperatures were chosen to mimic environmental
54 43 conditions. The experiment was designed as a two-way factorial treatment structure with repetitions considered as blocks. Details on the procedures used follow: Sample collection A 50-kg MWDGS lot was obtained from the Lincolnway Energy ethanol plant west of Nevada, Iowa on March 3rd, 2011 as it was released from the dryer. The sample was sealed in a plastic air-tight tub and transported about 10 km (6.1 miles) back to Iowa State University and stored at 5 o C until tested. Moisture content determination Moisture content was determined using 5 g of fresh MWDGS, air-dried in triplicate for 24 h in an oven set at 60 o C (Wilken et al., 2008). The initial MWDGS moisture content was 41% wet basis (w.b.). Material preparation In this study, 15 kg of MWDGS from the 50 kg sample collected was uniformly mixed in a covered cement mixer for 15 minutes. The mixed sample was divided into eighteen 50 g sub samples and each randomly assigned to preservative treatments, 0% and 0.1% respectively. and environmental chambers set at 10 o C, 20 o C and 30 o C. The environmental chambers were also randomly assigned to temperature. Two preservative treatments; untreated MWDGS (control) and preservative treated MWDGS all in triplicate were used. The manufacturers recommended dosage for preservative application was 1 kg preservative per Mg (1 Mg = 1 metric ton = 1 tonne = 1000 kg) of wet distillers grains
 treatment level.")


 weree placed between samples in")
55 44 (Alltech Inc., USA), to achieve 0.1% (w/w) treatment level. In our case, 50 g of MWDGS was used therefore the preservative was diluted with distilledd water in the ratio of 1:50. Treated samples were prepared by evenly applying 1 ml of diluted preservative using a pipette to the individual 50 g samples. After each preservative application, the mixture was stirred immediately and thoroughly by hand for three minutes sequentially and covered to prevent moisture loss. The same amount of distilled water was added to the untreated MWDGS samples and mixed thoroughly. Experimental setup Sample storage and aeration The prepared sampless were carefully placed in individuall glass columns 1 m in length with internal and external diameter of 47.2 and 54.2 mm, respectively. Two pieces of plastic spongy kitchen scrubber (Re-think It, Inc., FL, USA) (Figure 3.2) weree placed between samples in each glass column to aid aeration andd prevent clogging which could restrict airflow. Figure 3.2. Spongy kitchen scrubber placed between MWDGS samples in glass column.
 (Figure 3.3). Figure 3.3. Environmental chamber showing the arrangement of the glass columns containing modified wet distillers grains with solubles.")
56 45 The glass columns were tightly closed with stoppers, sealed with duct tape, and mounted vertically in the 10 o C, 20 o C and 30 o C environmental chambers (Model I-35-L, Percival Scientific, Inc., Boone, IA, USA) (Figure 3.3). Figure 3.3. Environmental chamber showing the arrangement of the glass columns containing modified wet distillers grains with solubles. Tygon tubing (Saint-Gobain Performance Plastics Corporation, Akron, OH, USA), 6.35 mm internal and 9.53 mm external diameter (Figure 3.3) was connected to the inlet and outlet ports made in the stoppers at both ends of each glass columns. Two Gast models, DOA-P135-AA and ROA-P151-AA oil-less diaphragm pump (Gast Manufacturing Inc.,
57 46 Benton Harbor, MI, USA) provided airflow distribution via the glass columns at a target rate of 0.47 Std L min -1 (9.4 m 3 min -1 m -3 of MWDGS, and 11.7 cfm bu -1 by volume of MWDGS). Standard conditions were defined as 21.1 o C (70 o F) and kpa (14.7 psia, 1 bar). Airflow rates were controlled by valves connected to PM-1000 flowmeters (Matheson Instruments, Montgomeryville, PA, USA). The accuracy of airflow rates through the flowmeters were monitored by a TSI 4100 Series High Performance Linear OEM Electronic Flowmeter (TSI Inc., Shoreview, MN, USA). The exiting air from the samples was distributed and directed to a non-dispersive infrared gas analyzer using a single station, bar manifold (Model CAT N-G, Ingersoll Rand, Bryan, OH, USA) assembled as stack. Each manifold has a three-way solenoid valve. Humidification and temperature Humidification, at 100% is necessary to condition the stored samples at constant moisture content and temperature. Therefore, ambient air was drawn and bubbled through a glass column filled with distilled water connected in series to the samples. While there is no standard data on equilibrium moisture content for wet distillers grains above 40% moisture, the equilibrium moisture content for dried distillers grains with 10 to 25% solubles ranged from 23.1% w.b. to 39.8% w.b. for equilibrium relative humidities of 90% for all temperatures used in this study (ASABE, 2007). An HIH (Honeywell Inc., ) relative humidity sensor and LM 35 (National Semiconductor Corporation, USA) temperature sensors were used to monitor the
 and water produced within MWDGS samples during storage as a result of microbial respiration were carried out by the air passing")
58 47 desired levels of relative humidity and temperature respectively of air passing through the samples in each environmental chamber. Carbon dioxide production and measurement Carbon dioxide (CO 2 ) and water produced within MWDGS samples during storage as a result of microbial respiration were carried out by the air passing through each glass column. The water was allowed to condense before reaching both flowmeters and manifolds. One empty column was used to measure the ambient CO 2 to correct for CO 2 produced in the samples. The system was checked regularly for air leaks. Figure 3.4 shows the complete experimental setup of the carbon dioxide monitoring system. Figure 3.4. Schematic diagram of carbon dioxide evolution monitoring system.
59 48 A Visual Basic (VB) program with a Microsoft Access (Microsoft Corporation, Redmond, WA, USA) interface was used to control the manifolds sequentially at 5-min intervals. This allowed enough time to purge the manifold and gas analyzer lines prior to each measurement. Air directed by the manifolds from each column entered a non-dispersive infrared gas analyzer (Rosemount Analytical Model 880A, Emerson Process Management, Orville, OH, USA) with 1% full scale ( 15 ppm) precision which analyzed and measured CO 2 in the air exiting the stored samples. The non-dispersive infrared gas analyzer was calibrated according to the manufacturer s specification for each experimental repetition. Light-emitting diode (LED) indicators on a high-drive, full speed, solid state relay (SSR) board, USB-SSR24 (Measurement Computing ) allowed visual observation of the state of the relays therefore showed which specific glass column and corresponding manifold port sampled at a particular time. Data collection and dry matter loss calculation After sampling a particular glass column, the concentration of CO 2 in the evolving air was recorded correspondingly with the glass column description, date, time, temperature and relative humidity. Analog data signals read from the CO 2, temperature, relative humidity and airflow measuring devices were converted to digital signal using an analog-to-digital (AD) signal converter PMD; Personal Measuring Device (PMD) (Measurement Computing ). Dry matter loss was computed using the averaged corrected CO 2 evolved from the stored samples after 21 days. Percent cumulative DML was computed based on the premise
60 49 that; overall biological degradation was by glucose oxidation (Bern et al., 2002). The stoichiometric relationship is expressed as: C 6 H 12 O 6 + 6O 2 CO 2 + 6H 2 O kj mol -1 The equation used to convert measured CO 2 to DML is shown below: Equation 1. Conversion of evolved CO 2 into percent cumulative dry matter loss (DML). % Cumulative DML = n Q P MWglucose CO MW ( ) CO ti t R T i (6 MW ) i 1 CO DM 2 sample where = cumulative summation of the parameters in the bracket ( ) n CO 2 = number of independent measurements = carbon dioxide evolved, ppm Q = normalized airflow rate to a target of 0.47, Std L min -1 (example; if 0.55 Std L min -1 produces 400 ppm CO 2, then 0.47 Std L min -1 will produce 468 ppm CO 2 ) P = absolute pressure of gas, 1 atm R = universal gas constant, L atm K -1 mol -1 T = Temperature at which sample was stored, K MW CO2 = molecular weight of CO 2, 44 g mol -1
61 50 t i t i-1 = time of i-th CO 2 measurement, min; i=1, 2,..,n, = time prior to i-th measurement, min; i=1, 2,..,n, MW glucose = molecular weight of glucose (C 6 H 12 O 6 ), 180 g mol -1 DM sample = dry matter of sample used, g Statistical analysis A two-way factorial ANOVA using the PROC MIXED procedure of Statistical Analysis Systems (SAS for Windows, version 9.2, SAS Inst., Cary, NC, USA) was used to determine the significance of preservative treatment and temperature main effects on DML. Lsmeans statement in PROC MIXED procedure was used to calculate the means of main effects and potential interactions. Tukey post-hoc test was used for group comparison. The main and interaction effects were determined at Results The effects of two-level preservative treatment; 0 and 0.1% (w/w) at 10 o C, 20 o C and 30 o C on MWDGS DML after three repetitions for 21 days storage period are shown in Figure 3.5, below. The results indicated a highly significant main effect of preservative on DML (p-value = ). The main effect of temperature treatment on DML was highly significant (p-value = ). There was significant interaction effect (Figure 3.5) observed between preservative and temperature treatment (p-value = ).
62 Dry matter loss (%) Untreated Treated Temperature ( o C) Figure 3.5. Effects of temperature and preservative treatment interaction on modified wet distillers grains with solubles treated with 0.1% (w/w) CakeGuard preservative at 10 o C, 20 o C and 30 o C. There was no statistically significant DML difference between preservative treatments at 10 o C (p-value = ). Treatment with preservative significantly reduced DML at 20 o C (p-value = ) moreover at 30 o C preservative effect on DML reduction was highly significant (p-value = ). Comparison of the least square means of significant effects on percent DML are summarized in Table 3.1.
63 52 Table 3.1. Percent dry matter loss in CakeGuard preservative treated and untreated modified wet distillers grains with solubles after 21 days of storage. Preservative Level Untreated (0% w/w) Treated (0.1% w/w) Mean Temperature ( o C) d 3.12 d b 16.8 c a 19.3 bc 23.7 Mean a-e Data with different letter are significantly different (Tukey; 0.05) The effects of preservative treatment and temperature on DML for each experimental repetition are illustrated in Figure 3.6. DML values for each repetition (rep) are averages of three samples stored for 21 days. For the purpose of descriptive analysis, we monitored the trend of DML (Figure 3.7) over time using the averaged cumulative DML after the three experimental repetitions. The trend of DML shows the variation of DML accumulation during storage. The time series reveals a consistent decrease in preservative treated MWDGS dry matter loss at 20 o C and 30 o C.
64 Dry matter loss (%) Temperature ( o C) Untreated (mean) Rep 1 - untreated Rep 2 - untreated Rep 3 - untreated Treated (mean) Rep 1 - treated Rep 2 - treated Rep 3 - treated Figure 3.6. Effects of preservative and temperature on modified wet distillers grains with solubles dry matter loss (DML) for 21 days with DML for each repetition and mean DML for the repetitions.
65 54 30 Cumulative dry matter loss (%) C = o C 10 C treated 10 C untreated 20 C treated 20 C untreated 30 C treated 30 C untreated Time (days) Figure 3.7. Dry matter loss rates in untreated and preservative treated stored modified wet distillers grains with solubles as a function of temperature for 21 days. Discussion The aim of this study was to quantify DML in MWDGS and to determine the effects of preservative and temperature treatments on DML during storage for 21 days. One minor problem occurred during the repetition of the experiment. One of the environmental chambers failed after the second repetition and needed replacement before the third repetition. The two-way factorial allowed us to analyze the differences in the means of absolute values for the data collected despite the unfortunate and unexpected circumstance.
66 55 The rapid rate of deterioration of wet distillers grains is the most critical issue with regards to storage life and it is often undesirable due to quantity and quality lost. DML occurs as a direct result of microbial activity. The presence of residual nutrients and high moisture content of the wet feed create an environment which favors growth of spoilage microorganisms. DML at the end of the 21 days storage was highly influenced by preservative and temperature treatment especially at 30 o C. There was consistent increase in DML with increasing temperature (Figure 3.5) irrespective of preservative treatment. At 10 o C, 20 o C and 30 o C; DML loss with CakeGuard (propionic acid-based) preservative treatment observed were 3.12%, 16.8%, 19.3% and DML for untreated MWDGS were 3.22%, 21.4% and 28.0% respectively from original 29 g dry matter sample. Temperature effect on DML was significant at all levels except at preservative treatment at 20 o C and 30 o C (Table 3.1.). The data illustrates that the lowest DML occurred at 10 o C. This is expected because low temperatures slow down microbial metabolism whereas high temperatures facilitate rapid metabolism as evident at 30 o C. According to Al-Yahya (1996), low temperature have very little effect on grain storability, whereas higher temperature increases grain rate deterioration. Considering the impact of deterioration on wet distillers grains by seasonal variation, this study shows that DML during hot weather season can occur very rapidly and in significant amounts compared to cold weather seasons (Figure 3.5). However preservative application can appreciably reduce the quantity of DML when stored for 21 days. From Figure 3.7, it can be estimated that the amount of DML in three weeks at 10 o C will occur in less than one week when stored at 30 o C. Storage strategies should therefore aim at preventing exposure of wet distillers grains to aerobic conditions in hot weather seasons, as the presence
67 56 of air which favors aerobic decomposers will hasten the rate of DML. It is however important to note that, inconsistencies of wet distillers grains such as initial quality of corn kernels, compositional variation, processing methods, storage conditions, biological factors, prevailing atmospheric conditions and time of the year could cause a general departure pattern in DML. From the results (Table 3.1.), it is evident that more DML occurred in the untreated samples compared to the preservative treated samples at all temperature levels. On the contrary, Nofsinger et al. (1983) observed that propionic acid favored more DML when wet distillers grains were treated at a rate of 0.5%, 0.25% and 1% (w/w) than untreated wet distillers grains stored at 30 o C. The inhibitory effect of CakeGuard preservative against the growth of spoilage microorganisms maybe due to the chemical composition (a combination of propionic acid, sodium benzoate and potassium sorbate), therefore has a higher potency in reducing DML compared to propionic acid effect as observed by Nofsinger et al. (1983). In our study, even though the rate of DML (Figure 3.7) accelerated rapidly in less than a week at 30 o C and in about a week at 20 o C, the quantitative differences in DML at these temperature levels undoubtedly was due to the inhibitory effect of the preservative used. The low recommended rate of the preservative application (0.1% w/w) seems effective in reducing storage losses at ambient temperatures. Nevertheless interaction effect observed indicates that preservative and temperature have a synergetic relationship on DML. This interdependency shows that preservative treatment will perform differently at different temperature treatments levels and vice versa Visual observations on mold formation were made during storage. Mold colonies appeared within an average of five days on both preservative treated and untreated samples at
68 57 30 o C. At 20 o C mold colonies began forming seven days on untreated samples and 10 days in treated samples respectively. At 21 days, there was no obvious mold growth on preservative treated sample at 10 o C and a few observed on untreated samples. Lyberg et al. (2008), studied the biochemical and microbial properties on cereals mix fermented with whey and wet wheat distillers grains and found that higher temperatures favor microbial growth. Different microbial coloration was visually observed between preservative treated and untreated samples during the period of monitoring CO 2 evolution. These could possibly be due to different types of spoilage microbes. At the end of the storage period, the preservative treated MWDGS showed considerable reduction in molds and were moderately stabilized (less clumps) than the untreated samples at 20 and 30 o C whiles at 10 o C both preservative treated and untreated samples appeared completely undegraded. According to Uslu et al. (2009), propionic acid at levels between 0.1% and 1% (w/w) inhibits mold growth. Geetha et al. (2009), treated barley distillers grains with 0%, 0.5%, 1.0%, 1.5% and 2.5% (w/v) propionic acid and found that mold count was significantly lower at both 2% and 2.5% percent treatment level but they fail to report storage losses. Visual observation of preservative treatment may prove deceptive as one might think that, reduction of mold due to treatment could necessarily lead to significant retardation of DML. The final averaged moisture content in the samples was found to increase at 10 o C and 20 o C but decreased slightly at 30 o C. The increased moisture content apparently was due to either microbial activities or aerating with 100% relative humidity. From Figure 3.6, DML during the second repetition was higher than both first and third repetitions. The differences may be caused by some accidental error during the experiment. The variation in moisture
69 58 content (42% w.b. in this study) of wet distillers grains which can reach as high as 70% w.b. before they are sold, unsurprisingly may result in even higher DML within a shorter time under the storage conditions investigated. In addition to these specific findings, it is important to know that storage temperature may influence the action of preservatives (weak acids). It was reported that ambient storage temperature decreases acid survival more than storage at cold temperatures ([Skandamis and Nychas, 2000] and [Beales, 2004]). This could be a reason for the high DML; 16.8% and 19.3% of samples treated with preservative at 20 and 30 o C respectively. Future research Additional testing and analysis of numerous loads of wet distillers grains DML during storage is needed to allow for precise estimation (using mathematical models) of the mean values and DML estimates. Studies have shown that the effectiveness of propionic acidbased preservatives increases with higher application rates ([Kung Jr et al., 1998], [Kung Jr et al., 2000] and [Kung Jr, 2010]), therefore it is recommended to study the effect of higher application rates of CakeGuard preservative on wet distillers grains DML beyond 21 days. Furthermore, the effect of including solubles on wet distillers grains DML and factors affecting aerobic stability such as microbial ecology should be studied. Conclusions From this research, we found significant differences in DML between preservativetreated and untreated MWDGS at 20 o C and 30 o C. The effect of temperature on DML was
70 59 also significant. Although preservative treatment was not significant at 10 o C, it recorded the lowest DML whereas the highest dry matter losses occurred at 30 o C. Storage at 10 o C appeared to have extended MWDGS storage life for 21 days. It might be reasonable to suggest the feasibility of cold storage method over other methods however; special reference to the economic feasibility is needed. The results suggest that, treating MWDGS with preservative during winter seasons will not be useful. However, the observation of appreciable performance of preservative treatment at 20 o C and 30 o C informs that using CakeGuard preservative during summer months will reduce storage losses considerably. Finally, it may be difficult to apply the results obtained on a larger scope to predict future DML occurrences because of potential variations in wet distillers grains from plant to plant. However, the findings in this study have established that CakeGuard preservative is effective in reducing DML and overall, visual observation showed that the preservative is effective in stabilizing, conditioning and retarding mold growth. Therefore a rational response to the concerns of wet distillers grains storage losses can be addressed using CakeGuard preservative for 21 days. Acknowledgement We are grateful for the partial financial support from the USDA Higher Education Challenge Grant Award #
71 60 CHAPTER 4. GENERAL CONCLUSIONS In this study, the storage temperature and preservative use both significantly impacted dry matter loss from modified wet distillers grains with solubles (MWDGS) (p-value = and p-value = respectively). The effect of preservative on DML at 10 o C was not significant (p-value = ), whereas the effect of preservative on DML at 20 o C and 30 o C were highly significant (p-value = and p-value = respectively). Temperature effect on DML was also significant. Interaction effect of preservative and temperature treatment on DML was significant. The DML observed in MWDGS samples after 21 days storage with preservative treatment at 10 o C, 20 o C and 30 o C were 3.12%, 16.8% and 19.3% respectively. Untreated samples at 10 o C, 20 o C and 30 o C resulted in a DML of 3.22%, 21.4% and 28.0% respectively. As expected, storage temperature forms one of the most important parameters that influence deterioration. Losses of the magnitudes observed under ambient temperatures imitated, indicates the need for exclusion of air during storage to prevent aerobic conditions which could boost the rate of DML. The encouraging performance of preservative on storage losses retardation at moderate (20 o C) and high (30 o C) temperature compared to preservative treatment at 10 o C makes suitable and useful for preserving wet distillers grains in hot weather conditions. These findings are vital to both the ethanol industry and farm operations as the most storage losses occur during warm weather conditions and very rapidly. Furthermore, for DML reaching 3% in MWDGS (42% m.c. used in this study) at 10 o C and more than 15% at 20 o C and 30 o C in 21 days raises concern about how much DML that can occur within the shortest time frame in wet feeds. Moisture content of wet distillers
72 61 grains sometimes can reach as high as 70% w.b. therefore higher levels of DML may occur at this moisture content level during storage especially in warm weather seasons. The effect of solubles added to wet distillers grains could be a potential promoter of deterioration. This should be checked in future studies as it may be the case. Wet distillers grains; a kind of feed which is becoming the most prominent and immediately promising livestock feed constitute a major revenue stream of an ethanol plant, which is also affordable for farm operations because of lower cost compared to dried distillers grains. It is therefore crucial that further studies be directed towards understanding the mechanism of deterioration and factors such as nutrient profile, ph and microbial ecology and how they influence deterioration. Based on the results from this experiment, continued investigation of varying CakeGuard preservative application rates which may prove to be highly beneficial in extending the storage time of these invaluable feeds over 21 days is recommended.
73 62 RECOMMENDATIONS FOR FUTURE RESEARCH Future studies should be centered on expanding knowledge on factors that promote rapid deterioration in wet distillers grains and possible ways to avert this issue. The following investigations are crucial to wet distillers grains storage and utilization: 1. Direct DML method should be used and compared with CO 2 method. 2. DML of numerous wet distillers grains samples should be collected and analyzed over time with more replications. This will allow for estimation of the mean values and also the variation of DML estimates. 3. Future studies should focus on the effects on wet distillers grains deterioration with and without solubles. 4. Different preservative treatment levels should be studied on wet distillers grains DML. 5. Elucidation of microbial culture during storage and toxicity levels is needed to determine unsafe feeding limits of deteriorated wet distillers grains. 6. Effect of CakeGuard-treated wet distillers grains on livestock dry matter intake, gain, milk yield and, overall performance needs to be researched. 7. A higher capacity Rosemount Infrared Gas Analyzer should be provided to measure a wider range of CO 2 evolution during future studies.
74 63 REFERENCES AAFC, China s meat market outlook Agriculture and Agri-Food Canada. July (accessed July 13, 2011). Al-Yahya, S.A., Mathematical simulation of model to predict storage time of grain. King Saud University, Agriultural Sciences 8, Al-Yahya, S.A., Bern, C.J., Bailey, T.B., Carbon dioxide evolution of fungicide-treated high moisture corn. Transactions of the ASAE 36, Alexander, R.J., Corn dry milling: processes, products, and applications. In: Corn Chemistry and Technology. Watson, S. A. and Ramstad, P.E. eds. Americal Association of Cereal Chemist, St. Paul, MN Alltech Inc., USA. Mold protection for distillers grains: for longer storage and consistent cake - everytime. CakeGuard TM Brochure. Nicholasville, Kentucky USA. Anderson, J.L., Schingoethe, D.J., Kalscheur, K.F., Hippen, A.R., Evaluation of dried and wet distillers grains included at two concentrations in the diets of lactating dairy cows. Journal of Dairy Science 89, ASABE, Shelled corn storage time for 0.5% dry matter loss. ASAE D535. Standards Engineering Practices Data. ASABE: St. Joseph, MI. ASABE, Moisture relationships of plant-based agricultural products. ASAE D Standards Engineering Practice Data. ASABE: St. Joseph, MI. Bailey, C.H., Respiration of shelled corn. Minnesota Agricultural Experiment Stateion Technical Bulletin 3. Bartling, F.W., Wet process corn milling. No.5. The steep house. Am. Miller 68 (August), 40-41, 82. Baskett, J., Nelson, A., Vincent, K., Strohbehn, D., Loy, D.D., Bern, C., Brumm, T., Storage and handling of high moisture co-products from ethanol production in beef operations. Feed Sepeicalist and Veternarian Study. Iowa State University Animal Industry Report. A.S. Leaflet R2417. Beales, N., Adaptation of Microorganisms to Cold Temperatures, Weak Acid Preservatives, Low ph, and Osmotic Stress: A Review. Comprehensive Reviews in Food Science and Food Safety 3, Belyea, R., Eckhoff, S., Wallig, M., Tumbleson, M., Variability in the nutritional quality of distillers solubles. Bioresource Technology 66,
75 64 Belyea, R.L., Rausch, K.D., Tumbleson, M.E., Composition of corn and distillers dried grains with solubles from dry grind ethanol processing. Bioresource Technology 94, Berger, L., Singh, V., Changes and evolution of corn coproducts for beef cattle. J. Anim Sci. 88, E Bern, C.J., Hurburgh, C.R., Jr., Brumm, T.J., Managing grains after harvest. Agricultural and Biosystems Engineering, Iowa State University. Bern, C.J., Pate, M.B., Shivvers, S., Operating characteristics of a high-efficiency pilot scale corn distillers grain dryer. ASABE Paper No St Joseph, Mich.: ASABE. Bern, C.J., Steele, J.L., Morey, R.V., Shelled corn CO 2 evolution and storage time for 0.5% dry matter loss. Applied Engineering in Agriculture 18, Bigelis, R., Food enzymes. In: D.B. Finkelstein and C. Ball (editors), Biotechnolgy of Filamentous Fungi. Technology and Products. Butterworth-Heinemann, Boston, MS Biomin America Inc., USA. (accessed January 4, 2011). Birkelo, C.P., Brouk, M.J., Schingoethe, D.J., The Energy Content of Wet Corn Distillers Grains for Lactating Dairy Cows. Journal of Dairy Science 87, Biswas, S., Staff, C., Analysis of Headspace Compounds of Distillers Grains using SPME in Conjunction with GC/MS and TGA. Journal of Cereal Science 33, Blanchard, P., Wet Milling. In: "Technology of Corn Wet Milling and Associated Processes". Elsevier Science, Amsterdam, Bothast, R.J., Schlicher, M.A., Biotechnological processes for conversion of corn into ethanol. Applied Microbiology and Biotechnology 67, Buckmaster, D.R., Gunn, P., Lake, S., Lemenger, R., Claeys, M., Co-ensiling of wet distiller's grains. An ASABE Meeting Presentation, Rhode Island Cocention Center, Rhode Island. June 29- July Buckner, C.D., Bremer, V.R., Klopfenstein, T.J., Erickson, G.E., Mark, D.R., 2008a. Cattle CODE: an economic model for determining by-product returns for feedlot cattle. Nebraska Beef Cattle Report, University of Nebraska-Lincoln. Buckner, C.D., Vanness, S.J., Erickson, G.E., Klopfenstein, T.J., Benton, J.R., 2008b. Sampling wet distillers grains plus solubles to determine nutrient variability.
76 65 Nebraska Beef Cattle Reports. Animal Science Department. University of Nebraska-Lincoln. Buckner, C.D., Wilken, M.F., Benton, J.R., Vanness, S.J., Bremer, V.R., Klopfenstein, T.J., Kononoff, P.J., Erickson, G.E., Nutrient variability for distillers grains plus solubles and dry matter determination of ethanol by-products. The Professional Animal Scientist 27, Butzen, S., Haefele, D., Dry-grind ethanol production from corn. Crop Insights. 18, 1-4. Chelkowski, J., Cereal grain. Mycotoxins, fungi and quality in drying and storage. (Editor). Elsevier, Amsterdam. Chisti, Y., Biodiesel from microalgae beats bioethanol. Trends in Biotechnology 26, Chitrakar, S., Bern, C.J., Shrestha, D.S., Quantifying corn deterioration due to fungal growth by use of CO 2 -sensitive gel. Applied Engineering in Agriculture 22, Christiansen, R.C., Wet storage strategies. Ethanol Producer Magazine. (accessed January 4, 2011). Dale, R.T., Tyner, W.E., Economic and technical analysis of ethanol dry milling model description: Model user's manual. (accessed December 21, 2010). Del Campo, B., Corn cob dry matter loss in storage as affected by temperature and moisture content. Masters Thesis, Agricultural and Biosystems Engineering. Iowa State University, Ames. Drackley, J.K., Hutjens, M.F., Ipharraguerre, I., French, E., Efficacy of a preservative product (Zenipro) for wet distiller's grains. Final Report tooo Kemin Americas, Inc. University of Illinois. Dugba, P.N., Bern, C.J., Rukunudin, I., Misra, M.K., Bailey, T.B., Preservative effects of iprodione on shelled corn. Transactions of the ASAE 39, Erickson, G., Klopfenstein, T., Rasby, R., Stalker, A., Plugge, B., Bauer, D., Mark, D., Addams, D., Benton, J., Greenquist, M., Nuttleman, B., Kovarik, L., Perterson, M., Waterbury, J., Wilken, M., 2008a. Storage of wet corn co-products. 1st Edition, May 2008, University of Nebraska-Lincoln Extension. Erickson, G., Plugge, B., Bauer, D., Stalker, A., 2008b. Storage of wet by-products: Nebraska update. Ethanol Coproduct and Utilization Conference. University of Nebraska, ARDC.
77 66 Erickson, G.E., Klopfenstein, T.J., Adams, D.C., Rasby, R.J., General overview of feeding corn milling co-products to beef cattle. Eun, J.S., ZoBell, D.R., Wiedmeier, R.D., Influence of replacing barley grain with corn-based dried distillers grains with solubles on production and carcass characteristics of growing and finishing beef steers. Animal Feed Science and Technology 152, Farlin, S.D., Wet distillers grains for finishing cattle. Animal Nutrition 36, Fawole, L.O., Deterioration of high moisture corn at low temperatures as measured by CO 2 production, Agricultural Engineering. Iowa State University, Ames, pp Fernandez, A., Stroshine, R.L., Tuite, J., Mold groth and carbon dioxide production during storage of high-moisture corn. Cereal Chem. 62, Filtenborg, O., Frisvad, J.C., Thrane, U., Moulds in food spoilage. International Journal of Food Microbiology 33, Firkins, J.L., Berger, L.L., Fahey, G.C., Jr, Evaluation of wet and dry distillers grains and wet and dry gluten feeds for ruminants. Animal Science 60, 847. Fox, J.A., Export markerts for distillers grains. Distillers Grain Market Development and Price Risk Management Series FS3. Frazier, W.C., Westhoff, D.C., Food Microbiology. Tata McGraw-Hill Publishing Company Ltd, New Delhi. Friday, D.C., Tuite, J., Stroshine, R., Effect of hybrid and physical damage on mold development and carbon dioxide production during storage of high moisture shelled corn. Cereal Chem. 66, Gallagher, P.W., Brubaker, H., Shapouri, H., Plant size: Capital cost relationships in the dry mill ethanol industry. Biomass and Bioenergy 28, Ganesan, V., Rosentrater, K.A., Muthukumarappan, K., Methodology to determine soluble content in dry grind ethanol coproduct streams. Applied Engineering in Agriculture 22, Garcia, A.D., Kalscheur, K.F., Ensiling wet distillers grains with other feeds. SDSU Extension Extra May Garcia, A.D., Kalscheur, K.F., Hippen, A.R., Schingoethe, D.J., Rosentrater, K.A., Mycotoxins in distillers grains: a concern in ruminants?. South Dakota Extension Extra, pp. 1-3.
78 67 Geetha, P., Valli, C., Blakrishnan, V., Evolving effective preservation technique for distiller's grain. Tamilnadu J. Vertineray & Animal Sciences 5, Glauber, J.W., Prospects for the U.S. farm economy in USDA. (accessed December 10, 2010). Gravesen, S., Frisvad, J.C., Samson, R.A., Microfungi. Munksgarrd, Copenhagen. Gulati, M., Kohlmann, K., Ladisch, M.R., Hespell, R., Bothast, R.J., Assessment of ethanol production options for corn products. Bioresource Technology 58, Ham, G.A., Stock, R.A., Klopfenstein, T.J., Larson, E.M., Shain, D.H., Huffman, R.P., Wet corn distillers byproducts compared with dried corn distillers grains with solubles as a source of protein and energy for ruminants. J. Anim Sci. 72, Hubbard, K.J., Kononoff, P.J., Gehman, A.M., Kelzer, J.M., Karges, K., Gibson, M.L., Short communication: The effect of feeding high protein distillers dried grains on milk production of Holstein cows. Journal of Dairy Science 92, Jackson, D.S., Shandera Jr, D.L., Corn Wet Milling: Separation Chemistry and Technology, in: John, E.K., Steve, L.T. (Eds.), Advances in Food and Nutrition Research. Academic Press, pp Jayas, D.S., Jeyamkondan, S., PH--Postharvest Technology: Modified Atmosphere Storage of Grains Meats Fruits and Vegetables. Biosystems Engineering 82, Johnson, C.O.L.E., Huber, J.T., Aerobic Storage and Utilization of Ammonia-Treated Distillers Wet Grains for Lactating Dairy Cows. Journal of Dairy Science 70, Johnson, L.A., May, J.B., Wet milling: the basis for corn biorefineries. In: Watson, S.A., Editor, "Corn: Chemistry and Technology". American Association of Cereal Cheimsit, St. Paul, MN, Jones, C.L., Economically optimal distiller's grains inclusion rates in beef feedlot rations, Department of Agricultural Economics. Michigan State University. Kaiser, R.M., Variation in composition of distillers wet grains with solubles. p. 191 in 4-State Dairy Nutri. Manage. Conf., Midwest Plan Service, Ames, IA. Kaiser, R.M., Utilizing the growing local supply of distillers grains. University of Winsconsin-Extension.
79 68 extension/dairy/nutrition/pdf/shaver-utilizing-distillers.pdf (accessed, February 4, 2011). Kalscheur, K.F., Garcia, A.D., New horizon in ethanol by-products. Dairy Science Department, South Dakota State University Brookings, SD. (accessed February 1, 2011). Kemin Inc., USA. ZeniPro liquid preservative. Product Specifications. A-SS-ZeniPRO-brand-Liquid---English.pdf (accessed October 8, 2010). Kim, S., Dale, B.E., Allocation procedure in ethanol production system from corn grain: I. System expansion. International Journal of Life Cycle Assessment 7, Kim, S., Dale, B.E., Global potential bioethanol production from wasted crops and crop residues. Biomass and Bioenergy 26, Kim, Y., Mosier, N., Ladisch, M.R., 2008a. Process simulation of modified dry grind ethanol plant with recycle of pretreated and enzymatically hydrolyzed distillers' grains. Bioresource Technology 99, Kim, Y., Mosier, N.S., Hendrickson, R., Ezeji, T., Blaschek, H., Dien, B., Cotta, M., Dale, B., Ladisch, M.R., 2008b. Composition of corn dry-grind ethanol by-products: DDGS, wet cake, and thin stillage. Bioresource Technology 99, Kinman, L.A., Hilton, G.G., Richards, C.J., Morgan, J.B., Krehbiel, C.R., Hicks, R.B., Dillwith, J.W., VanOverbeke, D.L., Impact of feeding various amounts of wet and dry distillers grains to yearling steers on palatability, fatty acid profile, and retail case life of longissimus muscle. J. Anim Sci. 89, Klopfenstein, T., Distillers grains as an energy source and effect of drying on protein availability. Animal Feed Science and Technology 60, Klopfenstein, T.J., Efficiency of escape protein utilization. Proc. 46th Distillers Feed Conf., Distillers Feed Research Council, Cincinattin, OH, p. 87. Klopfenstein, T.J., Erickson, G.E., Bremer, V.R., Feeding Corn Milling Byproducts to Feedlot Cattle. Veterinary Clinics of North America: Food Animal Practice 23, Kung Jr, L., Aerobic stability of silage. In: Proceedings, 2010 California Alfalfa and Forage Symposium and Corn/Cereal Silage Conference, Visalia, CA, 1-2 December UC Cooporative Extension, Plant Sciences Department, University of Californaia, Davis, CA
80 69 Kung Jr, L., Hession, A.O., Bracht, J.P., Inhibition of Sulfate Reduction to Sulfide by 9,10-Anthraquinone in In Vitro Ruminal Fermentations. Journal of Dairy Science 81, Kung Jr, L., Robinson, J.R., Ranjit, N.K., Chen, J.H., Golt, C.M., Pesek, J.D., Microbial Populations, Fermentation End-Products, and Aerobic Stability of Corn Silage Treated with Ammonia or a Propionic Acid-Based Preservative. Journal of Dairy Science 83, Kung, L., Jr, Managing high moisture co-product feeds for improved aerobic stability. Proceeding of the Four State Dairy Conference. Debuque, IA. June 15-16, Midwest Plan Service - 4SD Kurtzman, C.P., Detenction, identification and enumeration methods for spoilage yeast. In : Blackburn, C. de. W, editor. Food spoilage microorganisms. Cambridge, England: Woodhead Publishing Kwiatkowski, J.R., McAloon, A.J., Taylor, F., Johnston, D.B., Modeling the process and costs of fuel ethanol production by the corn dry-grind process. Industrial Crops and Products 23, Ladisch, M.R., Svarczkopf, J.A., Ethanol production and the cost of fermentable sugars from biomass. Bioresource Technology 36, Liu, K., Chemical Composition of Distillers Grains, a Review. Journal of Agricultural and Food Chemistry, null-null. Liu, S.X., Singh, M., Inglett, G., Effect of incorporation of distillers' dried grain with solubles (DDGS) on quality of cornbread. LWT - Food Science and Technology 44, Loy, D., Ethanol coproducts for cattle: distillers grains for beef cows. Iowa Beef Center. Iowa State University Extension. March Loy, D., Growing beef: Protecting your cattle from the dangers of summer heat stress. Iowa Beef Center's monthly newsletter, Iowa State University. (accessed October 12, 2010). Loy, D., Miller, w., Ethanol coproducts for cattle: the process and products. Iowa Beef Center. IBC-18. March (accessed December 29, 2010). Loy, D., Strohbehn, D., 2007a. Ethanol feeds: feeding distillers grains to beef cattle. Iowa Beef Center. Iowa State University Extension.
81 70 Loy, D., Strohbehn, D., Sellers, J., Storing wet distillers' feeds - Iowa update. In: Ethanol Co-product Storage and Utilization in Grazing Systems Compact Disc. University of Nebraska-Lincoln Extension. Loy, D., Strohbehn, D.R., 2007b. Ethanol coproducts for cattle: factors affecting the economics of corn coproducts in cattle feeds. Iowa Beef Center. IBC-28. December (accessed February 2, 2011). Loy, D.D., Strohbehn, D.R., 2007c. Ethanol coproducts for cattle: factors affecting the economics of corn co-products in cattle feeds. Iowa Beef Center, IBC-28. Iowa State University Extension. Loy, D.D., Strohbehn, D.R., 2007d. Ethanol coproducts for cattle: use of distillers grains in feedlot diets. Iowa Beef Center. IBC-29. December Iowa State University Extentsion. Loza, P.L., Buckner, C.D., Vander Pol, K.J., Erickson, G.E., Klopfenstein, T.J., Stock, R.A., Effect of feeding combinations of wet distillers grains and wet corn gluten feed to feedlot cattle. J. Anim Sci. 88, Luchansky, M.S., Monks, J., Supply and demand elasticities in the U.S. ethanol fuel market. Energy Economics 31, Lyberg, K., Olstorpe, M., Passoth, V., Schnürer, J., Lindberg, J.E., Biochemical and microbiological properties of a cereal mix fermented with whey, wet wheat distillers' grain or water at different temperatures. Animal Feed Science and Technology 144, Marks, B.P., Stroshine, R.L., Effects of previous storage history, hybrid, and drying method on the storability of maize grain (corn). Journal of Stored Products Research 31, Mathews, K.H., McConnell, M.J., Jr Ethanol co-product use in the U.S. Cattle Feeding. A Report from the Economic Research Service, FDS-09D-0,1 USDA. f (accessed June 16, 2010). Matz, S.A., The chemistry and technology of cereals as food and feed. Mills, J.T., Spoilage and heating of stored agricultural products: prevention, detection and control. Research Station Winnipeg, Manitoba. Agriculture and Agri-Food. Canada. (accessed February 15, 2011).
82 71 Milner, M., Geddes, W.F., Respiration and heating. In Anderson, J. A. and Alcock, A. W., editors. Storage of cereal grains and their products pp St. Paul, Minnesota, American Association of Cereal Chemists. Moog, D.J.P., Stroshine, R.L., Seitz, L.M., Relationship of shelled corn fungal susceptibility to carbon dioxide evolution and kernel attributes. Cereal Chem. 85, Nelson, A., Baskett, J., Vincent, K., Loy, D.D., Strohbehn, D., Bern, C., Brumm, T., Handling and storage of high moisture coproducts from ethanol production in beef operations. Agricultural and Biosystems Department. Iowa State University. Ng, H.F., Wilcke, W.F., Morey, R.V., Meronuck, R.A., Lang, J.P., Mechanical damage and corn storability. Transactions of the ASAE 41, Nofsinger, G.W., VanCauwenberge, J.E., Bothast, R.J., Kwolek, W.F., An evaluation of chemical methods to extend the allowable storage time of wet distiller's grains. Agric. Food Chem. 31, Noureddini, H., Byun, J., Dilute-acid pretreatment of distillers' grains and corn fiber. Bioresource Technology 101, NRC, Nutrient requirement of dairy cattle (7th rev. ed.), Natl. Acad. Sci., Washington, DC. O'Connor, D., The impact of changes in the ethanol production process on the nutritional value of distillers grains. In Proceedings 28th Western Nutriton Conference, September 2007, Saskatoon, SK. Pérez, O.E., Haros, M., Suarez, C., Corn steeping: influence of time and lactic acid on isolation and thermal properties of starch. Journal of Food Engineering 48, Perrin, R.K., Fretes, N.F., Sesmero, J.P., Efficiency in Midwest US corn ethanol plants: A plant survey. Energy Policy 37, Ramirez, E.C., Johnston, D.B., McAloon, A.J., Yee, W., Singh, V., Engineering process and cost model for a conventional corn wet milling facility. Industrial Crops and Products 27, Rasby, R., Stalker, A., Nutrition, feed issues, economic and research for cow/calf producers considering grain co-products. In: Ethanol Co-Product Storage and Utilization in Grazing Systems. University of Nebraska-Lincoln. Rausch, K.D., Belyea, R.L., The future of coproducts from corn processing. Appl. Biochem. Biotechnol. 128,
83 72 RFA, Ethanol Industry Outlook Renewable Fuels Association, Washington, DC. (accessed February 28, 2011). RFA, 2011a annual ethanol production = billion gallons. Renewable Fuels Association, Washington, DC. (accessed July 13, 2011). RFA, 2011b. Building bridges to a more sustainable future Ethanol Industry Outlook. Renewable Fuels Association, Washington, DC. (accessed March 12, 2011). RFA, 2011c. Industry resources: co-products. Renewable Fuels Association, Washington, DC. (accessed December 21, 2010). Rodríguez, L.F., Li, C., Khanna, M., Spaulding, A.D., Lin, T., Eckhoff, S.R., An engineering and economic evaluation of quick germ-quick fiber process for drygrind ethanol facilities: Analysis. Bioresource Technology 101, Rosentrater, K.A., Kongar, E., Modeling the effects of pelleting on the logistics of distillers grains shipping. Bioresource Technology 100, Rosentrater, K.A., Lehman, R.M., Physical and chemical properties of corn distillers wet grains. Applied Engineering in Agriculture 24, Rosentrater, K.A., Muthukumarappan, K., Julson, J., Krishnan, P., Update on ethanol processing residue properties. ASAE Paper No St. Joseph, Mich.:ASAE. Runge, F.C., Senaure, B., How biofuels could starve the poor. Foreign Affairs 83, Sasikala-Appukuttan, A.K., Schingoethe, D.J., Hippen, A.R., Kalscheur, K.F., Karges, K., Gibson, M.L., The Feeding Value of Corn Distillers Solubles for Lactating Dairy Cows. Journal of Dairy Science 91, Saul, T.A., Steele, J.L., Why damaged shelled corn costs more to dry. Agricultural Engineering 47, Saunders, J.A., Rosentrater, K.A., Survey of US fuel ethanol plants. Bioresource Technology 100, Schingoethe, D.J., Utilization of DDGS by Cattle. 27th Western Nutrieion Conference, September 19-20, in Winnipedd, Manitoba, Canada.
84 73 Schingoethe, D.J., Feeding corn distillers grains to dairy cattle. Ontario Dairy Symposium for Large Herd Operators, London, Ontario, Canada Ontario Large Herd Operators, Elora, Ontario, Canada., Schingoethe, D.J., Brouk, M.J., Birkelo, C.P., Milk Production and Composition from Cows Fed Wet Corn Distillers Grains. Journal of Dairy Science 82, Schingoethe, D.J., Kalscheur, K.F., Garcia, A.D., Distillers grains for dairy cattle. Extension Extra. ExEx 4022, South Dakota State University Cooperative Extension Service. Schingoethe, D.J., Kalscheur, K.F., Hippen, A.R., Garcia, A.D., Invited review: The use of distillers products in dairy cattle diets. Journal of Dairy Science 92, Schoonmaker, J.P., Trenkle, A.H., Beitz, D.C., Effect of feeding wet distillers grains on performance, marbling deposition, and fatty acid content of beef from steers fed low- or high-forage diets. J. Anim Sci. 88, Schroeder, J.W., Distillers grains protein energy supplement for dairy cattle. AS-1241, Extension Service. North Dakota State University. Schuster, M., Storage and handling considerations for distillers dried grains (ddgs). Laidig Systems Inc. Proceedings. The Grain Elevator and Processing Society (GEAPS). (accessed March 4, 2011). Shurson, J., Exporting DDGS: opportunities and challenges. Distillers Grains Quarterly, Department of Animal Science, University of Minnesota. Singh, V., Johnston, D., An Enzymatic Process for Corn Wet Milling, in: Steve, L.T. (Ed.), Advances in Food and Nutrition Research. Academic Press, pp Singh, V., Rausch, K.D., Yang, P., Shapouri, H., Belyea, R.L., Tumbleson, M.E., Modified Dry Grind Ethanol Process. Public. No Departments of Agricultural Engineering, University of IIlinois at Champaign-Urbana, IL. Skandamis, P.N., Nychas, G.-J.E., Development and Evaluation of a Model Predicting the Survival of Escherichia coli O157:H7 NCTC in Homemade Eggplant Salad at Various Temperatures, phs, and Oregano Essential Oil Concentrations. Appl. Environ. Microbiol. 66, Sommerfeldt, E., Focus on biofuels: new solutions to old problems Comstock Park MI. _Comstock_Park_MI-r Comstock_Park_MI.html (accessed February 13,2011).
85 74 Staff, C., The new paradigm of distillers grains with its myths and realities., Fertilizer & Pesticide Conference, Oklahoma City, Oklahoma. Steele, J.L., Deterioration of damaged shelled corn as measured by carbon dioxide production. Ph.D. Thesis, Agricultural Engineering. Iowa State University, Ames, pp Steele, J.L., Saul, A., Hukill, W.V., Deterioration of shelled corn as measured by carbon dioxide production. Transactions of the ASAE 12, Steevens, B., Sexten, J., By-product feed price listing. University of Missouri Extension. (accessed Februray 1, 2011). Stein, H.H., Shurson, G.C., BOARD-INVITED REVIEW: The use and application of distillers dried grains with solubles in swine diets. J. Anim Sci. 87, Strohbehn, D., Loy, D.D., Morrical, D., Sellers, J.H., Maxwell, D., 2008a. Modified distillers' grain with solubles stored for an extended period in a silo bag used to develop breeding heifers. Iowa State University Report. A.S. Leaflet R2288. Strohbehn, D.R., Loy, D.D., Morrical, D.G., Seller, J.H., Maxwell, D., 2008b. Evaluation of bagging to extend storage life of wet and modified distillers' grains - a demonstration project. Iowa State University Animal Industry Report. A.S. Leaflet R2289. Tipples, K.H., Quality and nutritional changes in stored grains. In: D.S. Jayas, N.D.G. White and W.E. Muir (editors), Stored Grain Ecosystems. Marcel Dekker, New York Tjardes, K., Wright, C., Feeding corn distiller's co-products to beef cattle. Extension Extra South Dakota State Univesity/USDA. Trenkle, A., Corn distillers grains: value-added feed source for beef, dairy beef, dairy poultry, swine and sheep. Department of Animal Science, Iowa State University. In: National Corn Growers Association. Washington, DC. USDA, Survey of ethanol producers National Distillers Grains Summary. (accessed January 18, 2011). USDA, Corn. United States Department of Agriculture, Economic Research Service, Washington, DC. (accessed December 27, 2010).
86 75 Uslu, H., Inci, I., Bayazit, S.S., Demir, G., Comparison of solid-liquid equilibrium data for the adsorption of propoinic acid and tartaric acid from aqueous solution onto amberlite IRA-67. Industrial & Engineering Chemistry Research 48, Vander Pol, K.J., Erickson, G.E., Klopfenstein, T.J., Mark, D.R., Economic optimum use of wet distillers grains in feedlots. Nebraska Beef Cattle Reports. Animal Science Department, University of Nebraska-Lincoln. Voloch, M., Ladisch, M.R., Bienkowski, P., Tsao, G.T., Bioutilization of cereal lignocellulose. In Cereal Polysaccharides in Technology and Nutrition, ed. V.F. Rasper. Am. Assoc. of Cereal Chmeists, St Paul, MN, P Walker, P.M., L. A. Forster, J., Case study: the evaluation of vacuum storage method for high moisture distillers grains and its efeect as a protein and energy supplement for beef cows. The Professional Animal Scientist 24. Wang, P., Singh, V., Xue, H., Johnston, D.B., Rausch, K.D., Tumbleson, M.E., Comparison of raw starch hydrolyzing enzyme with conventional lifquifaction and saccharification enzymes in dry-grind corn processing Cereal Chem. 84, Waterbury, J.A., The economic impact of corn co-products in the nebraska beef cattle industry. M.S. Thesis. Waterbury, J.A., Mark, D.A., "Ethanol byproduct prices." Cornhusker Economics. Department of Agricultural Economics, University of Nebraska-Linclon, March 26, Waterbury, J.A., Mark, D.R., Rasby, R.H., Erickson, G.E., An economic budget for determining co-product costs. Nebraska Beef Cattle Reports. University of Nebraska-Lincoln. Watson, S.A., Eckhoff, S.R., Corn and sorghum starches: Production. In: Whistler, R.L., BeMiller, J.N. and Paschall, E.F., Editors. " Starch: Chemistry and Technolgy", Academic Press, Orlando, FL. Weiss, B., Eastridge, M., Shoemaker, D., St-Pierre, N., Distillers grains. Animal Science, Ohio State University. June Fyffe Road, Columbus, OH (accessed February 2010). White, S.D., Murphy, P.T., Bern, C.J., van Leeuwen, J., Controlling deterioration of high-moisture maize with ozone treatment. Journal of Stored Products Research 46, Wilcke, W.F., Meronuck, R.A., Morey, R.V., Ng, H.F., Lang, J.P., Jiang, D., Storage life of shelled corn treated with a fungicide. Transactions of the ASAE 36,
87 76 Wilken, M.F., Erickson, G.E., Benton, J.R., Buckner, C.D., Klopfenstein, T.J., Karges, K., Gibson, M., Evaluation of methods for dry matter determination of ethanol byproducts. Nebraska Beef Cattle Report. MP 91. University of Nebraska-Lincoln. (accessed March 14, 2011). Wu, Y.V., Protein-rich residue from ethanolic fermentation of high-lysine, dent waxy and white corn varieties Cereal Chem. 66,
88 77 APPENDIX A. STATISTICAL RESULTS A. SAS CODES NB: Repetitions are considered as blocks. Data DML; Input Rep Temp Trt $ DML; Datalines; 1 10 U U U T T T U U U T T T U U U T T T U U U T T T U U U T T T U U U 27.87
89 T T T U U U T T T U U U T T T U U U T T T run; Proc Mixed data=dml method=type3; class rep temp trt; model DML = rep temp trt trt*temp/outp=predicted residual; random rep*temp; lsmeans trt*temp temp trt/adjust=tukey pdiff; run; proc plot data=predicted; plot studentresid*pred; run; proc univariate data=predicted normal plot; var resid; run;
90 79 B. SAS OUTPUT The SAS System 11:53 Saturday, June 25, The Mixed Procedure Model Information Data Set WORK.DML Dependent Variable DML Covariance Structure Variance Components Estimation Method Type 3 Residual Variance Method Factor Fixed Effects SE Method Model-Based Degrees of Freedom Method Containment Class Level Information Class Levels Values Rep Temp Trt 2 T U Dimensions Covariance Parameters 2 Columns in X 15 Columns in Z 9 Subjects 1
91 80 The SAS System 11:53 Saturday, June 25, The Mixed Procedure Dimensions Max Obs Per Subject 54 Number of Observations Number of Observations Read 54 Number of Observations Used 54 Number of Observations Not Used 0 Type 3 Analysis of Variance Sum of Source DF Squares Mean Square Expected Mean Square Error Term Rep Var(Residual) + 6 Var(Rep*Temp) MS(Rep*Temp) + Q(Rep) Temp Var(Residual) + 6 Var(Rep*Temp) MS(Rep*Temp) + Q(Temp,Temp*Trt) Trt Var(Residual) + Q(Trt,Temp*Trt) MS(Residual) Temp*Trt Var(Residual) + Q(Temp*Trt) MS(Residual) Rep*Temp Var(Residual) + 6 Var(Rep*Temp) MS(Residual) Residual Var(Residual). The SAS System 11:53 Saturday, June 25, The Mixed Procedure Type 3 Analysis of Variance Error Source DF F Value Pr > F Rep Temp Trt Temp*Trt
92 81 Rep*Temp Residual... Covariance Parameter Estimates Cov Parm Estimate Rep*Temp Residual Fit Statistics -2 Res Log Likelihood AIC (smaller is better) The SAS System 11:53 Saturday, June 25, The Mixed Procedure Fit Statistics AICC (smaller is better) BIC (smaller is better) Type 3 Tests of Fixed Effects Num Den Effect DF DF F Value Pr > F Rep Temp Trt Temp*Trt
93 82 Least Squares Means Standard Effect Trt Temp Estimate Error DF t Value Pr > t Temp*Trt T Temp*Trt U Temp*Trt T <.0001 Temp*Trt U <.0001 The SAS System 11:53 Saturday, June 25, The Mixed Procedure Least Squares Means Standard Effect Trt Temp Estimate Error DF t Value Pr > t Temp*Trt T <.0001 Temp*Trt U <.0001 Temp Temp <.0001 Temp <.0001 Trt T <.0001 Trt U <.0001 Differences of Least Squares Means Standard Effect Trt Temp _Trt _Temp Estimate Error DF t Value Pr > t Adjustment Temp*Trt T 10 U Tukey-Kramer Temp*Trt T 10 T <.0001 Tukey-Kramer Temp*Trt T 10 U <.0001 Tukey-Kramer Temp*Trt T 10 T <.0001 Tukey-Kramer Temp*Trt T 10 U <.0001 Tukey-Kramer Temp*Trt U 10 T <.0001 Tukey-Kramer Temp*Trt U 10 U <.0001 Tukey-Kramer
94 83 The SAS System 11:53 Saturday, June 25, The Mixed Procedure Differences of Least Squares Means Effect Standard Trt Temp _Trt _Temp Estimate Error DF t Value Pr > t Adjustment Temp*Trt U 10 T <.0001 Tukey-Kramer Temp*Trt U 10 U <.0001 Tukey-Kramer Temp*Trt T 20 U Tukey-Kramer Temp*Trt T 20 T Tukey-Kramer Temp*Trt T 20 U <.0001 Tukey-Kramer Temp*Trt U 20 T Tukey-Kramer Temp*Trt U 20 U Tukey-Kramer Temp*Trt T 30 U Tukey-Kramer Temp Tukey Temp Tukey Temp Tukey Trt T U Tukey-Kramer Differences of Least Squares Means Effect Trt Temp _Trt _ Temp Adj P Temp*Trt T 10 U Temp*Trt T 10 T 20 <.0001 Temp*Trt T 10 U 20 <.0001 Temp*Trt T 10 T 30 <.0001
95 84 The SAS System 11:53 Saturday, June 25, The Mixed Procedure Differences of Least Squares Means Effect Trt Temp _Trt _Temp Adj P Temp*Trt T 10 U 30 <.0001 Temp*Trt U 10 T 20 <.0001 Temp*Trt U 10 U 20 <.0001 Temp*Trt U 10 T 30 <.0001 Temp*Trt U 10 U 30 <.0001 Temp*Trt T 20 U Temp*Trt T 20 T Temp*Trt T 20 U 30 <.0001 Temp*Trt U 20 T Temp*Trt U 20 U Temp*Trt T 30 U Temp Temp Temp Trt T U
96 85 The SAS System 11:53 Saturday, June 25, Plot of StudentResid*Pred. Legend: A = 1 obs, B = 2 obs, etc. S t 2 A A u A A d B B e A A A A n A A B t A A A A C i 0 CC z F A A A A e C A d A A A B A A R A e -2 A A s i A d u a l Predicted The SAS System 11:53 Saturday, June 25, The UNIVARIATE Procedure Variable: Resid (Residual) Moments N 54 Sum Weights 54 Mean 0 Sum Observations 0 Std Deviation Variance Skewness Kurtosis Uncorrected SS Corrected SS Coeff Variation. Std Error Mean
97 86 Basic Statistical Measures Location Variability Mean Std Deviation Median Variance Mode. Range Interquartile Range The SAS System 11:53 Saturday, June 25, The UNIVARIATE Procedure Variable: Resid (Residual) Tests for Location: Mu0=0 Test -Statistic p Value Student's t t 0 Pr > t Sign M -3 Pr >= M Signed Rank S 23.5 Pr >= S Tests for Normality Test --Statistic p Value Shapiro-Wilk W Pr < W Kolmogorov-Smirnov D Pr > D > Cramer-von Mises W-Sq Pr > W-Sq > Anderson-Darling A-Sq Pr > A-Sq > Quantiles (Definition 5) Quantile Estimate 100% Max %
98 87 The SAS System 11:53 Saturday, June 25, The UNIVARIATE Procedure Variable: Resid (Residual) Quantiles (Definition 5) Quantile Estimate 95% % % Q % Median % Q % % % % Min Extreme Observations Lowest Highest----- Value Obs Value Obs The SAS System 11:53 Saturday, June 25, The UNIVARIATE Procedure Variable: Resid (Residual) Extreme Observations Lowest Highest----- Value Obs Value Obs
99 88 The SAS System 11:53 Saturday, June 25, The UNIVARIATE Procedure Variable: Resid (Residual) Stem Leaf # Boxplot *-----*
100 89 The SAS System 11:53 Saturday, June 25, The UNIVARIATE Procedure Variable: Resid (Residual) Normal Probability Plot * * +* *** ** ***+ * **** ** * +*** ****** ** **+ ***** * * *+* *
101 90 APPENDIX B. MODIFIED WET DISTILLERS GRAINS WITH SOLUBLES DRY MATTER LOSS FOR 21 DAYS USING DIRECT DRY MATTER DETERMINATION METHOD Preservative Level Temperature ( o C) Untreated (0% w/w) Treated (0.1% w/w) Mean Mean

102 91 APPENDIX C. EXPERIMENTAL SETUP AND COMPONENTS Figure B1. Diagram showing carbon dioxide measurement setup.

103 Figure B2. Rosemount gas analyzer, flow meter, stacks of manifolds and condenser components of carbon dioxide measurement setup. 92

104 93 APPENDIX D. VISUAL OBSERVATIONS MADE DURING MODIFIED WET DISTILLERS GRAINS STORAGE NB: First three samples are preservative treated whereas the last three samples are untreated samples. Order of arrangement follows thought all the environmental chambers. Figure C1. Day 0; samples stored at 10 o C.

105 Figure C2. Day 7: samples stored at 10 o C. 94

106 Figure C3. Day 14: samples stored at 10 o C. 95

107 Figure C4. Day 21: samples stored at 10 o C. 96

108 Figure C5. Day 0: samples stored at 20 o C. 97

109 Figure C6. Day 7: samples stored at 20 o C. 98

110 Figure C7. Day 14: samples stored at 20 o C. 99

111 Figure C8. Day 21: samples stored at 20 o C. 100

112 Figure C9. Day 0: samples stored at 30 o C. 101

113 Figure C10. Day 7: samples stored at 30 o C. 102

114 Figure C11. Day 14: samples stored at 30 o C. 103

115 Figure C12. Day 21: samples stored at 30 o C. 104
THE ROLE OF THE U.S. ETHANOL INDUSTRY IN FOOD AND FEED PRODUCTION
 FEEDING THE FUTURE: THE ROLE OF THE U.S. ETHANOL INDUSTRY IN FOOD AND FEED PRODUCTION SEPTEMBER 2008 RENEWABLE FUELS ASSOCIATION ONE MASSACHUSETTS AVENUE, NW WASHINGTON, D.C. 20001 202.289.3835 www.ethanolrfa.org
World. Nation. Fueling a. Feeding the THE ROLE OF THE U.S. ETHANOL INDUSTRY IN FOOD AND FEED PRODUCTION.
 Fueling a Nation Feeding the World THE ROLE OF THE U.S. ETHANOL INDUSTRY IN FOOD AND FEED PRODUCTION www.ethanolrfa.org The American ethanol industry has established itself as a major supplier of liquid
co-products ethanol for cattle Distillers Grains for Beef Cows
 ethanol co-products for cattle Distillers Grains for Beef Cows Iowa s ethanol industry is alive, vibrant and currently producing large volumes of feed coproducts. Based on surveys conducted by the California
Corn Wet Mill Improvement and Corn Dry Mill Improvement Pathways Summary Description
 Corn Wet Mill Improvement and Corn Dry Mill Improvement Pathways Summary Description DE Pathway bjectives The Biomass Program objective for both the corn wet mill and dry mill pathways is to improve the
Biorefinery for Corn Dry Grind Ethanol Production
 Biorefinery for Corn Dry Grind Production Associate Professor Department of Agricultural & Biological Engineering University of Illinois at Urbana-Champaign Workshop Biorefineries: Recent Advances and
OPTIMAL DISTILLERS DISTRIBUTION PLANNING IN AN ETHANOL SUPPLY CHAIN. A Thesis by. Qamar Iqbal
 OPTIMAL DISTILLERS DISTRIBUTION PLANNING IN AN ETHANOL SUPPLY CHAIN A Thesis by Qamar Iqbal Bachelor of Engineering, NED University of Engg. & Tech., 2001 Submitted to the Department of Industrial and
Developments of Corn for Dry Grind Corn Processing
 Developments of Corn for Dry Grind Corn Processing Vijay Singh, Kent Rausch, Carl Miller and Jim Graeber University of Illinois at Urbana-Champaign Syngenta Inc. Bioenergy-I I Conference March 5-10, 5
Managing Aerobic Stability
 Managing Aerobic Stability Patrick C. Hoffman and David K. Combs University of Wisconsin-Madison Aerobic instability of silages and high moisture corn at feedout is a common problem. Common symptoms are
Typical Ethanol Plant
 Ethanol is commercially produced in one of two ways, using either the wet mill or dry mill process. Wet milling involves separating the grain kernel into its component parts (germ, fiber, protein, and
Utilizing Coproducts in the Grazing Program
 Utilizing Coproducts in the Grazing Program Dr. Dan Shike Assistant Professor University of Illinois Introduction The rapidly expanding ethanol industry is changing the dynamics of the beef industry. US
Corn Silage for Beef Cattle
 1 of 7 11/13/2009 3:48 PM University of Missouri Extension G2061, Reviewed October 1993 Corn Silage for Beef Cattle Homer B. Sewell Department of Animal Sciences Howell N. Wheaton Department of Agronomy
ACE 427 Spring Lecture 7. by Professor Scott H. Irwin
 ACE 427 Spring 2012 Lecture 7 Forecasting Crop Prices Using Fundamental Analysis: Maximum Bid Price Models by Professor Scott H. Irwin Required Reading: Babcock B.A. Mandates, Tax Credits, and Tariffs:
A Producer Survey of Feeding Corn Co-Products in Iowa
 Animal Industry Report AS 654 ASL R2293 2008 A Producer Survey of Feeding Corn Co-Products in Iowa Justin Lain Daryl R. Strohbehn Dennis DeWitt Russ Euken Denise Schwab See next page for additional authors
Distillers Grains Feeding and Beef Quality
 MEAT PROPERTIES: HOW BEEF AND PORK QUALITY ARE AFFECTED BY SHIFTS IN ANIMAL NUTRITION REGIMENS Distillers Grains Feeding and Beef Quality Galen E. Erickson, Terry Klopfenstein and Virgil Bremer Introduction
THE EFFECTS OF CO-ENSILING WET DISTILLER S GRAINS PLUS SOLUBLES WITH CORN SILAGE ON GROWTH PERFORMANCE OF BRED BEEF HEIFERS DURING LATE PREGNANCY
 THE EFFECTS OF CO-ENSILING WET DISTILLER S GRAINS PLUS SOLUBLES WITH CORN SILAGE ON GROWTH PERFORMANCE OF BRED BEEF HEIFERS DURING LATE PREGNANCY By: R. P. Arias, R. P. Lemenager 2, L. Unruh-Snyder, and
ELEMENTARY CURRICULUM CORN ETHANOL. Fueling Our Future
 ELEMENTARY CURRICULUM CORN ETHANOL Fueling Our Future I. Enduring Knowledge: Students will understand how the application of new technologies in corn production can transform Wisconsin farming to make
COMPARING RESIDUAL PRODUCTION FROM TWO ALCOHOL FUEL PROCESSES: AN ECONOMIC EVALUATION. Stephen L. Ott
 ..... ESO 863 S~T~ 1i
Producing Premium DDGS
 Producing Premium DDGS Can it be Achieved in a Commodity Driven Market? Tara Vigil Vice President Business Development Ethanol Plant Profit Considerations Feedstock Dominates Costs Ethanol Dominates Revenue
The University of Georgia
 The University of Georgia Center for Agribusiness and Economic Development College of Agricultural and Environmental Sciences The Economic Feasibility of Operating an Advanced Ethanol Production Facility
ETHANOL BYPRODUCTS FOR BEEF & DAIRY CATTLE PERCEPTION VS REALITY
 ETHANOL BYPRODUCTS FOR BEEF & DAIRY CATTLE PERCEPTION VS REALITY Rick Stock Cargill Sweeteners North America Blair, NE rick_stock@cargill.com Distillers grains are an excellent source of protein and energy.
Nutrient Cycling in Corn for Bioenergy
 Nutrient Cycling in Corn for Bioenergy Lance Murrell, Consultant Scott Murrell, Paul Fixen IPNI 2008 Ann. Joint Mtg., Houston, TX. 5-9 Oct. 2008 Nutrient Distribution Removal?! Uptake Losses Application
MICROBES IN INDUSTRY. INDUSTRIAL PRODUCTS Microbes are used in the production of many products
 MICROBES IN INDUSTRY INDUSTRIAL PROCESS USING MICROBES Yeast and bacteria are used in producing medicines Microbes are used in food production and they play significant roles in food spoilage and contamination
Emerging Ethanol Industry: Implications for Animal Manure Management
 University of Nebraska Lincoln Extension RP192 Emerging Ethanol Industry: Implications for Animal Manure Management Summary of Heartland Water Coordination Initiative Animal Manure Management Round-Table
Ration Guard in Total Mixed Rations
 Ration Guard in Total Mixed Rations Keep rations fresher and cooler during the hot summer months! Heat Stress on Dairy Cows F 40 45 50 55 60 65 70 75 80 85 90 95 100 Stress Level 75 NO STRESS MILD 80 85
IMPACTS OF ETHANOL CO-PRODUCTS ON 2011/12 CORN AND SOYBEAN SUPPLIES AND ACREAGE
 IMPACTS OF ETHANOL CO-PRODUCTS ON 2011/12 CORN AND SOYBEAN SUPPLIES AND ACREAGE December 2012 KEY POINTS While biofuel critics claim 40% of the corn supply is being used for ethanol production, the actual
Crop Residue Utilization by Beef Cows
 South Dakota State University Open PRAIRIE: Open Public Research Access Institutional Repository and Information Exchange South Dakota Cow-Calf Field Day Proceedings, 1975 Animal Science Reports 1975 Crop
Ethanol Co-Product Use in U.S. Cattle Feeding
 United States Department of Agriculture FDS-09D-01 April 2009 A Report from the Economic Research Service Ethanol Co-Product Use in U.S. Cattle Feeding www.ers.usda.gov Lessons Learned and Considerations
Impact of Feeding Distillers Grains on Nutrient Planning for Beef Cattle Systems
 University of Nebraska Lincoln Extension RP190 Impact of Feeding Distillers Grains on Nutrient Planning for Beef Cattle Systems Teshome Regassa, Extension Water Quality Specialist Rick Koelsch, Extension
Silage for beef cattle 2018 CONFERENCE. sponsored by: LALLEMAND ANIMAL NUTRITION
 Silage for beef cattle 2018 CONFERENCE sponsored by: LALLEMAND ANIMAL NUTRITION Corn Silage and Earlage Characteristics and Use in Iowa (2017) An Iowa Beef Center Project Russ Euken ISU Extension Livestock
Magnitude and Variability in Emissions Savings in the Corn-Ethanol Life Cycle from Feeding Co-Products to Livestock
 Magnitude and Variability in Emissions Savings in the Corn-Ethanol Life Cycle from Feeding Co-Products to Livestock CRC Life Cycle Assessment Workshop, Chicago, Oct. 20-21, 2009 Virgil R. Bremer 1, Adam
LIMIT FEEDING CONCENTRATE DIETS TO BEEF COWS AS AN ALTERNATIVE TO FEEDING HAY. David Lalman, Extension Beef Cattle Specialist OSU Animal Science
 LIMIT FEEDING CONCENTRATE DIETS TO BEEF COWS AS AN ALTERNATIVE TO FEEDING HAY David Lalman, Extension Beef Cattle Specialist OSU Animal Science Introduction In years when hay and forage production is low
Adding value to coproducts. Keith Waldron.
 Adding value to coproducts Keith Waldron. Topics for consideration Deriving higher quality animal feed from 1G ddgs Consideration of potential for human consumption Possible routes to valorisation of 2G
Market Issues and Prospects for U.S. Distillers Grains
 United States Department of Agriculture FDS-10k-01 December 2010 A Report from the Economic Research Service www.ers.usda.gov Market Issues and Prospects for U.S. Distillers Grains Supply, Use, and Price
THE COLORADO EXPERIMENT STATION
 Press Bulletin 78 September, 1932 THE COLORADO EXPERIMENT STATION FORT COLLINS RATION EXPERIMENT WITH CALVES PROGRESS REPORT OF LIVESTOCK FEEDING EXPERIMENT 1932 By GEO. E. MORTON and H. B. OSLAND Summary
A Case Study of East Kansas Agri-Energy
 A Case Study of East Kansas Agri-Energy Introduction A Case Study of East Kansas Agri-Energy East Kansas Agri-Energy (EKAE) is one of seven ethanol production plants in the state of Kansas as of 2007.
More Feed = More Milk. Dry Matter Intake Used To Express Feed. Intake ASC-135. Donna M. Amaral-Phillips, Roger W. Hemken, and William L.
 More Feed = ASC-135 More Donna M. Amaral-Phillips, Roger W. Hemken, and William L. Crist Feed intake governs the amount of each nutrient a cow receives and the amount of milk she can potentially produce.
ETHANOL PRODUCTION IN OKLAHOMA
 ETHANOL PRODUCTION IN OKLAHOMA By: Andrew Abatiell, Jason Ireland, Joseph Odusina, Daniel Silva Rajoo, Zafar Zaidi Capstone Design Project- University of Oklahoma - Spring 2003 INTRODUCTION Ethanol is
Finishing Beef Cattle on Grass Supplemented with Self-fed By-Products
 Animal Industry Report AS 652 ASL R2067 2006 Finishing Beef Cattle on Grass Supplemented with Self-fed By-Products Mark S. Honeyman, honeyman@iastate.edu James R. Russell Daniel G. Morrical Dallas L. Maxwell
Cow/calf Management Winter and Spring
 $/ Pair 2/13/2013 Cow/calf Management Winter and Spring Rick Rasby Beef Specialist University of Nebraska 100 Years of Weather in the U.S. 3 4 Northern Nebraska Rates for Pasture ($/Cow-Calf pair per Month,
Steady Supplies or Stockpiles? Demand for Corn-Based Distillers Grains by the U.S. Beef Industry
 Steady Supplies or Stockpiles? Demand for Corn-Based Distillers Grains by the U.S. Beef Industry Roxanne Clemens and Bruce A. Babcock MATRIC Briefing Paper 08-MBP 14 March 2008 Midwest Agribusiness Trade
FEEDING HORSES WHEN FEED IS SHORT R.J. (Bob) Coleman Ph.D. PAS
 Coleman Ph.D. PAS") FEEDING HORSES WHEN FEED IS SHORT R.J. (Bob) Coleman Ph.D. PAS University of Kentucky Feeding programs for horses should be based on quality forage. However, when Mother Nature does not cooperate as in
FEEDING HORSES WHEN FEED IS SHORT R.J. (Bob) Coleman Ph.D. PAS University of Kentucky Feeding programs for horses should be based on quality forage. However, when Mother Nature does not cooperate as in
Phosphorus Requirements of Different Species, Phytase Feeding, and Ration Formulation
 Phosphorus Requirements of Different Species, Phytase Feeding, and Ration Formulation By Ron Kincaid - WSU Capturing energy from our food is done by forming high-energy P bonds. Synthesis of proteins and
Value of Modified Wet Distillers Grains in Cattle Diets without Corn
 AS 653 ASL R2184 2007 Value of Modified Wet Distillers Grains in Cattle Diets without Corn Allen H. Trenkle Iowa State University Recommended Citation Trenkle, Allen H. (2007) "Value of Modified Wet Distillers
Distillers Grains DDGS EXPORT MARKET UPDATE. Shipping It Out. Quarterly. Plus: Getting a Handle on the Parameters of Granular Flow
 Distillers Grains 2006 SECOND QUARTER Quarterly Shipping It Out DDGS EXPORT MARKET UPDATE Plus: Getting a Handle on the Parameters of Granular Flow Hitting the Mark with Dairy Cattle Rations Grains Without
UTILIZATION OF AGRICULTURAL BY-PRODUCTS IN TAIWAN
 UTILIZATION OF AGRICULTURAL BY-PRODUCTS IN TAIWAN An-Kuo Su Heng-Chun Station Taiwan Livestock Research Institute Taiwab ABSTRACT An abundance of agricultural by-products have been used to feed dairy and
SOLUTIONS. Developing Whole-Farm Nutrient Plans for Feedlots. For Open Feedlot Operators
 Developing Whole-Farm Nutrient Plans for Feedlots Iowa is a state with many farmer/feeders. Manure from feedlot cattle is a valuable source of fertilizer nutrients. However, as agriculture, as a whole,
Canola Meal & The Beef Industry. J. McKinnon & K. Wallburger University of Saskatchewan & B. Doig Saskatchewan Agriculture & Food
 Canola Meal & The Beef Industry J. McKinnon & K. Wallburger University of Saskatchewan & B. Doig Saskatchewan Agriculture & Food Canadian Total Cattle & Calves January 1-1998 to 2008P 16 15 Million Head
USDA s 2002 Ethanol Cost-of-Production Survey
 United States Department of Agriculture Agricultural Economic Report Number 841 July 25 USDA s 22 Ethanol Cost-of-Production Survey Hosein Shapouri and Paul Gallagher U.S. Department of Agriculture, Office
AMENDMENTS TO THE IMSBC CODE, INCLUDING EVALUATION OF PROPERTIES OF SOLID BULK CARGOES. Dried Distillers Grains with Solubles (DDGS)
") E SUB-COMMITTEE ON DANGEROUS GOODS, SOLID CARGOES AND CONTAINERS 15th session Agenda item 4 DSC 15/4/2 7 June 2010 Original: ENGLISH AMENDMENTS TO THE IMSBC CODE, INCLUDING EVALUATION OF PROPERTIES OF
E SUB-COMMITTEE ON DANGEROUS GOODS, SOLID CARGOES AND CONTAINERS 15th session Agenda item 4 DSC 15/4/2 7 June 2010 Original: ENGLISH AMENDMENTS TO THE IMSBC CODE, INCLUDING EVALUATION OF PROPERTIES OF
Corn Silage and Earlage Nutrient Analysis
 Animal Industry Report AS 664 ASL R3218 2018 Corn Silage and Earlage Nutrient Analysis Russ Euken Iowa State University, eldeters@iastate.edu Recommended Citation Euken, Russ (2018) "Corn Silage and Earlage
Measuring Supply-Use of Distillers Grains in the United States
 Measuring Supply-Use of Distillers Grains in the United States Daniel O Brien, Extension Agricultural Economist, K-State Research and Extension Robert Wisner, University Professor Emeritus, Iowa State
Improved Uses and Values for the Byproducts of the Developing Biofuels Industry
 Iowa State University From the SelectedWorks of Kurt A. Rosentrater August 25, 2008 Improved Uses and Values for the Byproducts of the Developing Biofuels Industry Kurt A. Rosentrater, United States Department
Conversion of Corn-Kernel Fiber in Conventional Fuel-Ethanol Plants
 Conversion of Corn-Kernel Fiber in Conventional Fuel-Ethanol Plants Executive Summary National Corn to Ethanol Research Center Ethanol derived from corn-kernel fiber is qualified as cellulosic biofuel
Kansas Corn: Ethanol - Corn Mash and Distillation High School Student Lab Packet
 Kansas Corn: Ethanol - Corn Mash and Distillation High School Student Lab Packet Overview In this lab, students will learn about ethanol and its important role in our world s ever-increasing demand for
Revised Estimated Returns Series Beginning in 2007
 Revised Estimated Returns Series Beginning in 2007 The Economics Department at Iowa State University has prepared monthly Estimated Returns to Feeding Livestock in Iowa since the 1960s. Each month the
Kansas Corn: Ethanol - Corn Mash and Distillation High School Student Lab Packet
 Kansas Corn: Ethanol - Corn Mash and Distillation High School Student Lab Packet Overview In this lab, students will learn about ethanol and its important role in our world s everincreasing demand for
Pasture Supplementation of Distillers Dried Grains to Growing Heifers in Southern Iowa
 Animal Industry Report AS 654 ASL R2294 2008 Pasture Supplementation of Distillers Dried Grains to Growing Heifers in Southern Iowa Daniel D. Loy H. Joe Sellers Daryl R. Strohbehn Daniel G. Morrical Dennis
IMPACT OF ETHANOL EXPANSION ON THE CATTLE FEEDING INDUSTRY. A Thesis ERIN DALEY
 IMPACT OF ETHANOL EXPANSION ON THE CATTLE FEEDING INDUSTRY A Thesis by ERIN DALEY Submitted to the Office of Graduate Studies at Texas A&M University in partial fulfillment of the requirements for the
Hay Quality. Bringing information and education into the communities of the Granite State
 Bringing information and education into the communities of the Granite State Hay Quality Carl Majewski, UNH Extension Field Specialist, Food & Agriculture The state of maturity at harvest plays a major
UTILISATION OF INDUSTRIAL ENZYMES TO PRODUCE BIOETHANOL FROM AUTOCHTHONOUS ENERGY CROPS. Abstract
 I. Stroia, et all. Journal of Agroalimentary Processes and Technologies, Volume XIII, No.2 (2007), 263-270 Full Paper Food Technology and Processing UTILISATION OF INDUSTRIAL ENZYMES TO PRODUCE BIOETHANOL
Planning for silage success
 Planning for silage success Mark Nooijen Ruminant Technical Manager Jutta Zwielehner Product Manager 2 Science & Solutions December 2013 Mark Nooijen Ruminant Technical Manager Jutta Zwielehner Product
Beef Cattle Handbook
 Beef Cattle Handbook BCH-5403 Product of Extension Beef Cattle Resource Committee Feeding The Beef Cow Herd Part II Managing the Feeding Program Rick Rasby, Extension Beef Specialist, University of Nebraska
Proceedings, State of Beef Conference November 2 and 3, 2016, North Platte, Nebraska OPTIMUM MANAGMEMENT FOR BACKGROUNDING SYSTEMS
 Proceedings, State of Beef Conference November 2 and 3, 2016, North Platte, Nebraska OPTIMUM MANAGMEMENT FOR BACKGROUNDING SYSTEMS Jim MacDonald, PhD, PAS Department of Animal Science, University of Nebraska-Lincoln
BEEF FACTS. The goal of the Center for Research and Knowledge Management at the National Cattlemen s Beef. Product Enhancement/Beef Safety
 BEEF FACTS Product Enhancement/Beef Safety Ethanol Co-Products Beef Implications Summit Introduction The goal of the Center for Research and Knowledge Management at the National Cattlemen s Beef Association
Curtis L. Weller. Department of
 Sorghum as Feedstock for Ethanol Production Sept. 2007 Curtis L. Weller Department of Biological Systems Engineering References for Ethanol Production and Sweet Sorghum Information National Sorghum Producers
How Much Energy Does It Take to Make a Gallon of Ethanol?
 How Much Energy Does It Take to Make a Gallon of Ethanol? David Lorenz and David Morris August 1995 1995 Institute for Local-Self Reliance (ILSR) Reproduction permitted with attribution to ILSR One of
Webster County Diversified Agriculture Conference
 Webster County Diversified Agriculture Conference Presented By Andy McCorkill Livestock Specialist University of Missouri Extension Ph: (417) 345 7551 Email: mccorkilla@missouri.edu Discussion Reasons
Inoculants for Silage
 Inoculants for Silage Zwi G. Weinberg Forage Preservation and By-Products Research Unit The Volcani Center, Israel Presentation Outline Principles of Food preservation Methods of forage preservation The
What Hay Is Right For Your Livestock. Tom Gallagher Capital Area Agriculture Horticulture Program Livestock Specialist
 What Hay Is Right For Your Livestock Tom Gallagher Capital Area Agriculture Horticulture Program Livestock Specialist What Have We Learned So Far? Renovate fields Establish new stands Maintain existing
Agricultural and Biological Engineering. Biological Manipulation of Manure: Getting What You Want from Animal Manure
 College of Agricultural Sciences Cooperative Extension Agricultural and Biological Engineering Biological Manipulation of Manure: Getting What You Want from Animal Manure G 87 Jeannie A. Leggett, Extension
POCKET GUIDE TO ETHANOL 2017
 POCKET GUIDE TO ETHANOL 2017 x ETHANOL BASICS Ethanol is a biodegradable, high-octane motor fuel derived from the sugars, starches, and cellulosic matter found in plants. It has been used as a fuel since
A COMPARISON OF BARLEY DISTILLERS DRIED GRAIN, SUNFLOWER MEAL AND SOYBEAN OIL MEAL AS PROTEIN SUPPLEMENTS IN BACKGROUNDING RATIONS
 A COMPARISON OF BARLEY DISTILLERS DRIED GRAIN, SUNFLOWER MEAL AND SOYBEAN OIL MEAL AS PROTEIN SUPPLEMENTS IN BACKGROUNDING RATIONS BY D. G. Landblom, J. L. Nelson and LaDon Johnson Introduction: Agricultural
T. W. Perry organized the material presented in this report and prepared the initial draft of the manuscript.
 This publication is sponsored by the Agricultural Experiment Stations of Illinois, Indiana, Iowa, Kansas, Michigan, Minnesota, Missouri, Nebraska, North Dakota, Ohio, South Dakota, and Wisconsin and by
Opportunities and Challenges for Cow/Calf Producers 1. Rick Rasby Extension Beef Specialist University of Nebraska
 Opportunities and Challenges for Cow/Calf Producers 1 Rick Rasby Extension Beef Specialist University of Nebraska Introduction The cow/calf enterprise has been a profitable enterprise over the last few
On the Physical Properties of Distillers Dried Grains with Solubles (DDGS)
") Iowa State University From the SelectedWorks of Kurt A. Rosentrater July, 2008 On the Physical Properties of Distillers Dried Grains with Solubles (DDGS) Klein Ileleji, Purdue University Kurt A. Rosentrater,
Iowa State University From the SelectedWorks of Kurt A. Rosentrater July, 2008 On the Physical Properties of Distillers Dried Grains with Solubles (DDGS) Klein Ileleji, Purdue University Kurt A. Rosentrater,
Phosphorus Concentrations and Flow in Maize Wet-Milling Streams
 Phosphorus Concentrations and Flow in Maize Wet-Milling Streams Kent D. Rausch, 1,2 Lutgarde M. Raskin, 3 Ronald L. Belyea, 4 Roderick M. Agbisit, 1 Becky J. Daugherty, 3 Thomas E. Clevenger, 5 and M.
CORN, ALFALFA AND GRASS SILAGE PRESERVATION PRINCIPLES. R. E. Muck 1. Abstract
 CORN, ALFALFA AND GRASS SILAGE PRESERVATION PRINCIPLES R. E. Muck 1 Abstract Ensiling is the primary means of preserving moist forages for feeding livestock. In ensiling, the crop is stored anaerobically,
Abstract Process Economics Program Report 280 COMPENDIUM OF LEADING BIOETHANOL TECHNOLOGIES (December 2011)
") Abstract Process Economics Program Report 280 COMPENDIUM OF LEADING BIOETHANOL TECHNOLOGIES (December 2011) The use of ethanol as an alternative motor fuel has been steadily increasing around the globe
Abstract Process Economics Program Report 280 COMPENDIUM OF LEADING BIOETHANOL TECHNOLOGIES (December 2011) The use of ethanol as an alternative motor fuel has been steadily increasing around the globe
Low Cost Rations for More Milk Dollars
 LO Series 104 - January 1968 Low Cost Rations for More Milk Dollars W. Ray Murley, Extension Dairy Specialist CJ D Adequate feeding of the dairy herd for optimum performance and economical production is
Corn Processing Coproducts from Ethanol Production
 Corn Processing Coproducts from Ethanol Production By Ronald L. Belyea University of Missouri Kent D. Rausch Vijay Singh M.E. Tumbleson University of Illinois Paper presented at a conference on Biofuels,
ECONOMIC AND TECHNICAL ANALYSIS OF ETHANOL DRY MILLING: MODEL DESCRIPTION
 ECONOMIC AND TECHNICAL ANALYSIS OF ETHANOL DRY MILLING: MODEL DESCRIPTION by Rhys T. Dale and Wallace E. Tyner Staff Paper # 06-04 April 2006 Agricultural Economics Department Purdue University Purdue
What Can We Do With All This. C. Merritt, C&S Engineers. Food Waste?
 What Can We Do With All This C. Merritt, C&S Engineers Food Waste? Here s the Deal How big is this problem- Food is one of the big 4 (water, energy and climate change) Sources of food wastes What are the
TITLE TITLE. Specialty Animal Presented Feed by: Products: Title for ICM, Inc. the Biofuels Industry. Steve Hartig, VP Technology Development
 Specialty Animal Presented Feed by: Products: A New Market for the Biofuels Industry Steve Hartig, VP Technology Development ICM COMPANY PROFILE 2017 ICM, Inc. All Rights Reserved 2017 ICM, Inc. All Rights
Market utilization overview. Grain Farmers of Ontario
 Market utilization overview Grain Farmers of Ontario Introduction AGRICULTURE IS AN important economic driver for the province of Ontario. In 2016, more than 13 million metric tonnes of barley, corn,
Novozymes Innovative & Sustainable Solutions for Grain Alcohol distillers
 Novozymes Innovative & Sustainable Solutions for Grain Alcohol distillers Sustainability Novozymes commitment For more than ten years, Novozymes has been recognized as one of the most sustainable companies
National Corn-to-Ethanol Research Center
 National Corn-to-Ethanol Research Center TM Summary Report for Pursuit Dynamics May 3, 2008 Prepared by: B.A. Wrenn Table of Contents page Executive Summary 1 Introduction 2 Objective 4 Experimental 4
There are various VOC sources in dairy operations: cows
 1 There are various VOC sources in dairy operations: cows 2 Commodities, especially, when exposed to the elements (sun, rain, wind) 3 Silages 4 Feedbunk 5 Farm Equipment 6 Manure Ponds 7 Farm Land 8 In
Performance and Carcass Traits of Market Beef Cattle Supplemented Self-Fed Byproducts on Pasture: Final Report
 AS 657 ASL R2592 2011 Performance and Carcass Traits of Market Beef Cattle Supplemented Self-Fed Byproducts on Pasture: Final Report Daniel Kiesling Daniel G. Morrical Daryl R. Strohbehn Mark S. Honeyman,
Corn Stover Update Jan 31 th, 2013
 Corn Stover Update Jan 31 th, 2013 Corn Yields will Double by 2030 Higher Corn Yields come with more residue Livingston County, IL 28 May 2010 Strip till corn after corn 2009 corn yield 230 bu/ac High
PERP Program - Ethanol New Report Alert
 PERP Program - Ethanol New Report Alert February 2006 Nexant s ChemSystems Process Evaluation/Research Planning program has published a new report, Ethanol (04/05-8). To view the table of contents or order
An Agriculture and AgriFood Canada funded Agriculture BioProducts Innovation Program (ABIP) grant.
 grant.") Feed Opportunities from the Biofuels Industries (FOBI) An Agriculture and AgriFood Canada funded Agriculture BioProducts Innovation Program (ABIP) grant. EPAC, June 2010 FOBI Mandate of FOBI network is
Feed Opportunities from the Biofuels Industries (FOBI) An Agriculture and AgriFood Canada funded Agriculture BioProducts Innovation Program (ABIP) grant. EPAC, June 2010 FOBI Mandate of FOBI network is
Corn Silage Additives. R. E. Muck USDA, ARS U.S. Dairy Forage Research Center Madison, WI
 Corn Silage Additives R. E. Muck USDA, ARS U.S. Dairy Forage Research Center Madison, WI Most Common Additives in U.S. Inoculants Standard inoculants Lactobacillus buchneri Combination inoculants Propionic
Global Warming. Department of Chemical Engineering
 Global Warming How Can Biofuels Help? Clint Williford Department of Chemical Engineering Introduction ti Greenhouse emissions Reducing growth of GHG emissions Biofuels Why and why now? What they are? How
CHEMICAL ANALYSES of ROUGHAGES for DAIRY CATTLE. the most from. ~ ~~ Getting CIRCULAR 994
 CIRCULAR 994 ~ ~~ Getting the most from CHEMICAL ANALYSES of ROUGHAGES for DAIRY CATTLE UNIVERSITY OF ILLINOIS COLLEGE OF AGRICULTURE COOPERATIVE EXTENSION SERVICE Kjeldahl equipment for determining nitrogen
19 th Annual Distillers Grains Symposium Symposium Overview
 DISTILLERS GRAINS TECHNOLOGY COUNCIL Increasing the awareness of the value of Distillers Grains 19 th Annual Distillers Grains Symposium Symposium Overview Kurt A. Rosentrater, Ph.D. Executive Director
THE FUTURE OF FORAGE QUALITY TESTING FOR MARKETS. Dan Putnam 1 ABSTRACT INTRODUCTION
 THE FUTURE OF FORAGE QUALITY TESTING FOR MARKETS Dan Putnam 1 ABSTRACT While the current fiber based system of utilizing RFV and TDN has been useful, incorporation of more dynamic analyses are needed.
Help in Choosing an Effective Silage Inoculant
 Department of Animal & Food Sciences 531 South College Avenue Newark, DE 19716-2150 Phone: 302-831-2522 FAX: 302-831-2822 Email: LKSILAGE@UDEL.EDU Help in Choosing an Effective Silage Inoculant Limin Kung,
Projected U.S. Corn Exports, Acreage and Production Under E-10, E-12 and E-15 Ethanol Policies
 Projected U.S. Corn Exports, Acreage and Production Under E-10, E-12 and E-15 Ethanol Policies Daniel O Brien, Extension Agricultural Economist, K-State Research and Extension July 19, 2010 This article
Understanding the 2011 Planting Outlook, Ethanol, and Food Pricing. March 31, 2011
 Understanding the 2011 Planting Outlook, Ethanol, and Food Pricing March 31, 2011 Planted acres by crop USDA Prospective Plantings report based on farmer surveys conducted during first two weeks of March
SUBMISSION BY STOCK FEED MANUFACTURERS COUNCIL OF AUSTRALIA & STOCK FEED MANUFACTURERS ASSOCIATION OF QUEENSLAND TO THE
 SFMAQ & SFMCA Submission SUBMISSION BY STOCK FEED MANUFACTURERS COUNCIL OF AUSTRALIA & STOCK FEED MANUFACTURERS ASSOCIATION OF QUEENSLAND TO THE QUEENSLAND BIOFUEL MANDATE JULY 2015 SUBMISSION BY THE STOCK