!"#$%&'"'"()!"#$%&'()!#)
|
|
|
- Kevin Clarke
- 6 years ago
- Views:
Transcription

1 !"#$%&'"'"(!"#$%&'(!# *+,-./0,1123, *+,/,6*9 :,;*.6.<327==<.45</51&27= *$+#,-+!$.+-($/'&01+!"$23+0'45$$ 67$8#+#(7$9':"-&5$ $

2 $ $ $ $ BCDDCE9$DF*F1B19F$ /'&01+!"$23+0'45$,+-!#:!5$40$+#5!-+#5$!"#$$ G'&0&'.#?$G'&0$,&:#5?$40$G'&0$+';#+5$-.$!"#$*(#+':4$/#5!H$ $ $ C4I3'+'#5$<-3!$!"'5$+#,-+!$40$ /'&01+!"$23+0'45J$/-+K$:4$<#$(0#$0'+#:!&7$!-L$ 8#+#(7$9':"-&5$ /'&01+!"$23+0'45$ MN>O$/74K--,?$D3'!#$>@M$ P#4;#+?$%E$Q@=@=$ >@>RNS>RTQAQ$U$M>@>$ V4':"-&5WG'&0#+!"X3+0'45H-+X$ $ $ $ $ Y/'&01+!"$23+0'45H$$*&&$+'X"!5$+#5#+;#0H$ Z+-4!$'(X#?$:-&$('4'4X$'4$[-G0#+$\';#+$65'4?$<7$6]BH$$$ 6:K$'(X#?$[-G0#+$\';#+$65'4?$<7$1:-Z&'X"!H$ 1
3 -JS#$%1'C$%4EM'"GGGGGGGGGGGGGGHHGGGGGGGGTT 6LED>JEO<$EM'"(-%J(%ED+'"#$%M5P'O'BFBJ5##%$MM=OJPEO /E%D'"(GGGHGGGGGGGGGGGGGGGGGGGGGGGGHTU 7$S>JEO<$EM'"(-%JQJMEOMBJ!"#$%D'"$>O'DEB$GGGGGGGHVI 6JOAB'J"MEB+E"#GGGGGGGGGGGGGGGGGGGGGGGHVU,"#7JB$MGGGGGGGGGGGGGGGGGGGGGGGGGGGVW 2
4 ,X,>!*23,6!&&51; Coal mining in the Powder River Basin is responsible for releasing more carbon dioxide than any other activity in the United States, making it a root contributor to global warming. Worse, a sham federal coal leasing program and a lack of attention from the federal government is hindering progress toward safeguarding the climate. Located in northeastern Wyoming and southeastern Montana, hundreds of millions of tons of coal are mined from the Powder River Basin every year and burned in coal-fired power plants throughout the country. In 2007, the region produced 42% of all coal in the U.S. more than any other region of the country and was the source of 40% of all carbon dioxide emitted by the nation s coal-fired power plants. Coal-fired power plants are the largest source of greenhouse gases in the U.S.; coal mining in the Powder River Basin is the primary source of coal to America s coal-fired power plants. Global warming is being fueled by carbon dioxide and other heat-trapping greenhouse gases released by human activities. Already, global warming is changing the climate, stressing water supplies, challenging agriculture, threatening the coasts, increasing public health risks, and undermining our economy. There is an urgent need to curb greenhouse gases in the U.S and address the impacts of coal mining in the Powder River Basin to the climate. Unfortunately, little progress is being made. All coal produced in the Powder River Basin is owned and leased by the federal government. Yet the Bureau of Land Management, the agency within the Department of Interior that oversees the coal leasing program, has declared the Powder River Basin to not be a coal production region. This sham designation has given coal companies more control over leasing, diminished competition and shortchanged the American public, and hindered the Bureau s ability to address global warming. The impact of coal mining in the Powder River Basin is likely to intensify as massive new mining proposals are pending. 12 new coal leases have been proposed, which would collectively mine up to 5.8 billion tons of coal as much coal as has been mined from the region in the last 20 years. Together, these proposals threaten to lead to the release of more than 10.6 billion tons (9.63 billion metric tons of carbon dioxide more than the amount released by 1.7 billion passenger vehicles annually. Solutions are at hand. To effectively respond to the climate crisis, the Bureau of Land Management needs to immediately focus on reforming coal mining in the Powder River Basin. To that end, it is imperative that the agency: Call a time-out on all new coal leasing in the Powder River Basin. Re-designate the Powder River Basin a coal production region to restore true competitiveness to the coal leasing process. 3
5 Prepare a regional environmental analysis that fully addresses the global warming impacts of coal mining in the Powder River Basin, and sets lease standards based on the need to reduce greenhouse gases. Address the impacts of any new coal leases by requiring coal companies to pay a carbon fee for new leases. Carbon fees should be used to create a Global Warming Impact Fund to support renewable energy development, habitat restoration, and other efforts to address the impacts of global warming. Fully transition away from coal and toward clean, renewable energy in the Powder River Basin. The State of Wyoming alone has enough renewable energy potential to more than meet the electricity needs of all 11 western states. Already, the groundwork for solutions has been laid. On September 14, 2009, Interior Secretary Ken Salazar proclaimed, The realities of climate change require us to change how we manage the land, water, fish and wildlife, and cultural heritage and tribal lands and resources we oversee. Secretary Salazar called for the development of a unified greenhouse gas emission reduction program among Department of Interior agencies. Secretary Salazar s Order was bolstered by President Obama, who on October 5, 2009 called on all federal agencies to measure, report, and reduce their greenhouse gas emissions from direct and indirect activities. Time is of the essence. The foundation for solutions has been set, but with the climate crisis projected to worsen, the Bureau of Land Management needs to act boldly and swiftly. The agency must meet the challenge of global warming and fulfill both President Obama s call for greenhouse gas reductions and Secretary Salazar s promise of change. The agency s leadership can ultimately transform the Powder River Basin from a key root of global warming to a key source of clean, renewable, and affordable energy. 4

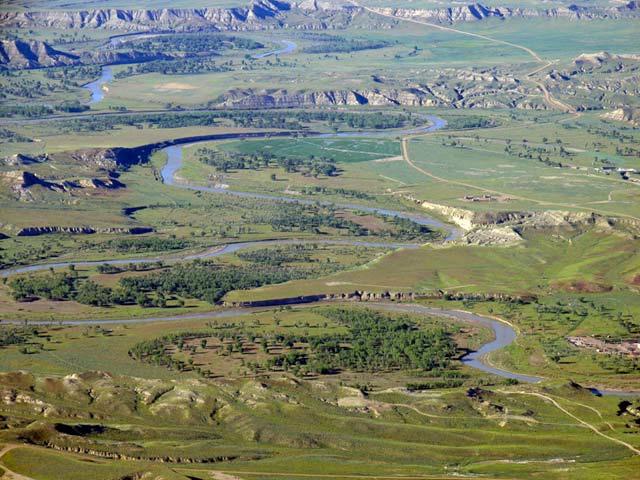
6 27*1.0!>*2.7 The Powder River Basin is located in northeastern Wyoming and southeastern Montana in the Western United States, and covers an area of roughly 24,000 square miles. See Figure 1. The region is named because it is drained primarily by the Powder River, although other rivers including the Big Horn, Tongue, Little Missouri, Belle Fourche, and Cheyenne also drain the area. The region is characterized by broad plains, rolling hills, and tablelands that vary in elevation from 2,500-6,000 feet above sea level. 1 See Figure 2. Mixed grass prairie and sagebrush dominate the landscape, providing habitat for a diversity of wildlife including sage grouse, black-tailed prairie dog, ferruginous hawk, mountain plover, burrowing owl, golden eagle, deer, and elk. 2 Figure 1. The Powder River Basin of Northeastern Wyoming and Southeastern Montana. 3 5


7 Some of the largest deposits of subbituminous coal in the world underlie the Powder River Basin. 4 Subbituminous coal from the region is low in sulfur, although it is also low in energy content. 5 On average, coal from the Powder River Basin contains 38% less energy than coal from the Appalachian region of the eastern U.S. 6 These large coal deposits make the Powder River Basin the single largest source of coal in the U.S. In 2008 alone, a record 495,964,000 tons of coal were mined from the region 42% of all coal produced in the U.S. and more than any other region of the country. 7 The Powder River Basin produces 1.25 times more coal than the entire Appalachian Region of the U.S. and more than three times the amount produced by the rest of the Western U.S., including Colorado, New Mexico, and Utah. 9 See Figure 2. Figure 2. Rolling hills and sagebrush, Powder River Basin. 8 Figure 3. Coal produced in the United States by region (in thousands of tons. 10 6

8 Over the years, coal production has steadily increased in the Powder River Basin. Just since 2000, coal production has increased by nearly 40%, from 360 million tons to a record of 494 million tons annually. See Figure 4. In 2008, production levels approached a record 500 million tons. 11 Figure 4. Coal production in the Powder River Basin, The Wyoming portion of the Powder River Basin produces the vast majority of coal in the Powder River Basin. In 2008, 451,701,585 tons of coal were mined from a total of 13 mines in the Wyoming portion of the Powder River Basin, all located near the town of Gillette. 13 See Table 1. These mines are primarily operated by large, often multinational, mining companies including the Australian-based Rio Tinto Energy and Peabody, the world s largest private-sector coal company. In 2008, the top 10 producing coal mines in the U.S. were all located in the Powder River Basin. 14 7
9 Table 1. Coal Mine Production in the Wyoming Portion of the Powder River Basin, Mine Name Owner Tons of Coal North Antelope/Rochelle Peabody 97,578,499 Black Thunder Arch 88,584,704 Jacobs Ranch Arch 42,145,705 Cordero Rio Tinto Energy America 40,033,283 Antelope Rio Tinto Energy America 35,777,489 Caballo Peabody 31,205,381 Belle Ayr Foundation Coal West 28,707,982 Buckskin Kiewit Mining Properties LLC 26,076,355 Eagle Butte Foundation Coal West 20,442,963 Rawhide Peabody 18,418,546 Coal Creek Arch 11,453,546 Wyodak Wyodak 6,015,890 Dry Fork Western Fuels 5,261,242 TOTAL 451,701,585 Surface strip mining is the preferred method in the Powder River Basin. More than 400 feet of overburden may be blasted and stripped away by gigantic electric shovels and draglines to exploit coal seams underlying the surface. 16 See Figures 5, 6, and 7. The process has created huge open pit mines thousands of acres in size. According to the U.S. Bureau of Land Management ( BLM, the North Antelope/Rochelle mine, which is the largest coal producer in the Powder River Basin, has disturbed an area of 14,342 acres, or 22 square miles, of which 6,200 acres are being actively mined. 17 See Figure 7. The mine is one of the largest in the U.S. 18 8


10 Figure 5. Mining coal from pit in Powder River Basin. 19 Basin..sagebrush, Powder Figure 6. Electric shovel loading truck in strip mine. 20 Figure 7. Aerial view of Jacobs Ranch coal mine. 21 9


11 Figure 8. Satellite View of North Antelope/Rochelle Coal Mine. 22 Almost all coal mined from the Powder River Basin is shipped by rail and used to generate electricity by coal-fired power plants throughout the U.S. 23 In 2006, the BLM reported 8.4 million rail-carloads of coal were shipped from the region. According to the agency, The largest rail coal movements are from the PRB [Powder River Basin] to generating power plants in Illinois, Missouri, and Texas. 24 By 2012, the BLM expects rail capacity to approach 500 million tons of coal, or roughly 100 mile-long trains each day. 25 Figure 9. Coal train in Powder River Basin

12 =1,,7+.!6,=56,6N=<.45</51&27=N570*+,2&-5>*.8*+, -./0,1123, Coal mined from the Powder River Basin is burned in coal-fired power plants to generate electricity. 27 Hundreds of plants of all generating capacities and of various ownerships burn coal from the region in 28 states from New Jersey to Oregon. 28 The vast majority of coal from the region is burned in the Midwest, with Missouri burning most, followed by Texas, Kansas, Iowa, and Wisconsin. 29 Burning this coal has released massive amounts of the greenhouse gas, carbon dioxide. Greenhouse gases, or heat-trapping gases, are a vital component of the Earth s atmosphere. Key greenhouse gases, including water vapor, carbon dioxide, ozone, methane, and nitrous oxide, absorb heat radiated from the Earth s surface and lower atmosphere and radiate much of the energy back to the surface. Without this greenhouse effect, it is estimated that the Earth s surface would be 60 o F cooler. 30 Yet dramatic increases in the release of greenhouse gases by human activities have intensified the greenhouse effect, leading to global warming. According to the U.S. Global Change Research Program: Observations show that warming of the climate is unequivocal. The global warming observed over the past 50 years is due primarily to human-induced emissions of heat-trapping gases. These emissions come mainly from the burning of fossil fuels (coal, oil, and gas with important contributions from the clearing of forests, agricultural practices, and other activities. 31 It is reported that since 1900, global average temperatures have increased by 1.5 degrees Fahrenheit and that by 2100, temperatures will rise another 2 to 11.5 degrees Fahrenheit. The U.S. Global Change Research Program reports that, The U.S. average temperature has risen by a comparable amount and is very likely to rise more than the global average over this century[.] 32 Figure 10. Kansas Jeffrey Energy Center burns 1,000,000 tons of Powder River coal monthly more than any other U.S. power plant. The release of carbon dioxide in particular has been the principal factor causing warming over the last 50 years. 33 Since the start of the industrial revolution, the concentration of carbon dioxide in the atmosphere has increased by 35%. Over the past several decades, 80% of all humanrelated carbon dioxide emissions came from the burning of fossil fuels

13 The Impacts of Global Warming in the U.S. Global warming poses myriad impacts that are occurring now, that are projected to occur, and that are projected to increase over time. In the U.S., these impacts include: Water resources will be stressed. Agricultural production will be increasingly challenged. Increased fire risk and insect infestations in western forests. The coasts, particularly along the Atlantic and Gulf Coasts, Pacific Islands, and parts of Alaska, are at increasing risk from sea-level rise and storm surge. Projected change in spring precipitation Increased human health risks, in the Southwest. 37 including health impacts related to heat stress, waterborne diseases, polluted air, and extreme weather. Exacerbate existing environmental and public health impacts resulting from pollution, population growth, urbanization, unsustainable use of resources, and other social, economic, and environmental stresses. Will push ecological systems beyond the thresholds needed to sustain populations and habitat of wildlife, fish, and plants, particularly those dependent upon Arctic and alpine ecosystems. Decreased economic stability, including impacts to ski, recreation, and tourism sectors, agriculture, the transportation infrastructure that support the U.S. economy, among other industries. 35 In the American West, the impacts of global warming are projected to be more pronounced. The U.S. Global Change Research Program reports: Human-induced climate change appears to be well underway in the Southwest. Recent warming in the Southwest has been among the most rapid in the nation, significantly more than the global average in some areas. This is driving declines in spring snowpack and Colorado River flow. Projections of future climate change indicate continued strong warming in the region[.] 36 12
14 Coal mining releases greenhouse gases directly, including methane releases from coal seams and carbon dioxide from combustion of fuel for mining equipment. 38 However, most greenhouse gases are released indirectly when the mined coal is burned. When burned, coal releases primarily carbon dioxide, along with lesser amounts of nitrous oxide and other greenhouse gases. 39 Coal releases more carbon dioxide when burned than any other fossil fuel. 40 Coal emits on average more than 200 pounds of carbon dioxide for every million Btus consumed. 41 This amounts to an average of around two tons of carbon dioxide for every one ton of coal burned. 42 Among coal types, anthracite releases the most carbon dioxide when burned, followed by lignite, subbituminous, and bituminous. 43 Subbituminous and bituminous coals are the most commonly burned coal types. Annually, the U.S. emits 7,881.6 million tons (7,150.1 million metric tons of greenhouse gases, based on carbon dioxide equivalency, making up 18.7% percent of human created greenhouse gases released globally. 44 Of this total, carbon dioxide comprises more than 85% of total U.S. greenhouse gas emissions. 45 The electricity generation sector is the largest source of greenhouse gases in the U.S., largely due to carbon dioxide emissions. 46 The EPA reports, The process of generating electricity is the single largest source of CO 2 [carbon dioxide] emissions in the United States, representing 39 percent of total CO 2 emissions from all CO 2 emissions sources in the United States. 47 Coal-fired power plants release 80% of all greenhouse gases from the electricity generation sector, including more than 2.17 billion tons (1.96 billion metric tons of carbon dioxide nearly 30% of the nation s total greenhouse gas inventory and 32% of all carbon dioxide released in the U.S. 48 This makes coal-fired power plants the largest single source of carbon dioxide in the country. As the largest producer of coal in the U.S., coal mining in the Powder River Basin is therefore responsible for more greenhouse gas emissions than any other direct activity. Based on 2007 data, coal mining in the region led to the release of 877,103,673 tons (795,695,068 metric tons of carbon dioxide, 13% of the U.S. total and 40% of all carbon dioxide released by coal-fired power plants in the country. 49 Although 2008 greenhouse gas inventory data for the U.S. is not available at this time, we expect that the contribution of the Powder River Basin to U.S. carbon dioxide emissions will continue to increase. Since 2000, the contribution of Powder River Basin coal to overall carbon dioxide emissions has increased from 10.07% to nearly 14%. 50 Given that in 2008, a record 494,964,000 tons of coal were mined from the Powder River Basin, leading to the release of 907,227,268 tons (823,022,733 metric tons of carbon dioxide, it appears the region is on track to continue growing as the largest contributor of carbon dioxide emissions in the U.S. 51 See Table 2. 13
15 Table 2. Carbon dioxide emissions from Powder River Basin coal and contribution to U.S. carbon dioxide emissions, Year Coal production in tons Tons of CO2 emissions Metric tons of CO2 emissions Metric tons of total U.S. CO2 emissions Percent contribution ,294, ,886, ,545,885 5,955,200, % ,693, ,321, ,650,657 5,860,000, % ,663, ,583, ,238,635 5,908,200, % ,953, ,602, ,698,194 5,963,200, % ,992, ,086, ,611,162 6,048,100, % ,996, ,557, ,552,764 6,090,800, % ,202, ,761, ,591,109 6,014,900, % ,496, ,103, ,695,068 6,103,400, % ,964, ,227, ,022,733 Data unavailable To be determined The role of the Powder River Basin as the largest contributor to U.S. carbon dioxide emissions is intensified by the fact that subbitminous coal from the region inherently releases more carbon dioxide on a per Btu basis than most coal mined elsewhere in the U.S. Subbituminous coal from the Powder River Basin of Wyoming and Montana releases pounds per million Btus and pounds per million Btus, respectively, which is higher than the U.S. average for subbituminous coal and higher than all but one other subbituminous coal producing state Alaska. 53 See Table 3. Subbituminous coal from the Powder River Basin also releases more carbon dioxide than any bituminous coal mined in the U.S. Bituminous coal, which is mined primarily in the eastern U.S., is the next most widely used coal type and emits on average pounds of carbon dioxide per million Btus
16 Table 3. Carbon dioxide emission factors for subbituminous coal in the U.S. 55 State Pounds of CO2 per million Btu Alaska Colorado Iowa Montana New Mexico Oregon Utah Washington Wyoming U.S. Average Carbon dioxide is the leading cause of global warming and the most emitted greenhouse gas in the U.S., with coal-fired power plants representing the largest single source of carbon dioxide. As the leading coal producing region in the U.S., the Powder River Basin is the leading contributor to global warming in the U.S., a distinction that is on track to continue. 15
17 6+5&>.5<<,5627=-1.=15& *>+57=,0*+,-!4<2>N!70,1&27,0*+,><2&5*, Coal in the Powder River Basin is almost entirely owned by the federal government and leased by the BLM to private companies to mine and sell. Federal regulations provide that coal must be leased in coal production regions through a competitive process whereby the BLM establishes regional leasing levels and delineates lease boundaries based on an assessment of regional environmental impacts and public input. 56 The BLM then auctions off leases to the highest bidder, ensuring adequate protection of the environment while recovering at least the fair market value for the U.S. Treasury. This does not occur in the Powder River Basin. This is due to the fact that the BLM has determined the Powder River Basin is not a coal production region, a determination that has both diminished competition for coal leases and undermined the agency s ability to address the global warming impacts of coal leasing. The Powder River Basin was initially designated a federal coal production region on November 9, This designation was followed by the 1982 promulgation of federal coal leasing regulations by President Reagan. 58 On a basic level, these regulations require extensive analysis and consideration of the regional environmental impacts of coal leasing, consultation with the public, the development of a regional plan for leasing, and a competitive bidding process. The regulations specifically require: 59 The establishment of regional leasing levels, which are to be based upon the economic, social and environmental effects of coal leasing and public comments, among other factors. 60 That potential lease tracts be delineated by the BLM and the ranked in order of prioritization for leasing. Tract ranking is to be based on three considerations: coal economics, impacts on the natural environment, and socioeconomic impacts. Tract delineation and ranking is also subject to public comment. 61 That a regional lease sale environmental analysis be prepared disclosing the impacts of all tract combinations for the various leasing levels. 62 That a regional lease sale schedule based on the regional environmental analysis and BLM lease rankings be established, published, adhered to, and, if necessary, revised over time. 63 And that a competitive bidding process be used to sell coal leases set forth in the regional lease sale schedule. 64 However, these standard leasing requirements have been sidestepped. In 1990, the BLM decertified the Powder River Basin coal production region, in essence 16
18 declaring the Basin was no longer a coal production region. 65 The decertification has had a profound and deliberate impact: it has enabled the BLM to avoid complying with standard leasing procedures and instead rely on the Lease by Application process. The Lease by Application process is a streamlined form of leasing where an interested coal company submits an application for a coal lease and the BLM offers the lease for sale. It differs from standard leasing procedures in two major ways. First, coal companies delineate lease tracts and propose them for leasing, not the BLM. 66 And second, lease proposals are not based on regional leasing levels or any regional environmental impact analysis. 67 This drastic shift in leasing procedure was, in fact, the driving force behind the decertification of the Powder River Basin. 68 The rationale for the decertification had nothing to do with production capacity or demand for coal; at the time, the region produced 15% of all coal in the U.S. and demand was increasing. 69 According to the BLM, the Lease by Application process was simply deemed more appropriate in order to facilitate expansion of existing coal mines. 70 Yet the Lease by Application process is only to be used where there is an emergency need for unleased coal or in areas outside coal production regions. 71 It is a streamlined process meant to facilitate leasing in areas that are not producing coal, or where a genuine emergency need for unleased coal exists. Federal regulations do not allow the process to be used to facilitate expansion of existing mines. The BLM nevertheless pushed ahead with decertification of the Powder River Basin, enabling the agency to utilize the streamlined Lease by Application process to facilitate expansion of existing mines. In the Powder River Basin, the decertification and use of the Lease by Application process has severely diminished competition for coal. In the last 20 years, the BLM has offered 21 Leases by Application for sale in the Powder River Basin totaling nearly 50,000 acres and more than 5.8 billion tons of coal. 72 During this time, there have been only three sales where more than one company has bid on a coal lease. See Table 4. The reason is that the Lease by Application process has allowed each major coal producer in the region to submit applications for federal coal leases based on tracts that they have designed. In all but one case, it appears that mine companies have designed tracts to facilitate expansion of their existing mines and preclude competition, thereby reducing the price of coal and the undermining the BLM s ability to ensure recovery of fair market value for the U.S. Treasury
19 Table 4. Leases by Application issued by the BLM in the Powder River Basin. 74 There have been only three competitive leases, highlighted in red, since the Lease by Application process began in Coal Lease Sale Date Acreage Tons of Coal No. of Bidders Winning Bid Jacobs Ranch 9/26/91 1, ,423,560 1 $.136/ton West Black Thunder North Antelope and Rochelle Mine West Rocky Butte Mine 8/12/92 3, ,000,000 1 $.168/ton 9/28/92 3, ,500,000 1 $.216/ton 1/7/ ,700,000 1 $.291/ton Eagle Butte 4/5/95 1, ,400,000 1 $.111/ton Antelope 12/4/ ,364,000 1 $.15/ton North Rochelle 9/25/97 1, ,610,000 1 $.194/ton Powder River 6/30/98 4, ,000,000 1 $.206/ton Thundercloud 10/1/98 3, ,000,000 2 $.3835/ton Horse Creek 9/7/00 2, ,577,000 1 $.33/ton Belle Ayr /11/ ,400,000 1 $.205/ton North Jacobs Ranch 1/16/02 4, ,542,000 2 $.706/ton NARO South 6/29/04 2, ,469,000 1 $.92/ton Little Thunder 9/22/04 5, ,719,000 1 $.85/ton Hay Creek 11/17/ ,698,000 1 $.30/ton West Antelope 12/15/04 2, ,961,000 1 $.75/ton NARO North 12/29/04 2, ,627,000 1 $.92/ton West Roundup 2/16/05 2, ,186,000 2 $.97/ton Eagle Butte West 2/20/08 1, ,000,000 1 $.708/ton South Maysdorf 4/22/08 2, ,081,000 1 $.8706/ton North Maysdorf 1/29/ ,657,000 1 $.88/ton TOTALS 49, ,812,914,560 In fact, for nearly every Lease by Application issued by the BLM in the last 20 years, the leases have been awarded to companies seeking to expand their existing mines. There has been only one instance where a lease was awarded to a company 18
20 that did not apply for the lease and that was not seeking to expand an existing mine under its ownership. This occurred on October 1, 1998, when Arch outbid Kennecott Energy, a subsidiary of Rio Tinto Energy, for the Thundercloud lease, which sought to expand the Jacobs Ranch Mine. 75 Ultimately, the lease was awarded to Arch. In 2009 however, Arch bought the Jacobs Ranch Mine from Kennecott Energy. 76 Although the BLM is required to ensure that any coal sold through the Lease by Application process meets fair market value standards, with little actual competition it is questionable whether this is occurring. 77 According to the BLM s Economic Evaluation of Coal Properties Manual, competition is a key component of ensuring fair market value. For example, the salient features of fair market value include, among other things: Fair market value is determined by reference to a competitive market rather than to the personal or inherent value of the property. And the property must be exposed to a competitive market for a reasonable time. 78 Additionally, the BLM s preferred process for appraising coal properties, the comparable sales approach, relies on comparable prices being [Market value] is the most probable price in cash, terms equivalent to cash, or in other precisely revealed terms, for which the specified property rights should sell after reasonable exposure in a competitive market under all conditions requisite to a fair sale[.] BLM Economic Evaluation of Coal Properties 80 determined in a competitive market. 79 At the least, with only three truly competitive leases sales in the last 20 years, it is difficult to see how any assessment of fair market value could be based on valid comparable data. When there has been actual competition for a Lease by Application in the Powder River Basin, the BLM has received a greater return. For example, in the case of the 1998 Thundercloud Lease by Application, the low bid was $0.3012/ton and the high bid was $0.3835/ton an ultimate difference of more than $33 million. 81 Additionally, according to the BLM, competition for the 2005 West Roundup coal lease brought a record bid of 97 cents per ton. 82 The lack of competition for Leases by Application indicates that the BLM could be recovering more value for the U.S. Treasury. This diminished competition has also undermined the ability of the BLM to address global warming. Because the Lease by Application process does not require a regional analysis of environmental impacts or that leasing levels be established based on a full consideration of environmental impacts, it prevents the BLM from addressing the global warming impacts of coal leasing in the Powder River Basin. 19

21 Under standard leasing procedures, the BLM would be required to rigorously analyze and fully take into account the global warming impacts of coal leasing. 83 The agency would be required to adhere to a three phase process: 1. First, regional leasing levels must be established based on consideration of environmental impacts, among other factors. 84 This first phase establishes a ceiling for coal leasing and ensures that environmental impacts are taken into account well before leasing occurs. 2. Second, lease tracts must be delineated and scheduled for sale according to a ranking based on consideration of environmental impacts, among other factors. 85 This second phase ensures that impacts are taken into account in determining the priority and timing in which any leases should be offered for sale. 3. And third, the site-specific and intraregional cumulative environmental impacts of each individual lease tract offered for sale must be analyzed and taken into account before being sold. 86 This final phase ensures that the impacts of leases are addressed individually and cumulatively before being sold. This three-phase process of analyzing and addressing the environmental impacts of leasing does not apply in decertified coal production regions. Instead, the BLM is simply required to offer leases delineated by coal companies, regardless of environmental considerations. The agency is not required to prepare a regional analysis of the impacts of coal leasing, nor required to limit leasing based on any consideration of regional impacts. Put simply, there is no ceiling on coal leasing. Although the BLM is required to prepare an environmental analysis for each individual Lease by Application, the agency is not required to consider or address regional impacts, or otherwise limit leasing based on regional environmental concerns. 87 In other words, while the current Lease by Application process requires a narrow analysis of the impacts of individual leases, it prevents the BLM from setting limits on leasing according to regional impacts. Figure 11. The amount of carbon dioxide released by Powder River coal equals the amount stored annually by 2.1 billion acres of pine forest. This is problematic as over the years, the global warming impacts of coal leasing in the Powder River Basin have been staggering. Since 1991, the BLM has awarded 21 Leases by Application totaling more than 5.8 billion tons of coal. 88 Cumulatively, this coal will have released more than billion tons (9.64 billion metric tons of carbon dioxide after being burned. 89 See Table 5. 20
22 Table 5. Leases by Application issued by the BLM in the Powder River Basin and total carbon dioxide emissions in tons and metric tons from burning leased coal. 90 Coal Lease Sale Date Tons of Coal Tons of Carbon Dioxide Metric Tons of Carbon Dioxide Jacobs Ranch 9/26/91 147,423, ,670, ,640, West Black Thunder North Antelope and Rochelle Mines West Rocky Butte Mine 8/12/92 429,000, ,735, ,899, /28/92 403,500, ,090, ,584, /7/93 56,700, ,716, ,090, Eagle Butte 4/5/95 166,400, ,382, ,130,894,23 Antelope 12/4/96 60,364, ,419, ,170, North Rochelle 9/25/97 157,610, ,303, ,544, Powder River 6/30/98 532,000, ,145, ,822, Thundercloud 10/1/98 412,000, ,638, ,689, Horse Creek 9/7/00 275,577, ,090, ,303, Belle Ayr /11/01 31,400,000 57,437, ,106, North Jacobs Ranch 1/16/02 537,542, ,282, ,018, NARO South 6/29/04 297,469, ,136, ,632, Little Thunder 9/22/04 718,719,000 1,314,695, ,192,671, Hay Creek 11/17/04 142,698, ,026, ,798, West Antelope 12/15/04 194,961, ,626, ,526, NARO North 12/29/04 324,627, ,814, ,699, West Roundup 2/16/05 327,186, ,495, ,945, Eagle Butte West South Maysdorf North Maysdorf 2/20/08 255,000, ,451, ,157, /22/08 288,081, ,963, ,053, /29/09 54,657,000 99,979, ,700, TOTALS 5,812,914,560 10,633,099, ,646,185,
23 This is the direct result of the decertification of the Powder River Basin and reliance on the Lease by Application process. Because the BLM is not required to adhere to standard leasing procedures, the agency has never prepared a regional analysis addressing the global warming impacts of coal leasing in the Powder River Basin. Consequently, the agency has not established regional leasing levels that take into account global warming impacts. Furthermore, the BLM has not delineated, ranked, or scheduled for sale any coal lease based on any consideration of associated carbon dioxide emissions and global warming impacts. While unsupported in the first place, the 1990 decertification of the Powder River Basin as a coal production region appears to have served the BLM s intent to facilitate expansion of existing mines. Unfortunately, this decision has worsened global warming impacts while simultaneously denying revenue to the U.S. Treasury. The Lease by Application process has favored the demands of coal companies, leading to much diminished competition for coal and an inadequate system of environmental oversight. 22
24 7,/>.5<<,5627= <6*+1,5*,7*.8!,<=<.45</51&27= Despite the global warming impacts of coal leasing in the Powder River Basin and obvious problems with the leasing program, the BLM has recently proposed to offer 12 new Leases by Application. See Table 6. Collectively, these leases propose to mine as much as 5.8 billion tons of coal from more than 34,571 acres. 91 This is almost as much coal as has been mined from the Powder River Basin in the last 20 years. Together, these proposed coal leases represent one of the most significant U.S. sources of greenhouse gases that may be authorized in the near future. Table 6. Leases by Application that have been proposed by the BLM in the Powder River Basin and estimated coal tonnage and carbon dioxide emissions, based on high and low estimates in BLM analyses. 92 Proposed Coal Lease West Antelope II Belle Ayr North West Coal Creek West Caballo Tons of Coallow Tons of Coalhigh 377,800, ,900, ,800, ,600,000 57,000,000 57,000,000 81,800,000 98,600,000 Maysdorf II 169,100, ,500,000 North Hilight Field South Hilight Field West Hilight Field West Jacobs Ranch North Porcupine South Porcupine 263,400, ,300, ,600, ,000, ,900,000 1,056,100, ,600,000 1,142,100, ,200, ,400, ,700, ,400,000 Hay Creek II 148,000, ,000,000 TOTALS 3,423,900,000 5,806,900,000 Tons of Carbon Dioxide Emissions-low (metric tons 683,043,510 (619,646, ,870,660 (253,894, ,053,150 (93,488, ,890,310 (134,163, ,724,345 (277,348, ,214,030 (432,014, ,178,120 (350,334, ,224,305 (619,810,663 1,210,603,320 (1,098,240,858 1,086,939,540 (986,054, ,922,115 (507,952, ,576,600 (242,741,408 6,190,240,005 (5,615,691,269 Tons of Carbon Dioxide Emissions-high (metric tons 830,282,958 (753,220, ,258,412 (339,521, ,265,540 (94,588, ,361,092 (163,620, ,964,890 (787,404,503 1,224,296,946 (1,110,663, ,350,400 (531,020,950 1,931,839,242 (1,752,535,080 2,089,152,162 (1,895,246,960 1,422,035,628 (1,290,049, ,565,788 (672,737, ,724,560 (245,597,190 10,622,097,618 (9,636,204,866 23
25 These proposals promise to entrench the role of the Powder River Basin as the leading contributor to global warming in the U.S. On the low end, the coal from these proposals would release 6.19 billion tons (5.61 billion metric tons of carbon dioxide. 93 This is a staggering amount of carbon dioxide nearly three times the amount of carbon dioxide released by all U.S. coal-fired power plants in However, these proposals may release as much as 10.6 billion tons (9.64 billion metric tons of carbon dioxide. 95 This is more than was released by all fossil fuel combustion in the U.S. in Importantly, these proposals highlight the failings of the current leasing program in the Powder River Basin. Indeed, every proposed Lease by Application is the result of a coal company seeking to expand an existing mine in the region. 97 Even the BLM itself describes every one of these proposed leases as maintenance tracts, or leases meant to maintain production at an existing mine. 98 For instance, Arch Coal applied for the North Highlight Field, South Highlight Field, and West Highlight Field Leases by Application for the sole purpose of maintaining production at the Black Thunder coal mine, the second largest mine in the Powder River Basin. 99 These proposals will continue to inhibit competition and depress coal prices in the Powder River Basin. Furthermore, these proposals underscore the inability of the BLM to address the global warming impacts of coal leasing in the Powder River Basin through the Lease by Application process. Although the agency has prepared or is preparing analyses of the environmental impacts of the proposed coal leases pursuant to the National Environmental Policy Act, these analyses fail to compensate for fundamental problems with the Lease by Application process. 100 For instance: The proposed leases have not been delineated, selected, or ranked based on any consideration of global warming impacts. 101 Instead, the proposed leases are merely a response to proposals from coal companies. No assessment of past, present, and foreseeable global warming impacts of coal leasing on a regional level has been completed. 102 Instead, the environmental analyses for the proposed Leases by Application only assess greenhouse gas emissions associated with individual leases. 103 No regional limits on coal leasing exist to address global warming. 104 Instead, coal companies can submit as many applications for coal leases as they want and the BLM is not required to limit approval of such applications, or otherwise keep coal leasing in check to address global warming impacts. While the BLM discloses that coal mining in the Powder River Basin is currently responsible for more than 13% of U.S. carbon dioxide emissions, the BLM proposes to do nothing to address this impact. 105 Under standard leasing procedures, the BLM would be required to limit leasing to address global warming impacts. 24
26 The BLM is scheduled to begin approving these proposed Leases by Application. According to the agency, the West Antelope II lease is slated to be imminently approved and offered for sale, followed by the Belle Ayr North, West Coal Creek, West Caballo, and Maysdorf II leases. 106 The BLM is also preparing a final environmental impact statement for the North Hilight Field, South Highlight Field, West Highlight Field, West Jacobs Ranch, North Porcupine, and South Porcupine leases and a draft environmental impact statement for the Hay Creek II lease. 107 If approved, these leases promise to perpetuate the BLM s deeply flawed decision to decertify the Powder River Basin as a coal production region, threatening to exacerbate global warming impacts at the expense of the U.S. Treasury. 25
27 6.<!*2.765*+570 Solving global warming means reducing greenhouse gas emissions. To effectively reduce greenhouse gas emissions in the U.S., efforts must focus on reducing the global warming impacts of coal leasing in the Powder River Basin. Fortunately, the groundwork for has already been laid. On September 14, 2009, Interior Federal agencies shall Secretary Ken Salazar called for the development reduce their greenhouse of a unified greenhouse gas emission reduction gas emissions from all program among Department of Interior direct and indirect agencies. 108 Secretary Salazar s Order was activities[.] bolstered by President Obama, who on October 5, 2009 called on all federal agencies to measure, President Barack Obama report, and reduce their greenhouse gas emissions from direct and indirect activities. 109 President Obama s Executive Order directed federal agencies to establish a percentage reduction target for reducing direct and indirect greenhouse gas emissions by June These orders provide a solid foundation for the BLM to address the global warming impacts of federal coal leasing in the Powder River Basin and reduce greenhouse gases. However, reform of the coal leasing program in the Powder River Basin must become an immediate priority of the BLM to effectively build upon this foundation. The agency must begin to take steps that both address the global warming impacts of coal leasing in the Powder River Basin and seize on clean energy solutions. To this end, we recommend the agency undertake the following actions: Call a time-out: The BLM should place a moratorium on all new coal leasing in the Powder River Basin until the agency develops and implements a comprehensive plan to address global warming impacts. This moratorium should apply to all pending lease proposals. Re-designate the Powder River Basin a coal production region : The re-designation, or recertification, of the Powder River Basin as a coal production region will restore competition for coal leases and enable the BLM to fully address the global warming impacts of coal leasing. Prepare a regional environmental analysis: In re-designating the Powder River Basin as a coal production region, the BLM will be required to prepare an analysis addressing the regional impacts of leasing. The agency should immediately prepare this analysis, ensuring that global warming impacts are fully analyzed and assessed in order to inform future leasing decisions and ensure reductions in carbon dioxide emissions attributable to Powder River Basin coal. 26

28 Establish a carbon fee for new leases: The BLM should establish a carbon fee for new coal leases to create a Global Warming Impact Fund. The carbon fee should be established pursuant to the Federal Land Policy and Management Act ( FLPMA as a reasonable charge to reimburse the BLM for the costs of addressing the global warming impacts of coal leasing. 111 Funds from the Global Warming Impact Fund should reimburse the BLM for renewable energy development, habitat restoration, and other efforts to address the impacts of global warming stemming from coal leasing in the Powder River Basin. Transition to clean, renewable energy: The BLM s long-term goal should be to reduce greenhouse gases by promoting renewable energy. To this end, the agency, either alone or in collaboration with other agencies, should report on the renewable energy potential of the Powder River Basin. With the guidance of this report, the BLM should develop and implement a plan to promote the expeditious development of renewable energy in the Powder River Basin. The State of Wyoming alone has enough renewable energy potential to more than meet the electricity needs of all 11 western states. 112 Furthermore, a substantial amount of wind energy potential lies in northeastern Wyoming. See Figure 12. Figure 12. Wind energy potential in the State of Wyoming. Blue is Superb, red is Outstanding, purple is Excellent, pink is Good, and orange is Fair
29 Solutions are at hand to address the global warming impacts of coal leasing in the Powder River Basin of northeastern Wyoming and southeastern Montana. The agency not only has broad authorities to address the global warming impacts, but is well poised to become a leader in transitioning the Powder River Basin away from coal and toward clean, renewable energy. The Powder River Basin is a leading contributor to global warming in the U.S., a distinction that promises to continue. For the sake of the welfare of the United States, the BLM must act and act fast to ensure progress is made to effectively confront global warming. 28
30 ,707.*,6 1. U.S. Bureau of Land Management, Draft Environmental Impact Statement for the Wright Area Coal Lease Applications. Wyoming BLM, pp Id. at Image from U.S. Geological Survey Luppens, J.A., et al., Assessment of Coal Geology, Resources, and Reserves in the Gillette Coalfield, Powder River Basin, Wyoming. USGS Open-File Report , p Id. 6. Powder River Basin subbituminous coal averages 8,600 British thermal units ( Btus, a measurement of energy content, per pound, whereas bituminous coal from the Appalachian Region averages 12,500 Btus/pound Energy Information Administration, Coal Production and Number of Mines by State and Mine Type Image from Bureau of Land Management. 9. Supra. Note Coal production regions are defined by the Energy Information Administration as geographic classifications of areas where coal is produced. The Appalachian Region includes Alabama, Eastern Kentucky, Maryland, Ohio, Pennsylvania, Tennessee, Virginia, and West Virginia. The Interior Region includes Arkansas, Illinois, Indiana, Kansas, Louisiana, Mississippi, Missouri, Oklahoma, Texas, and Western Kentucky. The Western Region includes Alaska, Arizona, Colorado, Montana (outside of the Powder River Basin, New Mexico, North Dakota, Utah, Washington, and Wyoming (outside the Powder River Basin Freme, F., U.S. Coal Supply and Demand: 2008 Review. Energy Information Administration Energy Information Administration, Annual Coal Report, DOE/EIA-0584 ( Historical production data from Annual Coal Reports Bureau of Land Management, Powder River Basin Coal Production Energy Information Administration, Major U.S. Coal Mines, Id. 16. Supra. Note 1. 29
31 17. Supra. Note 1 at Peabody Energy, North Antelope-Rochelle Mine Image from Bureau of Land Management. 20. Id. 21. Image from Image from NASA Supra. Note 1 at Supra. Note 1 at Supra. Note 1 at Image from Bureau of Land Management. =%$$"LJAM$=EM$MN=OJPEO/E%D'"(NE"#BL$2DQE@BJRBL$-JS#$%1'C$% 4EM'" 27. Supra. Note 1 at The Federal Energy Regulatory Commission and Energy Information Administration maintain databases disclosing coal consumption, including origins and quantities, by power plants within the United States. See and Id. 30. Karl, T.R., et al., eds., Global Climate Change Impacts in the United States. Cambridge University Press, pp Id. at Id. 33. Supra. Note 30 at Id. 35. Supra. Note 30 at Supra. Note 30 at Supra. Note 30 at
32 38. Supra. Note 1 at Coal combustion also releases a number of toxic air pollutants, including lead, mercury, selenium, soot, and sulfur dioxide, in addition to greenhouse gases. 40. U.S. EPA, Inventory of U.S. Greenhouse Gas Emissions and Sinks, EPA 430-R , p Hong, B.D. and E.R., Slatick, Carbon Dioxide Emission Factors for Coal. Energy Information Administration, Quarterly Coal Report, January-April 1994, DOE/EIA-0121(94/Q1, pp Btu is a unit of energy measurement. In 2006, the EIA reported global coal consumption to be quadrillion Btus, or 127,500,000 million Btus, or 127,500,000,000,000,000 Btus. See Supra. Note Id. 44. Supra. Note 40. Based on 2007 EPA inventory data. Carbon dioxide equivalency refers to the global warming potential of a greenhouse gas, where CO 2 has a potential of 1 and, for example, methane has a potential of 21. Therefore, one ton of methane equals 21 tons of CO 2 equivalent. We refer to both tons and metric tons of greenhouse gases in this report to both ensure consistency between greenhouse gas inventories and references regarding Powder River Basin coal mining. One ton equals approximately metric tons. 45. Id. 46. Id. at Id. at Id. at Supra. Note 1 at and The BLM s methodology for calculating greenhouse gas emissions from Powder River Basin coal uses an emission factor of pounds per million Btu and assumes an average Btu content of 8,600 per pound of Powder River Basin coal. Using this methodology, the BLM determined that Powder River Basin coal mines released 13.9% of the nation s carbon dioxide and 42% of all carbon dioxide from coal-fired power plants in Based on 2007 coal production data and 2007 U.S. greenhouse gas emission data, Powder River Basin coal contributed to 13.04% of the nations carbon dioxide and 40% of all carbon dioxide released by coal-fired power plants. 50. Data from Supra. Note 12 and Supra Note Id. 52. Id. Carbon dioxide emissions for Powder River Basin coal were estimated using the BLM s methodology in Note Supra. Note Id. 55. Supra. Note 41. Subbituminous coal is not produced in the eastern United States. 31
33 >O'DEB$ 56. Coal leasing regulations are set forth at 43 C.F.R. 3400, et seq Federal Register 784 (January 9, Interestingly, the 1982 coal leasing regulations were promulgated in response to corruption within the federal leasing program. According to the BLM and reports at the time, coal sale data was previously leaked to outside parties, compromising the ability of the federal government to achieve fair market value. The 1982 regulations supposedly addressed this problem. See BLM, Powder River Basin Briefing. BLM Wyoming State Office, p C.F.R , 47 Federal Register (July 30, C.F.R (c C.F.R (a and C.F.R (c C.F.R C.F.R Federal Register (January 9, In the late 1980 s, the BLM similarly decertified every other coal production region in the U.S. 66. The BLM may only add to or delete lands from lease tracts applied for by coal companies. 43 C.F.R Although BLM is required to prepare an analysis of the impacts of any individual Lease by Application, there is no requirement that the agency establish lease boundaries based on consideration of environmental impacts, whether regional or local in nature. 43 C.F.R BLM, Powder River Basin Briefing. BLM Wyoming State Office, p See Bureau of Land Management, Percent Total U.S. Coal Production Mined from the Powder River Basin, Wyoming gif. 70. Supra. Note C.F.R Data on Lease by Applications is available at Only one Lease by Application, the West Rocky Butte lease, issued in 1993, was specifically for a new mine start. Supra. Note 68 at 8. The lease was issued to Peabody and is currently held by the adjacent Caballo Mine. 32
34 74. Supra. Note Thundercloud Lease by Application Rio Tinto, Rio Tinto Completes Sale of Jacobs Ranch The BLM is not allowed to accept any bid for a Lease by Application that is less than the fair market value. See 43 C.F.R (c and (b. 78. BLM, Economic Evaluation of Coal Properties, BLM Handbook, H (April 7, 1994 at I Id. at III Id. I Supra. Note Bleizeffer, D., Company wins coal lease on second try, Casper Star Tribune (April 23, See e.g., 43 C.F.R (c. 84. Supra. Note Supra. Note Supra. Note C.F.R Supra. Note Carbon dioxide emissions were estimated using the BLM s methodology discussed in Note Supra. Note 88. 7$S>JEO<$EM'"(-%JQJMEOM*L%$EB$"BJ8A$O=OJPEO/E%D'"( 91. Data on the proposed coal leases was obtained from: U.S. Bureau of Land Management, Final Environmental Impact Statement for the West Antelope II Coal Lease Application. Wyoming BLM. U.S. Bureau of Land Management, Final Environmental Impact Statement for the South Gillette Area Coal Lease Applications. Wyoming BLM. 33
35 U.S. Bureau of Land Management, Draft Environmental Impact Statement for the Wright Area Coal Lease Applications. Wyoming BLM. U.S. Bureau of Land Management, Notice of Intent to Prepare [the Hay Creek II] Environmental Impact Statement and Notice of Public Meeting on a Federal Coal Lease-by-Application in the Decertified Powder River Federal Coal Production Region, Wyoming. Wyoming BLM. 72 Federal Register (December 21, Id. High and low estimates for the West Antelope II, Belle Ayr North, West Coal Creek, West Caballo, Maysdorf II, North Highlight Field, South Highlight Field, West Highlight Field, West Jacobs Ranch, North Porcupine, and South Porcupine leases are based on recoverable coal estimates provided by BLM in draft and final environmental impact statements. Estimate for the Hay Creek II is based on tonnage applied for. Carbon dioxide emissions estimated using methodology discussed in Note 49. Coal lease terms are for 20 years. See 43 C.F.R Id. 94. Supra. Note Supra. Note Supra. Note Supra. Note See e.g., Supra. Note 91, BLM 2009, Draft Environmental Impact Statement for the Wright Area Coal Lease Applications at Id The BLM is required to prepare an analysis of the impacts of any Lease by Application pursuant to the National Environmental Policy Act, 42 U.S.C. 4321, et seq., in accordance with 43 C.F.R However, the National Environmental Policy Act only requires an analysis of environmental impacts. It does not actually impose any limits on coal leasing to address environmental impacts Supra. Note 91. No consideration of global warming impacts informed the delineation of the proposed leases or the BLM s decision to propose the leases Id. According to the BLM, the last time a regional coal leasing environmental analysis was completed was in See U.S. Bureau of Land Management, Powder River Final Environmental Impact Statement, Coal To the extent the BLM discloses carbon dioxide emissions associated with coal leasing regionwide, the BLM simply discloses such impacts without explaining the significance or assessing the magnitude of the impacts No regional limits on leasing exist at all in the Powder River Basin Supra. Note 91. The BLM proposes no measures that would limit, offset, or otherwise address carbon dioxide emissions associated with the proposed Leases by Application. 34
36 106. Personal Communication with Shannon Anderson, Powder River Basin Resource Council (May 6, Personal Communication with Shannon Anderson, Powder River Basin Resource Council (November 12, JOAB'J"MEB+E"# 108. Interior Secretary Ken Salazar, Secretarial Order No. 3289, Addressing the Impacts of Climate Change on America s Water, Land, and Other Natural and Cultural Resources, Section 4(b (September 14, President Obama, Executive Order No , Federal Leadership in Environmental, Energy, and Economic Performance, Section 1 (October 5, Id. at Sections 2(a and (b 111. FLPMA provides the Secretary of the Interior with authority to require a deposit of any payments intended to reimburse the United States for reasonable costs with respect to applications, including coal lease application. See 43 U.S.C. 1734(b. Such payments are authorized to be appropriated and made available until expended by FLPMA. Id Renewable Energy Atlas of the West Renewable Energy Atlas of the West, Wyoming. 35
37 36
ANNEX E: Methodology for Estimating CH 4 Emissions from Coal Mining
 1 1 1 1 1 1 1 1 0 1 0 1 ANNEX E: Methodology for Estimating CH Emissions from Coal Mining The methodology for estimating methane emissions from coal mining consists of two distinct steps. The first step
Wyoming Coal Information Committee 2016 WYOMING COAL OVERVIEW
 Wyoming Coal Information Committee 2016 WYOMING COAL OVERVIEW SAFETY SHARE Safety is paramount in Wyoming mining and is one of the core values of the industry. All WMA board and committee meetings start
The US Coal Industry. How Much Longer?
 The US Coal Industry How Much Longer? NYU Coal Finance Workshop March 18, 2013 Leslie Glustrom Clean Energy Action, Boulder, Colorado Lglustrom(at)gmail.com 303-245-8637 Coal Deliveries to Power Plants
INFORMATION/BRIEFING MEMORANDUM
 INFORMATION/BRIEFING MEMORANDUM FOR THE ASSISTANT SECRETARY LAND AND MINERALS MANAGEMENT DATE: February 9, 2017 FROM: Kristin Bail, Acting Director, Bureau of Land Management (BLM) SUBJECT: Input to Leadership
Updated State-level Greenhouse Gas Emission Coefficients for Electricity Generation
 Updated State-level Greenhouse Gas Emission Coefficients for Electricity Generation 1998-2000 Energy Information Administration Office of Integrated Analysis and Forecasting Energy Information Administration
Wyoming Coal Information Committee 2018 WYOMING COAL OVERVIEW
 Wyoming Coal Information Committee 2018 WYOMING COAL OVERVIEW SAFETY SHARE Safety is paramount in Wyoming mining and is one of the core values of the industry. All WMA board and committee meetings start
U.S. Likely Past Peak Coal??
 U.S. Likely Past Peak Coal?? New Developments in the Powder River Basin IEEFA Coal Finance Workshop March 17-19. 2014 New York University Leslie Glustrom Clean Energy Action, Boulder, Colorado lglustrom(at)gmail.com
Domestic Coal Basin Outlooks Powder River Basin, Illinois Basin, NAPP, and CAPP
 Domestic Coal Basin Outlooks Powder River Basin, Illinois Basin, NAPP, and CAPP Presentation to: Platts 37 th Annual Coal Marketing Days Conference Pittsburgh, Pennsylvania September 22, 2014 Nick Bradley
Trends in. U.S. Delivered Coal Costs: July 2012
 Trends in U.S. Delivered Coal Costs: 2004-2011 July 2012 By Teresa Foster, William Briggs and Leslie Glustrom Version 1.1 Inquiries or corrections to info@cleanenergyaction.org 1 2 Table of Contents INTRODUCTION...
Trends in. U.S. Delivered Coal Costs: October 2013
 Trends in U.S. Delivered Coal Costs: 2004-2012 October 2013 By Teresa Foster and Leslie Glustrom Inquiries or corrections to info@cleanenergyaction.org 1 2 TABLE OF CONTENTS Introduction... 5 UNITED STATES
A concise Guide. An industry overview produced by the. Wyoming Coal Information Committee. Wyoming COAL. Wyoming Mining Association
 A concise Guide to Wyoming Coal 2003 An industry overview produced by the Wyoming Coal Information Committee Wyoming COAL Wyoming Mining Association www.wma-minelife.com Wyoming Coal Trends Wyoming coal
A Concise Guide to Wyoming Coal Wyoming Coal Information Committee
 A Concise Guide to Wyoming Coal 2006 An industry overview produced by the Wyoming Coal Information Committee Wyoming Mining Association www.wma-minelife.com Wyoming Coal Trends Growing energy needs continue
Clean and Secure Energy Actions Report 2010 Update. GHG Policies
 Alabama Alaska Arizona Arkansas California Colorado Connecticut Delaware Florida Georgia Participant in Climate Registry; climate action plan: Policy Planning to Reduce Greenhouse Gas Emissions in Alabama
Watershed Condition Framework
 US Forest Service - Watershed Condition Classification Maps http://www.fs.fed.us/publications/watershed/ Page 1 of 2 1/9/2013 Watershed Condition Framework The Forest Service has released the first national
to Wyoming Coal An industry overview produced by the
 A Concise Guide to Wyoming Coal 2008 An industry overview produced by the Wyoming Coal Information Committee Wyoming Mining Association www.wma-minelife.com Safety First Safety always comes first in the
WYOMING COAL The Concise Guide
 WYOMING COAL The 2017-18 Concise Guide wyomingmining.org The Concise Guide is an educational effort to raise awareness of the economic contribution and value of Wyoming s coal industry. A Culture of Safety
FACT SHEET: BLM, USFS Greater Sage-Grouse Conservation Effort
 EMBARGOED UNTIL SEPTEMBER 22, 2015 @ 12:00PM ET FACT SHEET: BLM, USFS Greater Sage-Grouse Conservation Effort Overview Effective conservation of the greater sage-grouse and its habitat requires a collaborative,
The Economic Value of American Coal Exports
 August 2012 The Economic Value of American Coal Exports Summary of Findings The United States has the world s largest endowment of low-cost, high quality coal reserves. These reserves can be competitively
United States Department of the Interior BUREAU OF LAND MANAGEMENT Washington, D.C
 United States Department of the Interior BUREAU OF LAND MANAGEMENT Washington, D.C. 20240 http://www.blm.gov TAKE PRIDE In Reply Refer To: ''''''''' JAN 2 8 2011 Mr. Jeremy Nichols Climate and Energy Program
A Concise Guide. Wyoming Mining Association. An industry overview produced by the Wyoming Coal Information Committee
 A Concise Guide to Wyoming Coal 2005 An industry overview produced by the Wyoming Coal Information Committee Wyoming Mining Association www.wma-minelife.com Wyoming Coal Trends Growing energy needs continue
Keep it in the Ground A Plan to Safeguard the Climate and End Mining of Our Publicly Owned Coal
 Keep it in the Ground A Plan to Safeguard the Climate and End Mining of Our Publicly Owned Coal A Report by WildEarth Guardians ASSOCIATED PRESS AUGUST 2015 PEABODY ENERGY ! MISSION STATEMENT WildEarth
The Denver Water System
 The Denver Water System Established in 1918 Unique structure Serves 1.3 million people 25% of Colorado s population System footprint - 4,000 square miles (2.5 million acres) 19 raw water reservoirs Critical
Overview and Background: Regulation of Power Plants under EPA s Proposed Clean Power Plan
 Overview and Background: Regulation of Power Plants under EPA s Proposed Clean Power Plan Jennifer Macedonia Council of State Governments Annual Meeting August 11, 2014 BACKGROUND: EPA S PROPOSED CLEAN
$13.35 per ton. The average price for Wyoming coal in 2017 was WYOMING S COAL RESOURCES
 A CULTURE OF SAFETY Safety is a core cultural value for Wyoming s coal mining industry, and Wyoming coal mines are recognized as some of the safest mining operations in the nation. Safe mines are productive
Chapter TRI Data and Trends (Original Industries Only)
") Chapter 3 1999 TRI Data and 1995 1999 Trends (Original Industries Only) Chapter 3 1999 TRI Data and 1995 1999 Trends (Original Industries Only) INTRODUCTION This chapter summarizes information reported
Chapter 3 1999 TRI Data and 1995 1999 Trends (Original Industries Only) Chapter 3 1999 TRI Data and 1995 1999 Trends (Original Industries Only) INTRODUCTION This chapter summarizes information reported
Interstate Movement Of Municipal Solid Waste
 1.S: P'E C I A L R E P 0 R T: 2 Interstate Movement Of Municipal Solid Waste February 1992 The United States has an intricate web of beneficial interstate movements of municipal solid waste. Where interstate
SOYBEANS: SURPLUS GROWS, ACREAGE TO DECLINE
 SOYBEANS: SURPLUS GROWS, ACREAGE TO DECLINE JANUARY 2007 Darrel Good 2007 NO. 2 Summary The 2006 U.S. soybean crop was a record 3.188 billion bushels, but was 16 million smaller than the November 2006
Greenhouse Gas Emission Reductions From Existing Power Plants Under Section 111(d) of the Clean Air Act: Options to Ensure Electric System Reliability
 of the Clean Air Act: Options to Ensure Electric System Reliability") Greenhouse Gas Emission Reductions From Existing Power Plants Under Section 111(d) of the Clean Air Act: Options to Ensure Electric System Reliability Susan Tierney, Analysis Group May 8, 2014 Questions/Answers
Greenhouse Gas Emission Reductions From Existing Power Plants Under Section 111(d) of the Clean Air Act: Options to Ensure Electric System Reliability Susan Tierney, Analysis Group May 8, 2014 Questions/Answers
POWDER RIVER BASIN COAL RESOURCE AND COST STUDY
 POWDER RIVER BASIN COAL RESOURCE AND COST STUDY Campbell, Converse and Sheridan Counties, Wyoming Big Horn, Powder River, Rosebud and Treasure Counties, Montana Prepared For XCEL ENERGY By John T. Boyd
Streamflow of 2013 Water Year Summary
 Streamflow of 23 Water Year Summary U.S. Geological Survey Reston, Virginia January 24 23 Statewide Streamflow Ranks (93 23) Introduction National Overview Regional Patterns Seasonal Characteristics High
Data and Analysis from EIA to Inform Policymakers, Industry, and the Public Regarding Power Sector Trends
 Data and Analysis from EIA to Inform Policymakers, Industry, and the Public Regarding Power Sector Trends for Power Sector Trends in the Eastern Interconnection Atlanta, GA by Howard Gruenspecht, Deputy
Knowledge Exchange Report
 Knowledge Exchange Report February 2016 The Economic Impact of a Minimum Wage Increase on New York State Agriculture New York State is considering a minimum wage increase from $9.00 to $15.00 statewide.
GLOBAL CLIMATE CHANGE
 1 GLOBAL CLIMATE CHANGE From About Transportation and Climate Change (Source; Volpe center for Climate Change and Environmental forecasting, http://climate.volpe.dot.gov/trans.html Greenhouse effect has
Forest Resources of the United States, 2017:
 Forest Resources of the United States, 2017: A Technical Document Supporting the Forest Service 2020 update of the RPA Assessment Abstract Oswalt, Sonja N.; Miles, Patrick D.; Pugh, Scott A.; Smith, W.
SOYBEANS: FOCUS ON SOUTH AMERICAN AND U.S. SUPPLY AND CHINESE DEMAND
 SOYBEANS: FOCUS ON SOUTH AMERICAN AND U.S. SUPPLY AND CHINESE DEMAND APRIL 2002 Darrel Good 2002-NO.4 Summary Soybean prices during the first half of the 2001-02 marketing year were well below the prices
INTRODUCTION TO ENERGY SYSTEMS (ELE 210 ) Lecture 03 (Nonrenewable Energy)
 Lecture 03 (Nonrenewable Energy)") INTRODUCTION TO ENERGY SYSTEMS (ELE 210 ) Lecture 03 (Nonrenewable Energy) COAL, PETROLEUM, AND GAS Coal, petroleum, and natural gas are considered nonrenewable because they can not be replenished in a
INTRODUCTION TO ENERGY SYSTEMS (ELE 210 ) Lecture 03 (Nonrenewable Energy) COAL, PETROLEUM, AND GAS Coal, petroleum, and natural gas are considered nonrenewable because they can not be replenished in a
Energy Resources Coal/Oil/Gas
 Energy Resources Coal/Oil/Gas 13 Larry Fox Peabody Energy I ve been asked to give a general overview the energy resources in the Powder River Basin. I m going to keep most my comments to coal. I don t
U.S. Drought Monitor, August 28, 2012
 University of Nebraska - Lincoln DigitalCommons@University of Nebraska - Lincoln US Ag in Drought Archive Drought -- National Drought Mitigation Center 8-28-2 U.S. Drought Monitor, August 28, 2 Brian Fuchs
U.S. Drought Monitor, September 4, 2012
 University of Nebraska - Lincoln DigitalCommons@University of Nebraska - Lincoln US Ag in Drought Archive Drought -- National Drought Mitigation Center 9--12 U.S. Drought Monitor, September, 12 Brian Fuchs
THE BIG DEBATE Can the global community tackle climate change without the USA?
 THE BIG DEBATE CAN THE GLOBAL COMMUNITY TACKLE CLIMATE CHANGE WITHOUT THE US? THE BIG DEBATE Can the global community tackle climate change without the USA? Friday 16th June 2017 THE DILEMMA US President
SOYBEANS: DECLINING EXPORTS, LARGE STOCKS
 SOYBEANS: DECLINING EXPORTS, LARGE STOCKS JANUARY 2006 Darrel Good 2006 NO. 2 Summary At 3.086 billion bushels, the 2005 U.S. soybean crop was 43 million larger than the November forecast and only 38 million
Technical Document EPA s Draft Report on the Environment Chapter 1 - Cleaner Air 1.2 Acid Deposition 1-25
 Technical Document EPA s Draft Report on the Environment 3 1. Acid Deposition Sulfur dioxide and NO X emissions in the atmosphere react with water, oxygen, and oxidants to form acidic components, also
Forest Resources of the United States, 2017: A Technical Document Supporting the Forest Service Update of the 2010 RPA Assessment
 Forest Resources of the United States, 2017: A Technical Document Supporting the Forest Service Update of the 2010 RPA Assessment Abstract Oswalt, Sonja N.; Miles, Patrick D.; Pugh, Scott A.; Smith, W.
U.S. Drought Monitor, July 31, 2012
 University of Nebraska - Lincoln DigitalCommons@University of Nebraska - Lincoln US Ag in Drought Archive Drought -- National Drought Mitigation Center -3-2 U.S. Drought Monitor, July 3, 2 Mark D. Svoboda
SOYBEANS: HIGHEST PRICES IN OVER SEVEN YEARS. January 2004 Darrel Good 2004 NO. 2
 SOYBEANS: HIGHEST PRICES IN OVER SEVEN YEARS January 2004 Darrel Good 2004 NO. 2 Summary At 2.418 billion bushels, the 2003 U.S. soybean crop was 34 million bushels smaller than the USDA s November forecast
Knowledge Exchange Report. Economic Impact of Mandatory Overtime on New York State Agriculture
 Farm Credit East Knowledge Exchange Report September, 2014 Economic Impact of Mandatory Overtime on New York State Agriculture The New York State Legislature and Governor Andrew Cuomo are considering legislation
A Study of United States Hydroelectric Plant Ownership
 INL/EXT-06-11519 A Study of United States Hydroelectric Plant Ownership Douglas G. Hall, INL Project Manager Kelly S. Reeves, NPS June 2006 The INL is a U.S. Department of Energy National Laboratory operated
Emission Factors and Energy Prices. for Leonardo Academy s. Cleaner and Greener Program
 Emission Factors and Energy Prices for Leonardo Academy s Cleaner and Greener Program Prepared by Leonardo Academy Inc. For the Multiple Pollutant Emission Reduction Reporting System (MPERRS) Funding for
State CO2 Emission Rate Goals in EPA s Proposed Rule for Existing Power Plants
 State CO2 Emission Rate Goals in EPA s Proposed Rule for Existing Power Plants Jonathan L. Ramseur Specialist in Environmental Policy July 21, 2014 Congressional Research Service 7-5700 www.crs.gov R43652
SOYBEANS: LARGE SUPPLIES CONFIRMED, BUT WHAT ABOUT 2005 PRODUCTION?
 SOYBEANS: LARGE SUPPLIES CONFIRMED, BUT WHAT ABOUT 2005 PRODUCTION? JANUARY 2005 Darrel Good 2005 NO. 2 Summary USDA s January reports confirmed a record large 2004 U.S. crop, prospects for large year-ending
U.S. Drought Monitor, August 7, 2012
 University of Nebraska - Lincoln DigitalCommons@University of Nebraska - Lincoln US Ag in Drought Archive Drought -- National Drought Mitigation Center -- U.S. Drought Monitor, August, Mark D. Svoboda
U.S. Drought Monitor, October 2, 2012
 University of Nebraska - Lincoln DigitalCommons@University of Nebraska - Lincoln US Ag in Drought Archive Drought -- National Drought Mitigation Center -2-12 U.S. Drought Monitor, October 2, 12 Anthony
Unit 5: Human-Environment Interactions (Lesson 7) Land, Air and Water: Additions and Removals
 Land, Air and Water: Additions and Removals") Unit 5: Human-Environment Interactions (Lesson 7) Land, Air and Water: Additions and Removals One way geographers classify modifications of the environment is by whether they have an impact on the land,
Unit 5: Human-Environment Interactions (Lesson 7) Land, Air and Water: Additions and Removals One way geographers classify modifications of the environment is by whether they have an impact on the land,
Draft Environmental Impact Statement
 The Safer Affordable Fuel-Efficient (SAFE) Vehicles Rule for Model Year 2021 2026 Passenger Cars and Light Trucks Draft Environmental Impact Statement July 2018 Docket No. NHTSA-2017-0069 Greenhouse Gas
SOYBEANS: SMALLER STOCKS, MORE ACRES, AND EARLY WEATHER WORRIES
 SOYBEANS: SMALLER STOCKS, MORE ACRES, AND EARLY WEATHER WORRIES APRIL 2000 Darrel Good Summary March 1, 2000 stocks of soybeans were estimated at 1.397 billion bushels, 60 million less than on the same
CAN THE UNITED NATIONS KEEP CLIMATE CHANGE UNDER CONTROL?
 CAN THE UNITED NATIONS KEEP CLIMATE CHANGE UNDER CONTROL? Climate change is one of the major challenges of our time and adds considerable stress to our societies and to the environment. From shifting weather
Potential Impacts to Texas of EPA s Clean Power Plan. Brian Tulloh Austin Electricity Conference April 9, 2015
 Potential Impacts to Texas of EPA s Clean Power Plan Brian Tulloh Austin Electricity Conference April 9, 2015 Luminant Is Texas Largest Competitive Power Generator 15.4 GW of generation capacity: 8.0 GW
August 4, The Honorable Donald J. Trump President 1600 Pennsylvania Avenue, NW Washington, DC Dear Mr. President:
 August 4, 2017 The Honorable Donald J. Trump President 1600 Pennsylvania Avenue, NW Washington, DC 20500 Dear Mr. President: On behalf of the more than 200 organizations representing rural communities,
Grain Price SOYBEANS: SMALLER U.S. CROP, WILL SOUTH AMERICA FILL THE GAP? OCTOBER 2002 Darrel Good 2002 NO. 8. Summary
 UNIVERSITY OF ILLINOIS EXTENSION Grain Price OUTLOOK A joint publication of the Department of Agricultural Economics, College of Agriculture, Purdue University, West Lafayette, Indiana, and the Department
2012 Distribution Best Practices Benchmarking Company Profile Data Packet
 American Gas Association January 2012 Company Name: DOT Operating ID(s): Person Completing Form: Phone Number: Email Address: Required Fields Deadline for data submittal in BESS, http://www.aga.org/research/bess/
CORN: MARKET TO REFLECT U.S. AND CHINESE CROP PROSPECTS
 CORN: MARKET TO REFLECT U.S. AND CHINESE CROP PROSPECTS JULY 2001 Darrel Good 2001 - No. 6 Summary The USDA s June Acreage and Grain Stocks reports provided some modest fundamental support for the corn
US Coal Supply Constraints:
 US Coal Supply Constraints: The Sweet Imperative that Will Help Drive the Repowering of the United States for the 21 st Century PXX Foundation October 2011 Leslie Glustrom Clean Energy Action lglustrom@gmail.com
States Use Gentle Hand in Taxing Timberland
 March 2009 No. 164 FISCAL FACT States Use Gentle Hand in Taxing Timberland By Travis Greaves In the realm of real property taxation, the best-known tax is on residential property. Every U.S. homeowner
Industrial Energy Efficiency as a Resource by Region
 Industrial Energy Efficiency as a Resource by Region Garrett Shields and Robert D. Naranjo, BCS Incorporated Sandy Glatt, U.S. Department of Energy ABSTRACT The energy intensity of specific manufacturing
Southeast Regional Carbon Sequestration Partnership
 Southeast Regional Carbon Sequestration Partnership The, encompasses an 11 state region including the states of Alabama, Arkansas, Florida, Georgia, Louisiana, Mississippi, North Carolina, South Carolina,
±450 Acre Premiere Business Park
 ±450 Acre Premiere Business Park Property Highlights Flexible lot sizes from 12-100 + acres. Lots are unplatted so different variations of each lot may be revised. Home to Musician s Friend, FedEx Ground,
IN THE UNITED STATES DISTRICT COURT FOR THE DISTRICT OF COLUMBIA
 IN THE UNITED STATES DISTRICT COURT FOR THE DISTRICT OF COLUMBIA WILDEARTH GUARDIANS 312 Montezuma Ave. Santa Fe, New Mexico 87501 and DEFENDERS OF WILDLIFE 1130 17th Street N.W. Washington, D.C. 20036
Coal s Vital Role in Our Energy Future
 Coal s Vital Role in Our Energy Future Kim Link Director Communications Park Hills, Mo. July 20, 2012 Arch is a top five global coal producer and a leader in safety and stewardship Global Coal Producers
U.S. Drought Monitor, August 14, 2012
 University of Nebraska - Lincoln DigitalCommons@University of Nebraska - Lincoln US Ag in Drought Archive Drought -- National Drought Mitigation Center 8-4-2 U.S. Drought Monitor, August 4, 2 Michael J.
LIVING IN THE ENVIRONMENT, 18e G. TYLER MILLER SCOTT E. SPOOLMAN. Climate Disruption. Cengage Learning 2015
 LIVING IN THE ENVIRONMENT, 18e G. TYLER MILLER SCOTT E. SPOOLMAN 19 Climate Disruption 19-1 How Is the Earth s Climate Changing? Considerable scientific evidence indicates that the earth s atmosphere is
Carbon Dioxide and Global Warming Case Study
 Carbon Dioxide and Global Warming Case Study Key Concepts: Greenhouse Gas Carbon dioxide El Niño Global warming Greenhouse effect Greenhouse gas La Niña Land use Methane Nitrous oxide Radiative forcing
Invasive Species There is an App and a Map for That
 Invasive Species There is an App and a Map for That Who am I? Information Technology Director Public Service Assistant in Entomology B.S. and M.S. in Computer Science President - National Exotic Pest Plant
Global Warming. By William K. Tong. Adjunct Faculty, Earth Science Oakton Community College
 Global Warming By William K. Tong Adjunct Faculty, Earth Science Oakton Community College What Is Global Warming? According to the National Academy of Sciences, the Earth's surface temperature has risen
Visibility, Haze, and Background Air Pollution in the West
 Visibility, Haze, and Background Air Pollution in the West An overview of visibility issues in the Western United States. Unimpeded visibility in the Western United States is strongly valued because of
Climate Change and Methane: Causes, Consequences and Solutions for Public Lands
 Climate Change and Methane: Causes, Consequences and Solutions for Public Lands Significant amounts of methane wasted by natural gas and coal producers on public lands across the country are greatly contributing
Unions for Jobs & Environmental Progress
 P.O. Box 1446 Olney, MD 20830 Ujep4jobs@gmail.com Jim Hunter, IBEW President hunter@ibew.org John Risch, UTU Vice President jrisch@smart union.org Pre-proposal Comments on U.S. EPA Existing Source Guidelines
HOW BIG IS AFRICA? Rules. recommended grades: 3-6
 AFRICA HOW BIG IS AFRICA? recommended grades: 3-6 time needed: 25 MINUTES Description Students develop a sense of scale by using their bodies and other tools to measure the length and width of Africa.
Energy and Regional Economics
 Energy and Regional Economics Michael Carliner International instability and possible war affect the overall US economy, and economic conditions in different regions, in a variety of ways. Changes in energy
Global Warming: A Threat Not to Be Ignored
 State Clean Cars Programs: An Effective Way to Slash Global Warming Pollution 10-State Clean Car Standards to Cut 64 Million Metric Tons of Global Warming Emissions per Year by 2020 Shrinking glaciers,
POTENTIAL IMPACTS ON WYOMING COAL PRODUCTION OF EPA GHG PROPOSALS
 POTENTIAL IMPACTS ON WYOMING COAL PRODUCTION OF EPA GHG PROPOSALS Forthcoming: Electricity Journal, June 2015 issue. R. Godby a, R. Coupal b, D. Taylor b, T. Considine a Economics and Finance, b Agricultural
Comparison of CAIR and CAIR Plus Proposal using the Integrated Planning Model (IPM ) Mid-Atlantic Regional Air Management Association (MARAMA)
 Mid-Atlantic Regional Air Management Association (MARAMA)") Draft Report Comparison of CAIR and CAIR Plus Proposal using the Integrated Planning Model (IPM ) Prepared for Mid-Atlantic Regional Air Management Association (MARAMA) Prepared by ICF Resources, L.L.C.
Draft Report Comparison of CAIR and CAIR Plus Proposal using the Integrated Planning Model (IPM ) Prepared for Mid-Atlantic Regional Air Management Association (MARAMA) Prepared by ICF Resources, L.L.C.
Economic Impact Study
 Economic Impact Study U.S.- Based Scrap Recycling Industry 2017 Prepared for the Institute for Scrap Recycling Industries, Inc. Executive Summary Scrap recycling is a major U.S.-based industry dedicated
CHAPTER 1 Executive Summary
 CHAPTER 1 Executive Summary Page Overview... 3 Status of Federal Coal Leases............. 6 Federal Coal Resources and Production..... 7 Ownership of Federal Coal Leases.......... 10 Lease Development
Intrepid Potash New Capital Investments Support Future Opportunities
 Intrepid Potash New Capital Investments Support Future Opportunities MMSA Colorado Section September 7, 2012 Presentation Overview Company Overview Capital Investment Overview Presentation of Select Capital
2010 County Sustainability Strategies
 2010 County Sustainability Strategies TM 1 Highlights The most important benefit counties are realizing from sustainability efforts is cost savings. Energy Efficiency and Renewable Energy Generation, and
PRICING POLLUTION. A Progressive Proposal for Combating Climate Change
 PRICING POLLUTION A Progressive Proposal for Combating Climate Change WHY The National Security Strategy, issued in February 2015, is clear that climate change is an urgent and growing threat to our
The Impacts of the Clean Air Act Amendments of 1990 and Changes in Rail Rates on Western Coal
 The Impacts of the Clean Air Act Amendments of 1990 and Changes in Rail Rates on Western Coal by John Bitzan Denver Tolliver Wayne Linderman Upper Great Plains Transportation Institute North Dakota State
CHALLENGING COAL IN THE TRUMP ADMINISTRATION
 Y L L A U ACT CHALLENGING COAL IN THE TRUMP ADMINISTRATION Shannon Anderson, Esq., Powder River Basin Resource Council, Shannon Hughes, Esq., WildEarth Guardians, Nathaniel Shoaff, Esq., Sierra Club 1
DID YOU KNOW THAT the federal
 Public Lands DID YOU KNOW THAT the federal government is managing roughly 670 million acres of land for U.S. citizens? That is about 30 percent of all the territory in the country. As you can imagine,
SOYBEANS: WORLD PRODUCTION CONTINUES TO EXPAND
 SOYBEANS: WORLD PRODUCTION CONTINUES TO EXPAND OCTOBER 2001 Darrel Good 2001-No. 7 Summary The USDA s October Crop Production report forecast the 2001 U.S. soybean crop at 2.907 billion bushels. That forecast
Land Values 2013 Summary
 United States Department of Agriculture National Agricultural Statistics Service Land Values 2013 Summary August 2013 ISSN: 19491867 Contents Agricultural Land Values Highlights... 4 Farm Real Estate,
Labor Market Outlook. Labor Market Outlook Survey Q (October December) Published by the Society for Human Resource Management
 Published by the Society for Human Resource Management") October December 2009 Labor Market Outlook Published by the Society for Human Resource Management Labor Market Outlook Survey Q4 2009 (October December) LABOR MARKET OUTLOOK SURVEY Q4 2009 (October December)
October December 2009 Labor Market Outlook Published by the Society for Human Resource Management Labor Market Outlook Survey Q4 2009 (October December) LABOR MARKET OUTLOOK SURVEY Q4 2009 (October December)
The Pyrogeographyof Wildfires in the Western U.S.
 The Pyrogeographyof Wildfires in the Western U.S. Dr. Michael Medler 1 2 3 4 The pumps buy you time, but minutes only. From this moment, no matter what we do, Titanic will founder. But this ship can't
Land Values and Cash Rents
 United States Department of Agriculture National Agricultural Statistics Service Land Values and Cash Rents 2009 Summary August 2009 ISSN: 19491867 Contents Agricultural Land Values Highlights... 4 U.
Accelerating Energy Efficiency in Texas
 Accelerating Energy Efficiency in Texas Southwest Partnership for Energy Efficiency As a Resource Houston, Texas August 5, 2014 Jim Lazar RAP Senior Advisor The Regulatory Assistance Project 50 State Street,
Sagebrush Country and Oil and Gas Country Can Coexist
 A Voice for the Western Majority Sagebrush Country and Oil and Gas Country Can Coexist In recent months, communities, businesses and elected officials throughout the West have collaborated in an unprecedented
Survey of Mineral Admixtures and Blended Cements in Ready Mixed Concrete
 Survey of Mineral Admixtures and Blended Cements in Ready Mixed Concrete A survey of concrete producers to quantify the use of cement, admixtures and blended cements in ready mixed concrete. October 2000
The Office of Surface Mining s Abandoned Mine Land Program
 The Office of Surface Mining s Abandoned Mine Land Program Tim Thoreen Introduction In the early 1970s, the mining industry held a symposium concerning the revegetation of surface mine land (West Virginia