Total Maximum Daily Loads for Total and Fecal Coliform Bacteria for Tumblin Creek, Alachua County, Florida WBID 2718A
|
|
|
- Paulina Wade
- 5 years ago
- Views:
Transcription

1 FLORIDA DEPARTMENT OF ENVIRONMENTAL PROTECTION Division of Water Resource Management, Bureau of Watershed Management Total Maximum Daily Loads for Total and Fecal Coliform Bacteria for Tumblin Creek, Alachua County, Florida WBID 2718A Zack Shelley and Wayne Magley, Ph.D., P.E. Florida Department of Environmental Protection Watershed Assessment Section September 19, 2003
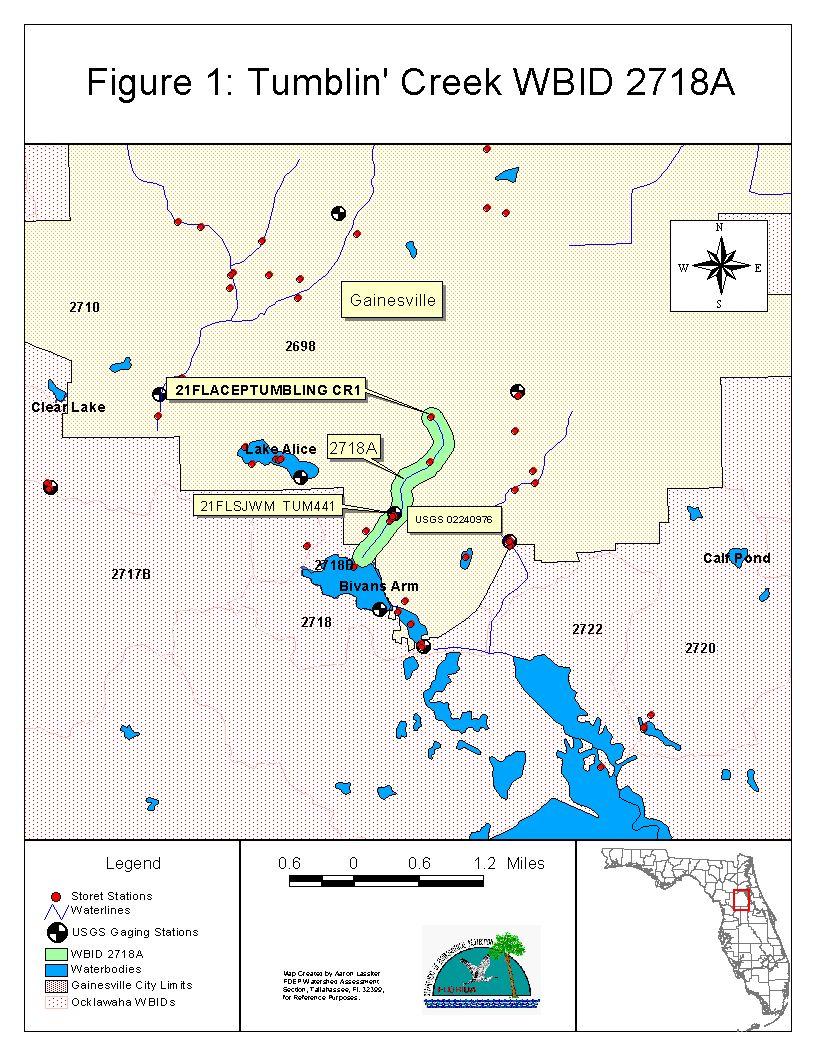
2 1.0 INTRODUCTION 1.1 Purpose of Report This report presents a Total Maximum Daily Load (TMDL) for Total and Fecal Coliforms for Tumblin Creek. Using the methodology to identify and verify water quality impairments described in the Impaired Waters Rule (IWR), Chapter , Florida Administrative Code (FAC), the creek was verified as impaired by Total and Fecal Coliforms, and was included on the verified list of impaired waters for the Ocklawaha Basin that was adopted by Secretarial Order on August 28, Identification of Waterbody For assessment purposes, the watersheds within the Ocklawaha River Basin have been broken out into smaller watersheds, with a unique waterbody identification (WBID) number for each watershed. Tumblin Creek has been assigned WBID 2718A. Tumblin Creek is located in Gainesville, Florida, in the Orange Creek planning unit of the Ocklawaha River basin (Figure 1). The Orange Creek Planning Unit contains many creeks and lakes in an area of approximately 602 square miles. Tumblin Creek is approximately 2.3 miles long and is one of the larger creeks in the Orange Creek planning unit. Though there are no permitted domestic wastewater discharges to Tumblin Creek, the creek watershed is entirely contained within the limits of the City of Gainesville. Urban and residential runoff appear to be the significant sources of bacterial contamination. Tumblin Creek flows through the Tumblin Creek watershed, located in southwest Gainesville to Bivens Arm Lake. The outflow of the lake then travels to Paynes Prairie where it enters the Floridan Aquifer via Alachua Sink. As the main stream channel flows southwest, elevations decrease exposing recent sands as well as Plio-Pleistocene Terrace deposits (comprised of sands and clays) and miocene age units of the Hawthorn Group (Spangler, 1985). The Hawthorn Group sediments are extremely variable, but generally consist of sands, clays, carbonates (limestone and dolomite), and phosphates (Scott, 1988). The Tumblin Creek watershed encompasses about 8.9 square miles of urban Gainesville. CH2M HILL (1985) reported 60% of this area to be impervious. The entire basin, except for the Bivens Arm floodplain, has been developed. In many cases, the development stops only inches from the creek channel. The elevation above National Geodetic Vertical Datum (NGVD) in the vicinity of the Tumblin Creek headwaters is near 170 feet and falls to 65 feet near Bivens Arm. The elevation decreases further as it flows to Alachua Sink. The watershed is located along the southwestern margin of the Northern Highlands physiographic province (White adjacent to SW 16th Avenue and U.S. Highway 441 (US 441). The headwaters of the creek, which extend north from SW 5th Avenue to NW 8th Avenue, west to 13th Street, and east to Main Street, are channelized through underground concrete culverts. Sources of baseflow include springs and seeps at the
3 base of the surficial aquifer and, lower in the basin, permeable units within the intermediate aquifer system. As part of the urbanized Gainesville area, the Tumblin Creek watershed has undergone extensive urbanization, and now residential and commercial areas around Gainesville account for the majority of land use in the impaired WBID. The distribution of land cover for Tumblin Creek is based on the National Land Cover Dataset (NLCD) of 1995 and is tabulated in Table 1. Table 1. Land Cover Distribution Land Cover For Tumblin Creek Total Acres % Distribution Urban Transport., Commercial, Utilities, Public 2 Agriculture 0 0 Barren Land 0 0 Rangeland Forest Wetlands Water Total Acreage represents the land use distribution in the impaired WBID and not the entire drainage area. 2. Public lands include urban and recreational areas. 3. Rangeland includes shrubland, grassland, and herbaceous land covers. 3
4 4
5 2.0 STATEMENT OF PROBLEM Florida s 1998 Section 303(d) list identified Tumblin Creek (WBID 2718A) in the Ocklawaha River Basin as not supporting water quality standards (WQS) for coliform bacteria. Through analysis of water quality data per Chapter , F.A.C., (Identification of Impaired Surface Waters or IWR), Tumblin Creek was verified as impaired for both total and fecal coliform bacteria. The creek was included on the list of impaired surface waters adopted by Secretarial Order on August 28, 2002, and then submitted to EPA as part of the 2002 update to Florida 303(d) list. During the verified period ( ), 18 out of the 24 fecal coliform samples from station 21FLACEPTUMBLIN CR1 exceeded the FDEP criterion of 800 counts/100 ml (75% exceedance rate). There was slight seasonal variability in the fecal coliform values, with higher averages in the spring (average of 6,686 counts/100 ml), followed by fall (average of 5,525 counts/100 ml), summer (average of 5,208 counts/100 ml), and winter (average of 3,833 counts/100 ml). For total coliforms, 12 out of 13 samples exceeded the FDEP criterion of 2,400 counts/100ml (92% exceedance). There was notable seasonal variability in the total coliform values, with higher averages in the spring (average of 66,286 counts/100 ml), followed by fall (average of 36,667 counts/100 ml), summer (average of 24,000 counts/100 ml), and winter (average of 3,000 counts/100 ml). 3.0 DESCRIPTION OF APPLICABLE WATER QUALITY STANDARDS AND NUMERIC WATER QUALITY TARGET Tumblin Creek is classified as a Class III waterbody, with a designated use of recreation, propagation and maintenance of a healthy, well-balanced population of fish and wildlife. The Class III water quality criteria applicable to the observed impairment are the numeric criteria for bacterial quality for fecal and total bacteria counts (Rule (7), F.A.C.). Both criteria have three separate components, expressed as follows: Fecal Coliform Bacteria: The most probable number (MPN) or membrane filter (MF) counts per 100 millileters (ml) of fecal coliform bacteria shall not exceed a monthly average of 200, nor exceed 400 in 10 percent of the samples, nor exceed 800 on any one day. Total Coliform Bacteria: The MPN or MF per 100 millileters (ml) shall be less than or equal to 1000 as a monthly average nor exceed 1000 in more than 20 percent of the samples examined during any month; and less than or equal to 2400 at any time. The rule also states that, for both fecal and total coliform bacteria, monthly averages shall be expressed as geometric means based on a minimum of 10 samples taken over a 30-day period. 5
6 Insufficient data were collected to base existing loads on the geometric mean criterion for either fecal coliform or total coliform bacteria. As such, the target for the fecal coliform TMDL is the one-day maximum criterion of 800 counts per 100 ml, and the target for the total coliform TMDL is the one-day maximum criterion of 2400 counts per 100 ml. The one-day maximum criteria is appropriate for TMDL development as this criterion was typically violated during and/or after storm events. For coliforms, an extended dry period followed by a storm event is usually identified as the critical period when coliform levels in waterbodies exceed the water quality criteria. 4.0 ASSESSMENT OF SOURCES 4.1 Types of Sources An important part of the TMDL analysis is the identification of source categories, source subcategories, or individual sources of coliforms in the watershed and the amount of pollutant loading contributed by each of these sources. Sources are broadly classified as either point sources or nonpoint sources. Historically, the term point sources has meant discharges to surface waters that typically have a continuous flow via a discernable, confined, and discrete conveyance, such as a pipe. Domestic and industrial wastewater treatment facilities (WWTFs) are examples of traditional point sources. In contrast, the term nonpoint sources was used to describe intermittent, rainfall driven, diffuse sources of pollution associated with everyday human activities, including runoff from urban land uses, runoff from agriculture, runoff from silviculture, runoff from mining, discharges from failing septic systems, and atmospheric deposition. However, the 1987 amendments to the Clean Water Act redefined certain nonpoint sources of pollution as point sources subject to regulation under EPA s National Pollutant Discharge Elimination Program (NPDES). These nonpoint sources included certain urban stormwater discharges, including those from local government master drainage systems, construction sites over five acres, and from a wide variety of industries (see Appendix A for background information about the State and Federal Stormwater Programs). To be consistent with Clean Water Act definitions, the term point source will be used to describe traditional point sources (such as domestic and industrial wastewater discharges) AND stormwater systems requiring an NPDES stormwater permit when allocating pollutant load reductions required by a TMDL (see Section 6). However, the methodologies used to estimate nonpoint source loads do not distinguish between NPDES stormwater discharges and non-npdes stormwater discharges, and as such, this source assessment section does not make any distinction between the two types of stormwater. 4.2 Nonpoint Sources in the Watershed Nonpoint sources of coliform bacteria generally, but not always, involve accumulation of coliform bacteria on land surfaces and wash off as a result of storm events. Typical nonpoint sources of coliform bacteria include: Wildlife Agricultural animals 6
7 Onsite Sewer Treatment and Disposal Systems (septic tanks) Urban development (outside of Phase I or II MS4 discharges) The Watershed Characterization System (WCS), a geographic information system (GIS) tool, was used to display, analyze, and compile available information to characterize potential bacteria sources in the Tumblin Creek watershed. Potential sources of impairment include leaking collection lines or leaking septic systems ; livestock having access to streams; and rainfall events when surface and stormwater runoff and infiltration/interflow dominate. For Tumblin Creek, there are two primary methods of loading or transport for nonpoint source total and fecal coliform bacteria. First, loading from failing septic systems and animals in the stream are considered direct sources to the stream, as they are independent of precipitation. The second mode involves loading resulting from total and fecal coliform accumulation on land surfaces that is transported to the stream during storm events Wildlife Wildlife deposit coliform bacteria with their feces onto land surfaces where it can be transported during storm events to nearby streams. The bacteria load from wildlife is typically assumed background, as the contribution from this source is usually small relative to the load from urban areas Agricultural Animals Agricultural animals can be the source of several types of coliform loading to streams. Livestock data from the 1997 Census of Agriculture for Alachua County where Tumblin Creek is located are listed in Table 2. The US Department of Agriculture is currently in the process of updating the agricultural census for Data from the 2002 Census will be released to the public in the Spring of As shown in Table 2, cattle, including beef and dairy, are the predominate livestock in WBID 2718A. There are no known Confined Animal Feeding Operations (CAFOs) operating in the impaired WBID. Table 2. Livestock Distribution by County (source: NASS, 1997) Livestock Distribution Alachua County Cattle 49,567 Beef 27,324 Dairy 3,341 Swine 1,292 Poultry (broilers sold) (D 1 ) Sheep 716 Horses 1,731 (D) data withheld to avoid disclosing data for individual farms. 7
8 4.2.3 Onsite Sewage Treatment and Disposal Systems (Septic Tanks) Onsite sewage treatment and disposal systems (OSTDs or septic tanks) are commonly used where providing central sewer is not cost effective or practical. When properly sited, designed, constructed, maintained, and operated, OSTDs are a safe means of disposing of domestic waste. The effluent from a well-functioning OSTD is comparable to secondarily treated wastewater for a sewage treatment plant. When not functioning properly, OSTDs can be a source of nutrients (nitrogen and phosphorus), pathogens, and other pollutants to both ground water and surface water. Table 3 summarizes the number of septic systems in Alachua County and provides estimates of countywide failure rates and total daily discharge of wastewater from septic tanks. Table 3. County Estimates of Septic Tanks (FDEP, 2001) County Number of Septic Tanks 1 Percent of 1995 Population Using Septic Tanks 2 Failure Rate per Estimated Discharge (MGD) 4 Alachua 37, Total number per county is based on 1970 census figures plus the number of systems installed since 1970 through June 30, Numbers do not reflect the removal of septic systems by connection to central sewers. 2. Source: St Johns River Water Management District, May 2000, p. 97, cited in FDEP Defined as the number of repairs divided by the number of installed systems for July 1, 1999 to June 30, Based on value of 135 gallons per tank per day (FDEP, 2001) Urban Development Total and fecal coliform loadings from urban areas is attributable to multiple sources including storm water runoff, leaks and overflows from sanitary sewer systems, illicit discharges of sanitary waste, runoff from improper disposal of waste materials, leaking septic systems, and domestic animals. 4.3 Point Sources There are no NPDES permitted domestic wastewater discharges to Tumblin Creek. All of the Tumblin Creek watershed lies within an area covered under Gainesville s NPDES Stormwater Program Phase II Municipal Separate Storm Sewer System (MS4) Permit. 5.0 LOADING CAPACITY LINKING WATER QUALITY AND POLLUTANT SOURCES The TMDL process quantifies the amount of a pollutant that can be assimilated in a waterbody, identifies the source of the pollutant, and recommends regulatory or other actions to be taken to achieve compliance with applicable water quality standards based on a relationship between pollution sources and in-stream water quality conditions. 8
9 5.1 Determination of Assimilative Capacity The percent reduction methodology was used to establish the Tumblin Creek TMDL. To determine the maximum daily concentration the stream can assimilate and maintain water quality standards, target concentrations of 800 counts/100 ml for fecal coliform and 2,400 counts/100 ml for total coliform were utilized. The TMDL target criterion for fecal and total coliform bacteria cannot exceed a concentration of 800 and 2,400 counts/100 ml, respectively, as specified in the Class III WQS. 5.2 Percent Reduction Approach Coliform TMDLs are commonly developed using load duration curves. However, this method requires flow data to calculate coliform and loads, and continuous flow data were not available for Tumblin Creek for the period when coliform data were available. When flow data are not available, the approach used to estimate a TMDL is based on the average percent reduction required to reduce the observed concentration to the water quality standard. A statistical summary of the coliform data used in developing the fecal and total coliform TMDLs for Tumblin Creek is shown in Tables 4 and 5. Locations of monitoring stations for the creek are shown in Figure 1. Water quality data collected at station 21FLACEPTUMBLIN CR1 were used to estimate the fecal and total coliform TMDLs for Tumblin Creek. This station has the largest number of samples for both fecal and coliform data. Data used to compile the statistics shown in Tables 4 and 5 are included in Appendix B. Table 4. Summary of Fecal Coliform Monitoring Data WBID Total Number Samples 30-Day Geometric Mean % Samples > 800 counts/100ml Minimum Concentration (counts/100ml) Maximum Concentration (counts/100ml) 2718A 24 N/A ,000 Table 5. Summary of Total Coliform Monitoring Data WBID Total Number Samples 30-Day Geometric Mean % Samples > 2,400 counts/100ml Minimum Concentration (counts/100ml) Maximum Concentration (counts/100ml) 2718A 13 N/A , ,000 To derive/establish an average percent reduction, the State s maximum criterion for total coliform (2,400 counts/100ml) and fecal coliform (800 counts/100ml) were subtracted from each sample violation respectively and then divided by the sample violation and multiplied by 100. This value provides the percent reduction required to achieve the instream concentration criterion established for total and fecal coliform. The percent reduction values for each sample violation for fecal and total coliform where then averaged providing an overall percentage reduction for that water quality variable to meet standards. It should be noted that there is a discontinued flow gage located in the watershed and attempts were made to extend the record of the gage to correspond with the sampling 9
10 time period. However, given the karst topography and the size of the Tumblin Creek watershed relative to the nearest USGS gage on Hogtown Creek (about 42 square miles), the drainage area ratio was too small to extend the Tumblin Creek flow record. According to USGS methods the flow at a discontinued gage can be accurately estimated from a record at a nearby long-term site when the drainage ratios of the two sites are within 0.5 to 1.5. When flow data are not available, it is also common practice to estimate flows using drainage area ratios to a nearby gaged stream. However, this option was again not appropriate for Tumblin Creek because the drainage area for Tumblin Creek is too small relative to the drainage area of Hogtown Creek to use a weighted drainage area ratio for estimating flows. Given the lack of flow data, it is not possible to correlate exceedances of the water quality with flow events. Without a means for estimating flow, it is not possible to calculate a load. As a result, the fecal and total coliform TMDLs for Tumblin Creek are concentration based and expressed as a percent reduction water quality criterion. 6.0 CRITICAL CONDITIONS The critical condition for the coliform loading from nonpoint sources is an extended dry period followed by a rainfall runoff event. During the dry weather period, coliform bacteria builds up on the land surface and are washed off by rainfall. The critical condition for point source loading occurs during periods of low stream flow when dilution is minimized. Water quality data were collected during both time periods with violations occurring during both time periods. 7.0 DETERMINATION OF TMDL The objective of a TMDL is to provide a basis for allocating acceptable loads among all of the known pollutant sources in a watershed so that appropriate control measures can be implemented and water quality standards achieved. A TMDL is expressed as the sum of all point source loads (Waste Load Allocations), nonpoint source loads (Load Allocations), and an appropriate margin of safety (MOS), which takes into account any uncertainty concerning the relationship between effluent limitations and water quality: TMDL = WLAs + LAs + MOS As mentioned in Section 4.1, the WLA is broken out into separate subcategories for wastewater discharges and stormwater discharges regulated under the NPDES Program: TMDL WLAs wastewater + WLAs NPDES Stormwater + LAs + MOS It should be noted that the various components of the TMDL equation may not sum up to the value of the TMDL because a) the WLA for NPDES stormwater is typically based on the percent reduction needed for nonpoint sources and is accounted for within the LA, and b) TMDL components can be expressed in different terms [for example, the WLA for 10
11 stormwater is typically expressed as a percent reduction and the WLA for wastewater is typically expressed as a mass per day]. WLAs for stormwater discharges are typically expressed as percent reduction because it is very difficult to quantify the loads from MS4s (given the numerous discharge points) and to distinguish loads from MS4s from other nonpoint sources (given the nature of stormwater transport). The permitting of stormwater discharges is also different than the permitting of most wastewater point sources. Because stormwater discharges cannot be centrally collected, monitored and treated, they are not subject to the same types of effluent limitations as wastewater facilities, and instead are required to meet a performance standard of providing treatment to the maximum extent practical through the implementation of Best Management Practices. This approach is consistent with federal regulations [40 CFR 130.2(I)], which state that TMDLs can be expressed in terms of mass per time (e.g. pounds per day), toxicity, or other appropriate measure. TMDLs for Tumblin Creek are expressed in terms of the average percent reduction required to achieve water quality criteria (Table 6). The total and fecal coliform TMDLs for Tumblin Creek are expressed as the average percent reduction required to reduce the observed water quality violations to the oneday maximum water quality criterion. The percent reduction value for fecal coliform and total coliform were determined by averaging the percent reduction based on the individual concentrations for each water quality variable. For total coliform, a 91 percent reduction is required to achieve an instream concentration of 2,400 counts/100ml. For fecal coliform, a 74 percent reduction is required to achieve an instream concentration of 800 counts/100ml. Table 6. TMDL Components WBID Parameter Wastewater (lbs/year) WLA NPDES Stormwater (% Reduction) LA (lbs/year) MOS TMDL (% Reduction) 2718A 2718A Fecal Coliform NA Implicit 74 Total Coliform NA Implicit Load Allocations (LA) All of the Tumblin Creek watershed lies within an area covered under Gainesville s Phase II MS4 permit. However, sources of impairment include leaking septic systems and stormwater runoff where infiltration/inflow dominate. These are considered to be nonpoint sources and are not covered under the under the MS4 permit. As a result, the LA values have been assigned a percent reduction similar to the TMDL and WLA Stormwater reductions. It should be noted that the LA includes loading from stormwater discharges regulated by the Department and the Water Management Districts that are not part of the NPDES Stormwater Program. 11
12 7.2 Wasteload Allocations (WLAs) There are no NPDES permitted facilities that discharge coliform bacteria to surface waters in the Tumblin Creek basin, and as such, the wasteload allocation for wastewater facilities is zero. Any future wastewater facility permitted to discharge coliform bacteria in the Tumblin Creek watershed will be required to meet permit limits and must not exceed the established TMDL values. For future facilities discharging into the basin, nonpoint source loads shall to be reduced such that the combined WLA and LA do not exceed the established TMDLs. Municipal Separate Storm Sewer Systems (MS4s) typically discharge bacteria to waterbodies in response to storm events. Large and medium MS4s serving populations greater than 100,000 people were required to obtain a NPDES storm water permit under Phase 1 of the program. As of March 2003, small MS4s serving urbanized areas are now required to obtain a permit under the Phase II storm water regulations. An urbanized area is defined as an entity with a residential population of at least 50,000 people and an overall population density of 1000 people per square mile. The City of Gainesville will be covered under Phase II of the NPDES Storm Water Program. Tumblin Creek is located within the Gainesville area and the calculated percent reduction applies to the MS4. It should be noted that any MS4 permittee will only be responsible for reducing the loads associated with stormwater outfalls for which it owns or otherwise has responsible control, and is not responsible for reducing other nonpoint source loads within its jurisdiction. 7.3 Margin of Safety (MOS) There are two methods for incorporating a MOS in the Tumblin Creek TMDL analysis: (1) by implicitly incorporating the MOS using conservative model assumptions to develop allocations, or (2) by explicitly specifying a portion of the TMDL as the MOS and using the remainder for allocations. In this TMDL, an implicit MOS was incorporated. The percent reduction necessary to achieve water quality standards is based on the monitoring stations having the largest number of samples and the highest water quality violations. Due to dilution and decay, not all stations require the same reduction to meet standards. By selecting the highest reduction, an implicit MOS is incorporated in the analysis. Additionally, the TMDL sets the water quality standard at the edge of the waterbody/point of discharge. If the allocation is met, dilution and decay could result in instream water quality samples below the numerical criteria and an implicit MOS would be realized. 8.0 IMPLEMENTATION PLAN DEVELOPMENT AND BEYOND Following adoption of this TMDL by rule, the next step in the TMDL process is to develop an implementation plan for the TMDL, which will be a component of the Basin Management Action Plan for the Tumblin Creek basin. This document will be developed in cooperation with local stakeholders and will attempt to reach consensus on more detailed allocations and on how load reductions will be accomplished. The Basin Management Action Plan (B-MAP) will include: 12
13 Appropriate allocations among the affected parties. A description of the load reduction activities to be undertaken. Timetables for project implementation and completion. Funding mechanisms that may be utilized. Any applicable signed agreements. Local ordinances defining actions to be taken or prohibited. Local water quality standards, permits, or load limitation agreements. Monitoring and follow-up measures. It should be noted that TMDL development and implementation is an iterative process, and this TMDL will be re-evaluated during the BMAP development process and subsequent Watershed Management cycles. The Department acknowledges the uncertainty associated with TMDL development and allocation, particularly in estimates of nonpoint source loads and allocations for NPDES stormwater discharges, and fully expects that it may be further refined or revised over time. If any changes in the estimate of the assimilative capacity AND/OR allocation between point and nonpoint sources are required, the rule adopting this TMDL will be revised, thereby providing a point of entry for interested parties. 9.0 SEASONAL VARIATION Seasonality was addressed by using water quality data associated with the impaired stream and collected during multiple seasons. 13
14 Appendix A In 1982, Florida became the first state in the country to implement statewide regulations to address the issue of nonpoint source pollution by requiring new development and redevelopment to treat stormwater before it is discharged. The Stormwater Rule, as authorized in Chapter 403, Florida Statutes (F.S.), was established as a technologybased program that relies upon the implementation of BMPs that are designed to achieve a specific level of treatment (i.e., performance standards) as set forth in Chapter 62-40, Florida Administrative Code (F.A.C.). The rule requires Water Management Districts (WMDs) to establish stormwater pollutant load reduction goals (PLRGs) and adopt them as part of a SWIM plan, other watershed plan, or rule. Stormwater PLRGs are a major component of the load allocation part of a TMDL. To date, stormwater PLRGs have been established for Tampa Bay, Lake Thonotosassa, Winter Haven Chain of Lakes, the Everglades, Lake Okeechobee, and Lake Apopka. No PLRG has been developed for Newnans Lake at the time this study was conducted. In 1987, the U.S. Congress established section 402(p) as part of the Federal Clean Water Act Reauthorization. This section of the law amended the scope of the federal NPDES to designate certain stormwater discharges as point sources of pollution. These stormwater discharges include certain discharges that are associated with industrial activities designated by specific Standard Industrial Classification (SIC) codes, construction sites disturbing five or more acres of land, and master drainage systems of local governments with a population above 100,000 [which are better known as municipal separate storm sewer systems (MS4s)]. However, because the master drainage systems of most local governments in Florida are interconnected, EPA has implemented Phase 1 of the MS4 permitting program on a county-wide basis, which brings in all cities (incorporated areas), Chapter 298 urban water control districts, and the DOT (Department of Transportation) throughout the 15 counties meeting the population criteria. An important difference between the federal and the state stormwater permitting programs is that the federal program covers both new and existing discharges while the state program focuses on new discharges. Additionally, Phase 2 of the NPDES stormwater permitting program will expand the need for these permits to construction sites between one and five acres, and to local governments with as few as 10,000 people. These revised rules require that these additional activities obtain permits by While these urban stormwater discharges are now technically referred to as point sources for the purpose of regulation, they are still diffuse sources of pollution that can not be easily collected and treated by a central treatment facility similar to other point sources of pollution, such as domestic and industrial wastewater discharges. The DEP recently accepted delegation from EPA for the stormwater part of the NPDES program. It should be noted that most MS4 permits issued in Florida include a re-opener clause that allows permit revisions to implement TMDLs once they are formally adopted by rule. 14
15 Appendix B Water Quality Data Tumblin' Creek Fecal Coliform TMDL Data Statistics WBID Basin/Waterbody Station ID Date Fecal Coliform (counts/100 ml) 2718A Tumblin' Creek 21FLACEPTUMBLIN CR1 7-Jun A Tumblin' Creek 21FLACEPTUMBLIN CR1 24-Jul A Tumblin' Creek 21FLACEPTUMBLIN CR1 31-Oct A Tumblin' Creek 21FLACEPTUMBLIN CR1 8-Jan A Tumblin' Creek 21FLACEPTUMBLIN CR1 27-Mar A Tumblin' Creek 21FLACEPTUMBLIN CR1 13-Aug A Tumblin' Creek 21FLACEPTUMBLIN CR1 17-Dec A Tumblin' Creek 21FLACEPTUMBLIN CR1 10-Feb A Tumblin' Creek 21FLACEPTUMBLIN CR1 26-Jan A Tumblin' Creek 21FLACEPTUMBLIN CR1 19-Apr A Tumblin' Creek 21FLACEPTUMBLIN CR1 19-Apr A Tumblin' Creek 21FLACEPTUMBLIN CR1 20-Jul A Tumblin' Creek 21FLACEPTUMBLIN CR1 7-Sep A Tumblin' Creek 21FLACEPTUMBLIN CR1 26-Oct A Tumblin' Creek 21FLACEPTUMBLIN CR1 22-Nov A Tumblin' Creek 21FLACEPTUMBLIN CR1 2-Dec A Tumblin' Creek 21FLACEPTUMBLIN CR1 27-Jan A Tumblin' Creek 21FLACEPTUMBLIN CR1 29-Feb A Tumblin' Creek 21FLACEPTUMBLIN CR1 20-Mar A Tumblin' Creek 21FLACEPTUMBLIN CR1 3-May A Tumblin' Creek 21FLACEPTUMBLIN CR1 18-May A Tumblin' Creek 21FLACEPTUMBLIN CR1 30-May A Tumblin' Creek 21FLACEPTUMBLIN CR1 12-Jun A Tumblin' Creek 21FLACEPTUMBLIN CR1 8-Jan Data Analysis Station # Samples Collected Samples >800 % Exceedances 21FLACEPTUMBLIN CR Fecal Coliform Sample Violations at Station 21FLACEPTUMBLING CR1 Date Concentration % Reduction 6/7/ /24/ /31/ /27/ /13/ /17/ /26/ /20/ /7/ /22/ /2/ /27/
16 2/29/ /20/ /3/ /18/ /12/ /8/ Average Percent Reduction Value for Fecal 73.6 % Coliform Tumblin' Creek Total Coliform TMDL Data Statistics WBID Basin/Waterbody Station ID Date Total Coliform (counts/100 ml) 2718A Tumblin' Creek 21FLACEPTUMBLIN CR1 20-Jul A Tumblin' Creek 21FLACEPTUMBLIN CR1 7-Sep A Tumblin' Creek 21FLACEPTUMBLIN CR1 26-Oct A Tumblin' Creek 21FLACEPTUMBLIN CR1 22-Nov A Tumblin' Creek 21FLACEPTUMBLIN CR1 2-Dec A Tumblin' Creek 21FLACEPTUMBLIN CR1 27-Jan A Tumblin' Creek 21FLACEPTUMBLIN CR1 20-Mar A Tumblin' Creek 21FLACEPTUMBLIN CR1 3-May A Tumblin' Creek 21FLACEPTUMBLIN CR1 18-May A Tumblin' Creek 21FLACEPTUMBLIN CR1 18-May A Tumblin' Creek 21FLACEPTUMBLIN CR1 30-May A Tumblin' Creek 21FLACEPTUMBLIN CR1 12-Jun A Tumblin' Creek 21FLACEPTUMBLIN CR1 12-Jun Data Analysis: Station # Samples Collected # Samples > 2400 % Exceedances 21FLACEPTUMBLING CR Total Coliform Sample Violations at Station 21FLACEPTUMBLING CR1 Date Concentration % Reduction 9/7/ /26/ /22/ /2/ /27/ /20/ /3/ /18/ /30/ /12/ Average Percent Reduction Value for Total 90.5 % Coliform Notes: 1. Concentrations represent geometric mean of two samples collected one minute apart 16
17 REFERENCES Gainesville Metropolitan Transportation Planning Organization, East Gainesville Community Profile, Plan East Gainesville Final Report, Internet document, Last update, March FDEP, Ocklawaha Basin Status Report, Florida Department of Environmental Protection, Division of Water Resource Management, Central District, Group 1 Basin, Tallahassee, Florida, November FDEP, Surface Water Quality Standards, Chapter , F.A.C., Florida Department of Environmental Protection, Division of Water Resource Management, Tallahassee, Florida, April, National Agricultural Statistics Service (NASS), Agricultural Census for 1997, U. S. Department of Agriculture. National Land Cover Data (NLCD), Multi-Resolution Land Characteristics Consortium, U. S. Environmental Protection Agency, Washington, DC. USDA, Census of Agriculture, Volume 1, Geographic Area Series, Part 42, U. S. Department of Agriculture, National Agricultural Statistics Service. AC97-A-42, March USEPA, Guidance for Water Quality based Decisions: The TMDL Process. U. S. Environmental Protection Agency, Office of Water, Washington, DC. EPA-440/ , April
Action Plan for the James River (Tidal) Bacteria TMDL ( MS4 General Permit)
 Bacteria TMDL ( MS4 General Permit)") Action Plan for the James River (Tidal) Bacteria TMDL (2013-2018 MS4 General Permit) Northern John Tyler Virginia Community College A Plan to Address JTCC s Assigned Waste Load Allocation for the Chester
Action Plan for the James River (Tidal) Bacteria TMDL (2013-2018 MS4 General Permit) Northern John Tyler Virginia Community College A Plan to Address JTCC s Assigned Waste Load Allocation for the Chester
FINAL Total Maximum Daily Load (TMDL) for Unnamed Tributary to Bon Secour River Assessment Unit ID # AL Pathogens (fecal coliform)
 for Unnamed Tributary to Bon Secour River Assessment Unit ID # AL Pathogens (fecal coliform)") FINAL Total Maximum Daily Load (TMDL) for Unnamed Tributary to Bon Secour River Assessment Unit ID # AL03160205-0310-702 Alabama Department of Environmental Management Water Quality Branch Water Division
FINAL Total Maximum Daily Load (TMDL) for Unnamed Tributary to Bon Secour River Assessment Unit ID # AL03160205-0310-702 Alabama Department of Environmental Management Water Quality Branch Water Division
TMDL Report Dissolved Oxygen for Coral Creek East Branch (WBID 2078B)
") DRAFT FLORIDA DEPARTMENT OF ENVIRONMENTAL PROTECTION Division of Environmental Assessment and Restoration, Bureau of Watershed Restoration SOUTH DISTRICT CHARLOTTE HARBOR BASIN TMDL Report Dissolved Oxygen
DRAFT FLORIDA DEPARTMENT OF ENVIRONMENTAL PROTECTION Division of Environmental Assessment and Restoration, Bureau of Watershed Restoration SOUTH DISTRICT CHARLOTTE HARBOR BASIN TMDL Report Dissolved Oxygen
FINAL TURBIDITY TOTAL MAXIMUM DAILY LOADS FOR SALT CREEK AREA, OKLAHOMA OKLAHOMA DEPARTMENT OF ENVIRONMENTAL QUALITY
 FINAL TURBIDITY TOTAL MAXIMUM DAILY LOADS FOR SALT CREEK AREA, OKLAHOMA OKLAHOMA DEPARTMENT OF ENVIRONMENTAL QUALITY APRIL 2010 FINAL TURBIDITY TOTAL MAXIMUM DAILY LOADS FOR SALT CREEK AREA, OKLAHOMA OKWBID
CHESAPEAKE BAY TMDL ACTION PLAN ( MS4 General Permit)
") CHESAPEAKE BAY TMDL ACTION PLAN (2013 2018 MS4 General Permit) Piedmont Virginia Community College A Plan for Achieving a 5% Reduction of Existing Loads June 30, 2015 Main Campus This plan satisfies the
CHESAPEAKE BAY TMDL ACTION PLAN (2013 2018 MS4 General Permit) Piedmont Virginia Community College A Plan for Achieving a 5% Reduction of Existing Loads June 30, 2015 Main Campus This plan satisfies the
Water Quality Study In the Streams of Flint Creek and Flint River Watersheds For TMDL Development
 Water Quality Study In the Streams of Flint Creek and Flint River Watersheds For TMDL Development Idris Abdi Doctoral Dissertation Presentation Major Advisor: Dr. Teferi Tsegaye April 18, 2005 Alabama
FINAL 2012 BACTERIA AND TURBIDITY TOTAL MAXIMUM DAILY LOADS FOR THE RED RIVER, OKLAHOMA (OK311100, OK311200, OK311210, OK311510, OK311600, OK311800)
") FINAL 2012 BACTERIA AND TURBIDITY TOTAL MAXIMUM DAILY LOADS FOR THE RED RIVER, OKLAHOMA (OK311100, OK311200, OK311210, OK311510, OK311600, OK311800) Prepared for: OKLAHOMA DEPARTMENT OF ENVIRONMENTAL QUALITY
FINAL 2012 BACTERIA AND TURBIDITY TOTAL MAXIMUM DAILY LOADS FOR THE RED RIVER, OKLAHOMA (OK311100, OK311200, OK311210, OK311510, OK311600, OK311800) Prepared for: OKLAHOMA DEPARTMENT OF ENVIRONMENTAL QUALITY
FINAL TURBIDITY TOTAL MAXIMUM DAILY LOADS FOR SULPHUR CREEK, OKLAHOMA (OK _00)
") FINAL TURBIDITY TOTAL MAXIMUM DAILY LOADS FOR SULPHUR CREEK, OKLAHOMA (OK410600010030_00) Prepared for: OKLAHOMA DEPARTMENT OF ENVIRONMENTAL QUALITY Prepared by: AUGUST 2010 FINAL TURBIDITY TOTAL MAXIMUM
FINAL TURBIDITY TOTAL MAXIMUM DAILY LOADS FOR SULPHUR CREEK, OKLAHOMA (OK410600010030_00) Prepared for: OKLAHOMA DEPARTMENT OF ENVIRONMENTAL QUALITY Prepared by: AUGUST 2010 FINAL TURBIDITY TOTAL MAXIMUM
City of Fairmont Storm Water Pollution Prevention Plan (SWPPP) January 23, 2017
 January 23, 2017") City of Fairmont Storm Water Pollution Prevention Plan (SWPPP) January 23, 2017 Why is Water Quality Important? Water has always been important to Minnesota and is a key part of our history, culture, economy
City of Fairmont Storm Water Pollution Prevention Plan (SWPPP) January 23, 2017 Why is Water Quality Important? Water has always been important to Minnesota and is a key part of our history, culture, economy
FINAL TURBIDITY TOTAL MAXIMUM DAILY LOAD FOR BLACK BEAR CREEK, OKLAHOMA ( _00)
") FINAL TURBIDITY TOTAL MAXIMUM DAILY LOAD FOR BLACK BEAR CREEK, OKLAHOMA (621200030010_00) Prepared for: OKLAHOMA DEPARTMENT OF ENVIRONMENTAL QUALITY Prepared by: AUGUST 2010 FIANL TURBIDITY TOTAL MAXIMUM
FINAL TURBIDITY TOTAL MAXIMUM DAILY LOAD FOR BLACK BEAR CREEK, OKLAHOMA (621200030010_00) Prepared for: OKLAHOMA DEPARTMENT OF ENVIRONMENTAL QUALITY Prepared by: AUGUST 2010 FIANL TURBIDITY TOTAL MAXIMUM
Sector Load Growth Demonstration Technical Memorandum
 Sector Load Growth Demonstration Technical Memorandum VERSION 1.0 Point Source Load Sectors: MS4s, Construction, CAFOs, Municipal and Industrial WWTP, CSOs and Air Deposition and Emissions Subject to Federal
FINAL BACTERIA TOTAL MAXIMUM DAILY LOADS FOR THE CANADIAN RIVER AREA, OKLAHOMA (OK520600, OK520610, OK520800)
") FINAL BACTERIA TOTAL MAXIMUM DAILY LOADS FOR THE CANADIAN RIVER AREA, OKLAHOMA (OK520600, OK520610, OK520800) Prepared for: OKLAHOMA DEPARTMENT OF ENVIRONMENTAL QUALITY Prepared by: PARSONS AUGUST 2008
FINAL BACTERIA TOTAL MAXIMUM DAILY LOADS FOR THE CANADIAN RIVER AREA, OKLAHOMA (OK520600, OK520610, OK520800) Prepared for: OKLAHOMA DEPARTMENT OF ENVIRONMENTAL QUALITY Prepared by: PARSONS AUGUST 2008
Background Information on the. Peace River Basin
 Background Information on the Peace River Basin Resource Conservation & Development Department August 24 Background Physiography The Peace River drainage basin occupies large parts of Polk, Hardee, DeSoto,
FLORIDA DEPARTMENT OF ENVIRONMENTAL PROTECTION SOUTHWEST DISTRICT PEACE RIVER BASIN UPPER PEACE RIVER PLANNING UNIT.
 FLORIDA DEPARTMENT OF ENVIRONMENTAL PROTECTION Division of Environmental Assessment and Restoration Water Quality Evaluation and TMDL Program SOUTHWEST DISTRICT PEACE RIVER BASIN UPPER PEACE RIVER PLANNING
CHESAPEAKE BAY TMDL ACTION PLAN ( MS4 General Permit)
") CHESAPEAKE BAY TMDL ACTION PLAN (2013 2018 MS4 General Permit) Central Virginia Community College A Plan for Achieving a 5% Reduction of Existing Loads June 30, 2015 Main Campus This plan satisfies the
CHESAPEAKE BAY TMDL ACTION PLAN (2013 2018 MS4 General Permit) Central Virginia Community College A Plan for Achieving a 5% Reduction of Existing Loads June 30, 2015 Main Campus This plan satisfies the
City of Tallahassee, Florida
 Upper Wakulla River Regulations, Restoration,.Rethink for Future City of Tallahassee, Florida American Planning Association Webinar - The Issue of Water: Quality and Quantity and Implications for Florida
The City of Cocoa (City) is located in east
 is located in east") FWRJ Reclaimed Water and Stormwater: A Perfect Pair to Meet Total Maximum Daily Load Wasteload Allocations? Danielle Honour, James Wittig, John A. Walsh, and Don Stevens Danielle Honour, P.E., D.WRE, and
FWRJ Reclaimed Water and Stormwater: A Perfect Pair to Meet Total Maximum Daily Load Wasteload Allocations? Danielle Honour, James Wittig, John A. Walsh, and Don Stevens Danielle Honour, P.E., D.WRE, and
6. Pollutant Sources in
 6. Pollutant Sources in 45 6. Pollutant Sources in the Plum Creek Watershed The LDC analysis for Plum Creek indicates that both point and nonpoint sources contribute pollutants in the watershed. Identifying
FINAL BACTERIAL AND TURBIDITY TOTAL MAXIMUM DAILY LOADS FOR STREAMS IN THE VERDIGRIS-NEOSHO RIVER STUDY AREA, OKLAHOMA (OK121510, OK121600)
") FINAL BACTERIAL AND TURBIDITY TOTAL MAXIMUM DAILY LOADS FOR STREAMS IN THE VERDIGRIS-NEOSHO RIVER STUDY AREA, OKLAHOMA (OK121510, OK121600) Prepared by: OKLAHOMA DEPARTMENT OF ENVIRONMENTAL QUALITY SEPTEMBER
FINAL BACTERIAL AND TURBIDITY TOTAL MAXIMUM DAILY LOADS FOR STREAMS IN THE VERDIGRIS-NEOSHO RIVER STUDY AREA, OKLAHOMA (OK121510, OK121600) Prepared by: OKLAHOMA DEPARTMENT OF ENVIRONMENTAL QUALITY SEPTEMBER
PROTECTING OUR WATERWAYS: STORMWATER POLLUTION REDUCTION EFFORTS
 PROTECTING OUR WATERWAYS: STORMWATER POLLUTION REDUCTION EFFORTS Public Information Meeting ~ May 2, 2018 Public Works Stormwater Management Division OVERVIEW Surface Water Quality Protection Municipal
FINAL. Appendix D: Newport Bay
 : Newport Bay 1.0 Introduction As described in the main TMDL report, the Coastal Bays are a shallow coastal lagoon system comprised of several individual and distinct waterbodies. The MD 8-Digit Newport
Municipal Stormwater Management Planning
 Municipal Stormwater Management Planning Christopher C. Obropta, Ph.D., P.E. Water Resources Extension Specialist with Rutgers Cooperative Extension Assistant Professor with Department of Environmental
GUIDELINES FOR STORMWATER BACTERIA REDUCTIONS THROUGH BMP IMPLEMENTATION NY/NJ HARBOR TMDL DEVELOPMENT
 GUIDELINES FOR STORMWATER BACTERIA REDUCTIONS THROUGH BMP IMPLEMENTATION NY/NJ HARBOR TMDL DEVELOPMENT Elevated bacteria in stormwater runoff in urban areas are well documented by many researchers. Monitoring
Bronx River Pollutant Loading Model Summary
 Bronx River Pollutant Loading Model Summary Section of River Located in Bronx County Table of Contents Drainage Areas...2 Data Sets Used for Analysis...2 Land Use Statistics...3 Model Calculations...3
Watershed master planning, City of Griffin, Georgia, USA
 Water Resources Management VII 3 Watershed master planning, City of Griffin, Georgia, USA J. K. Kaplan & B. J. Watson Tetra Tech, Water Resources Group, Atlanta, Georgia, USA Abstract Tetra Tech has assisted
Office of Water Quality Total Maximum Daily Load Program
 Office of Water Quality Total Maximum Daily Load Program Total Maximum Daily Load for Escherichia coli (E. coli) For the Plummer Creek Watershed, Greene County Prepared by: Office of Water Quality TMDL
STATE OF FLORIDA DEPARTMENT OF ENVIRONMENTAL PROTECTION GENERIC PERMIT FOR DISCHARGE OF STORMWATER FROM PHASE II
 STATE OF FLORIDA DEPARTMENT OF ENVIRONMENTAL PROTECTION GENERIC PERMIT FOR DISCHARGE OF STORMWATER FROM PHASE II MUNICIPAL SEPARATE STORM SEWER SYSTEMS May 1, 2003 1 Generic Permit for Discharge of Stormwater
Illinois EPA update to DuPage County Watershed Management Section Bureau of Water
 Illinois EPA update to DuPage County Watershed Management Section Bureau of Water Amy Walkenbach Coordinator, Financial and Technical Assistance Program, Bureau of Water, Illinois EPA Amy.walkenbach@illinois.gov
DRAINAGE AND NATURAL AQUIFER GROUNDWATER RECHARGE ELEMENT
 Goal 7.0. To optimize integrated stormwater management in order to reduce damage and impacts from sea level rise and flooding, promotes recharge to the Surficial Aquifer System (SAS), improve and protect
SCOPE OF WORK (Last amendment 9/18/08) Update: Signed agreement in hand Work to proceed March 15, 2009 June 30, 2010
 Update: Signed agreement in hand Work to proceed March 15, 2009 June 30, 2010") SCOPE OF WORK (Last amendment 9/18/08) Update: Signed agreement in hand Work to proceed March 15, 2009 June 30, 2010 TITLE: IDENTIFICATION OF ILLICIT DISCHARGES TO STORM DRAIN SYSTEM PROBLEM/NEED: The
SCOPE OF WORK (Last amendment 9/18/08) Update: Signed agreement in hand Work to proceed March 15, 2009 June 30, 2010 TITLE: IDENTIFICATION OF ILLICIT DISCHARGES TO STORM DRAIN SYSTEM PROBLEM/NEED: The
PA Municipal Separate Storm Sewer System (MS4) TMDL Plan
 TMDL Plan") PA Municipal Separate Storm Sewer System (MS4) TMDL Plan Instructor: Bryan Seipp, Watershed Manager- CWP Lee Epstein, Director, Lands Program- CBF 1 To Adjust How the Slides Appear on Your Screen To make
PA Municipal Separate Storm Sewer System (MS4) TMDL Plan Instructor: Bryan Seipp, Watershed Manager- CWP Lee Epstein, Director, Lands Program- CBF 1 To Adjust How the Slides Appear on Your Screen To make
Decision Rationale. Total Maximum Daily Load for Phosphorus for the Sassafras River, Cecil and Kent Counties, Maryland 4/1/2002
 Decision Rationale I. Introduction Total Maximum Daily Load for Phosphorus for the Sassafras River, Cecil and Kent Counties, Maryland 4/1/2002 The Clean Water Act (CWA) requires a Total Maximum Daily Load
UNITED STATES ENVIRONMENTAL PROTECTION AGENCY REGION III 1650 Arch Street Philadelphia, Pennsylvania /30/2007
 UNITED STATES ENVIRONMENTAL PROTECTION AGENCY REGION III 1650 Arch Street Philadelphia, Pennsylvania 19103-2029 7/30/2007 Dr. Richard Eskin, Director Technical and Regulatory Services Administration Maryland
Pipestone Creek Fecal Coliform Bacteria and Turbidity Total Maximum Daily Load Report
 Pipestone Creek Fecal Coliform Bacteria and Turbidity Total Maximum Daily Load Report For Submission to: U.S. Environmental Protection Agency Region 5 Chicago, Illinois Submitted by: Minnesota Pollution
Streamlines V2, n2 (May 1997) A Newsletter for North Carolina Water Supply Watershed Administrators
 A Newsletter for North Carolina Water Supply Watershed Administrators") Page 1 of 5 STREAMLINES A Newsletter for North Carolina Water Supply Watershed Administrators Volume 2, Number 2 May 1997 Non-Point Source (NPS) Pollution This issue of Streamlines provides basic information
Page 1 of 5 STREAMLINES A Newsletter for North Carolina Water Supply Watershed Administrators Volume 2, Number 2 May 1997 Non-Point Source (NPS) Pollution This issue of Streamlines provides basic information
Richard V. Busche, P.E., CFM
 Florida Stormwater Association EXCELLENCE AWARDS STORMWATER PROGRAMS & PROJECTS 2015 NOMINATION FORM I. Nomination Information Nomination Category (please check only one box): Program (Department/Division)
Checklist for 2013 Draft NH Small MS4 General Permit Requirements
 Checklist for 2013 Draft NH Small MS4 General Permit Requirements TASK DEADLINE (in relation to permit effective date) OVERLAPS WITH AOC REQUIREMENTS ASSISTANCE FROM WISE PROJECT 1. Submit Notice of Intent
TOTAL MAXIMUM DAILY LOAD (TMDL)
") TOTAL MAXIMUM DAILY LOAD (TMDL) for Pathogens in the Dickson, Giles, Hickman, Humphreys, Lawrence, Lewis, Maury, and Williamson Counties, Tennessee Prepared by: Tennessee Department of Environment and
TOTAL MAXIMUM DAILY LOAD (TMDL) for Pathogens in the Dickson, Giles, Hickman, Humphreys, Lawrence, Lewis, Maury, and Williamson Counties, Tennessee Prepared by: Tennessee Department of Environment and
Suffolk Downs Redevelopment. Appendix G: Stormwater Management Supporting Documentation
 Suffolk Downs Redevelopment Expanded PNF Appendix G: Stormwater Management Supporting Documentation Suffolk Downs Redevelopment Phase 1 Stormwater Management Report Boston, Massachusetts 285402RP004 TABLE
INFRASTRUCTURE ELEMENT
 Goals, Objectives and Policies INFRASTRUCTURE ELEMENT SANITARY SEWER GOAL 4.A.1.: PROVIDE ADEQUATE CENTRAL SANITARY SEWAGE FACILITIES FOR RESIDENTIAL AND NON-RESIDENTIAL DEVELOPMENT AND REDEVELOPMENT IN
Natural Resources & Environmental Stewardship
 Natural Resources & Environmental Stewardship Fundamentals of Nutrient Management Melissa L. Wilson Department of Environmental Science & Technology Ag Nutrient Management Program University of Maryland,
IV. ENVIRONMENTAL IMPACT ANALYSIS G. HYDROLOGY/WATER QUALITY
 IV. ENVIRONMENTAL IMPACT ANALYSIS G. HYDROLOGY/WATER QUALITY ENVIRONMENTAL SETTING The project site is located in the Wilshire community of the City of Los Angeles and is bound by S. Wetherly Drive to
Water Quality Criteria Update
 Water Quality Standards Program Water Quality Criteria Update Presentation for December 10, 2014 FSA DEP Day Division of Environmental Assessment and Restoration Summary of Presentation DEP s Numeric Nutrient
South Carolina Water Quality Standards. Heather Preston DHEC Bureau of Water October 14, 2008
 South Carolina Water Quality Standards Heather Preston DHEC Bureau of Water October 14, 2008 The Water Quality Standards 303 (c) of the Clean Water Act requires all states to have water quality standards
The Next Generation of Stormwater Management and Site Design. Melanie R. Grigsby, P.E. Stormwater Resource Manager, City of Fort Myers
 The Next Generation of Stormwater Management and Site Design Melanie R. Grigsby, P.E. Stormwater Resource Manager, City of Fort Myers History of WMD Stormwater Rule Florida passed the first rule requiring
MS4 Permits. Understanding MS4 Permits (Municipal Separate Storm Sewer System) P508-17
 P508-17") Understanding (Municipal Separate Storm Sewer System) P508-17 1 Edward R. Umbrell, P.E. Mr. Umbrell obtained his civil engineering degree from The University of Maryland and has over 20 years of design
Understanding (Municipal Separate Storm Sewer System) P508-17 1 Edward R. Umbrell, P.E. Mr. Umbrell obtained his civil engineering degree from The University of Maryland and has over 20 years of design
Development of a Stormwater Management Plan for Phase II Small MS4s Insight and Innovation
 Development of a Stormwater Management Plan for Phase II Small MS4s Insight and Innovation Ohio Water Environment Association 2016 Technical Conference & Expo June 29, 2016 Objective To create a Stormwater
What is a stormwater utility fee?
 What is a stormwater utility fee? A stormwater utility fee is similar to a water or sewer utility fee. In essence, customers pay a fee to convey stormwater from their properties. The City of Goodlettsville
Innovative Storm Water Program Implementation
 Innovative Storm Water Program Implementation US Environmental Protection Agency, Region III Water Protection Division 1650 Arch Street Philadelphia, PA 19103 EPA Storm Water Contacts: Region III SW Coordinator
Title 26 DEPARTMENT OF THE ENVIRONMENT
 Title 26 ALL NEW RESUBMITTED 11-8-17 DEPARTMENT OF THE ENVIRONMENT Subtitle 08 Water Pollution Chapter 11 Maryland Water Quality Trading Program.01 Purpose. Authority: Environment Article, 9-313, 9-315,
Factsheet: Town of Deep River Water Quality and Stormwater Summary
 79 Elm Street Hartford, CT 06106-5127 www.ct.gov/deep Affirmative Action/Equal Opportunity Employer Factsheet: Town of Deep River Water Quality and Stormwater Summary This document was created for each
MARK CREEK DEMONSTRATION PROJECT
 MARK CREEK DEMONSTRATION PROJECT OCC Tasks 20 and 21 FY 1990 319(h) Task 210 EPA Grant # C9-006704-90-0 Submitted by: Oklahoma Conservation Commission Water Quality Division 413 NW 12 th Oklahoma City,
Maine Department of Environmental Protection Program Guidance on Combined Sewer Overflow Facility Plans
 Maine State Library Maine State Documents Land and Water Quality Documents Environmental Protection 9-1-1994 Maine Department of Environmental Protection Program Guidance on Combined Sewer Overflow Facility
APPENDIX B: POLLUTANT LOADING ANALYSIS. Appendix B: Pollutant Loading Analysis
 APPENDIX B: POLLUTANT LOADING ANALYSIS Appendix B: Pollutant Loading Analysis This page has been intentionally left blank. Appendix B: Pollutant Loading Analysis Appendix B Pollutant Loading Analysis Methodology
Florida Department of Environmental Protection. Bureau of Mining and Minerals Regulation. Regulation of Mines. Howard J. Hayes, Program Administrator
 Florida Department of Environmental Protection Bureau of Mining and Minerals Regulation Regulation of Mines Howard J. Hayes, Program Administrator April 2011 What is a mine? Nonphosphate mine: Subsections
Stormwater Programs. BIA Meeting June 5, Jason Uhley
 Stormwater Programs BIA Meeting June 5, 2014 Jason Uhley Chief of Watershed Protection Riverside County Flood Control and Water Conservation District Presentation Outline Clean Water Act Stormwater Program
Total Maximum Daily Load (TMDL) & Pollutant Reduction Plan (PRP) For Skippack Creek Franconia Township Montgomery County, Pennsylvania
 & Pollutant Reduction Plan (PRP) For Skippack Creek Franconia Township Montgomery County, Pennsylvania") NPDES Stormwater Discharges from MS4 Total Maximum Daily Load (TMDL) & Pollutant Reduction Plan (PRP) For Skippack Creek Franconia Township Montgomery County, Pennsylvania September 2017 Prepared For:
NPDES Stormwater Discharges from MS4 Total Maximum Daily Load (TMDL) & Pollutant Reduction Plan (PRP) For Skippack Creek Franconia Township Montgomery County, Pennsylvania September 2017 Prepared For:
Stormwater Control and Treatment
 Stormwater Control and Treatment EXISTING CONDITIONS The topography of Pinellas County is mostly flat to gently sloping, characterized by sandy soils and high groundwater levels. Elevations range from
Wisconsin Wastewater Operators Association. Protecting Our Water Resources: The Future Bill Hafs - NEW Water 10/2014
 Wisconsin Wastewater Operators Association Protecting Our Water Resources: The Future Bill Hafs - NEW Water 10/2014 The Fox River Contributes 1/3 of All Nutrients to Lake Michigan APRIL 15, 2011 Photo
COON CREEK WATERSHED DISTRICT PERMIT REVIEW. Spring Lake Park Schools Westwood Middle School st Avenue NE, Spring Lake Park, MN 55432
 PAN 16-112, Westwood Middle School, Page 1 of 6 COON CREEK WATERSHED DISTRICT PERMIT REVIEW MEETING DATE: August 22, 2016 AGENDA NUMBER: 10 FILE NUMBER: 16-112 ITEM: Westwood Middle School RECOMMENDATION:
Pennsylvania s Chesapeake Bay Tributary Strategy Implementation Plan for Sewage Facilities Planning
 The strategy outlined in this guidance document is intended to supplement existing requirements. Nothing in the strategy shall affect regulatory requirements. The information herein is not an adjudication
Watershed Monitoring Programs in Fairfax County
 Watershed Monitoring Programs in Fairfax County Innovation and Collaboration in Stormwater and Ecosystem Assessments Department of Public Works and Environmental Services Working for You! A Fairfax County,
Pollution Reduction Plan For Municipal Separate Storm Sewer System
 Pollution Reduction Plan For Municipal Separate Storm Sewer System West Chester University of Pennsylvania September 2017 Table of Contents Purpose and Scope Permit Requirements Pollution Reduction Conclusion
It has been over two years since numeric nutrient
 FWRJ How to Comply With Numeric Nutrient Criteria and Facilitate Permit Renewal Russel Frydenborg and Beck Frydenborg It has been over two years since numeric nutrient criteria (NNC) were adopted, and
VIRGINIA POLLUTION ABATEMENT (VPA) PERMIT APPLICATION. FORM B - ANIMAL FEEDING OPERATIONS (AFOs)
 PERMIT APPLICATION. FORM B - ANIMAL FEEDING OPERATIONS (AFOs)") VIRGINIA POLLUTION ABATEMENT (VPA) PERMIT APPLICATION FORM B - ANIMAL FEEDING OPERATIONS (AFOs) Department of Environmental Quality Rev. 02-2013 VIRGINIA POLLUTION ABATEMENT (VPA) PERMIT APPLICATION FORM
VIRGINIA POLLUTION ABATEMENT (VPA) PERMIT APPLICATION FORM B - ANIMAL FEEDING OPERATIONS (AFOs) Department of Environmental Quality Rev. 02-2013 VIRGINIA POLLUTION ABATEMENT (VPA) PERMIT APPLICATION FORM
GROUNDWATER DISCHARGE: A SOURCE OF NUTRIENTS TO LAKE LOCHLOOSA?
 GROUNDWATER DISCHARGE: A SOURCE OF NUTRIENTS TO LAKE LOCHLOOSA? Presented by Margaret Murray April 18, FSU Participants: Natasha Dimova, Ben Mwashote, Bill Burnett, Jeff Chanton DEP Participants: Rick
STORMWATER MANAGEMENT PROGRAM. Table of Contents
 STORMWATER MANAGEMENT PROGRAM Yakima Valley College March 1st, 0 1 0 1 Table of Contents INTRODUCTION... PROGRAM COMPONENTS... S.D.1: PUBLIC EDUCATION AND OUTREACH... Label Storm Drain Inlets:... Public
Chapter 6 Regulations and Requirements
 Chapter 6 Regulations and Requirements The information in this chapter is provided to help you comply with other Tacoma and Washington State regulations, which may apply to your project, industry or business
Watershed - Lake Model to Support TMDL Determinations for Lake Thunderbird
 Watershed - Lake Model to Support TMDL Determinations for Lake Thunderbird 18 th Annual EPA Region 6 Stormwater Conference Workshop 5: TMDLs and You October 3, 2016 Oklahoma City, OK Lake Thunderbird Watershed-Lake
(including Slides from Dick Schwer & Michelle Thompson)
") Updated: 17 April 2013 Print version Lecture #38 TMDLs (including Slides from Dick Schwer & Michelle Thompson) David Reckhow CEE 577 #38 1 David Reckhow CEE 577 #38 2 What is a TMDL? Total Maximum Daily
Updated: 17 April 2013 Print version Lecture #38 TMDLs (including Slides from Dick Schwer & Michelle Thompson) David Reckhow CEE 577 #38 1 David Reckhow CEE 577 #38 2 What is a TMDL? Total Maximum Daily
WASTEWATER TREATMENT REQUIREMENTS
 WASTEWATER TREATMENT REQUIREMENTS To avoid local objections, a sewage treatment plant site should be as far as practical from any populated area or any area that will develop within a reasonable period
MS4 NPDES PERMITS FREQUENTLY ASKED QUESTIONS (FAQ) 1
 1") COMMONWEALTH OF PENNSYLVANIA DEPARTMENT OF ENVIRONMENTAL PROTECTION BUREAU OF CLEAN WATER MS4 NPDES PERMITS FREQUENTLY ASKED QUESTIONS (FAQ) 1 The Department of Environmental Protection (DEP) has developed
COMMONWEALTH OF PENNSYLVANIA DEPARTMENT OF ENVIRONMENTAL PROTECTION BUREAU OF CLEAN WATER MS4 NPDES PERMITS FREQUENTLY ASKED QUESTIONS (FAQ) 1 The Department of Environmental Protection (DEP) has developed
National Pollutant Discharge Elimination System Stormwater Program MS4 Annual Report Format
 Annual Report Format National Pollutant Discharge Elimination System Stormwater Program MS4 Annual Report Format Check box if you are submitting an individual Annual Report with one or more cooperative
Florida s Triennial Review of Water Quality Standards
 Florida s Triennial Review of Water Quality Standards Agenda Review Background on Triennial Review Revisions to Chapter 62-4, FAC Revisions to Chapter 62-302, FAC Revisions to Chapter 62-303, FAC Triennial
Task 3: Estimation of Nutrient Loading to Falls Lake
 Task 3: Estimation of Nutrient Loading to Falls Lake Prepared for: Upper Neuse River Basin Association Prepared by: Cardno ENTRIX 5400 Glenwood Ave, Suite G03, Raleigh, NC, 27612 Table of Contents Executive
Basin Management Action Plan Suwannee River
 Division of Environmental Assessment and Restoration Basin Management Action Plan Suwannee River Terry.hansen@dep.state.fl.us September, 2013 Welcome Recent DO Criteria, Rule 62-302.533, Florida Administrative
Pennsylvania Pequea and Mill Creek Watershed Section 319 National Monitoring Program Project
 Pennsylvania Pequea and Mill Creek Watershed Section 319 National Monitoring Program Project Figure 36: Pequea and Mill Creek (Pennsylvania) Watershed Project Location 231 T-1 C-1 T1-3 T-4 C1-2 T2-3 T-2
TMDL Development. For Turkey Creek HUC 11 Watersheds. Final Report
 TMDL Development For Turkey Creek HUC 11 Watersheds Final Report Developed By Oklahoma Department of Environmental Quality September 19, 2006 TABLE OF CONTENT 1. BACKGROUND... 1 2. PROBLEM STATEMENT...
Cokato Lake (86-263) Wright County. Hydrologic Investigation
 Wright County. Hydrologic Investigation") Cokato Lake (86-263) Wright County Hydrologic Investigation April 14, 2005 Cokato Lake (86-263) Wright County Hydrologic Investigation April 14, 2005 Problem Statement In recent years, heavy rainfall has
Cokato Lake (86-263) Wright County Hydrologic Investigation April 14, 2005 Cokato Lake (86-263) Wright County Hydrologic Investigation April 14, 2005 Problem Statement In recent years, heavy rainfall has
MARYLAND DEPARTMENT OF THE ENVIRONMENT 1800 Washington Boulevard Baltimore MD
 MARYLAND DEPARTMENT OF THE ENVIRONMENT 1800 Washington Boulevard Baltimore MD 21230 410-537-3000 1-800-633-6101 Martin O Malley Governor Anthony G. Brown Lieutenant Governor November 6, 2009 Shari T. Wilson
Central Florida Water Initiative Northern Everglades and Estuaries Springs Water Quality, Supply and Planning
 Roger Sims, Holland & Knight Ernie Barnett, Water and Land Advisors, INC. Rich Budell, Budell Water Group, LLC FAWQC Webinar May 20, 2016 Central Florida Water Initiative Northern Everglades and Estuaries
Water Quality Restoration Plan and E. coli TMDLs Salt River Watershed, Wyoming. Public Review Draft
 Public Review Draft April 22, 2015 Prepared for Wyoming Department of Environmental Quality Prepared by Tetra Tech, Inc. HC 62 Box 7482 Star Valley Ranch, WY 83127 Version Date Created or modified by Agency
Pennsylvania s Phase III Watershed Implementation Plan
 Pennsylvania s Phase III Watershed Implementation Plan Informational Meeting Pennsylvania House and Senate Agriculture and Rural Affairs Committees August 16, 2017 Agenda Why Are We Doing This? Progress
Regional Stormwater Program 2013 Stormwater Management Plan
 Regional Stormwater Program 2013 Stormwater Management Plan This 2013 SWMP is an attachment to the 2012 Annual Report to the Department of Ecology for its Phase II NPDES Permit Prepared for: Asotin County
Indian River Lagoon Basin North Indian River Lagoon
 BASIN MANAGEMENT ACTION PLAN for the Implementation of Total Maximum Daily Loads for Nutrients Adopted by the Florida Department of Environmental Protection in the Indian River Lagoon Basin North Indian
State of Florida Department of Community Affairs Areas of Critical State Concern Implementation Status Report Apalachicola Bay Area
 State of Florida Department of Community Affairs Areas of Critical State Concern Implementation Status Report Apalachicola Bay Area Thaddeus L. Cohen, AIA Secretary November 2006 CONTENTS Part 1 - Summary
CITY OF MERCER ISLAND 2017 STORMWATER MANAGEMENT PROGRAM (SWMP) PLAN
 PLAN") CITY OF MERCER ISLAND 2017 STORMWATER MANAGEMENT PROGRAM (SWMP) PLAN May, 2017 CITY OF MERCER ISLAND 2017 S T O R M W A T E R M A N A G E M E N T P R O G R A M ( S W M P ) P L A N May 2017 City of Mercer
CITY OF MERCER ISLAND 2017 STORMWATER MANAGEMENT PROGRAM (SWMP) PLAN May, 2017 CITY OF MERCER ISLAND 2017 S T O R M W A T E R M A N A G E M E N T P R O G R A M ( S W M P ) P L A N May 2017 City of Mercer
City of Saint Paul s STORMWATER MANAGEMENT PROGRAM
 City of Saint Paul s STORMWATER MANAGEMENT PROGRAM Minnesota Pollution Control Agency NATIONAL POLLUTANT DISCHARGE ELIMINATION SYSTEM Permit No. MN 0061263 TABLE OF CONTENTS TABLE OF CONTENTS 1 SCHEDULE
ROUGE RIVER MONITORING FOR E. COLI TMDL IMPLEMENTATION FINAL REPORT GRANT#
 1 ROUGE RIVER MONITORING FOR E. COLI TMDL IMPLEMENTATION FINAL REPORT GRANT# 2011-0504 FUNDED BY: MICHIGAN DEPARTMENT OF ENVIRONMENTAL QUALITY CLEAN MICHIGAN INITIATIVE CLEAN WATER FUND LANSING, MI PREPARED
City of Winter Haven Water Sustainability Program. Mike Britt, P.E., Natural Resources Division
 Florida Stormwater Association EXCELLENCE AWARD for STORMWATER PROGRAMS and PROJECTS NOMINATION FORM I. Nomination Information Nomination Category (please check only one box): Program (Department/Division)
STORMWATER PROGRAM MANAGEMENT PLAN FOR TOWN OF CAPE ELIZABETH, MAINE
 I Bob STORMWATER PROGRAM MANAGEMENT PLAN FOR TOWN OF CAPE ELIZABETH, MAINE Permit Years 1through 5 (June 1, 2013 to June 1, 2018) Submitted to Maine DEP December 2013 Revised April 2014 Table of Contents
INFRASTRUCTURE ELEMENT STORMWATER SUB-ELEMENT GOALS, OBJECTIVES & POLICIES
 INFRASTRUCTURE ELEMENT STORMWATER SUB-ELEMENT GOALS, OBJECTIVES & POLICIES GOALS, OBJECTIVES & POLICIES GOAL DR 1: STORMWATER MANAGEMENT/DRAINAGE SYSTEMS. It is the goal of the City of Casselberry to provide
MALIBU CREEK AND LAGOON BACTERIA TMDL COMPLIANCE MONITORING PLAN
 MALIBU CREEK AND LAGOON BACTERIA TMDL COMPLIANCE MONITORING PLAN PREPARED BY THE COUNTY OF LOS ANGELES DEPARTMENT OF PUBLIC WORKS SUBMITTED ON BEHALF OF COUNTY OF LOS ANGELES LOS ANGELES COUNTY FLOOD CONTROL
ENHANCING AND PROTECTING WATER QUALITY, QUANTITY, AND SUPPLY
 FLORIDA EXTENSION INITIATIVE #2: ENHANCING AND PROTECTING WATER QUALITY, QUANTITY, AND SUPPLY STATEWIDE EDUCATIONAL PROGRAMS IN URBAN WATER QUALITY SITUATION Florida is uniquely characterized by its numerous
POLLUTION PREVENTION AFTER CONSTRUCTION
 POLLUTION PREVENTION AFTER CONSTRUCTION..CHAPTER.. 10 This chapter describes the pollution prevention measures to be taken once the site has been permanently and finally stabilized and no additional construction
State of Surface Water Protection: A Summary of Critical Environmental Statutes
 www.ecologicalcities.org State of Surface Water Protection: A Summary of Critical Environmental Statutes Diane M.L. Mas Department of Civil and Environmental Engineering University of Massachusetts, Amherst
(1)(A)Inventory of the following existing natural resources on the USFSP Campus or within the context area adjacent to the University.
(A)Inventory of the following existing natural resources on the USFSP Campus or within the context area adjacent to the University.") 13. 6C-21.208 CONSERVATION ELEMENT Information Sources George F. Young, Interview notes, June 2002 Sasaki Associates, Inc., interview notes, April, 2000 Interviews between DRMP Staff and USF Staff, May,
13. 6C-21.208 CONSERVATION ELEMENT Information Sources George F. Young, Interview notes, June 2002 Sasaki Associates, Inc., interview notes, April, 2000 Interviews between DRMP Staff and USF Staff, May,
TECHNICAL MEMORANDUM NO. 1
 TECHNICAL MEMORANDUM NO. 1 PROJECT: TITLE: PREPARED BY:, Hillsborough County From Class III to Class I Historic Exceedances and IWR Analysis of Class I vs. Class III Standards in the Alafia River Mike
Occurrence of Iron in Surface Waters of the Upper St. Johns River Basin
 Occurrence of Iron in Surface Waters of the Upper St. Johns River Basin Prepared by Florida Department of Environmental Protection Bureau of Watershed Management Ground Water Protection Section December
Stormwater Reuse Through Aquifer Storage & Recovery
 Stormwater Reuse Through Aquifer Storage & Recovery CITY OF NAPLES, FLORIDA PRESENTED BY: GREGG R. STRAKALUSE, P.E. DIRECTOR-STREETS & STORMWATER DEPT. DECEMBER 12, 2014 FLORIDA STORMWATER ASSOCIATION