Water Quality Study In the Streams of Flint Creek and Flint River Watersheds For TMDL Development
|
|
|
- Hilda Little
- 6 years ago
- Views:
Transcription


1 Water Quality Study In the Streams of Flint Creek and Flint River Watersheds For TMDL Development Idris Abdi Doctoral Dissertation Presentation Major Advisor: Dr. Teferi Tsegaye April 18, 2005 Alabama A & M University 1
2 Presentation Order Introduction Statement of the Problem Research Hypothesis Objectives of the Study Materials and Methods Results and Discussion Conclusion Questions, Comments, & etc. 2
3 Introduction Water is essential to everyone. Thus no matter where we live, we like our water bodies (lakes, rivers, and streams ) to be clean, clear, and fresh. Therefore, healthy water bodies are central to people s lives. Every one wants to see pristine, clean, and unpolluted water to fish on or swim in. Pollutant discharges from non-point sources are less controlled and are also adversely affecting water quality. The US EPA reported that agricultural discharges affect 72% of the impaired river areas, 57% of the impaired lake area, and 43% of the estuarine areas (US EPA). 3
4 Introduction Point source discharges are regulated by the CWA through administration of the National Pollutant Discharge Elimination System (NPDES). Point source pollution have been significantly reduced since this program started. 4
5 Watershed..? Watershed is an area of land which drains to a common point. Watersheds can range in size from a few acre to thousands of square miles. A basin (or drainage basin) is the area of land drained by a river or lake and its tributaries. Each drainage basin is made up of smaller units called watersheds. 5

6 Watershed Source: 6
7 TMDL? TMDL determines the greatest amount of a given pollutant that a water body can receive without violating water quality standards and designated uses. By taking a watershed approach, a TMDL considers all potential sources of pollutants, both point and non-point sources. It also takes into account a margin of safety, which reflects scientific uncertainty and future growth. 7
8 TMDL In short, a TMDL is calculated using the following equation: TMDL = WLA + LA + MOS Where: WLA = Waste Load Allocation (point sources) LA = Load Allocation (non-point sources) MOS = Margin of Safety A TMDL can also be defined as a reduction in pollutant loading that results in meeting water quality standards. 8
9 Statement Of The Problem Water quality study in the Flint Creek and Flint River watersheds, in north Alabama due to both point and non-point sources resulting from spatial and temporal variability are not fully assessed and well documented. Effects of non-point source pollution in specific streams in watersheds resulting from spatial and temporal variability may pose a significant challenge to water quality. 9
10 Statement Of The Problem... A significant drop in water quality at the Flint Creek and Flint River watersheds due to NPS can impact drinking water supplies, recreation, fisheries, aquatic species, and wild life. Presence of nutrients, bacteria, and heavy metals can adversely affect the health of aquatic species and human in these two watersheds. The Clean Water Act, section 303, set by U.S. EPA establishes the water quality standards and TMDL programs. This program mandates states to conduct statewide water quality assessment and identify the water bodies that do not meet water quality standards set forth both at the state and national levels. 10
11 Research Hypothesis 1. Water quality pollution levels will not be different between the two watersheds. 2. Seasonal differences will not have a significant effect in water quality pollutant levels in watersheds. 3. Location will not have an effect in water quality pollutant levels. 4. Most water quality parameters will exceed the concentration levels of the standard set by environmental protection agency (EPA) or Alabama Department of Environmental Management (ADEM) for a given period of time. 11
12 OBJECTIVES OF THE STUDY i ii iii Examine and compare the spatial and temporal variability of water quality parameters between the water bodies in the Flint Creek and the Flint River watersheds. Investigate the effects of land use / land cover, rainfall, and temperature variations on pollutant levels in both watersheds. Finally, provide vital information on the trends of water quality in the Flint Creek and Flint River watersheds that could be used for future TMDLs development for these two watersheds. 12
13 Objectives of the Study Thus, we investigated the effects of Season year Watershed location 13
14 Parameters of Interest i. Total nitrogen (TN). ii. Total Phosphorus (TP) iii. Coliform Bacteria iv. BOD v. DO vi. ph vii. Turbidity viii. Temperature ix. Chlorophyll x. Cd xi. Cr xii. Ni xiii. Pb xiv. Zn 14
15 Materials And Methods Project Background & Approaches The study areas chosen for this project are FC and FR Ws, which are located in the Wheeler Lake basin, in north Alabama. FC is a major tributary to the Wheeler Reservoir and the Tennessee River. The FC Watershed encompasses approximately 117,441 hectares in three counties: Morgan, Lawrence and Cullman. 15

16 Map of Wheeler lake basin showing the Flint Creek and Flint River watersheds. 16
17 Materials and Methods Similar to other north Alabama watersheds, FC absorbs a large amount of residential waste, agricultural runoff, and discharges from municipal sewage (The Flint Creek Watershed Project 1996). 17

18 Sampling Locations at the FC Watershed Map of FC watershed showing sampling Locations 18
19 Materials and Methods The FRW includes approximately 147,151 hectares, including half of Madison County (USGS ). This one starts in Lincoln County, Tennessee, is bounded by the mountains on the east border of Madison County, and drains into the Tennessee River. It is also primarily agricultural land (U.S. Geological Survey, 2002). The FRW is an important recreational and scenic resource. 19

20 Materials and Methods Map of FR watershed showing sampling locations 20
21 Data Collection and Analysis Data collection and analysis consisted of acquiring spatial and temporal data, field data, and laboratory data. 21
22 Materials and Methods An analysis of variance (ANOVA) was performed for all indicator variables. The general linear model (GLM) procedure of statistical analysis system (SAS) version 8.2 (SAS Institute, 2001) was used to rank and evaluate the concentrations of pollutants in the two study areas. 22
23 Materials and Methods As you have seen in the previous slides, six sampling sites were selected for detailed analysis in both the FC and the FR Ws. Field data and surface water samples were collected and analyzed every two weeks during the evaluation period 23
24 Materials and Methods Standard methods and techniques found in the Standard Methods for the Examination of Water and Wastewater (Greenberg, et al., 2000) were used for determination of all parameters. 24

25 YSI 6600 Multi-Parameter Sonde 25
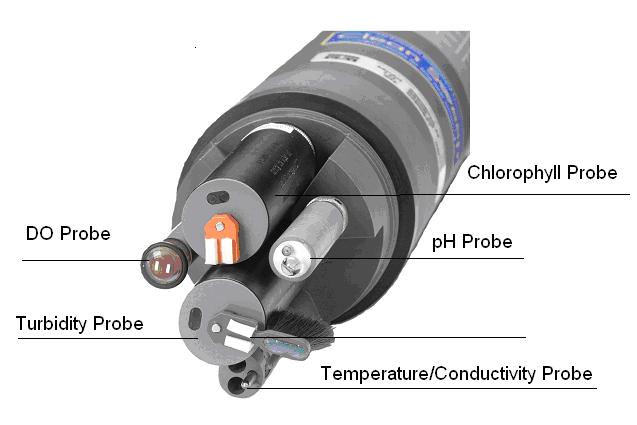

26 26
27 Rainfall data for 2003 and 2004 at the FC and FR watersheds rainfall the FCW rainfall the FRW mm mm Jan Feb Mar Apr May Jun Jul Aug Sep Oct Nov Dec 0.0 Jan Feb Mar Apr May Jun Jul Aug Sep Oct Nov Dec rainfall the FCW rainfall the FRW mm mm Jan Feb Mar Apr May Jun Jul Aug Sep Oct Nov Dec 0.0 Jan Feb Mar Apr May Jun Jul Aug Sep Oct Nov Dec 27
28 Results and Discussion Annual mean precipitation for 2003 at the FCW was mm, while FRW had mm annual precipitation for the same period. Annual mean precipitation for 2004 at the FCW was mm, while FRW had mm annual precipitation for the same period. Rainfall data suggests that Flint River had slightly higher rainfall precipitation for both 2003 and
29 Temperature data at the FC and FR Watersheds 30.0 Temperature the FCW for Temperature the FRW for C C Jan Feb Mar Apr May Jun Jul Aug Sep Oct Nov Dec 0.0 Jan Feb Mar Apr May Jun Jul Aug Sep Oct Nov Dec Temperature the FCW for 2004 Temperature the FRW for C C Jan Feb Mar Apr May Jun Jul Aug Sep Oct Nov Dec 0.0 Jan Feb Mar Apr May Jun Jul Aug Sep Oct Nov Dec 29

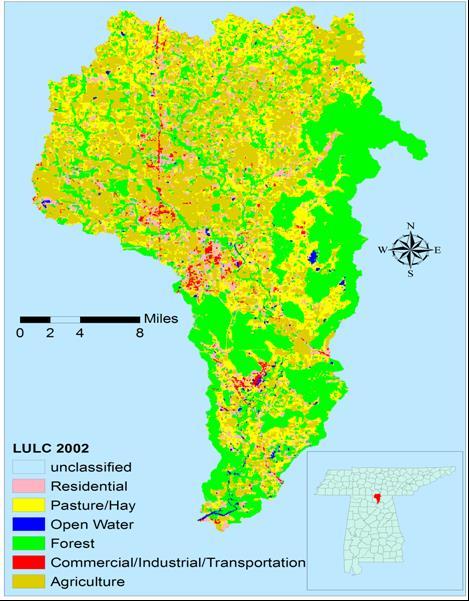
30 Results Land use / cover classification map for FC 30

31 Results Land use / cover classification map for FR 31
32 Land use/land cover characteristics at the Flint Creek and Flint River watersheds for Watershed Land Use/Land Hectare (ha) Percentage Cover Flint Creek Water Forest Pasture Residential Agriculture Commercial Total Flint River Water Forest Pasture Residential Agriculture Commercial Total

33 Percent land uses at the Flint Creek and Flint River watersheds 33
34 Flint Creek watershed land use/land cover in percentage 23% 2% 5% 3% 18% 49% Water Residential Commercial Forest Pasture Agriculture 34

35 Flint River Watershed land use/land cover in percentage. 35
36 Mean Temporal Variability of TN at the FC Watershed (2003) Mean temporal variability of TN at the Flint Creek Watershed (2003) 12 mg/l /10 2/24 3/10 3/24 4/7 4/21 5/5 5/19 6/2 6/16 6/30 7/14 7/28 8/11 8/25 9/8 9/22 10/6 10/20 11/3 11/17 12/1 12/15 12/29 Location 1 Location 2 Location 3 EPA Recommended Limit 36
37 Mean Temporal Variability of TN at the FC Watershed (2004) Mean temporal variability of TN at the Flint Creek Watershed (2004) mg/l /12 1/26 2/9 2/23 3/8 3/22 4/5 4/19 5/3 5/17 5/31 6/14 6/28 7/12 7/26 Location 1 Location 2 Location 3 EPA Recommended Limit 37
38 Mean Temporal Variability of TN at the FR Watershed (2003) Mean temporal variability of TN at the Flint River Watershed (2003) /20 3/6 3/20 4/3 4/17 5/1 5/15 5/29 6/12 6/26 7/10 7/24 8/7 8/21 9/4 9/18 10/2 10/16 10/30 11/13 11/27 12/11 mg/l Location 1 Location 2 Loaction 3 EPA Recommended Limit 38
39 Nutrients (TN & TP) Mean temporal variability of TN at the Flint River Watershed (2004) mg/l /7 1/21 2/4 2/18 3/3 3/17 3/31 4/14 4/28 5/12 5/26 6/9 6/23 7/7 7/21 8/4 Location 1 Loaction 2 Location 3 EPA Recommended Limit 39
40 Results and Discussion ( TN ) a mg/l b WS 1 WS 2 Flint Creek Flint River WS 1 WS 2 Figure 15. Mean total nitrogen concentrations observed for the watershed 1(Flint Creek) and watershed 2 (Flint River) during the study periods. 40
41 Results and Discussion ( TN ) a b b mg/l Location 1 Location 2 Location 3 0 Location 1 Location 2 Location 3 Figure 16. Mean total nitrogen concentrations observed by location during the study periods. Bars with the same letters are not statistically different according to Duncan s at the 5% level. 41
42 Results and Discussion ( TN ) a mg/l bc b c Winter Spring Summer Fall Winter Spring Summer Fall Figure 17. Mean total nitrogen concentrations observed for the season during the study periods. Bars with the same letters are not statistically different according to Duncan s at the 5% level. 42
43 Results and Discussion ( TN ) a mg/l b
44 Results and Discussion The highest TN seen in the winter and summer months than the spring and fall months may have been influenced by the heavy rain seen during those months. The seasonal changes that results in changes in rainfall, hydrologic conditions and other physiologic conditions may play significant role in nutrient washoffs from these watersheds. 44
45 Mean Temporal Variability of CF Seen at FCW (2003 & 2004 ) Temporal Variability of CF Bacteria at the Flint Creek Watershed (2003) Temporal Variability of CF Bacteria for the Flint Creek Watershed (2004) CFU/100 ml /10 3/10 4/7 5/5 6/2 6/30 7/28 8/25 9/22 10/20 11/17 12/15 CFU/100 ml /12 1/26 2/9 2/23 3/8 3/22 4/5 4/19 5/3 5/17 6/7 6/21 7/5 7/19 8/2 Site 1 Site 2 Site 3 Recommended Limit Site 1 Site 2 Site 3 Recommended Limit 45
46 Mean Temporal Variability of CF Seen at FRW (2003 & 2004) Temporal Variability of CF Bacteria for the Flint River Watershed (2003) Temporal Variability of CF Bacteria for the Flint River Watershed (2004) CFU/100 ml /20 3/5 4/2 4/30 5/28 6/25 7/23 8/20 9/17 10/15 11/12 12/10 CFU/100 ml /7 2/4 3/3 3/31 4/28 5/26 6/23 7/21 Site 1 Site 2 Site 3 Recommended Limit Site 1 Site 2 Site 3 Recommended Limit 46

47 Mean BOD5 and DO compared by watershed Flint Creek Flint Creek Flint Flint Creek Creek Flint River Flint River 47

48 Mean chlorophyll concentrations compared by watershed Flint Creek Flint River 48

49 Mean turbidity (NTU) compared by watershed Flint Creek Flint River 49
50 Mean BOD5 compared by location mg/l a b b Location 1 Location 2 Location 3 Location 1 Location 2 Location 3 50

51 Mean coliform bacterial concentrations compared by seasons 51

52 Mean BOD5 and DO concentrations compared by seasons 52
53 Mean Coliform Bacteria compared by year 140 a CFU/100 ml b
54 Mean monthly temporal variability of Pb at the FC watershed (2003 and 2004) mg/l /10 3/10 4/10 5/10 6/10 7/10 8/10 9/10 10/10 11/10 12/10 mg/l /12 1/26 2/9 2/23 3/8 3/22 4/5 4/19 5/3 5/17 5/31 6/14 6/28 7/12 7/26 Location 1 Location 2 Location 3 EPA Recommended Limit Location 1 Location 2 Location 3 EPA Recommended Limit Flint Creek 2003 Flint Creek
55 Mean monthly temporal variability of Pb at the FR watershed (2003 and 2004) mg/l /10 3/10 4/10 5/10 6/10 7/10 8/10 9/10 10/10 11/10 12/10 1/12 1/26 2/9 2/23 mg/l 3/8 3/22 4/5 4/19 5/3 5/17 5/31 6/14 6/28 7/12 7/26 Location 1 Location 2 Location 3 EPA Recommended Limit Location 1 Location 2 Location 3 EPA Recommended Limit Flint River 2003 Flint River
56 Heavy Metals a mg/l b a b b b a Pb Zn Cd Ni a Figure 42. Mean heavy metal concentrations observed during 2003 and 2004 monitoring period. 56
57 PH 7.8 a SU b Figure 43. Mean ph levels observed during 2003 and 2004 monitoring period. 57
58 Mean heavy metal different sampling locations for the FC watershed (2003 and 2004) Element Location 1 Location 2 Location 3 Range CV * Year 1 (2003) mg L -1 Pb Cr Cd Ni Zn Year 2 (2004) mg L -1 Pb Cr Cd Ni Zn
59 Mean heavy metal different sampling locations for the FR watershed (2003 and 2004) Element Site 1 Site 2 Site 3 Range CV * Year 1 (2003) mg L -1 Pb Cr Cd Ni Zn Year 2 (2004) mg L -1 Pb Cr Cd Ni Zn
60 CONCLUSION The mean TN concentrations were significantly lower during 2003 monitoring period compared to However this was not true for TP. The mean TN levels were also significantly lower at the FR watershed than the FC watershed. No significant changes occurred for TP. Mean TN concentration at location one was significantly higher compared to both locations two and three. Again this was not the case for TP. 60
61 CONCLUSION Mean CF bacterial counts and biological oxygen demand (BOD5) concentration were also significantly higher during summer season compared to the rest of the seasons. Mean DO conc. Were significantly lower in 2004 than 2003 monitoring period. Flint Creek watershed showed significantly higher concentrations of chlorophyll and turbidity when compared to FR watershed. This may illustrate the land use/land cover may be better managed at the FR watershed than the FC watershed.. 61
62 CONCLUSION To accurately quantify environmental impacts, land use changes, and natural processes leading to spatial and temporal variability of coliform bacteria and other variables, a continuous monitoring should be in place in these two watersheds for TMDL development 62
63 CONCLUSION Analysis of variance of heavy metal loads in these two watersheds suggests that there are no seasonal influence existed (p > 0.05) except for Pb. For most of the heavy metals (Cd, Ni, Pb, and Zn), this study showed a significant increase in the mean heavy metal concentration during the 2004 monitoring period compared to the 2003 monitoring period. 63
64 Summary/Take Home Message The findings of this study suggest that the intensity of runoff volume, hydrology of the sites, transportation rate of nutrients, and management of fertilizer application time may be important contributors to the variations of nutrients and other parameter concentrations. 64
65 Summary/Take Home Message The DO readings taken during the sampling visits, coupled with BOD5 results obtained in this study appears to show that there was no influence of a considerable organic load at both watersheds during our monitoring period. Differences in dynamic nature of water flow, and changes in land use/land cover in watersheds may play important role for the variations for some of the parameter concentrations during sampling event. 65
66 Summary/Take Home Message This study may have missed some important sampling events during heavy runoffs when sampling was not performed as scheduled. Thus continuous monitoring seems to be extremely important to collect those missing events. For TMDL development, additional information from point source loads will have to be included with the specific pollutant of interest. As additional information becomes available, the TMDL may be updated. The information compiled here may also interest interested groups to know about the water quality in the Flint Creek and Flint River watersheds. 66
67 Acknowlegement I would like to give thanks to Almighty God for giving me the strength, patience, wisdom and ability to complete this dissertations work. I would like to extend my special thanks to the members of my advisory committee: Dr. Teferi Tsegaye Dr. Constance Jordan-Wilson Dr. Yong Wang Dr. Wubishet Tadesse Dr. Majed Elshamy 67
68 Acknowledgement I would also like to thank the faculty, staff, and graduate students in the Department of Plant and Soil Science for their assistance and kind words throughout my graduate program. I would also like to thank my family for their patience and support through out my graduate work. 68
69 Acknowledgement This study was supported by Alabama Experiment station grant, obtained through Alabama Agricultural and mechanical university/auburn university competitive grant and Center of Hydrology, Soil Climatology and Remote Sensing (HSCARS), Alabama Agricultural and Mechanical University/National Aeronautics and Space Administration (NASA), Washington, DC. 69
70 End of Presentation Any Comments, Questions etc. Thanks 70
Jordan River TMDL Update
 Jordan River TMDL Update 2010 Watershed Symposium August 4 th, 2010 Hilary N. Arens Utah Division of Water Quality Jordan River TMDL Outline What is a TMDL and what is the Jordan impaired for? Evaluation
Watershed - Lake Model to Support TMDL Determinations for Lake Thunderbird
 Watershed - Lake Model to Support TMDL Determinations for Lake Thunderbird 18 th Annual EPA Region 6 Stormwater Conference Workshop 5: TMDLs and You October 3, 2016 Oklahoma City, OK Lake Thunderbird Watershed-Lake
Evaluation of Water Quality in. Sylvia Heaton Water Bureau, MDNRE
 Evaluation of Water Quality in Ford and Belleville Lakes Sylvia Heaton Water Bureau, MDNRE Objectives of 2010 TMDL Reevaluation Evaluate nutrient (total phosphorus) levels in Ford and Belleville Lakes
Watershed and Water Quality Modeling to Support TMDL Determinations Lake Oologah
 Watershed and Water Quality Modeling to Support TMDL Determinations Lake Oologah 26 th Annual Conference Oklahoma Clean Lakes and Watersheds Association (OCLWA) April 5-6, 2017 Stillwater, Oklahoma Lake
Jordan River Total Maximum Daily Load Study. Presented By: James Harris Utah Division of Water Quality
 Jordan River Total Maximum Daily Load Study Presented By: James Harris Utah Division of Water Quality Jordan River Watershed TMDL Study Area No Introduction Necessary A Few Things to Point Out... Lower
Long-Term Volunteer Lake Monitoring in the Upper Woonasquatucket Watershed
 Long-Term Volunteer Lake Monitoring in the Upper Woonasquatucket Watershed Linda Green URI Watershed Watch 1-87-95, lgreen@uri.edu WATER QUALITY IS A REFLECTION OF THE ACTIVITIES IN THE LANDS AND WATERS
Total Maximum Daily Load Development for Unnamed Tributary to Pitts Creek. Public Meeting March 26, Why Are We Here
 Total Maximum Daily Load Development for Unnamed Tributary to Pitts Creek Public Meeting March, Why Are We Here. Learn about water quality of the stream. Discuss the Total Maximum Daily Load (TMDL) development.
Little Cypress Bayou Special Study - Subwatershed 1.10
 - Subwatershed 1.1 Sabine River Authority of Texas August 31, 21 Prepared in Cooperation with the Texas Natural Resource Conservation Commission Under the Authorization of the Texas Clean Rivers Act Table
Sustaining Colorado s Watersheds: Making the Water Quality Connections October 2-4, 2007
 Sustaining Colorado s Watersheds: Making the Water Quality Connections October 2-4, 2007 Barr Lake and Milton Reservoir Watershed Management Plan ~ Brief History of the Reservoirs ~ Overview of the BMW
2006 Aliceville Reservoir Report. Rivers and Reservoirs Monitoring Program
 2006 Aliceville Reservoir Report Rivers and Reservoirs Monitoring Program Field Operations Division Environmental Indicators Section Aquatic Assessment Unit May 2011 Rivers and Reservoirs Monitoring Program
PINEY RUN WATERSHED 2005 PROFILE
 PINEY RUN WATERSHED 25 PROFILE Table of Contents Page Watershed Description Water Quality Studies Stream Monitoring Water Chemistry Conditions Water Bacteria Conditions Stream Habitat Conditions Aquatic
Understanding the 2014 NC Water Quality Assessment for the Integrated Report / 305(b)
") Understanding the 2014 NC Water Quality Assessment for the Integrated Report / 305(b) The Integrated Report/305(b) 1. Assessment Unit (AU) description information 2. AU water quality parameter assessment
Understanding the 2014 NC Water Quality Assessment for the Integrated Report / 305(b) The Integrated Report/305(b) 1. Assessment Unit (AU) description information 2. AU water quality parameter assessment
Prepared by: Maryland Department of the Environment Broening Highway Baltimore, MD Submitted to:
 Total Maximum Daily Loads of Carbonaceous Biochemical Oxygen Demand (CBOD) and Nitrogenous Biochemical Oxygen Demand (NBOD) for the Little Youghiogheny River Prepared by: Maryland Department of the Environment
PEACE RIVER MANASOTA REGIONAL WATER SUPPLY AUTHORITY BOARD OF DIRECTORS MEETING December 5, 2018 ROUTINE STATUS REPORTS ITEM 1
 PEACE RIVER MANASOTA REGIONAL WATER SUPPLY AUTHORITY BOARD OF DIRECTORS MEETING December 5, 218 ROUTINE STATUS REPORTS ITEM 1 Hydrologic Conditions Report MEMORANDUM Project: Hydrologic Conditions Report
Dog River Watershed Management Plan
 Dog River Watershed Management Plan Preliminary Water Quality Data Analysis Doug Robison, PWS ESA is where solutions and service meet. Water Quality - Regulatory Primer Designated Use Categories Swimming
Nutrient distributions and the interaction between coastal wetlands and the nearshore of Lake Ontario
 Nutrient distributions and the interaction between coastal wetlands and the nearshore of Ontario Krista Chomicki and Gary Bowen International Association of Great s Research, 25 Type Durham Region Coastal
Modeling the Middle and Lower Cape Fear River using the Soil and Water Assessment Tool Sam Sarkar Civil Engineer
 Modeling the Middle and Lower Cape Fear River using the Soil and Water Assessment Tool Sam Sarkar Civil Engineer Outline Problem statement and project objectives Watershed model development Model calibration
2007 Inland and Purdy Reservoirs Report. Rivers and Reservoirs Monitoring Program
 2007 Inland and Purdy Reservoirs Report Rivers and Reservoirs Monitoring Program Field Operations Division Environmental Indicators Section Aquatic Assessment Unit June 2012 Rivers and Reservoirs Monitoring
Gilleland Creek Intensive Bacteria Survey Addendum. March 18, 2010
 Gilleland Creek Intensive Bacteria Survey Addendum March 18, 21 Prepared by: Texas Stream Team Texas State University San Marcos PREPARED IN COOPERATION WITH THE TEXAS COMMISSION ON ENVIRONMENTAL QUALITY
Total Maximum Daily Load of Biochemical Oxygen Demand (BOD) for the Western Branch of the Patuxent River. Prepared by:
 for the Western Branch of the Patuxent River. Prepared by:") Total Maximum Daily Load of Biochemical Oxygen Demand (BOD) for the Western Branch of the Patuxent River Prepared by: Maryland Department of the Environment 2500 Broening Highway Baltimore, MD 21224 Submitted
Total Maximum Daily Load of Biochemical Oxygen Demand (BOD) for the Western Branch of the Patuxent River Prepared by: Maryland Department of the Environment 2500 Broening Highway Baltimore, MD 21224 Submitted
Salinity TMDL Development and Modeling in the Otter Creek Watershed. Erik Makus DEQ Hydrologist June 6, 2013
 Salinity TMDL Development and Modeling in the Otter Creek Watershed 1 Erik Makus DEQ Hydrologist June 6, 2013 Outline for Today: Otter Creek and the Tongue River Previous salinity modeling efforts Existing
Henderson Watershed WRIA 13. Chapter Includes: Tanglewilde Stormwater Outfall Woodard Creek Woodland Creek
 Henderson Watershed WRIA 13 Chapter Includes: Tanglewilde Stormwater Outfall Woodard Creek Woodland Creek 146 Tanglewilde Stormwater Outfall PART OF HENDERSON WATERSHED PRIMARY LAND USES: Urban residential
Effluent Treatment Alternatives
 Effluent Treatment Alternatives Harry Daniels Professor and Extension Specialist Department of Biology North Carolina State University Ohla Sydorovych Postdoctoral Research Associate Department of Agricultural
Source Water Protection Challenges in the Alafia River Watershed - Tampa, FL
 Source Water Protection Challenges in the Alafia River Watershed - Tampa, FL Doug Robison ESA Bob McConnell Tampa Bay Water AMERICAN WATER RESOURCES ASSOCIATION 2014 Annual Conference November 4, 2014,
Rainbow Creek TMDL Monitoring Program Report for October 2016 through September 2017
 Rainbow Creek TMDL Monitoring Program Report for October 2016 through September 2017 Introduction The Rainbow Creek monitoring program has been developed to provide water quality data in support of the
fcgov.com/water-quality Water Quality Update Fall 2017 Monitoring and Protecting Our Water Sources
 Water Quality Update Fall 217 Monitoring and Protecting Our Water Sources SOURCE WATER MONITORING The Upper Cache la Poudre (UCLP) Watershed Collaborative Monitoring Program was established in 28 between
Draft Wasteload Allocation Report For Logan County Rural Water District #1
 Draft Wasteload Allocation Report For Logan County Rural Water District #1 Contents 1. Problem Definition... 1 2. Endpoint Identification... 1 3. Source Analysis... 2 3.1. Point Sources... 2 3.2. Non-Point
Establishing Environmental Flows for California Streams. Eric Stein Southern California Coastal Water Research Project
 Establishing Environmental Flows for California Streams Eric Stein Southern California Coastal Water Research Project What Do We Know About the Status of Flows Statewide? First comprehensive study recently
Otter Creek Watershed TMDL Project. Stakeholder Meeting June 6, 2013
 Otter Creek Watershed TMDL Project Stakeholder Meeting June 6, 2013 1 Meeting Purpose Meet with watershed & technical advisory group members and watershed landowners to provide basic Otter Creek TMDL project
Middle Santa Ana River Bacterial Indicator TMDL Implementation Report
 Middle Santa Ana River Bacterial Indicator TMDL Implementation Report February 2013 on behalf of Santa Ana Watershed Project Authority San Bernardino County Stormwater Program County of Riverside Cities
TMDLs FOR CHLORIDE, SULFATE, TDS, AND AMMONIA IN THE ELCC TRIBUTARY, ARKANSAS. (Reach )
") TMDLs FOR CHLORIDE, SULFATE, TDS, AND AMMONIA IN THE ELCC TRIBUTARY, ARKANSAS (Reach 08040201-606) October 3, 2002 TMDLs FOR CHLORIDE, SULFATE, TDS, AND AMMONIA IN THE ELCC TRIBUTARY, ARKANSAS (Reach 08040201-606)
TMDLs FOR CHLORIDE, SULFATE, TDS, AND AMMONIA IN THE ELCC TRIBUTARY, ARKANSAS (Reach 08040201-606) October 3, 2002 TMDLs FOR CHLORIDE, SULFATE, TDS, AND AMMONIA IN THE ELCC TRIBUTARY, ARKANSAS (Reach 08040201-606)
LOXAHATCHEE RIVER WATER QUALITY EVENT SAMPLING TASK 2: FINAL REPORT ASSESSMENT OF LOXAHATCHEE RIVER WATER QUALITY
 LOXAHATCHEE RIVER WATER QUALITY EVENT SAMPLING TASK 2: FINAL REPORT ASSESSMENT OF 2007-2008 LOXAHATCHEE RIVER WATER QUALITY In Partial Fulfillment of Agreement No. 4600001281 For the Period October 2007
The Myakka River. Presented to the Myakka River Management Coordinating Council January 9, 2009
 The Myakka River Presented to the Myakka River Management Coordinating Council January 9, 2009 Kathryn L. Meaux Environmental Specialist III Sarasota County Integrated Water Resources Historical Monitoring
Watershed, Hydrodynamic, Water Quality and Sediment Flux Modeling to Support TMDL Determinations, Lake Thunderbird
 Watershed, Hydrodynamic, Water Quality and Sediment Flux Modeling to Support TMDL Determinations, Lake Thunderbird 24 th Annual Conference Oklahoma Clean Lakes and Watersheds Association (OCLWA) April
FINAL Total Maximum Daily Load (TMDL) for Unnamed Tributary to Bon Secour River Assessment Unit ID # AL Pathogens (fecal coliform)
 for Unnamed Tributary to Bon Secour River Assessment Unit ID # AL Pathogens (fecal coliform)") FINAL Total Maximum Daily Load (TMDL) for Unnamed Tributary to Bon Secour River Assessment Unit ID # AL03160205-0310-702 Alabama Department of Environmental Management Water Quality Branch Water Division
FINAL Total Maximum Daily Load (TMDL) for Unnamed Tributary to Bon Secour River Assessment Unit ID # AL03160205-0310-702 Alabama Department of Environmental Management Water Quality Branch Water Division
Dissolved Oxygen and Nutrient TMDLs for Little Gully Creek (WBID 1039)
") FLORIDA DEPARTMENT OF ENVIRONMENTAL PROTECTION Division of Environmental Assessment and Restoration, Bureau of Watershed Restoration NORTHWEST DISTRICT APALACHICOLA BASIN Final TMDL Report Dissolved Oxygen
FLORIDA DEPARTMENT OF ENVIRONMENTAL PROTECTION Division of Environmental Assessment and Restoration, Bureau of Watershed Restoration NORTHWEST DISTRICT APALACHICOLA BASIN Final TMDL Report Dissolved Oxygen
 Good Morning! Bruce Gilman Department of Environmental Conservation and Horticulture Finger Lakes Community College 3325 Marvin Sands Drive Canandaigua, New York 14424 585-785- 1255 gilmanba@flcc.edu Northern
Continuous, Real-time Nutrient Data and Regression Models Valuable Information for Monitoring Aquatic Ecosystem Restoration
 Continuous, Real-time Nutrient Data and Regression Models Valuable Information for Monitoring Aquatic Ecosystem Restoration Teresa Rasmussen, Jennifer Graham, Mandy Stone, US Geological Survey, Kansas
Draft Wasteload Allocation Report For McCurtain County Rural Water District #5
 Draft Wasteload Allocation Report For McCurtain County Rural Water District #5 Contents 1. Problem Definition... 1 2. Endpoint Identification... 1 3. Source Analysis... 2 3.1. Point Sources... 2 3.2. Non-Point
Draft Total Maximum Daily Load (TMDL) Little Tallapoosa River
 Little Tallapoosa River") Draft Total Maximum Daily Load (TMDL) For Little Tallapoosa River Alabama Department of Environmental Management Water Quality Branch Water Division May 2017 Prepared by ADEM/Water Quality Branch Figure
Draft Total Maximum Daily Load (TMDL) For Little Tallapoosa River Alabama Department of Environmental Management Water Quality Branch Water Division May 2017 Prepared by ADEM/Water Quality Branch Figure
Totten Watershed WRIA 13. Chapter Includes: Kennedy Creek. Schneider Creek (Totten)
") Totten Watershed WRIA 13 Chapter Includes: Kennedy Creek Schneider Creek (Totten) 257 Kennedy Creek #0012 PART OF TOTTEN/LITTLE SKOOKUM WATERSHED LENGTH OF CREEK: 10 miles BASIN SIZE: 19 square miles STREAM
Totten Watershed WRIA 13 Chapter Includes: Kennedy Creek Schneider Creek (Totten) 257 Kennedy Creek #0012 PART OF TOTTEN/LITTLE SKOOKUM WATERSHED LENGTH OF CREEK: 10 miles BASIN SIZE: 19 square miles STREAM
Water Quality Analysis of Eutrophication. Youghiogheny River Main Stem (Maryland Portion) Prepared by:
 Prepared by:") Water Quality Analysis of Eutrophication Youghiogheny River Main Stem (Maryland Portion) Prepared by: Maryland Department of the Environment 2500 Broening Highway Baltimore, MD 21224 Submitted to: Watershed
Water Quality Analysis of Eutrophication Youghiogheny River Main Stem (Maryland Portion) Prepared by: Maryland Department of the Environment 2500 Broening Highway Baltimore, MD 21224 Submitted to: Watershed
Climate Change & Urbanization Have Changed River Flows in Ontario
 Climate Change & Urbanization Have Changed River Flows in Ontario by Trevor Dickinson & Ramesh Rudra Water Resources Engineering University of Guelph Acknowledgements Agencies NSERC, OMAF & Environment
Final TMDL Implementation Plan. Prepared for Minnesota Pollution Control Agency
 Wirth Lake Final TMDL Implementation Plan Prepared for Minnesota Pollution Control Agency September 2010 4700 West 77 th Street Minneapolis, MN 55435-4803 Phone: (952) 832-2600 Fax: (952) 832-2601 wq-iw11-03c
SOURCE WATER MONITORING
 Monitoring and Protecting Our Water Sources SOURCE WATER MONITORING The Upper Cache la Poudre (UCLP) Watershed Collaborative Monitoring Program was established in 28 between the City of Fort Collins, the
Environmental Services
 215 Environmental Services River Water Quality Summary for the Twin Cities Metropolitan Area In 215, Metropolitan Council Environmental Services (MCES) river monitoring was conducted at six automated and
Lake of the Woods TMDL: Update and Next Steps November 21, 2017
 Lake of the Woods TMDL: Update and Next Steps November 21, 2017 Outline Where we ve been (2016) HSPF Bathtub Internal loading estimation Progress in 2017 Development of TMDL load allocation table Next
Arkansas Water Resources Center
 Arkansas Water Resources Center WATER QUALITY MONITORING OF MOORES CREEK ABOVE LINCOLN LAKE Submitted to the Arkansas Soil and Water Conservation Commission By M.A. Nelson L.W. Cash G.K. Trost Arkansas
REPORT TO REGIONAL WATER SUPPLY COMMISSION MEETING OF WEDNESDAY, MAY 21, 2014
 Agenda Item # REPORT # EPR- REPORT TO REGIONAL WATER SUPPLY COMMISSION MEETING OF WEDNESDAY, MAY, SUBJECT WATER QUALITY REPORT FOR SOOKE LAKE RESERVOIR NOVEMBER - FEBRUARY ISSUE To present the monitoring
What is a TMDL? MWEA NPDES Permit Compliance Seminar. December 2, 2009
 What is a TMDL? Total Maximum Daily Load is an estimate of the maximum amount of a pollutant that a water body can receive and still meet water quality standards, and an allocation of that amount to the
What s Happening in Lake Whatcom?
 What s Happening in Lake Whatcom? Dr. Robin A. Matthews, Director Institute for Watershed Studies Huxley College of the Environment Western Washington University June 6, 2011 Site 2 Basin 2 Lake Whatcom
Draft Wasteload Allocation Report Town of Haworth
 Draft Wasteload Allocation Report Town of Haworth Contents 1. Problem Definition... 1 2. Endpoint Identification... 1 3. Source Analysis... 2 3.1. Point Sources... 2 3.2. Non-Point Sources... 2 3.3. Background...
Appendix D Monitoring Program
 Appendix D Monitoring Program [This page left intentionally blank.] Shingle Creek and West Mississippi Watershed Management Commissions Third Generation Watershed Management Plan Monitoring Program Minnesota
Factsheet: Town of Deep River Water Quality and Stormwater Summary
 79 Elm Street Hartford, CT 06106-5127 www.ct.gov/deep Affirmative Action/Equal Opportunity Employer Factsheet: Town of Deep River Water Quality and Stormwater Summary This document was created for each
Texas Watch Volunteer Water Quality Monitoring Program 2006 Mary s Creek Data Summary
 Texas Watch Volunteer Water Quality Monitoring Program 26 Mary s Creek Data Summary Narrative Summary of Mary s Creek Mary s Creek is an unclassified, perennial stream flowing 6 miles southwest from Pearland,
WATER QUALITY ASSESSMENT REPORT 2013 SAGINAW CHIPPEWA INDIAN TRIBE. Clean Water Act Section 106 October 1, 2012 September 31, 2013 Grant #: I 00E57603
 WATER QUALITY ASSESSMENT REPORT 2013 SAGINAW CHIPPEWA INDIAN TRIBE Clean Water Act Section 106 October 1, 2012 September 31, 2013 Grant #: I 00E57603 Technical Contacts: Carey Pauquette Water Quality Specialist
TOTAL MAXIMUM DAILY LOAD (TMDL)
") TOTAL MAXIMUM DAILY LOAD (TMDL) For Nutrients In Black Point Channel (WBID 1637) Prepared by: US EPA Region 4 61 Forsyth Street SW Atlanta, Georgia 30303 September 2009 TABLE OF CONTENTS 1.0 INTRODUCTION...
TOTAL MAXIMUM DAILY LOAD (TMDL) For Nutrients In Black Point Channel (WBID 1637) Prepared by: US EPA Region 4 61 Forsyth Street SW Atlanta, Georgia 30303 September 2009 TABLE OF CONTENTS 1.0 INTRODUCTION...
Arkansas Water Resources Center
 Arkansas Water Resources Center 2003 POLLUTANT LOADS KINGS RIVER NEAR BERRYVILLE, ARKANSAS Submitted to the Arkansas Soil and Water Conservation Commission By Marc A. Nelson, Ph.D., P.E. and L. Wade Cash,
Environmental Services
 Environmental Services 14 River Water Quality Summary for the Twin Cities Metropolitan Area This document is a summary of the 14 water quality of major rivers in the Twin Cities metropolitan area (metro
Jordan River Watershed Council. Salt Lake County; Public Works Department Engineering Division Water Resources Planning and Restoration Program
 Jordan River Watershed Council Salt Lake County; Public Works Department Engineering Division Water Resources Planning and Restoration Program OUTLINE Background Information Jordan River Watershed Council
Aquaculture Effluents and the Environment. CS Tucker, Mississippi State University
 Aquaculture Effluents and the Environment CS Tucker, Mississippi State University Characteristics of catfish pond effluents Impacts of catfish pond effluents Ways to reduce impacts of effluents What is
Factsheet: City of West Haven Water Quality and Stormwater Summary
 79 Elm Street Hartford, CT 06106-5127 www.ct.gov/deep Affirmative Action/Equal Opportunity Employer Factsheet: City of West Haven Water Quality and Stormwater Summary This document was created for each
Watershed Management Area Recommendations for NJ Water Policy
 Watershed Management Area Recommendations for NJ Water Policy Presenters: William Kibler, Director of Policy, Raritan Headwaters Association Bob Kecskes, Freelance Environmental Consultant, retired NJDEP
TMDLS FOR TURBIDITY AND FECAL COLIFORMS FOR L'ANGUILLE RIVER, AR
 TMDLS FOR TURBIDITY AND FECAL COLIFORMS FOR L'ANGUILLE RIVER, AR October 2001 TMDLS FOR TURBIDITYAND FECAL COLIFORMS FOR L'ANGUILLE RIVER, AR Prepared for EPA Region VI Watershed Management Section Dallas,
2012 Nutrient Regulations Update
 2012 Nutrient Regulations Update OWEA Government Affairs Workshop March 1, 2012 Guy Jamesson, PE, BCEE Malcolm Pirnie, The Water Division of ARCADIS Imagine the result Agenda Nutrient impacts Nutrient
by Keith Kennedy Manager of Environmental Programs North Central Texas Council of Governments
 by Keith Kennedy Manager of Environmental Programs North Central Texas Council of Governments What is NPDES? National Pollutant Discharge Elimination System USEPA outfall permitting program Storm water
Science of the Causes of Hypoxia Nancy Rabalais et al.
 Science of the Causes of Hypoxia Nancy Rabalais et al. In support of overview of diversions and hypoxia, and context for refining science needs; July 14, 2014 Scientific Curiosity Hypothesis Testing Management
Factsheet: Town of East Lyme Water Quality and Stormwater Summary
 79 Elm Street Hartford, CT 06106-5127 www.ct.gov/deep Affirmative Action/Equal Opportunity Employer Factsheet: Town of East Lyme Water Quality and Stormwater Summary This document was created for each
Continuous records for the Chariton River indicate that 2004 was an average water year, with total flow approximately equal to the average annual
 2004 Rathbun Report Iowa State University Limnology Laboratory John A. Downing, Ph.D. George Antoniou, Assistant Scientist For Rathbun Land and Water Alliance August 31, 2005 A. Tributaries Personnel of
Factsheet: Town of Hamden Water Quality and Stormwater Summary
 79 Elm Street Hartford, CT 06106-5127 www.ct.gov/deep Affirmative Action/Equal Opportunity Employer Factsheet: Town of Hamden Water Quality and Stormwater Summary This document was created for each town
Understanding Agriculture And Clean Water
 1 IOWA CHAPTER Understanding Agriculture And Clean Water Clean Water Act Established in 1972, the Clean Water Act (CWA) created the basic structure for regulating discharges of pollutants into water bodies
2002 Water Quality Monitoring Report
 22 Water Quality Monitoring Report Wenck File #2-49 Prepared for: CLEARWATER RIVER WATERSHED DISTRICT Box 276 Annandale, MN 55389 Prepared by: WENCK ASSOCIATES, INC. 18 Pioneer Creek Center P.O. Box 249
Arkansas Water Resources Center
 Arkansas Water Resources Center WATER QUALITY SAMPLING, ANALYSIS AND ANNUAL LOAD DETERMINATIONS FOR TSS, NITROGEN AND PHOSPHORUS AT THE WASHINGTON COUNTY ROAD 195 BRIDGE ON THE WEST FORK OF THE WHITE RIVER
OKLAHOMA DEPARTMENT OF ENVIRONMENTAL QUALITY PUBLIC NOTICE. June 24, 2010 AVAILABILITY OF DRAFT BACTERIA TMDL FOR THE BIRD CREEK AREA WATERSHED
 Steve Thompson Executive Director OKLAHOMA DEPARTMENT OF ENVIRONMENTAL QUALITY Brad Henry Governor PUBLIC NOTICE June 24, 2010 AVAILABILITY OF DRAFT BACTERIA TMDL FOR THE BIRD CREEK AREA WATERSHED REQUEST
Natural Resources & Environmental Stewardship
 Natural Resources & Environmental Stewardship Fundamentals of Nutrient Management Melissa L. Wilson Department of Environmental Science & Technology Ag Nutrient Management Program University of Maryland,
Fountain Creek Watershed Water Quality Overview. Fountain Creek Watershed Citizen Advisory Committee June 12, 2015
 Fountain Creek Watershed Water Quality Overview Fountain Creek Watershed Citizen Advisory Committee June 12, 2015 Outline Fountain Creek Watershed Strategic Plan - 2009 Regulatory standards and classifications
Arkansas Water Resources Center
 Arkansas Water Resources Center 2004 POLLUTANT LOADS KINGS RIVER NEAR BERRYVILLE, ARKANSAS Submitted to the Arkansas Soil and Water Conservation Commission By Marc A. Nelson, Ph.D., P.E. L. Wade Cash,
2003 Water Quality Monitoring Report
 23 Water Quality Monitoring Report Prepared for Clearwater River Watershed District January 24 23 Water Quality Monitoring Report File #2-58 Prepared for: CLEARWATER RIVER WATERSHED DISTRICT Box 276 Annandale,
The Impacts of Climate Change on Portland s Water Supply
 The Impacts of Climate Change on Portland s Water Supply Richard Palmer and Margaret Hahn University of Washington Department of Civil and Environmental Engineering Joe Dvorak, Dennis Kessler, Azad Mohammadi
BACTERIA TOTAL MAXIMUM DAILY LOADS FOR STREAMS IN SALT CREEK AREA, OKLAHOMA
 FINAL BACTERIA TOTAL MAXIMUM DAILY LOADS FOR STREAMS IN SALT CREEK AREA, OKLAHOMA Prepared By: OKLAHOMA DEPARTMENT OF ENVIRONMENTAL QUALITY AUGUST 31, 2009 FINAL BACTERIA TOTAL MAXIMUM DAILY LOADS FOR
Total Maximum Daily Loads for Total and Fecal Coliform Bacteria for Tumblin Creek, Alachua County, Florida WBID 2718A
 FLORIDA DEPARTMENT OF ENVIRONMENTAL PROTECTION Division of Water Resource Management, Bureau of Watershed Management Total Maximum Daily Loads for Total and Fecal Coliform Bacteria for Tumblin Creek, Alachua
Tracking Sources of excess nitrate discharge in Lake Victoria, Kenya for improved Nitrogen use efficiency in the catchment
 Tracking Sources of excess nitrate discharge in Lake Victoria, Kenya for improved Nitrogen use efficiency in the catchment B. Nyilitya, S. Mureithi, P. Boeckx 7th International Nitrogen Initiative 216
Status of Water Quality in Ohio: The 2018 Integrated Report. April 25, 2018
 Status of Water Quality in Ohio: The 2018 Integrated Report April 25, 2018 Today s Topics Overview of the 2018 Integrated Report Purpose and requirements Assessment overview Differences from the 2016 Integrated
Numeric Nutrient Criteria Update
 Numeric Nutrient Criteria Update Kevin Carter South Florida Water Management District Office Of Everglades Policy and Coordination 561-682-6949, kecarter@sfwmd.gov Palm Beach County Water Resources Task
CANADA BRITISH COLUMBIA WATER QUALITY MONITORING AGREEMENT
 CANADA BRITISH COLUMBIA WATER QUALITY MONITORING AGREEMENT WATER QUALITY ASSESSMENT OF SIMILKAMEEN RIVER AT US BORDER (1976 2) Prepared by: Burke Phippen BWP Consulting March, 22 Environment Canada Environnement
Initial Assessment of Climate Change in the Chesapeake Bay Watershed
 Initial Assessment of Climate Change in the Chesapeake Bay Watershed STAC Workshop on Adapting to Climate Change In the Chesapeake Bay March 15, 2011 Lewis Linker 1, Thomas Johnson 2, and Gary Shenk 1
11/4/2010. Public Lands Grazing and WQ Project
 // Public Lands Grazing and WQ Project The Concern Current grazing practices are increasing fecal indicator bacteria (FIB) and nutrient levels in waterbodies, thus human and ecological risk. Presented
Surface Water Improvement and Management (SWIM) Plan Development
 Plan Development") Surface Water Improvement and Management (SWIM) Plan Development Bay Area Resource Council TAC Paul Thorpe Chief, Bureau of Environmental May 17, 2017 and Resource Planning May 17, 2017 Surface Water Improvement
Surface Water Improvement and Management (SWIM) Plan Development Bay Area Resource Council TAC Paul Thorpe Chief, Bureau of Environmental May 17, 2017 and Resource Planning May 17, 2017 Surface Water Improvement
Lake of the Pines. Watershed TMDL. Depressed DO conditions in 3,700 acres of upper reservoir; declining
 Lake O O the Pines Watershed TMDL Presented at: 15 th National NPS Monitoring Workshop August 27, 2007 Vernon D. Rowe, P.E. Pilgrim s Pride Corporation Corporate Environmental Manager Lake of the Pines
Onsite Septic System Nitrogen Contributions to the Hood Canal Estuary. Department of Civil and Environmental Engineering, University of Washington
 Onsite Septic System Nitrogen Contributions to the Hood Canal Estuary Michael Brett, Peter Steinberg, Julie Horowitz, Bryan Atieh, Garrett Leque, and Mark Benjamin Department of Civil and Environmental
Factsheet: Town of Trumbull Water Quality and Stormwater Summary
 79 Elm Street Hartford, CT 06106-5127 www.ct.gov/deep Affirmative Action/Equal Opportunity Employer Factsheet: Town of Trumbull Water Quality and Stormwater Summary This document was created for each town
Lake Tohopekaliga Nutrient Reduction Plan Two Years Later
 Lake Tohopekaliga Nutrient Reduction Plan Two Years Later Danielle Honour, P.E., D.WRE Kimberly Lawrence Florida Stormwater Association Annual Conference June 12, 2014 Nutrient Reduction Plan Timeline
Pima County Receives A+ for ROMP Upgrades
 Pima County Receives A+ for ROMP Upgrades 2015 Arizona WateReuse Symposium Jerry Bish PE, BCEE July 27, 2015 1 Pima County, Arizona Regional Water Reclamation Department Serves Nearly 1,000,000 Customers
Analysis of Chlorophyll-a and other data collected in the Illinois River Watershed from
 Analysis of Chlorophyll-a and other data collected in the Illinois River Watershed from 1996-2003 By W.J. Andrews and D.N. Mott USGS Oklahoma Water Science Center For the Oklahoma Clean Lakes and Watersheds
An Evaluation of Pathogen Removal in Stormwater Best Management Practices in Charlotte and Wilmington, North Carolina
 An ASABE Meeting Presentation Paper Number: 084330 An Evaluation of Pathogen Removal in Stormwater Best Management Practices in Charlotte and Wilmington, North Carolina J.M. Hathaway N.C. State University,
Linking Water Quality and Migratory Fish Passage to Economic Contributions of Fisheries and Water Use
 Insert Your Image Here Linking Water Quality and Migratory Fish Passage to Economic Contributions of Fisheries and Water Use Project/Grant Objective 1. Delineate impacts to drinking water quality from
3B IMPAIRED WATERS AND TMDL APPROACH
 3B IMPAIRED WATERS AND TMDL APPROACH 1. ISSUE Impaired waters are those waters that do not meet state water-quality standards for one or more pollutants, thus they are impaired for their designated uses.
UPPER GALLATIN RIVER WATERSHED
 216 UPPER GALLATIN RIVER WATERSHED WATER QUALITY REPORT Kristin Gardner, PhD Executive Director, Gallatin River Task Force Stephanie Lynn Education and Communications Coordinator, Gallatin River Task Force
From the cornbeltto the north woods; understanding the response of Minnesota. Chris Lenhart Research Assistant Professor BBE Department
 From the cornbeltto the north woods; understanding the response of Minnesota watersheds to climate change Chris Lenhart Research Assistant Professor BBE Department 1. Background Differential response of
NC Water Resources Planning April 4, Tom Fransen. North Carolina Division of Water Resources 1
 NC Water Resources Planning April 4, 2011 Tom Fransen North Carolina Division of Water Resources 1 Water links us to our neighbor in a way more profound and complex than any other. -John Thorson 1/18/2011