Ellen Bailey. UWW Educator training January 13,
|
|
|
- Evan Holt
- 5 years ago
- Views:
Transcription

1 Ellen Bailey UWW Educator training January 13,
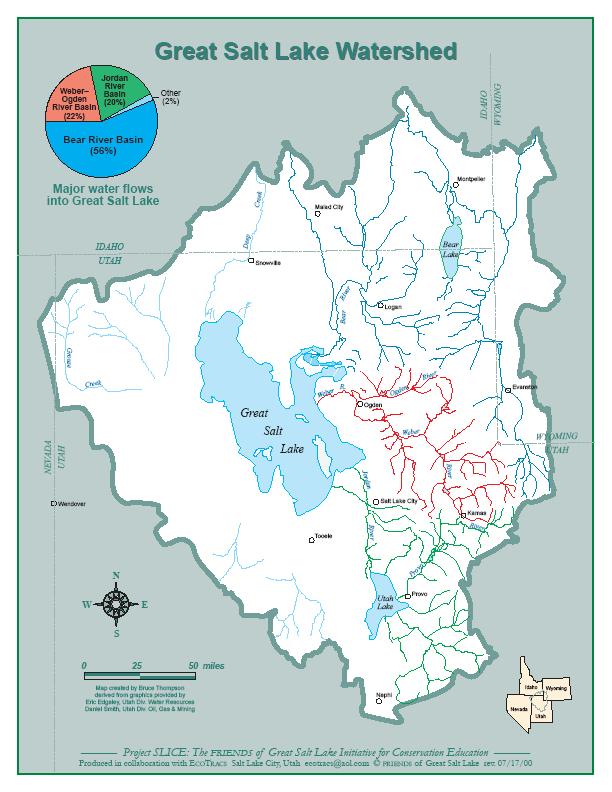
2 Utah Water Watch Partnership between USU Extension and the DWQ Started in 2012 Trained 750+ volunteers, monitoring 250+ sites
3 Utah Water Watch Goals: 1. Increase the public s knowledge about water quality 2. Collect credible data for water managers to use Create a network of trained volunteers Engage and empower our volunteers Encourage protection through education

4 Why do we monitor? Want to have more information Identify current conditions Show changes and trends Identify problems or solutions Why monitor water quality? We all use water Increase our knowledge about the environment It s the LAW!


5 Do you have experience monitoring?
6 What is science? A way of knowing The process of using observations and data to create knowledge
 and")

7 Who monitors? Local: Municipal (City, County) and Private State: Watershed Coordinators & DWQ Federal: EPA, BLM, USFS, NRCS, etc. Volunteers!
8 Why do we need volunteers? How many lakes are there in Utah? 2,085 How many miles of streams? 14,750 miles of permanent streams +89,000 miles of intermittent streams
9 What is a watershed? Geographic area within which all water drains to a common point.

10 Watersheds are defined by structure and by function
11 Elements of watershed structure Geography Size, latitude, longitude, elevation, aspect Climate Total precipitation, precipitation patterns Geology Formation - volcanic, sedimentary, basic rock types, soil types and depth, erosion potential Vegetation / Animals Human uses Type, native/non native, riparian areas, uplands, patterns of use and migration Development and land use patterns
12 What is the connection between watersheds and water quality? Everything that happens in a watershed can affect the quality of the water downstream. we all live downstream


13 The scale you work at depends on the question you want to answer.

14


15 What is Clean Water? Safe to drink? Distilled? Crystal clear?


16 There is no single definition of clean water. The Clean Water Act defines clean water according to how we use it. Drinking water, agriculture, recreation, fisheries and aquatic life, aesthetics
 Waters of U.S.")


17 Water quality is regulated through the Clean Water Act (1972) Waters of U.S. must be fishable and swimmable by 1983 Eliminate all pollution discharge to waters by 1985 Cuyahoga River, June
")


18 Water Quality Standards Clean Water Act (CWA) regulates the amount of pollutants that enter US Waters from point sources Types of pollution Point Source Nonpoint Source


19 Pollution source types: Point sources Nonpoint sources
20 Features of the watershed and sources of pollutants that may cause water quality to change. Structural Elements Narrow valley, steep, fast river Wide valley, wide slow river Shade near the stream Vegetated banks Human Impacts Pipes Canals coming in Changes in flows rip rap Nearby land uses Animals
 Macroinvertebrates Qualitative: Weather Photos Other observations")
21 Utah Water Watch monitors: Physical: Temperature Turbidity Habitat Chemical: ph Dissolved oxygen Biological: E. coli (bacteria) Macroinvertebrates Qualitative: Weather Photos Other observations
22 Why do we care about temperature? Fish and other aquatic life Other effects from temperature How much oxygen water can absorb The toxicity of ammonia Fish and other aquatic life require: Cold water fish: 20ᵒC (68ᵒF) Warm water fish:27ᵒc (81ᵒF)

 Runoff")

23 What causes temperature to rise? Natural causes: Seasons Length of river Location of river Hot springs Human causes: Removal of streamside vegetation (shade) Runoff over concrete and other heated surfaces Changes in stream shape Reducations in flow Impoundments Industrial discharges

24 Why do we care about dissolved oxygen? Fish and other aquatic life Other effects from dissolved oxygen Oxygen in water affects solubility of metals and other chemicals Fish and other aquatic life require: Cold water fish: 6.5 mg/l Warm water fish: 5.5 mg/l

25 What causes oxygen concentrations to change? Natural causes Uptake by organisms Natural increases in temperature Quiet water (low re-oxygenation) vs. turbulent waters Human causes Any source of biological material that will decay in water High temperatures or low flows Excessive plant growth in water


26 ph ph Scale: Pure Hydrochloric Acid Vinegar, Wine, Orange Juice Milk Baking Soda Bleach Pure Sodium Hydroxide Gastric Fluids Lemon Juice Rain Water 5.6 Sea Water Household Ammonia Oven Cleaner
27 Why do we care about ph? Low ph can affect membranes (e.g. gills of fish or macroinvertebrates and eggs) At low ph, causes some metals to dissolve into a more toxic form At high ph, ammonia is more toxic An acceptable ph range is

28 What causes ph to rise or fall? Natural causes: Rain is naturally acidic Rapid snow melt Photosynthesis in water higher ph Human causes: Combustion causes acids in the atmosphere acid precipitation Industrial discharge Mine drainage

29 Why do we care about turbidity? Turbidity refers to sediments in streams and lakes Fills space between cobble in stream and smother fish eggs and tiny aquatic life Very cloudy water affects visual predators Sediments fill in reservoirs Sediments bring nutrients, metals, and more into water
30 What are sources of sediment in rivers? Natural causes: Natural reworking of flood plain as stream meanders Remobilized bedload sediment under high flows Seasonal effects Human causes: Runoff (construction, agriculture, forestry, mining) Stream bank erosion Turbidity should not increase rapidly from site to site: An increase of more than 10 NTUs violates water quality criteria
31 Why do we care about E. Coli (bacteria) E. coli can make people sick Concern in drinking water Recteation Swimming (contact recreation) Boating (non-contact recreation) Contact recreation: 409 colonies/100ml Drinking water and non-contact recreation: 668 colonies/100ml
32 What are the sources of E. coli? Natural causes: Lives in the intestines of warm blooded animals Birds and other mammals Human causes: Not picking up after dogs Failing septic systems or wastewater treatment plants Animal feeding operations (manure)
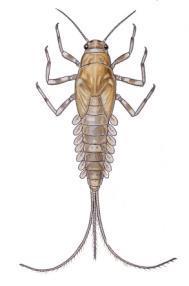


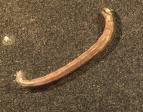
33 Macroinvertebrates Indicators of water quality Good indicators, pollution sensitive : Poor indicators, pollution tolerant :

34 Water is not static It has regular seasonal and daily fluctuations.
35 Dissolved Oxygen in milligrams per liter Daily manually measuring DO Typical Dissolved Oxygen in East Canyon Creek July 4 July 6 July 8 July 10 Date
36 Dissolved Oxygen in milligrams per liter Continuous measuring dissolved oxygen Typical Dissolved Oxygen in East Canyon Creek July 4 July 6 July 8 July 10 Date
37 Understand your site Each site will have unique characteristics Some streams are naturally clear while others are naturally turbid Monitor the site long term to capture the changes Documenting field parameters on the data sheets help understand the site and current conditions Flow, algae, water color, water odor, etc.

38 Database
39 Quality Control Follow procedures in your field notebook Also available online with videos Ensure use of the proper units (ᵒC vs ᵒF) and decimals are correct Enter data into the database ( Keep all copies of your field sheet and scan to the Utah Water Watch program coordinator at the end of the year Make sure equipment is stored properly and follow decontamination procedures
40 Safety! Safety is always more important than the data! Be aware of slippery banks or ice Don t let students enter water over their knees or that is moving very fast (more than 1 foot per second) Watch for poison ivy, broken glass or other hazards Review the Sampling Safety guide

41 Resources Instructions Events Maps Photos Also,
42 Adapting lessons for your grade We will creating some additional resources to help you merge Utah Water Watch with your needs. For example meeting 4 th grade standards Stay tuned! Let us know if you have any ideas. ellen.bailey@usu.edu
43 For more information: Ellen Bailey Utah Water Watch Program Coordinator USU Water Quality Extension ,
Resource. ph must be measured in the field. The ph will change if the water is collected and stored, and will not reflect the true value at the site.
 Resource ph What is ph? ph is a measurement of how acidic or alkaline (basic) the water is. ph is measured on a scale of 0 to 14, with 0 being the most acidic, and 14 being the most basic. Distilled water,
Water Quality indicators and How Human Activities Affect Water Quality
 Water Quality indicators and How Human Activities Affect Water Quality Name: Online Assignment: Period: Date: Purpose: to learn how to evaluate water quality and how pollution can make water unavailable
Basics of Water Quality Sheila Murphy
 Basics of Water Quality Sheila Murphy Water quality: The chemical, physical, and biological characteristics of water, usually in respect to its suitability for a particular purpose Water quality can include:
Introduction to Water Quality Parameters
 Introduction to Water Quality Parameters Directions: Your group will be assigned one or two Water Quality (WQ) parameters to read about and present to the class. 1. Read the explanations for your assigned
Stormwater Management in Your Backyard: Stormwater 101
 Stormwater Management in Your Backyard: Stormwater 101 Gregory Rusciano Program Associate, Water Resources Rutgers Cooperative Extension New Jersey Sea Grant Extension Program How much water do we have?
Aquatic Science Unit 2. Water Quality and Water Pollution
 Aquatic Science Unit 2 Water Quality and Water Pollution What is a healthy water body? In your own words, take a moment to describe what you believe are some of the characteristics of a healthy stream
Pennsylvania Senior Environment Corps. Table of Contents Part 2 Getting Started:. 21 Chemical Analysis... 22
 Table of Contents Part 2 Getting Started:. 21 Chemical Analysis.... 22 3 Chapter 2: Getting Started 21 Chemical Analysis of the Water Dependent on your area, you may measure for several parameters. In
Water Resources/Water Quality
 Water Resources/Water Quality From where does your drinking water come? How much land should be set aside for aquifer protection? Why should we care about Barton Springs? What are the effects (if any!)
Properties of Water. Their shapes change when they are in different containers. Their volumes stay the same in any container.
 Name: Date: 1. Which statement correctly describes both gases and liquids? Their shapes stay the same in any container. Their shapes change when they are in different containers. Their volumes stay the
Santa Rosa Creek Water Quality Results 2004
 Santa Rosa Creek Water Quality Results 24 Community Clean Water Institute Site Description: SRC4: Off 3rd Street in downtown Santa Rosa. Behind the Vineyard Hotel just West of Highway 11 along the Prince
A Claytor Nature Center Stream Monitoring Experience
 A Claytor Nature Center Stream Monitoring Experience Conduct field investigations in which distinctions are made among observations, hypotheses, results and conclusions Perform a visual habitat assessment
Advanced Water Quality Monitoring and Analysis Life Science: Grades 7-12
 Advanced Water Quality Monitoring and Analysis Life : Grades 7-12 Enduring Understandings 1. Understand and be able to list and describe important water quality factors (temperature, transparency, ph,
Watershed Detectives
 Watershed Detectives Students (6-12) analyze water samples from different watersheds and use their knowledge of water quality to determine the source of their samples. NR/WQ/2011-7 1 PURPOSE: To describe
The Snapshot CONODOGUINET CREEK WATERSHED SNAPSHOT
 CONODOGUINET CREEK WATERSHED SNAPSHOT ABOVE: CONODOGUINET CREEK AT RT 74 BRIDGE FACING DOWNSTREAM The Snapshot The Conodoguinet Watershed Snapshot was a collaborative effort to engage local citizens in
Reporting Period: 01/01/2010 to 12/31/2010. Understanding the Level 2 Stream Monitoring Data Report
 Squaw Creek, 10030147 Squaw Creek Latitude: 45.32639, Longitude: -88.945564 Jim Waters, Wolf River Trout Unlimited Andy Killoren, Wolf River Trout Unlimited Reporting Period: 01/01/2010 to 12/31/2010 Understanding
Reporting Period: 01/01/2008 to 12/31/2008. Understanding the Level 2 Stream Monitoring Data Report
 Panther Creek, 10010222 Panther Creek Latitude: 44.6216, Longitude: -90.568054 Carol Vedra, Beaver Creek Science Center Steven Hemersbach, Beaver Creek Citizen Science Center Reporting Period: 01/01/2008
Today s Webinar: Types of Monitoring and Assessment Data and What They Mean
 Welcome to the 1 st Webinar in the Series Monitoring & Assessment for Watershed Plans: Identifying, Accessing, and Using Data to Protect and Restore Indiana s Waters Each Monday in May at noon Today s
My Stream s Temperatures
 My Stream s Temperatures Temperature Adapted from: An original Creek Connections activity. Creek Connections, Box 10, Allegheny College, Meadville, Pennsylvania 16335. Grade Level: basic, all Duration:
Dirty Water. Adapted from: Dirty Water in Living in Water. National Aquarium in Baltimore, Grade Level: all. Duration: 1-2 class periods
 Dirty Water Adapted from: Dirty Water in Living in Water. National Aquarium in Baltimore, 1997. Nitrogen and Phosphorus Grade Level: all Duration: 1-2 class periods Setting: classroom or laboratory Summary:
Sample and Analysis Plan for Castle Valley Utah Water Watch Volunteer Monitoring Published January 1, 2015
 Sample and Analysis Plan for Castle Valley Utah Water Watch Volunteer Monitoring Published January 1, 2015 1. Monitoring Goals and Objectives The goal of this Sample and Analysis Plan (SAP) is to document
Maitland Valley WATERSHED
 Maitland Valley WATERSHED Report Card 2018 Maitland Conservation has prepared this report card as a summary of the state of your forests, wetlands, and water resources. WHERE ARE WE? We are one of 36 Conservation
What s in the Water?
 Purpose: Summary: Background: To observe and list abiotic factors in specific ecosystems. In this exercise, students will observe and list abiotic factors in an aquatic system and measure four of them
Reporting Period: 01/01/2008 to 12/31/2008. Understanding the Level 2 Stream Monitoring Data Report
 St Croix River at Old HWY 53 At Gordon, 163118 Saint Croix River Latitude: 46.252617, Longitude: -91.79963 Susan Peterson, Friends of the Saint Croix Headwaters James Heim, Friends of the Saint Croix Headwaters
Ousel Falls Interpretive Trail
 Ousel Falls Interpretive Trail Gallatin River Task Force Big Sky Community Organization gallytaskforce gallatinrivertaskforce bsco_mt WELCOME TO OUSEL FALLS Join us for an interpretive walk focused on
Factsheet: Town of Deep River Water Quality and Stormwater Summary
 79 Elm Street Hartford, CT 06106-5127 www.ct.gov/deep Affirmative Action/Equal Opportunity Employer Factsheet: Town of Deep River Water Quality and Stormwater Summary This document was created for each
WATER QUALITY; WHY IS IT SO IMPORTANT?
 WATER QUALITY; WHY IS IT SO IMPORTANT? by Debra Veeder 62 OBJECTIVES: Students will be able to describe the relationship between chemical changes in a stream and the reasons these changes take place. METHOD:
Grants Pass Water Quality Monitoring
 Grants Pass Water Quality Monitoring 2003-2005 Rogue Valley Council of Governments April 2005 Rogue Valley Council of Governments Natural Resources Department 155 North First Street Central Point, Oregon
Factsheet: City of West Haven Water Quality and Stormwater Summary
 79 Elm Street Hartford, CT 06106-5127 www.ct.gov/deep Affirmative Action/Equal Opportunity Employer Factsheet: City of West Haven Water Quality and Stormwater Summary This document was created for each
Norwalk Harbor Report Card
 Norwalk Harbor Report Card C+ Following the water s trail from your house, into the river, and to the Harbor The way land is used in a watershed has a significant effect on water quality. In areas where
INTERMEDIATE BMI ASSESSMENT TIER 2 FIELD SHEET
 INTERMEDIATE BMI ASSESSMENT TIER 2 FIELD SHEET PHYSICAL PARAMETERS ASSESSMENT FIELD SHEET ALL TIERS NAME: DATE: TIME: STREAM OR RIVER NAME: WATERSHED NAME: TOWN: WEATHER PRESENT PAST 48 HOURS SITE DESCRIPTION
City of Texarkana, Arkansas. Storm Water Pollution
 City of Texarkana, Arkansas Storm Water Pollution STORM WATER GUIDE What is Storm Water Pollution? Stormwater can provide a toxic discharge which can enter into a lake, river or coastal water system. As
Impacts to Aquatic Habitats from Land-Use or Is It Polluted?
 Impacts to Aquatic Habitats from Land-Use or Is It Polluted? Water Pollution is: The addition of excessive carbon to a system The addition of large amounts of materials to water that causes adverse changes
Factsheet: Town of East Lyme Water Quality and Stormwater Summary
 79 Elm Street Hartford, CT 06106-5127 www.ct.gov/deep Affirmative Action/Equal Opportunity Employer Factsheet: Town of East Lyme Water Quality and Stormwater Summary This document was created for each
Anthropogenic Impacts on Bays and Watersheds. HI-MOES Presentation 2009 The Kohala Center Kohala Watershed Partnership
 Anthropogenic Impacts on Bays and Watersheds HI-MOES Presentation 2009 The Kohala Center Kohala Watershed Partnership Some Common Terms Watershed = An area of land that drains into a common destination
Water Pollution. Chapter 20
 Water Pollution Chapter 20 Water Pollution Comes from Point and Nonpoint Sources Water pollution Any chemical, biological, or physical change in water quality that harms living organisms or makes water
National Science Content Standards: A: Science as Inquiry E: Science and Technology
 National Science Content Standards: A: Science as Inquiry E: Science and Technology To develop an understanding of water quality monitoring and an appreciation of the methods used to keep water safe and
PRESENTATION OUTLINE. Stormwater Program Update Stormwater Overview. Education Program Discussion. Sources and consequences of pollutants
 PRESENTATION OUTLINE Stormwater Program Update Stormwater Overview Sources and consequences of pollutants Education Program Discussion Why Stormwater? 1972 Clean Water Act Established permitting program
Florida Watersheds Video Southwest Florida Water Management District
 Teacher s Guide Florida Watersheds Video Download at: http://www.watermatters.org/watershedvideo Middle School Video Length: 11 minutes Lesson Time: One block or class period (approximately 45 minutes)
Reporting Period: 01/01/2010 to 12/31/2010. Understanding the Level 2 Stream Monitoring Data Report
 Eau Claire River at Outlet Bay Rd, 10029003 Upper Eau Claire Lake Latitude: 46.302803, Longitude: -91.50336 Susan Peterson, Friends of the Saint Croix Headwaters John Kudlas, Friends of the St.Croix Headwaters
Clean Water Act Basics: An Overview of Core Programs. Merritt Frey Habitat Program Director River Network
 Clean Water Act Basics: An Overview of Core Programs Merritt Frey Habitat Program Director 801-486-1224 mfrey@rivernetwork.org AGENDA Introduction History of Act Goals of Act Act & Jordan Resources Why
SAP for Spanish Valley Utah Water Watch Volunteer Monitoring Published January 1, 2015
 SAP for Spanish Valley Utah Water Watch Volunteer Monitoring Published January 1, 2015 1. Monitoring Goals and Objectives The goal of this SAP is to document the overall monitoring plan and provide clear
WASA Quiz Review. Chapter 2
 WASA Quiz Review Chapter 2 Question#1 What is surface runoff? part of the water cycle that flows over land as surface water instead of being absorbed into groundwater or evaporating Question #2 What are
2009 Columbia River Water Quality Monitoring Data Report
 2009 Columbia River Water Quality Monitoring Data Report Table of Contents Page Introduction......3 Map of Columbia Basin....4 Maps of Portland and Wenatchee Area Sites..5 Maps or Columbia Gorge East and
WATERSHED. Maitland Valley. Report Card 201
 Maitland Valley WATERSHED Report Card 201 The Maitland Valley Conservation Authority has prepared this report card as a summary on the state of our forests, wetlands, surface water, and ground water resources.
Introduction to Water Quality Monitoring Life Science: Grades 4-8
 Introduction to Water Quality Monitoring Life : Grades 4-8 Enduring Understandings 1. Understand and be able to list and describe important water quality factors (temperature, transparency, ph, electrical
Measuring Turbidity with Filters
 Measuring Turbidity with Filters Adapted from: It s Sedimentary, My Dear Watson in Environmental Resource Guide: Nonpoint Source Pollution Prevention Grades 9-12. Tennessee Valley Authority and Air and
Acidity and Alkalinity:
 Evaluation of Pollution Sources to Lake Glenville Quarterly Report December 2018 Kimberlee K Hall, PhD Environmental Health Program, Western Carolina University Summary Chemical and microbial analysis
How is Water Quality Affected by Land Use?
 Watershed Connections Lesson Les4 3 How is Water Quality Affected by Land Use? Overview What are the benefits of a healthy watershed? What are examples of land uses? What types of pollution can come from
Water Pollution & Quality. Dr. Deniz AKGÜL Marmara University Department of Environmental Engineering
 Water Pollution & Quality Dr. Deniz AKGÜL Marmara University Department of Environmental Engineering IMPORTANCE OF WATER Life on planet Earth would be impossible without water. All life forms, from simple
Protecting Utah s Water Resources. Nutrient Issues
 Protecting Utah s Water Resources Nutrient Issues Nutrient Issues Questions What are they? Why are they important? Nationally Locally What are the impact on my community Costs Timing What are Nutrients?
Hydrology and Water Quality. Water. Water 9/13/2016. Molecular Water a great solvent. Molecular Water
 Hydrology and Water Quality Water Molecular Water Exists as an equilibrium But equilibrium altered by what is dissolved in it Water Molecular Water a great solvent In reality, water in the environment
Status of Water Quality in Ohio: The 2018 Integrated Report. April 25, 2018
 Status of Water Quality in Ohio: The 2018 Integrated Report April 25, 2018 Today s Topics Overview of the 2018 Integrated Report Purpose and requirements Assessment overview Differences from the 2016 Integrated
Hydrology and Water Quality. Water. Water 9/11/2018. Molecular Water a great solvent. Molecular Water
 Hydrology and Water Quality Water Molecular Water Exists as an equilibrium But equilibrium altered by what is dissolved in it Water Molecular Water a great solvent In reality, water in the environment
Factsheet: Town of Trumbull Water Quality and Stormwater Summary
 79 Elm Street Hartford, CT 06106-5127 www.ct.gov/deep Affirmative Action/Equal Opportunity Employer Factsheet: Town of Trumbull Water Quality and Stormwater Summary This document was created for each town
Factsheet: Town of Hamden Water Quality and Stormwater Summary
 79 Elm Street Hartford, CT 06106-5127 www.ct.gov/deep Affirmative Action/Equal Opportunity Employer Factsheet: Town of Hamden Water Quality and Stormwater Summary This document was created for each town
VI-1. The Water Cycle What is the water cycle? evaporate condenses surface runoff ground water
 Classroom Copy VI-1. The Water Cycle What is the water cycle? Did you know that the water we see all around us never gets destroyed, and new water never gets created? Instead, it constantly recycles and
AP Environmental Science
 AP Environmental Science Types of aquatic life zones MARINE Estuaries coral reefs mangrove swamps neritic zone pelagic zone FRESHWATER lakes and ponds streams and rivers wetlands Distribution of aquatic
River Monitoring and Water Resource Terms
 River Monitoring and Water Resource Terms Baseflow: River discharge or flow composed of ground water drainage and delayed surface drainage. Baseflow is typically characterized as that portion of river
When Things Heat Up. To relate the physical and chemical properties of water to a water pollution issue.
 Purpose: Summary: To relate the physical and chemical properties of water to a water pollution issue. In this exercise, students will measure the temperature and dissolved oxygen of a stream (or use their
Jordan River TMDL Update
 Jordan River TMDL Update 2010 Watershed Symposium August 4 th, 2010 Hilary N. Arens Utah Division of Water Quality Jordan River TMDL Outline What is a TMDL and what is the Jordan impaired for? Evaluation
LOCATION: Circle Your Location
 SSU WATERS COLLABORATIVE - COPELAND CREEK WATER QUALITY PROJECT WATER QUALITY DATA SHEET Student Names (no name, no credit!): Date: Tests on This DataSheet: Time: Conductivity/TDS Temperature Discharge
Protecting Our Water Keeping Our Water Healthy
 Protecting Our Water Keeping Our Water Healthy Draw a bubble map about "Why Water is Important in Our Daily Lives". Include at least 5 reasons. Compare answers with your neighbors, noting similarities
Reservoir age, increasing human population,
 B-6249 02/12 Eagle Mountain Watershed Management Brent Clayton, Justin Mechell, David Waidler and Clint Wolfe* Reservoir age, increasing human population, and changing land uses have prompted the development
Stream Watch Visual Survey Instructions
 Stream Watch Visual Survey Instructions The Stream Watch Visual Survey is based on assessment parameters from the EPA's Rapid Bioassessment Protocol Habitat Assessment, Georgia Adopt a Stream Visual Survey,
Jackson Lake Analysis
 Jackson Lake Analysis Lake Zones Lake Zones Limnetic Zone- open water far from shore Light penetrates shallow, allowing photosynthesis Supports phytoplankton (algae, protists, cyanobacteria) which then
Water Quality: The Basics
 Water Quality: The Basics Environmental Science Why is Water Quality Important? Effects all humans Safe drinking water Allows for food productions and SAFE food products Effects Wildlife Health domestic
Results from the 2017 Water Quality Monitoring Program
 Results from the 217 Water Quality Monitoring Program As part of a larger project, this summer the BWC conducted water sampling throughout the Belleisle Bay to get a baseline of data and determine the
Activity 1: Using the Level of Oxygen- Saturation Chart graph Dissolved Oxygen vs. Temperature at 100% saturation. Start by making a 2 column table.
 Activity 1: Using the Level of Oxygen- Saturation Chart graph Dissolved Oxygen vs. Temperature at 100% saturation. Start by making a 2 column table. Number the first column with temperatures from 0 to
Appendix D: Visual aids and handouts for graphing lessons
 Appendix D: Visual aids and handouts for graphing lessons Macroinvertebrate Graphing Activity Amount Stonefly Caddisfly Beetle Cranefly Midge Leech 41 Water Pollution Graphing Activity Amount Sediment
Gray s Creek. Gray s Creek
 Gray s Creek 1 Grades F + Forest Conditions B Wetland Conditions C - Surface Water Quality This Watershed Report Card outlines the environmental information for the Gray s Creek watershed as of 2017. The
Water Pollution Overview. Sewage dumping
 Water Pollution Water Pollution Overview Sewage dumping Ocean Pollution Water Pollution Overview Urban Water Pollution Water Pollution Overview Water Pollution Overview Urban Runoff Water Pollution Overview
groundwater. Because watersheds are complex systems, each tends to respond differently to natural or human activities.
 The private development of Altos del María is located at an altitude between 550 and 1,000 meters above sea level in the environmentally sensitive Cordillera Central of Panama that separates the Pacific
Enough Clean Water. Background
 Enough Clean Water Scientists test the water. Photo by Breakaway Media. Background Clean, abundant water in the Lamprey River and its tributaries (Little, North, North Branch, Pawtuckaway, and Piscassic)
ECOSYSTEMS, WATERSHEDS AND POLLUTION CONTROL REVIEW
 ECOSYSTEMS, WATERSHEDS AND POLLUTION CONTROL REVIEW ECOSYSTEMS: (6 th grade content) How biotic and abiotic factors make an ecosystem: https://www.youtube.com/watch?v=mdlwptkg-vi 1. A/An ecosystem is a
Environmental Services
 215 Environmental Services River Water Quality Summary for the Twin Cities Metropolitan Area In 215, Metropolitan Council Environmental Services (MCES) river monitoring was conducted at six automated and
Otonabee Region WATERSHED
 Otonabee Region WATERSHED Report Card 2018 Otonabee Conservation has prepared this report card as a summary of the state of your forests, wetlands, and water resources using data from 2012 to 2016. WHERE
Water Chemistry Monitoring
 Chicago River Fieldtrip Activity Summary Students use basic to advanced water quality monitoring kits and probes to assess the water quality of the Chicago River. Water chemistry kits available for loan
The rest of this article describes four biogeochemical cycles: the water cycle, carbon cycle, nitrogen cycle, and phosphorous cycle.
 BIOGEOCHEMICAL CYCLES The chemical elements and water that are needed by living things keep recycling over and over on Earth. These cycles are called biogeochemical cycles. They pass back and forth through
Youth make a solution of food coloring with a concentration of one part per million and discuss clean water standards.
 One in a Million Overview: Youth make a solution of food coloring with a concentration of one part per million and discuss clean water standards. Substances dissolved in water can be present in very tiny
Experiment Modules Water Quality
 Experiment Modules Water Quality Page 2 of 18 Table of Contents 1 PH... 4 2 TEMPERATURE... 6 3 ELECTRICAL CONDUCTIVITY / TOTAL DISSOLVED SOLIDS... 8 4 BACTERIA (E. COLI, COLIFORM)... 9 5 DISSOLVED OXYGEN...
OKLAHOMA DEPARTMENT OF ENVIRONMENTAL QUALITY PUBLIC NOTICE. June 24, 2010 AVAILABILITY OF DRAFT BACTERIA TMDL FOR THE BIRD CREEK AREA WATERSHED
 Steve Thompson Executive Director OKLAHOMA DEPARTMENT OF ENVIRONMENTAL QUALITY Brad Henry Governor PUBLIC NOTICE June 24, 2010 AVAILABILITY OF DRAFT BACTERIA TMDL FOR THE BIRD CREEK AREA WATERSHED REQUEST
BIG ROCHE A CRI LAKE CHARACTERISTICS
 BIG ROCHE A CRI LAKE CHARACTERISTICS Lake Description Big Roche Cri Lake is located in north central Adams County and has a surface area of 205 acres, a shoreline length of 6.1 mile, a volume of 6,993
Redwood Shores Lagoon May 2017 Monthly Water Quality Monitoring Report
 Redwood Shores Lagoon May 2017 Monthly Water Quality Monitoring Report Prepared for Redwood City Public Works Services Department 1400 Broadway Redwood City, CA 94063-2594 Prepared by Clean Lakes, Inc.
State of the Waters ~ Overview
 Chapter 1 Page 2 Background & Purpose State of the Waters ~ The waters of Clallam County are varied, in some cases provide abundant resources for fish, wildlife and humans. In others, their quality has
BACKGROUND: The following is adapted from the Watershed Cruzin Guide:
 GOALS: To introduce students to the Watsonville Wetlands water system To help students identify sources of water pollution and learn how they can avoid polluting the environment To discuss the importance
Peach Creek Watershed
 SH 304 Peach Creek Watershed Bastrop Peach Cree FM 713 Caldwell Peach Creek, Sandy Fork Copperas Creek 1803C Peach Creek Fayette FM 1054 US 90 Waelder US IH US 90 FM 1680 IH 10 Dry Run Gonzales SH 97 Peach
REPORT. Report No: 2013/0958 Prepared For: Natural Resources Committee Prepared By: Dean Olsen, Environmental Resource Scientist Date: 11 July 2013
 REPORT Document Id: A544088 Report No: 2013/0958 Prepared For: Natural Resources Committee Prepared By: Dean Olsen, Environmental Resource Scientist Date: 11 July 2013 Subject: Waianakarua River Water
Transparency A Water Clarity Measure
 Volunteer Monitoring Factsheet Series 2010 Transparency A Water Clarity Measure Why are we concerned? Water clarity is one of the most obvious measures of water quality. Water clarity can be a useful indicator
Boulder Elkhorn TMDL Project. TMDL Document Public Comment Meeting June 27, 2013
 Boulder Elkhorn TMDL Project TMDL Document Public Comment Meeting June 27, 2013 Presentation Outline: What are TMDLs? Boulder Elkhorn TMDL Project Area What s in a TMDL document? Sediment Overview Temperature
OAR Newsletter March 1993
 OAR Assabet River Water Quality Testing 1992 - Final Report prepared by Barbara H. Offenhartz As originally reported in Organization for the Assabet River Newsletter, Summary The Organization for the Assabet
The Importance of Riparian Forests
 The Importance of Riparian Forests By Jean Llewellyn Monroe County is the second fastest growing county in Pennsylvania. This rapid growth can be problematic because uncontrolled and unregulated growth
Earth s Pools of Water What is the residence time of these pools?
 (1) The Hydrologic Cycle What are the major pools (reservoirs) of water on EARTH? More than enough water on our planet to sustain life. Why then do we have water shortages? And, why are we concerned about
Water Pollution and Water Quality (Nazaroff & Alvarez-Cohen, Sections 6.A and 6.B) (with additional materials)
 (with additional materials)") Water Pollution and Water Quality (Nazaroff & Alvarez-Cohen, Sections 6.A and 6.B) (with additional materials) Water is a basic necessity of nature and humans. We use water for: -drinking - food preparation
Water Pollution and Water Quality (Nazaroff & Alvarez-Cohen, Sections 6.A and 6.B) (with additional materials) Water is a basic necessity of nature and humans. We use water for: -drinking - food preparation
To diagram the nitrogen cycle and provide examples of human actions that affect this cycle.
 Purpose: Summary: Background: To diagram the nitrogen cycle and provide examples of human actions that affect this cycle. Students will learn about the nitrogen cycle through discussion and the construction
What is a stormwater utility fee?
 What is a stormwater utility fee? A stormwater utility fee is similar to a water or sewer utility fee. In essence, customers pay a fee to convey stormwater from their properties. The City of Goodlettsville
Primer introduction to watershed management Plan Process highlight the major steps of plan development Project types look at some examples of common
 1 Primer introduction to watershed management Plan Process highlight the major steps of plan development Project types look at some examples of common projects Plan Organization how to read the plan Next
CHECKLIST FOR ECOLOGICAL ASSESSMENT/SAMPLING
 CHECKLIST FOR ECOLOGICAL ASSESSMENT/SAMPLING Introduction The checklist that follows provides guidance in making observations for an ecological assessment. It is not intended for limited or emergency response
Pollutants in our Waters
 Pollutants in our Waters CARIWIN Advanced Course in IWRM September 17, 2007 Apurva Gollamudi Brace Centre for Water Resources Management McGill University It isn t the pollution that s harming the environment.
WATER QUALITY OF A NEIGHBORHOOD RESERVOIR
 WATER QUALITY OF A NEIGHBORHOOD RESERVOIR Forrest W. Coffman, Department of Earth Sciences, University of South Alabama, Mobile, Al, 36688 E-mail: fwc501@jaguar1.usouthal.edu. Optimist Lake is an integral
Chapter 2 Site Selection
 Chapter 2 Site Selection Before you start monitoring water quality, you must first select a site to monitor. This chapter will explore many factors for selecting an appropriate stream site to monitor.